effect of solar proton events on the middle atmosphere ... h. jackman, anne r. douglass, 1 richard...
TRANSCRIPT

JOURNAL OF GEOPHYSICAL RESEARCH, VOL. 95, NO. D6, PAGES 7417-7428, MAY 20, 1990
Effect of Solar Proton Events on the Middle Atmosphere During the Past Two Solar Cycles as Computed Using a Two-Dimensional Model
CHARLES H. JACKMAN, ANNE R. DOUGLASS, 1 RICHARD B. ROOD, AND RICHARD D. MCPETERS
Laboratory for Atmospheres, NASA Goddard Space Flight Center, Greenbelt, Maryland
PAUL E. MEADE
Department of Astrophysical, Planetary, and Atmospheric Sciences, University of Colorado, Boulder
Daily average solar proton flux data for the years 1963-1984 (two solar cycles) have been used in a proton energy degradation scheme to derive ion pair production rates and, subsequently, HOx (H, OH, HO2) and NOx (N, NO, NO2) production rates. These HOx and NOx production rates are computed in a form suitable for inclusion in an atmospheric two-dimensional time-dependent photochemical model. The HOx increases, although large for certain solar proton events (SPEs), are relatively short-lived because the HOx species have lifetimes of only hours in the middle atmosphere. For longer-lived NOx species, increases are important for 2-4 months past the more intense SPEs but are generally negligible 6 months after the SPE. The only exception to this scenario was the gigantic August 1972 SPE, whose stratospheric effects lasted about a year past the event. Comparisons of model results with the ozone data from the Nimbus 4 backscattered ultraviolet (BUV) instrument indicate relatively good agreement in the time dependence and magnitude of the ozone depletion for the middle stratosphere between the model and measurements for the August 1972 SPE and for 2 months past the event. The model predictions for the August 1972 SPE indicate at most a 1% decrease in total ozone at the highest latitudes with a significant interhemispheric difference. The model predicts a larger middle latitude stratospheric ozone change in the southern than the northern hemisphere caused by the difference in seasons between the two hemispheres. The computed ozone decreases associated with the HOx and NOx increases are substantial in the upper stratosphere at high latitudes for only a few SPEs in the 22 years studied. A mechanism is presented for transport of NOy from the stratosphere to the ground, which may be involved in the enhancements in nitrate fluxes noticed in Antarctic deposition data. Our computations, however, indicate that the SPE contributions to these nitrate fluxes (even for the August 1972 SPE) are probably small.
INTRODUCTION
In order to comprehend fully humankind's influence on the middle atmosphere, the natural changes must first be understood. Some natural changes in the middle atmosphere related to the solar cycle are caused by solar proton events (SPEs). SPEs have been investigated since the late 1960s for possible effects on the middle atmosphere. Solar protons from SPEs produce ionizations, dissociations, dissociative ionizations, and excitations in the middle atmosphere. Either directly or through a photochemical sequence, reactive HO x (H, OH, HO2) and NOx (N, NO, NO2) are produced. These HOx and NOx constituents are important because they can lead to the destruction of ozone.
Ozone depletions have been observed during and after nine separate SPEs over the past two solar cycles [Weeks et al., 1972; Heath et al., 1977; McPeters et al., 1981; Thomas et al., 1983; Solomon et al., 1983a; McPeters and Jackman, 1985]. SPEs have also been observed to increase NO during one SPE [McPeters, 1986]. The ozone depletions for eight of the SPEs (November 1969, January and September 1971, June and August 1979, October 1981, and July and Decem- ber 1982) are believed to be primarily caused by the HOx
1Now at Universities Space Research Association, Columbia, Maryland.
Copyright 1990 by the American Geophysical Union.
Paper number 90JD00089. 0148-0227/90/90J D-00089505.00
production of SPEs. Those HOx-caused ozone depletions are confined to the mesosphere and upper stratosphere, where HOx species account for most of the ozone loss [Jackman et al., 1986], and are relatively short-lived, since HOx lifetimes and 03 recovery times in this region are only of the order of hours.
The ozone depletion observations of the August 1972 SPE indicated a short-lived HOx-caused component in the me- sosphere and upper stratosphere and a relatively long-lived (approximately months) NOx-dominated component in the middle stratosphere. This event was the largest of the past two solar cycles and has been studied theoretically by several groups [e.g., Crutzen et al., 1975; Fabian et al., 1979; Solomon and Crutzen, 1981; Reagan et al., 1981; Rusch et al., 1981].
Jackman et al. [1980] focused on the SPE production of odd nitrogen over 26 years (1954-1979), and Jackman and Meade [1988] investigated in detail the production of odd nitrogen during the years 1978 and 1979 for a possible SPE-related influence on the limb infrared monitor of the
stratosphere (LIMS) measured constituents NO2 and HNO3. Jackman et al. [1980] found that the SPE source has a large variability in its yearly contribution to odd nitrogen and can dominate the largest odd nitrogen source, N20 oxidation, for geographic latitudes greater than 50 ø during certain years. Jackman and Meade's [1988] calculations showed that the SPE-related odd nitrogen changes (1) were confined mainly to the region above 10 mbar and latitudes higher than 50 ø in both hemispheres, (2) depended primarily
7417

7418 JACKMAN ET AL.' SOLAR PROTON EFFECT ON THE MIDDLE ATMOSPHERE
on the background local abundance of odd nitrogen as well as on the altitude and season, (3) are important for 2-3 months after the SPEs but are generally negligible 6 months after the SPE, and (4) should have caused negligible changes in background Na2 and HNa 3 during the LIMS measure- ment period.
Here we investigate the effects of two solar cycles (1963- 1984) of solar protons on the middle atmosphere by investi- gating odd nitrogen (Nay) as well as ozone. Our calculations indicate the extent to which solar protons influence the middle atmosphere constituents and if SPEs need to be taken into consideration for studies of long (solar cycle) time scales.
lOO
90
80
70
•o
4o 30
20
10
0
216
AUG. 1972 SPE-ION PAIR PROD.(CM-5 SEC- ) i i i i i l
(o)
217 218 219 220 221 222 223 DAY OF YEAR - 1972
PROTON FLUX DATA AND SPE PRODUCTION
OF ODD NITROGEN (Nay) AND Hax Proton fluxes from T. Armstrong and colleagues (Univer-
sity of Kansas, private communication, 1986) allow for a daily computation of ion pair production and Nay produc- tion due to SPEs for the time period 1963-1984. The proton fluxes are given in integral form (units are cm -2 s -• sr -•) for energies greater than 10, 30, and 60 MeV and are zero for most days in the 22-year period (1963-1984) with about 900 days containing nonzero values. These proton data are discussed by Armstrong et al. [1983]. We have derived differential proton spectra from those data and used those data in a manner similar to that given by Jackman and Meade [1988]. We fit the proton data from T. Armstrong with an empirical formula of a power law form, given as
dF/dE = Fo(E/Eo)-" cm -2 s -• sr -• MeV -•
where F is the proton flux, F0 and n are parameters, E is the proton energy in megaelectron volts (MeV), and E0 is simply set to 1 MeV for all fits. The best fit to the proton data was found using a least squares fitting solution: parameter F 0 varied over a large range, while values for n were close to 2. These fits were generally within 10% over the proton energy range for most days of spectra data. We assume our power law form is valid over the proton energy range from 5 to 100 MeV. We extended the lower limit of the energy range from 10 MeV (given by Jackman and Meade [1988]) to 5 MeV because we wanted a better estimate of the mesospheric source of odd nitrogen over the two solar cycle time period 1963-1984. A significant amount of extra odd nitrogen pro- duction is derived from those protons between 5 and 10 MeV which deposit energy in the mesosphere, and the small extrapolation from 10 to 5 MeV is believed to give at least a reasonable estimate of the proton flux at these lower ener- gies.
The protons were divided up into 60 monoenergetic en- ergy intervals, all assumed to be isotropic, and then were degraded in energy following Jackman et al. [1980]. Protons in the 5-100 MeV energy range deposit most of their energy between about 100 and 35 km. We compute a daily ion pair production over the 22-year time period in a form suitable for inclusion in our two-dimensional model.
The ion pair production computed from the daily average proton flux data of T. Armstrong compares favorably with the ion pair production computed using the hourly average proton flux data found in the Solar Geophysical Data publi- cation for most SPEs. However, for the August 1972 SPE the ratio of the hourly computed ion pair production to the
lOO
90
80
70
• •o • 50
• 4o 30
20
10
0
30
JAN. 1982 SPE-ION PAIR PROD.(CM-3 SEC-1)
_
_
_
(b)
51 32 33 34 35 36 DAY OF YEAR - 1982
Fig. 1. Daily average ion pair production for (a) the August 1972 solar proton event; contours represented are 200, 500, 1000, 2000, and 5000 cm -3 s -1' and (b) the January 1982 solar proton event; contours represented are 10, 20, 50, 100, 200, and 500 cm -3 s -1
daily computed ion pair production ranges from about 3.7 in the stratosphere to near 1.0 in the mesosphere. We have normalized the daily to the hourly computed ion pair pro- duction for this one SPE because the hourly computed ion pair production is believed to be more accurate than the daily computed ion pair production.
The daily average ion pair production for two SPEs (August 1972 and January 1982) is shown in Figure 1. The gigantic SPE in August 1972 is presented in Figure la. This event had a rather hard spectrum of particles (with higher energy protons dominating) during the first couple of days, peaking in ion pair production near 8000 cm -3 s -1 between 40 and 50 km on day 217. Later in the August 1972 SPE (days 220-222), the peak in ion pair production occurred at the higher altitudes (between 70 and 80 km) when a softer spectrum of particles was dominant (lower-energy protons). Other SPEs during the 22-year period studied are not as intense as the first couple of days of the August 1972 SPE, and their proton spectra are typically softer. The January 1982 SPE, whose ion pair production is shown in Figure lb, is a good example of this type of SPE. Its ion pair production has a peak over 500 cm -3 s -1 between 70 and 80 km on day 31.
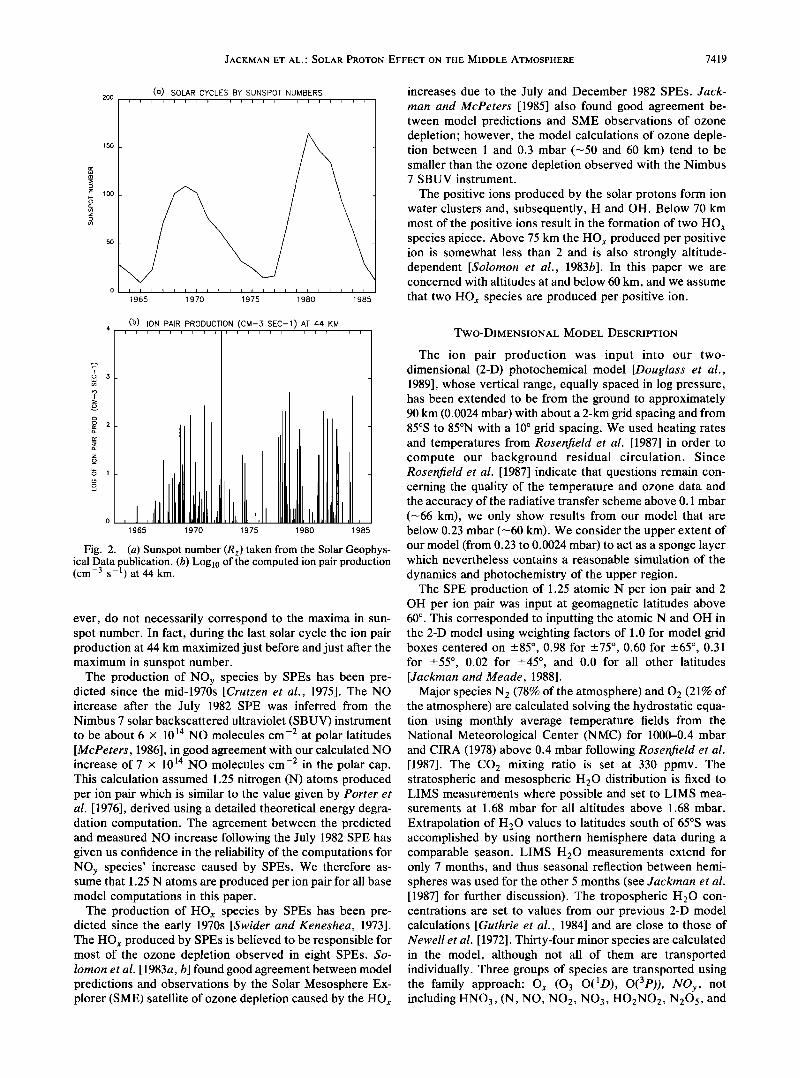
These 22 years of changing solar condition are represented by the changing sunspot number in Figure 2a. Figure 2b indicates the ion pair production at 44 km for the same 22-year period at geomagnetic latitudes greater than 60 ø. Note that more SPEs tend to occur when the sunspot number is high. The maxima in ion pair production, how-
JACKMAN ET AL.' SOLAR PROTON EFFECT ON THE MIDDLE ATMOSPHERE 7419
150
(o) SOLAR CYCLES BY SUNSPOT NUMBERS
I I I I I I I I I I 11 I I I I I I I I I I I 1965 1970 975 1980 1985
increases due to the July and December 1982 SPEs. Jack- man and McPeters [1985] also found good agreement be- tween model predictions and SME observations of ozone depletion; however, the model calculations of ozone deple- tion between 1 and 0.3 mbar (-•50 and 60 km) tend to be smaller than the ozone depletion observed with the Nimbus 7 SBUV instrument.
The positive ions produced by the solar protons form ion water clusters and, subsequently, H and OH. Below 70 km most of the positive ions result in the formation of two HOx species apiece. Above 75 km the HOx produced per positive ion is somewhat less than 2 and is also strongly altitude- dependent [Solomon et al., 1983b]. In this paper we are concerned with altitudes at and below 60 km, and we assume that two HOx species are produced per positive ion.
(b) ION PAIR PRODUCTION (CM-3 SEC-1) AT 44 KM i i ! 1 i i i i i i i I i I i i i i i i •
1965 1970 1975
I
980 1985
Fig. 2. (a) Sunspot number (R z) taken from the Solar Geophys- ical Data publication. (b) Log l0 of the computed ion pair production (cm -3 s -1) at 44 km.
ever, do not necessarily correspond to the maxima in sun- spot number. In fact, during the last solar cycle the ion pair production at 44 km maximized just before and just after the maximum in sunspot number.
The production of NOy species by SPEs has been pre- dicted since the mid-1970s [Crutzen et al., 1975]. The NO increase after the July 1982 SPE was inferred from the Nimbus 7 solar backscattered ultraviolet (SBUV) instrument to be about 6 x 10 TM NO molecules cm -2 at polar latitudes [McPeters, 1986], in good agreement with our calculated NO increase of 7 x 10 TM NO molecules cm -2 in the polar cap. This calculation assumed 1.25 nitrogen (N) atoms produced per ion pair which is similar to the value given by Porter et al. [1976], derived using a detailed theoretical energy degra- dation computation. The agreement between the predicted and measured NO increase following the July 1982 SPE has given us confidence in the reliability of the computations for NOy species' increase caused by SPEs. We therefore as- sume that 1.25 N atoms are produced per ion pair for all base model computations in this paper.
The production of HOx species by SPEs has been pre- dicted since the early 1970s [Swider and Keneshea, 1973]. The HO x produced by SPEs is believed to be responsible for most of the ozone depletion observed in eight SPEs. So- lomon et al. [1983a, b] found good agreement between model predictions and observations by the Solar Mesosphere Ex- plorer (SME) satellite of ozone depletion caused by the HOx
Two-DIMENSIONAL MODEL DESCRIPTION
The ion pair production was input into our two- dimensional (2-D) photochemical model [Douglass et al., 1989], whose vertical range, equally spaced in log pressure, has been extended to be from the ground to approximately 90 km (0.0024 mbar) with about a 2-km grid spacing and from 85øS to 85øN with a 10 ø grid spacing. We used heating rates and temperatures from Rosenfield et al. [1987] in order to compute our background residual circulation. Since Rosenfield et al. [1987] indicate that questions remain con- cerning the quality of the temperature and ozone data and the accuracy of the radiative transfer scheme above 0.1 mbar (-•66 km), we only show results from our model that are below 0.23 mbar (-•60 km). We consider the upper extent of our model (from 0.23 to 0.0024 mbar) to act as a sponge layer which nevertheless contains a reasonable simulation of the
dynamics and photochemistry of the upper region. The SPE production of 1.25 atomic N per ion pair and 2
OH per ion pair was input at geomagnetic latitudes above 60 ø. This corresponded to inputting the atomic N and OH in the 2-D model using weighting factors of 1.0 for model grid boxes centered on ___85 ø , 0.98 for ___75 ø , 0.60 for ---65 ø , 0.31 for ---55 ø, 0.02 for _+45 ø, and 0.0 for all other latitudes [Jackman and Meade, 1988].
Major species N2 (78% of the atmosphere) and 02 (21% of the atmosphere) are calculated solving the hydrostatic equa- tion using monthly average temperature fields from the National Meteorological Center (NMC) for 1000-0.4 mbar and CIRA (1978) above 0.4 mbar following Rosenfield et al. [1987]. The CO2 mixing ratio is set at 330 ppmv. The stratospheric and mesospheric H20 distribution is fixed to LIMS measurements where possible and set to LIMS mea- surements at 1.68 mbar for all altitudes above 1.68 mbar.
Extrapolation of H20 values to latitudes south of 65øS was accomplished by using northern hemisphere data during a comparable season. LIMS H20 measurements extend for only 7 months, and thus seasonal reflection between hemi- spheres was used for the other 5 months (see Jackman et al. [1987] for further discussion). The tropospheric H20 con- centrations are set to values from our previous 2-D model calculations [Guthrie et al., 1984] and are close to those of Newell et al. [1972]. Thirty-four minor species are calculated in the model, although not all of them are transported individually. Three groups of species are transported using the family approach' Ox (03 O(1D), O(3p)), NOy, not including HNO3, (N, NO, NO2, NO 3, HO2NO2, N205, and

7420 JACKMAN ET AL..' SOLAR PROTON EFFECT ON THE MIDDLE ATMOSPHERE
TABLE 1. Lower Boundary Conditions for All Transported Species
Species Type of Boundary
Condition 1980 Value 1972 Value
N20 CH4 CO
H2 CH3OOH CH3C1 CH3CC13 CC14 CFC13 CF2C12 Ox HNO3 NOy (not including HNO3) Clx
mixing ratio (ppbv) 300 300 mixing ratio (ppmv) 1.6 1.6 mixing ratio (ppbv) 100 100
mixing ratio (p•bv) 500 500 flux (cm -2 s 0.0 0.0 mixing ratio (pptv) 700 700 mixing ratio (pptv) 100 100 mixing ratio (pptv) 100 100 mixing ratio (pptv) 170 70 mixing ratio (pptv) 285 130 deposition velocity (cm s - l) 0.1 0.1 mixing ratio (pptv) 90 90
mixing ratio (pl•tv) 10 10 flux (cm -2 s- 0.0 0.0
C1ONO2), and Cly (C1, C10, HOC1, HC1, and C1ONO2). Partitioning among the family members is done in the manner described by Douglass et al. [1989]. Other trans- ported species include HNO3, N20, CH 4, H 2, CO, CH3OOH, CFC13, CF2C12, CH3C1, CC14, and CH3CC13. The HO x (H, OH, HO2) species, H202, and the hydrocar- bons CH 3, CH30, CH302, CH20, and CHO are calculated using photochemical equilibrium assumptions.
The boundary conditions are given in Table 1 for the two model background cases used: (1) a simulation of year 1980 with --•2.5 ppbv Clx input at the ground and (2) a simulation of year 1972 with --• 1.7 ppbv Clx input at the ground. Most reaction rates and photodissociation cross sections are taken from DeMore et al. [1987] and presented by Douglass et al. [1989]. Some reactions were added when the upper bound- ary was moved to 90 km. The reactions added were O + O + M --> 02 + M with k = 1.4 x 10 -33 exp (408/T) cm 6 s -! from Hampson [1980], N + OH--> NO + H with k = 5.0 x 10 -ll cm 3 s -1 from DeMore et al. [1987], and CO2 + he--> CO + O with J < 220 nm from DeMore et al. [1987]. Another reaction which was included in the simulation but inadvert-
ently left out of Table 2 of Douglass et al. [1989] was OH + CH3CC13 ---> 3(C1) with k = 5.0 x 10 -•2 exp (-!800/73 cm 3 s -1 from DeMote et al. [1987].
The 2-D model was run 20 years to a seasonally repeating steady state for the two model background cases, years 1980 and 1972. The model was then run for 23 years from 1963 through 1985 using the year 1980 background case. No SPEs were allowed to occur in 1985 so that the model had a chance
to relax to its ambient state before the end of the model run.
A closer look at the effect of the August 1972 SPE on the middle atmosphere used the 1972 background case. Several runs were completed for 1972, some for 60 days in which the output was analyzed every day and some for 360 days (1 model year) in which the output was analyzed every 10 days.
The solar cycle ultraviolet (UV) flux variation was not accounted for in any of our computer simulations. Some variation is expected in the background NOy abundance because of the solar cycle UV flux variation. We do not include this UV change so that it is possible to analyze more easily the straightforward influence of solar protons.
ODD NITROGEN (NOy) VARIABILITY DUE TO SPEs
Odd nitrogen (NOy = N + NO + NO 2 + NO 3 + HO2NO2 + HNO3 + 2N205 + C1ONO2), due to its lifetime of
months, is of interest for any long-term stratospheric changes. We investigate NOy at 75øN because of the large changes associated with SPEs at this high latitude. Figure 3a illustrates the variability of NOy at 1.7 mbar (44 km) and 75øN over the 23-year period. Note that NOy can vary dramatically after an SPE, especially after the August 1972 SPE. Generally, the NOy values return to their ambient levels 2-6 months after the event, but after the August 1972 SPE the stratospheric NOy values take about a year to return to their ambient levels.
200
150
100
50
-5O
(a) NOy CHANGE AT 1.7 MB (44 KM), 75øN • i i i i i i i i i i i i i i i i i i i i i
i i i i i i i i i i i i i i i i i i i i i i
1965 1970 1975 1980 1985
(b) OZONE CHANOE AT 1.7 MB (44 iN), 75"N i i i • i i I i I [ r i I i • I I i i i i i
•j -5
-25
1965 1970 1975 1980 1985
Fig. 3. Model-predicted (a) NOy and (b) ozone percentage change at 1.7 mbar (44 km) and 75øN.

JACKMAN ET AL.' SOLAR PROTON EFFECT ON THE MIDDLE ATMOSPHERE 7421
(a) NOy CHANGE AT 7 MB (54 KM), 75øN i i i i i I i i i [ i i [ i i ! i i i i i i
i i i i i i i i i i i i i f i i i i i i i i
1965 1970 1975 1980 1985
(b) OZONE CHANGE AT 7 MB (34 KM), 75øN i i i i i i i i i i i ! i i i i i i i i i i
-lO
1965 1970 1975 1980 1985
Fig. 4. Model predicted (a) NOy and (b) ozone percentage change at 7 mbar (34 km) and 75øN.
The NOy seems to be affected only by those SPEs which have an ion pair production over about 100 ion pairs cm -3 s -1 (see Figure 2b). The ambient NOy amounts help deter- mine the magnitude of the computed NOy change at a certain level. These ambient NOy amounts vary with season, being less in late winter and more in late summer. The same
production rate of N atoms, adding, say, 2 ppbv of NOy to a 14 ppbv background at 4 mbar and 85øN in late summer will have less of an effect than the same production rate of N atoms, adding, say, 2 ppbv of NOy to a 4-ppbv background at 4 mbar and 85øS in late winter (see Jackman and Meade
[1988] for further discussion). Some downflux of NOy from the SPE's mesospheric production of NOy is important during late fall, winter, and early spring and influences the amount of NOy in the upper stratosphere.
Figure 4a illustrates the behavior of NOy at 34 km. Figures 3a and 4a, as well as our analysis of NOy at other altitudes and latitudes, indicate that although the NOy produced by SPEs over solar cycle time periods does not build up, it can be important at high latitudes on time scales of months to a year. This result is not surprising as only a small fraction of the annual odd nitrogen budget results from SPEs [Jackman et al., 1980]. Most of the annual production of odd nitrogen is a result of N20 oxidation and was computed by Jackman et al. [1987] to be 2.6 x 10 34 NOy molecules yr -1. Here we have a different ozone and N20 distribution (model com- puted rather than specified as by Jackman et al. [1987]) and compute the annual production of odd nitrogen as a result of
SPE ODD NITROGEN PRODUCTION / YEAR 1
cr 1 • E+33 >.-
z
0 1 •E+32 0
z
o 1 • E+31 z
o
1 E+30
55 1960 i i r] i i i i i i i i
1965 1970 1975 i i i i i I I i i i
1980 1985
Fig. 5. Solar proton event (SPE) odd nitrogen production in molecules yr -1 for years 1955-1984.
N20 oxidation to be 2.9 x 1034 NOy molecules yr -1. The largest production of NOy molecules from SPEs was in the year 1972 at the level of 3.6 x 1033 NOy molecules yr -1, only 12% of the N20 oxidation source. Since this SPE source is confined to high latitudes, we note that it is significantly larger than the yearly N20 oxidation source at latitudes greater than 50 ø, calculated to be 2.2 x 1033 NOy molecules per yr -1. The production of odd nitrogen mole- cules from SPEs in other major SPE-active years is less than that computed for 1972.
We show the annual production of odd nitrogen from SPEs in the middle atmosphere for the years 1955-1984 in Figure 5. The annual production for the years 1955-1962 is taken from Jackman et al. [1980], and the years 1963-1984 are taken from this study. The values for the stratosphere and mesosphere, separately and together, are given in Table 2. Clearly, there is a large variation in the annual addition of odd nitrogen from SPEs.
OZONE VARIANCE DUE TO SPEs
The investigation of the long-term influence of SPEs on ozone is the primary purpose of this paper. We would like to answer the question: Do SPE-related changes in ozone need to be considered when investigating long-term variations of ozone? Figure 3b illustrates the variability of ozone at 1.7 mbar (44 km) and 75øN over the 23-year period. In Figure 4b we show the ozone at 7 mbar (34 km) and 75øN. In general, the NOy increase corresponds to an ozone decrease. Note, however, that ozone goes up during several days of 1972 at 7 mbar (see Figure 4b). This is a result of self-healing due to ozone depletion above.
It is clear from Figures 3b and 4b that the largest changes in ozone in the stratosphere are connected with the August 1972 SPE. Because of this we have investigated the time period during and just after the August 1972 SPE in more detail. We first ran the model to steady state (20-year computer simulation) for the 1972 boundary conditions (see Table 1). Next we ran a base case for 60 and 360 days, with daily and 10-day interval outputs, respectively. Finally, we simulated the August 1972 SPE with the model (several times) over 60- and 360-day time periods. We found only small differences in the ozone depletion from the August
7422 JACKMAN ET AL.: SOLAR PROTON EFFECT ON THE MIDDLE ATMOSPHERE
TABLE 2. Odd Nitrogen Molecules Produced per Year in the Mesosphere, Stratosphere, and Both the Mesosphere and
Stratosphere
Mesospheric Stratospheric Total Year Contribution Contribution Contribution
1955 3.24 (+30) 9.32 (+29) 4.17 (+30) 1956 1.19 (+32) 1.00 (+32) 2.19 (+32) 1957 4.64 (+32) 5.07 (+31) 5.15 (+32) 1958 1.98 (+33) 4.38 (+32) 2.42 (+33) 1959 1.42 (+33) 4.37 (+32) 1.86 (+33) 1960 6.63 (+32) 1.08 (+33) 1.74 (+33) 1961 1.40 (+32) 1.09 (+32) 2.49 (+32) 1962 9.25 (+30) 2.30 (+30) 1.16 (+31) 1963 6.56 (+29) 7.05 (+28) 7.26 (+29) 1964 4.65 (+ 29) 1.26 (+ 28) 4.78 (+ 29) 1965 3.89 (+ 30) 3.64 (+ 29) 1.42 (+ 30) 1966 1.19 (+33) 1.44 (+30) 1.19 (+33) 1967 1.29 (+33) 1.02 (+31) 1.30 (+33) 1968 4.31 (+32) 2.54 (+31) 4.56 (+32) 1969 7.56 (+32) 4.46 (+31) 7.60 (+32) 1970 8.85 (+31) 9.44 (+30) 9.79 (+31) 1971 3.85 (+32) 4.65 (+31) 4.32 (+32) 1972 2.09 (+ 33) 1.46 (+ 33) 3.55 (+ 33) 1973 5.18 (+30) 1.88 (+30) 7.06 (+30) 1974 7.34 (+31) 1.24 (+31) 8.58 (+31) 1975 6.10 (+29) 2.42 (+29) 8.52 (+29) 1976 1.44 (+31) 4.09 (+30) 1.85 (+31) 1977 9.19 (+31) 2.18 (+31) 1.14 (+32) 1978 1.01 (+33) 1.46 (+32) 1.16 (+33) 1979 1.58 (+32) 3.72 (+31) 1.95 (+32) 1980 6.08 (+30) 1.46 (+30) 7.54 (+30) 1981 2.59 (+32) 4.69 (+31) 3.06 (+32) 1982 4.55 (+32) 7.65 (+31) 5.32 (+32) 1983 1.80 (+31) 2.89 (+30) 2.09 (+31) 1984 1.79 (+32) 5.68 (+31) 2.36 (+32)
*Read 3.24 (+30) as 3.24 x 10 30.
6o (e) BUV 05 % CHANGE (70-80øN) - 1972
55 i i i i i i i i i i i i ! i ! ! i ! i i i i i i ! i i ! • 45
• ,•o
35
30
214 224 234 244 254 264 274 DAY OF YEAR
6o (b) BUV O5 % CHANGE (50-60øN) - 1972
55 i i i i i i i i i i i i ! I i i i i i i i i i ! i i i i i, • 45
( , < 40
35
30 i i i i ! I i ! ! i i i i i ! i i i i i i i i i i i i i i
214 224 234 244 254 264 274 DAY OF YEAR
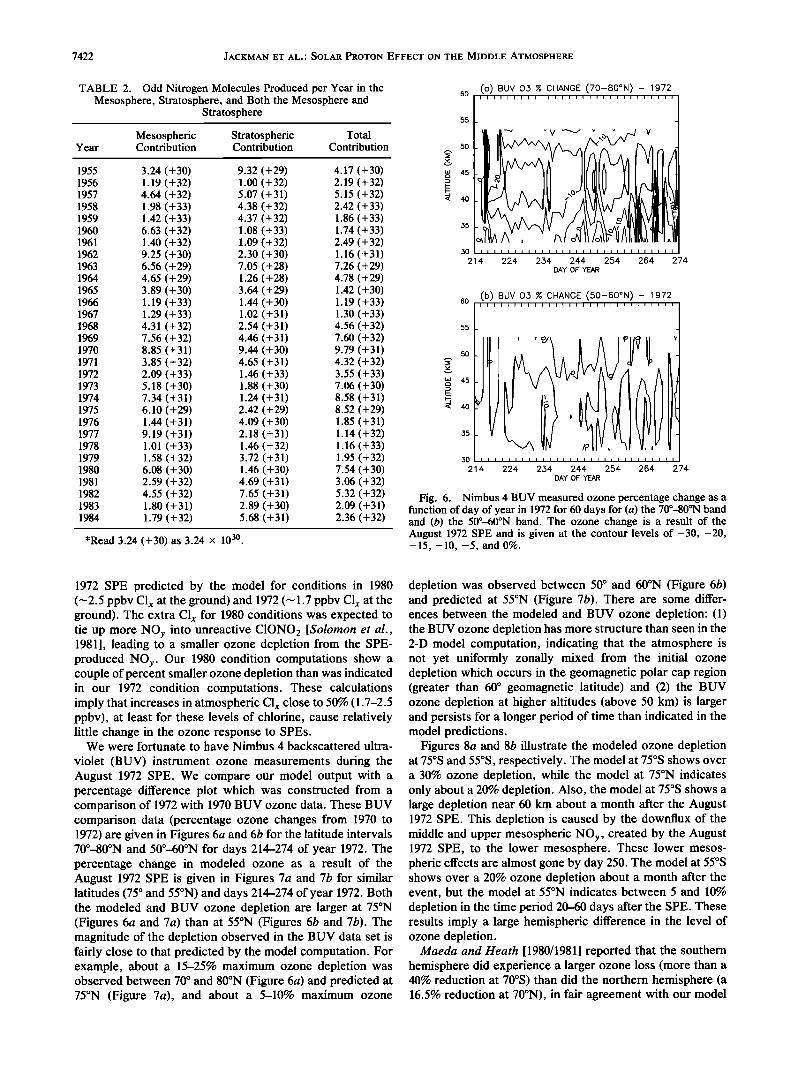
Fig. 6. Nimbus 4 B UV measured ozone percentage change as a function of day of year in 1972 for 60 days for (a) the 70ø-80øN band and (b) the 50ø-60øN band. The ozone change is a result of the August 1972 SPE and is given at the contour levels of-30, -20, - 15, - 10, -5, and 0%.
1972 SPE predicted by the model for conditions in 1980 (-2.5 ppbv Clx at the ground) and 1972 (-1.7 ppbv C1 x at the ground). The extra C1 x for 1980 conditions was expected to tie up more NOy into unreactive C1ONO2 [Solomon et al., 1981], leading to a smaller ozone depletion from the SPE- produced NOy. Our 1980 condition computations show a couple of percent smaller ozone depletion than was indicated in our 1972 condition computations. These calculations imply that increases in atmospheric Clx close to 50% (1.7-2.5 ppbv), at least for these levels of chlorine, cause relatively little change in the ozone response to SPEs.
We were fortunate to have Nimbus 4 backscattered ultra-
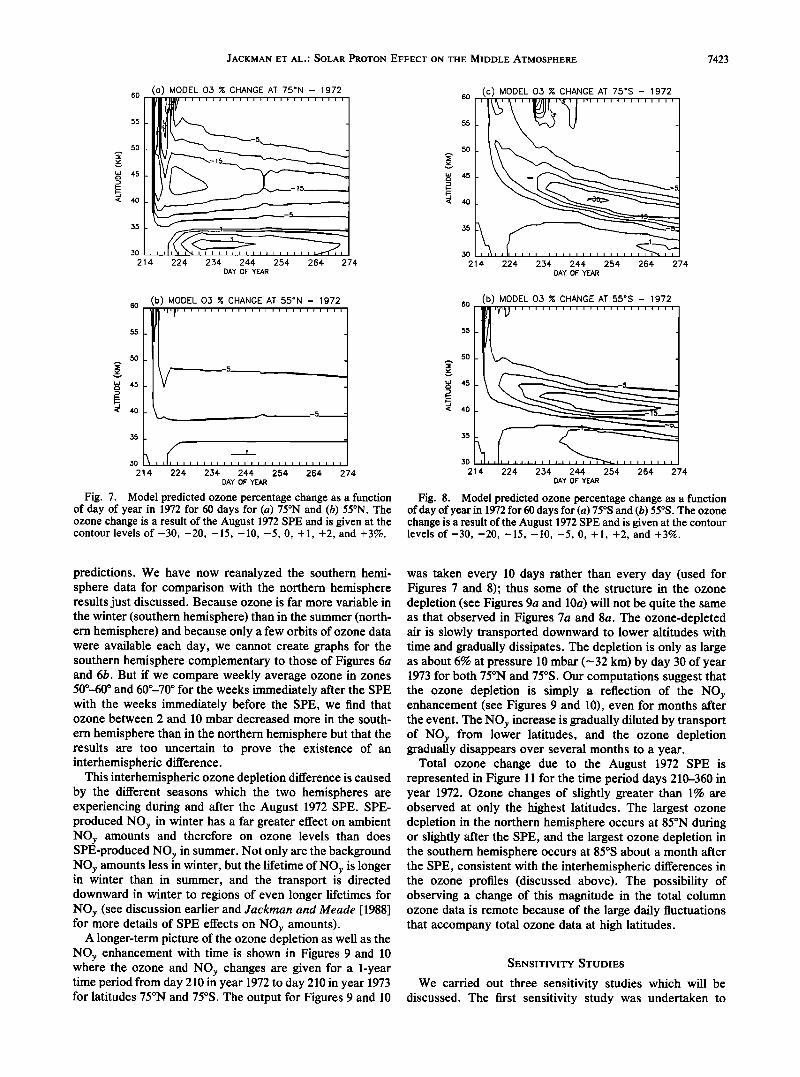
violet (BUV) instrument ozone measurements during the August 1972 SPE. We compare our model output with a percentage difference plot which was constructed from a comparison of 1972 with 1970 BUV ozone data. These BUV comparison data (percentage ozone changes from 1970 to 1972) are given in Figures 6a and 6b for the latitude intervals 70ø-80øN and 50ø-60øN for days 214-274 of year 1972. The percentage change in modeled ozone as a result of the August 1972 SPE is given in Figures 7a and 7b for similar latitudes (75 ø and 55øN) and days 214-274 of year 1972. Both the modeled and B UV ozone depletion are larger at 75øN (Figures 6a and 7a) than at 55øN (Figures 6b and 7b). The magnitude of the depletion observed in the B UV data set is fairly close to that predicted by the model computation. For example, about a 15-25% maximum ozone depletion was observed between 70 ø and 80øN (Figure 6a) and predicted at 75øN (Figure 7a), and about a 5-10% maximum ozone
depletion was observed between 50 ø and 60øN (Figure 6b) and predicted at 55øN (Figure 7b). There are some differ- ences between the modeled and B UV ozone depletion: (1) the BUV ozone depletion has more structure than seen in the 2-D model computation, indicating that the atmosphere is not yet uniformly zonally mixed from the initial ozone depletion which occurs in the geomagnetic polar cap region (greater than 60 ø geomagnetic latitude) and (2) the BUV ozone depletion at higher altitudes (above 50 km) is larger and persists for a longer period of time than indicated in the model predictions.
Figures 8a and 8b illustrate the modeled ozone depletion at 75øS and 55øS, respectively. The model at 75øS shows over a 30% ozone depletion, while the model at 75øN indicates only about a 20% depletion. Also, the model at 75øS shows a large depletion near 60 km about a month after the August 1972 SPE. This depletion is caused by the downflux of the middle and upper mesospheric NOy, created by the August 1972 SPE, to the lower mesosphere. These lower mesos- pheric effects are almost gone by day 250. The model at 55øS shows over a 20% ozone depletion about a month after the event, but the model at 55øN indicates between 5 and 10% depletion in the time period 20-60 days after the SPE. These results imply a large hemispheric difference in the level of ozone depletion.
Maeda and Heath [1980/1981] reported that the southern hemisphere did experience a larger ozone loss (more than a 40% reduction at 70øS) than did the northern hemisphere (a 16.5% reduction at 70øN), in fair agreement with our model
JACKMAN ET AL.' SOLAR PROTON EFFECT ON THE MIDDLE ATMOSPHERE 7423
60 (a) MODEL 05 % CHANGE AT 75øN - 1972
5O
'< 4o
3o
214
_ , ; i i•[ I ] ! i ! ! [ ! i [ [ i [ i i i _
224 2,34 244 254 264 274 DAY OF YEAR
3O
214
(O) MODEL 05 % CHANGE AT 75øS - 1972
'I
224 2,.34 244 254 264 274 DAY OF YEAR
60 (b) MODEL 05 % CHANGE AT 55øN - 1972 IIIVl [ I I I I I I I I I I I I I I I I I I I I [ I I
•o
40 • • - -5 35
30 • i i i i i i i i i i i i i i i i i i i i i i i i 21 4 224 2,34 244 254 264 274
DAY OF YEAR
Fig. 7. Model predicted ozone percentage change as a function of day of year in 1972 for 60 days for (a) 75øN and (b) 55øN. The ozone change is a result of the August 1972 SPE and is given at the contour levels of-30, -20, -15, -10, -5, 0, +1, +2, and +3%.
5O
3O
(b) MODEL 05 % CHANGE AT 55øS - 1972 '1 i i i i i i i
4 224 234 244 254 264 274 DAY OF YEAR
Fig. 8. Model predicted ozone percentage change as a function of day of year in 1972 for 60 days for (a) 75øS and (b) 55øS. The ozone change is a result of the August 1972 SPE and is given at the contour levels of-30,-20,-15,-10,-5, 0, +1, +2, and +3%.
predictions. We have now reanalyzed the southern hemi- sphere data for comparison with the northern hemisphere results just discussed. Because ozone is far more variable in the winter (southern hemisphere) than in the summer (north- ern hemisphere) and because only a few orbits of ozone data were available each day, we cannot create graphs for the southern hemisphere complementary to those of Figures 6a and 6b. But if we compare weekly average ozone in zones 50o-60 ø and 60o-70 ø for the weeks immediately after the SPE with the weeks immediately before the SPE, we find that ozone between 2 and 10 mbar decreased more in the south-
ern hemisphere than in the northern hemisphere but that the results are too uncertain to prove the existence of an interhemispheric difference.
This interhemispheric ozone depletion difference is caused by the different seasons which the two hemispheres are experiencing during and after the August 1972 SPE. SPE- produced NOy in winter has a far greater effect on ambient NOy amounts and therefore on ozone levels than does SPE-produced NOy in summer. Not only are the background NOy amounts less in winter, but the lifetime of NOy is longer in winter than in summer, and the transport is directed downward in winter to regions of even longer lifetimes for NOy (see discussion earlier and Jackman and Meade [1988] for more details of SPE effects on NOy amounts).
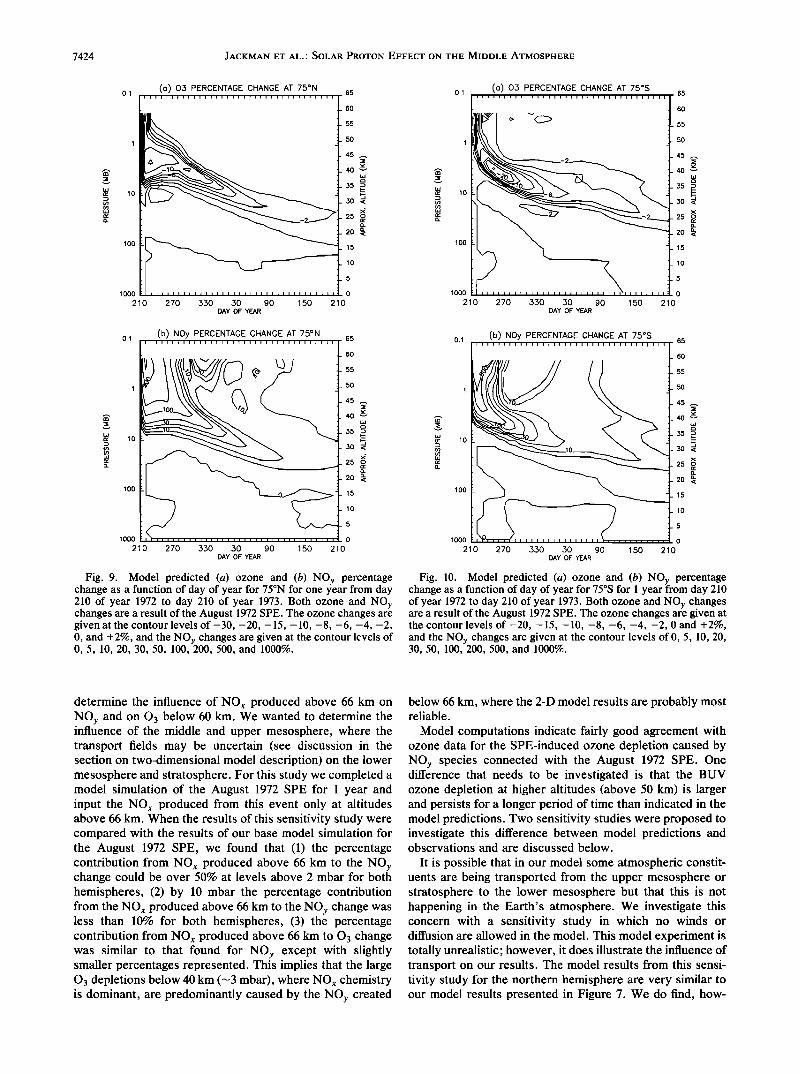
A longer-term picture of the ozone depletion as well as the NOy enhancement with time is shown in Figures 9 and 10 where the ozone and NOy changes are given for a 1-year time period from day 210 in year 1972 to day 210 in year 1973 for latitudes 75øN and 75øS. The output for Figures 9 and 10
was taken every 10 days rather than every day (used for Figures 7 and 8); thus some of the structure in the ozone depletion (see Figures 9a and 10a) will not be quite the same as that observed in Figures 7a and 8a. The ozone-depleted air is slowly transported downward to lower altitudes with time and gradually dissipates. The depletion is only as large as about 6% at pressure 10 mbar (-•32 km) by day 30 of year 1973 for both 75øN and 75øS. Our computations suggest that the ozone depletion is simply a reflection of the NOy enhancement (see Figures 9 and 10), even for months after the event. The NOy increase is gradually diluted by transport of NOy from lower latitudes, and the ozone depletion gradually disappears over several months to a year.
Total ozone change due to the August 1972 SPE is represented in Figure 11 for the time period days 210-360 in year 1972. Ozone changes of slightly greater than 1% are observed at only the highest latitudes. The largest ozone depletion in the northern hemisphere occurs at 85øN during or slightly after the SPE, and the largest ozone depletion in the southern hemisphere occurs at 85øS about a month after the SPE, consistent with the interhemispheric differences in the ozone profiles (discussed above). The possibility of observing a change of this magnitude in the total column ozone data is remote because of the large daily fluctuations that accompany total ozone data at high latitudes.
SENSITIVITY STUDIES
We carried out three sensitivity studies which will be discussed. The first sensitivity study was undertaken to
7424 JACKMAN ET AL.' SOLAR PROTON EFFECT ON THE MIDDLE ATMOSPHERE
1 ooo
210
0.1 (0) 03 PERCENTAGE CHANGE AT 75øN i i i i i I I I I I I I I I I I I I I I I I I I I I I I I I I I I I I
1
lO
100 15
lO
5
o
270 330 30 90 150 210 DAY OF YEAR
65 0.1
6O
55
5O 1 45
35 • •- • 10
30 • 25 o n o:
20 n
1 O0
lOOO
2
(O) 03 PERCENTAGE CHANGE AT 75øS IIIIIIIIIIIIIIIIIIIIIiiiiiiiiiiiiii
0 270 330 30 90 150 2 DAY OF YEAR
65
6O
55
_ 50
_4,5 •. 40 "--'
35 • 3o •
20 •
15
10
5
0
o
0.1 (b) NOy PERCENTAGE CHANGE AT 75øN 65 60
55
1 50
- 40 '--' '"" 35 • • lO g 30 •
20 •
100 15
10
5
1000 0
210 270 330 30 90 150 210 DAY OF YEAR
Fig. 9. Model predicted (a) ozone and (b) NOy percentage change as a function of day of year for 75øN for one year from day 210 of year 1972 to day 210 of year 1973. Both ozone and NOy changes are a result of the August 1972 SPE. The ozone changes are given at the contour levels of -30, -20, - 15, - t0, -8, -6, -4, -2, 0, and +2%, and the NOy changes are given at the contour levels of 0, 5, 10, 20, 30, 50, tOO, 200,500, and 1000%.
0.1 (b) NOy PERCENTAGE CHANGE AT 75øS 65 IIIIIIIIIIiiiiiiiiiiiiiiiiiiiiiiiii
6O
1 5O
45 • 40 v
35 2 lO 5
3O <
25 •
20 • 100 15
10
5
1000 0
210 270 330 30 90 150 210 DAY OF YEAR
Fig. 10. Model predicted (a) ozone and (b) NOy percentage change as a function of day of year for 75øS for t year from day 210 of year 1972 to day 210 of year 1973. Both ozone and NOy changes are a result of the August 1972 SPE. The ozone changes are given at the contour levels of -20, -15, -t0, -8, -6, -4, -2, 0 and +2%, and the NOy changes are given at the contour levels of 0, 5, t0, 20, 30, 50, t00, 200, 500, and t000%.
determine the influence of NOx produced above 66 km on NOy and on O3 below 60 km. We wanted to determine the influence of the middle and upper mesosphere, where the transport fields may be uncertain (see discussion in the section on two-dimensional model description) on the lower mesosphere and stratosphere. For this study we completed a model simulation of the August 1972 SPE for 1 year and input the NOx produced from this event only at altitudes above 66 km. When the results of this sensitivity study were compared with the results of our base model simulation for the August 1972 SPE, we found that (1) the percentage contribution from NO• produced above 66 km to the NOy change could be over 50% at levels above 2 mbar for both hemispheres, (2) by 10 mbar the percentage contribution from the NO• produced above 66 km to the NOy change was less than 10% for both hemispheres, (3) the percentage contribution from NOx produced above 66 km to 03 change was similar to that found for NOy except with slightly smaller percentages represented. This implies that the large 03 depletions below 40 km (--•3 mbar), where NO• chemistry is dominant, are predominantly caused by the NOy created
below 66 km, where the 2-D model results are probably most reliable.
Model computations indicate fairly good agreement with ozone data for the SPE-induced ozone depletion caused by NOy species connected with the August 1972 SPE. One difference that needs to be investigated is that the BUV ozone depletion at higher altitudes (above 50 km) is larger and persists for a longer period of time than indicated in the model predictions. Two sensitivity studies were proposed to investigate this difference between model predictions and observations and are discussed below.
It is possible that in our model some atmospheric constit- uents are being transported from the upper mesosphere or stratosphere to the lower mesosphere but that this is not happening in the Earth's atmosphere. We investigate this concern with a sensitivity study in which no winds or diffusion are allowed in the model. This model experiment is totally unrealistic; however, it does illustrate the influence of transport on our results. The model results from this sensi- tivity study for the northern hemisphere are very similar to our model results presented in Figure 7. We do find, how-

JACKMAN ET AL.' SOLAR PROTON EFFECT ON THE MIDDLE ATMOSPHERE 7425
90
80
70
60
50
40
50
,--- 20
• lO ,,, 0
• -10 ß • -20
-30
-40
-50
-6(} -70
-80
-90 I I • I I I I I I I I
210 240 270 ,300 ,330 DAY OF YEAR
PERCENTAGE TOTAL 03 CHANGE AFTER AUG 1972 SPE
i i
,360
Fig. 11. Model predicted total ozone percentage change as a function of day of year for 1 year from day 210 of year 1972 to day 210 of year 1973. Contour levels represented are -1, -0.8, -0.6, -0.4, and -0.2%.
ever, that the ozone-depleted air in this model experiment is not being transported to lower altitudes in the northern hemisphere as indicated in Figures 9 and 10. Model results in this sensitivity study for the southern hemisphere differ somewhat from our model results presented in Figure 8. Transport is very important in the 60 days presented for 55 ø and 75øS. The large ozone depletion observed in Figure 8b is a result of NOy transport; thus with no winds or diffusion the ozone depletion is predicted .to be only between 5 and 10%, and not the 30% presented in Figure 8b. The depletion at 75øS is about the same in this sensitivity study than shown in Figure 8a.
It is equally likely that in our model some atmospheric constituents are not being transported from the upper me- sosphere or stratosphere to the lower mesosphere but that this is happening in the Earth's atmosphere. We investigate this concern with a sensitivity study in which the vertical diffusion is increased by a factor of 20 from 10 to 1 mbar (increasing from 2 x 10 3 to 4 x 10 4 cm 2 s -1) with a constant value of 4 x 10 4 cm 2 s -1 for altitudes above 1 mbar. Again, the values in the northern hemisphere are similar in this sensitivity study when compared to the base case. Less ozone depletion was predicted in this sensitivity study than observed in the base case for the southern hemisphere, however, the differences between the two studies are small.
Both sensitivity studies gave a smaller ozone depletion in the lower mesosphere than was observed in the data, the same as indicated in our base model simulation. These two
sensitivity studies do not span all possible uncertainties in our 2-D model, but they do represent two extreme compu- tations which indicate that it may be difficult to resolve easily the model-observation disagreement in the lower mesos- phere. This disagreement between model predictions and satellite observations may be related to the ozone depletion problem noted earlier and discussed by Jackman and Mc- Peters [1985]. They showed that model computations of ozone depletion in the lower mesosphere/upper stratosphere were less than indicated in the observations of ozone deple- tion by the Nimbus 7 SBUV instrument.
This model prediction problem may also be related to the classical problem that models tend to have in predicting
ozone amounts in the upper stratosphere. Models tend to predict less ozone than observed or, equivalently, models constrained by observations predict more ozone loss than production in the ozone photochemical region which is located in the upper stratosphere at the low to middle latitudes [e.g., Wofsy, 1978; Butler, 1978; Frederick et al., 1978; Johnston and Podolske, 1978; Jackman et al., 1986; Natarajan and Callis, 1989; McElroy and Salawitch, 1989]. This discrepancy implies that we have something missing or incorrect in our photochemical description of the upper stratosphere; for instance, there could be a missing impor- tant reaction, an incorrect photodissociation or reaction rate, a missing important species, a combination of the above, or perhaps some other model simulation problem. Future observations of ozone depletion and NOy or HOx enhancements during SPEs may help in the resolution of this model-observation disagreement.
ANTARCTIC NITRATE DEPOSITION
The deposition of trace molecules in the surface ice sheet in both the northern and southern hemisphere is an intriguing problem. The southern hemisphere ice cores are character- ized by large spikes in the nitrate (NO3-) concentration. These spikes could come from any of a variety of terrestrial and extraterrestrial sources [see Zeller and Parker, 1981, pp. 896-897]. Zeller et al. [1986] have indicted that the August 1972 SPE is observable in the nitrate deposition data. Earlier calculations [Jackman and McPeters, 1987] showed that
enough NOy was produced in the August 1972 SPE to possibly generate a detectable signal in the ice core. In this study we propose a viable mechanism for communicating enhanced amounts of stratospheric NOy to the ground and further investigate the possibility of the August 1972 SPE event being observed in the Antarctic ice cores.
The mechanism and model studies are described in detail
in •he appendix. The mechanism requires the heterogeneous processes that are important in the formation of the Antarc- tic ozone hole. Basically, the NOy produced by SPEs is transported downward to the lower stratosphere, removed from the gas phase by heterogeneous processes, and then precipitated into the troposphere and subsequently to the ground.
Performing model studies and then invoking the maximum possible ice deposition does not provide for an NOy en- hancement in the ice core that agrees with the observations of Zeller et al. [1986]. The maximum NOy enhancement that is calculated is 1.6 x 10¹⁵ molecules cm -2 at 75øS, which is a 10.6% increase in NOy above the model background. If the entire amount was transported to the ground within 1 month, the nitrate flux could be as large as 1.6 mg NOj- m -2 month -1 , in reasonable agreement with Zeller et al. [1986]. However, the nitrate maximum can only b e 10.6% above the background and enhancements measured by Zeller et al. are 400% above background. Therefore our model suggests that the correlation of the spike with the August 1972 SPE is fortuitous and that the spike has a different origin.
A complementary study of the effects of solar cycle variations on stratospheric odd nitrogen and the possible geochemical implications in Antarctic nitrate flux was re- cently published by Legrand et al. [1989]. Legrand et al. [1989] studied the effect of solar cycle variations in ultravi- olet radiation, thermospheric and mesospheric NOv down-
7426 JACKMAN ET AL..' SOLAR PROTON EFFECT ON THE MIDDLE ATMOSPHERE
ward transport, and galactic cosmic rays on stratospheric NOy. They concluded that the net solar cycle changes in stratospheric NOy are fairly modest (3-7%) and that these changes are not sufficient to account for the solar cycle variation in Antarctic nitrate flux indicated by Zeller and Parker [ 1981].
We suggest that the solar cycle variation in nitrate flux [Zeller and Parker, i981] and the spike in 1972 [Zeller et al., 1986] are perhaps indications of other atmospheric effects, such as cold temperatures in the lower stratosphere or tropospheric meteorological variation in the Antarctic.
CONCLUSIONS
It would be useful to compare these detailed studies with another large SPE similar in magnitude to the August 1972 SPE, perhaps one that occurs during the current solar active period. Since NOy constituents are responsible for most of the ozone loss in the stratosphere [Jackman et al., 1986], this type of comparison is useful for further validation of NOy- ozone-related photochemistry.
Our model computations indicate that NOy will not be substantially changed over a solar cycle by SPEs. Significant SPEs last only 1-5 days, tend to occur near solar maximum, and are typically months to years apart; thus the NOy produced by SPEs does not, in general, build up. The NOy changes caused by the SPEs are mainly at high latitudes and are on time scales of several months (most SPEs) to a year (August 1972 SPE), after which NOy relaxes to its ambient levels. Fractional ozone changes are even smaller than the fractional NOy changes and are significant only for the August 1972 SPE. Ozone, like NOy, returns to its ambient levels on time scales of several months to a year.
We presented a mechanism whereby NOy enhancements in the stratosphere can be communicated to the ground. Our computations of the SPE-related increase in the strato- spheric NOy abundance indicated that the correlation be- tween the huge spikes in nitrate flux data and major SPEs should probably be regarded as fortuitous.
APPENDIX: ANTARCTIC NITRATE DEPOSITION
Episodic spikes of nitrate in Arctic and Antarctic ice cores have been attributed to a variety of sources ranging from biological fixation, to supernovae, to solar activity [Zeller and Parker, 1981]. A major problem with the deposition of reactive stratospheric nitrogen compounds in the Antarctic ice pack has been the lack of any viable mechanism to communicate stratospheric air to the troposphere and sub- sequently to the surface on the necessary time scales. Zeller et al. [1986] show a nitrate peak 4 months after the 1972 SPE and attribute the peak to the SPE. In this appendix we propose a mechanism based on the 1987 Antarctic Airborne Ozone Experiment (AAOE) observations. Then, using the model, we investigate the possibility that the peak is caused by the SPE.
Communication Mechanism
The AAOE data revealed that the wintertime polar vortex is isolated from the rest of the hemisphere and contains very low values of N20 [e.g., Loewenstein et al., 1989]. The values of N20 within the vortex are approximately one half of the values found just outside the vortex. These low values
within the vortex are typical of higher altitudes and are an indication that significant subsidence has taken place during the polar night. The AAOE results suggest that there is a downward displacement of polar air of the order of 5-10 km in the lower stratosphere. Qualitatively similar results have been found in the recent Airborne Arctic Stratospheric Expedition.
These large vertical displacements could be the first step
in moving SPE-generated NOy enhancements toward the ground. However, there is no indication that this downward
motion would move the NOy out of the stratosphere and into the troposphere. Therefore other steps are needed if the NOy is to get to the ground.
The same heterogeneous mechanisms that are responsible for the formation of the Antarctic ozone hole can provide the next step. The current understanding of this mechanism is the formation of large water particles that scavenge out the reactive nitrogen compounds. These particles then precipi- tate out of the lower stratosphere, leaving the lower strato- sphere depleted in reactive nitrogen and enhanced in reac- tive chlorine. The formation of water clouds in the
stratosphere requires very low temperatures. The AAOE data, therefore, suggest that the downward
motion of NOy-rich air, followed by the precipitation of NOy-rich particles to the troposphere, followed by deposi- tion of nitrate containing ice at the surface, could communi- cate the SPE event to the ground. The mechanism would be active in winter and spring and should work on the time scale of months. Of course, this mechanism would move the
background NOy as well as any SPE enhancement. Given the above mechanism, there are several implica-
tions on nitrate deposition in the polar ice caps: 1. Temperatures in the northern hemisphere winter polar
vortex are warmer than in the southern hemisphere. The temperatures do not regularly get cold enough to form water droplets, and there is no precipitation of nitrate-enriched air out of the stratosphere. Therefore spikes of extraterrestrial origin are not expected in the northern hemisphere.
2. Given the time scales of months for the existence of
SPE-enhanced air, the effect of any particular SPE on ice cap deposition would be a strong function of the season in which the SPE occurred. For instance, the mechanism for downward displacement and precipitation would not occur during the summer, and an SPE in January would go largely unnoticed in the southern hemisphere ice cores.
3. The mechanism depends strongly on temperature and water vapor concentrations.
4. The spikes in the ice core may be entirely of terrestrial origin and simply markers of atmospheric processes (e.g., low stratospheric temperatures leading to cloud formation).
Given these possibilities, it is worth noting that 30 and 50 mbar temperatures during austral spring in 1972 at the south pole were the coldest observed prior to the 1980s and the formation of the ozone hole [Trenberth and Olson, 1989]. Therefore the 1972 ice core nitrate maximum could be
related to these cold temperatures. However, other cold seasons and the very cold temperatures seen in the 1980s do not obviously correlate with nitrate spikes. Any relation of the nitrate spikes to stratospheric activity is not straightfor- ward, and careful analysis of tropospheric and stratospheric meteorology is needed to understand their origin.

JACKMAN ET AL.' SOLAR PROTON EFFECT ON THE MIDDLE ATMOSPHERE 7427
Model Studies
It is not possible to model fully the above mechanism within the current framework of the 2-D model because of
the lack of heterogeneous (cloud) chemistry. However, the model transport fields can be altered to give a credible simulation of the AAOE observations. Then the maximum
possible enhancement that the SPE could produce can be estimated. This section presents results from such experi- ments and, also, experiments that investigate the sensitivity of the results to the ion pair production by solar protons.
The model used in this study differs from the one used by Jackman and McPeters [ 1987]. Therefore we first investigate what the base model predicts about nitrate deposition. The model shows that the August 1972 SPE has enhanced the atmosphere in the year past the event between the ground and 10 mbar by a maximum of 4.4 x 10 TM NOy molecules cm -2 (about a 3.5% increase) at 75øS. It is reasonable to assume that only a small fraction of the NOy enhancement above 10 mbar will make it to the ground after a year past the event, and thus we ignore this upper stratospheric (above 10 mbar) component of the NOy enhancement. The increase in NOy between the ground and 10 mbar as a result of the August 1972 SPE corresponds to a maximum deposition of about 0.45 mg NO•- m -2 month -1 (assuming it is all deposited in a month). This can be compared to a value of approximately 1.5 mg NO•- m -2 month -1 above back- ground from Zeller et al. [1986].
By setting the horizontal diffusion (Kyy) to zero for lati- tudes of -+65 ø , -+75 ø , and -+85 ø , it is possible to simulate the vortex isolation and downward motion observed during
AAOE. This yields significantly more NOy below 10 mbar in the year following the SPE event. The enhancement is 1.6 x 10¹⁵ NOy molecules cm -2 (about a 10.6% increase) at 75øS. With heterogeneous processes it is reasonable to assume that the entire signal can be transported to the ground. Therefore the nitrate flux could be as large as 1.6 mg NOr- m -2 month -1 (assuming it is all deposited in a month), which is in reasonable agreement with the observations of Zeller et al. [1986]. This computation pushes the NOy enhancement of the ground nitrate flux to the limit.
The denitrification of lower stratospheric air by clouds would not act just on the SPE-enhanced NOy but also on the background NOy. Even with the reduced gyy the NOy increase due to the August 1972 event is only 10.6% above background. The enhancements of nitrate observed by Zeller et al. [1986] are 400% above background. Therefore our model suggests that the relationship of the spike with the August 1972 SPE is fortuitous.
It is also possible that errors exist in the specification of the N production by ion pairs. Laird et al. [1988] have argued that Legrand and Delmas [1986] did not observe a solar signal in the nitrate data because they did not take into account the possibility that SPEs produce more than 1.25 N atoms per ion pair. They discuss the possibility that SPE- produced N•- constituents will form water clusters and then nitrate in water clusters. Other studies have indicated that
N•- will likely end up as O•- first and eventually a water cluster [Frederick, 1976; Solomon et al., 1981] and not affect the NOy abundance. Jackman et al. [1979] concluded that production rates larger than 1.5 NOy per ion pair in the stratosphere are difficult to justify.
We have performed a study to investigate if a larger
production of NOy per ion pair is reasonable. About the only possibility for N•- to affect NOy directly in the stratosphere is through a dissociative recombination with an electron with the resultant formation of two N atoms. The reaction N•- + e---> N* + N has a rate of k• = 3 x 10 -7 (T/300) -ø'2 cm 3 s -1 and the charge exchange reaction N•- + 02 --> O•- + N2 has a rate of k2 = 2 x 10⁻¹ø cm3 s-1 (both rates taken from Whitten and Poppo•[1971, p. 251]). The August 1972 SPE was the largest in the past 22 years, with electron densities computed to be between 10 4 and 105 cm -3 s -1 near 50 km [Banks, 1979]. At 50 km the 02 number density is 5.6 x 1016 cm -3, and the temperature is about 260 K. We compare the two rates for N•- loss at 50 km by computing k 1 e- - 0.031 s -1 assuming e- = 105 cm -3 an upper limit and k 2 02 = 1.1 x 10⁷ s -1. Clearly, the charge exchange reaction is several orders of magnitude faster than recombination for loss of N•- at 50 km. At lower altitudes the charge exchange is even more dominant. These calculations indicate that N•- will likely end up as O•- and eventually a water cluster through O•- to O•- ß H20 and got affect the NOy abundance, which is in agreement with the conclusions of Frederick [1976] and Solomon et al. [1981].
We did complete a sensitivity study in which some extra production of N atoms from N•- recombination was input for the August 1972 SPE. For this model experiment we assume an NOy production of 2.5 N atoms per ion pair (similar to that suggested by Laird et al. [1988]). This gave an NOy. enhancement between the ground and 10 mbar of 8.7 x 10 TM NOy molecules cm -2 at 75øS, which translates into a maxi- mum deposition of about 0.88 mg NO•- m -2 month -1 (assuming it is all deposited in a month). This nitrate deposition is still less than that observed by Zeller et al. [1986]. We found that the ozone depletion predicted from this model calculation was somewhat higher than indicated in the BUV data for the northern hemisphere. At 75øN the maximum ozone decrease was computed to be 25-30%, compared to the 15-25% observed, and at 55øN the ozone decrease was computed to be 10-15%, compared to the 5-10% observed. We conclude from this study that a pro- duction of 2.5 N atoms per ion pair is probably too large.
Acknowledgments. The authors would like to thank Thomas P. Armstrong (University of Kansas) for sending solar proton data that were used in the ion pair production computations for this paper. We would like to acknowledge Sushil Chandra of NASA Goddard Space Flight Center for useful comments on an earlier version of this manuscript. We thank Richard S. Stolarski of NASA Goddard Space Flight Center for helpful discussions concerning this re- search. Finally, we thank Linwood B. Callis of NASA/Langley Research Center and another anonymous reviewer for constructive comments on this manuscript. A.R.D. is a Universities Space Research Association Resident Associate.
REFERENCES
Armstrong, T. P., C. Brundardt, and J. E. Meyer, Satellite obser- vations of interplanetary and polar cap solar particle fluxes from 1963 to the present, in Weather and Climate Response to Solar Variations, edited by B. M. McCormac, pp. 71-79, Colorado Associated University Press, Boulder, 1983.
Banks, P.M., Joule heating in the high-latitude mesosphere, J. Geophys. Res., 84, 6709-6712, 1979.
Butler, D. M., The uncertainty in ozone calculations by a strato- spheric photochemistry model, Geophys. Res. Lett., 5, 769-772, 1978.
7428 JACKMAN ET AL.: SOLAR PROTON EFFECT ON THE MIDDLE ATMOSPHERE
Crutzen, P. J., I. S. A. Isaksen, and G. C. Reid, Solar proton events: Stratospheric sources of nitric oxide, Science, 189,457-458, 1975.
DeMore, W. B., J. J. Margitan, M. J. Molina, R. T. Watson, D. M. Golden, R. F. Hampson, M. J. Kurylo, C. J. Howard, and A. R. Ravishankara, Chemical kinetics and photochemical data for use in stratospheric modeling, JPL Publ., 87-41, 1987.
Douglass, A. R., C. H. Jackman, and R. S. Stolarski, Comparison of model results transporting the odd nitrogen family with results transporting separate odd nitrogen species, J. Geophys. Res., 94, 9862-9872, 1989.
Fabian, P., J. A. Pyle, and R. J. Wells, The August 1972 solar proton event and the atmospheric ozone layer, Nature, 277, 458-460, 1979.
Frederick, J. E., Solar corpuscular emission and neutral chemistry in the Earth's middle atmosphere, J. Geophys. Res., 81, 3179- 3186, 1976.
Frederick, J. E., B. W. Guenther, P. B. Hays, and D. F. Heath, Ozone profiles and chemical loss rates in the tropical stratosphere deduced from backscatter ultraviolet measurements, J. Geophys. Res., 83,953-958, 1978.
Guthrie, P. D., C. H. Jackman, and A.M. Thompson, Methane and carbon monoxide: Budgets and seasonal behavior in a 2-D model simulation (abstract), Eos Trans. AGU, 65, 834, 1984.
Hampson, R. F., Chemical kinetic and photochemical data sheets for atmospheric reactions, Rep. FAA-EE-80-17, Natl. Bur. of Stand., Washington, D.C., 1980.
Heath, D. F., A. J. Krueger, and P. J. Crutzen, Solar proton event: Influence on stratospheric ozone, Science, 197, 886-889, 1977.
Jackman, C. H., and R. D. McPeters, The response of ozone to solar proton events during solar cycle 21: A theoretical interpre- tation, J. Geophys. Res., 90, 7955-7966, 1985.
Jackman, C. H., and R. D. McPeters, Solar proton events as tests for the fidelity of middle atmosphere models, Phys. Scr., T18, 309-316, 1987.
Jackman, C. H., and P. E. Meade, Effect of solar proton events in 1978 and 1979 on the odd nitrogen abundance in the middle atmosphere, J. Geophys. Res., 93, 7084-7090, 1988.
Jackman, C. H., H. S. Porter, and J. E. Frederick, Upper limits on production rate of NO per ion pair, Nature, 280, 170, 1979.
Jackman, C. H., J. E. Frederick, and R. S. Stolarski, Production of odd nitrogen in the stratosphere and mesosphere: An intercom- parison of source strengths, J. Geophys. Res., 85, 7495-7505, 1980.
Jackman, C. H., R. S. Stolarski, and J. A. Kaye, Two-dimensional monthly average ozone balance from limb infrared monitor of the stratosphere and stratospheric and mesospheric sounder data, J. Geophys. Res., 91, 1103-1116, 1986.
Jackman, C. H., P. D. Guthrie, and J. A. Kaye, An intercomparison of nitrogen-containing species in Nimbus 7 LIMS and SAMS data, J. Geophys. Res., 92, 995-1008, 1987.
Johnston, H. S., and J. Podolske, Interpretation of stratospheric photochemistry, Rev. Geophys., 16, 491-519, 1978.
Laird, C. M., E. J. Zeller, and G. A.M. Dreschhoff, Comments on "Relative contributions of tropospheric and stratospheric sources to nitrate in Antarctic snow" by M. R. Legrand and R. J. Delmas, Tellus, 40B, 233-236, 1988.
Legrand, M. R., and R. J. Delmas, Relative contributions of tropospheric and stratospheric sources to nitrate in Antarctic snow, Tellus, 38B, 236-249, 1986.
Legrand, M. R., F. Stordal, I. S. A. Isaksen, and B. Rognerud, A model study of the stratospheric budget of odd nitrogen, including effects of solar cycle variations, Tellus, 4lB, 413-426, 1989.
Loewenstein, M., J. R. Podolske, K. R. Chan, and S. E. Strahan, Nitrous oxide as a dynamical tracer in the 1987 Airborne Antarc- tic Ozone Experiment, J. Geophys. Res., 94, 11,589-11,598, 1989.
Maeda, K., and D. F. Heath, Stratospheric ozone response to a solar proton event: Hemispheric asymmetries, Pure Appl. Geo- phys., 119, 1-8, 1980/1981.
McElroy, M. B., and R. J. Salawitch, Changing composition of the global stratosphere, Science, 243, 763-770, 1989.
McPeters, R. D., A nitric oxide increase observed following the July 1982 solar proton event, Geophys. Res. Lett., 13,667-670, 1986.
McPeters, R. D., and C. H. Jackman, The response of ozone to
solar proton events during solar cycle 21: The observations, J. Geophys. Res., 90, 7945-7954, 1985.
McPeters, R. D., C. H. Jackman, and E.G. Stassinopoulos, Observations of ozone depletion associated with solar proton events, J. Geophys. Res., 86, 12,071-12,081, 1981.
Natarajan, M., and L. B. Callis, Examination of stratospheric ozone photochemistry in light of recent data, Geophys. Res. Lett., 16, 473-476, 1989.
Newell, R. E., J. W. Kidson, D. G. Vincent, and G. J. Boer, The General Circulation of the Tropical Atmosphere and Interations With Extratropical Latitude, vol. 1, MIT Press, Cambridge, Mass., 1972.
Porter, H. S., C. H. Jackman, and A. E. S. Green, Efficiencies for production of atomic nitrogen and oxygen by relativistic proton impact in air, J. Chem. Phys., 65, 154-167, 1976.
Reagan, J. B., R. E. Meyerott, R. W. Nightingale, R. C. Gunton, R. G. Johnson, J. E. Evans, W. L. Imhof, D. F. Heath, and A. J. Krueger, Effects of the August 1972 solar particle events on stratospheric ozone, J. Geophys. Res., 86, 1473-1494, 1981.
Rosenfield, J. E., M. R. Schoeberl, and M. A. Geller, A computa- tion of the stratospheric diabatic residual circulation using an accurate radiative transfer model, J. Atmos. Sci., 44, 859-876, 1987.
Rusch, D. W., J.-C. Gerard, S. Solomon, P. J. Crutzen, and G. C. Reid, The effect of particle precipitation events on the neutral and ion chemistry of the middle atmosphere, I, Odd nitrogen, Planet. Space Sci., 29, 767-774, 1981.
Solomon, S., and P. J. Crutzen, Analysis of the August 1972 solar proton event including chlorine chemistry, J. Geophys. Res., 86, 1140-1146, 1981.
Solomon, S., D. W. Rusch, J.-C. Gerard, G. C. Reid, and P. J. Crutzen, The effect of particle precipitation events on the neutral and ion chemistry of the middle atmosphere, 2, Odd hydrogen, Planet. Space Sci., 29, 885-892, 1981.
Solomon, S., G. C. Reid, D. W. Rusch, and R. J. Thomas, Mesospheric ozone depletion during solar proton events, paper presented at the Sixth ESA-PAC Meeting, Eur. Space Agency, Interlaken, Switzerland, April 12-19, 1983a.
Solomon, S., G. C. Reid, D. W. Rusch, and R. J. Thomas, Mesospheric ozone depletion during the solar proton event of July 13, 1982, 2, Comparison between theory and measurements, Geophys. Res. Lett., 10, 257-260, 1983b.
Swider, W., and T. J. Keneshea, Decrease of ozone and atomic oxygen in the lower mesosphere during a PCA event, Planet. Space Sci., 21, 1969-1973, 1973.
Thomas, R. J., C. A. Barth, G. J. Rottman, D. W. Rusch, G. H. Mount, G. M. Lawrence, R. W. Sanders, G. E. Thomas, and L. E. Clemens, Mesospheric ozone depletion during the solar proton event of July 13, 1982, 1, Measurement, Geophys. Res. Lett., 10, 253-255, 1983.
Trenberth, K. E., and J. G. Olson, Temperature trends at the south pole and McMurdo Sound, J. Clim. 2, 1196-1206, 1989.
Weeks, L. H., R. S. CuiKay, and J. R. Corbin, Ozone measure- ments in the mesosphere during the solar proton event of Novem- ber 2, 1969, J. Atmos. Sci., 29, 1138-1142, 1972.
Whitten, R. C., and I. C. Poppoff, Fundamentals ofAeronomy, p. 251, John Wiley, New York, 1971.
Wofsy, S. C., Temporal and latitudinal variations of stratospheric trace gases: A critical comparison between theory and experi- ment, J. Geophys. Res., 83, 364-378, 1978.
Zeller, E. J., and B. C. Parker, Nitrate ion in Antarctic firn as a marker for solar activity, Geophys. Res. Lett., 8, 895-898, 1981.
Zeller, E. J., G. A.M. Dreschhoff, and C. M. Laird, Nitrate flux on the Ross Ice Shelf, Antarctica and its relation to solar cosmic rays, Geophys. Res. Lett., 13, 1264-1267, 1986.
A. R. Douglass, C. H. Jackman, R. D. McPeters, and R. B. Rood, Laboratory for Atmospheres, Code 616, NASA Goddard Space Flight Center, Greenbelt, MD 20771.
P. E. Meade, Department of Astrophysical, Planetary, and Atmo- spheric Sciences, University of Colorado, Boulder, CO 80309.
(Received September 14, 1989; revised January 2, 1990;
accepted January 3, 1990.)