effect of socio-demographic factors and obesity in blood pressure
TRANSCRIPT

Effect of Socio-demographic Factors and Obesity
on Blood Pressure among Adults Based on Health
Status in Gaza, Palestine: The UPM-Gaza Study
Mohammed Ellulu
Department of Nutrition and Dietetics,
Faculty of Medicine and Health Sciences

Background
• To identify risk factors of blood pressure due to
change of socio-demographic factors, obesity and
health status.
• Cross-sectional designed study of 482 participants
have chosen from Primary Health Care Centers in
Gaza Strip; Palestine.
• The study ethically approved by:
1. JKE-UPM: (FPSK_Mac (13)04).
2. Helsinki committee: (PHRC/HC/11/13).
28-Jan-15 2 9th Asia Pacific Conference on Clinical
Nutrition (APCCN)
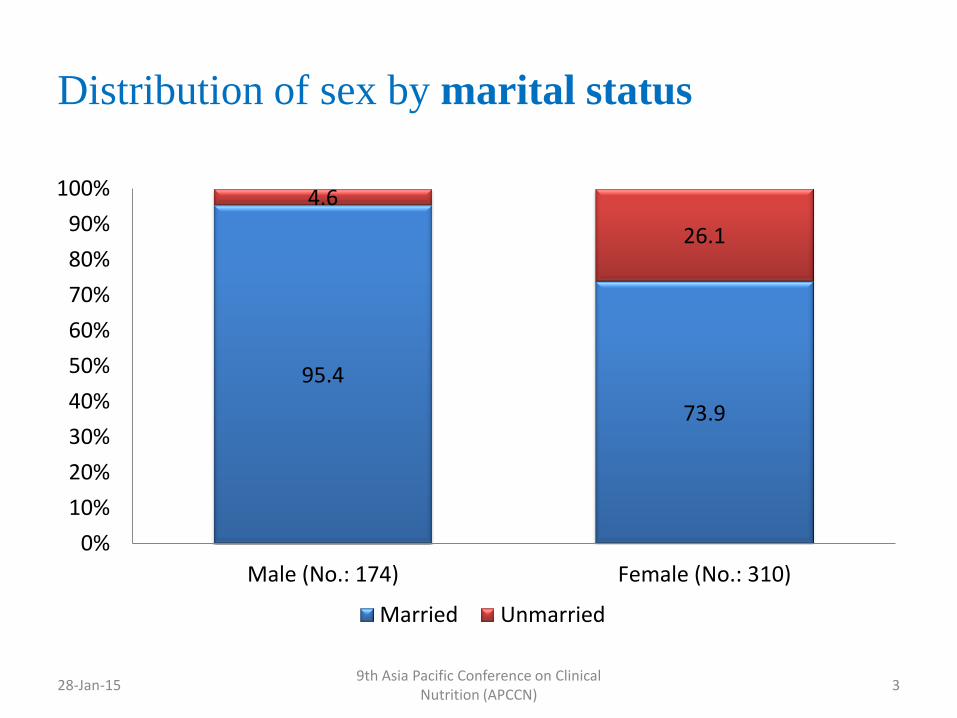
Distribution of sex by marital status
28-Jan-15 3 9th Asia Pacific Conference on Clinical
Nutrition (APCCN)
95.4
73.9
4.6
26.1
0%
10%
20%
30%
40%
50%
60%
70%
80%
90%
100%
Male (No.: 174) Female (No.: 310)
Married Unmarried
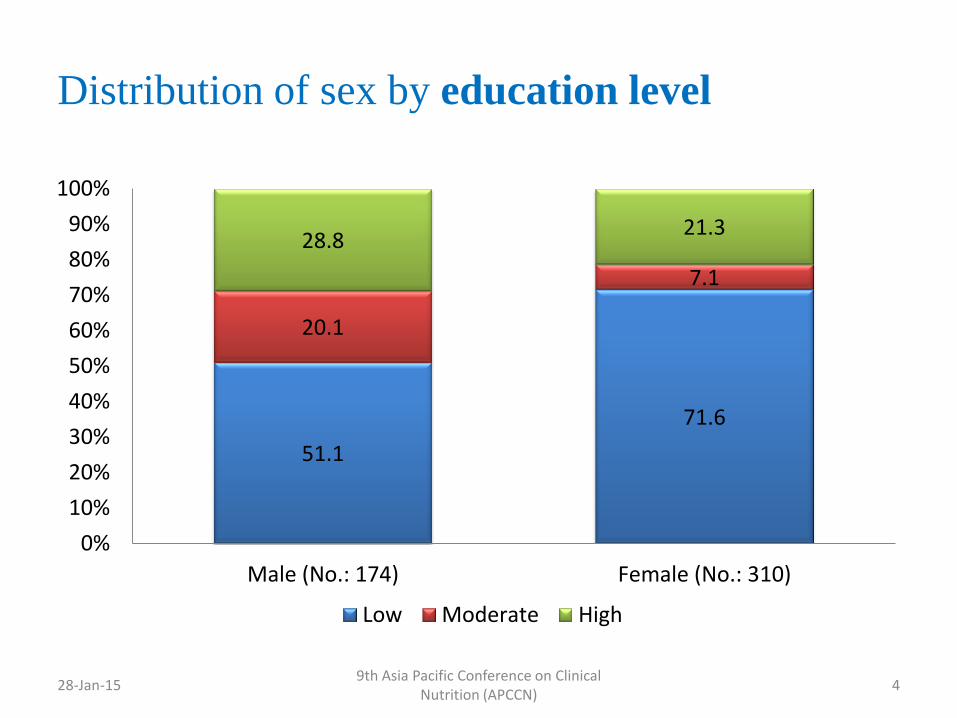
Distribution of sex by education level
51.1
71.6
20.1
7.1
28.8 21.3
0%
10%
20%
30%
40%
50%
60%
70%
80%
90%
100%
Male (No.: 174) Female (No.: 310)
Low Moderate High
28-Jan-15 9th Asia Pacific Conference on Clinical
Nutrition (APCCN) 4
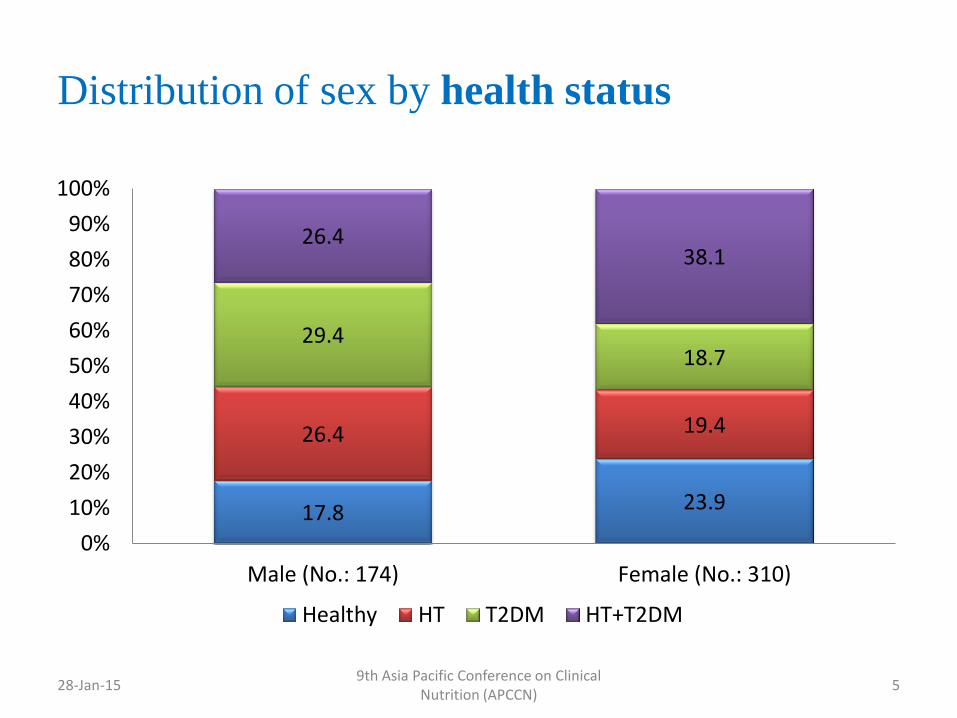
Distribution of sex by health status
28-Jan-15 5 9th Asia Pacific Conference on Clinical
Nutrition (APCCN)
17.8 23.9
26.4 19.4
29.4 18.7
26.4 38.1
0%
10%
20%
30%
40%
50%
60%
70%
80%
90%
100%
Male (No.: 174) Female (No.: 310)
Healthy HT T2DM HT+T2DM

Distribution of sex by obesity factors
28-Jan-15 6 9th Asia Pacific Conference on Clinical
Nutrition (APCCN)
67.8
86.8 72.9
91.6
32.2
13.2 27.1
8.4
0%
10%
20%
30%
40%
50%
60%
70%
80%
90%
100%
Male (BMI) Female (BMI) Male (WC) Female (WC)
Obese Non-obese
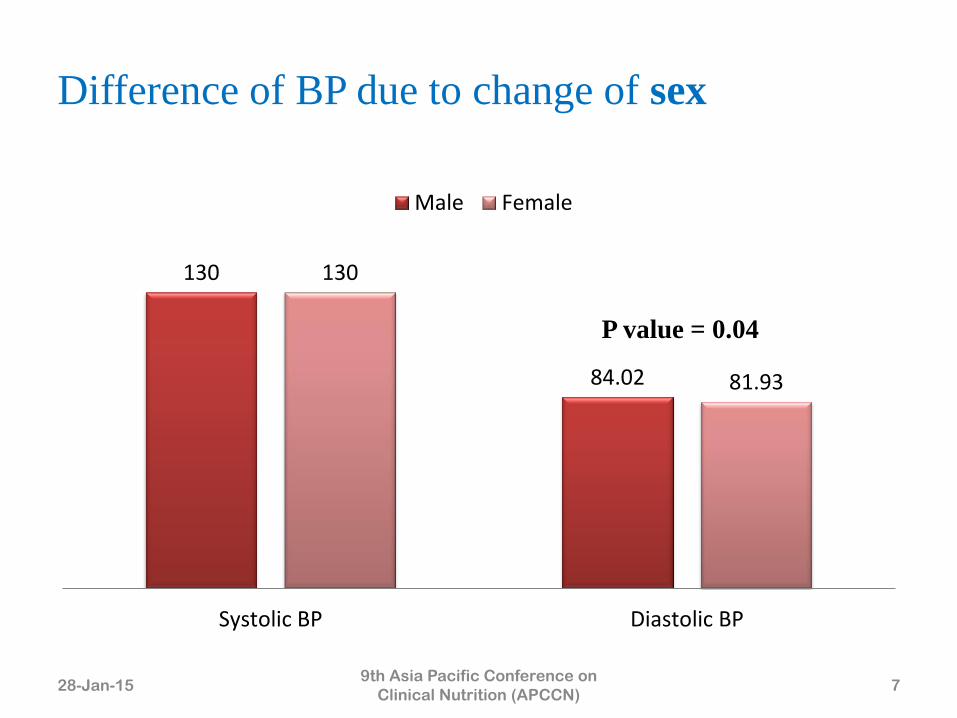
Difference of BP due to change of sex
130
84.02
130
81.93
Systolic BP Diastolic BP
P value = 0.04
Male Female
28-Jan-15 7 9th Asia Pacific Conference on
Clinical Nutrition (APCCN)
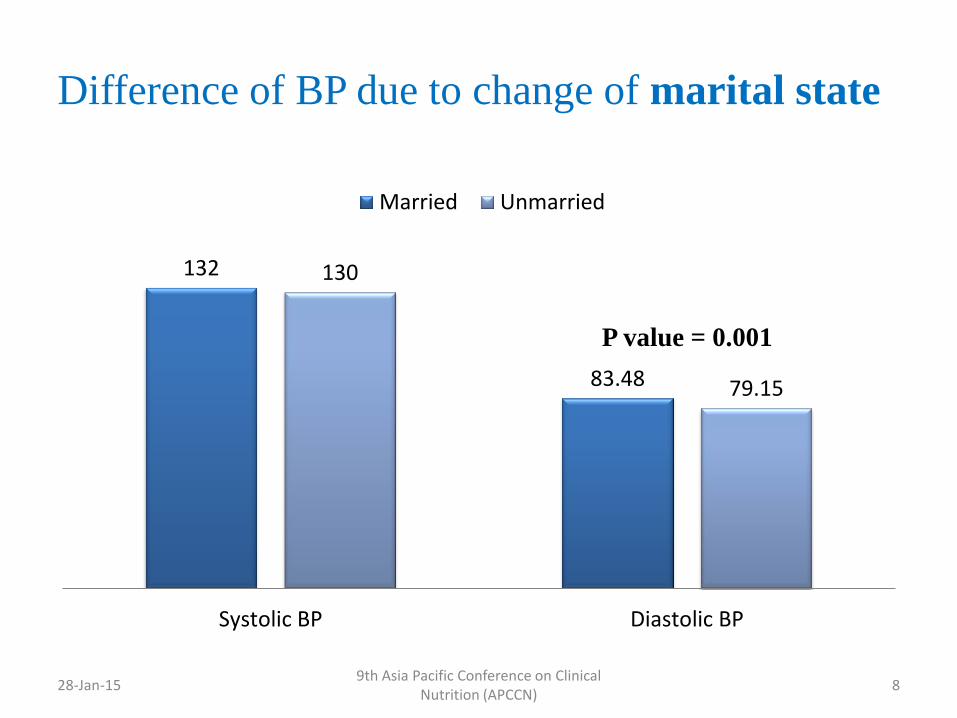
Difference of BP due to change of marital state
132
83.48
130
79.15
Systolic BP Diastolic BP
P value = 0.001
Married Unmarried
28-Jan-15 8 9th Asia Pacific Conference on Clinical
Nutrition (APCCN)

133.83
81.39
132.77
82.62
136.33
85.99
Systolic BP Diastolic BP
P value = 0.013
Small Medium Large
28-Jan-15 9 9th Asia Pacific Conference on Clinical
Nutrition (APCCN)
Difference of BP due to change of family size

Difference of BP due to change of education
135
83.75
122
80.02
120
81.14
Systolic BP Diastolic BP
P value = 0.011
Low Moderate High
P value = 0.001
28-Jan-15 10 9th Asia Pacific Conference on Clinical
Nutrition (APCCN)

Difference of BP due to change of menopause
124
80
140
82.5
Systolic BP Diastolic BP
P value = 0.006
Pre-menopause Post-menopause
P value ˂ 0.001
28-Jan-15 11 9th Asia Pacific Conference on Clinical
Nutrition (APCCN)
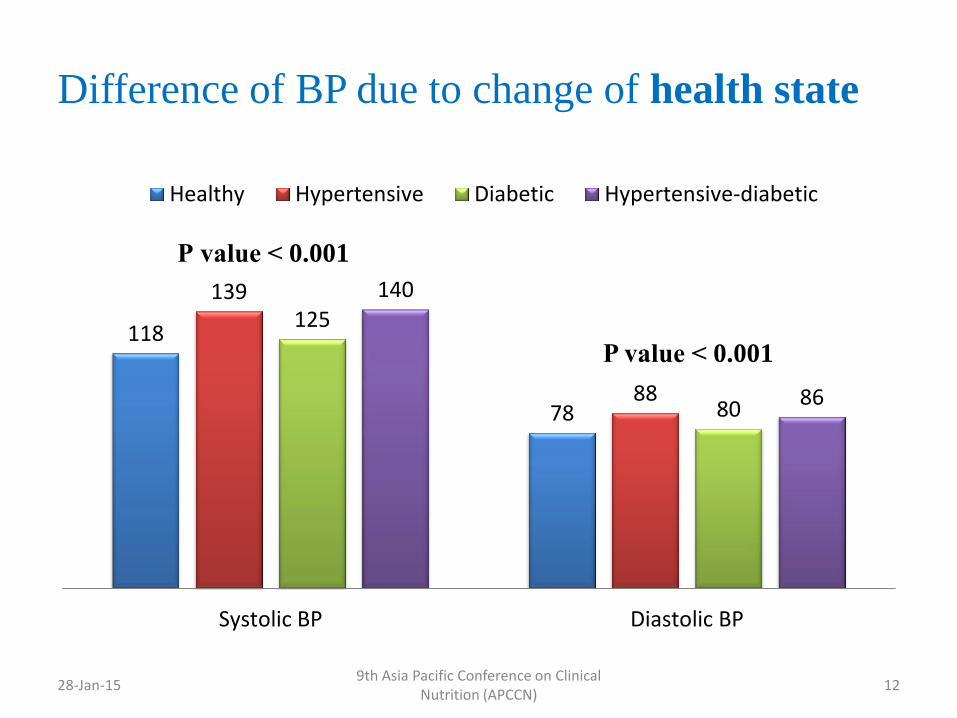
Difference of BP due to change of health state
118
78
139
88
125
80
140
86
Systolic BP Diastolic BP
P value ˂ 0.001
Healthy Hypertensive Diabetic Hypertensive-diabetic
P value ˂ 0.001
28-Jan-15 12 9th Asia Pacific Conference on Clinical
Nutrition (APCCN)

Difference of BP due to change of obesity
134
84
118
76
Systolic BP Diastolic BP
P value ˂ 0.001
Obese Normal weight
P value ˂ 0.001
28-Jan-15 13 9th Asia Pacific Conference on Clinical
Nutrition (APCCN)

Correlations of BP with subject’s characteristics
Factors
Systolic BP Diastolic BP
Spearman’s Coefficient Spearman’s Coefficient
Age (years) rs= 0.444 rs= 0.170
WC (cm) rs= 0.434 rs= 0.374
Weight (kg) rs= 0.323 rs= 0.362
All correlations were significant at the 0.01 level (2-tailed).
28-Jan-15 14 9th Asia Pacific Conference on Clinical
Nutrition (APCCN)

Prediction of risk factors associated with the HT
Merging of SBP with DBP in one variable
SBP Total
Normal
(<130 mmHg)
High
(≥130 mmHg)
DBP
Normal (<85 mmHg) 180 107 287
High (≥85 mmHg) 26 169 195
Total
206
276
482
28-Jan-15 15 9th Asia Pacific Conference on Clinical
Nutrition (APCCN)

Predication of risk factors associated with blood pressure (SBP≥130 & DBP≥85)
B S.E. Wald df Sig. Exp (B) 95%CI for Exp(B)
Lower Upper
Female -0.283 0.275 1.060 1 0.303 0.754 0.440 1.291
Age (years) 0.020 0.016 1.679 1 0.195 1.020 0.990 1.052
Married 0.163 0.318 0.262 1 0.609 1.177 0.631 2.196
Low education -0.076 0.314 0.058 1 0.810 0.927 0.501 1.716
High education -0.168 0.426 0.156 1 0.693 0.845 0.367 1.948
Medium family size -0.493 0.248 3.941 1 0.047* 0.611 0.376 0.994
Large family size -0.019 0.346 0.003 1 0.956 0.981 0.498 1.932
Obese 1.018 0.434 5.514 1 0.019* 2.768 1.183 6.475
WC (cm) 0.005 0.014 0.133 1 0.716 1.005 0.978 1.033
Weight (kg) 0.013 0.013 1.091 1 0.296 1.013 0.989 1.039
Hypertensive 1.613 0.416 15.048 1 0.001* 5.019 2.221 11.339
Diabetic 0.069 0.450 0.024 1 0.878 1.071 0.444 2.587
HT+DM 1.016 0.436 5.428 1 0.020* 2.762 1.175 6.492
Diseased father -0.369 0.237 2.417 1 0.120 0.692 0.434 1.101
Diseased mother 0.635 0.237 7.150 1 0.007* 1.886 1.185 3.003
Constant -4.929 1.142 18.639 1 0.000 0.007
Exp (B) = OR: Odds Ratio. (S.E.) = Standard Error
* Association is significant at the 0.05 level (2-tailed).
28-Jan-15 16 9th Asia Pacific Conference on Clinical
Nutrition (APCCN)

Risk factors
No. Prediction of risk factors by Odds Ratio (OR)
1 If participants have or had mother diseased by HT and/or diabetes
OR= [1.8] (95% CI: 1.185 to 3.003)
2 If the participant is obese
OR= [2.7] (95% CI: 1.183 to 6.475)
3 If the participants live in large family (OR decreased by smaller families)
OR= [0.6] (95% CI: 1.285 to 8.466)
4 If participants diseased by HT or HT+Type-2 DM
OR= [5.0] (95% CI: 2.221 to 11.339) or [2.7] (95% CI: 1.175 to 6.492)
28-Jan-15 17 9th Asia Pacific Conference on Clinical
Nutrition (APCCN)

28-Jan-15 18 9th Asia Pacific Conference on Clinical
Nutrition (APCCN)