effect of sight distance on highway...
TRANSCRIPT

Effect of Sight Distance on Highway Safety
John C. Glennon Transportation Consulting Engineer Overland Park, Kansas
For safety of highway operations, the designer must provide sight distances of sufficient length along the highway that most drivers can control their vehicles to avoid collision with other vehicles and objects that conflict with their path. Since 1940, the American Association of State Highway and Transportation Officials (AASHTO) has defined acceptable limits for stopping, passing, and intersection (corner) sight distances based on a rational analysis of safety requirements (1-5). Adequate sight distances have been defined as a function of operating speeds and are achieved by designing nonrestrictive horizontal and vertical alignment and by avoiding sight obstructions (vegetation, embankments, walls, etc.) in intersection quadrants and on the inside of horizontal curves.
When considering the safety enhancement of resurfacing, restoration, and rehabilitation (RRR) projects, designers have a different perspective than when they are designing a new highway. Changes in existing alignment are very expensive and should not be undertaken unless their cost-effectiveness compares favorably with competing demands for RRR funding. For this reason, it is important to know the expected sight distance safety benefits for any proposed changes to existing alignment. Also important are the safety benefits of alternative low-cost improvements to sight distance such as the removal of roadside obstructions.
This critical review of literature was undertaken to synthesize the available knowledge on the relationships between highway sight distance and safety in order to provide guidance on selecting cost-effective improvements that will enhance the safety of RRR projects. This review is limited to two areas of sight distance design: stopping sight distance and intersection sight distance. The safety effects of improvements to passing sight distance were not studied because, although there are safety aspects to available sight distances within passing zones, the provision of more or longer passing zones is normally considered an operational rather than a safety improvement.
64

SIGHT DISTANCE 65
STOPPING SIGHT DISTANCE
Analysis of operational and safety aspects of stopping sight distance (SSD) requires an understanding of the concept of SSD as it relates to highway operations. The geometric design policy published by AASHTO discusses the need for SSD:
If safety is to be built into highways the designer must provide sight distance of sufficient length in which drivers can control the speed of their vehicles so as to avoid striking an unexpected obstacle on the traveled way .... The minimum sight distance available on a highway should be sufficiently long to enable a vehicle traveling at or near the likely top speed to stop before reaching an object in its path. While greater length is desirable, sight dis tance at every point along the highway should be at least that required fo r a below average operator or vehicle to stop (2, 3) .
This short discussion alludes to many of the operational elements of stopping sight distance-namely, vehicle performance, driver ability, and the roadway alignment. This AASHTO operational "model" thus provides a reasonable starting point for considering the relationship between SSD and highway operations.
SSD as defined by AASH10 is the sum of two distances: (a) the distance a vehicle travels between the time a driver sights an object and the time he applies the brakes; and (b) the distance a vehicle travels in braking to a stop. SSD is determined by the following equation:
SSD = 1.47 PV + __ V_2-
30 <t ± g)
where
V = initial speed, mph; P = perception-reaction time, sec; f = coefficient of friction; and g = percent of grade divided by 100.
AASHTO defines minimum SSD requirements in terms of a passenger car approaching a stationary object in its path. This basic functional model has remained unchanged since 1940. The following review of the evolution of AASHTO stopping sight distance policy illustrates the reasoning behind this model. It also demonstrates the need to go beyond this simple "abstraction" to gain insight into the safety relationships of SSD.
In 1940, the American Association of State Highway Officials (AASHO) (1) formally recognized the need for a sight distance requirement to help drivers avoid collision circumstances other than passing encounters. Although AASHO recognized that a clear sight line to the pavement was desirable, analyses of how this requirement affected construction cost led t9 a compromise. A design object height of 4 in. was selected on the basis of optimizing the trade-off between object height and required vertical curve length. Although the object height criterion is discussed in the AASHO policy as it related to objects in the road, the selection of a 4-in. height clearly was not based on the frequency or severity of such objects. This conclusion is further borne out by subsequent changes in AASHO policy to a 6-in. object height; the same discussion was used in relating this height to roadway events.
Selection of other design parameters such as perception/reaction time, eye height, and pavement friction was rational; individual design values were selected based on the currently known distributions of these physical values, which were periodically

TABLE 1
Year
1940 (1)
1954 (2)
1965 (3)
1970 (4)
1984 (5)
Evolution of AASHTO Stopping Sight Distance Policy
Design Parameters Eye Height (ft)
4.5
4.5
3.75
3.75
3.50
Object Perception/ Assumed Tire/ Height Reaction Time Pavement Coefficient Assumed Speed for Effective Change from (in.)
4
4
6
6
6
(sec) of Friction Design Previous Policy
Variable: 3.0 sec at Dry: f ranges from 0.50 Design speed 30 mph to 2.0 at 30 to 0.40 at 70 sec at 70 mph mph
2.5 Wet: f ranges from 0.36 Lower than design No net change in at 30 to 0.29 at 70 speed (28 mph at 30 design distances mph mph design speed; 59
mph at 70 mph design speed)
2.5 Wet: f ranges from 0.36 Lower than design No net change in at 30 to 0.27 at 80 speed (28 mph at '.-\0 dffiign distances mph mph design speed; 64
mph at SO mph design speed)
2.5 Wet: f ranges from 0.35 Minimum values same Desirable values are up at 30 to 0.27 at 80 as 1965; desirable to 250 ft greater than mph values design speed minimum values
2.5 Wet: f slightly lower Minimum values same Computed values than 1970 values for as 1965; desirable always rounded up higher speeds values design speed giving slightly higher
values than 1970
updated as indicated in Table 1. Yet, the underlying methodology was by design an abstraction-a simplified set of elemental factors used to derive a distance-with only an indirect link to the functional needs for sight distance.
The Role of Stopping Sight Distance in Highway Accidents
The literature on the relationship between highway accidents and SSD is highly limited. Several accident studies (6-12) were found in which SSD was considered one of several roadway elements that might affect accident rates. All of these studies used some form of either multivariate analysis or a sufficiency rating scheme to identify the incremental effects of SSD. None of these studies is able to offer any reliable method of determining the accident effects of variable SSD.
A study by Olson et al. (13) does provide some general insight into the accident effects of SSD. A small but well-designed accident study was conducted on 10 pairs of sites--one site was a crest with limited SSD (118 to 308 ft} and the other was a nearby crest with identical conditions except that it had adequate SSD (greater than 700 ft). Of these comparison pairs, the limited SSD site had more accidents than the adequate SSD site in seven of the pairs. In one of the pairs, the adequate SSD site had more accidents, and in two of the pairs the sites had an equal number of accidents. As a group, the comparison pairs exhibited a SO percent higher accident rate for the limited SSD sites compared with the adequate SSD sites. Although this study indicates some accident reduction benefits from improved SSD, the comparison of 20 to 40 mph AASHTO designs with those 75 mph or greater may be of little use in the RRR process in helping to decide whether to upgrade restrictive sight distance on highways operating at 55 mph.

SIGHT DISTANCE 67
With the lack of accident studies documenting the incremental effects of changes in SSD, one method of estimating these effects might be to use probability simulation such as that employed by Farber (14). Farber's model, however, needs further refinements in order to produce realistic estimates.
Functional Analysis of Stopping Sight Distance Requirements
Neuman et al. (15) present the results of a recent study that critically reviewed present design practice for SSD. They developed a concept of SSD that focuses on various highway operational requirements . . From this operational concept of SSD, shortcomings and inconsistencies in the AASHTO design policy were revealed. A summary of the considerations in that study is discussed next.
Analysis of the functional requirements for SSD gives focus to the types of accidents and hazardous situations that result from limited SSD. The following points are useful in understanding the link between SSD and safety.
• SSD accidents are event oriented. The mere presence of a segment of highway with inadequate SSD does not guarantee that accidents will occur. SSD-related accidents occur only after an event or events create a critical situation. These events can take the form of arrivals of conflicting vehicles, the presence of objects on the road, poor visibility, or poor road surface conditions, or all of these events. Some of these events are a function of the highway type (e.g., crossing conflicts at intersections do not occur on freeways); some are related to other geometric or environmental elements (e.g., requirement for severe cornering maneuver on wet pavement); and others may be totally random (e.g., presence of an object in the road).
• The probabilities of critical events occurring within the influence of SSD restrictions define the relative haz.ard of these restrictions. The relative hazard of various SSD-deficient locations can be estimated by examining the probabilities of critical events. Traffic volume, frequency of conflicts (rear-end, head-on, crossing, object in road), and time exposure of each vehicle to the restricted SSD are all useful in estimating these probabilities.
• Severity as well as frequency is important. SSD situations that create severe although infrequent conflicts (e.g., head-on or angle collisions) may be just as important as situations with frequent, less severe conflicts. Cost-effectiveness analysis rightfully values injuries and fatalities prevented much higher than property-damage-only accidents.
• Many uncontrollable or unquantifiable factors also contribute to accident causation. Driver performance characteristics such as perception/reaction time, vehicle characteristics such as braking ability, and certain imponderables such as the driver's state of mind, all contribute to increased accident potential. Although these factors are exclusive of the presence of a poor SSD location, their importance is undoubtedly heightened when the deficiency in SSD means the driver has less time to react to an event. This reduced time may make the difference between collision avoidance and an accident.
Figure 1 shows the complexity of SSD requirements when viewed as a function of all the elements discussed previously. Present AASHTO policy, which defines SSD requirements based on only one event and one set of conditions, produces sufficient SSD for certain events or conditions but not for others.

DRY PAVEMENT TANGENT 2·FOOT OBJECT
CAR
68 TRB STATE OF 1HE ART REPORT 6
Application of these functional relationships for SSD revealed a number of situations for which greater SSD than the minimum AASHID values might be advisable. These included not only approaches to intersections and sharp highway curves but also highway curves. Truck operations on highway curves with sight restrictions created by vertical obstructions (such as trees and walls) were found to be the situation where the AASHTO model least fit the SSD needs for the following two reasons:
1. When a vehicle brakes on a curve, the frictional demand is greater than for the same braking level and speed on a tangent because the total deceleration is the resultant of the braking deceleration and the lateral cornering acceleration. Because of this compounding of frictional demand, AASHTO-lcvel braking on curves could often lead to loss of control. Therefore, the need for hard braking should be reduced by the provision of longer sight distances.
2. Vertical obstructions on the inside of highway curves create special problems for large trucks. In these situations, the greater eye height of the truck driver is of no value in compensating for the longer truck stopping distances. Therefore, trucks need greater SSD for stopping on curves because of both longer stopping distances and the need to keep resultant friction within a tolerable range.
DRY PAVEMENT TANGENT 6-INCH OBJECT
AASHTO POLICY • • • Cohdlllon• neumed lo apply lor determination ol minimum •topping eight distance.
WET PAVEMENT TANGENT 2-FOOT OBJECT
CAR TRUCK
DRY PAVEMENT TANGENT D·FOOT OBJECT
PASSENGER CAR TANGENT ALIGNMENT WET PAVEMENT 6-INCH STATIONARY OBJECT
DRY PAVEMENT DESIGN CURVATURE 6-INCH OBJECT
WET PAVEMENT TANGENT D·FOOT OBJECT
DRY PAVEMENT TANGENT
WET PAVEMENT TANGENT
HEAD·ON ENCOUNTER HEAD-ON ENCOUNTER
· .. ,.-: . ·''.i;§;~'! Sh1ded 1ree repr .. 11'111 condlllon1 for which 1topplng 1lght '/,~· f~ti,"iJ,,fj dlet1nce exCMd• that provided by AASHTO, aHumlng
AASHTO dHlgn v1lue1 for percepllon/reacllon time and coaHlclll'll of friction for braking.
FIGURE 1 Analysis of functional requirements for stopping sight distance (15).

SIGHT DISTANCE 69
Safety Trade-Off in Lengthening Vertical Curves
Another aspect of SSD that was discovered in the Neuman et al. (15) study relates to the fact that longer vertical curves are not always necessarily better. This may be particularly true when an extremely deficient crest is upgraded to provide a design speed that is still below the highway operating speed. This phenomenon is best described by an example using SSD profiles.
Figure 2 shows three different sight distance profiles for different vertical curves joining a severe alignment of two 7 percent grades. Considering Profile 1 as an existing crest with a design speed of 25 mph and a minimum 1984 AASHTO policy (5) SSD of 150 ft, the question is, "What are the safety benefits gained by lengthening the vertical curve on an existing highway with a 55-mph operating speed?" If the vertical curve is lengthened to provide a 40-mph minimum SSD of 275 ft (Profile 2), about 400 ft of the highway will be improved. However, because a driver approaching the shorter crest from a distance can see farther up the crest and also more quickly reaches the point where the sight distance opens up, the "improved" geometry has 600 ft of highway where the SSD is worse than before. In comparing each of these vertical curve profiles with Profile 3 for a crest providing a design speed of 55 mph, the shorter crest has a length of about 600 ft with deficient SSD and the longer crest has a length of about 1,000 ft with deficient SSD.
7
\ i I \ I
6 \ i I \ i I \ \ I
I \ i 5 \ i I c
.~ _l ___ L _ __,/ u .,~
\ i \ £5~ c ~ \ I
PROFILE 3 ·- 0
\ AASHTO " ·- i u - Design Speed c P. \ 0 .,, = 55 mph .'? O> i 0 · ~ \ L = 2140'
- 0 \ i s = 450' ~" 0) -·- u \ .,, c .,,- \ c ~
\ 'Ci 0 PROFILE 2 Q_ \ 0 AASHTO Design ,;; \ Speed = 40 mph
\ L = 800' . I s = 275' \ ........
\ PROFILE 1
. AASHTO Design Speed = 25 mph L = 240' s = 150'
0 - 10 -s 0 +5 +lO
Stat ioning Rela tive to P. I . of Verti cal Curve
FIGURE 2 Comparison of sight distance profiles for various design speeds for a crest joining 7 percent grades (A= 14%).
70 TRB STATE OF THE ART REPORT 6
This example indicates the possible futility in lengthening some existing vertical curves. Not only would the construction expense be high for cutting about 9 ft into the hill to change Profile 1 to Profile 2, but the safety benefits may be small or even negative. Changing from Profile 1 to Profile 3 might be expected to produce positive safety benefits; however, this improvement would require a 33-ft greater cut.
Cost-Effectiveness of Stopping Sight Distance Improvements
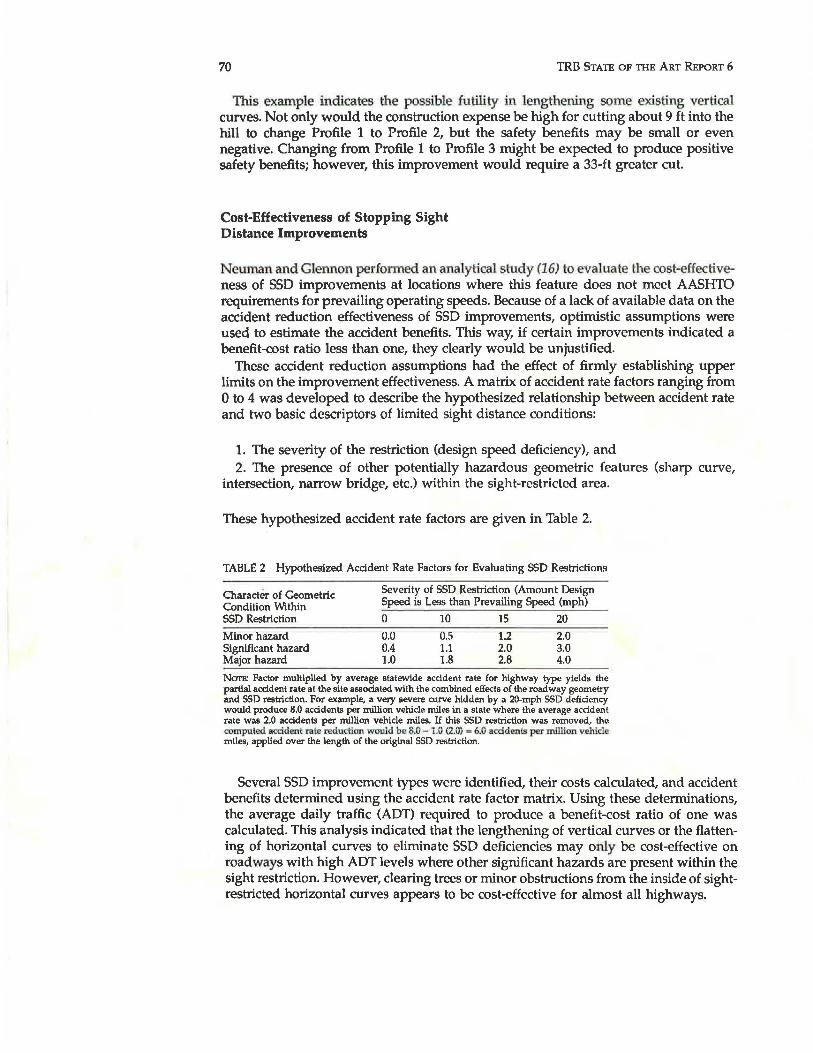
Neuman and Glennon performed an analytical study (16) to evaluate the cost-effectiveness of SSD improvements at locations where this feature does not meet AASH1D requirements for prevailing operating speeds. Because of a lack of available data on the accident reduction effectiveness of SSD improvements, optimistic assumptions were used to estimate the accident benefits. This way, if certain improvements indicated a benefit-cost ratio less than one, they clearly would be unjustified.
These accident reduction assumptions had the effect of firmly establishing upper limits on the improvement effectiveness. A matrix of accident rate factors ranging from 0 to 4 was developed to describe the hypothesized relationship between accident rate and two basic descriptors of limited sight distance conditions:
1. The severity of the restriction (design speed deficiency), and 2. The presence of other potentially hazardous geometric features (sharp curve,
intersection, narrow bridge, etc.) within the sight-restricted area.
These hypothesized accident rate factors are given in Table 2.
TABLE 2 Hypothesized Accident Rate Factors for Evaluating SSD Restrictions
Character of Geometric Condition Within SSD Restriction
Minor hazard Significant hazard Major hazard
Severity of SSD Restriction (Amount Design Speed is Less than Prevailing Speed (mph)
0 10 15 20
0.0 0.5 1.2 2.0 0.4 1.1 2.0 3.0 1.0 1.8 2.8 4.0
Nam: Factor multiplied by average statewide accident rate for highway type yields the partial accident rate at the site associated with the combined effects of the roadway geometry and SSD restriction. For example, a very severe curve hidden by a 20-mph SSD deficiency would produce 8.0 accidents per million vehicle miles in a state where the average accident rate was 2.0 accidents per million vehicle miles. If this SSD restriction was removed, the computed accident rale redu<:tlon would be 8.0 - 1.0 (2.0) • 6.0 accidents per million vehicle miles, applied over the length of the original SSD restriction.
Several SSD improvement types were identified, their costs calculated, and accident benefits determined using the accident rate factor matrix. Using these determinations, the average daily traffic (ADT) required to produce a benefit-cost ratio of one was calculated. This analysis indicated that the lengthening of vertical curves or the flattening of horizontal curves to eliminate SSD deficiencies may only be cost-effective on roadways with high ADT levels where other significant hazards are present within the sight restriction. However, clearing trees or minor obstructions from the inside of sightrestricted horizontal curves appears to be cost-effective for almost all highways.

SJGfIT DISTANCE
Clearing Obstructions on the Inside of Highway Curves
71
The conclusion of the cost-effectiveness of clearing vegetation from the inside of horizontal curves recognizes that the required offsets to obstacles vary on the approaches and along the curve such that the maximum offset, m specified by AASHfO (2, 3, 5) and shown in Figure 3 is only required toward the center of longer curves and may not be required at all on shorter curves.
5730 so m• -
0- vers
200
28 65S Also m a R(vers -R - )
And S • _R_ Cos-I R-m 28-6!1 R
w z <t
I I
I ..J w25 1----1---+---+-----k-~1------t------i o MAX. 0 When iii •• 0 10
~ .._ 020 1-----+---+----+w z ::i er w ~ I 5 t-----+---+w u I
w > '5 I 0 ,___ _ __,__ u .._ 0 I.LI I.LI ffi _5 w 0
" 0
/
; ;
;
5 10 15 20 25 30 35 m= MIDDLE ORDINATE:
200
f-w w .._ I
250 ~
300
<t ..J
w 0 iii ;;; .._ 0
CENTERLINE INSIDE LANE TO SIGHT OBSTRUCTION-FEET
FIGURE 3 Relation between stopping sight distance and middle ordinate on horizontal curoes (3).
Both the studies by Olson et al. (13) and Neuman and Glennon (16) show that the AASHTO specification for m is only required for highway curves where the length of the curve, L, is longer than the required SSD. As shown by the example sight line analysis in Figure 4, the offset, m, is needed from a point that is a distance of SSD/2 from the PC of the curve to a point that is a distance of SSD /2 from the PT of the curve. From these points outward, the required offsets decrease to zero at a distance of SSD. For this case, where Lis greater than the required SSD, a graphical analysis indicates that the offset relationship is insensitive to both the degree of curve and the length of required sight distance such that Figure 5 is a reasonable approximation of the required offsets.

72 TRB STATE OF 1HE ART REPORT 6
SSD ; 600'
FIGURE 4 Example sight obstruction envelope on horizontal curves for condition where the stopping sight distance is less than the length of the curve.
20
0
PC · t s PC PC+ l PC+ l PC - 4 4 2
PT + l 2
PT+ l 4
PT PT - l, 4
PT - l, 2
Distance Along Highwa y (S ; Stopping Sight Distance in feet)
FIGURE 5 Relationship offsets at various points to maximum offset for sight obstruction envelope on a horizontal curve where the stopping sight distance is less than the length of the curve.
For short highway curves where Lis shorter than the required SSD, Olson et al. have derived a reasonable approximation to the maximum offset as given by the following equation:
m2 8
L(2S - L) =----
BR

SIGHT DISTANCE
where
ms
L s R
=
= = =
maximum offset, in feet, between center of lane and obstruction at the midpoint of the curves, where Sis greater than L; length of curve, ft; stopping sight distance, ft; and radius of curvature, ft.
73
This maximum offset is always less than the maximum offset, m, required when Lis greater than the required SSD.
The relationship for other offsets on the short curve is not so clearcut. Graphical exercises indicate that the locus of offsets for the short curve is a function of degree of curve, length of curve, and the required SSD. Although a mathematical relationship could not be found, the required locus of offsets can always be solved graphically for any combination of parameters. Suffice to say the offset at the PC and PT will vary between 60 and 100 percent of m5, as L goes from SSD to zero. Also, the required offset at a distance of SSD/2 outside of the PC or PT will always be a small fraction of mSf such that obstacles outside the traveled way should not restrict the required SSD.
In analyzing the SSD profiles on horizontal curves, they are found to exhibit characteristics different from vertical curves. Because the sight obstruction is off the highway for horizontal curves instead of being the highway alignment itself as for vertical curves, clearing of the sight envelope will never reduce the amount of sight distance at any point. Figure 6 shows both the SSD profile for an existing obstacle offset envelope and the SSD profile for a slight clearing beyond that envelope. This example demonstrates the improvement in the SSD profile.
Effectiveness of Signing for Limited Sight Distance
In 1981 Christian et al. (17) conducted a study to evaluate the effectiveness of the standard Limited Sight Distance warning sign applied at sight-restricted highway crests. Spot speed studies were undertaken at 14 locations both with and without the warning sign and its accompanying advisory speed plate. The results of the speed data recorded at the crests of the vertical curves indicated that the warning signs with advisory speed plates had no effect in slowing vehicles. Driver surveys also indicated that these signs were not well understood.
INTERSECTION SIGHT DISTANCE
A driver approaching an intersection should have an unobstructed view of the intersection and a length of the intersecting highway sufficient to avoid colliding with approaching vehicles. AASHTO (2, 3, 5) provides recommended values for both uncontrolled and stop-controlled intersections. In both cases, available sight distance is measured from the driver's eye height to the roofline of the conflicting vehicle.
For uncontrolled intersections, the minimum safe sight distance along each highway is related to vehicle speeds and to the resultant distances traveled during driver perception and reaction and during braking. As defined by AASHTO (2, 3, 5), the recommended legs of the sight triangle are equivalent to the length of the SSD

74
-~ u c 0 "t;
Ci .1: -~ V>
_!! .IJ ..2 ·;; >
<{
from center of inside lane
700
600
500
400 ~
300
200
100
......__ Envelope 2 _____ ,,,,,,,,.
Offset Envelope 2 add itional offset ranging from zero at P.C. and P. T. to maximum of 13 .3 ft near center of curve
I I I I
I /
Enve lope I
o.____.~---'-~--'-~-'-~-'-~-'-~'----' -400 -300 -200 - 100 PC +100 +200 +300 -t.400
Distance Relative to P.C . of Curve (ft)
FIGURE 6 Analysis showing an example improvement to stopping sight distance on a horizontal curoe.
TRB STATE OF THE ART REPORT 6
requirements corresponding to the design speed of each leg. For intersections with stop-control on the minor highway, the required sight distance is a function of the time and distance necessary for the stopped driver to scan the approaches, accelerate, and clear the intersection.
Only a few studies (18-22) have addressed the role of intersection sight distance in producing accidents. Only two of these studies (18, 22) provide any specific relationships between accidents and intersection sight distance.
Wu studied the relationship between accident rate and what he called "clear vision right-of-way" at 192 signalized intersections (22). Although no specific numbers are given and no statistical tests are cited, the study concludes that intersections where vision is poor have significantly higher injury, property damage, and total accident rates. The conclusions, however, may be misleading because right-of-way widths varied from 66 to 204 ft in both the poor and clear vision categories. Conceivably, then, an intersection with good sight distance could be in the poor category and vice versa.
David and Norma.1 (18) studied the relationships lx::lween accident rnie a1·1d various intersection geometric and traffic features. The sample included 558 intersections on which 4,372 accidents occurred over 3 years. Intersections had three and four legs, two or four through lanes, and stop or signal control. The study revealed significant

SIGHT DI!ttANCE 75
accident rate differences between "obstructed" and "clear" intersections for various levels of restriction. HoweV,er, these results are reported without regard for number of legs, number of lanes, type of control, presence of turning lanes, and speed limit. Because all of these variables can have major effects on accident rate, the conclusions about sight distance may be misleading.
Although the safety-effectiveness of improved intersection sight distance is unclear, low-cost treatments to remove vegetation or flatten low-height embankments in sight triangles should be encouraged on RRR projects to improve the existing sight distance and to compensate for the loss of sight distance at stop-controlled intersections when the highway is widened as part of RRR improvements.
APPLICATIONS OF RESULTS TO RRR PRACTICE
The critical review and synthesis of literature produced the following major conclusions about sight distance improvements on RRR projects:
1. Horizontal and vertical alignment changes, undertaken to improve stopping sight distances, appear to be safety-effective when very short sight distances are improved to provide very long sight distances. One study indicates a 33 percent lower accident rate for crests with 100 to 300 ft of (AASHTO) stopping sight distance compared with crests with 700 ft or more of stopping sight distance. For more nominal improvements to stopping sight distance (e.g., AASHTO minimum requirements at 55 mph is 450 ft), the accident rate reduction is expected to be less than 33 percent.
2. In spite of these potential safety benefits of stopping sight distance improvements, the results of another study that produced estimates of the upper limits on the safety benefits of sight distance improvements indicate that alignment changes may only be cost-effective on highways with very high traffic volumes where major hazards (such as intersections or sharp curves) are hidden by the sight obstruction.
3. Analysis of signt distance profiles for crest vertical curves indicates a possible caution against minor lengthening of extremely substandard crests. When lengthening a crest vertical curve, there is always a trade-off whereby one portion of the highway will have less sight distance than before (see example in Figure 2). This phenomenon may only be of interest when comparing the available sight distance of an extremely substandard crest with the AASHTO requirement for that highway's operating speed. If the crest is lengthened to provide a minimum sight distance that is still considerably less than the AASHTO requirement, even though a short length of the highway will have better sight distance, the total length of highway with substandard sight distance will increase substantially.
4. Although no documentation could be found on the safety-effectiveness of lowcost treatments at restricted sight-distance crests, applications such as site-specific warning signs, advisory speed indications, or speed zones should be encouraged where hazards such as sharp curves or intersections are hidden by the crest vertical curves. In contrast to this statement, studies of the standard Limited Sight Distance sign indicate that it is vague and ineffective in reducing highway speeds.
5. Providing AASHTO minimum or greater stopping sight distance on horizontal curves may be critical to safety, particularly on highways with moderate to heavy truck traffic, for the following reasons:
a. AASHTO-level braking on horizontal curves can lead to loss of control because the friction demand is the resultant of both cornering and braking forces. Greater stopping sight distances should reduce the probability of severe braking.

76 TRB STATE OF THE ART REPORT 6
b. The AASHTO stopping sight distance requirements use the passenger car as the design vehicle and do not allow for the much longer stopping distances of large trucks when the sight restriction is a wall or a row of trees on the inside of a horizontal curve. This situation is unlike applying the AASHTO requirements to a vertical curve where the truck driver's higher eye height mostly compensates for the longer braking distances of trucks.
6. Because of the potentially greater criticality of sight distance restrictions on horizontal curves compared with vertical curves, low-cost treatments such as clearing vegetation or other minor obstructions on the inside of horizontal curves may be costeffective on almost all highways. The offsets to obstructions specified by AASHTO to provide certain sight distances are maximum offsets that are only required toward the center of longer curves and may not be required at all on shorter curves. Also, the offset envelope for providing a certain sight distance has offsets that decrease from the maximum at or near the center of the curve to zero somewhere on the tangent approach. In other words, minor vegetation clearing can sometimes produce substantially longer sight distance, particularly on shorter curves.
7. When the prime improvement on a RRR project is highway resurfacing, particular consideration should be given to improving the skid resistance on the approaches of sight-restricted areas.
REFERENCES
1. A Policy on Sight Distance for Highways. American Association of State Highway Officials, Washington, D.C., 1940.
2. A Policy on Geometric Design of Rural Highw11ys. American Association of State Highway Officials, Washington, D.C., 1954.
3. A Policy on Geometric Design of Rur11l Highw11ys. American Association of State Highway Officials, Washington, D.C., 1965.
4. A Policy on Design Standards for Stopping Sight Distance. American Association of State Highway Officials, Washington, D.C., 1971.
5. A Policy on Geometric Design of Highways and Streets. American Association of State Highway and Transportation Officials, Washington, D.C., 1984.
6. J. A. Cirillo, S. K. Dietz, and R. L. Beatty. An11lysis 11nd Modeling of Rel11tionships Between Accidents and the Geometric and Traffic Char11cteristics of the Jnterstllte System. Bureau of Public Roads, 1969.
7. T. J. Foody and M. D. Long. The Identification of Relationships Between S11fety and Roodside Obstructions. Ohio Department of Transportation, Columbus, Jan. 1974.
8. R. C. Gupta and R. P. Jain. Effect of Certain Roadway Characteristics on Accident Rates for Two-Lane, Two-Way Roads in Connecticut. In Tr11nsportlltion Rese11rch Record 541, TRB, National Research Council, Washington, D.C., 1975, pp. 5(}-54.
9. B. Hills. llillcrests: Problems of Vertic11l Line of Sight 11nd Visibility. Organisation of Economic Cooperation and Development, Washington, D.C., 1.976.
10. M. S. Raff. Interstate Highway Accident Study. Bulletin 74, HRB, National Research Council, Washington, D.C., 1953.
11. D. W. Schoppert. Predicting Accidents from Roadway Elements of Rural Two-Lane Highways with Gravel Shoulders. Bulletin 158, HRB, National Research Council, Washington, D.C., 1957.
12. J. S. Sparks. The Influence of Highway Characteristics on Accident Rates. Public Works, March 1968. 13. P. L. Olson, D. E. Oeveland, P. S. Fancher, L. P. Kostynluk, and L. W. Schneider. NCHRP Report 270:
P11rameters Affecting Stopping Sight Distance. TRB, National Research Council, Washington, D.C., June 1984.
14. E. Farber. Modeling Conflicts Caused by Sight Distance Restrictions on Vertical Curves. Presented at the 66th Annual Meeting of the Transportation Research Board, Washington, D.C., 1987.
15. T. R. Neuman, J.C. Glennon, and J.E. Leisch. Functional Analysis of Stopping Sight Distance Requirements. In Tr11nsportation Rese11rch Record 923, TRB, National Research Council, Washington, D.C., 1984, pp. 57-M.

SIGHT DISTANCE 77
16. T. R. Neuman and J. C. Glennon. Cost-Effectiveness of Improvements to Stopping Sight Distance Safety Problems. In Transportation Research Record 923, TRB, National Research Council, Washington, D.C., 1984, pp. 26-34.
17. M. R. Christian, J. J. Harnack, and A. E. Karoly. E'IJQluation of Limited Sight Distance Warning Signs. New York State Department of 'Ii'ansportation, Albany, Feb. 1981.
18. N. A. David and J. R. Norman. Motor Vehicle Accidents in Relation to Geometric and Traffic Features of Highway Intersections. Report FHWA-RD-76-128. FHWA, U.S. Department of Transportation, July 1975.
19. R. Mitchell. Identifying and Improving High Accident Locations. Public Works, Dec. 1972. 20. W. L. Moore and J. B. Humphries. Sight Distance Obstructions on Private Property at Urban Intersec
tions. In Transportation Research Rec.ord 541, TRB, National Research Council, Washington, D.C., 1975, pp. 31-39.
21. H. E. Strate. Making Highways Safe: A Realistic Approach. ITE Journal, March 1980. 22. Y. S. Wu. Effect of Clear Vision Right-of-Way on Traffic Accidents at Urban and Rural Signalized Intersections.
Michigan Department of State Highways, Lansing, July 1973.