effect of serrated grain boundaries on the creep of 21-4n ... · creep tests show no effect on...
TRANSCRIPT
Effect of Serrated Grain Boundaries on the Creep of 21-4N Manganese Austenitic Stainless Steel
by
Aleksander A. Wisniewski B. Eng.
A thesis submitted to the Faculty o f Graduate Studies and Research
in partial fulfillment o f the requirements for the degree o f
Master of Applied Science
Ottawa Carleton Institute for Mechanical and Aerospace Engineering
Department o f Mechanical and Aerospace Engineering
Carleton University
Ottawa, Ontario
Canada
© Copyright
A. Wisniewski September 2007
R eproduced with perm ission of the copyright owner. Further reproduction prohibited without perm ission.

Library and Archives Canada
Bibliotheque et Archives Canada
Published Heritage Branch
395 W ellington S treet Ottawa ON K1A 0N4 Canada
Your file Votre reference ISBN: 978-0-494-33674-8 Our file Notre reference ISBN: 978-0-494-33674-8
Direction du Patrimoine de I'edition
395, rue W ellington Ottawa ON K1A 0N4 Canada
NOTICE:The author has granted a nonexclusive license allowing Library and Archives Canada to reproduce, publish, archive, preserve, conserve, communicate to the public by telecommunication or on the Internet, loan, distribute and sell theses worldwide, for commercial or noncommercial purposes, in microform, paper, electronic and/or any other formats.
AVIS:L'auteur a accorde une licence non exclusive permettant a la Bibliotheque et Archives Canada de reproduire, publier, archiver, sauvegarder, conserver, transmettre au public par telecommunication ou par I'lnternet, preter, distribuer et vendre des theses partout dans le monde, a des fins commerciales ou autres, sur support microforme, papier, electronique et/ou autres formats.
The author retains copyright ownership and moral rights in this thesis. Neither the thesis nor substantial extracts from it may be printed or otherwise reproduced without the author's permission.
L'auteur conserve la propriete du droit d'auteur et des droits moraux qui protege cette these.Ni la these ni des extraits substantiels de celle-ci ne doivent etre imprimes ou autrement reproduits sans son autorisation.
In compliance with the Canadian Privacy Act some supporting forms may have been removed from this thesis.
While these forms may be included in the document page count, their removal does not represent any loss of content from the thesis.
Conformement a la loi canadienne sur la protection de la vie privee, quelques formulaires secondaires ont ete enleves de cette these.
Bien que ces formulaires aient inclus dans la pagination, il n'y aura aucun contenu manquant.
i * i
CanadaR eproduced with perm ission of the copyright owner. Further reproduction prohibited without perm ission.

Abstract
Creep testing is carried out to determine the effect o f serrated grain boundary
morphology on the creep o f a high temperature engineering alloy. 21-4N, a manganese
austenitic stainless steel is the test material. Heat treatments are applied to produce
microstructures with planar and serrated grain boundaries. The serrated grain boundary
microstructure contains grain boundary reaction (GBR) nodules, and two heat treatments
producing -10% an d -16% GBR area fraction are used. Constant and increasing load
creep tests show no effect on creep rate from the serrated grain boundaries. The serrated
grain boundary micro structures show no improvements to creep rupture life as seen in
other high temperature alloys capable o f forming serrated grain boundaries.
Thermodynamic instability o f the serrated grain boundary microstructures as well as
possible increased intergranular cracking from coarse grain boundary carbides and GBR
nodules are identified as causes o f the inferior creep properties o f the serrated grain
boundary microstructures.
iii
R eproduced with perm ission of the copyright owner. Further reproduction prohibited without perm ission.

Acknowledgements
First and foremost I would like to thank my parents, Elzbieta and Gustaw. Their love,
patience and support throughout my life has been and continues to be tremendous. My
fervent wish is to some day be able to repay them for the sacrifices they have made to
allow me to come this far.
I would also like to thank my thesis supervisor Dr. Jonathan Beddoes for his patience and
support. His guidance has been invaluable in the course o f this project. As well, his
curiosity and enthusiasm are contagious, keeping the project enjoyable and encouraging a
need to know more.
Thanks also go to Dr. Richard Kearsey from NR.C. His help has been appreciated since
the very beginning o f this project.
Special thanks go to Fred Barrett, who it seems can fix anything, no matter how
complicated it may be. As well, the work o f Alex Proctor and Kevin Sangster is much
appreciated. They can make anything you ask for, from just about any material you give
to them.
iv
R eproduced with perm ission of the copyright owner. Further reproduction prohibited without perm ission.

Table of Contents
List of Tables. .......................................................................................................................viii
List of Figures..............................................................................................................................ix
List of Appendices....................................................................................................................xvi
Nomenclature..................................................................... xvii
1 Introduction..................................................................................................................... 1
1.1 Importance o f Creep...................................................................................................1
1.2 Role o f Grain Boundaries in Creep.......................................................................... 3
1.3 Thesis Objectives and Outline..................................................................................3
2 Creep Theory...................................................................................................................5
2.1 Dislocation Creep......................................................................................................10
2.2 Diffusional Creep and Grain Boundary Sliding....................................................13
3 Grain Boundary Morphology................................................................................... 19
3.1 Grain Boundaries .........................................................................................19
3.1.1 Role o f Grain Boundaries in Creep................................................................21
3.2 Serrated Grain Boundary Formation......................................................................24
3.2.1 Nickel Base Superalloys................................................................................. 25
3.2.2 Austenitic Stainless Steels.............................................................................. 35
3.2.3 Cobalt Base Superalloys .........................................................................37
3.2.4 121-4N..................................................................................................................38
3.3 Effects o f Serrated Grain Boundaries on Creep................................................... 39
4 Thesis Objectives and Scope..................................................................................... 46
5 Materials and Experimental Methods....................................................................48
5.1 21-4N: Manganese Stabilized Austenitic Stainless Steel...................................48
5.1.1 Chemistry and Microstructure ..............................................................48
5.1.2 Effects of the Grain Boundary Reaction........................................................54
5.1.3 Typical Properties and Applications.............................................................. 59
v
R eproduced with perm ission of the copyright owner. Further reproduction prohibited without perm ission.

5.2 Test Material.............................................. 60
5.3 Sample Heat Treatment............................................................................................ 62
5.4 Metallographic Preparation......................................................................................64
5.5 Creep Testing Procedure.......................................................................................... 65
5.5.1 Increasing Load Testing.................................................................................... 69
5.6 Data Acquisition....................................................................................................... 70
5.7 Metallographic Analysis ........................................................................................ 71
5.8 Creep Data Analysis.................................................................................................72
6 Results.............................................................................................................................77
6 .1 Heat Treated Microstructures................................................................................. 77
6.1.1 ‘NGB’ Microstructure........................................................................................77
6.1.2 ‘SGB’ & ‘SGB M ’ Microstructures.................................................................79
6.1.3 Microstructure Comparison..............................................................................84
6.2 Creep Testing Results...............................................................................................87
6.2.1 Constant Load Tests...........................................................................................87
6.2.1.1 700°C and 196MPa..............................................................................87
6.2.1.2 900°C and 27.4MPa.............................................................................88
6.2.1.3 925°C and 27.4MPa.............................................................................89
6.2.2 Increasing Load Tests........................................................................................90
6.2.2.1 700°C and 183-295MPa...................................................................... 90
6.2.2.2 900°C and 27.4-65MPa............................................................. 91
6.3 Creep Tested Microstructures................................................................................94
6.3.1 Constant load testing at 700°C and 196MPa..................................... 94
6.3.2 Constant load testing at 900°C and 27.4MPa.................................... 97
6.3.3 Constant load testing at 925°C and 27.4MPa.................................. 101
6 .4 Aged Microstractures..............................................................................................103
6.5 Creep Fracture..........................................................................................................105
7 Discussion................................................. 114
7.1 Heat Treated Microstructures................................................................................114
7.2 Creep Testing Results and Resulting Microstructures........................................116
vi
R eproduced with perm ission of the copyright owner. Further reproduction prohibited without perm ission.

7.3 Effect o f Serrated Grain Boundaries on Creep Rate......................................... 123
8 Summary, Conclusions and Recommendations for Future W ork.................127
8.1 Summary and Conclusions.................................................................................. 127
8.2 Recommendations for Future W ork.................................................................... 128
References................................................................................................................................. 134
Appendix A: Typical 21-4N Material Properties............................................................ 143
Appendix B: Metallographic Preparation........................................................................ 144
Appendix C: Creep Testing Procedure..............................................................................148
Appendix D: Data Acquisition System............................................................................... 166
Appendix E: 6 Projection Analysis Results...................................................................... 181
Vll
R eproduced with perm ission of the copyright owner. Further reproduction prohibited without perm ission.

List of Tables
Table 1: Creep processes considered to be dominant in pure metals based ontemperature and stress and associated n and Qc values [3,p.47]........................10
Table 2: Compositional limits o f 21-4N [41,p.254]............................................................48
Table 3: Composition o f 21-4N test material as provided by manufacturer andfrom independent tests............................................................................................61
Table 4: Heat treatments used on 21-4N test material.................. 62
Table 5: Results o f -Projection analysis for 700°C and 196MPa................................... 88
Table 6 : Results o f 0-Projection analysis for 900°C and 27.4MPa..................................89
Table 7: Results o f 0-Projection analysis for 925°C and 27.4MPa..................................90
Table 8 : Comparison of creep rupture lives........................................................................117
Table 9: Chemical compositions o f 21-4N used by Tanaka et al. [22] and testmaterial used in the current study....................................................................... 118
Table 10: Chemical compositions o f 304 and 316 used by Hong et al. (wt.%)[72-73].............................................................. 129
Table 11: Heat treatments required to produce serrated and planar grainboundaries in 304 and 316 [72-73]..................................................................... 129
viii
R eproduced with perm ission of the copyright owner. Further reproduction prohibited without perm ission.

List of Figures
Figure 1: Simple lever loading machine for tensile creep testing....................................... 5
Figure 2: Typical creep curve for a constant load test showing the three stages o f creep, namely: primary, secondary and tertiary creep [21,p.263]....................................................................................................................6
Figure 3: Effect o f increasing stress and temperature on a typical creepcurve [21,p.265].........................................................................................................7
Figure 4: Typical Arrhenius plot o f experimental rate data [21,p. 156]...............................8
Figure 5: Testing at the same stress and various temperatures can be usedto produce a plot giving the activation energy Qc for creep [3,p.20]..................9
Figure 6 : Testing at the same temperature and various stresses can producea plot giving the stress exponent n [3,p.22]........................................................... 9
Figure 7: Pile up of gliding dislocations followed by climb [3,p.43]................................ 11
Figure 8 : Shearing o f 7 ’ particles in a dilute 7/7 ’ alloy strained two per centin tension [ 1 ,p. 197]..................................................................................................12
Figure 9: Dislocation passing particles through Orowan looping [5,p .179].................... 12
Figure 10: Dislocation local and general climb over particles [37,p.l56]..........................13
Figure 11: Stress directed diffusion o f atoms in Nabarro-Herring creep [5,p.208].......... 14
Figure 12: Schematic o f denuded zone formation in a material with precipitates[5,p.221].................................................................................................................... 16
Figure 13: Denuded zone formation in Mg 0.5% Zr alloy [l,p .57].....................................16
Figure 14: A) Equiaxed grains, B) Result o f diffusional creep without GBS,C) GBS occurring simultaneously with diffusional creep resultingin an offset marker line [5,p.211]...........................................................................17
Figure 15: Grain boundaries separate grains o f different crystallographicorientation [41 ,p.34]................................................................................................ 19
Figure 16: Small angle tilt boundary made up of edge dislocations o f Burgersvector b, separated by a distance d [38,p.65]......................................................20
ix
R eproduced with perm ission of the copyright owner. Further reproduction prohibited without perm ission.

Figure 17: Grains from beta brass showing polyhedral nature and planar facetso f grain boundaries [2,p. 191].................................................................................21
Figure 18: A) Wedge type cracks at grain boundary triple points, B) Cavitiesalong grain boundaries [2,p .871].......................................................................... 22
Figure 19: A) Wedge crack formed due to GBS, B) Wedge crack formed due toaccumulating cavities [37,p.215].......................................................................... 23
Figure 20: A) Cavity forming at ledge due to GBS, B) Cavity forming from vacancy condensation, C) Cavity forming through a dislocation mechanism, D) Cavity forming at a particle [37,p.220].......................... 24
Figure 21: Planar (A) and serrated (B) grain boundaries in nickel basesuperalloy PWA 1113 [43].................................................................................... 25
Figure 22: Schematic diagram o f Tu-Tumbull mechanism [51]..........................................26
Figure 23: A) Tu-Tumbull mechanism of grain boundary serration through cellular precipitation [52], B) and C) Serrated grain boundary morphology of IN 718 [50; 53]..............................................................................28
Figure 24: Serrated grain boundary micrographs, A) IN 738 [63],B) MERL76 [62]......................................................................................................29
Figure 25: Model showing serrated grain boundary formation by coolingthrough y’ solvus range from solution treatment [54]........................................30
Figure 26: Schematic o f grain boundary serration model based on ymigration in Nickel base superalloys [54]........................................................... 32
Figure 27: Formation of serrated grain boundary through asymmetric y’precipitate growth [6 6 ] ............................................................................................33
Figure 28: Asymmetric y’ precipitate growth causing grain boundaryserrations, revealed through deep etching [6 6 ] ....................................................34
Figure 29: Fan type serration in model alloy o f Henry et al. [57]....................................... 35
Figure 30: Formation o f serrated grain boundaries followed by carbideprecipitation in 304 stainless steel [71].................................................................36
Figure 31: GBR nodules inHS-21 [31]................................................................................... 38
Figure 32: Creep tests o f 21-4N with serrated grain boundaries (solid line)and planar grain boundaries (broken line) [23]............................... 40
x
R eproduced with perm ission of the copyright owner. Further reproduction prohibited without perm ission.

Figure 33: Creep tests o f cobalt base superalloys L-605 and HS-21 with serrated grain boundaries (solid line) and planar grain boundaries (broken line) [30-31].......................................................................... 40
Figure 34: Creep tests o f nickel base superalloy IN718 with serrated grainboundaries (solid line) and planar grain boundaries (broken line) [28]........... 41
Figure 35: Comparison o f creep rates between serrated grain boundary samples (solid line, circle) and planar grain boundary samples (broken line, triangle) in 21-4N [23]............................................................................................42
Figure 36: Comparison of creep rates for cobalt base superalloys: A) L-605,serrated grain boundaries (solid line, circle), planar grain boundaries (broken line, triangle) [30] B) HS-21, serrated grain boundaries (solid line, open symbol), planar grain boundaries (broken line, filled symbol) [31]............................................................................................................. 43
Figure 37: Creep test results o f IN718 and IN738LC with serrated and planargrain boundaries [53].............................................................................................. 44
Figure 38: Effect o f alloying additions on the solubility of N in liquid 18Cr-8Nialloys at 1600°C and 1 atm N2 [33,p.31]............................................................. 50
Figure 39: Effect o f alloy additions on the solid solution hardening o f austenite[33,p .16]....................................................................................................................51
Figure 40: Fe-Cr-Mn austenitic steel with 0.18% C and 0.38% N - (a) 1204°C solution annealed and aged at 871°C for 16 hrs. (b) 1204°C solution annealed and aged at 982°C. (c) 1204°C solution annealed and aged at 927°C. (d) 1204°C solution annealed and aged at 1038°C [33,p.28].......... 52
Figure 41: A) Schematic diagram showing sequence o f development o f cellularprecipitation [94,p.324], B) Grain boundary reaction nodule in 21-4N.......... 53
Figure 42: Effect o f the grain boundary reaction on material properties [96].................... 55
Figure 43: Effect o f the grain boundary reaction on rupture time, elongation andminimum creep rate [91].........................................................................................56
Figure 44: Effect o f the grain boundary reaction on creep curve shape [91]..................... 57
Figure 45: Room temperature fracture o f 21-4N with grain boundary reactionnodules [92]........................................... 58
Figure 46: Engine valve [97].....................................................................................................60
xi
R eproduced with perm ission of the copyright owner. Further reproduction prohibited without perm ission.

Figure 47: As received 21-4N bar stock and sample slug.....................................................60
Figure 48: As received microstructure o f the 21-4N bar stock............................................. 62
Figure 49: A - Lindberg furnace, B - Lindberg/Blue furnace controller,C - Yokogawa program temperature controller, D - Omega Type K thermocouple............................................................................................................ 63
Figure 50: Creep sample geometry..........................................................................................6 6
Figure 51: A - Creep rupture frame, B - Leeds & Northrup furnace control unit,C - Omega DP462 digital panel thermometer, D - Solartron Metrology OD5 conditioning module, E - Satec RT-214 single LVDT extensometer, F - Extensometer micrometer, G - Solartron Metrology LVDT.....................................................................................................67
Figure 52: A - National Instruments USB data acquisition system, B - signal lines from LVDT conditioning modules, C - USB connection to PC laptop......................................................................................................................... 70
Figure 53: LabView data acquisition user interface.............................................................. 70
Figure 54: The 6 Projection method treats the creep curve as decaying primaryand accelerating tertiary sections [3]....................................................................73
Figure 55: Comparison of measured engineering strain and calculated true strain........... 74
Figure 56: Truncated data overlaid on full true strain data for ‘NGB’ sampletested at 27.4MPa and 900°C.................................................................................75
Figure 57: Comparison o f actual data to 0 Projection method curve fit..............................75
Figure 58: Difference in strain between Q fit equations and actual data.............................76
Figure 59: Microstructural evolution during the ‘NGB’ heat treatment..............................78
Figure 60: Grain boundaries o f partially and fully heat treated ‘NGB’microstructure............................................. 78
Figure 61: Microstructural evolution during the ‘SGB’ heat treatment..............................80
Figure 62: Grain boundaries o f partially and fully heat treated ‘SGB’microstructure.......................................................................................................... 80
xii
R eproduced with perm ission of the copyright owner. Further reproduction prohibited without perm ission.

Figure 63: Effect o f cooling rate on amount o f GBR precipitated aftersolutionizing at 1200°C for 1 hour, followed by cooling to 1030°Cand water quenching............................................................................................... 82
Figure 64: Representative micrographs showing effect o f cooling rate on areafraction o f GBR........................................................................................................ 82
Figure 65: Comparison o f ‘SGB M ’ and SGB’ heat treated microstructures..................... 83
Figure 6 6 : Micrographs o f fully heat treated microstructures.............................................. 85
Figure 67: Grain boundaries o f fully heat treated micro structures.......................................86
Figure 6 8 : Constant load creep curves at 700°C and 196MPa............................................87
Figure 69: Constant load creep curves at 900°C and 27.4MPa...........................................89
Figure 70: Constant load creep curves at 925°C and 27.4MPa...........................................90
Figure 71: Increasing load creep curves at 700°C and 183-295MPa.................................. 91
Figure 72: Strain rate vs stress plot from increasing load tests at 700°C and183-295MPa............................................................................................................. 91
Figure 73: Increasing load creep curves at 900°C and 27.4-64.7MPa................................92
Figure 74: Increasing load creep curves at 900°C and 27.4-65MPa................................... 92
Figure 75: Strain rate vs stress plot from increasing load tests at 900°C and27.4-65MPa................................................................. 93
Figure 76: Gauge section microstructures after constant load creep testing at700°C and 196MPa................................................................................................. 95
Figure 77: Gauge section grain boundaries after constant load creep testing at700°C and 196MPa................................................................................................. 96
Figure 78: Gauge section microstructures after constant load creep testing at900°C and 27.4MPa................................................................................................ 98
Figure 79: Gauge section grain boundaries after constant load creep testing at900°C and 27.4MPa................................................................................................ 99
Figure 80: Gauge section grain boundaries o f prematurely failed ‘SGB’ sampleafter constant load creep testing at 900°C and 27.4MPa................................. 100
xiii
R eproduced with perm ission of the copyright owner. Further reproduction prohibited without perm ission.

Figure 81: Gauge section GBR nodule morphology in prematurely failed ‘SGB’sample and fully heat treated but untested ‘SGB’ sample............................... 100
Figure 82: Gauge section microstructures after constant load creep testing at925°C and 27.4MPa.............................................................................................. 101
Figure 83: Gauge section grain boundaries after constant load creep testing at925°C and 27.4MPa.............................................................................................. 102
Figure 84: ‘NGB’ and ‘SGB’ microstructures after-1800 hour aging at 900°C.............103
Figure 85: ‘NGB’ and ‘SGB’ grain boundaries after -1800 hour aging at 900°C...........104
Figure 8 6 : Creep fracture surfaces from constant load tests at 700°C and 196MPa 106
Figure 87: Gauge section intergranular cracking from constant load tests at700°C and 196MPa............................................................................................... 107
Figure 8 8 : Gauge section intergranular cracking from constant load tests at900°C and 27.4MPa.............................................................................................. 108
Figure 89: Gauge section intergranular cracking from constant load tests at925°C and 27.4MPa.............................................................................................. 108
Figure 90: Gauge section intergranular cracks at GBR nodules in ‘SGB’and SGB M ’ samples tested at 700°C and 196MPa......................................... 109
Figure 91: Gauge section grain boundary cavities away from grain boundary triple points in ‘SGB’ and ‘SGB M ’ samples tested at 700°C and 196MPa........................................................................................................... 110
Figure 92: Gauge section grain boundary cavities away from grain boundary triple points in ‘SGB’ and ‘SGB M ’ samples tested at 900°C and 27.4MPa.......................................................................................................... I l l
Figure 93: Gauge section grain boundary cavities ‘NGB’ sample tested at900°C and 27.4MPa.............................................................................................. I l l
Figure 94: Gauge section intergranular cracks at and propagating into GBR nodules in ‘SGB’ prematurely failed and ‘SGB M ’ samples tested at 900°C and 27.4MPa.......................................................................................... 112
Figure 95: Gauge section micrographs showing an increase in grain boundary cavities in a ‘NGB’ sample tested at 925°C and 27.4MPa, and a prevalence of cracks at GBR nodules in a ‘SGB’ sample also tested at 925°C and 27.4MPa.......... 113
xiv
R eproduced with perm ission of the copyright owner. Further reproduction prohibited without perm ission.

Figure 96: PWA 1113 constant load creep curves at 705°C and 690MPa.................... 131
Figure 97: PWA 1113 constant load creep curves at 750°C and 550MPa.................... 131
Figure 98: PWA 1113 constant load creep curves at 800°C and 300MPa.................... 132
Figure 99: PWA 1113 constant load creep curves at 800°C and 250MPa.................... 132
xv
R eproduced with perm ission of the copyright owner. Further reproduction prohibited without perm ission.

List of Appendices
Appendix A: Typical 21-4N Material Properties.................................................................. 143
Appendix B: Metallographic Preparation.............................................................................. 144
Appendix C: Creep Testing Procedure.................................................................................. 148
Appendix D: Data Acquisition System.................................................................................. 166
Appendix E: 6 Projection Analysis Results...........................................................................181
xvi
R eproduced with perm ission of the copyright owner. Further reproduction prohibited without perm ission.

Nomenclature
Tm absolute melting temperature
GBS grain boundary sliding
£s steady state creep rate
a stress
n stress exponent
Qc creep activation energy
R universal gas constant
T absolute temperature
Q sd activation energy for self diffusion
Q core activation energy for self diffusion along dislocation cores
Q gb activation energy for diffusion along grain boundaries
Q volume of a vacancy
d average grain diameter
k Boltzmann’s constant
D sd diffusion coefficient for lattice self diffusion
D gb diffusion coefficient for grain boundary diffusion
e grain boundary misorientation angle
Yst interfacial energy due to structural distortion caused by misfit dislocations
8 particle-matrix misfit
shear modulus
TEM transmission electron microscope
GBR grain boundary reaction
xvii
R eproduced with perm ission of the copyright owner. Further reproduction prohibited without perm ission.
LVDT linear variable differential transformer
DAQ data acquisition system
SEM scanning electron microscope
xviii
R eproduced with perm ission of the copyright owner. Further reproduction prohibited without perm ission.

1 Introduction
1.1 Importance of Creep
The importance o f creep is evident from the description o f the phenomenon. At
high temperatures, typically above 0.5Tm (where Tm is the absolute melting temperature),
metal parts under load will experience continuously increasing strain [l,p .l]. The
continuously increasing and permanent strain runs against the need in engineering
applications to maintain dimensional tolerances [2,p.891], Apart from changes to
component dimensions, the microstructure o f the component will also change and
continuing creep may lead to failure through creep fracture [l,p .l]. As such, materials
capable o f withstanding long periods o f time under load and high temperature are
required.
For moderate temperatures o f around 550°C, typical components requiring creep
resistant materials include furnace parts, piping, bolts, steam turbine rotors, boiler tubes
in power plants, etc. [l,p.3]. Up to around 1000°C, parts requiring creep resistant
materials are heat exchangers, furnace linings, boiler baffles, jet engine burner liners and
exhaust systems, etc. [ 1 ,p. 3 ]. The materials used in these applications typically include
low alloy steels with Cr, Mo, or V for the moderate temperatures and more expensive
materials such as austenitic stainless steels or nickel-base superalloys for the higher
temperatures [l,p.3].
The most extreme conditions in terms o f creep exist in jet engines. Creep
resistance in jet engines is critical for gas turbine blades which can experience material
temperatures in excess o f 1000°C [l,p.3]. Thus, both nickel and cobalt base superalloys
are used extensively for the manufacture o f gas turbine blades [l,p.3].
1
R eproduced with perm ission of the copyright owner. Further reproduction prohibited without perm ission.

With continually increasing temperatures and stresses, new materials must be
devised to withstand the more demanding conditions. This requires a greater
understanding o f the creep phenomenon. Increased understanding of creep will allow
components and structures to be designed to be safe and economically viable [2,p .895].
The reality however is that high temperature creep resistant alloys are usually complex,
and are developed for specific applications through empirical methods [l,p.2]. Another
important point is that components subjected to creep are generally expected to have long
service lives. In the case o f aeroengine gas turbines, components generally have service
lives of around 10,000 hours [3,p.6 ]. Testing to ascertain the creep properties of
materials for several thousand hours is feasible though expensive. A far more difficult
proposition would be testing up to 250,000 hours to ascertain the creep properties of
materials required for power plants which typically have service lives in excess o f 30
years [3,p.6],
For the extremely long service lives desired o f power plants for instance, short
term testing (relatively speaking) makes it difficult to understand the creep mechanisms
occurring [4,p.l22], The common practice o f extrapolating long term creep behaviour
from short term tests is possibly inaccurate as the material’s microstructure could change
unexpectedly well before the intended service life and cause failure [2,p.891].
The slow creep rates required for extremely long service lives are generally
believed to be controlled by diffusional creep mechanisms [5,p.205]. However,
controversy has arisen as to whether diffusional creep is a viable creep mechanism in
engineering applications, and whether dislocation creep continues to dominate instead [6 -
20],
2
R eproduced with perm ission of the copyright owner. Further reproduction prohibited without perm ission.

1.2 Role of Grain Boundaries in Creep
While the debate over diffusional creep continues, it is also important to note that
grain boundaries play an important role in long term creep [4,p.l22]. This is due to the
fact that when diffusional creep occurs, grain boundary sliding (GBS) must also occur to
prevent the formation of voids as the metal grains deform [5,p.211]. GBS can have a
negative impact on creep properties however, as GBS which is not accommodated by
diffusional mass flow can cause cracks to form, typically at grain boundary triple points
[2,p .871; 3,p.53]. Grain boundaries also play a role in creep fracture as the typical failure
mechanism is intergranular fracture as opposed to transgranular fracture which occurs at
lower temperatures [21,p.264; 2,p.870; 3,p.50]. Thus the inhibition o f GBS is expected
to be beneficial on creep properties. This has been noted when the grain boundary
morphology of various metals has been changed to a zig-zag or serrated type, from the
normal straight or planar type [22-32]. Improvements typically involve increased creep
ductility and creep rupture life. What is not completely understood, is what effect the
inhibition o f GBS will have on diffusional creep in terms o f the creep rate. Thus, the
interrelationship o f diffusional creep and GBS presents an opportunity to study the effects
o f grain boundary morphology on the creep rate o f metals.
1.3 Thesis Objectives and Outline
The objective o f this thesis is thus to help elucidate the role o f grain boundary
morphology on the creep rate o f engineering alloys. This involves creep testing a high
temperature engineering alloy capable o f forming planar and serrated grain boundaries.
3
R eproduced with perm ission of the copyright owner. Further reproduction prohibited without perm ission.

The material investigated is 21-4N, a manganese stabilized austenitic stainless steel that
typically sees use in automotive engine exhaust valves [33,p.6 8 ; 34; 35,p.24], It is
known to be able to form serrated grain boundaries [22-24].
This thesis is part of a larger research project being undertaken at Carleton
University which involves creep testing of a number o f engineering alloys such as nickel
base superalloys and other austenitic stainless steels. O f particular interest are the effects
of grain boundaries and intergranular second phase particles on the creep rate during the
period before the minimum creep rate, as opposed to the effect on creep ductility or creep
rupture life. Thus, the main objectives o f this thesis can be summarized as follows:
1. Establish heat treatment procedures to produce 21-4N creep samples with
planar and serrated grain boundaries.
2. Determine the effect(s) o f the serrated grain boundaries on the creep rate
through constant load and increasing load creep tests on the planar and
serrated grain boundary creep samples.
3. Outline possible future work required to achieve the overall research
objectives.
4
R eproduced with perm ission of the copyright owner. Further reproduction prohibited without perm ission.

2 Creep Theory
Creep is defined as time dependent plastic deformation [5,p.l4]. It becomes a
concern in engineering applications at temperatures above roughly 0.5Tm (where Tm is
the absolute melting temperature). This deformation is permanent and cannot be
recovered when the load is removed as the material’s structure undergoes changes
through numerous deformation mechanisms, the primary ones being dislocation slip and
climb, grain boundary sliding (GBS) and diffusion [2,p .844],
Mechanical testing to determine creep properties is typically done under tensile
creep conditions using apparatus as seen in Figure 1.
rod
specimen
furnace
LVDTLVDT
Figure 1: Simple lever loading machine for tensile creep testing. The extensometer with LVDTs mounted on the specimen measures strain by the displacement o f A1/A2 from B1/B2. Without an extensometer the
machine is a creep rupture frame capable o f only measuring rupture time [3 ,p .l0 ,p .l2 ],
The creep sample is brought up to test temperature in the furnace and then the
load is applied through a loading lever. Axial load application is maintained through the
5
R eproduced with perm ission of the copyright owner. Further reproduction prohibited without perm ission.

universal couplings. The particular test apparatus shown in Figure 1 is a constant load
type of machine as the stress experienced by the sample increases as it deforms over time.
There are constant stress machines which compensate for the sample deformation with
cams, however the most common is creep testing at constant load [3,p.l5].
A constant load test using an extensometer would typically produce a time vs.
strain plot, known as a creep curve, as seen in Figure 2.
Fracture
Figure 2: Typical creep curve for a constant load test showing the three stages o f creep, namely: primary,secondary and tertiary creep [21,p.263],
A typical creep curve also shows the three stages o f creep. The first stage, known
as primary creep, is a transient as it includes an instantaneous elongation from load
application and then decreasing strain rate as the sample strain hardens to support the
load [l,p. 15; 21,pp.263-264; 36,p.245]. The strain rate then becomes steady in the
secondary stage, where there is a balance between strain hardening and recovery
processes [21,p.264; 36,pp.245-246; 37,p.3]. This steady state strain rate is known as the
creep rate. Finally, the strain rate begins to increase in the tertiary stage as voids and
cracks continuously form within the sample increasing the stress further [l,p,16;
21,p.264; 36,p.249]. Finally, the sample will fail by fracture as the voids and cracks
6
R eproduced with perm ission of the copyright owner. Further reproduction prohibited without perm ission.

coalesce into larger cavities [36,p.249]. It is also possible for there to be no clearly
defined secondary stage of creep but rather a direct transition from primary to tertiary.
This produces a ‘minimum’ strain rate that is usually assumed to be equivalent to the
creep rate [5,p .15].
The typical effects o f temperature and stress can be seen in Figure 3, that an
increase in stress and/or temperature accelerates the creep rate.
aMedium temperature or stjfs*
Low Ktnpenutireor tow stress
Figure 3: Effect o f increasing stress and temperature on a typical creep curve [21,p.265].
It is assumed that the most important parameter is the steady state creep rate ( s s )
which is believed to be dependent on stress and temperature, but in an independent
manner [3,p.l9]:
s s = u ( o ) - v ( T ) ....................................................................... (1 )
The steady state creep rate is believed to obey Arrhenius’ rate kinetics and
‘Norton’s Law’ which results in a power law representation o f creep rate:
s s - A ct" exp(- Qc / R l ) ................................................. (2)
7
R eproduced with perm ission of the copyright owner. Further reproduction prohibited without perm ission.
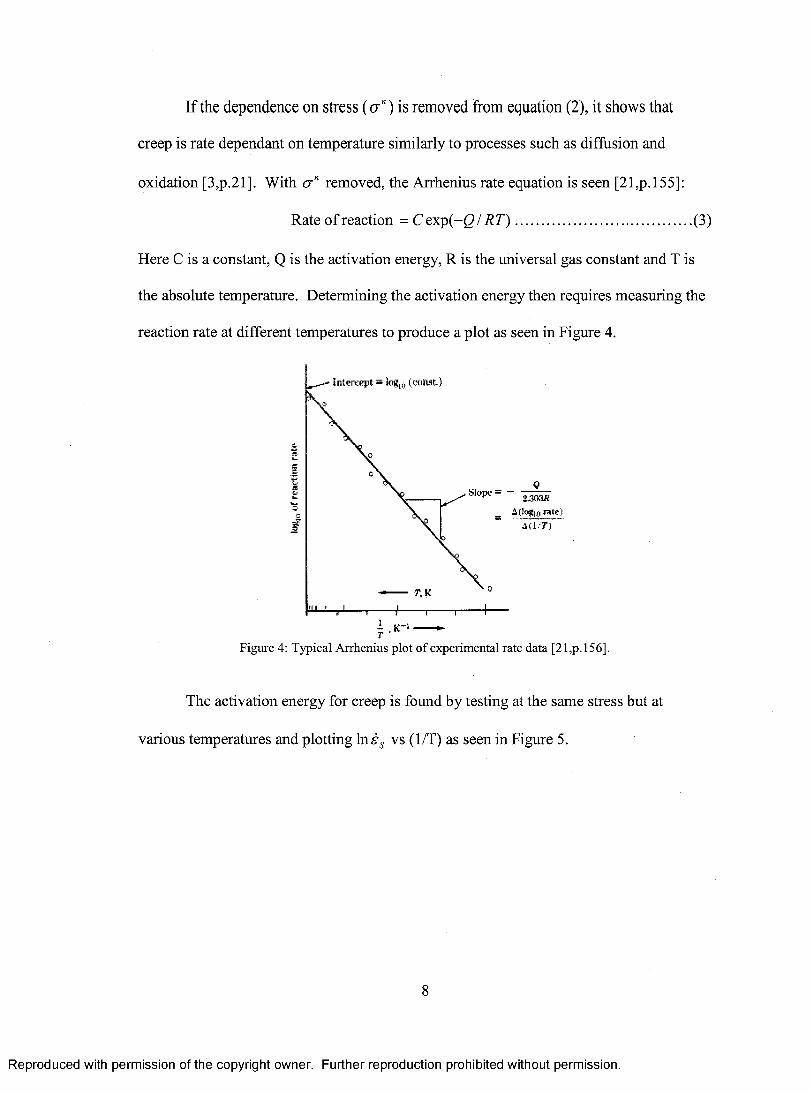
If the dependence on stress (cr") is removed from equation (2), it shows that
creep is rate dependant on temperature similarly to processes such as diffusion and
oxidation [3,p.21]. With <rn removed, the Arrhenius rate equation is seen [21,p. 155]:
Rate o f reaction = C exp( -Q / R T ) ................................................ (3)
Here C is a constant, Q is the activation energy, R is the universal gas constant and T is
the absolute temperature. Determining the activation energy then requires measuring the
reaction rate at different temperatures to produce a plot as seen in Figure 4.
Intercept = log1# (const.)
z2Ii£ Stop? = —oc
Figure 4: Typical Arrhenius plot o f experimental rate data [21,p. 156].
The activation energy for creep is found by testing at the same stress but at
various temperatures and plotting l n ^ vs (1/T) as seen in Figure 5.
8
R eproduced with perm ission of the copyright owner. Further reproduction prohibited without perm ission.

i / r — ^Figure 5: Testing at the same stress and various temperatures can be used to produce a plot giving the
activation energy Qc for creep [3,p.20].
Given that creep is not solely dependent on temperature, the effect o f stress must
also be determined. This is done through the so called ‘Norton’s Law’ which is simply
[3,p.22]:
s, oc a •(4)
Here a is the stress and n is the stress exponent. The stress exponent is determined by
testing at constant temperature and various stresses, and plotting log es vs log a as seen
in Figure 6 .
tlOg Ej
gradient = n e,«0*
loget« « lo g o
(/(JogeJridogo)
logo —>Figure 6: Testing at the same temperature and various stresses can produce a plot giving the stress exponent
n [3,p.22].
In general, creep can be considered to be either due to dislocation slip and climb
or diffusion o f atoms [2,p .844], For pure metals and simple alloys, which mechanism is
R eproduced with perm ission of the copyright owner. Further reproduction prohibited without perm ission.

dominant can generally be inferred from the values o f the stress exponent n and
activation energy Qc, as seen in Table 1.
Table 1: Creep processes considered to be dominant in pure metals based on temperature and stress and associated n and Qc values [3,p.47]. (QSd - activation energy for se lf diffusion, Q core - activation energy for self diffusion along dislocation cores, Qgb - activation energy for diffusion along grain boundaries)
Creep Process Temperature Stress nvalue
Qcvalue
high temperature dislocation creep
above ~ 0.7Tm
intermediate/high >3 ~ Q sd
low temperature dislocation creep
~ 0.4 to ~ 0.7Tm
intermediate/high >3 Q core
high temperature diffusional creep (Nabarro-Herring)
above ~ 0.7Tm
low ~1 Q sd
low temperature diffusional creep (Coble creep)
~ 0.4 to ~ 0.7Tm
low ~1 Q gb
2.1 Dislocation Creep
At relatively high stresses and temperatures dislocation climb and glide are
thought to be the most common deformation mechanisms during creep [2,p .852; 5,p .19].
Climb and glide are the recovery processes that balance strain hardening in secondary
creep to produce a steady state creep rate. As the dislocation slips on its slip planes, it
encounters obstacles which create dislocation pile ups; this is the hardening stage [3,p.43;
5,p.30]. Climb is necessary for the dislocation to free itself o f obstacles that impede its
slip, which can make climb rate controlling [2,p.955]. The slip and climb process is
shown schematically in Figure 7. After climb has occurred, the dislocation can be
annihilated by encountering a dislocation o f opposite sign or it may slip on a new glide
plane, most likely encountering another obstacle soon after [2,p.852; 3,p.43; 38,p.95].
10
R eproduced with perm ission of the copyright owner. Further reproduction prohibited without perm ission.

source o&siacioFigure 7: Pile up o f gliding dislocations followed by climb [3,p.43],
For a pure metal or a simple alloy, one o f two dislocation creep processes may
occur, which are differentiated by the size o f the obstacle the dislocation will encounter
[38,p.94]. The first is when the obstacle is on the scale o f the dislocation core (a few
interatomic distances) and can be passed by thermal agitation with the aid o f stress; this is
known as glide controlled creep. The second creep process is when the obstacle is too
large to be overcome by thermal agitation. These larger obstacles are created by other
dislocations through fluctuating internal stress fields or dislocations forming tangles or
barriers by locking-up [38,p.96]. The larger obstacles may disappear through a thermally
activated process, making it recovery controlled creep since diffusion is required to
remove the obstacles before glide can continue [38,p.96].
In precipitation or dispersion strengthened alloys, dislocations face increased
numbers o f obstacles thereby improving the creep resistance. Depending on the applied
stress, dislocations can overcome the obstacles in several ways. If the stress is high
enough, dislocations can simply shear the obstacles as seen in Figure 8 [l,p.95].
11
R eproduced with perm ission of the copyright owner. Further reproduction prohibited without perm ission.

Figure 8 : Shearing o f 7 ’ particles in a dilute 7/7 ’ alloy strained two per cent in tension [ 1 ,p. 197].
As the stress is decreased, dislocations can bypass obstacles either through
Orowan looping or climb. Orowan looping is shown in Figure 9 where a dislocation
passes a row of particles and leaves Orowan loops, or dislocation loops, around the
obstacles [l,p.85,p.l95; 5,p .179].
Dislocations can also climb over obstacles, either through local or general climb
as seen in Figure 10.
DislocationO row an
loops
Particles
Figure 9: Dislocation passing particles through Orowan looping [5,p. 179].
12
R eproduced with perm ission of the copyright owner. Further reproduction prohibited without perm ission.

t
Local Climb
General Climb
Figure 10: Dislocation local and general climb over particles [37,p .156].
As mentioned earlier, one o f the deformation processes during creep is grain
boundary sliding (GBS) which may occur during dislocation creep as an accommodation
process. However, the role o f GBS in high stress conditions which favour dislocation
motion is believed to be minimal. One reason is that if enough glide systems are
operative, then GBS is not required as an accommodation process [l,p.37; 5,p.211].
Also, the higher stresses required for dislocation creep will mean that the deformation
within the grains will be fast compared to the deformation from GBS [5,p.248]. Thus in
dislocation dominated creep, GBS has a very small role in the creep strain and creep rate.
It is more important for intergranular creep fracture which will be covered in greater
detail in Section 3.1.1 [5,p.248].
2.2 Diffusional Creep and Grain Boundary Sliding
Diffusional creep in general occurs at high temperatures and low stresses. At
these conditions it is known as Nabarro-Herring creep and diffusion occurs within the
grains [5,p.205; 36,p.248; 38,p .195]. At lower temperatures accompanied by low
13
R eproduced with perm ission of the copyright owner. Further reproduction prohibited without perm ission.

stresses, diffusional creep occurs by diffusion along grain boundaries and is known as
Coble creep [2,p.845; 5,p.205; 36,p.249; 38,p.200].
Figure 11 shows the basic physical concept o f diffusional creep, that is stress
directed diffusional mass transport [5,p.205].
When a tensile stress is applied, vacancies are formed on grain boundaries normal
to the tensile axis [l,p.54; 36,p.248; 37,p.91]. A basic assumption of Nabarro-Herring
and Coble diffusional creep is that grain boundaries are perfect sources and sinks for
vacancies which are required to accomplish the mass transport [2,p .845; 5,p.206;
36,p.248]. Thus there is a concentration gradient o f vacancies between grain boundaries
under tension and those in compression. This concentration gradient provides the driving
force for the flow o f vacancies from boundaries in tension to those in compression
[l,p.54; 2,p.845; 3,p.35; 36,p.248; 37,p.91]. In response, there is a counter flow o f atoms
from grain boundaries in compression to those in tension. This then leads to an extension
of the grain in the tensile direction [3,p.32], Equation (5) gives the creep rate for lattice
diffusional creep (Nabarro-Herring creep) [3,p.34; 5,p.208; 38,p .198]:
V MfttSQSeOPC STRfSS
Figure 11: Stress directed diffusion o f atoms in Nabarro-Herring creep [5,p.208],
(5 )
14
R eproduced with perm ission of the copyright owner. Further reproduction prohibited without perm ission.

Here K is a constant, Dsd is the diffusion coefficient for lattice self-diffusion, a is the
stress at the grain boundary, Q is the volume o f a vacancy, d is the average grain
diameter, k is Boltzmann’s constant and T is the temperature.
The relation for the creep rate of grain boundary diffusional creep (Coble creep) is
a simple modification of Equation (5) [3,p.35; 5,p.209; 38,p.200]:
D .SQ cr£ = K —:............................................................................................(6)
d 3kT
Diffusion is considered to be occurring in a narrow zone o f width 5 along the grain
boundaries, where “the area ofgrain boundary zone intersecting a unit area o f a
polycrystal o f average grain diameter, d, is given by (5/d)" [3,p.35]. For both lattice and
grain boundary diffusional creep, there is a clear grain size dependence. Thus, both
mechanisms are dominant with finer grain sizes. Which type o f diffusional creep will be
dominant also depends on the temperature. This is due to the activation energy being
lower for grain boundary diffusion than for lattice self-diffusion diffusion (Q gb <- Q sd)-
Thus at lower temperatures, it is easier for diffusion to take place along the grain
boundaries than within the grain boundaries. The activation energy affects the diffusion
coefficient as seen in equation (7). The relation given by Equation (7) makes the creep
rate o f diffusional creep processes consistent with the power law relationship given in
Equation (2) [3,p.34],
D = D0 exp- I Q / R T ) ....................................................(7)
An important phenomenon observed, that shows diffusional mechanisms are
operating, is that o f denuded zone formation. This is seen in materials with precipitates,
where the faces o f grains in tension become free o f precipitates as atoms diffuse there
from boundaries in compression. The grain faces in compression then show an increase
15
R eproduced with perm ission of the copyright owner. Further reproduction prohibited without perm ission.

in precipitates. Figure 12 shows a schematic o f denuded zone formation while Figure 13
shows the formation of denuded zones in a crept sample o f Mg 0.5% Zr alloy.
I
¥Figure 12: Schematic o f denuded zone formation in a material with precipitates [5,p.221].
Figure 13: Denuded zone formation in M g 0.5% Zr alloy [l,p .57].
While Nabarro-Herring creep is generally considered to be only applicable at very
high temperatures and low stresses, Coble creep is what allows diffusional mechanisms
to be applicable at lower temperatures; thereby making it a concern in engineering
applications [l,p.55; 5,p.205; 37,p.91].
An important point associated with these diffusional creep theories is the need for
an accommodation process to prevent void formation due to mass transport [5,p.211].
16
R eproduced with perm ission of the copyright owner. Further reproduction prohibited without perm ission.
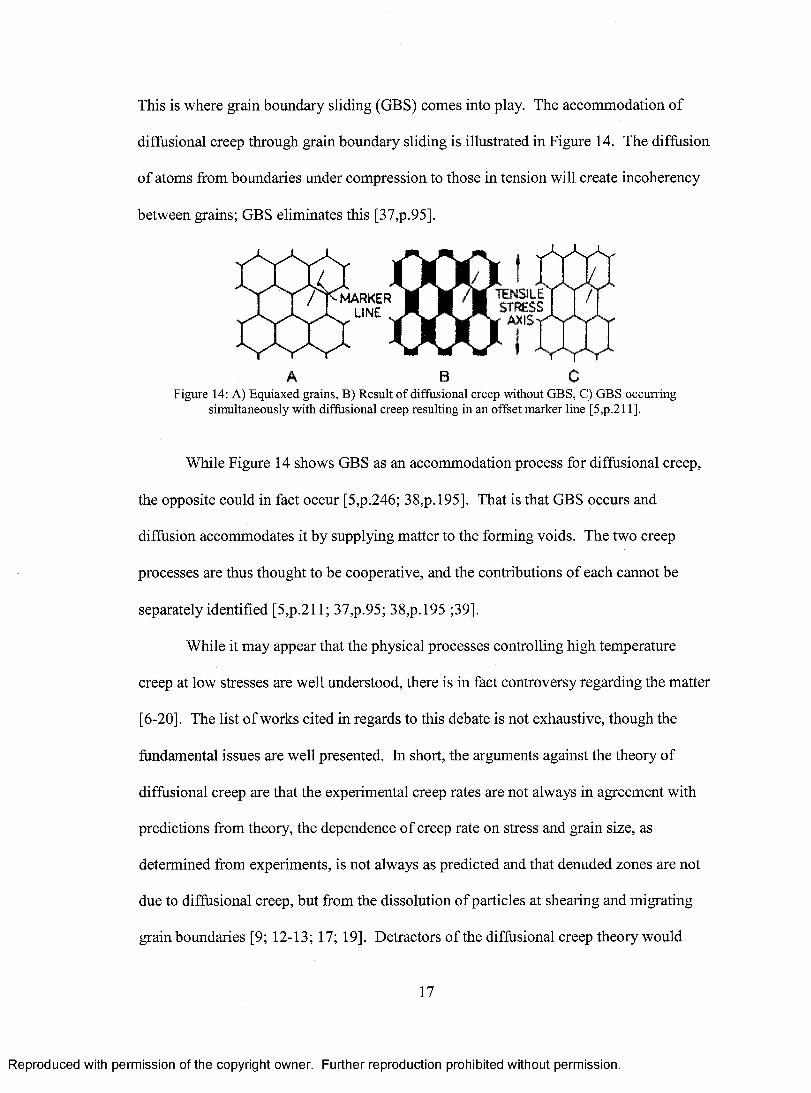
This is where grain boundary sliding (GBS) conies into play. The accommodation of
diffusional creep through grain boundary sliding is illustrated in Figure 14. The diffusion
of atoms from boundaries under compression to those in tension will create incoherency
between grains; GBS eliminates this [37,p.95],
TENSILE STRESS
i axiSy/ ]<M A R K E R
J L LINE ^
A B CFigure 14: A) Equiaxed grains, B) Result o f diffusional creep without GBS, C) GBS occurring
simultaneously with diffusional creep resulting in an offset marker line [5,p.211],
While Figure 14 shows GBS as an accommodation process for diffusional creep,
the opposite could in fact occur [5,p.246; 38,p .195]. That is that GBS occurs and
diffusion accommodates it by supplying matter to the forming voids. The two creep
processes are thus thought to be cooperative, and the contributions o f each cannot be
separately identified [5,p.211; 37,p.95; 38,p .195 ;39].
While it may appear that the physical processes controlling high temperature
creep at low stresses are well understood, there is in fact controversy regarding the matter
[6-20]. The list o f works cited in regards to this debate is not exhaustive, though the
fundamental issues are well presented. In short, the arguments against the theory of
diffusional creep are that the experimental creep rates are not always in agreement with
predictions from theory, the dependence o f creep rate on stress and grain size, as
determined from experiments, is not always as predicted and that denuded zones are not
due to diffusional creep, but from the dissolution of particles at shearing and migrating
grain boundaries [9; 12-13; 17; 19]. Detractors o f the diffusional creep theory would
17
R eproduced with perm ission of the copyright owner. Further reproduction prohibited without perm ission.

replace it with a dislocation creep process such as Harper-Dom creep along with GBS [9;
13;17].
Harper-Dom creep is also a creep mechanism that only occurs at high
temperatures and low stresses [40]. Although it is a dislocation creep mechanism, it has
similarities to diffusional creep in that the stress exponent is one and the activation
energy is that o f lattice self-diffusion [40]. It also predicts higher creep rates than
diffusional creep, thereby addressing one o f the problems with the diffusional creep
theory. Unlike diffusional creep, Harper-Dom creep does not have a grain size
dependence, but it is believed to only occur when the dislocation density is extremely low
[40]. Another requirement is that the test material purity be very high, which could rule
out the occurrence o f Harper-Dom creep in engineering alloys [40],
Returning to diffusional creep, supporters o f the theory point out though that it
may be more useful to investigate why diffusional creep may be suppressed or modified
instead of trying to replace it entirely [12]. However, the supporters o f diffusional creep
also acknowledge that the numerical theory is complicated by factors such as non
uniformity o f stress due to varying lengths of diffusional paths, shape o f grains and
distribution o f grain sizes [19]. There is also the possibility that the assumption o f grain
boundaries being perfect sources and sinks o f vacancies is incorrect [12; 19]. Thus, it is
apparent that further research is required to either refine the diffusional creep theory or
find a suitable alternative by first disproving diffusional creep and then providing an
alternative that is based on determinable physical processes and capable o f providing
accurate predictions for engineering applications.
18
R eproduced with perm ission of the copyright owner. Further reproduction prohibited without perm ission.

3 Grain Boundary Morphology
3.1 Grain Boundaries
Metals are crystalline structures which after most solidification processes are
polycrystalline [41,p.33]. Due to these many crystals, or ‘grains’, boundaries form to
separate the grains; as each has a different orientation o f its crystalline lattice with respect
to its neighbouring grains [21,p. 145].
A simple description o f grain boundary structure is islands o f good fit (grains)
separated by lines o f bad fit (grain boundaries) [36,p.97; 42], Referring to Figure 15, the
grain boundaries are planar crystalline lattice imperfections that separate grains of
different orientation, which can be understood as complex arrays o f dislocations [2 ,p .l6 8 ;
21,p .145; 36,p.97; 38,p.63]. The crystalline order o f the grains generally remains
constant right up to the grain boundary, which is normally several atomic diameters wide
[21,p.l46; 36,p.43; 38,p.66].
Figure 15: Grain boundaries separate grains o f different crystallographic orientation [41,p.34].
A characteristic o f grain boundaries is the misorientation angle (6), which can be
seen in a small angle tilt boundary in Figure 16. The lattice misorientation caused by
19
R eproduced with perm ission of the copyright owner. Further reproduction prohibited without perm ission.
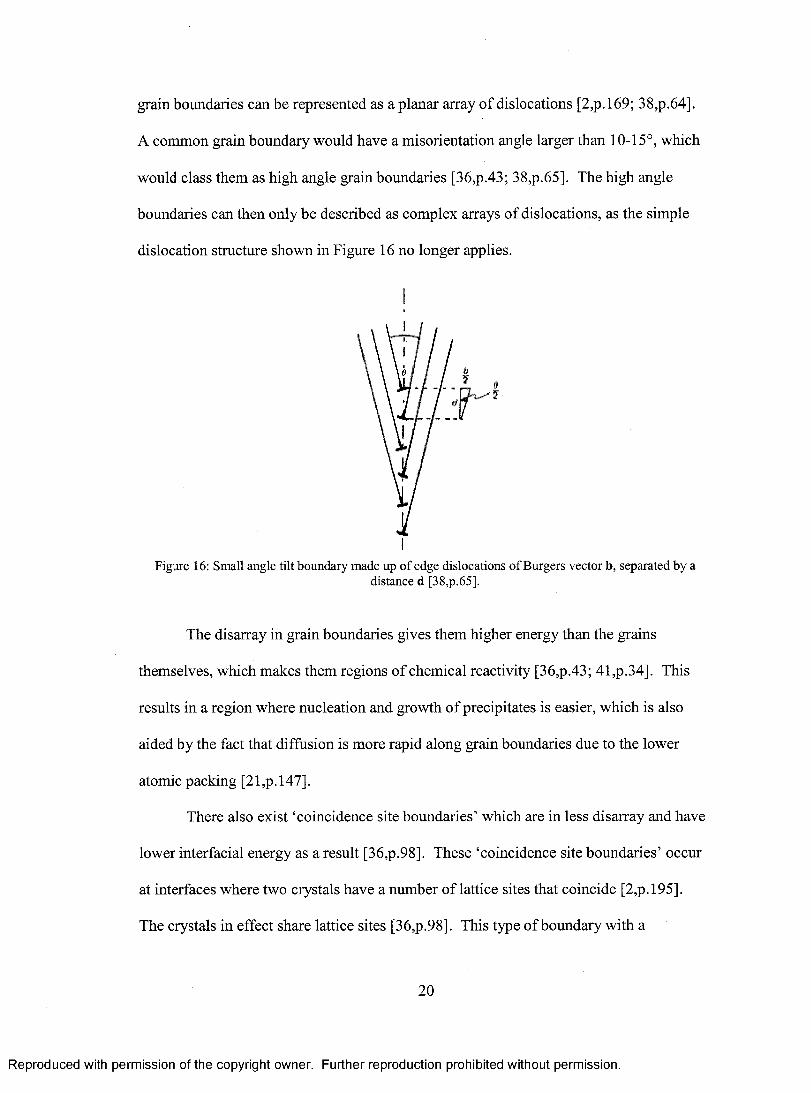
grain boundaries can be represented as a planar array of dislocations [2,p.l69; 3 8,p.64].
A common grain boundary would have a misorientation angle larger than 10-15°, which
would class them as high angle grain boundaries [36,p.43; 38,p.65]. The high angle
boundaries can then only be described as complex arrays o f dislocations, as the simple
dislocation structure shown in Figure 16 no longer applies.
Figure 16: Small angle tilt boundary made up o f edge dislocations o f Burgers vector b, separated by adistance d [38,p.65].
The disarray in grain boundaries gives them higher energy than the grains
themselves, which makes them regions o f chemical reactivity [36,p.43; 41,p.34], This
results in a region where nucleation and growth of precipitates is easier, which is also
aided by the fact that diffusion is more rapid along grain boundaries due to the lower
atomic packing [21,p. 147],
There also exist ‘coincidence site boundaries’ which are in less disarray and have
lower interfacial energy as a result [36,p.98]. These ‘coincidence site boundaries’ occur
at interfaces where two crystals have a number o f lattice sites that coincide [2,p.l95],
The crystals in effect share lattice sites [36,p.98]. This type o f boundary with a
20
R eproduced with perm ission of the copyright owner. Further reproduction prohibited without perm ission.
sufficiently large amount o f coincidence sites is believed to have higher mobility and
could support rapid grain growth [2,p. 195].
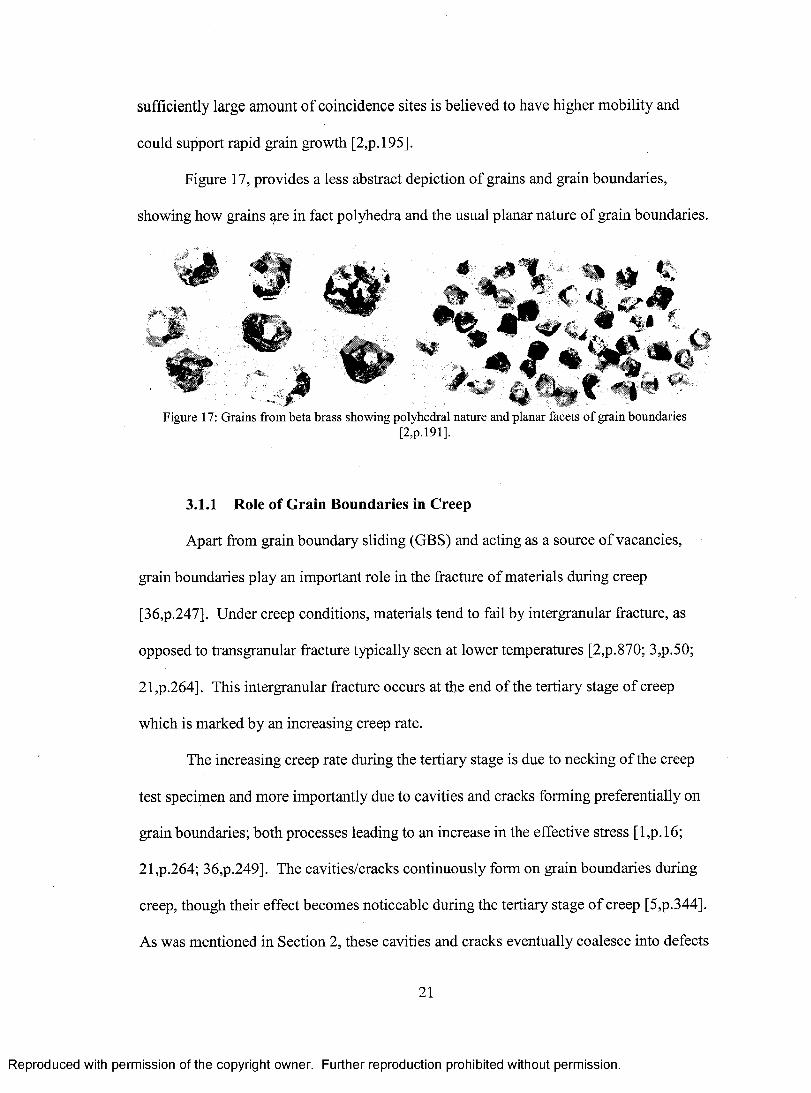
Figure 17, provides a less abstract depiction o f grains and grain boundaries,
showing how grains are in fact polyhedra and the usual planar nature of grain boundaries.
Figure 17: Grains from beta brass showing polyhedral nature and planar facets o f grain boundaries
3.1.1 Role of Grain Boundaries in Creep
Apart from grain boundary sliding (GBS) and acting as a source o f vacancies,
grain boundaries play an important role in the fracture o f materials during creep
[36,p.247]. Under creep conditions, materials tend to fail by intergranular fracture, as
opposed to transgranular fracture typically seen at lower temperatures [2,p .870; 3,p.50;
21,p.264]. This intergranular fracture occurs at the end o f the tertiary stage of creep
which is marked by an increasing creep rate.
The increasing creep rate during the tertiary stage is due to necking of the creep
test specimen and more importantly due to cavities and cracks forming preferentially on
grain boundaries; both processes leading to an increase in the effective stress [ l ,p .l6 ;
21,p.264; 36,p.249]. The cavities/cracks continuously form on grain boundaries during
creep, though their effect becomes noticeable during the tertiary stage o f creep [5,p.344].
As was mentioned in Section 2, these cavities and cracks eventually coalesce into defects
1-■*
[2,p .191].
21
R eproduced with perm ission of the copyright owner. Further reproduction prohibited without perm ission.

sufficiently large to propagate and fracture the test specimen [3,p.51]. Figure 18 shows
the two types o f cavities and cracks which lead to intergranular failure. These cavities
and cracks nucleate early in the creep life and continue to form simultaneously during the
creep process [2,p.817; 3,p.51; 5,p.344] The cracks tend to occur more often in high
stress and high strain rate conditions, while the cavities favour lower stresses and lower
strain rates [2,p.874].
Figure 18: A) Wedge type cracks at grain boundary triple points, B) Cavities along grain boundaries[2,p.871].
The wedge cracks seen in Figure 18 are generally attributed to GBS which is not
accommodated, leading to a stress concentration high enough to cause a crack to form
[2,p.871; 3,p.53]. There is also the possibility that the wedge cracks are just a product of
accumulating cavities [2,p.874]. The two possibilities are shown in Figure 19. These
cracks occur at the junction o f grains, making them also known as triple point cracks.
22
R eproduced with perm ission of the copyright owner. Further reproduction prohibited without perm ission.

Figure 19: A) W edge crack formed due to GBS, B) Wedge crack formed due to accumulating cavities[37,p.215].
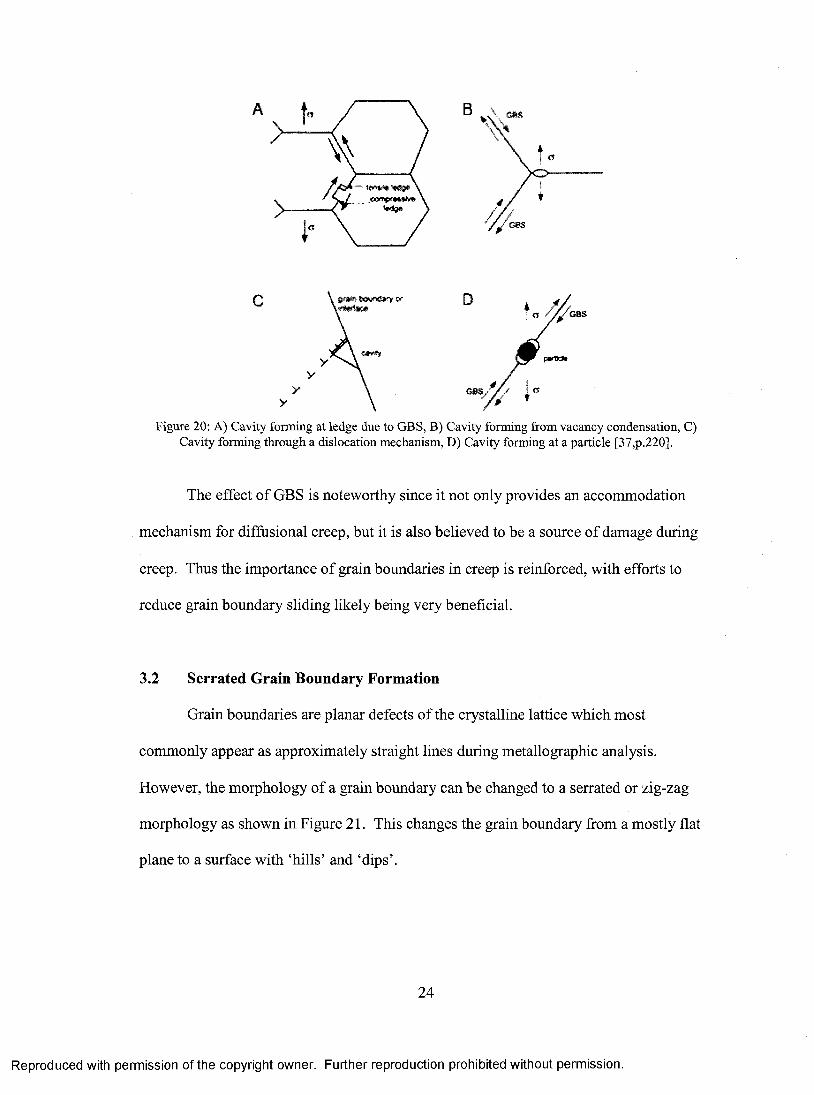
Cavities generally nucleate inhomogeneously on grain boundaries transverse to
the tensile axis [ l ,p .l6 ; 3,p.51; 5,p.346; 36,p.249]. Their method of formation is also
often attributed to GBS along a grain boundary which may feature discontinuities such as
jogs/ledges or hard particles [2,p .873; 3,p.54; 37,p.218]. The possibility also exists that
they may form due to vacancy diffusion which could be assisted by GBS, or they may
even form by a dislocation mechanism [2,p .876; 3,p.54; 5,p.344; 37,p.218]. Refer to
Figure 20 for the various possible cavity formation mechanisms.
23
R eproduced with perm ission of the copyright owner. Further reproduction prohibited without perm ission.
o
y 1 -
>/
c
yy
yy
Figure 20: A) Cavity forming at ledge due to GBS, B) Cavity forming from vacancy condensation, C) Cavity forming through a dislocation mechanism, D) Cavity forming at a particle [37,p.220].
The effect o f GBS is noteworthy since it not only provides an accommodation
mechanism for diffusional creep, but it is also believed to be a source o f damage during
creep. Thus the importance o f grain boundaries in creep is reinforced, with efforts to
reduce grain boundary sliding likely being very beneficial.
3.2 Serrated Grain Boundary Formation
Grain boundaries are planar defects o f the crystalline lattice which most
commonly appear as approximately straight lines during metallographic analysis.
However, the morphology of a grain boundary can be changed to a serrated or zig-zag
morphology as shown in Figure 21. This changes the grain boundary from a mostly flat
plane to a surface with ‘hills’ and ‘dips’.
24
R eproduced with perm ission of the copyright owner. Further reproduction prohibited without perm ission.

Figure 21: Planar (A) and serrated (B) grain boundaries in nickel base superalloy PWA 1113 [43],
Serrated grain boundaries can occur in different materials including nickel and
cobalt base superalloys, as well as various types o f austenitic stainless steels. The
serrations form during heat treatment involving solutionizing followed by furnace cooling
and/or isothermal aging. Grain boundary serrations can also arise as a result o f high
temperature deformation in various materials [44-47]. The following sections describe
the formation of grain boundary serrations in various materials, specifically through the
use of heat treatments.
3.2.1 Nickel Base Superalloys
Serrated grain boundary formation in nickel base superalloys can be divided into
alloys with a base composition similar to IN 718 and those with high 7 ’ volume fraction
[4,p.l 10], In both cases, serrations occur as a result o f the precipitation o f secondary
phases. The precipitates are intermetallic compounds; 8 orthorhombic NisNb for IN 718
type alloys and 7 ’ fee ordered Nis(Al,Ti) for high 7 ’ volume fraction alloys [4,p.l 10;
48,p25].
25
R eproduced with perm ission of the copyright owner. Further reproduction prohibited without perm ission.

In IN 718 type alloys, the Tu-Tumbull mechanism is believed to occur which
involves controlled cellular precipitation o f the 5 NisNb phase at grain boundaries
[4 ,p .ll0; 28; 49-50]. The Tu-Tumbull mechanism was originally outlined for a lead-tin
bicrystal; the process is shown schematically in Figure 22 [51].
t* i°l i °! \ .J~--- P pJo/e ^
XAt \
f o j (b) ( C)
\\ a
a T i a2
\(ej , (f)
\\
/X\ A(Ql (h) ( i )
Figure 22: Schematic diagram o f Tu-Tumbull mechanism [51].
The process is explained by Tu and Turnbull as follows:
“In the earliest stage o f precipitation, lamellae (j3) are found lying along the grain
boundary; later they become embedded into the matrix with one set o f tips still in the
boundary... Fig. [22(b)] shows a plate along the boundary after considerable growth. Its
orientation follows the crystallographic directions this means that the left hand side
o f the tin plate is lying on the habit plane o f a.\... but the right hand side o f the plate does
26
R eproduced with perm ission of the copyright owner. Further reproduction prohibited without perm ission.

not lie on the habit plane o f a2. .. The existence o f [a] difference between the surface free
energies o f the opposite sides o f the plate produces a driving force which tends to replace
the high energy interface a2 - /3 by the lower energy ax - (3. This replacement is
accomplished by the up and right motion o f the boundary at B in Fig. [22(b)], followed
by the motion illustrated in Fig. [22(c)]... which carries the boundary to the other end o f
the plate. This kind o f motion o f boundary B toward boundary A embeds the tin plate
into grain cti... During the course o f the motion o f B, as in Fig. [22(c)], a second tin plate
may form and lie parallel to the first one, see Fig. [22(d)]... in the same manner, a third
one, a fourth one and more would appear successively and constitute a c e ll... [B]oundary
A does not undergo the same kind o f motion as B . .. [as] the boundary would have to be
highly curved and this would be energetically unfavourable. On the other hand, it is
apparent from Fig. [22(b)] that the configuration o f boundary B is quite favourable for
the branching o f a plate out into a new part o f it, as shown in Fig. [22(f)]... As the
boundary... starts from C and m oves in the direction shown by the arrow so as to traverse
the plate, it may drain the Sn atoms away from the comer C. While this occurs, the
configuration then changes to that shown in ... Fig. [22(g)], One reason for the drainage
o f Sn atoms may be to supply the tin for the branching o f another plate at the position D
(or E) see Fig. [22(h)]. When these processes are repeated, we obtain Fig. [2 2 (i)] ...” [51]
Thus the serrations are formed from grain boundary precipitates which branch and
transfer into the matrix, with the driving force being the difference in surface free energy
between the grain boundaries on either side o f the precipitates [51]. These serrations are
angular in nature (refer to Figure 23) unlike in the high y’ volume fraction alloys where
the grain boundary serrations are wavy in nature [4,p.l 10], A typical heat treatment used
to produce these angular serrations involves solution treatment followed by furnace
cooling to an aging temperature to precipitate the 5 phase [28, 49-50].
27
R eproduced with perm ission of the copyright owner. Further reproduction prohibited without perm ission.
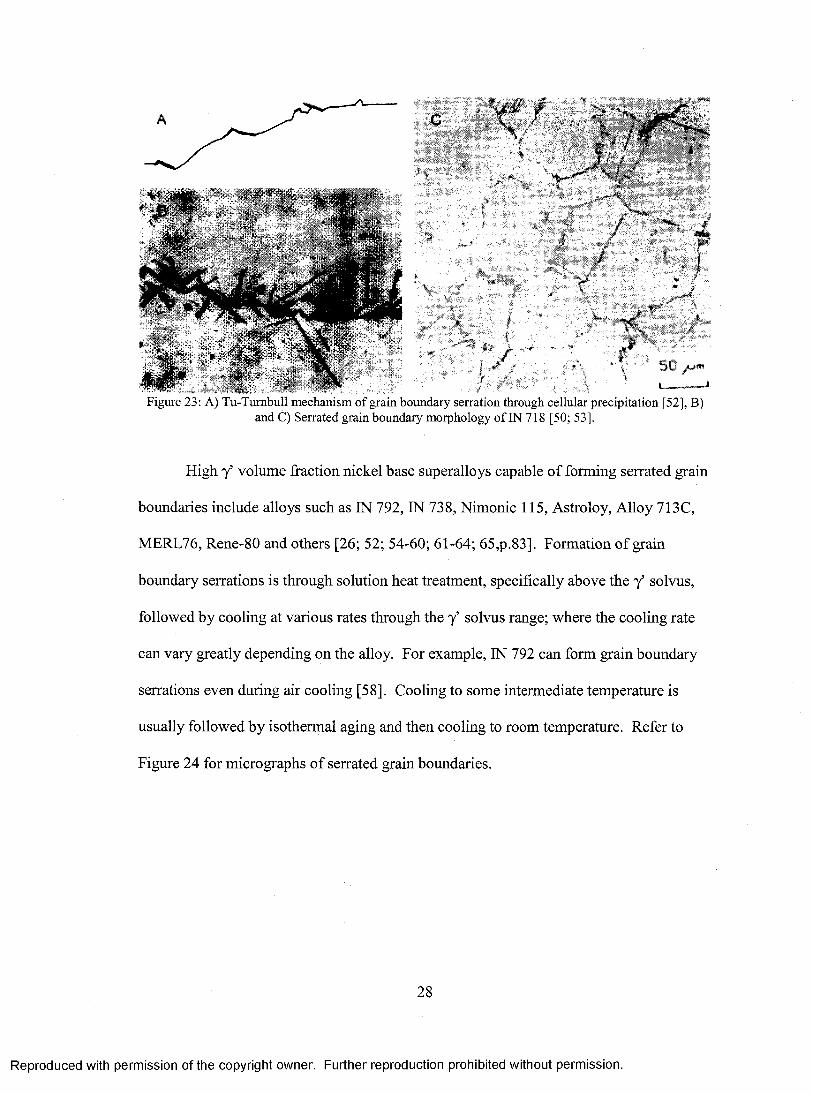
Figure 23: A) Tu-Tumbull mechanism o f grain boundary serration through cellular precipitation [52], B) and C) Serrated grain boundary morphology o f IN 718 [50; 53].
High Y volume fraction nickel base superalloys capable o f forming serrated grain
boundaries include alloys such as IN 792, IN 738, Nimonic 115, Astroloy, Alloy 713C,
MERL76, Rene-80 and others [26; 52; 54-60; 61-64; 65,p.83]. Formation of grain
boundary serrations is through solution heat treatment, specifically above the y solvus,
followed by cooling at various rates through the 7 ’ solvus range; where the cooling rate
can vary greatly depending on the alloy. For example, IN 792 can form grain boundary
serrations even during air cooling [58]. Cooling to some intermediate temperature is
usually followed by isothermal aging and then cooling to room temperature. Refer to
Figure 24 for micrographs o f serrated grain boundaries.
28
R eproduced with perm ission of the copyright owner. Further reproduction prohibited without perm ission.
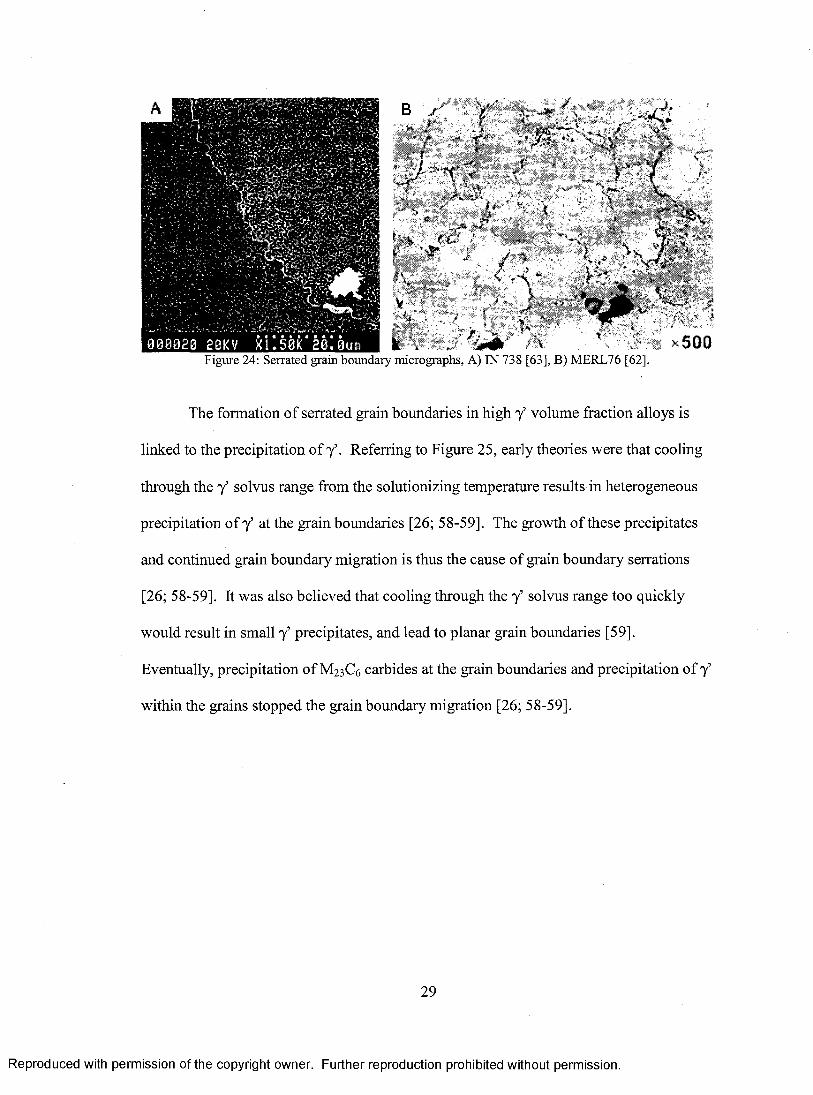
Figure 24: Serrated grain boundary micrographs, A) IN 738 [63], B) MERL76 [62].
The formation o f serrated grain boundaries in high y ’ volume fraction alloys is
linked to the precipitation o f y \ Referring to Figure 25, early theories were that cooling
through the 7 ’ solvus range from the solutionizing temperature results in heterogeneous
precipitation of 7 ’ at the grain boundaries [26; 58-59]. The growth of these precipitates
and continued grain boundary migration is thus the cause of grain boundary serrations
[26; 58-59]. It was also believed that cooling through the 7 ’ solvus range too quickly
would result in small 7 ’ precipitates, and lead to planar grain boundaries [59].
Eventually, precipitation o f M23C6 carbides at the grain boundaries and precipitation o f 7 ’
within the grains stopped the grain boundary migration [26; 58-59].
29
R eproduced with perm ission of the copyright owner. Further reproduction prohibited without perm ission.

• M A I N BOUNDARY p P H i M A f t Y y ' P A R T I C L C S
1 1 1 !Moratory forces octing on o groin
to ! bounoory during slow coding from solution trtotnwM temp*fo»ur*
y - > S E C O N D A R Y y< r - P R I M A R Y y * P A R 'l C L C S /
f • • 9 0 9*9 9 * *9 0 09 0*0*9* e # e WA
I-ORIGINAL MAIN BOUNDARY
Serrated gram boundorits formed on cooling from solution treatment to partial solution traotment temperatures
Figure 25: M odel showing serrated grain boundary formation by cooling through y ’ solvus range fromsolution treatment [54],
A later theory put forward by Koul et al. also concludes that serrated grain
boundary formation is related to 7 ’ precipitation [52; 54-55]. The formation o f serrations
is again closely linked to the cooling rate through the 7 ’ solvus range [52]. Some basic
requirements determine whether an alloy is capable o f forming serrated grain boundaries.
The first is that the 7 ’ solvus must be higher than the M23C6 solvus, so that the grain
boundaries are not pinned before the 7 ’ begins to precipitate [52; 54-55]. The second
requirement is a minimum grain boundary 7 ’ particle size, below which serrated grain
boundaries will not form [52]. This critical particle size is given below:
r = 3 7st / 4[i82............................................................. (8 )
where 7st is the interfacial energy due to structural distortion caused by the misfit
dislocations, 5 is the particle-matrix misfit, and ji is the shear modulus o f the matrix [52].
30
R eproduced with perm ission of the copyright owner. Further reproduction prohibited without perm ission.

The theory by Koul et al. however differs from previous ones, as it rejects the
idea that grain boundaries are mobile enough to migrate between the grain boundary 7 ’
particles and cause sufficient serration. Instead, it is proposed that grain boundary
serrations occur as a result o f the movement o f primary 7 ’ found on the grain boundaries
[52; 54-55]. This theory is shown schematically in Figure 26. The theory suggests that
7 ’ nucleates on one side o f a grain boundary, and that the coherency strains o f the 7 ’
particle and grain boundary interface must be accommodated [54-55]. The coherency
strains are then accommodated due to the net strain energy difference between the two
grains A and B, as shown in Figure 26. This results in the movement o f the 7 ’ particle
until the line tension o f the grain boundary stops it [54-55]. Their evidence in support of
this theory is that they find 7 ’ particles o f nearly elliptical shape, always on the concave
side of serrations [54-55]. They also state that the magnitude o f the force available to
form serrations could be related to the 7 ’ particle-matrix misfit, which they reason could
be the explanation for changes in the minimum cooling rate required to form serrations in
different alloys [55].
31
R eproduced with perm ission of the copyright owner. Further reproduction prohibited without perm ission.

AG. on Axti&G.enS
AG b«tw««n A and 8 ptoviim rft* dMng font*in »h* <fir*eHon of M* boundary
Figure 26: Schematic o f grain boundary serration model based on 7 ’ migration in Nickel base superalloys[54].
Later work by Danflou et al. suggests that serration o f grain boundaries can be
considered a type o f discontinuous reaction requiring grain boundary migration [56].
These findings are different from that o f Koul et al. in that serrations do not form from
the movement o f grain boundary 7 ’ precipitates and that grain boundary migration is a
requirement. Instead, the theory states that some o f the precipitating 7 ’ dissolves partially
or completely in contact with migrating grain boundaries [56]. This then contributes to
the growth o f larger and more stable 7 ’ precipitates in the opposite grain. Thus the grain
boundary acts as a ‘short-circuit’ path for solute to quickly establish an equilibrium state
through the growth of 7 ’ on the grain boundaries; thereby pinning them and forming
serrations [56]. Danflou et al. also noted that the size o f the grain boundary serrations
was not only affected by the cooling rate, but also by the coincidence of a grain
boundary. They note that serrations o f large amplitude were found on low coincidence or
32
R eproduced with perm ission of the copyright owner. Further reproduction prohibited without perm ission.

random grain boundaries, while small amplitude serrations are found on high coincidence
boundaries [56].
Work by Henry et al. on a model nickel base superalloy purposely designed to
minimize the misfit between the matrix and y’ precipitates, again highlighted the
importance o f y’ precipitation in the serration of grain boundaries [6 6 ]. It was found that
the y’ precipitate growth mode affected the grain boundary morphology. Spherical
precipitates with high nucleation density produced planar grain boundaries while
dendritic precipitates caused serrations to form [6 6 ]. Refer to Figure 27 for an illustration
o f how the dentritic precipitate growth causes grain boundary serrations. Initially a y’
precipitate coherent with one grain forms at a grain boundary. Once the precipitate has
sufficiently grown, dendritic growth will occur at the matrix and grain boundary
interfaces. Due to the solutionizing heat treatment, the matrix is supersaturated with
solute and diffusion occurs at the matrix and grain boundary interfaces [6 6 ]. The largest
precipitate growth is at the grain boundary interface due to rapid grain boundary diffusion
from a wider area, causing asymmetric growth as seen in Figure 27.
1
Figure 27: Formation o f serrated grain boundary through asymmetric y ’ precipitate growth [66],
An important point made by Henry et al. is that without deep etching o f the
matrix, only discrete y’ precipitates are seen at the grain boundary serration peaks.
33
R eproduced with perm ission o f the copyright owner. Further reproduction prohibited without perm ission.

Referring to Figure 28, only etching to the point o f deeply grooving the grain boundaries
will expose the true nature o f the 7 ’ precipitate growth [6 6 ]. These results differ from
that of Koul et al. in that serrations are formed in an alloy with low misfit between the
matrix and 7 ’ precipitates. As well, formation of grain boundary serrations is again
shown not to be due to migration o f grain boundary 7 ’ precipitates [6 6 ].
Figure 28: Asymmetric 7 ’ precipitate growth causing grain boundary serrations, revealed through deepetching [6 6 ],
The work o f Letellier et al. appears to confirm that o f Henry et al. [61]. They also
show that the precipitation o f 7 ’ causes movement of the grain boundary, leading to
serrations. Nucleation o f 7 ’ at a grain boundary and growth into an adjacent grain occurs,
likely caused by increased grain boundary diffusion and mobility [61].
Most recently, Danflou et al. use the low matrix and 7 ’ misfit alloy developed by
Henry et a l, as well as Astroloy, and produce grain boundary serrations through an
isothermal heat treatment just below the 7 ’ solvus [57], In both alloys, dendritic 7 ’
precipitate growth is seen, pushing the grain boundaries and forming serrations. Also, a
new category o f grain boundary serration is seen in the alloy o f Henry et al. [57], This
new category o f serration can be seen in Figure 29. The serration is like a ‘fan’, caused
by a discontinuous reaction, in regions o f low precipitate density.
34
R eproduced with perm ission of the copyright owner. Further reproduction prohibited without perm ission.

Figure 29: Fan type serration in model alloy o f Henry et al. [57].
3.2.2 Austenitic Stainless Steels
While the formation of grain boundary serrations in austenitic stainless steels such
as 21-12N and 316 is known [25, 67], some of the most recent work has been concerned
with 304 and 316 stainless steels [68-74]. This work is also the most interesting since it
concludes that grain boundary serrations in these steels is not related to precipitate
formation whatsoever. Hong et al. have found that grain boundary serrations occur
before the precipitation o f M23C6 carbides along the grain boundaries o f 304 and 316 [6 8 -
69; 71]. This can be seen in Figure 30. They ensured that this is correct through the use
o f transmission electron microscopy (TEM) and high resolution TEM, neither o f which
could detect carbide particles on the grain boundary just after serration occurred [69].
The serrations were formed in a similar manner as in nickel base superalloy, using a
solution heat treatment, followed by furnace cooling and/or isothermal aging.
35
R eproduced with perm ission of the copyright owner. Further reproduction prohibited without perm ission.

Figure 30: Formation o f serrated grain boundaries followed by carbide precipitation in 304 stainless steel, A) after solution treatment, B) furnace cooled to aging temperature and aged for 5 min, C) furnace cooled to aging temperature and aged for 15 min and D) furnace cooled to aging temperature and aged for 3 hrs
[71].
It is also noted that the misorientation angle o f the grain boundaries is larger in
planar boundaries than in serrated ones [6 8 ]. Thus even with increased grain boundary
area, they suggest that the driving force for grain boundary serration could be the
reduction o f interfacial free energy per unit area [6 8 ].
Hong et al. also noted that in both 304 and 316, the M23C6 carbides had a
triangular morphology if they precipitated on a planar grain boundary, while on a serrated
grain boundary they were planar [69-70; 72-73], They state that the planar carbides have
lower interfacial energy due to lower indices o f the interfaces and lower misorientation
angle [70; 72-73]. This also adds to their theory that grain boundary serration reduces the
interfacial free energy per unit area.
36
R eproduced with perm ission of the copyright owner. Further reproduction prohibited without perm ission.

Their most recent work also identifies carbon as a critical element for the
occurrence o f grain boundary serration in 316 stainless steel [74]. They tested stainless
steels with different carbon contents and found that high carbon content increases the
amount o f serrations while below a certain amount, there is no grain boundary serration
[74]. They also carburized the low carbon stainless steel and then applied a heat
treatment that would produce serrations which proved successful [74], Their hypothesis
is then that lattice distortional strain energy due to excess carbon near a grain boundary is
the driving force for serrations [74].
3.2.3 Cobalt Base Superalloys
Some cobalt base superalloys capable o f forming serrated grain boundaries are
HS-21 and HS-25. As with nickel base superalloys there are different mechanisms for
the formation o f serrations, and a solution heat treatment is required, typically followed
by furnace cooling. The work o f Tanaka et al. includes both alloys [29-32; 75-78]. In
HS-25, the grain boundaries are serrated through the precipitation o f a tungsten rich
phase with small amounts o f MeC carbides [30; 32; 75; 77-78]. The precipitates are the
same as the bcc tungsten rich phase in Ni-20Cr-20W alloys [30]. The amount of
precipitates formed is affected by the tungsten content o f the alloy, with higher tungsten
leading to more precipitates [78].
In HS-21, grain boundaries are serrated through the grain boundary reaction
(GBR) [29; 31; 76]. The GBR forms nodules o f rod-like M23C6 carbides that grow from
one grain into another (refer to Figure 31) [29; 31; 76]. The carbon content o f the alloy
plays an important role in the formation of GBR. Since it contains approximately 0.25
37
R eproduced with perm ission of the copyright owner. Further reproduction prohibited without perm ission.

wt% C, this easily allows the formation of GBR during heat treatment [29; 31]. The
amount o f GBR formed is dependent on the supersaturation of carbon in the matrix, as an
increase in intragranular precipitates reduces the amount of GBR; thereby showing a
reduction in driving force from lowered carbon supersaturation [29]. Tanaka et al. also
confirmed that the GBR was not formed as a result o f an eutectoid reaction [29]. This
GBR in HS-21 is very similar to that found in 21-4N manganese austenitic stainless steel.
3.2.4 21-4N
In the manganese stabilized austenitic stainless steel 21-4N, Tanaka et al. have
found that grain boundaries are serrated through the grain boundary reaction (GBR) [79-
82], Further information about the GBR in 21-4N, as well as micrographs can be found
in Section 5. As with the cobalt based superalloy HS-21, the GBR in 21-4N is a nodule
o f rod-like M23C6 carbides. There are also C ^N nitrides in the GBR nodules o f 21-4N
due to the large amounts o f nitrogen present. Similarly to HS-21, supersaturation o f the
matrix is the driving force for the GBR; in the case of 21-4N it is a supersaturation of
carbon and nitrogen. Again, a solution heat treatment is required followed either by
furnace cooling or isothermal aging to precipitate the GBR.
.GBR v frotiutes
1 0 0 j i m
Figure 31: GBR nodules in HS-21 [31].
38
R eproduced with perm ission of the copyright owner. Further reproduction prohibited without perm ission.

As explained in Section 5, the GBR is a cellular type o f precipitate which pushes
the grain boundary into an adjacent grain, creating a serration. However, as seen in
Figure 31, the GBR cannot be the source o f all the grain boundary serrations in HS-21 or
in 21-4N. It is apparent that there are serrations which were not formed through the
GBR.
The work of Hong et al. on 304 and 316 stainless steel (refer to Section 3.2.2)
may shed light on the grain boundary serrations free o f GBR. They theorize that lattice
distortional strain energy due to excess carbon near a grain boundary is the driving force
for serrations [74]. This could apply to 21-4N since it contains substantial amounts of
carbon and nitrogen and to HS-21 since it also has large amounts o f C [29; 41,p.254].
Thus the GBR nodules produce the largest serrations, while the smaller serrations could
occur to reduce boundary energy, caused by supersaturation o f carbon and/or nitrogen. It
could also be possible that as with 304 and 316, the grain boundary serrations form and
are then followed by intergranular carbides as well as the GBR.
3.3 Effects of Serrated Grain Boundaries on Creep
Serrated grain boundaries have been shown to have very beneficial effects on the
creep properties o f various materials. In general, the creep rupture life and creep ductility
is increased in materials with serrated grain boundaries as opposed to planar grain
boundaries [22-32], This can be seen for 21-4N in Figure 32.
39
R eproduced with perm ission of the copyright owner. Further reproduction prohibited without perm ission.

0.10
294 MPa196 MPa
0 600 ?004 0 0
9 0 0 ”C
c,10
(15
3000 100 200T i m e (hi Ti me ( ft)
Figure 32: Creep tests o f 21-4N with serrated grain boundaries (solid line) and planar grain boundaries(broken line) [23].
Similar trends occur in other stainless steels as well as nickel and cobalt base
superalloys. Figures 33 and 34 show a similar trend for cobalt and nickel base
superalloys.
Q34L-605 (HS-25) - 927’C
Q3Q
c"(O 58J3!MPi
4 0 03 0 0200100
HS-21 - 9 2 7 'C
c CSSfD55 cio?
001
iOSMPs 784 KPa
50 103 150 200 230Tim# Chi
T i m e (n)Figure 33: Creep tests o f cobalt base superalloys L-605 and HS-21 with serrated grain boundaries (solid
line) and planar grain boundaries (broken line) [30-31].
40
R eproduced with perm ission of the copyright owner. Further reproduction prohibited without perm ission.

8
650'C & 593MPa
6
4
2
0300300 900§
Time (hours)Figure 34: Creep tests o f nickel base superalloy IN718 with serrated grain boundaries (solid line) and
planar grain boundaries (broken line) [28].
A common point seen in Figures 32, 33 and 34 is that tertiary creep appears to be
delayed in general for the serrated grain boundary samples. This would suggest that the
serrated grain boundaries improve the damage tolerance o f the materials during creep.
The improvement to damage tolerance is supported by fatigue and creep-fatigue tests
which show improvements to fatigue life in samples with serrated grain boundaries from
various stainless steels and superalloys [28-29; 49-50; 56-57; 62; 70-73; 75-76; 79-87].
Reasons for the improvement in damage tolerance include reduced grain
boundary sliding (GBS), as well as increased resistance to crack propagation from an
increased crack path, deflection of cracks at grain boundary serrations and even crack
arrest at inflection points on the grain boundaries [22-24; 56; 81; 83; 85]. Hong et al. in
their work on 304 and 316 stainless steel, claim however that improvements to the
damage tolerance arise from higher cavitation resistance and not from a reduction o f GBS
[70-73], The higher cavitation resistance is a result o f modified carbide morphology
41
R eproduced with perm ission of the copyright owner. Further reproduction prohibited without perm ission.

occurring with serrated grain boundaries (refer to Section 3.2.2), which have lower
interfacial energy. They reason that if GBS was occurring, then cavities would form the
most on grain boundaries oriented at 45° to the tensile axis. In their investigations
however, they found the most amount o f cavities on grain boundaries perpendicular to the
tensile axis, and also found few if any wedge type cracks at grain triple points. They
therefore concluded that GBS is not likely to be the main cause for cavity nucleation and
believe that improvements to damage tolerance from serrated grain boundaries arise only
from the modified carbides [70-73]. The general opinion though remains that GBS is a
main cause for cavitation, and that serrated grain boundaries increase damage tolerance
by inhibiting GBS.
Apart from improved damage tolerance leading to increased creep rupture life, the
effect o f serrated grain boundaries on the creep rate is unclear. Results from 21-4N at
intermediate temperatures and relatively high stresses show no difference in the creep
rates between samples with serrated and planar grain boundaries (refer to Figure 35).
id7
*3 1 ■*'10 I —150 2 5 0 300 350200
Stress (M P a )Figure 35: Comparison o f creep rates between serrated grain boundary samples (solid line, circle) and
planar grain boundary samples (broken line, triangle) in 21-4N [23],
42
R eproduced with perm ission of the copyright owner. Further reproduction prohibited without perm ission.

The result shown in Figure 35 is not unexpected since the temperature and
stresses are likely not in the regime of diffusional creep, where the link between
diffusional creep and GBS could result in a lower creep rate for the serrated grain
boundary samples. Similar outcomes are seen in Figure 36 for the cobalt base
superalloys L-605 (HS-25) and HS-21.
A
idL1-605 (HS-25)
id'
//i
I 92?’
1
<1*<75i
I
SC1 ' 0 0 1 5 0 2 0 0Stress (MPa)
B 5X10’V
10 1©£_a.Q)<UL-O
S3
ifii>H1 3S3m55
HS-211038 C/ 8 1 6 C
927 C
2 0 30 5 0 70 100 150 2 0 0Stress (MPa)
Figure 36: Comparison o f creep rates for cobalt base superalloys: A) L-605, serrated grain boundaries (solid line, circle), planar grain boundaries (broken line, triangle) [30] B) HS-21, serrated grain boundaries
(solid line, open symbol), planar grain boundaries (broken line, filled symbol) [31].
The results continue to show no difference in creep rate between serrated and
planar grain boundaries, even at high temperatures such as 1038°C, and low stresses.
Later testing by the same workers on the same two cobalt base superalloys revealed that
during high temperature creep tests at 1038°C and above, the planar grain boundary
samples formed serrations [76-77]. Thus the previous results at high temperature and low
stress, which could conceivably be in the diffusional regime for those materials, are likely
not valid comparisons between serrated and planar grain boundary creep rates.
43
R eproduced with perm ission of the copyright owner. Further reproduction prohibited without perm ission.
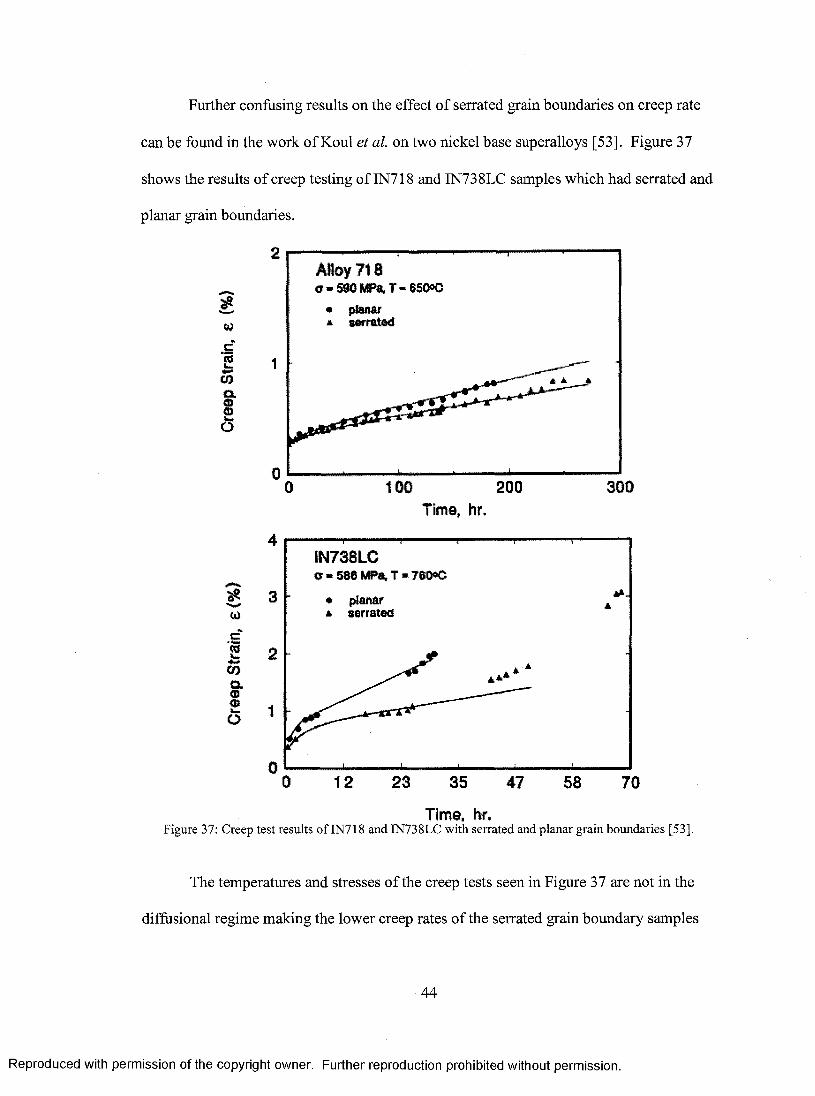
Further confusing results on the effect o f serrated grain boundaries on creep rate
can be found in the work of Koul et al. on two nickel base superalloys [53]. Figure 37
shows the results o f creep testing of IN718 and IN738LC samples which had serrated and
planar grain boundaries.
£w
2COIo
(0
efm>_
m&
o
2Alloy 718o-5WMP«,T-6SO°C
* serrated
1
03001 0 00 200
Time, hr.4
IN738LC<I-580MPa,T»7eO°C
• planar3
2
1
00 23 58 7012 35 47
Time. hr.Figure 37: Creep test results o f IN718 and IN738LC with serrated and planar grain boundaries [53],
The temperatures and stresses o f the creep tests seen in Figure 37 are not in the
diffusional regime making the lower creep rates o f the serrated grain boundary samples
44
R eproduced with perm ission of the copyright owner. Further reproduction prohibited without perm ission.

difficult to explain. This puzzling result with nickel base superalloys as well as the
unexpected change in grain boundary morphology in cobalt base superalloys leaves some
doubt as to the exact effects o f serrated grain boundaries on creep rate. The comparative
tests between serrated and planar grain boundaries on 21-4N, HS-21 and L-605 reinforce
the view that GBS has little effect on the creep mechanisms at intermediate temperatures
and high stresses. The high temperature and low stress tests are in doubt which makes it
difficult to assess whether or not GBS and diffusional creep are inextricably linked as
predicted by theory. Thus there still exists a need to further clarify the effect o f serrated
grain boundaries on creep rate and possibly shed light on fundamental creep mechanisms.
45
R eproduced with perm ission of the copyright owner. Further reproduction prohibited without perm ission.

4 Thesis Objectives and Scope
This thesis is the beginning of a broader research project at the Department of
Mechanical and Aerospace Engineering at Carleton University, which seeks to elucidate
the role o f grain boundaries on the creep rate o f engineering alloys. One o f the key areas
of interest is the effect of grain boundaries and intergranular second phase particles on the
creep strain rate during the time period prior to the minimum strain rate, as opposed to
the effect on rupture time and strain. The project will use a series o f engineering
materials including cast nickel base superalloys such as IN738, wrought nickel base
superalloys such as PWA 1113 and austenitic stainless steels such as 21-4N, 304 and 316.
The material being studied in this thesis is the manganese stabilized austenitic
stainless steel 21-4N. The objectives o f this thesis, within the scope o f the overall
research project are:
1 Identify heat treatment processes to produce microstructures in 21-4N with
planar and serrated grain boundaries.
2 Commence systematic creep testing of the planar and serrated grain boundary
microstructures at identical temperatures and stresses to ascertain what effect
the grain boundary serrations may have on primary creep and on the creep
rate, in comparison to the planar grain boundary microstructure.
3 Analyze resulting microstructures after creep testing.
4 Determine the suitability o f 21-4N for further testing with respect to the
overall research project goals.
5 Outline further possible work for the continuation o f the research project.
46
R eproduced with perm ission of the copyright owner. Further reproduction prohibited without perm ission.

The result o f the work to complete these objectives is outlined in the following
sections of this thesis. First, Section 5 details the material used for testing and the
experimental methods used. Section 6 outlines the results, first with the microstructural
results o f the various heat treatments applied to the test material. Then the creep testing
results are outlined followed by the microstructures of the tested samples. The results are
discussed in Section 7. Section 8 summarizes the results and outlines possible future
work.
47
R eproduced with perm ission of the copyright owner. Further reproduction prohibited without perm ission.
5 Materials and Experimental Methods
5.1 21-4N: Manganese Stabilized Austenitic Stainless Steel
The material used to investigate the effects o f serrated grain boundaries on creep
is 21-4N. It is also known as EV8 in the SAE designation [8 8 ,p.6 ]. 21-4N was originally
created by Armco Steel Co. but is now also produced by other companies [33,p.70]. As
the material name suggests, Mn plays a large role in the material’s properties by
improving the solubility o f N.
5.1.1 Chemistry and Microstructure
21-4N is an austenitic stainless steel. As such it has a face centered cubic (f.c.c.)
crystal structure. In terms o f austenitics, it is a Cr-Mn-N alloy as opposed to the more
typical Cr-Ni alloys, such as the 18Cr-8Ni steels [33,p. 14; 89,p.6]. And more specifically
it is a Fe-Cr-Mn-Ni-N alloy [33,p.22], The f.c.c. structure of 21-4N is maintained due to
the Ni, Mn and N alloying additions, all o f which are austenitizing elements [89,p.21].
The austenitic structure also provides improved solubility due to the larger lattice
interstices [33,p.30], The typical compositional limits o f 21-4N are given in Table 2.
Table 2: Compositional limits o f 21-4N [41,p.254],
Composition %C Cr Mn N Ni Si
0.45-0.6 20-23 7-10 0.3-0.5 3-5 0.25
Chief among the alloying elements is Cr, as it is essential in creating a passive Cr
rich oxide surface film [89,p.3,p .133]. A minimum of about 11% Cr is needed for the
steel to be classified as stainless, and more typically the Cr content ranges from 16 to
48
R eproduced with perm ission of the copyright owner. Further reproduction prohibited without perm ission.

26% [33,p.9; 89,p.3,p.21], The more typical Cr contents help in high temperature
applications and oxidizing environments [89,p.6]. Chromium is also a ferritizing element
and it also increases the solubility o f N [89,p.22],
While Ni can vary up to 35%, 21-4N has a low content, compared to a typical
18Cr-8Ni steel. Ni is used to stabilize austenite but it also improves mechanical
properties as well as improving corrosion resistance by promoting repassivation [41,p.37;
89,p.6,p .133]. The low Ni content is due to economics, as Mn, a cheaper substitute, can
be used to stabilize the austenite [33,p.5; 41,p.37]. However, the austenitizing power of
Ni is double that o f Mn, making it necessary to use a 2:1 ratio o f Mn to Ni in order to
reduce the Ni content [33,p .15]. Figure 5.1 also shows the negative impact Ni has on the
solubility o f N.
As stated above, Mn is substituted for Ni to stabilize the austenitic structure. Its
content can vary up to 15%, though above 10% it becomes a ferritizer [41,p. 140;
89,p.21], The other important function o f Mn is to increase the solubility of N [33,p.5;
41,p.37,p. 140; 89,p.6,p.22], This is where the economical advantage o f substituting Mn
for Ni improves.
The high solubility o f N in 21-4N is due to the Cr and Mn additions. Refer to
Figure 38 for the effects o f various alloying additions on the solubility o f N. In effect,
Mn and N are added together to replace Ni; the Mn increases the solubility o f N and both
Mn and N help to stabilize the austenite [41,p. 10]. Nitrogen is the stronger austenitizer o f
the two and it also provides solid solution strengthening, as well as improving the work
hardening characteristics [33,p.5; 41,p.37,p.46,p.l40; 89,p.6,p.l34]. The addition of N to
49
R eproduced with perm ission o f the copyright owner. Further reproduction prohibited without perm ission.

more common Cr-Ni steels such as 304 and 316 has also shown positive effects by
improving the high temperature strength [89,p.521].
.*1!
OS 2.0
Figure 38: Effect o f alloying additions on the solubility o f N in liquid 18Cr-8Ni alloys at 1600°C and 1 atmN 2 [33,p.31],
Carbon, like nitrogen, is soluble in the fee structure; meaning that it also helps to
stabilize the fee structure [89,p.6]. It also provides solid solution strengthening, which
helps in high temperature applications [41,p.46; 89,p .134]. Refer to Figure 39 for the
strengthening effects o f various alloying elements.
50
R eproduced with perm ission of the copyright owner. Further reproduction prohibited without perm ission.

w»ao
40 10.0
Figure 39: Effect o f alloy additions on the solid solution hardening o f austenite [33,p .16].
The chemistry o f 21-4N provides some microstructural features not found in
typical Cr-Ni steels. While typical austenitic stainless steels can only be work hardened,
this is not true for 21-4N [41,p. 16; 89,p.6]. Due to the high C and N content, 21-4N can
be effectively precipitation hardened after solution heat treating [33,p.28; 41,p.254], The
precipitation occurs either by aging at 700-1038°C or by control cooling from the
solution heat treating temperature (~ 1200°C) [33,p.28; 79; 90-92].
In manganese austenitic steel with 0.4% C and 0.2-0.45% N the precipitates are
either lamellar nodules formed on the grain boundaries or general Widmanstatten type
precipitates [33, p.28]. The grain boundary precipitates are M23C6 carbides or CT2N
nitrides. These precipitates on grain boundaries are also reported for 21-4N with 0.23-
0.55% C and 0.40-0.60% N [79; 90-93], The grain boundary precipitation is referred to
as the Grain Boundary Reaction (GBR). The GBR contains nodules o f rod-like M23C6
carbides, G 2N nitrides and coarse M23C6 carbides form on the grain boundaries as well
[79; 90]. Refer to Figure 40 for micrographs o f the GBR.
51
R eproduced with perm ission of the copyright owner. Further reproduction prohibited without perm ission.
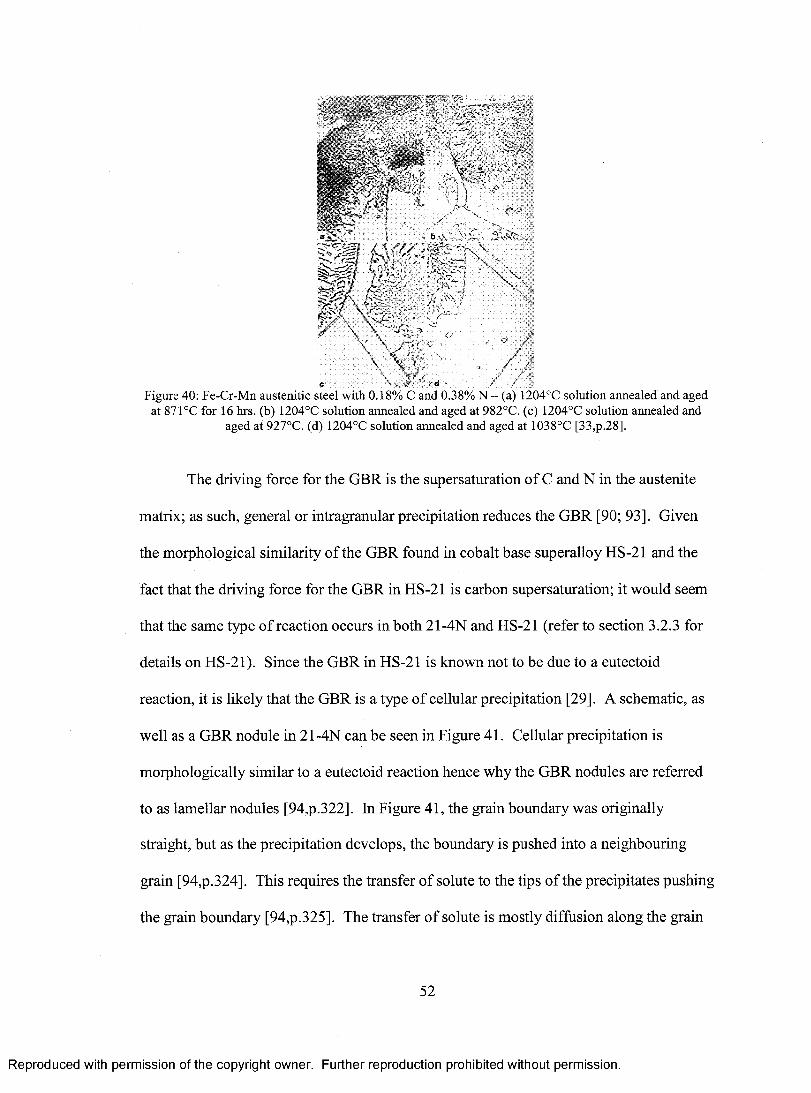
s % -i A / Sto - > # ; -d /Figure 40: Fe-Cr-Mn austenitic steel with 0.18% C and 0.38% N - (a) 1204°C solution annealed and aged
at 871°C for 16 hrs. (b) 1204°C solution annealed and aged at 982°C. (c) 1204°C solution annealed and aged at 927°C. (d) 1204°C solution annealed and aged at 1038°C [33,p.28].
The driving force for the GBR is the supersaturation o f C and N in the austenite
matrix; as such, general or intragranular precipitation reduces the GBR [90; 93]. Given
the morphological similarity o f the GBR found in cobalt base superalloy HS-21 and the
fact that the driving force for the GBR in HS-21 is carbon supersaturation; it would seem
that the same type of reaction occurs in both 21-4N and HS-21 (refer to section 3.2.3 for
details on HS-21). Since the GBR in HS-21 is known not to be due to a eutectoid
reaction, it is likely that the GBR is a type o f cellular precipitation [29]. A schematic, as
well as a GBR nodule in 21-4N can be seen in Figure 41. Cellular precipitation is
morphologically similar to a eutectoid reaction hence why the GBR nodules are referred
to as lamellar nodules [94,p.322], In Figure 41, the grain boundary was originally
straight, but as the precipitation develops, the boundary is pushed into a neighbouring
grain [94,p.324], This requires the transfer o f solute to the tips o f the precipitates pushing
the grain boundary [94,p .325]. The transfer o f solute is mostly diffusion along the grain
52
R eproduced with perm ission of the copyright owner. Further reproduction prohibited without perm ission.

boundary, though at higher temperatures diffusion within the matrix may contribute more
[94,p.325]. This cellular precipitation thus creates a ‘wavy’ or serrated grain boundary in
Figure 41: A) Schematic diagram showing sequence o f development o f cellular precipitation [94,p,324], B)Grain boundary reaction nodule in 21-4N.
A study on the effects o f alloying additions on the GBR in an alloy of base
composition similar to 21-4N, finds that the N content is essential [93]. Less than 0.1
wt% N produces no GBR, regardless the C content. Conversely, with more than 0.5 wt%
N there is always GBR, even with very small C contents. The effect o f varying the N to
C ratio is also examined with steels with a total of ~ 0.9 wt % C and N. As the N content
is increased, the amount o f GBR increases while intragranular precipitation is suppressed.
Increased C content has the opposite effect. In general, increasing the C and N content
increases the GBR but N is noted to be more effective.
A host o f other alloying additions are examined in the same study, including Nb,
Mo, W, Mn, Cu and B [93], Niobium, molybdenum and tungsten have the same effect
on the GBR; that is that they substantially suppress the reaction and encourage
intragranular precipitation. To achieve this effect, approximately 0.5 wt% Nb can be
used or 1 wt% of Mo or W. As for the Mn and Cu, both raise the solubility o f C and N
HS-21 and 21-4N.
53
R eproduced with perm ission of the copyright owner. Further reproduction prohibited without perm ission.

thereby suppressing the GBR. Roughly 13 wt% Mn or 0.5 wt% Cu is needed to do so.
And finally small additions o f B are effective in suppressing the GBR.
As was explained in section 3, the GBR is one source o f grain boundary serrations
in 21-4N. The amount of the grain boundary reaction also has an effect on the material
properties and should be controlled accordingly.
5.1.2 Effects of the Grain Boundary Reaction
While the GBR is a source o f grain boundary serrations in 21-4N, too much o f the
GBR will have a negative effect on the material properties. Approximately 8 % GBR is
needed to sufficiently serrate the grain boundaries [79-80]. Conveniently, around 8-10%
GBR is the optimum amount for substantially improving the creep rupture strength and
imparting good ductility [91; 95-96]. Similarly, the fatigue strength can also be improved
the most with approximately 8 % GBR [79-80].
Referring to Figure 42, beyond 8-10% GBR, at room temperature there is little
effect on the tensile strength o f 21-4N until more than 60% GBR is present; at which
point the strength decreases considerably [96]. There is also a steady decrease in the
0.2% proof stress with increasing amounts of GBR. The effect o f the GBR on the tensile
strength as well as other properties is seen at various temperatures. There is a notable
increase in ductility at higher temperatures.
54
R eproduced with perm ission of the copyright owner. Further reproduction prohibited without perm ission.

.....—j—.— J —,_. . 0 20 4 0 » « 0 t ® 0 20 40 40 60100Amount cr S6K % Amount 3* Gfiti *h
Figure 42: Effect o f the grain boimdary reaction on material properties [96],
Referring to Figure 43, the effect o f the GBR reaction on high temperature
properties also extends to creep ductility and the minimum creep rate. Both increase with
rising amounts o f the GBR reaching a maximum around 30% GBR [91]. The positive
effects o f -10% GBR can be seen in figure 43 especially in increasing rupture time and
elongation. Another more interesting trend is the way the minimum creep rate decreases
at -10% GBR with increasing temperature.
55
R eproduced with perm ission of the copyright owner. Further reproduction prohibited without perm ission.

1000
40wo
so
22 40 m m »03oAm cure oi 15BR ffij
7CKPC
m
Nixnoivatfi 120-30): stress (kgi'mmf!
2 0 40 SO 80 1000
I
f£
O
I 10*X
Amourf, of tiBff (%j0 20 40 60 80 100
Amoyro r,1 fjBK (*HJ
Figure 43: Effect o f the grain boundary reaction on rupture time, elongation and minimum creep rate [91].
56
R eproduced with perm ission of the copyright owner. Further reproduction prohibited without perm ission.

The amount of GBR reaction also has an effect on the shape o f the creep curve, as
seen in figure 44. The negative effect o f excessive amounts o f GBR on creep rupture
time is clear.
*> sS
Figure 44: Effect o f the grain boundary reaction on creep curve shape [91].
The negative effects o f excess GBR can be linked to the GBR nodules. While
larger GBR area percentage creates larger grain boundary serrations, it also means larger
GBR nodules [79], In fatigue testing o f samples with 8 % and 15% GBR, the larger
nodules in the 15% GBR samples were frequently found to fracture perpendicular to the
loading direction [80]. Cracks were also found to have originated within the GBR
nodules o f the 15% GBR samples [79]. No fractures were found to have initiated in the
GBR nodules o f the 8 % GBR samples [79-80].
Theoretical work on the deformation and fracture o f 21-4N with GBR nodules
presents similar conclusions [92; 96]. Room temperature tensile tests have shown a
decrease in ductility with GBR levels above 10%, which can be seen in figure 42 [92;
96]. This decrease in ductility is from the fracture o f rod-like precipitates in the GBR
nodules [92; 96], which is believed to occur as follows:
1) Microcracks form due to fracture o f rod-like precipitates in GBR nodules.
57
R eproduced with perm ission of the copyright owner. Further reproduction prohibited without perm ission.

2) Voids form from microcracks and link together to fracture entire GBR
nodules.
3) Rupture of specimen from propagation o f cracks from GBR nodules to
bordering grains [92].
This process can be seen schematically in Figure 45, and is due to tensile stresses
applied to the rod-like precipitates. It was also concluded that with less than 10% GBR,
this type o f fracture has almost no effect on the strength and ductility o f 21-4N [92].
t tCT
f t t
<©•<©• •
4 a 4
Figure 45: Room temperature fracture o f 21-4N with grain boundary reaction nodules [92].
At higher temperatures, it is theorized that cracks form at the interfaces o f GBR
nodules [96]. This is believed to be from a difference in plastic strain between the GBR
nodules and matrix, due to a lack o f deformation o f the rod-like precipitates in the GBR
nodules [96].
As stated before, the required amount o f GBR to sufficiently serrate the grain
boundaries is also the amount for greatest improvement to creep rupture strength. It is
also clear that at 8-10% GBR, the GBR nodules are not a noticeable source o f cracks
which would negatively impact the material properties. Figure 42 also shows that at
those levels o f GBR, there is little effect on the tensile strength and proof stress. The
same can be seen at higher temperatures in Figure 42. Thus the improvements to the
58
R eproduced with perm ission of the copyright owner. Further reproduction prohibited without perm ission.

creep properties seen in Figures 43 and 44 can be reasonably assumed to be due to the
grain boundary serrations and not to some influence by the GBR at the modest amounts
o f 8-10%. Due to the GBR, there may in fact be a minor decrease in creep properties
since the interstitial C and N contents would be reduced; though the grain boundary
serrations likely more than make up for this. The improvement to creep properties solely
from the grain boundary serrations unfortunately cannot be investigated since the GBR
always occurs when grain boundary serrations form in 21-4N.
5.1.3 Typical Properties and Applications
As an austenitic stainless steel, 21-4N can be used in high temperature
applications where it has good strength and oxidation resistance [33,p.6 8 ;
89,p.505,p.520]. It is also a stable austenitic steel, which retains its hot hardness after
sustained exposure at high temperatures [33,p.68], As such, its primary application is as
automotive valve steel (Figure 46), though other uses are plates in hot-press forming of
titanium and other high temperature materials [33,p.69].
The requirements for automotive valve steel are substantial, including creep and
fatigue resistance, abrasion and galling resistance, tight dimensional tolerances and
possibly accepting surface coatings [41,p,254], Even with operating temperatures of
800°C occurring, the mechanical properties o f 21-4N are stable at those temperatures
[41,p.254], Also o f interest is that engine operating temperature is similar to the aging
temperature for 21-4N, resulting in hardening when the engine is operated for the first
time [41,p.254]. Refer to Appendix A for some typical physical properties o f 21-4N.
59
R eproduced with perm ission of the copyright owner. Further reproduction prohibited without perm ission.

Figure 46: Engine valve [97].
5.2 Test Material
The material used for testing is provided as hot rolled bar stock o f 7/8” diameter.
Figure 47 shows the as received bar stock. Sample slugs o f ~ 4” length are cut from the
bar stock before heat treatment.
Figure 47: As received 21-4N bar stock and sample slug.
Small discs were also cut from the bar stock to discover effects o f the heat
treatments on the material (refer to sections 6 and 7 for further details). The
manufacturer provided composition is shown in Table 3. As well, two pieces from the
ends of the 21-4N bar stock were analyzed by an independent company with a LECO
furnace and optical emission spectroscopy; the results are listed in Table 3. Optical
emission spectroscopy works on the principle that free atoms in energetic environments
60
R eproduced with perm ission of the copyright owner. Further reproduction prohibited without perm ission.

emit light in narrow wavelength intervals which are characteristic o f the atom making
them [98,p.21]. Identification o f an element is done by measuring the line intensities of
the characteristic lines o f that element [98,p.21]. The LECO furnace features a high-
frequency induction furnace and a solid state infrared detector [99].
Table 3: Composition o f 21-4N test material as provided by manufacturer and from independent tests.
Manufacturer Specified Tested Sample 1 Tested Sample 2c 0.530 0.49 0.55Cr 20.774 20.64 20.61Mn 8.185 8.33 8.34N - 0.39 0.39Ni 3.472 3.35 3.35Si 0.179 0.19 0.18P 0.041 0.030 0.029S 0.001 <0.001 0.001V 0.089 - -
w 0.029 - -
Mo 0.246 0.25 0.25Co 0.035 - -
Cu 0.206 - -
At 0.013 - -
Ti 0.002 -
Nb 0.020 - -
Ta 0.003 - -
Sn 0.008 - -
The results in Table 3 show that the C and N content is suitably high to allow for
the occurrence o f the grain boundary reaction. The manufacturer’s specified composition
is also sufficiently accurate, though the omission of the N content is perplexing.
A small disc of the 21-4N bar stock was also polished and etched; refer to Figure
48 for micrographs o f the as received microstructure. The grain size is approximately
5 pm.
61
R eproduced with perm ission of the copyright owner. Further reproduction prohibited without perm ission.
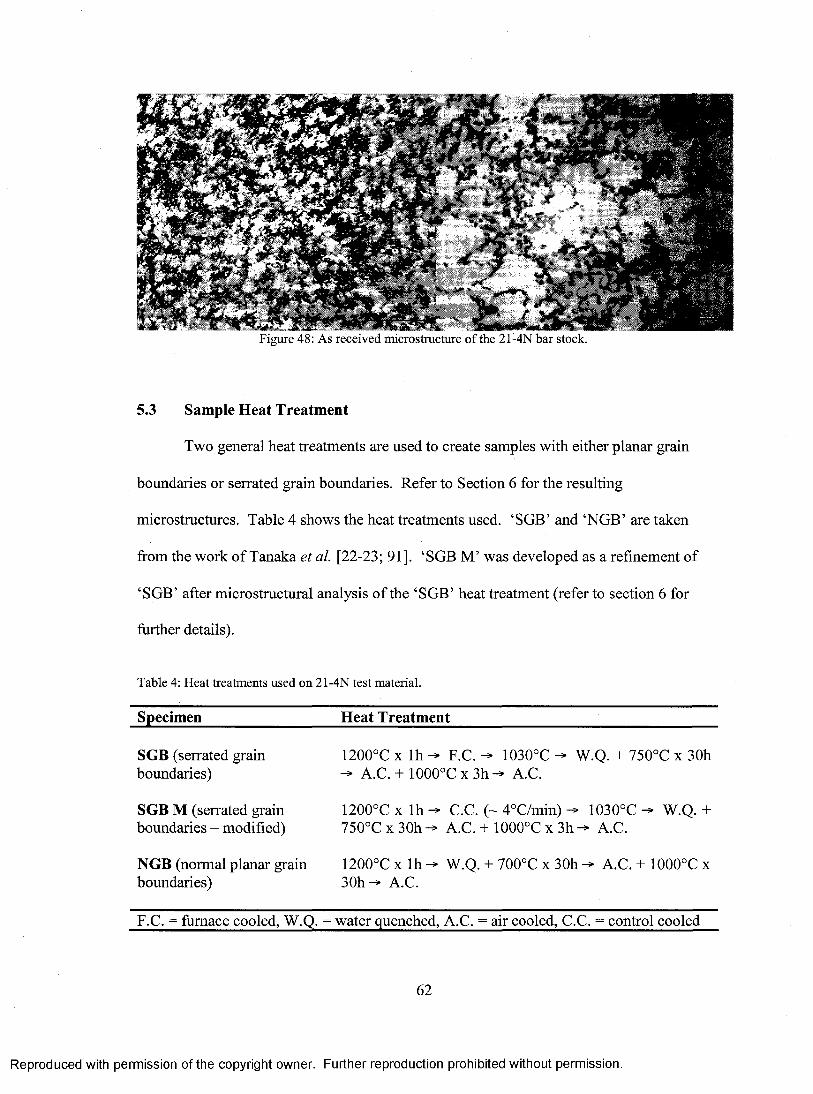
Figure 48: As received microstructure o f the 21-4N bar stock.
5.3 Sample Heat Treatment
Two general heat treatments are used to create samples with either planar grain
boundaries or serrated grain boundaries. Refer to Section 6 for the resulting
microstructures. Table 4 shows the heat treatments used. ‘SGB’ and ‘NGB’ are taken
from the work of Tanaka et al. [22-23; 91]. ‘SGB M ’ was developed as a refinement of
‘SGB’ after microstructural analysis o f the ‘SGB’ heat treatment (refer to section 6 for
further details).
Table 4: Heat treatments used on 21-4N test material.
Specimen Heat Treatment
SGB (serrated grain boundaries)
1200°C x lh ^ F.C. -* 1030°C -* W.Q. + 750°C x 30h A.C. + 1000°Cx3h-> A.C.
SGB M (serrated grain boundaries - modified)
1200°C x lh C.C. (~ 4°C/min) -* 1030°C -*» W.Q. + 750°C x 30h-> A.C. + 1 0 0 0 °C x 3 h ^ A.C.
NGB (normal planar grain boundaries)
1200°C x lh —> W.Q. + 700°C x 30h A.C. + 1000°C x 30h -» A.C.
F.C. = furnace cooled, W.Q. = water quenched, A.C. = air cooled, C.C. = control cooled
62
R eproduced with perm ission of the copyright owner. Further reproduction prohibited without perm ission.

The heat treatments are performed in a Lindberg furnace (type 51442) with a
rated maximum temperature o f 1200°C. A Lindberg/Blue furnace controller is used
(model CC58114PC-1) with a Yokogawa UP150 programmable temperature controller.
An Omega Type K thermocouple is also used (part # XCIB-K-2-2-3).
Two sample slugs are always heat treated simultaneously. Referring to Figure 49,
it can be seen that the control thermocouple is inserted through the door o f the furnace.
The thermocouple is always located in between the two sample slugs and at their mid
section. The position o f the thermocouple is always established with the samples in
place, before the furnace is brought up to temperature. Although the opening and closing
o f the furnace to load the sample slugs causes rapid temperature changes for the
thermocouple, it is necessary to ensure the best possible temperature control at the sample
slug mid sections.
Figure 49: A - Lindberg furnace, B - Lindberg/Blue furnace controller, C - Yokogawa program temperature controller, D - Omega Type K thermocouple.
The quick loading o f the sample slugs is also very important in the heat treating
procedure, though it is only possible to load one sample at a time. As such, there is
always an unavoidable temperature drop in the furnace. The temperature drop is always
most severe for the initial part o f the heat treatments at 1200°C. Therefore, an extra five
63
R eproduced with perm ission of the copyright owner. Further reproduction prohibited without perm ission.

minutes is added to the heat treatment to allow the furnace to return to and stabilize at the
required 1200°C.
The furnace cooling in the ‘SGB’ heat treatment is done by shutting off the
furnace controller after one hour and reconnecting the thermocouple to an Omega DP462
digital panel thermometer. The temperature is then monitored until it drops to 1030°C at
which point the samples are withdrawn and placed into a bucket o f cold tap water for
quenching. The control cooling in the ‘SGB M ’ heat treatment is done by using the
programming functions o f the Yokogawa programmable temperature controller. The
programmed heat treatment also feature an extra five minutes to allow the furnace to
stabilize at 1200°C after sample slug loading. Again, the sample slugs are removed and
water quenched once they have reached 1030°C. The air cooling is also straight forward,
with the sample slugs being removed from the furnace and placed on separate ceramic
bricks.
As mentioned in section 5.2, small discs are heat treated to investigate the effects
o f the heat treatments on the material microstructure. These discs are easier to heat treat
by virtue o f being able to load several at a time, thereby reducing the temperature drop in
the furnace.
5.4 Metallographic Preparation
Sample slugs and small discs for microstructural analysis are cut from the 7/8”
bar stock using an abrasive cutter. Tested creep samples are sectioned on a precision saw
using an abrasive disc for rough cuts and a wafering blade for actual longitudinal
sectioning.
64
R eproduced with perm ission of the copyright owner. Further reproduction prohibited without perm ission.

Mounted in bakelite, the metallographic samples are ground on 240, 320,400 and
600 grit emery cloths. They are then polished using 6 and 1 micron diamond polishing
compounds on suitable polishing cloths. The polishing is finished using 0.3 micron alpha
alumina on microcloth.
After both grinding and polishing, the samples are carefully rinsed and cleaned
using dish soap. They are then cleaned ultrasonically in a mixture o f distilled water and
acetone. Finally they are rinsed with water, methanol and acetone before being blown
dry and stored in plastic containers.
The next step is etching, which is done in a mixture of equal parts o f HNO3, HC1
and distilled water. The etchant is always prepared fresh in 120mL batches which allows
4-5 samples to be etched. After initial mixing, the etchant is cooled to approximately
20°C and then stirred continuously as the samples were being etched. Each sample is
etched for ~35 seconds, after which it is immediately dipped in distilled water and then
rinsed under running water before being blown dry. For more details please refer to
Appendix B.
5.5 Creep Testing Procedure
Creep tests are carried out using ASTM E 139-00 [100] and the ASM 10th
Edition, Volume 8 : Mechanical Testing Handbook [101] as guidelines. Creep samples
are machined from the 21-4N sample slugs according to figure 50.
65
R eproduced with perm ission of the copyright owner. Further reproduction prohibited without perm ission.

Vi - 20 nBOTH ENDS 0.050 ±0.005
0.250 DIA. / 0.400 DIARJS/ ± 0.002
NOTCH ANGLE 115
DEPTH 0.010
NOTCH DETAIL NOT TO SCALE
Figure 50: Creep sample geometry.
NOTE:
1. TAPER TOWARD CENTRE OF TEST SECTION, DIAMETER AT CENTRE TO BF. 0.001 LESS THAN AT ENDS
2. TEST SECTION SURFACE TO BE FREE OF SCRATCHES AND FRIT. OF UNDERCUT AT FILLET ENDS
The creep tests are run on Satec M3 constant load creep rupture test frames.
Solartron Metrology Linear Variable Differential Transformers (LVDTs) (part #
AX/1.5/S - 20119) with OD5 conditioning modules are used on Satec single (RT-214)
and dual (DA-214) LVDT extensometers to measure the sample strain. Extensometers
are attached to grooves machined in the specimen shoulders (refer to Figure 50). In the
case of the dual LVDT extensometer, the actual creep strain is the average o f the readings
given by the two LVDTs.
Creep sample temperature is monitored using two Omega Type K thermocouples
attached to the sample surface. The temperature is displayed on an Omega DP462 digital
panel thermometer. The furnace is controlled with a Leeds & Northrup unit. Reference
can be made to Appendix C for full details o f the testing procedure; however a general
overview is given below.
66
R eproduced with perm ission of the copyright owner. Further reproduction prohibited without perm ission.

Figure 51: A - Creep rupture frame, B - Leeds & Northrup furnace control unit, C - Omega DP462 digital panel thermometer, D - Solartron Metrology OD5 conditioning module, E - Satec RT-214
single LVDT extensometer, F - Extensometer micrometer, G - Solartron Metrology LVDT.
The LVDT is calibrated before every test using the micrometers mounted on the
extensometer. The calibration gives the voltage signal o f the LVDT when it is fully
uncompressed (i.e. when the sample fails or creeps past the range o f the LVDT) which is
used to stop the data acquisition system. Also, the average change in voltage per unit
length is calculated from the calibration, which is required to produce creep curves. Next
the creep sample is measured and the gauge length and load needed are calculated. The
gauge length is entered into the data acquisition system so that it can display the creep
curves o f running tests.
67
R eproduced with perm ission of the copyright owner. Further reproduction prohibited without perm ission.

The creep sample is then installed into the extensometer with all threaded
connections being coated with boron nitride. The thermocouples are attached to the
sample with thermocouple wire at the top and bottom o f the gauge length. The sample
and extensometer assembly are installed into the creep rupture frame with pull rods. The
creep rupture frame furnace is closed and the ends are sealed with ceramic insulation.
The creep rupture frame furnace is brought up to testing temperature while
monitoring the temperature across the creep sample gauge length. The temperature is
never allowed to exceed the test temperature for any reason and was maintained within ±
1°C during the test duration. The temperature difference between the two thermocouples
on the gauge length is also maintained well below 1°C, typically less than 0.5°C. This is
possible since the furnace has three zones, each of which are independently controlled.
After test completion, the furnace is allowed to cool fully to room temperature before
removing the sample and extensometer assembly.
Once the creep sample is steady at the test temperature, the load train is connected
to the creep sample. The load is not applied and slack is maintained in the assembly,
while the LVDT is installed into its mounting point on the extensometer. Then the
LVDT is compressed as much as possible using the micrometer on the extensometer
while keeping the LVDT in its linear range o f operation (i.e. in its range o f motion where
the voltage change is related to the distance traveled through a linear relationship).
Extreme care has to be taken to ensure the LVDT is not overly compressed before
applying the test load and starting the test.
The data acquisition system is also prepared for the start o f testing. Once it is
prepared, as much slack as possible is removed from the load train assembly while
68
R eproduced with perm ission of the copyright owner. Further reproduction prohibited without perm ission.

monitoring the LVDT voltage signals to avoid straining the creep sample before the data
acquisition is actually started. Typically, the point at which the test is ready to start is
when the bottom portion o f the load train is taught enough that it can not be easily moved
by hand. At this point, the data acquisition system is started and the load is applied to the
creep sample. Once started, the creep test is fully autonomous, with only observation o f
the creep curve and temperature across the creep sample surface. Minor corrections are
made at times to the furnace in order to correct for discrepancies in the creep sample
temperature due to changes in the test room. These corrections are infrequent and usually
occur during significant shifts in the local weather.
5.5.1 Increasing Load Testing
This testing was just a modification o f the constant load creep testing described in
section 5.5. The goal o f this testing was to find the strain rates at various loads while
only testing one creep sample. This would greatly reduce the amount o f testing required
for the same amount o f data. Thus the increasing load test involved several loads at a
constant temperature. Before the test was started the loads that were desired were
calculated and prepared. The initial load applied at the start was done just like a constant
load test. Then using the creep curve being generated by the data acquisition system, the
next load was applied once a roughly constant creep rate was achieved. The extra load
had to be carefully added to the load train to avoid disturbing the test, beyond the
increase in stress on the sample. Again, a roughly constant creep rate is allowed to occur
before the next load was applied. This was continued until all the loads were applied or
once the creep sample failed.
69
R eproduced with perm ission of the copyright owner. Further reproduction prohibited without perm ission.

5.6 Data Acquisition
Strain data is collected from the extensometer mounted LVDTs with a National
Instruments (NI) USB-6008 Multifunction I/O data acquisition system (DAQ). The DAQ
is connected via USB port to a PC laptop on which a LabView programmed user
interface is operating. Refer to figures 52 and 53.
A
Figure 52: A - National Instruments USB data acquisition system, B - signal lines from LVDT conditioning modules, C - U SB connection to PC laptop.
«mk
LVDT calibration values
* **!*““ flBvi
DAQ LVDT ^ channel selection kA.j ;r- j
S i.n°i V
Data sampling interval and frequency
Continuously updated creep curve
Test sam ple.-i information
imiH -*■ LVDT signal output
* ***** * * '' ft*m*21 ■ 35KL»
l a -■1
r-o—Figure 53: LabView data acquisition user interface.
With the NI DAQ, the LabView software data acquisition is capable o f collecting
data from multiple tests simultaneously, including tests using a dual LVDT extensometer.
70
R eproduced with perm ission of the copyright owner. Further reproduction prohibited without perm ission.

In the case o f the dual LVDT, the LabView user interface displays the strain from each
LVDT on the same plot o f strain vs time.
The LVDT calibration data is input into the LabView user interface as well as the
calculated gauge length o f the creep samples. As well, intervals o f time with specific
strain sampling rates are input. Thus, the strain transient at the beginning of each test can
be collected at a very high sampling rate for greater accuracy followed by a slower
sampling rate once the creep curve enters the secondary and tertiary stages.
The data recorded for each tested sample includes the test time, voltage signal of
LVDT, displacement o f LVDT and strain o f sample. As well, details about the sample
and test conditions are also recorded. For further details, please see Appendix D.
5.7 Metallographic Analysis
Specimens for metallographic analysis are observed using an Olympus PME 3
optical microscope. Digital images are taken using Clemex Vision Lite image analysis
software with a Clemex L 1.3M general purpose camera mounted on the PME 3
microscope.
Apart from taking micrographs, the Clemex software is used to analyze grain
boundary reaction (GBR) area fractions and the grain size. In both cases the process is
partially automated except for user intervention to correct for such things as incorrectly
identified GBR and removal and/or addition of grain boundaries. For both analyses,
roughly 30 images are used per metallographic specimen. The GBR results are given as
an area percentage and the grain size was found from the average o f the mean vertical
and horizontal grain lengths measured.
71
R eproduced with perm ission of the copyright owner. Further reproduction prohibited without perm ission.

Some metallographic specimens have the grain size manually calculated from
printed micrographs, again by measuring horizontal and vertical grain lengths from a
series o f lines and averaging the result. ASTM E 112-88 [102] is used as a guideline for
both the software and manual grain size analyses.
5.8 Creep Data Analysis
Analysis o f the creep data was performed on the constant load and increasing load
test results. Strain rates were calculated from the increasing load test results by fitting
straight lines to the regions o f roughly constant strain rate. The constant load creep
curves were modeled using the 0-Projection method [3]. The 0-Projection method was
only used to model the creep curves and not to infer or extract any meaning about the
physical processes occurring during creep. The basic equation used to model creep
behaviour is given below and is also known as the 4-0 method due to the fact that it has
four coefficients.
Here s is the uniaxial true strain and t is time. The equation is based on common
characteristics o f creep curves which can be seen in Figure 54.
(9)
72
R eproduced with perm ission of the copyright owner. Further reproduction prohibited without perm ission.

tc3jWaOrCU P
Figure 54: The 0 Projection method treats the creep curve as decaying primary and accelerating tertiarysections [3],
If a creep curve can be accurately modeled using equation (9), then calculating the
creep rate as well as creating strain vs. strain rate plots becomes a simple matter of
differentiating equation (9) with respect to time. An issue with the 4-6 method is that it
often does not accurately model the creep curve at low strains [103]. To account for this
issue, the 6-6 method involves six coefficients and can be seen in equation ( 10).
8 = 0 i ( l - e 02t) + 0 3(e 0 4 t - l) + 0 5( i - e 06t) ^
The 6-6 method is based on a general model function [103]:
8 = r | ( e ) = ^ 0 2i - i ( l - e 02‘)
i=1 - (11)
It is believed that any experimental creep curve can be modeled by just increasing the
number o f terms; there being no theoretical limit to q [103], Thus, the general form of
the 6 Projection method is used to model the constant load creep curves.
Although the 6 Projection method should be used for uniaxial true strain from
tests done at constant stress and constant temperature [104], the tests carried out on the
21-4N were done in constant load creep rupture frames. To conform better to the method
73
a) primary s tage hi tertiary stage
Lp=e1t 1 - e '0 ft l t , * e , t e 4d „ n
— f
t , quantifiesthe total primary straw
y—rTracture
/ *j determines < th e curvature
determines the curvature / of tertiary creep /
/(»3 scales the tertiary
at primary creep 1 creep sir am t
R eproduced with perm ission of the copyright owner. Further reproduction prohibited without perm ission.

requirements, the true strain is calculated from the engineering strain measured during
testing using equation (12), where e is the engineering strain.
s = ln(i + e) ...................................................................... ( 12)
Using an ‘NGB’ sample that was tested at 27.4MPa and 900°C as an example, refer to
figure 55 for a comparison of the calculated true strain and measured engineering strain.
0.09Engineering Strain True Strain0.08
0.07
0.06
c 0.05
M 0.04
0.03
0.02
0.01
1000 Time in hours
1500 2000 2500500
Figure 55: Comparison o f measured engineering strain and calculated true strain.
The difference between the strains only becomes pronounced at higher strain
levels. However this difference has little effect on the data analysis as the data is
truncated to simplify the modeling process. This allows for greater accuracy in modeling
the primary sections o f the creep curves which are of greater concern than the tertiary
sections. In each case, it is ensured that the truncation is done after the minimum creep
rate occurred. Figure 56 shows how the data is truncated for this example creep data.
Referring to Figure 55 it is seen that the difference between engineering and true strain is
negligible for the truncated data set.
74
R eproduced with perm ission of the copyright owner. Further reproduction prohibited without perm ission.

0.09 True Strain Full Data
True Strain Truncated Data0.08
0.07
0.06
c 0.05£5CO 0.04
0.03
0.02
0.01
20001000 Time in hours
1500500
Figure 56: Truncated data overlaid on full true strain data for ‘N G B ’ sample tested at 27.4MPa and 900°C.
After the data is suitably truncated, a non-linear least squares solving algorithm is
applied to solve for the 0 Projection coefficients. This is in line with other research [103;
105]. For the current example, an 18-0 fit is best to describe the truncated data. The
curve fit equation is o f the form given in equation (13).
s = G ^l - e_02t ) + 0 3(e 04t - l) + 0 5( l - e_06t ) + .... + 0 i 7( l - e_ 0 ‘8t) (13)
0.025 Truncated True Strain Data 18 Theta Curve Fit
0.02
0.015
(00.01
0.005
1000 1200400 800200 600 Time in hours
Figure 57: Comparison o f actual data to 8 Projection method curve fit.
75
R eproduced with perm ission of the copyright owner. Further reproduction prohibited without perm ission.

In each case o f curve fitting, multiple equations o f fit are attempted. The errors of
these attempts can be seen in figure 58 for the current example.
x 10
4 -
12 Theta Error — 16 Theta Error — 18 Theta Error— 20 Theta Error— 22 Theta Error
5 -10
-12200 400 600
Time in hours800 1000 1200
Figure 58: Difference in strain between 0 fit equations and actual data.
Each sample’s creep curve is modeled similarly, with at times several excellent 9
Projection fits achieved. The minimum creep rates calculated from the 9 fit equations are
relatively consistent with at most 5% variation, but the time to minimum creep rate varied
significantly. Thus the 9 Projection results are used only to provide more accurate
minimum creep rate data from the constant load test results. Refer to Appendix E for
details on the individual 9 Projection curve fits.
76
R eproduced with perm ission of the copyright owner. Further reproduction prohibited without perm ission.

6 Results
6.1 Heat Treated Microstructures
6.1.1 ‘NGB’ Microstructure
As outlined in Section 5, three heat treatments were applied to the 21-4N test
material. The first is the ‘NGB’ heat treatment which produces planar or normal grain
boundaries. Figure 59, shows the microstructures after each step o f the ‘NGB’ heat
treatment. The first step o f the heat treatment increases the grain size to ~110/im and
results in precipitate free grain interiors. The second step causes a large amount of
precipitation at the grain boundaries and in the grain interiors, mostly adjacent to the
grain boundaries. The final step of the heat treatment causes a more even distribution of
precipitates, though there are still some concentrations next to grain boundaries.
Referring to Figure 60, there is a marked change in the grain boundary structure
between the second and final steps o f the heat treatment. After the final step, there are
some coarse carbides visible and almost negligible regions free o f precipitates; likely due
to the growth o f the coarser carbides. The precipitate distribution also appears to be more
even after the final step o f the heat treatment. The carbides are not continuous in the
fully heat treated microstructure.
77
R eproduced with perm ission of the copyright owner. Further reproduction prohibited without perm ission.

Step I: ]200°C x 111 — W.Q.
Step 2: I200°C x lh — W .Q . + 700°C x 30hA.C.
Step 3: 1200°C x lh — W .Q . + 700°C x 30h —A.C. i 1000*0 x 30h A.C.
Figure 59: Microstructural evolution during the ‘N G B’ heat treatment.
‘NGB' Step 2 ‘NGB’ Step 3 - Fully Heat TreatedFigure 60: Grain boundaries o f partially and fully heat treated ‘N G B ’ microstructure.
78
R eproduced with perm ission of the copyright owner. Further reproduction prohibited without perm ission.

6.1.2 ‘SGB’ & ‘SGB M’ Microstructures
‘SGB’ is the second heat treatment and produces serrated grain boundaries as well
as Grain Boundary Reaction (GBR) nodules, as seen in Figure 61. The first step o f the
heat treatment increases the grain size to ~94/un, precipitates GBR nodules but leaves the
grain interiors free o f precipitates. The second step causes a large amount of
precipitation at the grain boundaries, notably adjacent to the GBR nodules. There remain
areas within the grain interiors free o f precipitates. The final step o f the heat treatment
creates a more balanced distribution of precipitates though the microstructure is not
nearly as uniform as the ‘NGB’ one. There still remain dense precipitates adjacent to the
GBR nodules and some grain interiors have very sparse precipitates.
Referring to Figure 62, there is not a large difference in the grain boundary
structure between the second and final steps o f the heat treatment. The grain boundaries
have coarse carbides o f a more planar nature than the ‘NGB’ microstructure, though they
follow the serrations o f the grain boundaries. In some places, the carbides are nearly
continuous. While the precipitates have been partially redistributed into the grain
interiors, there remain dense precipitates adjacent to the GBR nodules. Compared to the
‘NGB’ microstructure, there are larger zones on either side of the grain boundaries free of
precipitates, again likely due to the coarser grain boundary carbides.
79
R eproduced with perm ission of the copyright owner. Further reproduction prohibited without perm ission.

GBR Nodules
Step 3: I SOOT x lh — F.C. 1030T — W.Q. +750°C x 30h . A .C. - lOOOT x 3h » A .C .
Figure 61: Microstructural evolution during the ‘SGB’ heat treatment.
•SGB1 Step 2 SGB’ Step 3 - Fully Heat TreatedFigure 62: Grain boundaries o f partially and fully heat treated ‘SG B’ microstructure.
80
R eproduced with perm ission of the copyright owner. Further reproduction prohibited without perm ission.

The ‘SGB’ heat treatment produces ~ 16% area fraction o f GBR. This is an
excessive amount, which as explained in Section 5, can have a negative impact on the
creep properties. A new heat treatment was sought to produce serrated grain boundaries
while controlling the amount o f GBR closer to the ideal o f 8-10% area fraction.
The effect of varying the cooling rate after the solutionizing treatment was
studied. Referring to Figure 63, the 6 °C/min cooling rate corresponds to the furnace
cooling used in the ‘SGB’ heat treatment. Figure 64 visually shows the effect o f the
cooling rate on the amount o f GBR precipitated. From the results shown in Figure 63, a
cooling rate o f 4°C/min was chosen to produce ~ 10% area fraction GBR. The new heat
treatment was designated ‘SGB M ’ and is identical to the ‘SGB’ heat treatment, except
for the cooling rate in the first step.
Referring to Figure 65, the only difference between the ‘SGB’ and ‘SGB M ’
microstructures is the area fraction o f GBR nodules. The grain size o f the ‘SGB M ’
microstructure is virtually identical to that o f the ‘SGB’ at ~ 90/xm. Due to the reduced
amount o f GBR in the ‘SGB M ’ microstructure, it can be considered to be a more
uniform microstructure than the ‘SGB’ one, though again it is not nearly as uniform as
the ‘NGB’ microstructure.
81
R eproduced with perm ission of the copyright owner. Further reproduction prohibited without perm ission.

20.00
£< 10.00amCD
5.00
o.oo 40 2 4 6 8
Cooling Rate (°C/min)
Figure 63: Effect o f cooling rate on amount o f GBR precipitated after solutionizing at 1200°C for 1 hour, followed by cooling to 1030°C and water quenching.
'- U *
6°0/min cooling rate (-16% GBR)
, ^ / ■ ' \ & •
4®C/min cooling rate ("10% GBR)
v*i s
S,a - ■
. firnM*’.. .
42 0C/min cooling rate ("17% GBR)
Figure 64: Representative micrographs showing effect o f cooling rate on area fraction o f GBR.
82
R eproduced with perm ission of the copyright owner. Further reproduction prohibited without perm ission.

Step 1: 1200*0 x 1 h -» C.C. (4°C/rmn) -> 1030°C W.Q.
Fullv Heat Treated: 1 2 0 0 X x 1h C.C. (46C/min) 1030°C W.Q, + 750aC x 30h A.C.
+ 10Q0°Cx3h ^ A C.Figure 65: Comparison o f ‘SGB M ’
Step 1: 1200°C x 1h F.C. (6°C/min) -> 1030°C W.Q.
Fullv Heat Treated: 1200°C x 1h F.C. {6°C/ min) -» 103Q°C -» W.Q. + 7 5 0 X x 30h ^ A C.
+ 1 0 0 0 X x 3b -¥ A.C.SG B’ heat treated microstructures.
83
R eproduced with perm ission of the copyright owner. Further reproduction prohibited without perm ission.

6.1.3 Microstructure Comparison
Figures 6 6 and 67 show the general microstructures and grain boundaries o f the
three heat treatments for comparative purposes. Each microstructure ended up having a
roughly equal grain size with the ‘NGB’ being ~ 110pm, the ‘SGB’ ~ 94pm and the
‘SGB M ’ ~ 90pm. As was noted earlier, the ‘NGB’ microstructure is more uniform in
nature than the ‘SGB’ or ‘SGB M ’ microstructures (refer to Figure 6 6 ). This non
uniformity o f the ‘SGB’ and ‘SGB M ’ microstructures is unavoidable due to the GBR
being the cause o f the grain boundary serrations.
O f note also are the grain boundaries shown in Figure 67. Apart from the GBR
seen in the ‘SGB’ and ‘SGB M ’ micrographs, the largest difference between the ‘NGB’
and ‘SGB’/ ‘SGB M ’ grain boundaries is the occurrence o f coarse carbides. The ‘NGB’
grain boundaries show few coarse carbides o f mostly globular type. The ‘SGB’ and
‘SGB M ’ grain boundaries however show large amounts o f coarse carbides that are
mainly planar in configuration. They almost appear to be continuous in some areas.
Again it can be noted that there are precipitate free zones in the ‘SGB’ and ‘SGB M ’
microstructures immediately adjacent to the grain boundaries, likely due to the coarse
carbides depleting elements for adjacent precipitates.
84
R eproduced with perm ission of the copyright owner. Further reproduction prohibited without perm ission.

•SGB M’Figure 6 6 : Micrographs o f fully heat treated microstructures.
85
R eproduced with perm ission of the copyright owner. Further reproduction prohibited without perm ission.

Figure 67: Grain boundaries o f fully heat treated microstructures (arrows indicate direction o f grainboundaries).
86
R eproduced with perm ission of the copyright owner. Further reproduction prohibited without perm ission.

6.2 Creep Testing Results
6.2.1 Constant Load Tests
6.2.1.1 700°C and 196MPa
The first creep tests were carried out to fracture at 700°C and 196MPa, Figure 6 8 .
Based on references [22-24] it is an unexpected result that the ‘NGB’ microstructure has
creep performance superior to the ‘SGB’ microstructure and comparable to the ‘SGB M ’
microstructure. Retests were performed to confirm these results. The second ‘SGB’ and
‘NGB’ tests however reaffirmed the original results. Refer to Figure 6 8 for the resulting
creep curves and Table 5 for the strain rate results.
700°C & 196MPa0.18
0.16
0.14
SGB 10.12
SGB MSGB 2-c
5« 0.08
0.06
0.04 NGB 1
0.02 NGB 2
100 200 300 Time in hours
400 500 600 700
Figure 6 8 : Constant load creep curves at 700°C and 196MPa.
87
R eproduced with perm ission of the copyright owner. Further reproduction prohibited without perm ission.

Table 5: Results o f 0-Projection analysis for 700°C and 196MPa (* 0-Projection analysis for SGB 2 produced a poor fit o f the primary stage o f creep).
Sample Minimum Strain Rate (/h)
NGB 1 3.7 xlO '3NGB 2 4.0x1 O'5SGB 1 7.1 xlO"5
SGB 2* 5.8 xlO"5SGB M 5.9 xlO"5
6.2.1.2 900°C and 27.4MPa
The next creep tests carried out were constant load tests at 900°C and 27.4MPa,
Figure 69. One o f the ‘SGB’ samples failed prematurely, requiring a retest o f that
microstructural condition. Given the length o f the 900°C constant load creep tests, and
the repeatability seen in the shorter 700°C tests, it was decided not to retest at 900°C. In
this case, the ‘NGB’ microstructure showed creep properties superior to both the ‘SGB’
and ‘SGB M ’ microstructures. Again, this result is unexpected as according to references
[22-24] the ‘SGB M ’ microstructure should have had a noticeably longer creep rupture
life. Table 6 summarizes the strain rate results.
88
R eproduced with perm ission of the copyright owner. Further reproduction prohibited without perm ission.

0.1
0.09
0.08
0.07
0.06c' I 0.05 m
0.04
0.03
0.02
0.01
00 500 1000 1500 2000
Time in hoursFigure 69: Constant load creep curves at 900°C and 27.4MPa.
Table 6: Results o f ©-Projection analysis for 900°C and 27.4MPa.
Sample Minimum Strain Rate (/h)
NGB 1.0 xlO '5SGB 1.4 xlO '5
SGB Prematurely 1.1 xlO '5FailedSGB M 8.1 xlO '6
6.2.1.3 925°C and 27.4MPa
The final constant load creep tests were carried out at 925°C and 27.4MPa, Figure
70. A similar trend continued with the ‘NGB’ microstructure outperforming the ‘SGB’
microstructure. In this case the ‘NGB’ microstructure had substantially better creep
performance. It was decided not to test the ‘SGB M ’ microstructure due to the extremely
poor performance o f the ‘SGB’ microstructure and partially due to increasing difficulty in
removing tested specimens from the specimen grips after tests o f such long duration and
high temperatures. Table 7 summarizes the strain rate results.
89
900°C & 27.4MPa
Note: tests stopped before fracture
SGB-
SGB M
NGBSGB Prematurely Failed
R eproduced with perm ission of the copyright owner. Further reproduction prohibited without perm ission.

925°C & 27.4MPa0.12
Note: tests stopped before fracture
0.08 SGB
c5 0.06 55
0.04NGB
0.02
200 400 600 Time in hours
800 1000 1200
Figure 70: Constant load creep curves at 925°C and 27.4MPa.
Table 7: Results o f 0-Projection analysis for 925°C and 27.4MPa.
Minimum StrainSample Rate (/h)NGB 8.37 xlO ' 6SGB 4.83 xlO"5
6.2.2 Increasing Load Tests
6.2.2.1 700°C and 183-295MPa
As described in Section 5, increasing load tests were carried out to ascertain the
creep rates o f the different microstructural conditions while saving on the number o f
samples needed and the time to run individual tests. Figure 71 shows the creep curves of
the increasing load tests run at 700°C while Figure 72 has the strain rates plotted against
the stresses. The stress exponents for both the ‘NGB’ and ‘SGB’ microstructures are the
same at 700°C. The stress exponents in Figure 72 were calculated according to equation
(4) in Section 2.
90
R eproduced with perm ission of the copyright owner. Further reproduction prohibited without perm ission.

700°C Increasing Load Tests
Note: tests stopped before fracture0.09
0.08295 MPa
0.07
0.06c£55
0.05
274 MPa0.04 NGB
SGB0.03
0.02
228 MPa0.01 183 MPa
50 100 150Time in hours
Figure 71: Increasing load creep curves at 700°C and 183-295MPa.
700°C10'
NGB n = 8.1-3
SGB n = 8.1
,-410'
183 228 274 295Stress (MPa)
Figure 72: Strain rate vs stress plot from increasing load tests at 700°C and 183-295MPa.
6.2.2.2 900°C and 27.4-65MPa
The next increasing load tests were run at 900°C and two sets o f tests were run on
the ‘NGB’ and ‘SGB’ microstructures. The results can be seen in Figures 73, 74 and 75.
Figure 75 shows that overall the ‘SGB’ microstructure had a higher stress exponent, with
the strain rates only increased in a linear fashion. The ‘NGB’ microstructure had a lower
91
R eproduced with perm ission of the copyright owner. Further reproduction prohibited without perm ission.

stress exponent initially, while there was a noticeable increase as the stress increased.
The stress exponents in Figure 75 were calculated according to equation (4) in Section 2.
900°C Increasing Load Tests0.09
Note: tests stopped before fracture0.08 NGB-
0.07 SGB
64.7MPa0.06
0.05c2u 59.8MPa0.04
49MPa
0.03 54.4MPa
0.02 38.2MPa
0.01
100 150 200 250 300 350 400Time in hours
Figure 73: Increasing load creep curves at 900°C and 27.4-64.7MPa.
Second 900°C Increasing Load Tests0.12
Note: tests stopped before fracture
SGB-
0.08
2 0.06NGB
55MPa0.04
45MPa
0.02 35MPa
65MPa27.4MPa
150 200Time in hours
250 300 350100
Figure 74: Increasing load creep curves at 900°C and 27.4-65MPa.
92
R eproduced with perm ission of the copyright owner. Further reproduction prohibited without perm ission.

900°C
-310 SGB n = 5.7
,-4 NGBn = 9.3
6L 10'
NGB n = 3.7
,•610 '27.4 35 38.2 45 49 55 60 65
Stress (MPa)Figure 75: Strain rate vs stress plot from increasing load tests at 900°C and 27.4-65MPa.
93
R eproduced with perm ission of the copyright owner. Further reproduction prohibited without perm ission.

6.3 Creep Tested Microstructures
6.3.1 Constant load testing at 700°C and 196MPa
Figures 76 and 77 show the resulting general microstructures and grain
boundaries o f samples tested at 700°C and 196MPa. The most striking feature o f the
resulting microstructures is that the ‘SGB’ microstructure appears very similar to the
‘NGB’ one. There is a similar distribution o f precipitates within the grain interiors and
there are areas o f the ‘SGB’ sample where the grain boundaries are no longer serrated,
but planar. There is also very little GBR left. The ‘SGB M ’ sample on the other hand
retains much o f the GBR and most o f the grain boundaries remain serrated, though the
GBR nodules are no longer evenly distributed. It also contains planar grain boundaries in
some areas. The precipitate distribution within the grains is similar to that o f the ‘NGB’
and ‘SGB’ samples. This can be seen in better detail in Figure 77.
Also o f note in Figure 77 is that the ‘SGB’ and ‘SGB M ’ samples continue to
show coarse planar carbides. The grain boundaries in these samples show nearly
continuous carbides, with little space between the individual sections.
94
R eproduced with perm ission of the copyright owner. Further reproduction prohibited without perm ission.
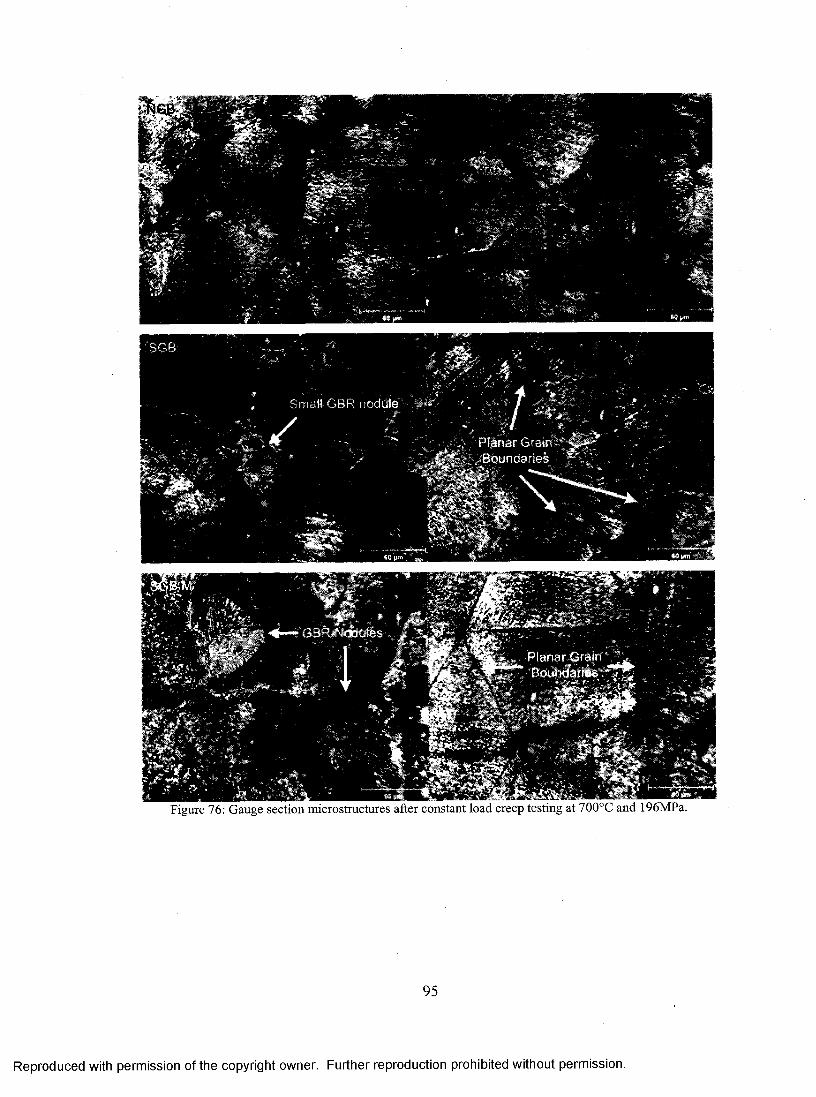
Figure 76: Gauge section microstructures after constant load creep testing at 700°C and 196MPa.
R eproduced with perm ission of the copyright owner. Further reproduction prohibited without perm ission.

n'»
Figure 77: Gauge section grain boundaries after constant load creep testing at 700°C and 196MPa.
R eproduced with perm ission of the copyright owner. Further reproduction prohibited without perm ission.

6.3.2 Constant load testing at 900°C and 27.4MPa
After the 900°C constant load tests, the ‘NGB’ and ‘SGB’ samples had virtually
identical microstructures. This can be seen in Figures 78 and 79. There is an even
distribution o f intragranular precipitates and the grain boundaries have coarse carbides
and precipitate free zones. All the grain boundaries are planar in the ‘SGB’ sample and
no GBR remains. The ‘SGB M ’ sample, which was not tested as long as the ‘NGB’ and
‘SGB’ samples, appears to be changing in a similar manner as the ‘SGB’ sample. There
are far fewer GBR nodules and they are almost all small remains. There are areas where
the grain boundaries are planar. The grain boundaries contain coarse carbides similar to
those in the ‘SGB’ and ‘NGB’ samples.
The ‘SGB’ sample that prematurely failed shows an intermediate step in the
microstructural changes o f the ‘SGB’ microstructure. Referring to Figure 80, there are
no intragranular precipitates but the GBR nodules remain and the grain boundaries are
still serrated. Figure 81 shows a change in the morphology of the GBR nodules. The
GBR nodules are no longer made up of rod like precipitates as in the untested ‘SGB’ and
‘SGB M ’ microstructures. The GBR nodule morphology has become similar to the dense
precipitates surrounding the GBR nodule in the untested microstructure.
97
R eproduced with perm ission of the copyright owner. Further reproduction prohibited without perm ission.

‘SGB M" 'SGB1 Prematurely FailedFigure 78: Gauge section microstructures after constant load creep testing at 900°C and 27.4MPa.
98
R eproduced with perm ission of the copyright owner. Further reproduction prohibited without perm ission.

Figure 79: Gauge section grain boundaries after constant load creep testing at 900°C and 27.4MPa.
R eproduced with perm ission of the copyright owner. Further reproduction prohibited without perm ission.

Figure 80: Gauge section grain boundaries o f prematurely failed ‘SGB’ sample after constant load creeptesting at 900°C and 27.4MPa.
'SGB' Prematurely Failed ‘SG B’ UntestedFigure 81: Gauge section GBR nodule morphology in prematurely failed ‘SGB’ sample and fully heat
treated but untested ‘SGB’ sample.
100
R eproduced with perm ission of the copyright owner. Further reproduction prohibited without perm ission.

6.3.3 Constant load testing at 925°C and 27.4MPa
Again after the constant load tests at 925°C there are microstructural changes to
both samples. For both ‘NGB’ and ‘SGB’ there is a more uniform distribution of
precipitates within the grain interiors (refer to Figure 82). The ‘SGB’ sample also has
fewer GBR nodules but the grain boundaries are still serrated in all areas. Both samples
also show coarse grain boundary carbides (refer to Figure 83).
‘NGB* SG B 1Figure 82: Gauge section microstructures after constant load creep testing at 925°C and 27.4MPa.
101
R eproduced with perm ission of the copyright owner. Further reproduction prohibited without perm ission.

Figure 83: Gauge section grain boundaries after constant load creep testing at 925°C and 27.4MPa.
102
R eproduced with perm ission of the copyright owner. Further reproduction prohibited without perm ission.

6.4 Aged Microstructures
Due to the microstructural changes observed during the constant load tests,
‘NGB’ and ‘SGB’ heat treated discs, cut from the bar stock, were aged at 900°C for a
period o f time similar to the length o f the constant load tests at 900°C. The resulting
microstructures can be seen in Figures 84 and 85. The changes to the microstructures are
similar to those of the constant load tests at 900°C, as the ‘NGB’ and ‘SGB’
microstructures appear to be the same. The ‘SGB’ microstructure still retains areas
which were likely GBR nodules due to the coarse carbides concentrated in those areas.
The ‘SGB’ sample however no longer has serrated grain boundaries. As well, both
samples have coarse grain boundary carbides. The density o f the intragranular
precipitates is lower than that seen after the 900°C constant load tests, indicating an effect
on the rate o f microstructural change due to applied stress.
NGB’ SGB'Figure 84: ‘N G B ’ and ‘SG B’ microstructures after ~1800 hour aging at 900°C.
103
R eproduced with perm ission of the copyright owner. Further reproduction prohibited without perm ission.

'NGB' SGB'Figure 85: ‘N G B ’ and ‘SG B’ grain boundaries after ~1800 hour aging at 900°C.
104
R eproduced with perm ission of the copyright owner. Further reproduction prohibited without perm ission.
6.5 Creep Fracture
Only the constant load tests at 700°C and 196MPa were crept to fracture. Figure
86 shows SEM images o f the fracture surfaces. In all cases, the intergranular nature of
creep fracture is apparent. The ‘SGB’ and ‘SGB M ’ samples also show grain boundary
serrations as the grain surfaces are not as smooth as the ‘NGB’ sample. Instead, they
appear to have ‘rises’ and ‘dips’, and generally a more rough surface appearance. Figure
87 also shows intergranular cracks in the samples crept at 700°C and 196MPa.
Even though the samples crept at 900°C and 925°C did not fracture, figures 88
and 89 show that they would have likely failed by intergranular fracture also.
105
R eproduced with perm ission of the copyright owner. Further reproduction prohibited without perm ission.

'SG B M'Figure 86: Creep fracture surfaces from constant load tests at 700°C and 196MPa.
106
R eproduced with perm ission of the copyright owner. Further reproduction prohibited without perm ission.

’SGB M‘Figure 87: Gauge section intergranular cracking from constant load tests at 700°C and 196MPa.
107
R eproduced with perm ission of the copyright owner. Further reproduction prohibited without perm ission.

’SGB M’ 'SGB* Prematurely FailedFigure 88: Gauge section intergranular cracking from constant load tests at 900°C and 27.4MPa.
“NGB’ SG B ’Figure 89: Gauge section intergranular cracking from constant load tests at 925°C and 27.4MPa.
108
R eproduced with perm ission of the copyright owner. Further reproduction prohibited without perm ission.

There is also variation in how intergranular cracks appear to originate in the
different microstructures at the various testing conditions. At 700°C, the ‘NGB’
microstructures appear to form cracks at triple points as seen in Figure 87. The ‘SGB’
and ‘SGB M ’ microstructures however show cracks around GBR nodules (Figure 90) as
well as on grain boundaries away from triple points and other cracks (Figure 91). The
grain boundary cavities seen in the ‘SGB’ and ‘SGB M ’ samples are not prevalent at
700°C. The tests at 900°C however show a marked increase in the number o f grain
boundary cavities seen in the ‘SGB’ and ‘SGB M ’ samples (Figure 92). The ‘NGB’
sample also begins to show grain boundary cavities after the 900°C test (Figure 93). The
‘SGB’ prematurely failed and ‘SGB M ’ samples also show cracks near the GBR nodules
(Figure 94). The ‘SGB’ prematurely failed sample was the only one to show a crack
propagating into a GBR nodule.
The 925°C constant load tests show a noticeable increase in the number o f grain
boundary cavities in the ‘NGB’ sample and the prevalence o f cracks near GBR nodules in
the ‘SGB’ sample (Figure 95).
'SGB' 'SGB M'Figure 90: Gauge section intergranular cracks at GBR nodules in ‘SGB’ and SGB M ’ samples tested at
700°C and 196MPa.
109
R eproduced with perm ission of the copyright owner. Further reproduction prohibited without perm ission.

Figure 91: Gauge section grain boundary cavities away from grain boundary triple points in ‘ SGB ’ and‘SGB M ’ samples tested at 700°C and 196MPa.
110
R eproduced with perm ission of the copyright owner. Further reproduction prohibited without perm ission.

Figure 93: Gauge section grain boundary cavities ‘NGB’ sample tested at 900°C and 27.4MPa
111
R eproduced with perm ission of the copyright owner. Further reproduction prohibited without perm ission.

‘S G B 1 Prem aturely Failed ‘S G B 1 Prem aturely Failed
‘SG B WFigure 94: Gauge section intergranular cracks at and propagating into GBR nodules in ‘SG B’ prematurely
failed and ‘SGB M ’ samples tested at 900°C and 27.4MPa.
112
R eproduced with perm ission of the copyright owner. Further reproduction prohibited without perm ission.
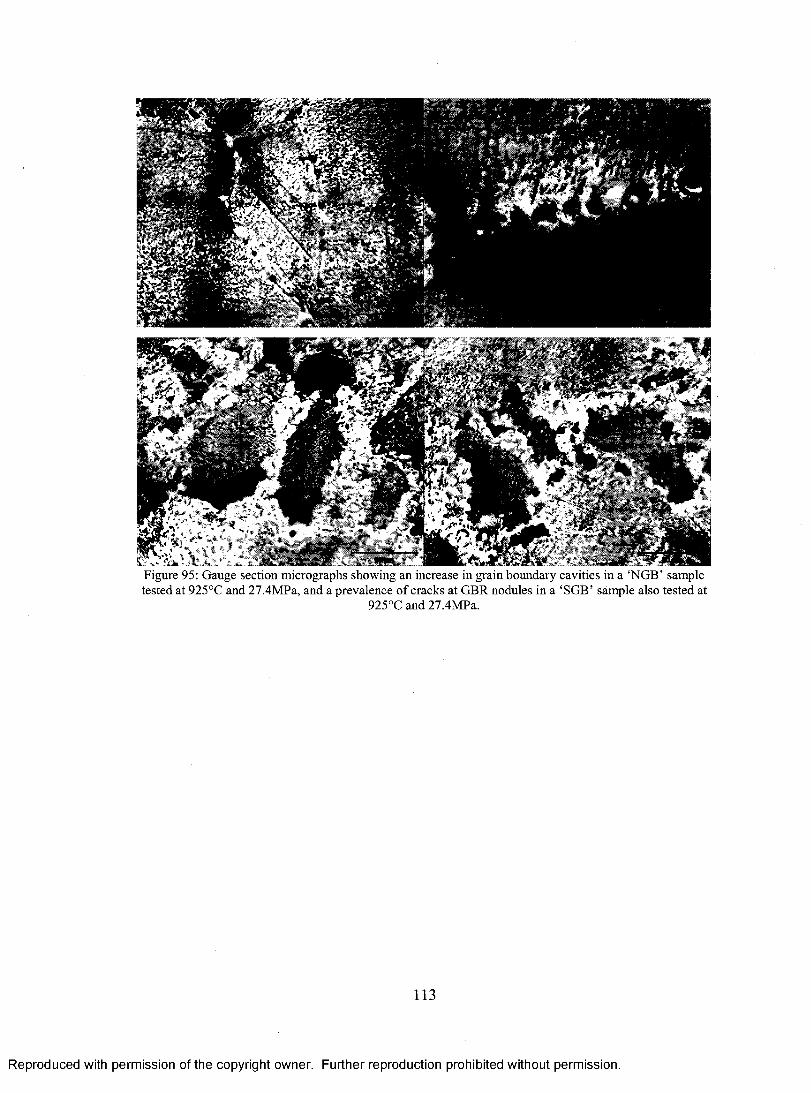
Figure 95: Gauge section micrographs showing an increase in grain boundary cavities in a ‘N G B ’ sample tested at 925°C and 27.4MPa, and a prevalence o f cracks at GBR nodules in a ‘SGB’ sample also tested at
925°C and 27.4MPa.
113
R eproduced with perm ission of the copyright owner. Further reproduction prohibited without perm ission.

7 Discussion
7.1 Heat Treated Microstructures
As explained in Section 6.1, the ‘SGB’ microstructure was found to contain grain
boundary reaction (GBR) nodules with an area fraction o f approximately 16%. This is in
excess o f the ideal amount o f 8-10% as shown in Section 5. This result is not
unreasonable given that the heat treatment outlined by Tanaka et al. [22-23; 91] states
only that furnace cooling is required after the solutionizing step at 1200°C. The furnace
cooling step would thus produce results dependent on the physical characteristics o f the
furnace being used for the heat treatment. The furnace used in this study o f 21-4N
produced a cooling rate o f approximately 6°C/min. The study on the effect o f cooling
rate and amount o f GBR precipitated showed that 4°C/min is likely the cooling rate that
occurred in the furnace used by Tanaka et al. This conclusion is supported by the
improved creep properties o f the ‘SGB M ’ microstructure with respect to the ‘SGB’
microstructure seen in the constant load tests at 700°C and 900°C. Thus the ‘SGB M ’
microstructure likely corresponds closely to the serrated grain boundary microstructure
used by Tanaka et al. [22-23; 91].
A peculiar occurrence is the fact that Tanaka et al. failed to mention that GBR
nodules occur during the ‘SGB’ heat treatment [22-24]. They conducted creep tests to
compare microstructures with planar and serrated grain boundaries. However, their
omission o f the GBR would make it seem that the improvements to creep properties are a
result o f only the grain boundary serrations. This is misleading as the planar and serrated
grain boundary microstructures have significant differences beyond just the changes in
grain boundary morphology. Tanaka et al. [91] do mention that the ‘SGB’ heat treatment
114
R eproduced with perm ission of the copyright owner. Further reproduction prohibited without perm ission.

should produce roughly 8% GBR in a separate investigation on the effects o f the GBR on
the creep rupture properties o f 21-4N.
From the micrographs shown in Section 6.1, it is clear that a simple comparison
o f serrated and planar grain boundary microstructures o f 21-4N is difficult, as the
microstructures show significant differences. This is unavoidable since the GBR occurs
with the formation o f grain boundary serrations. The most striking difference would be
that the ‘NGB’ microstructure with planar grain boundaries is far more uniform than the
‘SGB’ or ‘SGB M ’ microstructures with serrated grain boundaries and GBR nodules.
Apart from the non-uniformity o f the ‘SGB’ and ‘SGB M ’ microstructures, there is also
the possibility o f the GBR becoming a liability to creep performance when in excess o f 8-
10%, as discussed in Section 5.1.2. Also o f note between the ‘NGB’ and ‘SGB’/ ‘SGB
M ’ microstructures is the difference in grain boundary carbides. The coarse grain
boundary carbides o f the ‘SGB’ and ‘SGB M ’ microstructures could become a liability to
the creep properties if they were to form a continuous network, which could occur given
the high content o f C and N in 21-4N.
The formation of grain boundary serrations being solely due to the GBR is
another conclusion o f Tanaka et al. difficult to accept given the microstructural results
[79-83]. As seen from the micrographs in Section 6.1, there are grain boundary
serrations in the ‘SGB’ and ‘SGB M ’ microstructures where there are no GBR nodules
present. The GBR nodules may represent the largest serrations; but they cannot be the
cause o f all the serrations. As explained in Section 5.1.1, the GBR is likely the result of
cellular precipitation on the grain boundaries. Thus the grain boundary serrations in areas
free o f GBR nodules could be due to cellular precipitation which was deprived of
115
R eproduced with perm ission of the copyright owner. Further reproduction prohibited without perm ission.

sufficient solute to form GBR nodules. The grain boundary serrations could thus be
explained solely in terms o f cellular precipitation, though as reviewed in Section 3.2.2,
work on 304 and 316 SS suggests that grain boundary serrations could be due to lattice
distortional strain energy from excess solute near a grain boundary [74]. A more careful
study of the formation o f grain boundary serrations in 21-4N would likely shed further
light on whether serrations occur before grain boundary precipitates, or are in fact the
result o f cellular precipitation.
7.2 Creep Testing Results and Resulting Microstructures
Contrary to the results o f Tanaka et al. on 21-4N, there was little to no
improvement in creep properties o f the serrated grain boundary microstructure over the
planar grain boundary microstructure [22-24]. The initial constant load creep tests at
700°C and 196MPa (refer to Section 6.2.1.1, Figure 68) revealed the poor creep
performance o f the ‘SGB’ microstructure which had an area fraction of GBR in excess of
8-10%. While there was an improvement in the creep ductility relative to the ‘NGB’
microstructure, the rupture life was shorter. Even the ‘SGB M ’ microstructure, with an
ideal 10% area fraction o f GBR, showed minimal improvement in creep life, but
exhibited a higher minimum strain rate. The constant load tests at 900°C (refer to
Section 6.2.1.2, Figure 69) continued to show results opposite to those o f Tanaka et al.
(refer to Section 3.3, Figure 32). At these conditions, the serrated grain boundary
microstructures showed no improvement in creep rupture life; not even the ‘SGB M ’
microstructure.
116
R eproduced with perm ission of the copyright owner. Further reproduction prohibited without perm ission.
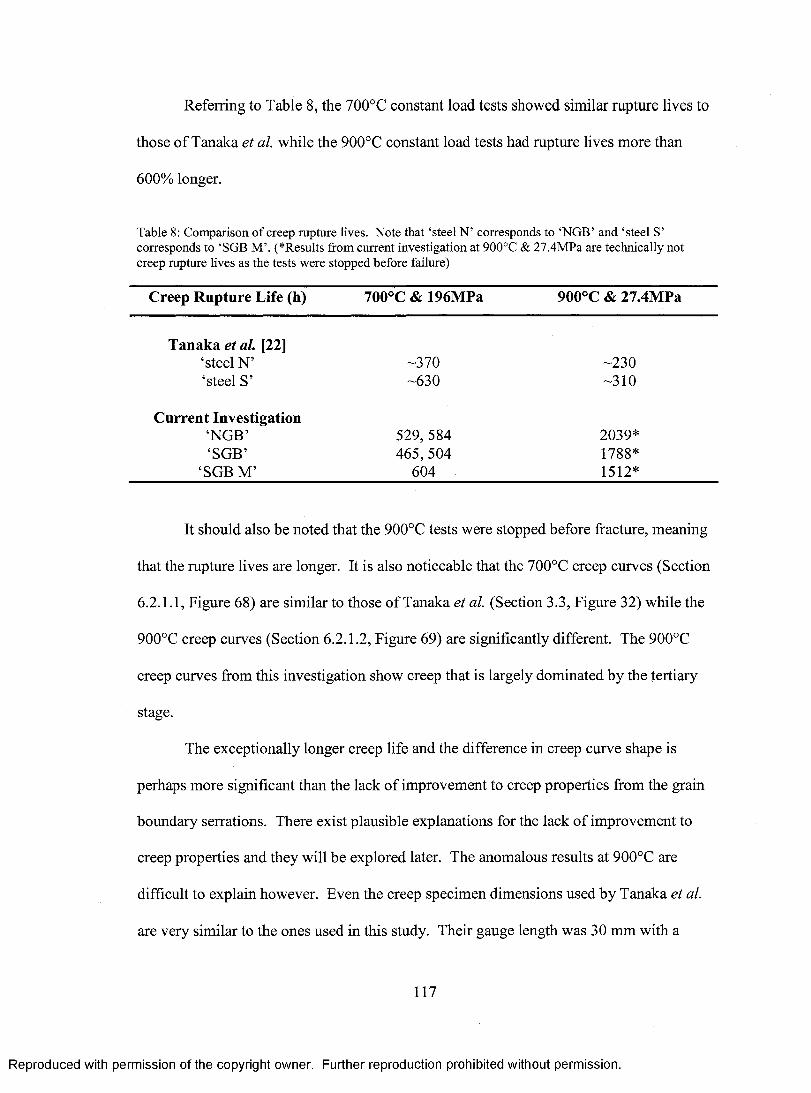
Referring to Table 8, the 700°C constant load tests showed similar rupture lives to
those o f Tanaka et al. while the 900°C constant load tests had rupture lives more than
600% longer.
Table 8: Comparison o f creep rupture lives. Note that ‘steel N ’ corresponds to ‘N G B ’ and ‘steel S ’ corresponds to ‘SGB M ’. (*Results from current investigation at 900°C & 27.4M Pa are technically not creep rupture lives as the tests were stopped before failure)
Creep Rupture Life (h) 700°C & 196MPa 900°C & 27.4MPa
Tanaka etal. [22]‘steel N ’ -370 -230‘steel S’ -630 -310
Current Investigation‘NGB’ 529, 584 2039*‘SGB’ 465, 504 1788*
‘SGB M ’ 604 1512*
It should also be noted that the 900°C tests were stopped before fracture, meaning
that the rupture lives are longer. It is also noticeable that the 700°C creep curves (Section
6.2.1.1, Figure 68) are similar to those o f Tanaka et al. (Section 3.3, Figure 32) while the
900°C creep curves (Section 6.2.1.2, Figure 69) are significantly different. The 900°C
creep curves from this investigation show creep that is largely dominated by the tertiary
stage.
The exceptionally longer creep life and the difference in creep curve shape is
perhaps more significant than the lack o f improvement to creep properties from the grain
boundary serrations. There exist plausible explanations for the lack o f improvement to
creep properties and they will be explored later. The anomalous results at 900°C are
difficult to explain however. Even the creep specimen dimensions used by Tanaka et al.
are very similar to the ones used in this study. Their gauge length was 30 mm with a
117
R eproduced with perm ission of the copyright owner. Further reproduction prohibited without perm ission.

gauge diameter o f 5 mm, while the dimensions used in this study were -40.64 mm (1.6”)
gauge length with a gauge diameter o f -6.35 mm (0.25”) [22],
As well, the 21-4N chemical compositions are very similar. Referring to Table
Table 9 below, there are only minor differences in the Cr, Ni and Mn contents. These
differences are unlikely to explain the massive difference in creep life at 900°C.
Differences in creep testing procedure would also be improbable as an explanation for the
anomalous results. Therefore, there appears to be no clear explanation as to why the
constant load creep tests at 900°C and 27.4MPa in this study, lasted more than 600%
longer than the constant load tests performed by Tanaka et al. [22-24].
Table 9: Chemical compositions o f 21-4N used by Tanaka et al. [22] and test material used in the current study.
C N C r Ni Mn Si S P21-4N 0.54 0.39 21.10 4.07 9.74 0.19 0.008 0.017
TestM aterial 0.53 0.39 20.77 3.47 8.19 0.18 0.001 0.041
Returning now to the unexpected lack o f improvement in creep properties from
the serrated grain boundaries, it appears that one possible reason is microstructural
instability o f the serrated grain boundary microstructures. This is somewhat apparent in
the crept microstructures from the 700°C constant load tests. There is no question though
of the microstructural instability when looking at the crept microstructures from the
900°C constant load tests. The ‘NGB’ and ‘SGB’ microstructures are virtually identical,
and the ‘SGB M ’ microstructure appears to be changing in a similar manner. The ‘SGB’
sample that prematurely failed, shows that the changes in microstructure are not simple.
The intragranular precipitates are dissolved and the GBR nodule morphology has
118
R eproduced with perm ission of the copyright owner. Further reproduction prohibited without perm ission.

drastically changed, but there are still grain boundary serrations. The fully tested ‘SGB’
sample then shows evenly distributed intragranular precipitates, no GBR nodules
whatsoever and planar grain boundaries. The instability also arises during simple aging
o f the microstructures at 900°C without an applied stress, though the stress does appear to
accelerate the changes (refer to Section 6.4).
Further proof o f the microstructural instability can be seen in the 925°C and
27.4MPa constant load test results. Although the ‘SGB’ sample has an excess o f GBR
nodules, its creep performance at 900°C and 27.4MPa was comparable to that o f the
‘NGB’ sample. The 925°C results indicate a severe drop in creep performance, which
would be difficult to explain solely by excess GBR. One possible cause is the
thermodynamic instability o f the microstructure.
Tanaka et al. do not make mention of significant changes to the planar and
serrated grain boundary microstructures after testing at 700°C and 900°C [22-24]. This is
somewhat expected due to the fact that their 900°C tests were substantially shorter than
the ones in the current study. However, the similar creep rupture lives o f the 700°C tests
means that some changes in microstructure should have been noted.
The crept microstructures from the 700°C tests in this study show that the ‘SGB
M ’ microstructure appears fairly stable, though there are some signs o f instability due to
areas free o f grain boundary serrations. Thus given the similar length o f the creep tests at
700°C in this study and in that o f Tanaka et al., it is partly understandable that no major
changes in microstructure were reported.
The prematurely failed ‘SGB’ sample from the 900°C tests can also explain the
lack of mention o f microstructural changes by Tanaka et al. [22-24]. This sample lasted
119
R eproduced with perm ission of the copyright owner. Further reproduction prohibited without perm ission.

~ 800hrs and the sample with the longest rupture life at 900°C tested by Tanaka et al.
lasted only ~ 310hrs [22-24]. The prematurely failed ‘SGB’ sample still had serrated
grain boundaries and GBR nodules, albeit the GBR nodules were different and the
precipitate structure had changed significantly. It could reasonably be assumed that at ~
310hrs, the microstructure may not have been as grossly altered. The fact that serrated
grain boundaries remain after nearly 800hrs in the prematurely failed ‘SGB’ sample is an
important point to note.
Another possible explanation for the poor creep performance of the ‘SGB’ and
‘SGB M ’ microstructures could be increased susceptibility to intergranular cracking.
This can be seen in the micrographs shown in Section 6.5. The micrographs from
samples tested at 700°C and 196MPa show that the intergranular cracks appear to be
mostly from triple point cracking, though the ‘SGB’ and ‘SGB M ’ samples show some
grain boundary cavities away from grain boundary triple points and wedge cracks, with
coarse grain boundary carbides adjacent to the cavities. Cracks at the GBR nodules are
also seen in the ‘SGB’ and ‘SGB M ’ samples.
The 900°C and 27.4MPa tested samples show a large increase in grain boundary
cavities for the ‘SGB’ and ‘SGB M ’ microstructures. Cracks are also seen at GBR
nodules in the ‘SGB’ prematurely failed and ‘SGB M ’ samples. Some o f the grain
boundary cavities in the ‘SGB’ sample could have formed at GBR nodules before they
dissolved. The prematurely failed ‘SGB’ sample is also the only one to show a crack
propagating into a GBR nodule. At 900°C, the ‘NGB’ sample shows an increase in grain
boundary cavities with respect to the samples crept at 700°C.
120
R eproduced with perm ission of the copyright owner. Further reproduction prohibited without perm ission.
At 925°C and 27.4MPa, the ‘NGB’ sample shows a large increase in grain
boundary cavities. The ‘SGB’ sample shows cracks predominantly at GBR nodules.
This could indicate that the GBR nodules are sites for crack initiation due to the reduced
ductility of the nodules themselves. It is also possible that the coarse grain boundary
carbides act as crack initiation points. However, the ‘SGB’ sample tested at 925°C and
27.4MPa shows cracks almost exclusively initiating at the GBR nodules. This could
extend to the 900°C results as cracks could have formed at GBR nodules and remained
after the nodules had disappeared over the course o f the test. However, the ‘SGB’
microstructure does have an excess amount o f GBR, possibly making it more susceptible
to crack formation.
The GBR nodules are not likely to be the only source o f cracks as the ‘NGB’
samples tested at 900°C and 925°C also showed substantial amounts o f grain boundary
cavities. This could be due to the coarse grain boundary carbides which precipitated
during the tests as seen in Sections 6.3.2 and 6.3.3. Thus it seems probable that the
coarse grain boundary carbides have a negative effect on the creep properties by acting as
crack initiation sites. This combined with the GBR nodules also acting as possible crack
initiation sites would explain why the ‘SGB’ and ‘SGB M ’ microstructures performed so
poorly with respect to the ‘NGB’ microstructure. It would also explain why the constant
load test results at 900°C and 27.4MPa show creep mostly in the tertiary stage. In
essence, the ‘SGB’ and ‘SGB M ’ microstructures are ‘handicapped’ from the start o f the
creep test with a larger amount o f potential crack initiation sites. Thus they experience an
increase in creep rate sooner than the ‘NGB’ microstructure which only forms coarse
grain boundary carbides as the test progresses, delaying the onset of accelerating creep.
121
R eproduced with perm ission of the copyright owner. Further reproduction prohibited without perm ission.

Thus, any benefit of the serrated grain boundaries in the ‘SGB’ and ‘SGB M ’
microstructures is outweighed by the inherent flaws in the microstructures, leaving them
at a distinct disadvantage to the ‘NGB’ microstructure. Add to that the microstructural
instability of the ‘SGB’ and ‘SGB M ’ microstructures discussed earlier and it seems
fairly clear as to why there was no improvement to creep properties from the serrated
grain boundaries. While it would require a large number o f creep tests to progressively
increasing strains in order to completely observe the development o f creep damage in the
various microstructures, the larger amount o f cracks in the ‘SGB’ and ‘SGB M ’
microstructures, found near microstructural features absent from the ‘NGB’
microstructure, indicates that these microstructural features could be at fault for the poor
creep performance o f the ‘SGB’ and ‘SGB M ’ microstructures.
Another interesting point to note is that only in the ‘SGB’ prematurely failed
sample were cracks seen propagating within the GBR nodules, and even there it was a
rare occurrence. This could be the reason for the premature failure o f this sample as the
‘SGB’ samples tested at 700°C and 925°C, which still had some GBR remaining, showed
no cracks within the GBR nodules. This conflicts with the discussion in Section 5.1.2,
where cracks were expected to initiate and propagate from within the GBR nodules when
the area percent o f GBR exceeded 8-10% at lower temperatures.
An additional point to note is the difference in chemical composition o f the 21-4N
test material in this investigation and in that o f Tanaka et al. [22], The material tested
had lower amounts o f Cr, Ni and Mn which would result in fewer coarse carbides and
possibly lower amounts of GBR. And yet, the coarse grain boundary carbides and GBR
nodules appear to have a negative impact on creep properties, making the results of
122
R eproduced with perm ission of the copyright owner. Further reproduction prohibited without perm ission.

Tanaka et al. [22-24] even more perplexing in that they actually showed improvements to
creep properties with the serrated grain boundary microstructure.
7.3 Effect of Serrated Grain Boundaries on Creep Rate
While it is clear that the ‘SGB’ and ‘SGB M ’ microstructures have
thermodynamic stability issues and inherently have more potential crack initiation sites,
the results from the 0-Projection analysis o f the 700°C and 900°C constant load test
results can be used to shed light on the effect o f serrated grain boundaries on creep rate.
This is possible since the minimum creep rates occur early on in the creep life, where it
can be reasonably assumed that the microstructures are similar to the untested
microstructures. Thus the ‘NGB’ samples have planar grain boundaries and the
‘SGB’/ ‘SGB M ’ still have serrated grain boundaries, and any creep damage that has
occurred in the ‘SGB’/‘SGB M ’ microstructures should not overwhelm the beneficial
effects o f the serrated grain boundaries.
Referring to Table 6.1 in Section 6.2.1.1, the 700°C constant load test results
show that the creep rates are very similar. This is expected since at 700°C and 196MPa,
a dislocation creep mechanism is expected to be dominant, which should not be affected
by grain boundary morphology. The increasing load tests at 700°C (Section 6.2.2.1) also
show that the creep rates are similar. The high stress exponent o f approximately 8.1 also
suggests that a dislocation creep mechanism is dominant. This stress exponent is
consistent with the results o f Tanaka et al. at 700°C (Section 3.3) where stress exponents
o f 7.6 and 7.1 were reported.
123
R eproduced with perm ission of the copyright owner. Further reproduction prohibited without perm ission.

The 900°C constant load test results show that the creep rates are very similar
(refer to Table 6.2). The increasing load tests at 900°C (Section 6.2.2.2) however show
that the ‘SGB’ samples have slightly higher creep rates. This is likely due to the fact that
the increasing load creep rates are calculated from linear fits o f the creep curves where
the creep rate appears to be roughly constant. This is also an indication that the ‘SGB’
microstructure experiences a definite minimum creep rate and that the creep curve is
likely devoid o f a true secondary stage o f creep. There is instead only a transition from
primary to tertiary creep. The ‘NGB’ microstructure on the other hand does appear to
experience a roughly steady secondary stage o f creep.
A more significant result from the increasing load test results at 900°C is that the
‘SGB’ samples do not show an increase in the stress exponent as the stresses increase.
Typically an increase in stress exponent, as seen in the ‘NGB’ samples, would indicate a
change in the creep mechanism. While this may be true in this case, it is more likely that
the increase in stress exponent is due to increasing microstructural damage from the
continuously increasing loads. The ‘SGB’ samples then show the increased damage
tolerance o f the serrated grain boundary morphology, while the grain boundary serrations
are still present.
Thus from the constant and increasing load test results at 700°C and 900°C,
serrated grain boundaries do not appear to have any effect on the minimum creep rate.
The results o f the constant load tests at 900°C and 27.4MPa are the most significant since
those conditions are the most likely to be controlled by diffusional creep mechanisms.
With diffusional creep, it is expected that grain boundary sliding will also be occurring.
124
R eproduced with perm ission of the copyright owner. Further reproduction prohibited without perm ission.

If that is the case, then the creep rate should be affected by the presence o f serrated grain
boundaries which are known to inhibit grain boundary sliding.
The lack of effect on the creep rate from the serrated grain boundaries could be
explained in several ways. The first and simplest explanation would be that there is no
link between diffusional creep and grain boundary sliding as hypothesized by creep
theory. Another simple explanation could be that the creep conditions are not dominated
by diffusional mechanisms, as indicated by the stress exponents above one in the
increasing load tests at 900°C.
The microstructural instabilities o f the serrated grain boundary microstructures
and the larger number o f inherent flaws from the GBR nodules and coarse grain boundary
carbides could also be factors in why the serrated grain boundaries had no effect on the
creep rate. This would likely be minor since the serrated grain boundaries were present
for a significant portion o f the creep life, as shown by the ‘SGB’ sample that failed
prematurely and the microstructural damage should be relatively negligible at the low
strains at which the minimum creep rates occured.
The largest problem from the microstructural instabilities is the fact that a more
extensive creep testing regime could not have been undertaken. Any attempt to test at
lower stresses and higher temperatures would have been futile. Tests at lower stresses
would likely have increased the time to the minimum creep rate to such an extent that the
serrated grain boundary morphology would no longer have been present. As for
increasing the temperature further, the constant load tests at 925°C and 27.4MPa show
that it would have been equally pointless.
125
R eproduced with perm ission of the copyright owner. Further reproduction prohibited without perm ission.

The results from this investigation o f 21-4N do not provide a conclusive answer
as to what effect if any serrated grain boundaries may have on creep rate. Instead, these
results can be considered as an intermediate step. Unfortunately, due to the
thermodynamic instability o f the serrated grain boundary microstructures and the
negative effects o f the coarse grain boundary carbides and GBR nodules, it is not suitable
for further investigation. Therefore the current conclusion about the effect o f serrated
grain boundaries on creep rate is that there is no noticeable effect.
126
R eproduced with perm ission of the copyright owner. Further reproduction prohibited without perm ission.

8 Summary, Conclusions and Recommendations for Future Work
8.1 Summary and Conclusions
Heat treatments to produce serrated and planar grain boundaries in 21-4 were
successfully applied including a correction to the serrated grain boundary heat treatment.
Constant and increasing load creep tests were performed on the planar and serrated grain
boundary microstructures. Crept microstructures were examined using optical
microscopy. Long term aging o f planar and serrated grain boundary microstructures was
also performed. The following can be concluded from this study on the effects of
serrated grain boundaries on the creep of 21-4N:
• Correct heat treatment to produce grain boundary serrations in 21-4N with an
optimal amount (8-10%) o f grain boundary reaction is:
1. Solutionize at 1200°C for 1 hour, followed by controlled cooling at
approximately 4°C/min to 1030°C, followed by water quenching.
2. Age at 750°C for 30 hours, followed by air cooling.
3. Age at 1000°C for 3 hours, followed by air cooling.
• Improvement in creep properties from serrated grain boundaries in 21-4N is
limited to none, due to thermodynamic instability o f the microstructure during
creep testing and due to increased microstructural damage from coarse grain
boundary carbides and grain boundary reaction nodules. This result is in direct
contrast to past research on 21-4N.
• From the creep data gathered, there appears to be no effect on the creep rate due
to the grain boundary serrations, even at conditions which could be considered to
controlled by diffusional creep mechanisms.
127
R eproduced with perm ission of the copyright owner. Further reproduction prohibited without perm ission.

• 21-4N is not suitable for further study within the frame work o f the overall
research project dealing with the effects o f grains boundaries on the creep rate of
engineering alloys, as the formation o f serrated grain boundaries is accompanied
by coarse grain boundary carbides and grain boundary reaction nodules.
8.2 Recommendations for Future Work
In light o f the results showing the problems associated with the serrated grain
boundary microstructure in 21-4N, no further use o f this alloy is envisioned in the overall
project seeking to elucidate the role o f grain boundaries on the creep rate o f engineering
alloys.
Instead, the work o f Hong et al. on 304 and 316 stainless steels could provide a
useful start for further investigation [68-74]. Using austenitic stainless steels again would
prove very practical since the testing temperatures and stresses would not have to be as
high as for a nickel base superalloy for instance. An outline o f work to be done to
continue the investigation o f serrated grain boundary effects on creep rate is as follows:
• Procure 304 and/or 316 test material, preferably bar stock for ease o f creep
sample machining. The carbon content has been shown to be an important factor
in the formation o f serrated grain boundaries in these alloys [74]. Ensure the
composition o f the 304 includes at least -0.077 wt.% C, or at least -0.067 wt.% C
for 316. If it is desired to match the compositions used by Hong et al., they are
provided below in Table 10.
128
R eproduced with perm ission of the copyright owner. Further reproduction prohibited without perm ission.
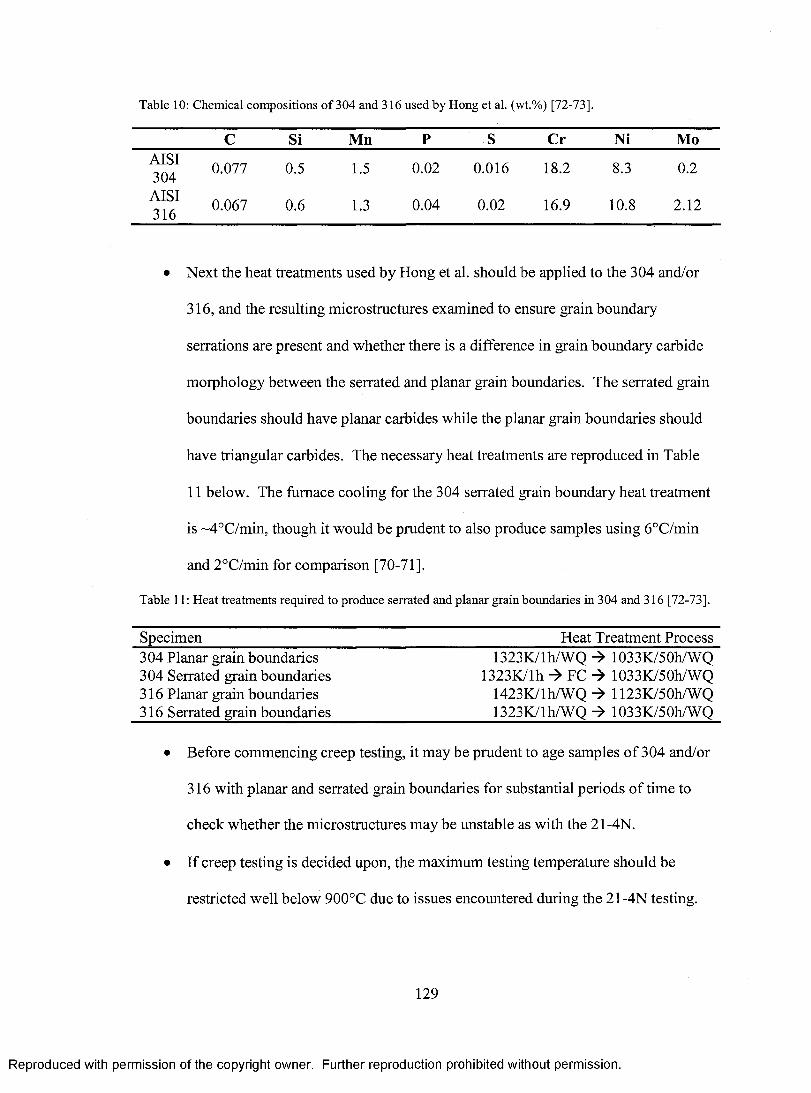
Table 10: Chemical compositions o f 304 and 316 used by Hong et al. (wt.%) [72-73].
C Si Mn P S Cr Ni MoAISI304 0.077 0.5 1.5 0 .0 2 0.016 18.2 8.3 0 .2
AISI316 0.067 0 .6 1.3 0.04 0 .0 2 16.9 10.8 2 .1 2
• Next the heat treatments used by Hong et al. should be applied to the 304 and/or
316, and the resulting microstructures examined to ensure grain boundary
serrations are present and whether there is a difference in grain boundary carbide
morphology between the serrated and planar grain boundaries. The serrated grain
boundaries should have planar carbides while the planar grain boundaries should
have triangular carbides. The necessary heat treatments are reproduced in Table
11 below. The furnace cooling for the 304 serrated grain boundary heat treatment
is ~4°C/min, though it would be prudent to also produce samples using 6 °C/min
and 2°C/min for comparison [70-71].
Table 11: Heat treatments required to produce serrated and planar grain boundaries in 304 and 316 [72-73].
Specimen_________________________________________________Heat Treatment Process304 Planar grain boundaries 1323K/lh/WQ -» 1033K/50h/WQ304 Serrated grain boundaries 1323K/lh FC 1033K/50h/WQ316 Planar grain boundaries 1423K/lh/WQ 1123K/50h/WQ316 Serrated grain boundaries______________________ 1323K/lh/WQ 1033K/50h/WQ
• Before commencing creep testing, it may be prudent to age samples o f 304 and/or
316 with planar and serrated grain boundaries for substantial periods o f time to
check whether the microstructures may be unstable as with the 21-4N.
• If creep testing is decided upon, the maximum testing temperature should be
restricted well below 900°C due to issues encountered during the 21-4N testing.
129
R eproduced with perm ission of the copyright owner. Further reproduction prohibited without perm ission.

It may become impossible to remove the creep samples from the specimen grips
when testing at too high a temperature.
• Increasing load tests are not recommended as the creep rates obtained may not be
sufficiently close to the true minimum creep rates and the accumulating creep
damage may cause the results to be suspect.
It should also be mentioned that a substantial amount o f work has been carried out
on the nickel base superalloy PWA 1113 concurrently with the work on 21-4N. A similar
procedure was used where planar and serrated grain boundary microstructures were
produced and tested at identical temperatures and stresses. The results are promising so
far in that improvements to creep rupture life and ductility have been recorded as
expected, suggesting that the PWA 1113 does not suffer from microstructural instability
during testing. The stability o f the grain boundary serrations could be due to the fact that
the serrations are formed through 7 ’ precipitation, during cooling from 1135°C to
1060°C. Thus the highest testing temperature o f 800°C is well below the 7 ’ solvus.
Figures 96 to 99 show a selection o f creep results o f the PWA 1113 testing which
highlight some interesting features.
130
R eproduced with perm ission of the copyright owner. Further reproduction prohibited without perm ission.

705°C & 690MPa0.09
0.08
0.07
0.06
0.05cs55 Serrated Grain
Boundaries0.04
0.03Planar Grain Boundaries0.02
0.01
100 150 200 250Time (hrs)
Figure 96: PWA 1113 constant load creep curves at 705°C and 690MPa.
750°C & 550MPa0.12
0.1
0.08
cSerrated Grain
Boundaries2(0
0.06
0.04Planar Grain Boundaries
0.02
50 100 Time (hrs)
150 200
Figure 97: PWA 1113 constant load creep curves at 750°C and 550MPa.
131
R eproduced with perm ission of the copyright owner. Further reproduction prohibited without perm ission.

800°C & 300MPa0.2
0.18
0.16
0.14
0.12c
Planar Grain Boundaries
0.08
0.06
0.04Serrated Grain
Boundaries0.02
200 400 600 Time (hrs)
800 1000 1200
Figure 98: PWA 1113 constant load creep curves at 800°C and 300MPa.
800*0 & 250MPa0.14
0.12
Planar Grain Boundariesc 0.08S55 0.06
Serrated Grain Boundaries (test continuing)0.04
0.02
200 400 600 800 1000 1200 1400Time (hrs)
Figure 99: PWA 1113 constant load creep curves at 800°C and 250MPa.
Figures 96 and 97 show creep results at high stresses and in the case o f Figure 96,
a relatively low temperature. The improvement to creep ductility and creep rupture life
from the serrated grain boundaries is immediately apparent. As well, it can be seen that
the creep rates are similar as expected at such high stresses. Figures 98 and 99 show
creep results at stresses and temperatures closer to diffusional creep conditions. The
creep rates still appear to be very similar, driving the need for continued creep testing at
132
R eproduced with perm ission of the copyright owner. Further reproduction prohibited without perm ission.

even lower stresses. It is interesting to note that the improvement to creep properties
from the grain boundary serrations continues to be improved damage tolerance. This is
seen with improved creep ductility, longer creep rupture life and increased time to tertiary
creep. Further creep testing continues on this material with increasingly lower stresses to
try and enter the diffusional regime o f creep.
133
R eproduced with perm ission of the copyright owner. Further reproduction prohibited without perm ission.

References
[1] F.R.N. Nabaro, H.L. de Villiers, The Physics o f Creep. Great Britain: Taylor & Francis Ltd., 1995
[2] R.E. Reed-Hill, R. Abbaschian, Physical Metallurgy Principles, 3rd Ed. U.S.A.: PWS-KENT Publishing Company, 1992
[3] R.W. Evans, B. Wilshire, Introduction to Creep. London: The Institute of Materials, 1993
[4] Edited by, A.K. Koul, V.R. Parameswaran, J-P. Immarigeon, W. Wallace, Advances in High Temperature Structural Materials and Protective Coatings. Ottawa: National Research Council o f Canada, 1994
[5] J. Cadek, Creep in Metallic Materials. Czechoslovakia: Elsevier Science Publishing Company Inc., 1988
[6 ] O.A. Ruano, O.D. Sherby, Low Stress Creep o f Fine-grained Materials at Intermediate Temperatures: Diffusional Creep or Grain Boundary Sliding?, Materials Science and Engineering, Vol.56, No.2, 1982, pp. 167-175
[7] O.A. Ruano, J. Wadsworth, O.D. Sherby, Harper-Dom Creep in Pure Metals,Acta Metallurgica, Vol.36, No.4, 1988, pp.1117-1128
[8] O.A. Ruano, J. Wadsworth, O.D. Sherby, Harper-Dorn and Power Law Creep inFe-3wt%Si, Scripta Metallurgica, Vol.22, N o.12, 1988, pp.1907-1910
[9] O.A. Ruano, J. Wadsworth, J. Wolfentine, O.D. Sherby, Evidence fo r Nabarro-Herring creep in metals: fiction or reality?, Materials Science and Engineering, Vol.A165, No.2, 1993, pp.133-141
[10] J. Wolfenstine, O.A. Ruano, J. Wadsworth, O.D. Sherby, Refutation o f the relationship between denuded zones and diffusional creep, Scripta Metallurgica et Materialia, Vol.29, No.4, 1993, pp.515-520
[11] G. W. Greenwood, Denuded zones and diffusional creep, Scripta Metallurgica et Materialia, Vol.30, No.12,1994, pp.1527-1530
[12] B. Burton, G.L. Reynolds, In defense o f diffusional creep, Materials Science and Engineering, Vol.A191, No.1-2, 1995, pp.135-141
[13] O.A. Ruano, O.D. Sherby, J. Wadsworth, J. Wolfenstine, Rebuttal to “In defense o f diffusional creep ”, Materials Science and Engineering, Vol.A211, N o.1-2, 1996, pp.66-71
134
R eproduced with perm ission of the copyright owner. Further reproduction prohibited without perm ission.
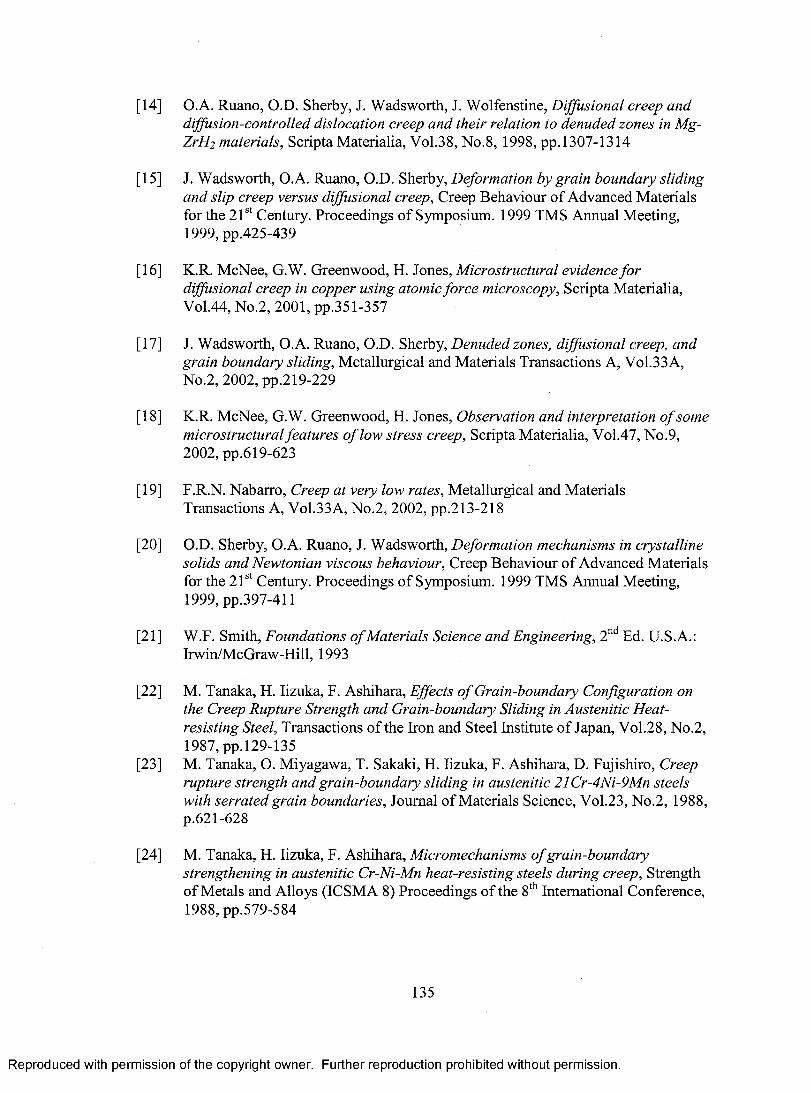
[14] O.A. Ruano, O.D. Sherby, J. Wadsworth, J. Wolfenstine, Diffusional creep and diffusion-controlled dislocation creep and their relation to denuded zones in Mg- ZrH2 materials, Scripta Materialia, Vol.38, No.8 , 1998, pp.1307-1314
[15] J. Wadsworth, O.A. Ruano, O.D. Sherby, Deformation by grain boundary sliding and slip creep versus diffusional creep, Creep Behaviour o f Advanced Materials for the 21st Century. Proceedings o f Symposium. 1999 TMS Annual Meeting, 1999, pp.425-439
[16] K.R. McNee, G.W. Greenwood, H. Jones, Microstructural evidence fo r diffusional creep in copper using atomic force microscopy, Scripta Materialia, Vol.44, No.2, 2001, pp.351-357
[17] J. Wadsworth, O.A. Ruano, O.D. Sherby, Denuded zones, diffusional creep, and grain boundary sliding, Metallurgical and Materials Transactions A, Vol.33A, No.2, 2002, pp.219-229
[18] K.R. McNee, G.W. Greenwood, H. Jones, Observation and interpretation o f some microstructural features o f low stress creep, Scripta Materialia, Vol.47, No.9, 2002, pp.619-623
[19] F.R.N. Nabarro, Creep at very low rates, Metallurgical and Materials Transactions A, Vol.33A, No.2, 2002, pp.213-218
[20] O.D. Sherby, O.A. Ruano, J. Wadsworth, Deformation mechanisms in crystalline solids and Newtonian viscous behaviour, Creep Behaviour o f Advanced Materials for the 21st Century. Proceedings o f Symposium. 1999 TMS Annual Meeting, 1999, pp.397-411
[21] W.F. Smith, Foundations o f Materials Science and Engineering, 2nd Ed. U.S.A.: Irwin/McGraw-Hill, 1993
[22] M. Tanaka, H. Iizuka, F. Ashihara, Effects o f Grain-boundary Configuration on the Creep Rupture Strength and Grain-boundary Sliding in Austenitic Heat- resisting Steel, Transactions o f the Iron and Steel Institute o f Japan, Vol.28, No.2,1987, pp.129-135
[23] M. Tanaka, O. Miyagawa, T. Sakaki, H. Iizuka, F. Ashihara, D. Fujishiro, Creep rupture strength and grain-boundary sliding in austenitic 21Cr-4Ni-9Mn steels with serrated grain boundaries, Journal o f Materials Science, Vol.23, No.2, 1988,p.621-628
[24] M. Tanaka, H. Iizuka, F. Ashihara, Micromechanisms o f grain-boundary strengthening in austenitic Cr-Ni-Mn heat-resisting steels during creep, Strength of Metals and Alloys (ICSMA 8) Proceedings of the 8 th International Conference,1988, pp.579-584
135
R eproduced with perm ission of the copyright owner. Further reproduction prohibited without perm ission.

[25] T. Saga, O. Miyagawa, M. Kobayashi, D. Fujishiro, Structural Change Occurred by Furnace Cooling and Its Effect on Creep Rupture Properties o f 21-12N Steel, Tetsu-To-Hagane, Vol.56, N o.l, 1970, pp.55-68
[26] J.C. Beddoes, W. Wallace, Heat Treatment o f Hot Isostatically Processed IN-738 Investment Castings, Metallography, Vol.13, No.2, 1980, pp.185-194
[27] M. Yoshiba, O. Miyagawa, Effect o f Grain Boundary Serration on the Fatigue, Creep and Cyclic Creep Strengths o f a Nickel-base Superalloy in Air and in Hot Corrosive Environment, Transactions o f the Iron and Steel Institute o f Japan, Vol.26, N o.l, 1985, pp.69-77
[28] M. Chang, A.K. Koul, P. Au, T. Terada, Damage Tolerance o f Wrought Alloy 718 Ni-Fe-Base Superalloy, Journal o f Materials Engineering and Performance, Vol.3, No.3, 1994, pp.356-366
[29] H. Iizuka, M. Tanaka, Effect o f heat treatment on precipitation behaviour and high temperature strength in a wrought Co-base superalloy, Journal o f Materials Science, Vol.21, No.3, 1986, pp.2803-2811
[30] M. Tanaka, H. Iizuka, M. Tagami, Effects o f grain-boundary configuration on the high-temperature creep strength o f cobalt-base L-605 alloys, Journal o f Materials Science, Vol.24, No. 7, 1989, pp.2421-2428
[31] M. Tanaka, H. Iizuka, F. Ashihara, Improvement o f creep-rupture properties o f wrought cobalt-based HS-21 alloys at high temperatures, Journal o f Materials Science, Vol.24, No.5, 1989, pp.1623-1628
[32] M. Tanaka, H. Iizuka, Effects o f Serrated Grain Boundaries and Cold Work on the Creep-Rupture Properties o f Cobalt-base Superalloy L-605, Zeitschrift fur Metallkunde, Vol.81, No.2, 1990, p.149-152
[33] R.A. Lula, Manganese Stainless Steels, Paris, France: The Manganese Center, 1986
[34] T. Tunnecliffe, “Valve Alloys - What Makes Them So Special?”, Automotiverebuilder, [Online] September 1999. Available: www. automotiverebuilder. com/ar/ar99946.htm
[35] Automotive Stainless Steels, Committee o f Stainless Steel Producers, American Iron and Steel Institute, Washington, D.C., 1985
[36] R.E. Smallman, R.J. Bishop, Modern Physical Metallurgy & Materials Engineering. Great Britain: Educational and Professional Publishing Ltd., 1999
136
R eproduced with perm ission of the copyright owner. Further reproduction prohibited without perm ission.

[37] M.E. Kassner, M-T. Perez-Prado, Fundamentals o f Creep in Metals and Alloys, Netherlands: Elsevier Ltd., 2004
[38] J-P. Poirier, Creep o f Crystals - High Temperature Deformation Processes in Metals, Ceramics and Minerals, Great Britain: Cambridge University Press, 1985
[39] S.S. Sahay, G.S. Murty, Uncertainty in Separating the Strain Contributions o f Sliding and Diffusion in Diffusional Creep, Scripta Materialia, Vol.44, No.5, 2001, pp.841-845
[40] P. Kumar, M.E. Kassner, T.G. Langdon, Fifty years o f Harper-Dorn creep: a viable creep mechanism or a Californian artifact?, Journal o f Material Science, Vol.42, No.2, 2007, pp.409-420
[41] J. Beddoes, J.G. Parr, Introduction to Stainless Steels, U.S.A.: ASM International, 1999
[42] R.C. Gifkins, Grain-boundary Participation in High-temperature Deformation: An Historical Review, Materials Characterization, Vol.32, No.2, 1994, pp.59-77
[43] J. Beddoes, A. Wisniewski, Influence o f Grain Boundary Morphology on Creep o f a Wrought Ni-Base Superalloy, to appear in proceedings o f Creep 2008, May 2008
[44] H .J. McQueen, N.D. Ryan, E.V. Konopleva, X. Xia, Formation and Application o f Grain Boundary Serrations, Canadian Metallurgical Quarterly, Vol.34, No.3, 1995, pp.219-229
[45] D-W. Suh, T. Inoue, S. Torizuka, A. Ohmori, K. Nagai, Serration o f Grain Boundary in Ni-30Fe Alloy through High Temperature Deformation, ISIJ International, Vol.42, No.9, 2002, pp. 1026-1032
[46] K.U. Snowden, The Formation o f Boundary Serrations and Cavities During High-Temperature Fatigue, Metals Forum, Vol.4, No.1-2, 1981, pp.106-111
[47] V. Raman, Serrated Grain Boundary Formation during High Temperature Fatigue, Metallurgical Transactions A, Vol.l7A, No.6 , 1986, pp.l 100-1102
[48] M.J. Donachie, S.J. Donachie, Superalloys: A Technical Guide, U.S.A.: ASM International, 2002
[49] R. Thamburaj, A.K. Koul, W. Wallace, T. Terada, M.C. de Malherbe, The Influence o f Microstructure Upon the Creep and Fatigue Crack Growth Behaviour in Inconel 718, Time-Dependent Fracture, V ol.l, 1985, pp.245-260
137
R eproduced with perm ission of the copyright owner. Further reproduction prohibited without perm ission.
[50] A.K. Koul, P. Au, N. Bellinger, R. Thamburaj, W. Wallace, J-P. Immarigeon, Development o f a Damage Tolerant Microstructure fo r Inconel 718 Turbine Disc Material, Superalloys 1988, The Metallurgical Society, 1988, pp.3-12
[51] K.N. Tu, D. Turnbull, Morphology o f Cellular Precipitation o f Tin From Lead- Tin Bicrystals, Acta Metallurgica, Vol. 15, No.2, 1967, pp.369-376
[52] A.K. Koul, R. Thamburaj, Serrated Grain Boundary Formation Potential o fN i- Based Superalloys and Its Implications, Metallurgical Transactions A, V0 I.I6 A, N o.l, 1985, pp. 17-26
[53] X.J. Wu, A.K. Koul, Grain Boundary Sliding at Serrated Grain Boundaries, Advanced Performance Materials, Vol.4, N o .4 ,1997, pp.409-420
[54] A.K. Koul, G.H. Gessinger, On the Mechanism o f Serrated Grain Boundary Formation in Ni-based Superalloys, Acta Metallurgica, Vol.31, No.7, 1983, pp.1061-1069
[55] A.K. Koul, D.D. Morphy, Serrated Grain Boundary Formation in Nickel-base Superalloys, Microstructural Science Vol. 11. Proceedings o f the Fifteenth Annual Technical Meeting o f the International Metallographic Society, 1983, pp.79-88
[56] H.L. Danflou, M. Marty, A. Walder, Formation o f Serrated Grain Boundaries and Their Effect on the Mechanical Properties in a P/M Nickel Base Superalloy, Proceedings o f the Seventh International Symposium on Superalloys, 1992,pp.63-72
[57] H.L. Danflou, M. Macia, T.H. Sanders, T. Khan, Mechanisms o f Formation o f Serrated Grain Boundaries in Nickel Base Superalloys, Superalloys 1996, The Metallurgical Society, 1996, pp. 119-127
[58] J.M. Larson, Carbide Morphology in P/M IN-792, Metallurgical Transactions A, Vol.7A, No. 10, 1976, pp. 1497-1502
[59] J.M. Larson, S. Floreen, Metallurgical Factors Affecting the Crack Growth Resistance o f a Superalloy, Metallurgical Transactions A, V0 I.8A, N o.l, 1977, pp.51-55
[60] T.M. Maccagno, A.K. Koul, J-P. Immarigeon, L. Cutlet, R. Allem, G. L’Esperance, Microstructure, Creep Properties, and Rejuvenation o f Service- Exposed Alloy 712C Turbine Blades, Metallurgical Transactions A, Vol.21A, No.12, 1990, pp.3115-3125
138
R eproduced with perm ission of the copyright owner. Further reproduction prohibited without perm ission.
[61] L. Letellier, M. Guttmann, D. Blavette, Atomic-scale investigation o f grain- boundary microchemistry in the nickel-based superalloy Astroloy with a three- dimensional atom probe, Philosophical Magazine Letters, Vol.70, No.4, 1994, pp. 189-194
[62] M. Chang, A.K. Koul, C. Cooper, Damage Tolerance o f P/M Turbine Disc Materials, Superalloys 1996, The Metallurgical Society, 1996, pp.677-685
[63] X. Du, P. Au, A.K. Koul, J-P. Immarigeon, Creep Rejuvenation fo r T56 Series III IN 738 Second Stage Turbine Blades, SMPL-LTR-ST-2136, 1998
[64] J. Safari, S. Nategh, On the heat treatment o f Rene-80 nickel-base superalloy, Journal o f Materials Processing Technology, Vol.176, N o.1-3, 2006, pp.240-250
[65] Edited by W. Betteridge, J. Heslop, Nimonic Alloys and Other Nickel-Base High- Temperature Alloys, Great Britain: Edward Arnold Publishers Ltd., 1974
[6 6 ] M.F. Henry, Y.S. Yoo, D.Y. Yoon, J. Choi, The Dendritic Growth o f y ’ Precipitates and Grain Boundary Serration in a Model Nickel-Base Superalloy, Metallurgical Transactions A, Vol.24A, No.8 , 1993, pp.1733-1743
[67] D.N. Yoon, M.F. Henry, M.R. Jackson, Precipitation Induced Grain Boundary Migration in Austenitic Alloys, Colloque de Physique, No. C -l, 1990, pp.721-726
[6 8 ] U.H. Hyun, S.W. Nam, Crystallographic Investigations on the Serrated Grain Boundaries in an A IS I316 Stainless Steel, Zeitschrift fur Metallkunde, Vol. 92, No.12, 2001, pp.1331-1334
[69] H.U. Hong, S.W. Nam, The occurrence o f grain boundary serration and its effect on the M 2 3C6 carbide characteristics in an AISI 316 stainless steel, Materials Science and Engineering, Vol.A332, pp.255-261
[70] H.U. Hong, S.W. Nam, The Effect o f Grain Boundary Carbide Characteristics on the Improvement o f Creep-Fatigue Properties in AISI 304 Stainless Steels, TMS Annual Meeting, 2002, pp.247-259
[71] H.U. Hong, S.W. Nam, Improvement o f creep-fatigue life by the modification o f carbide characteristics through grain boundary serration in an AISI 304 stainless steel, Journal o f Materials Science, Vol.38, No.7, 2002, pp.1535-1542
[72] K.J. Kim, H.U. Hong, K.S. Min, S.W. Nam, Correlation between the carbide morphology and cavity nucleation in an austenitic stainless steels under creep- fatigue, Materials Science and Engineering A, Vol.387-389, 2004, pp.531-535
139
R eproduced with perm ission of the copyright owner. Further reproduction prohibited without perm ission.

[73] K J . Kim, H.U. Hong, K.S. Min, S.W. Nam, Effects o f Modification o f the Carbide Characteristics Through Grain Boundary Serration on Creep-Fatigue Life in Austenitic Stainless Steels, Acta Metallurgica Sinica, Vol. 17, No.5, 2004, pp.632-638
[74] K.J. Kim, J. Ginsztler, S.W. Nam, The role o f carbon on the occurrence o f grain boundary serration in an AISI 316 stainless steel during aging heat treatment, Materials Letters, Vol.59, N o .ll, 2005, pp.1439-1443
[75] M. Tanaka, H. Iizuka, Effects o f high-temperature ageing on the creep-rupture properties o f cobalt-base L-605 alloys, Journal o f Materials Science, Vol.25,N o.12,1990, pp.5199-5206
[76] M. Tanaka, H. Iizuka, F. Ashihara, Creep-rupture properties and grain-boundary sliding in wrought cobalt-base HS-21 alloys at high temperatures, Journal o f Materials Science, Vol.27, No. 10, 1992, pp.2636-2640
[77] M. Tanaka, Improvement o f Creep-Rupture Properties by Serrated Grain Boundaries in High-Tungsten Cobalt-Base Superalloys, Zeitschrift fur Metallkunde, Vol.84, N o.l, 1993, pp.51-56
[78] M. Tanaka, Effects o f high-temperature ageing on the creep-rupture properties o f high-tungsten cobalt-base superalloys, Journal o f Materials Science, Vol.29,No. 10, 1994, pp.2620-2628
[79] H. Iizuka, M. Tanaka, F. Ashihara, Improvement o f Fatigue Crack Growth Resistance by Serrated Grain Boundary at High Temperature, Journal of Engineering Materials and Technology, Vol.113, N o.l, 1991, pp.9-14
[80] H. Iizuka, M. Tanaka, O. Miyagawa, D. Fujishiro, Effect o f Grain-Boundary Strengthening on High-Temperature Fatigue in an Austenitic Heat-Resisting Steel, Transactions o f the Japan Institute o f Metals, Vol.27, 1986, pp.851-858
[81] H. Iizuka, M. Tanaka, Effects o f Grain-Boundary Reaction Precipitates on the Initiation and Growth o f Short Cracks under High-Temperature, Low-Cycle Fatigue, Transactions o f the Japan Society o f Mechanical Engineers Part A, Vol.55, No.515, 1989, pp.1469-1473
[82] H. Iizuka, M. Tanaka, H. Ashihara, Improvement o f the Fatigue Crack-Growth Property by Grain-Boundary Reaction Precipitates at High Temperatures, Transactions of the Japan Society o f Mechanical Engineers Part A, Vol.54,No.503, 1988, pp.1317-1321
[83] H. Iizuka, M. Tanaka, H. Ashihara, Improvement o f Low-cycle Fatigue Strength by Serrated Grain Boundary, Strength o f Metals and Alloys (ICSMA 8) Proceedings o f the 8 th International Conference, Vol.2, 1988, pp.689-694
140
R eproduced with perm ission of the copyright owner. Further reproduction prohibited without perm ission.

[84] M. Tanaka, H. Iizuka, Grain-Boundary Crack Initiation and Toughening Mechanism in High-Temperature Creep o f an Austenitic Cr-Mn-Ni Steel, JSME, 1986, pp.187-192
[85] M. Tanaka, H. Iizuka, F. Ashihara, Effects o f serrated grain boundaries on the crack growth in austenitic heat-resisting steels during high-temperature creep, Journal o f Materials Science, Vol.23, N o.l 1, 1988, pp.3827-3832
[8 6 ] M. Tanaka, H. Iizuka, F. Ashihara, Creep Crack Growth in an Austenitic Cr-Ni- Mn Steel, Journal o f Engineering Materials and Technology, Vol.l 12, No.3, 1990, pp.353-357
[87] M. Tanaka, Creep Crack Growth and Fractal Dimension o f the Grain-boundary Fracture in Austenitic 21Cr-4Ni-9Mn Steel, Zeitschrift fur Metallkunde, Vol.8 8 , No.3, 1997, pp.217-224
[8 8 ] Edited by J.P. Frick, Woldman’s Engineering Alloys, 8th Ed.,U.S.A.: ASM International, 1998
[89] ASM Specialty Handbook: Stainless Steels Book, U.S.A., ASM International,1996
[90] M. Tanaka, Grain Refinement by Thermal Cycling in High-nitrogen Austenitic Heat-resistant Steels, Zeitschrift fur Metallkunde, Vol.85, No.6 , 1994, pp.446-452
[91] M. Tanaka, O. Miyagawa, T. Sakaki, D. Fujishiro, The Effect o f the Grain Boundary Reaction on the Creep Rupture Properties o f the Austenitic Heat Resisting Steel, Journal of the Iron and Steel Institute o f Japan, Vol.65, No.7,1979, pp.939-948
[92] M. Tanaka, T. Sakaki, O. Miyagawa, The Deformation and fracture o f austenitic Heat Resisting Steel with Grain Boundary Reaction Nodules, Vol. 13, No.8 , 1978, pp.1658-1670
[93] M. Tanaka, O. Miyagawa, D. Fujishiro, The Effect o f Alloying Elements on the Grain Boundary Reaction in Austenitic Heat Resisting Steels, Journal o f the Japan Institute o f Metals, Vol.41, N o.l, 1977, pp.11-20
[94] D.A. Porter, K.E. Easterling, Phase Transformations in Metals and Alloys, 2nd Ed., Great Britain: Chapman & Hall, 1992
[95] M. Tanaka, T. Sakaki, H. Fujita, Effect o f the Grain Boundary Reaction on the Notched Creep Rupture Strength o f the Austenitic Heat Resisting Steel, Journal of the Iron and Steel Institute o f Japan, Vol.67, No.6 , 1981, pp.784-790
141
R eproduced with perm ission of the copyright owner. Further reproduction prohibited without perm ission.

[96] H. Fujita, M. Tanaka, O. Miyagawa, Effect o f the microstructure on the deformation and fracture behaviour o f an austenitic heat resisting steel, Bulletin o f the Japan Society o f Mechanical Engineers, Vol.23, No.182, 1980, pp.1267- 1274
[97] D ’Agostino Racing Website [Online] September 2007. Available: www.dagostineracing.com
[98] ASM Metals Handbook Ninth Edition - Volume 10 Materials Characterization, U.S.A.: American Society for Metals, 1986
[99] LECO Corporation [Online] September 2007. Available: www.leco.com
[100] ASTM E 139-00, Standard Test Methods fo r Conducting Creep, Creep-Rupture, and Stress-Rupture Tests o f Metallic Materials, American Society for Testing and Materials, 2000
[101] ASM Handbook Formerly Ninth Edition, Volume 8: Mechanical Testing, U.S.A.: American Society for Metals, 1985
[102] ASTM E 112-88, Standard Test Methods fo r Determining Average Grain Size, American Society for Testing and Materials, 1988
[103] M. Evans, Predicting Times to Low Strain fo r a lCrM oV rotor steel using a 6- O projection technique, Journal o f Materials Science, Vol.35, No. 12, 2000, pp.2937- 2948
[104] D.R. Hayhurst, D.A. Lavender, N.G. Worley, A. Salim, An assessment o f the 0 - projection method fo r the representation and extrapolation o f creep data fo r a l% Cr,l/2% M o,l/4% V steel tested at 565°C, International Journal o f Pressure Vessels and Piping, Vol.20, No.4, 1985, pp.289-317
[105] S.G.R. Brown, R.W. Evans, B. Wilshire, A Comparison o f Extrapolation Technique fo r Long-term Creep Strain and Creep Life Prediction based on Equations Designed to Represent Creep Curve Shape, International Journal o f Pressure Vessels and Piping, Vol.24, No.3, 1986, pp.251-268
142
R eproduced with perm ission of the copyright owner. Further reproduction prohibited without perm ission.

Appendix A: Typical 21-4N Material Properties
Table 34. Typical short time room and high temperature tmsile properties. 21—IS
C ondition Test Ultimate 0.2% Yield Elong. R ed. o f HardneTem perature Tensile Strength % area % Brinell(°C) Strength ksi (M Pa)
ksi (M Pa)
Solution Room 162 (1117) 102 (703) 9 9 344Treated 900 (4X2) 3 i4 (?S6) 58 (400) 20 21 242and 1 inn i5w;i 100 (6S9) 55 1565) 18 24 22UAged 121)11 (fo!>) ,36 (593) m (33i) 16 23 208
14; ii.i f N , i 62 (427) 37 (255) 18 25 190lOl'O (570) 38 (262) 25 (172) 27 39 177
Table 35- Typical sirength-mptare properties," 2 /—A '
TestTenure rat ureT PC)
MM) hours 1(100 hours
Strength Elong. Red. of Strength Elong. Red. o fksi (MPa) Cf area % ksi fMPit) % area *5
900 (482) 1(10 (689) 9,0 LiJ.O S3 (572) S.t) 9,01 Iffl)(593) 61 (42U]I 6.0 7.0 50 (344) ■ 5.0 5.01400 (760) 25 (158) — — 13 (S9) _ _ —
Material in the solution treated and aged condition
Table Wk Tvpienl creep simigih. 21—iSI k a t T r e a t m e n t T e s t
T e m p e r a t u r e»F r r )
Solution Treated and Aeed
1001)
3 >511 ( 7%J. )
Creep Slrrrwth ksi (MPa) tor Creep Kate of:
l'-i in lUU.UUO Ins P , m in.nnn lire
33 1,22? ) 4f|3 > 7 )
3.6 (25) 7 ,4 (3 0 )
Table 37. Typhal fatigue strength in the sohttitm treated mu! aged etmditMii. 31 -TV
R imjih Temperature 14lirT: (7 « rC )
S tress, ksi ( M l 'j ) ItK'Kl ( \ cles Stress, ksi (M Pa) 1000 t
?5 (517) 65 50 (344) 2173 (503! 120 43 (296) lt.9s71 |4»9) 250 5H (262) 823669 (475) 500 32 (220) 4227968.5 (470) h iu h ir .im v 30 p ( * | e»422?
limit
[33] Lula, R.A., Manganese Stainless Steels, Paris, France: The Manganese Center, 1986
143
R eproduced with perm ission of the copyright owner. Further reproduction prohibited without perm ission.

Appendix B: Metallographic Preparation
Mount specimen in bakelite and sand off edge on opposite side o f specimen surface with belt sander. This will preserve your fingers while holding the sample.
If the sample surface is irregular or coarse, start with the 120 grit belt sander. Place the sample against the belt and apply even pressure. Hold for a few moments and then dip in water to cool the surface. Rotate specimen by 90° and continue sanding surface until it is flat and all the sanding marks are in the same direction. Remember to continuously cool the sample to avoid possible microstructural changes.
Figure B l: 120grit belt sander for rough sample preparation.
Now proceed to the Handimet Grinder. Replace sanding sheets if necessary.Turn on water flow and begin with the 240 grit sheet. Place the sample on the sheet and push it back and forth on the sheet. Start at the front and push towards the back, then pull back towards the front.
Figure B3: Sample grinding on Handimet Grinder.
144
R eproduced with perm ission of the copyright owner. Further reproduction prohibited without perm ission.

Do ten back and forth strokes and then check the sample surface. If all the sanding lines point in the same direction, rotate 90° and repeat. Otherwise continue with this orientation. This will ensure a flat specimen surface.
Once grinding is finished after the third 90° rotation and the sample shows sanding lines are all pointing in the same direction, proceed to 320 grit. This time, just push towards the back and lift the sample to bring it to the front. Do this ten times and check the surface. If all the sanding lines point in the same direction, rotate 90° and repeat. Otherwise continue with this orientation.
Do the same for the 400 and 600 grits. The procedure is simple but can be time consuming. Always do the four rotations for each level o f grit.
Once finished with the 600 grit, rinse the sample surface with water and then use some dish soap to clean it. Rinse the dish soap off and place the sample in a beaker with distilled water and a small amount of acetone. Place the beaker into the ultrasonic cleaner and let it run for 15 - 20 minutes. Up to 3 samples fit into an average sized 250 mL beaker at the same time.
r
*■-f
Figure B4: Ultrasonic cleaning o f sample.
Once that is done, remove the sample and rinse with water, followed by rinsing with methanol. Blow dry the sample a bit, but it’s not necessary to completely dry it. Then rinse with acetone and blow dry completely.
Now comes the diamond polishing step. It is best to wear gloves and a lab coat. This will prevent clothing stains and keep your fingers from becoming raw.
Start with 6 micron diamond polishing compound and a TexMet 2500 polishing cloth. Spray some distilled water on the cloth while it is rotating. Then stop the polishing wheel and apply some polish to the cloth. Use a sample to spread out the polish.
145
R eproduced with perm ission of the copyright owner. Further reproduction prohibited without perm ission.
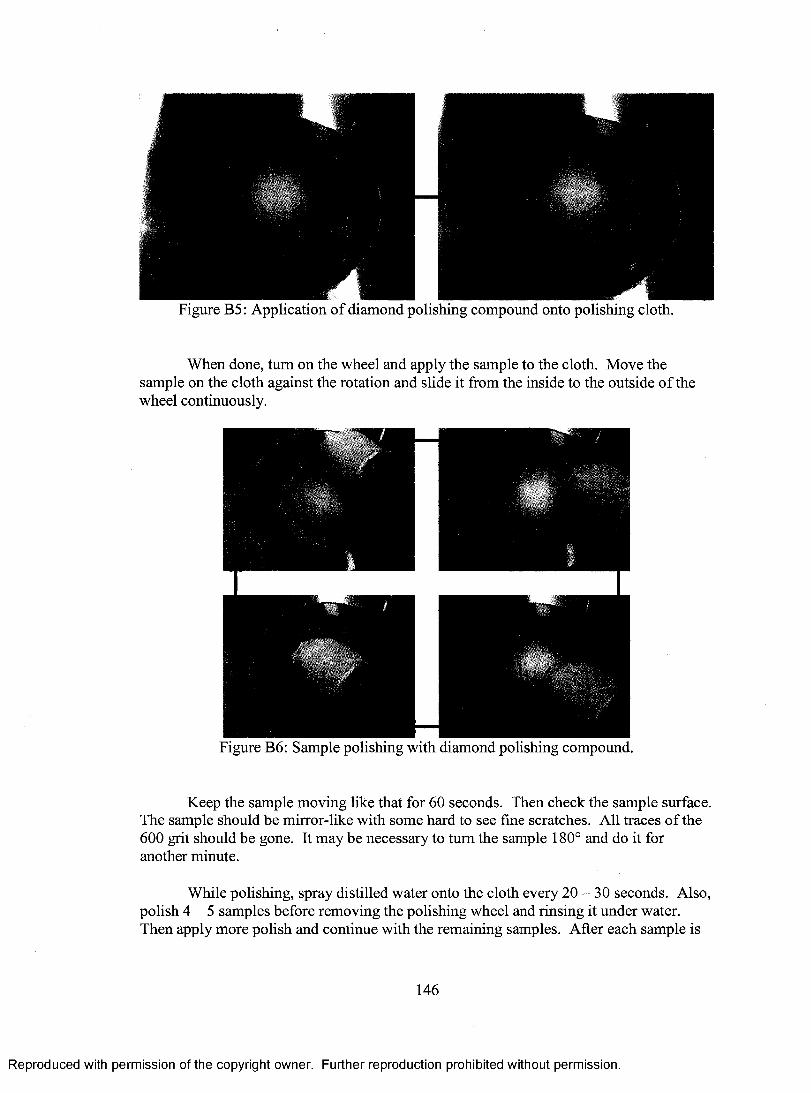
Figure B5: Application of diamond polishing compound onto polishing cloth.
When done, turn on the wheel and apply the sample to the cloth. Move the sample on the cloth against the rotation and slide it from the inside to the outside o f the wheel continuously.
Figure B6 : Sample polishing with diamond polishing compound.
Keep the sample moving like that for 60 seconds. Then check the sample surface. The sample should be mirror-like with some hard to see fine scratches. All traces o f the 600 grit should be gone. It may be necessary to turn the sample 180° and do it for another minute.
While polishing, spray distilled water onto the cloth every 20 - 30 seconds. Also, polish 4 - 5 samples before removing the polishing wheel and rinsing it under water. Then apply more polish and continue with the remaining samples. After each sample is
146
R eproduced with perm ission of the copyright owner. Further reproduction prohibited without perm ission.

polished, rinse it carefully under water. The 1 micron procedure is identical to the 6 micron polishing procedure. If it seems that the sample is becoming more scratched from the 1 micron polishing, just add a little more polish and water. Again rinse the samples thoroughly after polishing.
The 0.3 micron alumina is the final polishing step. The alumina powder is mixed with water and needs to be thoroughly shaken before use. The polishing cloth is different for the alumina as it has large naps.
Figure B7: Microcloth for polishing with alumina.
Generally, about 30 seconds o f moving the sample side to side is required. If need be, rotate the sample 180° and polish for another 30 seconds. Rinse samples afterwards. The surface should be like a mirror with no scratches.
Now comes the final cleaning. Rinse the sample with water and apply dish soap. Use Kim Wipes to clean the soapy surface. Rinse again with water and place in a beaker with acetone and distilled water. Again ultrasonically clean for 15 - 20 minutes. When done, rinse with water followed by methanol. Blow dry and rinse with acetone. Completely blow dry and store in a sealed container to await etching.
147
R eproduced with perm ission of the copyright owner. Further reproduction prohibited without perm ission.

Appendix C: Creep Testing Procedure
Preparing for a creep test involves an assortment o f steps; not all o f which are always necessary.
Going from top to bottom you start with balancing the lever arm. It is necessary to remove the effect o f the load support from the testing load. Do this by installing a single connecting rod with a mounted specimen grip. Then move the weight on the lever arm until it is balanced. It is not always necessary to check the balance o f the lever arm though it should be done periodically.
Balancing weight of lever arm
Connecting rod
Specimen grip
Load support
Figure C l: Balancing of load train.
Next ensure the level sensing arm is fully functional. Do this by moving it up and down, ensuring that it can move freely without any obstruction except for the lever arm.
Level sensing arm
Figure C2: Testing the level sensing arm.
148
R eproduced with perm ission of the copyright owner. Further reproduction prohibited without perm ission.

Turn on the main furnace power. Then use the metal cord attached to the level sensing arm to lower and raise the arm. A series o f ‘clicks’ should be heard as the arm is put through its range o f motion. This level sensor controls a switch located in the bottom of the creep frame. It is the switch which produces the ‘clicks’.
Switch controlled by level sensing arm
Figure C3: Creep frame power switch controlled by the level sensing arm.
When the level sensing arm is roughly horizontal, the switch is “on”, allowing power to flow to the furnace. When the sensor is down left, or rotated counter-clockwise from the horizontal, it turns the switch “o ff’. No power is available to the furnace then. This ensures that when the creep sample physically breaks and the lever arm drops, the furnace will immediately shut off.
The level sensing arm also controls the load train draw head. The draw head is connected to a motor through a chain drive. It pulls on the load train to lift the load and bring the level arm to a horizontal position. As the specimen creeps, the lever arm will lower left. The level sensing arm ensures the lever arm stays horizontal by activating the draw head as needed for extremely brief periods o f time.
Figure C4: Load train draw head.
149
R eproduced with perm ission of the copyright owner. Further reproduction prohibited without perm ission.

Make sure the level sensing arm is functioning properly before proceeding any further. Once that is done, remove the connecting rod used for balancing the lever arm. Then it is necessary to ensure the threaded load train connections are sufficiently lubricated. Inspect the connections and remove them to clean and lubricate if necessary. Due to the heat from the furnace, use a high temperature anti-seize compound such as Nikal.
Load train components to be
inspected
Figure C5: Load train components to be inspected and cleaned/lubricated if necessary.
The only connections that actually need to be cleaned with a wire brush are the couplings that the connecting rods thread into. Here foreign materials are introduced as the rods are removed and installed. Also, the linear couplings should have extra lubricant packed in on both sides if necessary.
Reassemble the load train components and reinstall into the creep frame. Check that the control thermocouple is firmly secured in the furnace. If the control thermocouple were to shift during the test startup or during the actual test, the temperature would likely change rapidly inside the furnace.
■ Furnace control
thermocouple
Figure C6 : Furnace control thermocouple must be firmly secured.
150R eproduced with perm ission of the copyright owner. Further reproduction prohibited without perm ission.

Now the creep specimen can be mounted into an extensometer. Before this is done the sample must be inspected and certain dimensions measured in order to calculate the gauge length and mass o f load required for the test. The sample inspection involves checking for surface defects such as severe scratches as well as possible dirt and oil from the machining process. Next the sample needs to be measured in certain areas, as shown in Figure C l.
* ----------------------- A -------------------------H
DFigure C7: Creep sample dimensions to be measured.
A number o f measurements need to be taken for each dimension and the average used. Dimension A is the most difficult to measure while dimension D is critical to obtain as accurate a load as possible.
Dimension D can be input into a built in load calculator in the LabView data acquisition user interface (refer to Figure C8 ). The built in load calculator can calculate the required mass (kg) for a desired stress (MPa) based on a gauge diameter (inches). It can also calculate the resulting stress from a load mass. Refer to Appendix D for more information about the LabView data acquisition system.
mmsmm ■' —Figure C8 : Built in load calculate in the LabView data acquisition user interface.
151
R eproduced with perm ission of the copyright owner. Further reproduction prohibited without perm ission.
Dimensions A, B and C are used to calculate the specimen gauge length. The gauge length in inches is calculated with the following equation:
Gaugelength = A - 2[(5{6) ! - ( ( f y - (C l)
Equation C l is valid for the specimen geometry shown in Section 5, where the 5/16 is the round radius in inches that tapers the specimen from its shoulders to the gauge length. This equation can be used on other sample sizes as long as they are similar to the geometry shown in Section 5. The only change required is to replace the 5/16” round radius to the value o f the alternate geometry.
Proceeding onto the installation of the specimen into the extensometer, remove the nuts at the top end of the extensometer and inspect the knife edges. If the knife edges are still sharp enough to properly fit into the grooves machined in the specimen shoulders, install the specimen into the extensometer (refer to Figure C9). Otherwise it will be necessary to replace the knife edges.
Figure C9: Test specimen being installed into an extensometer.
Replacing the knife edges is fairly simple, involving a 1/8” pin being hammered to push the knife edges out. Refer to Figure CIO.
152
R eproduced with perm ission of the copyright owner. Further reproduction prohibited without perm ission.

Figure CIO: Removal of knife edges with 1/8” pin driven by a hammer.
If the knife edges are particularly seized, it may be necessary to use a press to remove them. Use the custom built jig to hold the extensometer parts in place while the press pushes the 1/8” pin to remove the knife edge (refer to Figure C l 1).
■*H».
Figure C 11: Removal o f knife edge with 1/8” pin with press using custom jig.
Installing new knife edges requires mounting the extensometer parts into a vise and hammering them in.
After a specimen has been installed, take the extensometer to the creep frame in order to test fit the LVDT. Adjust the micrometer holder until it is just at the tip o f the
153
R eproduced with perm ission of the copyright owner. Further reproduction prohibited without perm ission.

LVDT. Make sure the micrometer is completely unscrewed or that the tip is pulled back. This will ensure the sample will creep beyond the range o f the LVDT before the micrometer holder makes contact with the extensometer body. Refer to Figure C l2.Now is also a good time to calibrate the LVDT if this has not already been done (refer to Appendix D).
Figure C12: Test fitting LVDT to adjust micrometer position.
Once the LVDT has been test fit in the extensometer, remove the LVDT and the specimen from the extensometer. Check the ease with which the extensometer slides (refer to Figure C l3).
Figure C l3: Testing ease with which extensometer slides.
If the extensometer does not slide freely, it may be due the micrometer mount being too tightly secured, the upper extensometer assembly rods may not be straight and there may be oxidation products in the extensometer body (refer to Figure C l4).
154
R eproduced with perm ission of the copyright owner. Further reproduction prohibited without perm ission.
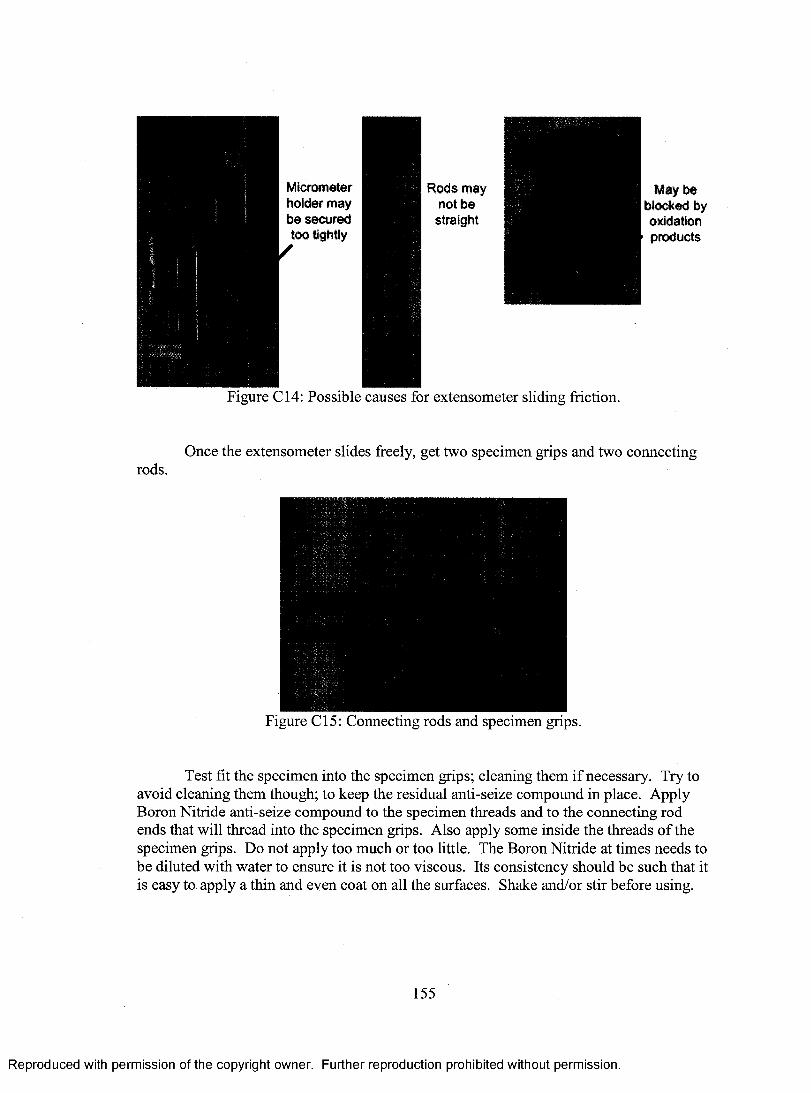
Figure C14: Possible causes for extensometer sliding friction.
Once the extensometer slides freely, get two specimen grips and two connectingrods.
Figure C l5: Connecting rods and specimen grips.
Test fit the specimen into the specimen grips; cleaning them if necessary. Try to avoid cleaning them though; to keep the residual anti-seize compound in place. Apply Boron Nitride anti-seize compound to the specimen threads and to the connecting rod ends that will thread into the specimen grips. Also apply some inside the threads o f the specimen grips. Do not apply too much or too little. The Boron Nitride at times needs to be diluted with water to ensure it is not too viscous. Its consistency should be such that it is easy to apply a thin and even coat on all the surfaces. Shake and/or stir before using.
155
R eproduced with perm ission of the copyright owner. Further reproduction prohibited without perm ission.
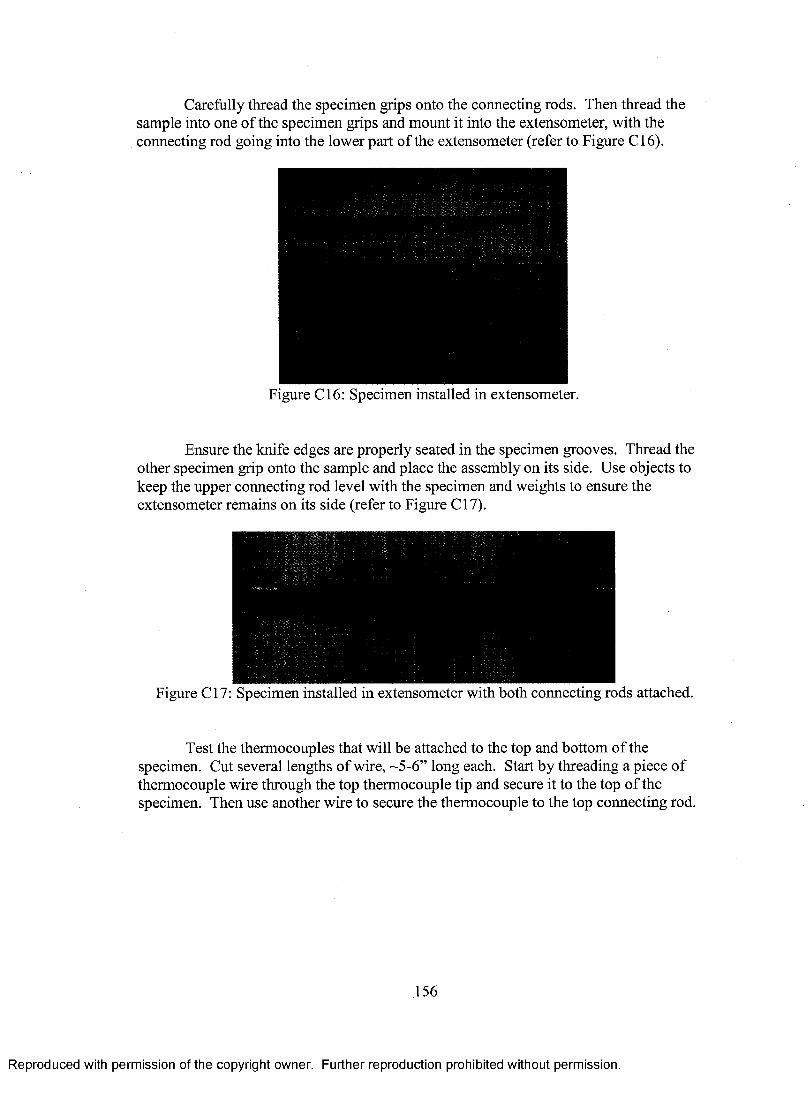
Carefully thread the specimen grips onto the connecting rods. Then thread the sample into one o f the specimen grips and mount it into the extensometer, with the connecting rod going into the lower part o f the extensometer (refer to Figure C l 6 ).
Figure C l6 : Specimen installed in extensometer.
Ensure the knife edges are properly seated in the specimen grooves. Thread the other specimen grip onto the sample and place the assembly on its side. Use objects to keep the upper connecting rod level with the specimen and weights to ensure the extensometer remains on its side (refer to Figure C17).
Figure C l7: Specimen installed in extensometer with both connecting rods attached.
Test the thermocouples that will be attached to the top and bottom of the specimen. Cut several lengths o f wire, ~5-6” long each. Start by threading a piece o f thermocouple wire through the top thermocouple tip and secure it to the top o f the specimen. Then use another wire to secure the thermocouple to the top connecting rod.
156
R eproduced with perm ission of the copyright owner. Further reproduction prohibited without perm ission.

Figure C l 8 : Thermocouple attached to top o f specimen and secured to specimen gripwith thermocouple wire.
Do the same thing with the second thermocouple by attaching it to the bottom of the specimen. Give the bottom thermocouple more slack when attaching it to the connecting rod so that it may slide freely when the sample creeps.
Figure C19: Thermocouples attached to top and bottom of specimen and secured to specimen grip with thermocouple wire.
Finally secure both thermocouples near the top o f the connecting rod.
157
R eproduced with perm ission of the copyright owner. Further reproduction prohibited without perm ission.

Figure C20: Thermocouples secured to top connecting rod with thermocouple wire.
Install the test assembly into the creep frame. Connect the thermocouples to the Omega DP462 Thermometer. Ensure that the top thermocouple is connected to #1, and the bottom to #2. The connectors on the thermometer are labeled accordingly.
Figure C21: Thermocouples attached to Omega DP462 Thermometer.
Next, get a handful o f small flat metal weights as well as one o f the largest weights that will be needed for the sample load. For the specific specimen being used to demonstrate this procedure, a load o f just over 5kg was needed. The closest weight to that available was 4.179kg. The small assorted weights will be used to support the sample load before the test is started. Place enough o f the weights under the load support so that as the lever arm is lowered, a single ‘click’ is heard followed shortly by the load support resting on the support weights. Then the largest load weight can be placed on the load support to keep it in place.
158
R eproduced with perm ission of the copyright owner. Further reproduction prohibited without perm ission.
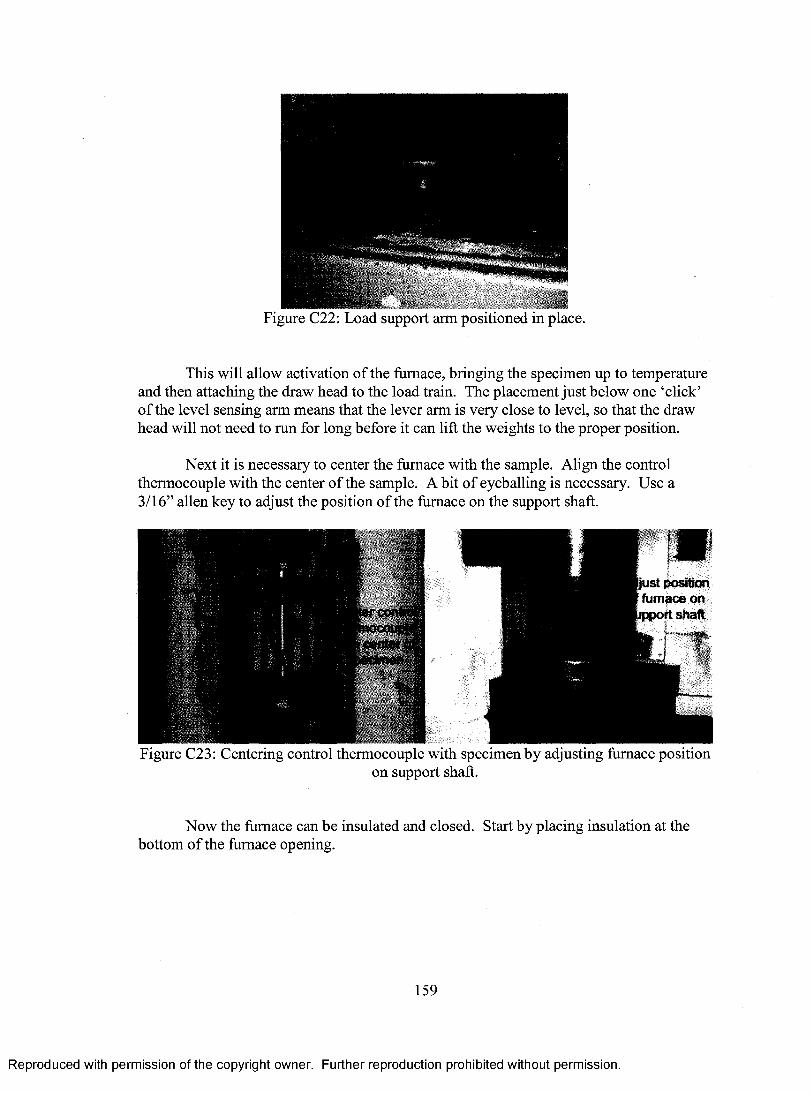
Figure C22: Load support arm positioned in place.
This will allow activation of the furnace, bringing the specimen up to temperature and then attaching the draw head to the load train. The placement just below one ‘click’ o f the level sensing arm means that the lever arm is very close to level, so that the draw head will not need to run for long before it can lift the weights to the proper position.
Next it is necessary to center the furnace with the sample. Align the control thermocouple with the center o f the sample. A bit o f eyeballing is necessary. Use a 3/16” alien key to adjust the position of the furnace on the support shaft.
ijust position furnace on pport shaft
Figure C23: Centering control thermocouple with specimen by adjusting furnace positionon support shaft.
Now the furnace can be insulated and closed. Start by placing insulation at the bottom of the furnace opening.
159
R eproduced with perm ission of the copyright owner. Further reproduction prohibited without perm ission.

Figure C24: Insulate bottom of furnace opening.
Next, close the furnace carefully and make sure the bottom insulation remained securely in place. Then use the latches to secure the furnace shut. Insulate the top opening in layers.
Figure C25: Top o f furnace insulated in layers.
Once that is done, turn the ‘Main Switch” on, and then turn the “Controller” on. Then press the ‘Process Variable/Set Point’ button on the controller and use the “Incr” and “Deer” buttons to set the first temperature about 150 - 200°C below the test temperature. Then wait 4 seconds and press the Process Variable/Set Point’ button again. Turn the “Controller” off and then on again to speed up the furnace start (refer to Figure C26).
160
R eproduced with perm ission of the copyright owner. Further reproduction prohibited without perm ission.

Figure C26: Furnace controller.
While the furnace begins to heat up, load the remaining weights onto the load support arm. Also, set up the data file on the data acquisition system. Refer to Appendix D for further details on setting up the data file.
Although it would be ideal to get the samples to heat up at the same rate, the reality is that not all the furnaces heat up equally fast. The goal is to bring the temperature up fairly quickly, to within 10-15°C o f the test temperature. Along the way though, it may be necessary to correct for temperature variations between the bottom and top of the sample. Check for these variations using channels 1 (top) and 2 (bottom) on the Omega DP462 Thermometer. Very large differences, ~5°C or more should be corrected once the sample reaches 150 - 200°C below the test temperature. Then, increment by 50°C or so and correct if necessary. Fine tuning is done slowly when the temperature gets to within 10°C or so o f the test temperature. Then, increment the temperature by 2°C or so and make adjustments to the bottom and top SCRs. The adjustments are made using control knobs next to the furnace controller (refer to Figure C27).
161
R eproduced with perm ission of the copyright owner. Further reproduction prohibited without perm ission.

Figure C27: SCR control knobs used to adjust the temperature difference across thespecimen.
Changing the value of the control knob changes the firing rate o f the furnace SCRs. The control knobs are used to adjust the temperature at the top and bottom o f the specimen to be nearly the same. There will likely end up being a difference in the temperature o f the control thermocouple and the thermocouples mounted on the specimen. The ones on the specimen should be used for the test temperature. Adjust the control thermocouple temperature as needed to get the right test temperature at the specimen.
The test temperature is not to be exceeded by more than 1°C. Carefully bring the temperature up. There can be no more than 1°C difference between the top and bottom of the specimen, and be within 1°C o f the test temperature. Once the temperature is at the test temperature, the draw head can be attached to the bottom connecting rod.
Use a pair o f vise grips to prevent the connecting rod from rotating. Raise the draw head until it nearly touches the connecting rod. Then thread the draw head on.
162
R eproduced with perm ission of the copyright owner. Further reproduction prohibited without perm ission.

Figure C28: Attaching the drawhead by threading it onto the bottom connecting rod.
Attach the LVDT to its mounting point (refer to Figure C28). Fully compress the LVDT with the micrometer and check the voltage output using the Fluke 45 Dual Display Multimeter. Each LVDT is attached at a specific channel to the data acquisition system. The channels in use currently are 0-5 for frames 1-5. Frame five uses channels 4 and 5 due to the dual LVDT extensometer that is used. Uncompress the LVDT to get Vi V above the max compressed voltage (refer to Appendix D for further information about the data acquisition system). Run the draw head down until there is tension in the load train. Stop and then run it in short bursts until the load train cannot easily move side to side. Keep checking the LVDT voltage to ensure the load has not been partly applied.
Once that is ready, press the start button in the LabView data acquisition user interface and quickly turn the timer on and set the draw head to “Auto inch down”.Finally use an object such as shown to slide the supports out from under the load. Be careful when doing so to avoid disturbing the data being gathered by the LVDT.
163
R eproduced with perm ission of the copyright owner. Further reproduction prohibited without perm ission.

Figure C29: Starting the creep test by pressing the ‘Start’ button in the LabView data acquisition program and then quickly turning the timer on and setting the draw head to
‘Auto Inch Down’ followed by removal o f the load supports.
When a test specimen fails, the load will drop, shutting off the furnace power and the creep frame timer. The first things to do are to turn off the main creep frame power, turn the furnace controller off, turn the timer off and move the draw head switch to ‘neutral’. Then record the length o f the creep test from the frame timer.
Remove the LVDT from the extensometer and then remove the insulation from the top o f furnace. Open the furnace and remove the bottom insulation. Store the insulation carefully for future use.
Next, disconnect the draw head from the connecting rod at the bottom.Disconnect the thermocouples from the DP462 connectors and remove the test specimen assembly from the creep frame. Place the assembly on a table and cut the wires that hold the thermocouples. Care should be taken when removing the thermocouples as the portions within the furnace should not be bent or twisted. Bending or twisting may cause the thermocouple wire to fracture. Careful handling allows multiple tests to be run with the same thermocouples.
164
R eproduced with perm ission of the copyright owner. Further reproduction prohibited without perm ission.

Next remove the connecting rods from the specimen and remove the specimen from the knife edges. Inspect the knife edges to ensure they are still sufficiently sharp to keep the specimen firmly in place. If the knife edges are suspect, remove the set and install a new set.
165
R eproduced with perm ission of the copyright owner. Further reproduction prohibited without perm ission.

Appendix D: Data Acquisition System
The data acquisition system is made up o f LVDTs, signal conditioners, a National Instruments USB DAQ and a PC laptop with LabView software. Using the system is fairly straight forward thanks to the LabView software interface.
Figure D l: LabView data acquisition software interface.
Before any creep test is run, the LVDT to be used should be calibrated using the extensometer mounted micrometer and a multimeter. The micrometer is used to compress/uncompress the LVDT by known distances while the multimeter is used to measure the voltage signal the LVDT is sending to the DAQ.
The first step is to mount a sample into the extensometer to prevent any movement. Then place the extensometer on the creep frame and mount the LVDT into its holder on the extensometer (refer to Figure D2).
166
R eproduced with perm ission of the copyright owner. Further reproduction prohibited without perm ission.

Figure D2: Extensometer with mounted specimen ready to calibrate an LVDT.
Turn on the Fluke 45 multimeter and compress the LVDT to maximum using the micrometer by twisting it until the LVDT is completely compressed. In order to find out what the LVDT voltage signal is, it is necessary to know what channel the specific creep frame has been assigned on the DAQ. The data acquisition system uses the analog terminals o f the DAQ and single-ended mode as seen in Figure D3. The analog terminals are labeled 1 to 16. There are in total 8 input channels available, labeled AIO to AI7.Each shares a common ground, with AIO and AI4 sharing terminal 1, A ll and AI5 sharing terminal 4, and so on.
Ttrtuna)Sisn.»l,
S n ||r .{ jllln l M nit
1 GOT)
1 1 2 AIO
ft-l u *j A N
T j4 GN'D
♦m i
J
M*r*» S A ll
!ESJtm lm lB OG j :
A *6 At 5
j| «S 1 OKU
j * A lt
1U ! 1a .mb -**1 * , -<■*'
m*> A16
! 10 GOT)
jImW" •**K» II At J
«■»s 12 AI?
jssp*m r . - - h 4iCSiM
«IBm
l.» GNU
3 3
14 AO (I
IS AO 1
w GOT)
Figure D3: DAQ analog terminal assignments [1].
167
R eproduced with perm ission of the copyright owner. Further reproduction prohibited without perm ission.
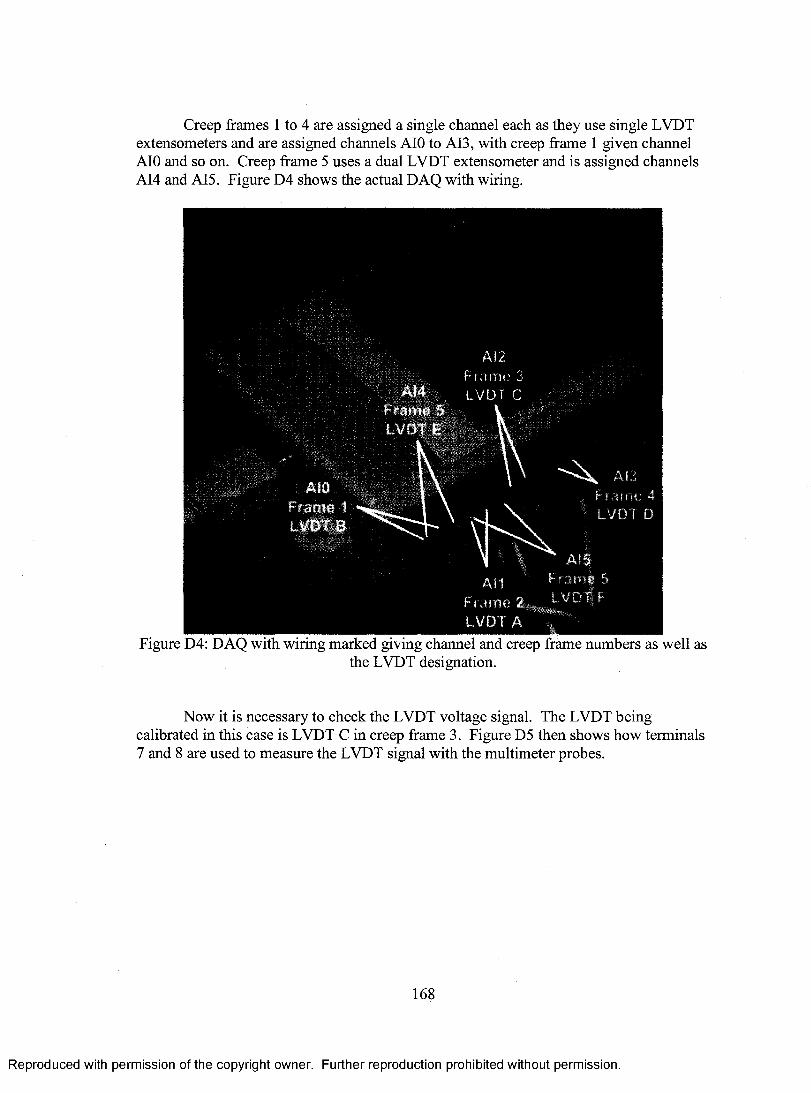
Creep frames 1 to 4 are assigned a single channel each as they use single LVDT extensometers and are assigned channels AIO to AI3, with creep frame 1 given channel AIO and so on. Creep frame 5 uses a dual LVDT extensometer and is assigned channels AI4 and AI5. Figure D4 shows the actual DAQ with wiring.
Figure D4: DAQ with wiring marked giving channel and creep frame numbers as well asthe LVDT designation.
Now it is necessary to check the LVDT voltage signal. The LVDT being calibrated in this case is LVDT C in creep frame 3. Figure D5 then shows how terminals 7 and 8 are used to measure the LVDT signal with the multimeter probes.
168
R eproduced with perm ission of the copyright owner. Further reproduction prohibited without perm ission.
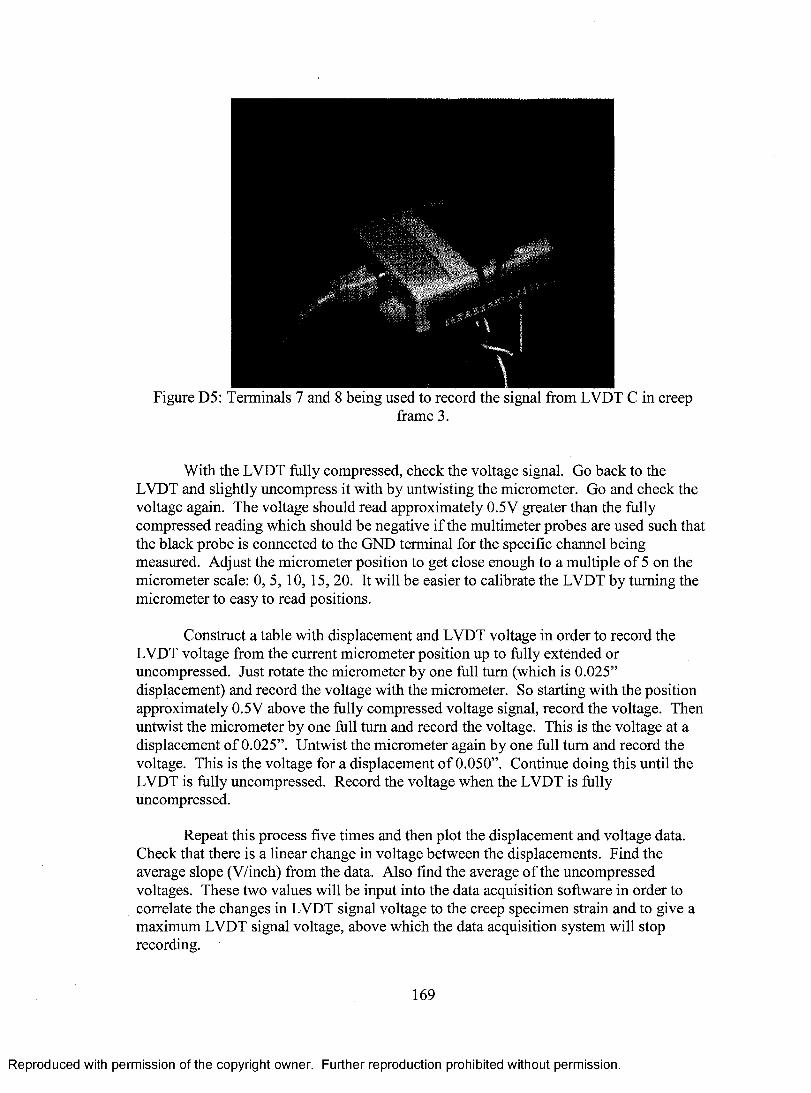
Figure D5: Terminals 7 and 8 being used to record the signal from LVDT C in creepframe 3.
With the LVDT fully compressed, check the voltage signal. Go back to the LVDT and slightly uncompress it with by untwisting the micrometer. Go and check the voltage again. The voltage should read approximately 0.5 V greater than the fully compressed reading which should be negative if the multimeter probes are used such that the black probe is connected to the GND terminal for the specific channel being measured. Adjust the micrometer position to get close enough to a multiple o f 5 on the micrometer scale: 0, 5, 10, 15, 20. It will be easier to calibrate the LVDT by turning the micrometer to easy to read positions.
Construct a table with displacement and LVDT voltage in order to record the LVDT voltage from the current micrometer position up to fully extended or uncompressed. Just rotate the micrometer by one full turn (which is 0.025” displacement) and record the voltage with the micrometer. So starting with the position approximately 0.5V above the fully compressed voltage signal, record the voltage. Then untwist the micrometer by one full turn and record the voltage. This is the voltage at a displacement o f 0.025”. Untwist the micrometer again by one full turn and record the voltage. This is the voltage for a displacement o f 0.050”. Continue doing this until the LVDT is fully uncompressed. Record the voltage when the LVDT is fully uncompressed.
Repeat this process five times and then plot the displacement and voltage data. Check that there is a linear change in voltage between the displacements. Find the average slope (V/inch) from the data. Also find the average o f the uncompressed voltages. These two values will be input into the data acquisition software in order to correlate the changes in LVDT signal voltage to the creep specimen strain and to give a maximum LVDT signal voltage, above which the data acquisition system will stop recording.
169
R eproduced with perm ission of the copyright owner. Further reproduction prohibited without perm ission.

With the LVDT calibration complete, if the LabView program is not currently running, start LabView and open the file labeled “creep_2LVDT”. Figure D 6 shows the screen that will come up when the file is open. Click the ‘Run’ button to run the program.
Figure D6 : Data acquisition program after initial start up.
Now it is assumed that the LVDT calibration has been completed and the test specimen has been measured with the gauge length and diameter known as well as the load required. With the data acquisition program running, the screen should look as shown in Figure D7.
p-fifipjaiTir.........................- .......................................... ■_______ - -a1 a
.SJfWSiWli,.
*»? tarn u
K••V.; j r . . M - i -
Figure D7: Operating data acquisition program.
170
R eproduced with perm ission of the copyright owner. Further reproduction prohibited without perm ission.

Now it is necessary to input the LVDT calibration values, the gauge length, the data sampling frequency and sampling intervals as well as ensuring the proper DAQ channel(s) is(are) selected. Referring to Figure D 8 , under the heading ‘LVDT at max extension (V)’ input the uncompressed voltage found from the LVDT calibration. Under ‘Calibration slope’, input the value found from the LVDT calibration relating change in voltage to displacement. The ‘Gauge Length (in)’ entry is self explanatory and the ‘Channels’ section at the bottom left is also simple. In the case o f testing on creep frame 5 which has two LVDT’s, the proper channel must be selected in the ‘Channels’ section and the appropriate calibration values have to be entered in the prompts below the ‘Gauge Length (in)’ entry for the second LVDT. Otherwise for single LVDT creep frames, leave those entries alone.
Finally the ‘time at interval (hrs)’ and ‘length o f interval (sec)’ should be entered. The ‘time at interval (hrs)’ is the length o f time in hours that the data acquisition software will collect data at the ‘length o f interval (sec)’ specified in seconds. The most commonly used entries for these two prompts are shown in Table D l.
Table D l: Most common entries for ‘time at interval (hrs)’ and ‘length o f interval (sec)’.
_________ Time at interval (hrs)___________________ Length of interval (sec)_______0.1 1
1 609999 1800
The result o f the entries seen in Table D l is that for 6 minutes (0.1 hours), the data acquisition system will collect data every 1 second, followed by a period o f 1 hour where data is collected every 1 minute (60 seconds), and followed by 9999 hours where data is collected every 0.5 hour (1800 seconds).
Frame 1?
0*3
mwi.mkiI hB
' t T
Figure D 8 : Important prompts requiring data entry before the creep test can be started.
171
R eproduced with perm ission of the copyright owner. Further reproduction prohibited without perm ission.

With the prompts shown in Figure D 8 completed, the ‘OK’ button below ‘Run test on Frame # ’, shown on the left can be pressed. A window will pop up with a suggested file name for the test data which will be recorded. It is recommended to just record the file name for reference and press ‘OK’ (refer to Figure D9). The file format is ‘.csv’.
^Frame I Oct IS 2006 0910 _Odl6_2006_12M
|§Fraine_l_Ortl6_2006_1211 l|jFrameJ_Se[>Oi_2006_i619 l|§Fraroe_2_Aug!6_Z0CI6J219 ISFram8_2Juri30.2006_1049 !§Fr«me_2_Nov06_J006_1242 ljjjjjFrsm»_2_Ncv20_JC06 J 130 lgj|Fr»ne_2_Nov20_2006_1352 l§8ft*ne_2Jep01J2006_1621
t f=rame_3_Au9l6_2006_1200 Fr*ne_3_Aug29_2CC6_14S6 ij|jFrane_3Juri30_2006_l05l
®Frme_3.0«ll_2006_1056 3g§Fr*i'e_3_Sep01_20C6_1623
Figure D9: File name window pops up after pressing ‘OK’ under ‘Run test on Frame #?’.
The next window visible is just a reminder o f the remaining settings that must be input and test information that should be recorded to identify the test conditions and test specimen. Press ‘OK’ to continue.
□ •
iHnTWTrtiili
Figure D10: Reminder window of what must be input to configure the data file.
172
R eproduced with perm ission of the copyright owner. Further reproduction prohibited without perm ission.

Following from Figure D l 1, the next set o f steps will be outlined in the Figure captions.
isnep?
1 Frim*2
Figure D l l : Window requiring various inputs in order to complete data fileconfiguration.
j j g f
zzs H S sr“ r~
n
• : j s s £ — Frame 2
'3rr:T ^.!5'‘*fca5o ■ ■". Figure D12: Ensure correct frame is selected.
173
R eproduced with perm ission of the copyright owner. Further reproduction prohibited without perm ission.

V» tfirii »'>H ya*
.n- ,“ l'»x * «/* f
••■C.'sj i' -V , \ v < % p . * . v 7
. I - ' * * ’ ■w-.Br
3P yLVPT A LVDT | WW2 ivi)ic
«N H M a LVDTD I j™ ^ M“ ' LVDT I 1 LVDT F *wpTe
L V D f Hi? r
; * f e i F f f ? 7 3 S s s r a e . -'L'-i1 v f ■«»!«■?.. 1---------- ;— fra:
Figure D13: Choose correct LVDT for future reference of what LVDT was used.
• '* w - E S g r f . . - ■■■-.,>■■■:.. -7-,• ■■ •. .;■■■■:
■ . »5L «*U!_____ _l-sMS p ; * " t I p w ' s s P IVLM A
LVUI BLVDT CLwi DLVUI ILVDTFI VDl CLVDT H
wuts +.■■*■■.
gw» h^ooKftwo^. &C»QG0 nj$$*
i. JtWWa jto\ tJ i•w . ,■ r
i m• T f S - - - - ^ r - .
! ' P ^ “
Figure D14: IMPORTANT! If only using one LVDT, select the last option ‘----- ’ under‘LVDT 2’. Otherwise, if using two LVDT’s, select the appropriate one.
174
R eproduced with perm ission of the copyright owner. Further reproduction prohibited without perm ission.
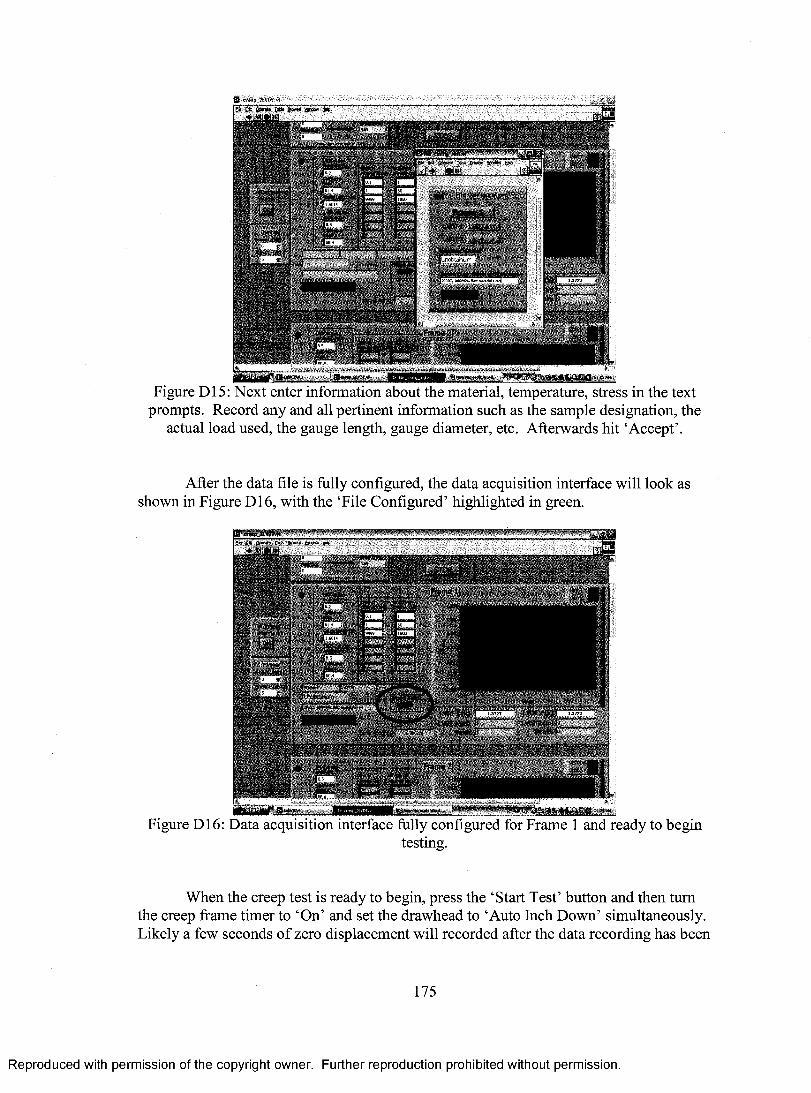
Figure D15: Next enter information about the material, temperature, stress in the text prompts. Record any and all pertinent information such as the sample designation, the
actual load used, the gauge length, gauge diameter, etc. Afterwards hit ‘Accept’.
After the data file is fully configured, the data acquisition interface will look as shown in Figure D16, with the ‘File Configured’ highlighted in green.
a mp jtv&t vi JM_______________lE
4r|^6'V': ; i- - j j--;'"*
« ~a .a rn— ^
J « j r I p T = |• , - j w f - 3 ■ M
t jV ) r — T “ I V O T ip n ! I ,V I
H B l W f " ' UW*flnji'f areia Pm m m
FranrwZ
tmmFigure D16: Data acquisition interface fully configured for Frame 1 and ready to begin
testing.
When the creep test is ready to begin, press the ‘Start Test’ button and then turn the creep frame timer to ‘On’ and set the drawhead to ‘Auto Inch Down’ simultaneously. Likely a few seconds o f zero displacement will recorded after the data recording has been
175
R eproduced with perm ission of the copyright owner. Further reproduction prohibited without perm ission.

started and the test has actually been started in the creep frame. The creep data will be saved to the data file as the data is collected and displayed in the plot on the right.
Once a creep test is completed, the green circle in the top left will no longer be lit and the ‘File Configured’ will be highlighted in red as seen in Figure D17. This indicates the data file has been saved and may be used. Prior to the test completing, the data file cannot be modified in any way, in including copying.
B iN.pjrowv
K'r -===■-
tsar ioo r ”iwtiM r
Fu o i a f l n j r
r.
I ISWwWerawft^.
Figure D17: Data acquisition interface after test is completed.
With the file closed, it may be imported into Microsoft Excel for instance. To do so, open Microsoft Excel and go to Data » Import External Data » Import Data (refer to Figure D18).
9» fe*t toob : {#nd:0(»Sd9 #1 * '<3.
• «:\ Sheetl^ 9«at5 / Sheets /
Figure D18: Importing creep data file into Microsoft Excel.
176
R eproduced with perm ission of the copyright owner. Further reproduction prohibited without perm ission.

A O X L I S I 'T - * - .
J J
, - J . Frame JJKK23 _2006_1 352 WFr«i«JJeo27J005.1554 3jF'«ne.«.ND»aj 0tl6.1131Sp'*i»_‘-°d03_2005J3«
:^FranOJJJ«01J005J659
Hsgam; ; .•I tm'&Kt... i I uwn 1j H«» jAl D»« Srnre! ,:J .....5 i» i .....i
♦ M\SheeU/Shaet2/&ieet3/
Figure D19: Select creep data file (.csv).
U JText Import Wizard - Step 1 of 3 | ? |fx ] J
TheText Wizardhas determined that your dateisDelimibd. vIf this is correct, choose Next, or choose the data type that best describes your data.-Original data type - — ----- -------------------------------- ------------------:—Choose the file type that best describes your data:
^[^iimrtedj - Characters such as commasor tabs separate each field.C Fixed ^d th - Fields are aligned in columns with spaces between each field.
Start import at low: f l " j j File&rigin; ] 437 : OEM U n ite d States
Preview of file C:\Pocuments and 5ettings\Efeabet.. .\FrameJ^.Aug05_^005J456.csv,
Cancel (jJext > j
IJCteeap TastFram e 1 4]Epafce/Tine: A ugust OS 2005 02:S7PH l iS_prM»e 1Z L wpt A.§_ppttcisien H a te r ia i :2 1 4W, 3A hAi ►
Finish
Figure D20: Select ‘Delimited’, and ‘Start import at row’ set to 1.
177
R eproduced with perm ission of the copyright owner. Further reproduction prohibited without perm ission.

rText Import W izard Step 2 of 3 [ ? |fX~]
This screen lets you set the delimiters your.data contains. You can see how your text is affected in the preview below.
(Delimiters-
I .17 lab V Semicolon J ~ gomma j | I- Space I~ Qther: | j
[-Data ureview------------ ---------------------
!~ Treat consecutive delimiters as one
Text auaifier: “3
Z r e e p T e s t F ram e 1> a te / T i m e : f c u g u s t OS 2 0 0 5 0 2 :5 ? P KF ram e 1LVDT AS p e c im e n . M a t e r i a l : 21 4 N , 3A -1jJ >
Cancel < gack Next > Finish
Figure D21: Select ‘Delimiters’ to ‘Tab’.
Text Import W izard Step 3 of 3
This screen lets you select each (iilgmn'aM t theDataTormat.
'General' converts numeric values to numbers, date . values to dates, and all remaining values to text.
(-Column data format <•" general
r Text
Advanced..
r Bate: F®V 3
Do not jmport column (skip)
Data ereview-
F ra m e _ l 3 |A u g u s t OS 2 0 0 S 0 2 :S 7 P M 3 3 1
I21 4H , 3A jd i
<1 1 2 . j
Caneel < |ack I L ljn is h 1
Figure D22: Select ‘Column data format’ to ‘General’, then hit ‘Finish’ in the bottomright.
178
R eproduced with perm ission of the copyright owner. Further reproduction prohibited without perm ission.

Where do you want to put the data?
<• Existing worksheet:
f New worksheet
OK
Cancel
Properties.■■ j P a ia rr^e ;^ ... |
Figure D23: Choose to either import the data into an existing worksheet, or to create anew one.
Note that the options shown in Figure D20 to D22 are generally correctly set by Microsoft Excel, requiring little user input. If the data import went correctly, it should look as shown in Figure D24.
d j j j flte' Edt Bew lwert P f l i i n a t I o o l s Q a t s t f n d o w .
"ft X - ^ 100% . C O I U i S 4 j
^ f f l C r e e c T e s t ^ ^ j F r a r r i e J2 jOate/Time: Augus’ 0 5 200502:57PM3 ’Frame 14 [LVDTA5 (Specimen Material: 21 4N,3A6 !Note: :900 C, approx. 27.4 MPa (actual: 5.39658 kg, 0.247 in dia ), gauge length 1.61 in.7 [T est# Timer (hours) -VDT Disp. (V): LVDT Disp. (in.) Strain Date ’Time
9 > i ............................................................................................... 0.000278 •4.455282 0 0 5/8/2005 14:57:12'1 0 i 2 0.000556 -4.455282. 0 0 5/B/2005:14:57:1311 i 3 0.000833 -4.445002 0.000125 0.000078 543/2005 14:57:1412? 4 0.001111 -4.445082 0.000125 0.000078 543/2005.14:57:1513! 5: 0.001389 -4.445082 0.000125 0.000078 56/2005 14:57:1614i b 0001667 -4.445082: 0.000125 0.000078 543/2005 14:57:1715l 7 0.001944 -4.445082 0.000125 0.000078 643/2005 14:57:18161 8 0.002222 -4.434882 0.000251 0.000156 543/2005 14:57:1917l 9 0.0025 -4.434882 0.000251 0.000156 543/2005:14:57:2018! 10 0.002776 4.434882! 0.000251 0.000156 5/8/2005’ 14:57:21
'19! 11 0003056 4.434882’ 0.000251 0.000156 5/8/2005! 14:57:2220] 12: 0.003333 4.434B82: 0.000251 0.000156 5/8/2005114:57:23211 13: 0.003611 -4.434802! 0.000251 0.000156 5/8/2005! 14:57:2422 j 14’ 0.003889 4.434882! 0.000251 0.000156 543/2005! 14:57:25.2 3 1 16: 0.004167 4.434882: 0.000251 0.000156 543/2005:14:57:262 4 1 16: 0.004444 4.434882’ 0.000251 0.000156 543/2005.14:57:2725! ' 17’ 0.004722 -4 424602 0.000376 0.000233 54326 j 18 0.005 4.424682: 0.000376 0.000233 543/2005:14:57:29
2 ? I 19 0.005278 4.434882: 0.000251 0.000156 5/8/2005:14:57:30281 20: 0005556 -4.424682: 0.000376 0.000233 5/8/2005! 14.57:31291 21 0.005833 -4.424682’ 0.000376 0.000233 5/8/2005:14.57:3230! 22 0.006111 4.424682’ 0.000376 0.000233 5/8/2005:14 57:3331 j 23 0.006389 4.424682 0.000376 0.000233 543/2005! 14:57:3432 r 24 0.006667 4.424682- 0.000376 0.000233 5.6/2005 14:57:3533 I 25 0.006944 4 424602: 0.000376 0.000233 543/2005! 14:57:3634] 26 0 007222 4.424682: 0.000376 0.000233 543/2005:14:57:3735 27 0.0075 4 424602! 0.000376 0.000233 5/8/2005:14:57:38
.3 6 J 26 0007778 4.424602: 0.000376 0.000233 5/8/2005:14:57:39
n n m “ ! -m 4 > M | \ S h e e t l / s » r e e t 2 X S h p e t 3 / R e a d y
i _ _ _ _ _ ___ I
_ a xA.'.
■■ * * N e w W o r i d M o k * x
’ O p e n a w o r k b o o kPWA 1)13 Log Strar vs Log StrM LVDT A & D Calferaticr, Novembei LVDT E Calibration Feb 28.2006 LVDT Calibration January 29th. 2C
S f Mere workbooks,,.
New□ Slank Workbook
New from existing workbooky} Choose workbook,..
New from templateB j GeneralTemplates...
Templates on my Web Sites...# J Template5onMlcrosoft.com
*ir
C-, Add Network. Piace... (^1 Microsoft Excel Help
Figure D24: Imported data in Microsoft Excel.
Figure D24 shows that the time of each data point is recorded, including the elapsed time o f the internal timer as well as the date and actual time. As well, the LVDT voltage signal is recorded as well as the LVDT displacement which is calculated from the
179
R eproduced with perm ission of the copyright owner. Further reproduction prohibited without perm ission.

calibration slope and the specimen strain, calculated from the displacement and gauge length.
References:
[1] “NI-USB-6008”, National Instruments Products and Services, [Online] July 2007, Available: http://sine.ni.eom/nips/cds/view/p/lang/en/nid/14604
180
R eproduced with perm ission of the copyright owner. Further reproduction prohibited without perm ission.

Appendix E: 6 Projection Analysis Results
700°C & 196MPa
0 Coefficient NGB1 NGB 2 SG BM SGB 1 SGB 26: 0 .001778159 0.00257451 0.000299356 0 .000260165 0.005469197
#2 87.34549732 259.1464027 0.232163686 0.30499213 0 .030866819
03 0.004966776 0.006735941 0.002117822 0 .013855746 0 .005066369
04 0.003698469 0.003404356 0.005727296 0 .003335954 0 .005633253
05 0.000756463 0.000752146 0.000294748 0.000210168
06 0.115820668 0.019970132 0.197088045 0.304607133
07 0.000812773 9.64E-05 7.84E-05 0 .002243943
08 0.014404709 0.101715558 0.096481232 124.0523016
09 0.001090698 0.000893086 0.003126727 0.000294422
010 0.014394588 0.020989207 0.004419088 0.305544282
011 0 .001160815 0.000777233 0.00038411 0 .003304235
012 0 .014390675 0.020152599 0.218001746 0 .024245209
013 0.000146604 0.00328132
014 0.240672803 177.888469
015 0.000653858 0.000168832
016 0.019182113 0.254363281
017 0 .003767805
018 0 .004419277
019 0.003178378
020 0 .004419103
021 0.003485898
022 0.004419194
R eproduced with perm ission of the copyright owner. Further reproduction prohibited without perm ission.

900°C & 27.4MPa
0 C o effic ien t N G B S G B M SG B S G B P rem a tu re ly F a iled
01 0.000665685 0.001024783 0.000142581 0.000172231
6 2 0.000807018 0.000478845 0.052167391 0.085855873
#3 0.00585146 0.00769349 0.008838412 0.005203081
04 0.001229358 0.001302117 0.001093122 0.001378583
05 0.000317554 0.000367594 0.000197407 0.000173602
06 0.056398565 0.154250929 0.052207293 0.086878684
07 0.000214613 0.000339838 0.000186376 0.00017834
08 0.000833371 0.835753196 0.052172401 0.090436223
09 0.000532419 0.000706651 0.000317665 0.000173705
010 0.000812878 49.76813468 52.4920347 0.086955484
011 0.000351435 0.001060624 0.000363523 0.00017894
012 0.056401244 0.000478833 0.520901152 0.090889312
013 0.000332224 0.000350467 5.61 E-05 0.000178331
014 0.440549912 0.384096612 0.052159907 0.090430001
015 0.000861093 0.001143331 0.000140581 0.000172231
016 0.000800829 0.00047881 0.020410945 0.085855873
017 0.000392961 0.001085041
018 0.057071168 0.000478826
019 0.000961911
020 0.000478869
021 0.001403394
022 0.000478762
R eproduced with perm ission of the copyright owner. Further reproduction prohibited without perm ission.

925°C & 27.4MPa
0 C o effic ien t N G B SG B
01 0.000154559 0.000472121
8 2 0.164744966 0.117222038
03 0.004584519 0.007999926
04 0.001672522 0.004743334
05 0.000154399 0.000472121
06 0.164681524 0.117222027
07 0.000153496 0.000472121
08 0.164322621 0.11722203
09 0.000154889 0.000472121
010 0.164875922 0.117222035
011 0.000154467 0.000472121
012 0.16470849 0.11722203
013 0.000155228
014 0.165010061
015 0.00015448
016 0.164713394
183
R eproduced with perm ission of the copyright owner. Further reproduction prohibited without perm ission.