effect of seasonal variation on the composition and ...centaur.reading.ac.uk/36075/3/draft...
TRANSCRIPT
Effect of seasonal variation on the composition and properties of raw milk destined for processing in the UK Article
Accepted Version
Chen, B., Lewis, M. and Grandison, A. (2014) Effect of seasonal variation on the composition and properties of raw milk destined for processing in the UK. Food Chemistry, 158. pp. 216223. ISSN 03088146 doi: https://doi.org/10.1016/j.foodchem.2014.02.118 Available at http://centaur.reading.ac.uk/36075/
It is advisable to refer to the publisher’s version if you intend to cite from the work. See Guidance on citing .
To link to this article DOI: http://dx.doi.org/10.1016/j.foodchem.2014.02.118
Publisher: Elsevier
All outputs in CentAUR are protected by Intellectual Property Rights law, including copyright law. Copyright and IPR is retained by the creators or other copyright holders. Terms and conditions for use of this material are defined in the End User Agreement .
www.reading.ac.uk/centaur

CentAUR
Central Archive at the University of Reading
Reading’s research outputs online

Effect of Seasonal variation on the composition and properties of raw milk 1
destined for processing in the UK 2
Biye Chen, Michael J. Lewis and Alistair S. Grandison* 3
Department of Food and Nutritional Sciences, University of Reading, Whiteknights, PO Box 4
226, Reading RG6 6AP, UK 5
*Corresponding author – Tel. +44 (0) 118 378 6724; Fax. +44 (0) 378 7708 6
Abstract (150 words max) 7
The composition and physical properties of raw milk from a commercial herd were studied 8
over a one year period in order to understand how best to utilise milk for processing 9
throughout the year. Protein and fat levels demonstrated seasonal trends, while minerals and 10
many physical properties displayed considerable variations, which were apparently unrelated 11
to season. However, rennet clotting time, ethanol stability and foaming ability were subject to 12
seasonal variation. Many significant interrelationships in physico-chemical properties were 13
found. It is clear that the milk supply may be more suited to the manufacture of different 14
products at different times of the year or even on a day to day basis. Subsequent studies will 15
report on variation in production and quality of products manufactured from the same milk 16
samples described in the current study and will thus highlight potential advantages of 17
seasonal processing of raw milk. 18
Highlights – 3-5 bullet points – max 85 characters including spaces 19
- Physical and chemical properties of commercial raw milk studied throughout year 20
- Rennet clotting, ethanol stability and foaming ability displayed seasonal variation 21
- Significant interrelationships in physico-chemical properties were found 22
- Clearer guidelines on the seasonal processing of raw milk to be resolved. 23
24

1. Introduction 25
The composition of raw bulk milk is of prime importance for the manufacture of products in 26
the UK, and there is significant interest in variations in the composition and physico-chemical 27
properties of raw milk. In general, the composition of milk varies with season, stage of 28
lactation, feeding, health status of the cow, milking interval, genetic factors and other day to 29
day variation (Heck, van Valenberg, Dijkstra and van Hooijdonk, 2009). 30
The effects of seasonal variation on milk composition have been reported by many 31
researchers and it is clear that the concentrations of many constituents and the physico-32
chemical properties vary throughout the year to different extents (DairyCo, 2013). Heck et al., 33
(2009) reported lower fat and protein contents in summer than in winter milk. This could be 34
attributed to the different temperatures and feed composition, because cows consume more 35
dry feed in winter, whereas in summer they eat grass and stay outside for longer (Fox and 36
McSweeney, 2003). Some of this variation is well established and predictable. For example, 37
DairyCo (2013) reported that in the years 2009 to 2013, fat levels from the UK national herd 38
gradually decreased from January to July, followed by a sharp increase to more than 4.20 % 39
in August and September, and remained constant in October, November and December. 40
Protein content followed a similar trend but with less variation. From November to April, 41
protein content declined steadily from 3.35 % to 3.23 %, followed by a constant period from 42
April to July, and finally increased slightly from July to November. While these trends are 43
repeated annually, it is notable that there was significant year on year variation in the absolute 44
values. Also it should be noted that these trends are the means of the national herd, and 45
greater variation would be expected when considering individual milk supplies. Different 46
regions and feeding regimes result in different seasonal effects on the main components of 47
raw milk. Compared with the UK, the lowest protein content observed by O'Brien, Mehra, 48

Connolly and Harrington, (1999a) in Ireland was in March, which was probably due to lower 49
intake of feed energy with indoor feeding. 50
These seasonal changes cause problems, but also allow opportunities for dairy manufacturers. 51
For example, it is well established that butter spread ability is better when produced from 52
summer fat compared with winter fat, due to the higher proportion of unsaturated fatty acids 53
when cows are maintained on pasture in summer (Schmidt and Van Vleck, 1974). In the 54
cheese industry, extended rennet clotting times can result in either disruption of production 55
schedules or the failure to form a coagulum (Schmidt and Van Vleck, 1974). In addition to 56
cheese manufacturing, seasonal variation in milk composition probably causes a range of 57
problems in the manufacture of casein powder, whipping cream and liquid milk (Murphy and 58
O'Brien, 1997). 59
Variation in raw milk properties, such as pH, Ca2+
and mineral content, can also have a 60
pronounced effect on the manufacture of different dairy products (Faka, Lewis, Grandison 61
and Deeth, 2009). For example, according to Faka et al., (2009), higher Ca2+
and lower pH 62
was generally correlated with poor heat stability in skim milk powder (SMP) and vice versa, 63
and it is well known that calcium chloride addition can reduce the rennet coagulation time 64
and increase the curd firmness in cheese-making (Tsioulpas, 2005). On-Nom, Grandison and 65
Lewis (2010) found that Ca2+
concentration increased as pH decreased, and both parameters 66
decreased as temperature increased. Casein micelle size, buffering capacity, viscosity and 67
foaming ability are other important physico-chemical properties, which are related to the 68
natural and induced variations in the composition of milk (Salaun, Mietton, and Gaucheron, 69
2005; Fox and McSweeney, 2003). 70
The aim of this study was to determine the composition and physical properties of raw milk 71
from a commercial herd over the period from August 2011 to October 2012. Although 72
seasonal variation in milk composition and properties has been studied previously, the current 73

study is focussed on the practical relationship of these variations to dairy product 74
manufacture. 75
76
2. Materials and methods 77
2.1 Milk samples 78
Raw bulk milk was collected from the University of Reading Centre for Dairy Research. The 79
herd consists of an average of 550 lactating Holstein cows and the milk is sold commercially. 80
The animals are year-round calvers, and the majority are maintained indoors on total mixed 81
rations, while approximately 30% spend the summer months on grass. The composition and 82
physical properties were measured every two weeks. All analyses of raw milk were carried 83
out in triplicate. pH, ionic calcium, lactose, protein, fat and total solids content, rennet 84
clotting time (RCT), ethanol stability (ES), percentage of dry sediment, density, viscosity, 85
buffering capacity (BC), casein micelle size, freezing point depression (FPD), foaming ability 86
were measured at 20oC within 24 hours of milking. A total of 25 bulk milk samples were 87
studied during the period August 2011 to October 2012. 88
2.2 Chemical analysis 89
The protein, fat, lactose, urea, somatic cell count (SCC) and total casein concentrations were 90
measured in raw milk using a Lactoscope (Quadrachem Laboratories Ltd, London, UK) 91
pH was measured using a Sentron 3001 pH meter (Sentron Europe BV, ZH Roden, Dutch), 92
which was calibrated with standard buffer solutions of pH 4.0 and 7.0. 93
Ionic calcium (Ca2+
) was measured using a Ciba Corning 634 ISE Ca2+
/pH analyser (Ciba-94
Corning Diagnostic Limited). The instrument was calibrated in the millivolt (mV) output 95
mode with solutions of 0.50, 1.00, 2.50 and 5.00 mM Ca2+
daily, prior to use. There was a 96
linear relationship between log (ionic calcium) and mV output, with correlation coefficients 97
greater than 0.99. 98
To determine total solids content (TS), raw milk samples (5 g) were accurately weighed and 99
poured into stainless aluminium dishes and placed in an oven (100oC) to constant weight. The 100
residual dry weight of raw milk was considered as the total solids. 101
To measure buffering capacity (BC), 4.0 mL 0.1 M HCL solution was added to 25 mL raw 102
milk sample and left for 1 h at room temperature. The pH difference before, and 1 hour after, 103
acid addition was considered to be the buffering capacity, and was expressed in pH units. The 104
fall in pH accompanied by this procedure is similar to the fall in pH when milk is heated from 105
20 oC to 120
oC. 106
Ash content was measured using the AOAC method (2005) employing a Precisa 125A 107
balance. Dry ashing was preferred to wet digestion. Results were expressed as % (w/v) 108
percentage of ash in milk. Each sample was measured in triplicate. 109
Total calcium and magnesium concentration were determined according to the AOAC 110
official method of analysis 991.25 (AOAC, 2005), employing a Pye Unicam SP9 Atomic 111
Absorption Spectrophotometer (Atomic absorption Spectrometer novAA350, Analytik Jena 112
AG, Germany) and using a calcium/magnesium lamp at a wavelength of 422.7 nm and 282.5 113
nm respectively. This method involves dry ingestion of milk samples followed by dissolution 114
of the resulting ash in concentrated nitric acid (69% HNO3, Fisher Scientific, Loughborough, 115
UK). The calcium in the samples (100ml) reacts with the added lanthanum chloride solution, 116
1ml (10%; Fisher Scientific, Loughborough, UK). 117
Total citrate concentration was determined by HPLC (High Performance Liquid 118
Chromatography) according to Garnsworthy, Masson, Lock and Mottram (2006).The HPLC 119
apparatus consisted of an Agilent 1100 Isocratic Pump, an auto-sampler, a variable 120

wavelength detector, and a Prevail™ Organic Acid, 5μm Column (150 x 4.6mm) (Alltech, 121
Deerfield, US). Data were analysed by ChemStation software. 122
Total phosphorus concentration was determined according to IDF standard 42B (International 123
Dairy Federation, 1990). 124
2.3 Physical analysis 125
Dry sediment and ethanol stability (ES) were measured according to Chen, Grandison and 126
Lewis, (2012). 127
A range of hydrometers (ranged from 1.000 to 1.050 g/ml) were used to determine the 128
density of raw milk. 129
Kinematic viscosity was determined by a capillary BS/U tube viscometer (PoultenSelfe and 130
Lee Ltd., Essex, UK). Raw milk was well shaken before the analysis. All measurements took 131
place at room temperature (20oC). The kinematic viscosity was calculated by multiplying the 132
flow time by the instrument constant. Types B, C, and D BS/U tube viscometers were used. 133
The nominal constants for each type are 0.01, 0.03 and 0.1. cSt s-1
(1 cSt s-1
= 10-6
m2s
-1) 134
respectively. 135
Freezing point depression (FPD) was measured for milk samples by using an Advanced Milk 136
Cryoscope 4L2 (Advance Instruments Inc., Metuchen, NJ, USA). 137
Rennet coagulation time (RCT) was measured according to Tsioulpas (2005). 138
The average casein micelle size of raw milk was measured with a Zeta Master (Malvern 139
Instruments, Malvern, UK) according to Chen et al., (2012). 140
Foaming ability was determined at 650C by the air bubbling method developed by Huppertz 141
(2010). 142
2.4 Statistical analysis 143

Statistical analysis of all data used Xlstat, 2012 and Statistical Package for the Social 144
Sciences (SPSS 18) software. All variables were centred and normalised using SPSS 18 145
normality test (explore). The Spearman correlation method in Xlstat was used to establish 146
whether the correlation coefficients between parameters were significant. Mean values, 147
number of determinations, regression, univariate analysis and seasonal variations were 148
calculated using SPSS 18 one-way ANOVA. The threshold levels of significance of p<0.05, 149
0.01 and 0.001 were used in all analysis. Seasonal variations in raw milk were categorised 150
into four groups as shown in Table 1. 151
Measurements were made in triplicate and inserted into the database. Principal component 152
analysis (PCA) statistical method was performed with the Xlstat, 2012 software. 153
3. Results and discussion 154
The milk samples were analysed in detail in order to investigate how milk composition varies 155
throughout the year. The milk was also processed under standardised conditions to make a 156
variety of dairy products in order to investigate how selected quality attributes of these 157
products are influenced by milk composition. This paper presents the results for properties of 158
the raw milk. 159
3.1 Chemical properties of raw milk 160
Table 2 presents the average values, range and seasonal variation for composition of raw milk 161
collected over the period August 2011 to October 2012. Higher total solids were found in 162
autumn than in summer but there was no significant seasonal variation over the spring and 163
winter. It was observed by O'Brien et al., (1999a) that there was a reduction in total solids 164
content in January to April and July to August which is in agreement with the current study. 165
Raw milk produced in the autumn period had a significantly higher fat content than in other 166
periods which is broadly in line with the UK national statistics (DairyCo, 2013). 167

Compared with fat, the protein and casein concentrations showed less variability, ranging 168
from 2.89 to 3.56 %. However, significantly higher protein content was observed in spring 169
compared to the summer and autumn periods. This would not be expected from UK national 170
statistics (DairyCo, 2013), which would predict higher levels of protein in the autumn and 171
winter months, and may reflect the particular feeding regime used for this herd. 172
The average concentration of urea was 3.95 mM, ranging from 2.65 mM in October to 5.44 173
mM in November, although there was no specific significant seasonal variation. There were 174
no significant correlations between urea and other components of raw milk. This contrasts 175
with Giaccone, Todaro and Scatassa (2007) who reported considerable seasonal variation in 176
urea level. This difference could be attributed to the farming methods used at the Reading 177
University farm where there was no strict time schedule in moving from indoor feeding to 178
pasture feeding. 179
There was a little variation in the level of lactose which ranged from 4.52 to 4.69 % with no 180
significant seasonal differences. This is not surprising as lactose is well known to be one of 181
the least variable milk components. 182
pH showed a similar seasonal trend to the protein, which was significantly higher in spring 183
than in summer and autumn. However, buffering capacity (BC) did not display any 184
significant seasonal trend. 185
Generally the levels of minerals and citrate were within the normal range found for cows’ 186
milk, and while there were fluctuations, there were no significant differences between 187
seasons. The total calcium and magnesium concentrations followed a similar trend. This is in 188
general agreement with O'Brien, Mehra, Connolly and Harrington (1999d) who showed that 189
calcium, magnesium and chloride concentrations fluctuated considerably but showed no 190
definite trend over the year, and that these minerals were predominantly influenced by 191

lactation stage, but were also influenced by feed type (Keogh, Kelly, O'Keeffe and Phelan, 192
1982). 193
The ash content for raw milk fluctuated greatly over the period of study, but no significant 194
seasonal difference was observed. The maximum ash content (1.03%) was observed in 195
August and minimum content (0.53%) was found in October. Rao and Mishra (2010) 196
reported that ash content was not significantly influenced by season, breed and lactation stage, 197
but much narrower variations were observed compared to the current study. 198
The Ca2+
concentration ranged from 1.68 to 2.55 mM (which corresponds to 5.7 to 8.7% of 199
the total Ca), with no significant seasonal differences. Although bulking of milk will reduce 200
these variations, raw milk destined for processing will still be subject to considerable 201
variations in Ca2+
and pH, which may have significant effects on its processing behaviour. 202
Grimley, Grandison and Lewis (2009) monitored changes in minerals throughout the spring 203
flush period and reported that Ca2+
was reduced from 1.48 to 1.40 mM at this time, whereas 204
total divalent cations were reduced from 35.4 to 33.4 mM. There was no evidence to suggest 205
that any of the milk samples were unsuitable for processing, in terms of poor heat stability or 206
poor coagulation properties. 207
Buffering capacity (BC) of raw milk was constant throughout the year. The average value of 208
BC, expressed as pH differential value, was 0.84±0.02. Conversely, Harris, Tong, Vinkl, 209
Izeol and Jimenez-Flores (2002) observed that the highest BC values were found in 210
December and the lowest in September in California, using a method based on titration of 211
milk to pH 4.0. Again, farming methods and feeding regime probably contributed to 212
differences in the study. 213
The BC depends mainly on the composition and distribution of minerals and proteins 214
between aqueous and solid phases. Salaun et al., (2005) proposed that BC is determined by 215

soluble phosphate, colloidal calcium phosphate, citrate, bicarbonate, caseins and whey 216
proteins. However, with the exception of a positive correlation with somatic cell count, no 217
significant correlation between BC and compositional properties was observed in the current 218
study. 219
3.2 Physical properties of raw milk 220
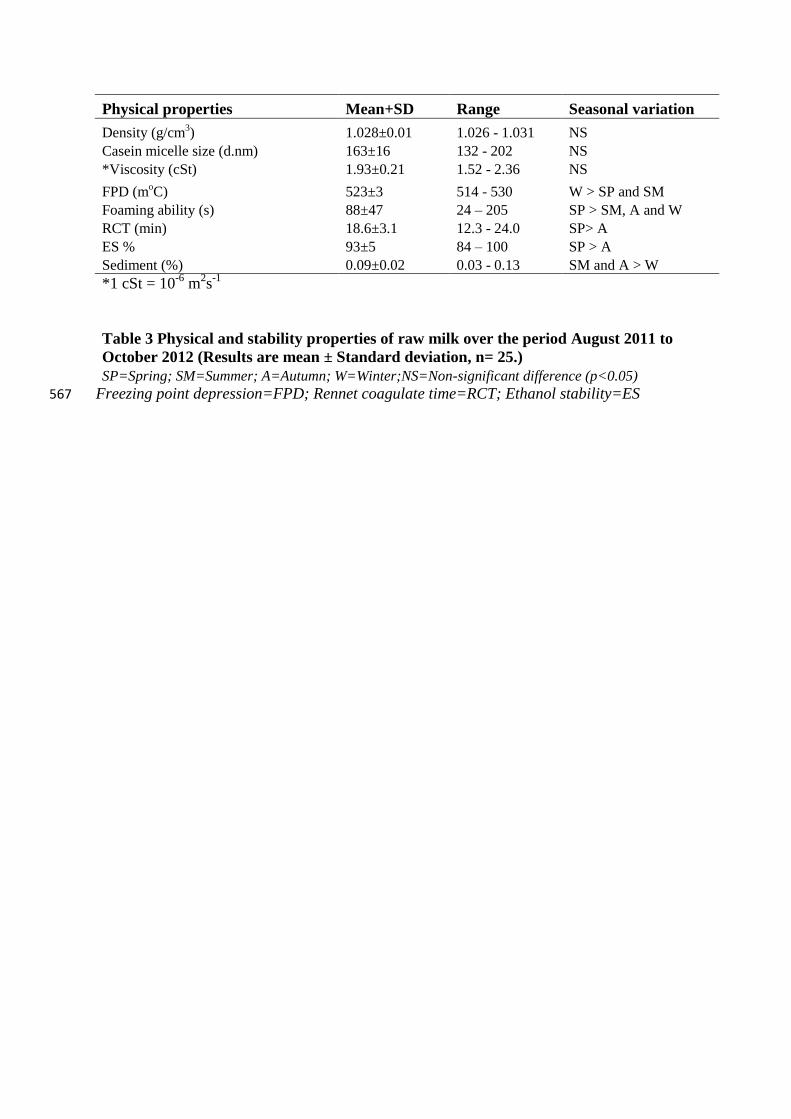
Values, ranges and seasonal variations in physical properties and various markers of milk 221
stability are given in table 3. The viscosity and density displayed some fluctuations but no 222
significant seasonal variation. 223
The average casein micelle size was 163 nm, which was slightly smaller than reported by 224
Glantz, Devold, Vegarud, Lindmark Månsson, Stålhammar and Paulsson (2010).The range 225
was from 132 nm in August to 202 nm in October. However, no significant seasonal variation 226
was observed. Holt and Muir (1978) reported that the average size of casein micelles 227
followed a pronounced seasonal trend with smaller average sizes in summer compared to 228
winter. The present study showed a similar trend in that the average sizes in summer and 229
winter were 162 nm and 167 nm respectively, but the difference was not statistically 230
significant. 231
The FPD displayed a relatively narrow range, as would be expected because it is a 232
consequence of the osmotic balance between the milk and the blood (Shipe, 1959). However 233
the values were significantly greater in winter than in the spring and summer. Changes in 234
temperature and diet are considered to be primarily responsible for the seasonal effect on 235
milk FPD (Henno, Ots, Jõudu, Kaart and Kärt, 2008). However, the latter authors stated that 236
the increase in milk freezing point was not caused by the lack of energy or protein from the 237
feed ration, but was probably due to the increased water intake due to the increased 238
temperature and sunshine hours as suggested by Bjerg, Rasmussen and Nielse (2005). 239

The RCT, ES, foaming ability and sediment formation are all properties which relate directly 240
to the processing of milk, and it is notable that all displayed significant seasonal variation 241
(Table 3). The raw milk samples produced in spring had significantly longer RCT than in the 242
autumn. Average values were 21 min in spring compared to 17 min in autumn, which would 243
imply considerable coagulation time differences in rennet cheese manufacturing. This 244
variation could be attributed to the pH value in raw milk. It is well known that reduced pH 245
leads to a reduction in RCT. (e.g. Lucey, 2002). 246
The average ES was higher (93%) than that reported by Chavez, Negri, Taverna and Cuatrin 247
(2004), where about one third of samples had an ES less than 72%. All samples were above 248
74%, which is the suggested limiting value for for UHT processing (Shew, 1981). Ethanol 249
stability followed the same seasonal trend as RCT with significantly higher values in spring 250
than autumn. 251
Dry sediment formation followed a different trend with significantly higher values in the 252
summer and autumn compared to the winter. However, the importance of this finding is not 253
clear as sediment in raw milk may be unrelated to other compositional properties, being at 254
least partly related to extraneous debris in the milk (reference). 255
Foaming ability displayed the greatest range of all parameters measured (8.5 times difference) 256
and in common with the RCT and ES, values were highest in the spring, in this case higher 257
than the other three seasons. (discussed in section 3.3.7) 258
259
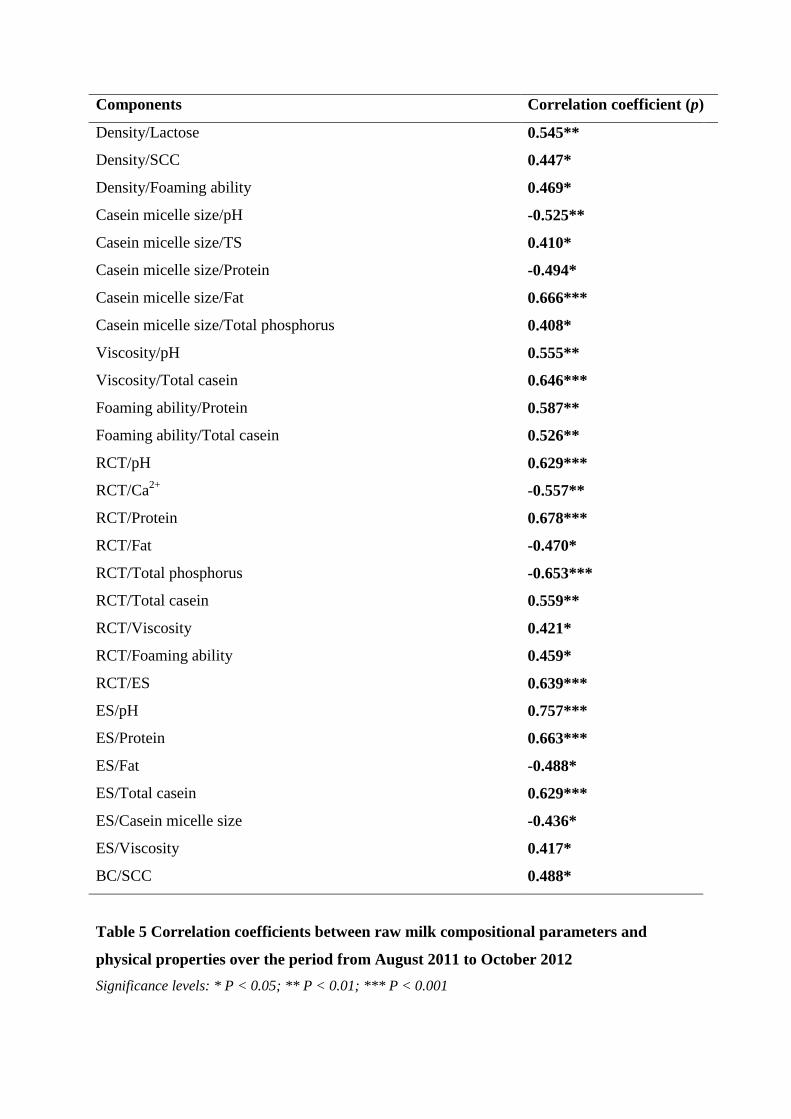
3.3 Interrelationships between physical and chemical parameters 260

Significant correlations between the main milk components and properties are shown in 261
Tables 4 and 5. It should be noted that not all the significant correlations will be causal, some 262
may be coincidental or linked indirectly to other parameters. 263
Fat content was strongly correlated with total solids, pH and protein content, and weakly with 264
total calcium and phosphorus, while protein content was significantly correlated with pH and 265
total casein content. 266
The average value of total solids was 12.78 % which gave a strong positive correlation 267
coefficient (p<0.001) to the fat content as shown in Table 4. Also, it was weakly correlated 268
with total ash and calcium content. 269
Lactose content was weakly correlated with total ash, citrate and SCC content. 270
As shown in Table 4, there were positive correlations between pH and protein and total 271
casein content, but a negative correlation with fat content. Pastorino, Hansen and McMahon 272
(2003) reported that the most significant effect of decreased pH was to promote mineral 273
solubilisation and casein dissociation from casein micelles, both of which altered milk 274
properties by affecting the extent and nature of protein interactions. 275
A weak but significant negative correlation between pH and Ca2+
was found, which agrees 276
with On-Nom et al., (2010). It is well established (Fox and McSweeney, 2003) that reducing 277
milk pH results in solubilisation of micellar calcium, which would result in increased Ca2+
. 278
Keogh et al., (1982) reported that there were significant positive correlations between citric 279
acid and fat content and between soluble calcium and fat content, but no correlation was 280
found between fat content and citrate in the present study. 281
A number of weak but significant correlations were found among the mineral, citrate, lactose 282
and SCC concentrations, but it is not clear which of these were of biological significance. 283

RCT and ES were strongly positively correlated, which is not surprising as both are 284
expressions of the stability of the casein micelle system (Tsioulpas, 2005). Both parameters 285
were significantly related to pH, protein, casein and fat levels. The correlations with fat are 286
likely to be coincidental or linked indirectly to other parameters. The correlations with pH are 287
to be expected as lowering pH is known to reduce casein micelle stability and the 288
relationships with protein and casein are probably at least partly secondary to the 289
relationships with pH (Fox and McSweeney, 2003). RCT correlated with Ca2+
, and it is 290
surprising that ES did not display a similar correlation, as other researchers (e.g. Davis and 291
White, 1958) have reported that ethanol stability was inversely related to Ca2+
concentration. 292
The explanation could be that ES was not only very high for this sample set but the range was 293
also much narrower than those found by other investigators. Also ES was only measured up 294
to 100%, and a number of samples displayed ES values of 100% (N.B. it is possible to have 295
values >100% if more concentrated ethanol solutions are used). 296
297
3.3.1 Rennet Clotting Time (RCT) 298
RCT was highly positively correlated with pH, protein, casein and ES, but negatively 299
correlated with Ca2+
, fat and total phosphorus content (Table 5). The strong positive 300
correlation with pH would be expected from earlier studies. Lucey (2002) showed that the 301
activity of rennet increased with decrease of pH, while other studies have demonstrated that 302
the aggregation of destabilised micelles increases at lower pH due to solubilisation of 303
micellar calcium phosphate, a decrease in net surface charge and dissociation of casein from 304
the micelles (Fox and McSweeney, 2003). The Ca2+
was negatively correlated with RCT, in 305
agreement with Tsioulpas (2005) who showed that increasing Ca2+
would accelerate milk 306
coagulation because Ca2+
in the serum phase reduces the negative charge on the surface of 307

casein micelles, weakening repulsion and accelerating their coagulation. Fox and McSweeney 308
(2003) suggested that initiating coagulation required a minimum concentration of Ca2+
of 309
about 1.5 mM. 310
Jõudu, Henno, Kaart, Püssa and Kärt (2008) showed that an increase in milk protein, casein, 311
casein fractions, and the casein number decreased the rennet coagulation time of milk which 312
was not in agreement with the current study. The weak negative correlation between RCT 313
and fat content observed in Table 5 is probably secondary to the correlations of fat with pH 314
and protein (Table 4). 315
The negative correlation of RCT with total phosphorus content corresponds with the findings 316
of McMahon, Brown, Richardson and Ernstrom (1984) who found that addition of phosphate 317
reduced coagulation time with a minimum at 0.01 M added phosphate. However higher levels 318
of addition (0.04 M added phosphate) increased coagulation time above control levels. They 319
suggested that the calcium phosphate system was extremely slow in equilibrating, and at low 320
added phosphate, it enhanced coagulation, whereas at high phosphate the equilibrium was 321
forced sufficiently in the direction of complex formation with Ca2+
that coagulation was 322
retarded. 323
There was a significant positive correlation between RCT and ES, which could be attributed 324
to Ca2+
and pH in raw milk because higher concentration of Ca2+
and lower pH value resulted 325
in the shorter RCT and poor ES in raw milk as described above. 326
327
3.3.2 Casein micelle size 328
As discussed previously, large casein micelles would be expected to cause a longer RCT, 329
poorer heat stability (Chen et al., 2012) and weaker curd compared with smaller ones. As 330

shown in Table 4, there was a positive significant correlation between casein micelle size and 331
total phosphorus content. Holt and Muir (1978) reported that the average size of casein 332
micelles correlated positively with the amount of colloidal phosphorus per unit weight of 333
casein, and negatively with casein-bound calcium. Micelle size has been shown to vary, not 334
only between feeding regimens and regions (Devold, Brovold, Langsrud and Vegarud, 2000), 335
but also between protein genotypes in different breeds. The casein micelle size was also 336
related to milk pH (table 5). Milk pH correlated negatively with casein micelle size, implying 337
that a higher milk pH would result in smaller native casein micelles, which was in contrast to 338
data of Glantz et al., (2010), although the reason for this disparity is not clear. With the 339
exception of total phosphorus content, none of the mineral components was significantly 340
related to casein micelle size, which is also in contrast to Glantz et al., (2010). Total protein 341
content was significantly correlated to the casein micelle size, which is in agreement with 342
results found previously in individual cows (Devold et al., 2000). The fact that there was no 343
correlation with the total calcium content was also in agreement with studies on bulk tank 344
milk and milk from individual cows (Devold et al., 2000). 345
346
3.3.3 Viscosity and density 347
The average value of viscosity of was 1.93 cSt (1 cSt = 10-6
m2s
-1), with a range from 1.52 to 348
2.36 cSt (Table 3). It has been shown by Fernandez-Martin (1972) that at room temperature, 349
milk viscosity increased either with increasing fat content, when solids-not-fat content was 350
kept constant, or with increasing solids-not-fat content when fat content was constant. There 351
is general agreement that milk viscosity is a non-linear function of total solids content. 352
However, according to Table 5, viscosity was highly significantly positively correlated with 353

pH and casein content, but not with total solids or fat content, although the correlation with 354
pH may be secondary to that with casein. 355
According to Table 2, the highest density was 1.031 g/ml and the lowest was 1.026 g/ml, 356
which fall within the normal range of 1.025-1.035 g/ml, reported by Scott, Robinson and 357
Wilbey (1998). The density of raw milk did not vary significantly with seasonal changes over 358
the year. 359
3.3.5 Somatic Cell Counts (SCC) 360
Contrary to the reports of some authors (Klinkon, Zadnik and Nemec, 2000), the raw milk 361
produced in winter had significantly more SCC than in other seasons, presumably reflecting 362
differences in herd management. The SCC results of Rajčević, Potočnik and Levstek (2003) 363
were in partial agreement with the current study. SCC in raw milk ranged from 65000 to 364
357000 and correlated positively and significantly with lactose and phosphorus content, and 365
negatively with total calcium and citrate content in raw milk in the present study. 366
Rajčević et al., (2003) reported that a statistically significant negative correlation occurred 367
between SCC and lactose content in milk, which was in contrast to the present study. 368
Compared with former researchers, the significant positive correlation in our results could be 369
attributed to the different feed, regions and even milking methods. 370
3.3.6 Freezing Point Depression (FPD) 371
Freezing point depression was significantly higher in winter than in spring and summer 372
(Table 3) with a range comparable to that reported by Shipe (1959) – i.e. 515 to 530 moC. 373
Changes in temperature and diet were considered to be primarily responsible for the seasonal 374
effect on milk FPD (Henno et al., 2008). Pinkerton and Peters (1958) suggested that 375
differences in environmental temperature and animal feed were contributing factors to the 376
seasonal variations that they observed. However, Henno et al., (2008) pointed out that the 377
increase in milk FPD was not caused by the lack of energy or protein from the feed ration 378
used but was probably due to the increased water intake with increased temperature and 379
sunshine hours. No significant correlation between FPD and compositional parameters was 380
found, which implies that FPD was a strong independent parameter in raw milk. The freezing 381
point of cows’ milk is relatively constant as a consequence of osmotic equilibrium in milk 382
and blood (Shipe, 1959). 383
384
3.3.7 Foaming ability 385
The foaming ability (the time to produce a foam) of raw milk in the summer period was 386
significantly lower than in spring, autumn and winter (Table 3). It was significantly positively 387
correlated with protein and casein content in raw milk (Table 5) which suggests that higher 388
protein content in raw milk would cause the longer foaming times. This result is counter-389
intuitive and contrasts with Marinova et al., (2009) who reported that the foaming ability of 390
milk increased with the protein concentration, until a constant value was reached. 391
Foaming ability did not correlate significantly with milk pH, although the pH range was 392
narrow. However, Augustin and Clarke (2008) indicated that when pH was decreased to 5.6, 393
an increase in foaming ability was observed, but this pH is well below the values measured in 394
the current study. 395
The mineral components in milk presumably play a significant part in determining the 396
foaming ability properties due to their large effect on the casein micelle (Augustin and Clarke, 397
2008). However, no correlation was observed in the present study. Augustin and Clarke 398
(2008) reported that addition of calcium chelators, such as citrate and EDTA, could improve 399
the foaming ability and stability in milk. Such enhanced foaming ability in milk could 400
possibly be attributed to the higher proportion of non-micellar casein, which could adsorb 401
onto the air interface. 402
Gambini, Castagnetti and Losi (1995) reported that foaming capacity of milk also tended to 403
decrease with increasing SCC due to the strongly correlated with increased plasmin 404
concentration and proteolysis in milk. However, no significant relation was observed in the 405
present study. 406
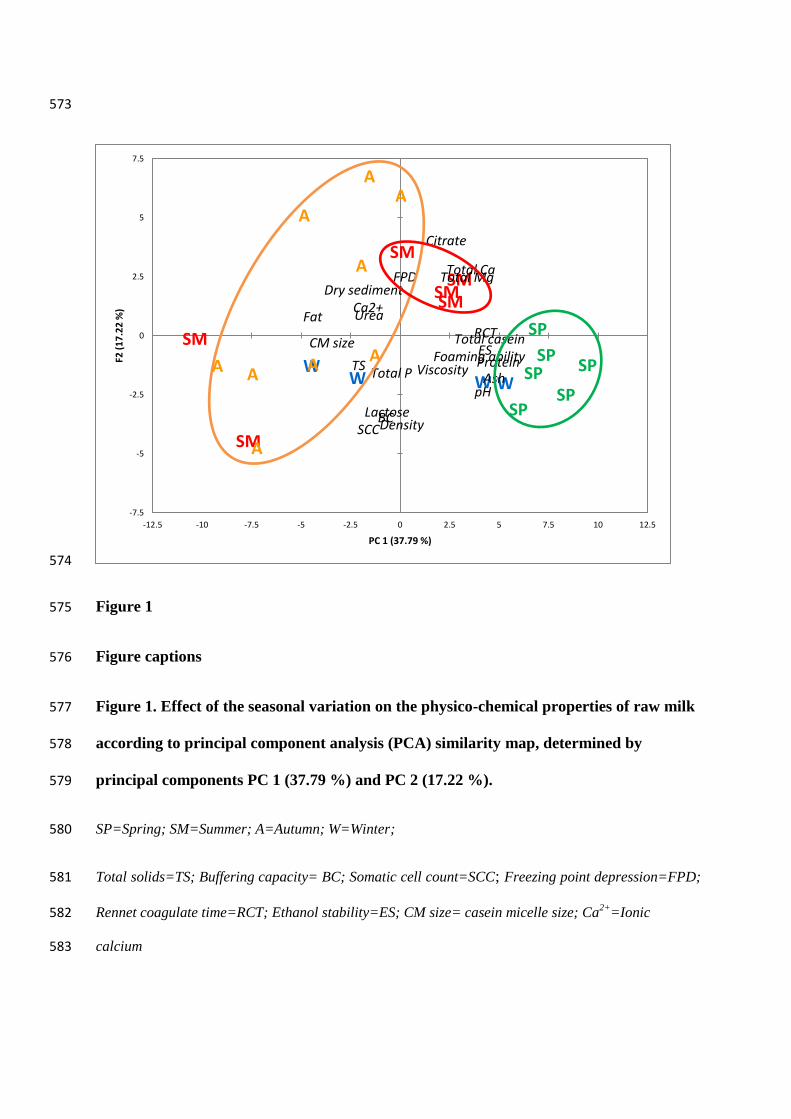
3.3.8 Principal Component Analysis 407
PCA was carried out on the whole data set consisting of 25 samples and the 23 variables. The 408
similarity map defined by principal components PC 1 and PC 2 showed a discrimination of 409
samples according to the different seasons. Considering the PCA similarity map defined by 410
principal components 1 and 2, the milk samples were separated according to principal 411
component 1 (37.79 % of the total variance; Figure 1). This component clearly showed the 412
effect of the seasonal variations. Most samples in spring and summer were located on the 413
positive part of the similarity map, whereas autumn samples were on the negative part. Raw 414
milk in spring and summer were characterised by higher pH, ash content, foaming ability, ES, 415
RCT, total casein and protein content. In contrast, the properties of raw milk in autumn were 416
characterised by higher fat content and CM size than in spring and summer. Autumn milk 417
also exhibited higher Ca2+
, urea, TS, SCC and percentage of dry sediment than spring and 418
summer milk, but the contributions of these variables were less significant. Similarly, spring 419
milk contained higher citrate, total Mg, Total Ca and viscosity, but these attributes were less 420
significant due to being closer to the origin of the coordinate. BC, total phosphorus, density 421
and lactose were not subject to seasonal variations, since these variables were located close to 422
the origin of the coordinate (Figure 1) which is in agreement with Table 2 and 3. However, 423
FPD was not influenced by seasonal variations from the similarly map which was in contrast 424
to Table 3 which, again, implied that FPD was a strong independent parameter in raw milk. 425
In addition, two summer milk samples located in the bottom left position could probably be 426
attributed to the sampling time since they were the final samples in summer period. This short 427
interval between the last sample in summer and the first sample in autumn probably explains 428
the similar physico-chemical properties. Overall this analysis shows that the physico-429
chemical properties of the spring and autumn milks were quite distinct, whereas the summer 430
and winter milks were much less differentiated. 431
4. General Discussion 432
The aim of this study was to determine the extent of variations in composition and physico-433
chemical properties of bulk milk from a commercial herd in the UK throughout the year. 434
Seasonal variations were found for some properties and correlations between some physical 435
properties and milk composition have been highlighted. PCA was used to distinguish 436
between the samples and was able to differentiate between autumn and spring milk samples. 437
The novelty of this study is that these milk samples were then used to produce a range of 438
products under standardised conditions in order to determine how selected quality attributes 439
of the products were influenced by milk composition and other properties. 440
441
The observed variation in different parameters could be related to seasonal effects in some 442
cases but seemed to be more difficult to explain. Much of the data was consistent with earlier 443
studies on seasonal variation, while other parameters varied less widely or displayed less 444
seasonality than may have been expected.. This may be because previous studies were from 445
different geographical areas, or employed different, in some cases outdated, farming practices 446
such as diets or calving patterns. 447
Many interrelationships in physical and chemical parameters were observed and it is clear 448
that the milk supply would be more suited to the manufacture of different products at 449
different times of the year or even on a day to day basis. Subsequent studies will report on 450
variation in production and quality of products manufactured from the same milk samples 451
described in the current study. In this way it is hoped to provide some clearer guidelines on 452
the relationships in milk composition, properties and product manufacture, including seasonal 453
factors. 454
References 455
AOAC (2005). Moisture in dried milk. In Official Methods of Analysis 727.05 (18th
ed). USA: 456
AOAC International 457
Augustin, M. A., & Clarke, P. T. (2008). Skim milk powders with enhanced foaming and 458
steam-frothing properties. Dairy Science and Technology, 88, 149-161. 459
Chavez, M. S., Negri, L. M., Taverna, M. A., & Cuatrin, A. (2004). Bovine milk composition 460
parameters affecting the ethanol stability. Journal of Dairy Research, 71, 201-206. 461
Chen, B. Y., Grandison, A. S., & Lewis, M. J. (2012). Comparison of heat stability of goat 462
milk subjected to ultra-high temperature and in-container sterilization. Journal of Dairy 463
Science, 95, 1057-1063. 464
DairyCo. Market information, Supply & Production, 2013. URL 465
http://www.dairyco.org.uk/market-information/supply-production/composition-and-466
hygiene/uk-milk-composition/ Accessed 04.04.2013. 467
Davies, D. T., & White, J. C. D. (1958). The relation between the chemical composition of 468
milk and the stability of the caseinate complex: II. Coagulation by ethanol. Journal of Dairy 469
Research, 25, 256-266. 470
Devold, T. G., Brovold, M. J., Langsrud, T., & Vegarud, G. E. (2000). Size of native and 471
heated casein micelles, content of protein and minerals in milk from Norwegian Red Cattle—472
effect of milk protein polymorphism and different feeding regimes. International Dairy 473
Journal, 10, 313-323. 474
Faka, M., Lewis, M. J., Grandison, A. S., & Deeth, H. (2009). The effect of free Ca2+
on the 475
heat stability and other characteristics of low-heat skim milk powder. International Dairy 476
Journal, 19, 386-392. 477
Fernandez-Martin, F. (1972). Influence of temperature and composition on some physical 478
properties of milk and milk concentrates. II. Viscosity. Journal of Dairy Research, 39, 75-82. 479
Fox, P.F & McSweeney, P. L. H. (2003). Advanced Dairy Chemistry, volume 1, proteins. (3rd 480
ed). London: Kluwer Academic/ Plenum Publishers. 481
Gambini, G., Castagnetti, G. B., & Losi, G. (1995). Influence of somatic cell count and heat 482
treatments on milk foam formation and stability. Industrie Alimentari. 34, 247–252. 483
Garnsworthy, P. C., Masson, L. L., Lock, A. L., & Mottram, T. T. (2006). Variation of milk 484
citrate with stage of lactation and de novo fatty acid synthesis in dairy cows. Journal of Dairy 485
Science, 89, 1604-1612. 486
Giaccone, P., Todaro, M., & Scatassa, M. L. (2010). Factors associated with milk urea 487
concentrations in Girgentana goats. Italian Journal of Animal Science, 6, 622-624. 488
Glantz, M., Devold, T. G., Vegarud, G. E., Lindmark Månsson, H., Stålhammar, H., & 489
Paulsson, M. (2010). Importance of casein micelle size and milk composition for milk 490
gelation. Journal of Dairy Science, 93, 1444-1451. 491
Grimley, H., Grandison, A., & Lewis, M. (2009). Changes in milk composition and 492
processing properties during the spring flush period. Dairy Science and Technology, 89, 405-493
416. 494
Harris, A., Tong, P., Vinkl, S., Izeol, J., & Jimenez-Flores, R., J. (2002). Effects of seasonal 495
and regional variations in milk components on the buffering capacity of milk in California. 496
Journal of Dairy Science, 85, 289. 497
Heck, J. M. L., Van Valenberg, H. J. F., Dijkstra, J., & Van Hooijdonk, A. C. M. (2009). 498
Seasonal variation in the Dutch bovine raw milk composition. Journal of Dairy Science, 92, 499
4745-4755. 500
Henno, M., Ots, M., Jõudu, I., Kaart, T., & Kärt, O. (2008). Factors affecting the freezing 501
point stability of milk from individual cows. International Dairy Journal, 18, 210-215. 502
Holt, C., & Muir, D. D. (1978). Natural variations in the average size of bovine casein 503
micelles. II. Milk samples from creamery bulk silos in south west Scotland. Journal of Dairy 504
Research, 45, 347-353. 505

Huppertz, T. (2010). Foaming properties of milk: a review of the influence of composition 506
and processing. International Journal of Dairy Technology, 63, 477-488. 507
IDF. (1990). Milk: determination of total phosphorus content by the spectrometric method. In 508
International Dairy Federation standard No 42B. Brussels, Belgium: IDF. 509
Jõudu, I., Henno, M., Kaart, T., Püssa, T., & Kärt, O. (2008). The effect of milk protein 510
contents on the rennet coagulation properties of milk from individual dairy cows. 511
International Dairy Journal, 18, 964-967. 512
Karoui R., Mazerolles G., & Dufour E., (2003). Spectroscopic techniques coupled with 513
chemometric tools for structure and texture determinations in dairy products. International 514
Dairy Journal, 13, 607–620. 515
Keogh, M. K., Kelly, P. M., O'Keeffe, A. M., & Phelan, J. A. (1982). Studies of Milk 516
Composition and Its Relationship to Some Processing Criteria: II. Seasonal variation in the 517
mineral levels of milk. Irish Journal of Food Science and Technology, 13-27. 518
Klinkon, M., Zadnik, T., & Nemec, M. (2000). The impact of breeding, breed, successive 519
lactation, stage of lactation, season and somatic cell count on basic milk components. 520
Slovenian Veterinary Research, 37, 197-208. 521
Lucey, J. A. (2002). Formation and physical properties of milk protein gels. Journal of Dairy 522
Science, 85, 281-294. 523
Marinovaa, K. G., Bashevaa, E.S., Nenovaa, B., Temelskaa, M.,Mirarefib, A.Y., Campbellb, 524
B., & Ivanova, I.B. (2009). Physico-chemical factors controlling the foam ability and foam 525
stability of milk proteins: Sodium caseinate and whey protein concentrates. Food 526
Hydrocolloids, 23, 1864–1876. 527
McMahon, D. J., Brown, R. J., Richardson, G. H., & Ernstrom, C. A. (1984). Effects of 528
calcium, phosphate, and bulk culture media on milk coagulation properties. Journal of Dairy 529
Science, 67, 930-938. 530
Murphy, J. J., & O'Brien, B. (1997). Quality milk for processing? The production technology. 531
Proceedings of National Dairy Conference, Teagasc, Dublin, 54-83. 532
O'Brien, B., Mehra, R., Connolly, J. F., & Harrington, D. (1999a). Seasonal variation in the 533
composition of Irish manufacturing and retail milks: 1. Chemical composition and renneting 534
properties. Irish Journal of Agricultural and Food Research, 38, 53-64. 535

O'Brien, B., Mehra, R., Connolly, J. F., & Harrington, D. (1999d). Seasonal variation in the 536
composition of Irish manufacturing and retail milks: 4. Minerals and trace elements. Irish 537
Journal of Agricultural and Food Research, 38, 87-99. 538
On-Nom, N., Grandison, A. S., & Lewis, M. J. (2010). Measurement of ionic calcium, pH, 539
and soluble divalent cations in milk at high temperature. Journal of Dairy Science, 93, 515-540
523. 541
Pastorino, A. J., Hansen, C. L., & McMahon, D. J. (2003). Effect of pH on the chemical 542
composition and structure-function relationships of Cheddar cheese. Journal of Dairy Science, 543
86, 2751-2760. 544
Pinkerton, F., & Peters, I. I. (1958). Conductivity, per cent lactose, and freezing point of milk. 545
Journal of Dairy Science, 41, 392-397 546
Rajčević, M., Potočnik, K., & Levstek, J. (2003). Correlations between somatic cells count 547
and milk composition with regard to the season. Agriculturae Conspectus Scientificus (ACS), 548
68, 221-226. 549
Rao, A., & Mishra, S. (2010). An assessment of the nutritional profile of milk in different 550
seasons and locations in Varanasi through modern laboratory techniques. Indian Journal of 551
Preventive and Social Medicine, 41, 237-239. 552
Salaün, F., Mietton, B., & Gaucheron, F. (2005). Buffering capacity of dairy products. 553
International Dairy Journal, 15, 95-109. 554
Schmidt, G. H., & Vleck, L. V. (1974). Principles of dairy science. WH Freeman and 555
Company. USA. 556
Scott, R., Robinson, R. R. K., & Wilbey, R. A. (1998). Cheesemaking practice. (3rd
ed). 557
Springer. 558
Shew, D. I. 1981. IDF Bulletin, New monograph on UHT milk, document 133, Brussels, 115–559
121. 560
Shipe, W. F. (1959). The freezing point of milk. A review. Journal of Dairy Science, 42, 561
1745-1762. 562
Tsioulpas, A (2005) Role of minerals on casein micelle stability of bovine milk. Ph.D. Thesis. 563
Reading University. 564

Seasons
Definitions Sample size
Spring SP March, April and May 6
Summer SM June, July and August 6
Autumn A September, October and November 9
Winter W December, January and February 4
Table 1 The definition and sample sizes of different seasons 565

Compositional Properties Mean+SD Range Seasonal variation pH 6.79±0.35 6.73 - 6.87 SP>SM and A;W > A
Ca2+
(mM) 2.05±0.25 1.68 - 2.55 NS
TS (%) 12.78±0.29 12.31 - 13.31 A > SM
Protein (%) 3.29±0.16 2.89 - 3.56 SP>SM and A
Total casein (%) 2.36±0.09 2.08 - 2.52 SP>SM and A
Fat (%) 4.08±0.36 3.62 - 4.77 A > SP, SM and W
Lactose (%) 4.59±0.44 4.52 - 4.69 NS
BC 0.84±002 0.78 - 0.88 NS
Ash (%) 0.71±0.14 0.53 - 1.03 NS
Total Ca (mM) 29.3±1.78 24.5 - 31.5 NS
Total Mg (mM) 5.11±0.34 4.21 - 5.81 NS
Total P (mM) 9.04±0.53 8.22 - 10.1 NS
Total Citrate (mM) 27.5±2.12 22.6 - 33.6 NS
Urea (mM) 3.95±0.40 2.65–5.44 NS
SCC (cells ml-1
x 103) 155±63 65 – 357 W > SP, SM and A
Table 2 Composition of raw milk collected over the period August 2011 to October 2012
(Results are mean ± Standard deviation, n= 25.)
SP=Spring; SM=Summer; A=Autumn; W=Winter;NS=Non-significant difference (p<0.05)
Total solids=TS; Buffering capacity= BC; Somatic cell count=SCC 566
Physical properties Mean+SD Range Seasonal variation
Density (g/cm3) 1.028±0.01 1.026 - 1.031 NS
Casein micelle size (d.nm) 163±16 132 - 202 NS
*Viscosity (cSt) 1.93±0.21 1.52 - 2.36 NS
FPD (moC) 523±3 514 - 530 W > SP and SM
Foaming ability (s) 88±47 24 – 205 SP > SM, A and W
RCT (min) 18.6±3.1 12.3 - 24.0 SP> A
ES % 93±5 84 – 100 SP > A
Sediment (%) 0.09±0.02 0.03 - 0.13 SM and A > W
*1 cSt = 10-6
m2s
-1
Table 3 Physical and stability properties of raw milk over the period August 2011 to
October 2012 (Results are mean ± Standard deviation, n= 25.)
SP=Spring; SM=Summer; A=Autumn; W=Winter;NS=Non-significant difference (p<0.05)
Freezing point depression=FPD; Rennet coagulate time=RCT; Ethanol stability=ES 567

Components Correlation coefficient (p)
pH/Ca2+
-0.471*
pH/Protein 0.631***
pH/Total casein 0.658***
pH/Fat -0.525**
TS/Fat 0.630***
TS/Total Ca -0.406*
TS/Total ash 0.482*
Protein/Fat -0.614**
Protein/Total Casein 0.597**
Fat/Total Ca -0.441*
Fat/Total P 0.414*
Lactose/Total citrate -0.452*
Lactose/Total ash -0.511*
Lactose/SCC 0.444*
Total Ca/Total Mg 0.446*
Total Ca/Total citrate 0.476*
Total Ca/SCC -0.457*
Total Mg/Total citrate 0.464*
Total Mg/Total ash -0.473*
Total P/SCC 0.492*
Total citrate/Total ash 0.438*
Total citrate/SCC -0.498*
Table 4 Correlation coefficients between raw milk compositional parameters over the
period from August 2011 to October 2012
Significance levels: * P < 0.05; ** P < 0.01; *** P < 0.001
Total solids=TS; Somatic cell count=SCC 568
569
Components Correlation coefficient (p)
Density/Lactose 0.545**
Density/SCC 0.447*
Density/Foaming ability 0.469*
Casein micelle size/pH -0.525**
Casein micelle size/TS 0.410*
Casein micelle size/Protein -0.494*
Casein micelle size/Fat 0.666***
Casein micelle size/Total phosphorus 0.408*
Viscosity/pH 0.555**
Viscosity/Total casein 0.646***
Foaming ability/Protein 0.587**
Foaming ability/Total casein 0.526**
RCT/pH 0.629***
RCT/Ca2+
-0.557**
RCT/Protein 0.678***
RCT/Fat -0.470*
RCT/Total phosphorus -0.653***
RCT/Total casein 0.559**
RCT/Viscosity 0.421*
RCT/Foaming ability 0.459*
RCT/ES 0.639***
ES/pH 0.757***
ES/Protein 0.663***
ES/Fat -0.488*
ES/Total casein 0.629***
ES/Casein micelle size -0.436*
ES/Viscosity 0.417*
BC/SCC 0.488*
Table 5 Correlation coefficients between raw milk compositional parameters and
physical properties over the period from August 2011 to October 2012
Significance levels: * P < 0.05; ** P < 0.01; *** P < 0.001

Somatic cell count=SCC; Rennet coagulate time=RCT; Ethanol stability=ES; Buffering 570
capacity= BC 571
572
573
574
Figure 1 575
Figure captions 576
Figure 1. Effect of the seasonal variation on the physico-chemical properties of raw milk 577
according to principal component analysis (PCA) similarity map, determined by 578
principal components PC 1 (37.79 %) and PC 2 (17.22 %). 579
SP=Spring; SM=Summer; A=Autumn; W=Winter; 580
Total solids=TS; Buffering capacity= BC; Somatic cell count=SCC; Freezing point depression=FPD; 581
Rennet coagulate time=RCT; Ethanol stability=ES; CM size= casein micelle size; Ca2+
=Ionic 582
calcium 583
SM
SM
SM SM
SM
SM
W W W W
SP
SP SP
SP
SP
SP
A
A A
A
A
A A
A
A
pH
Ca2+
TS Protein
Fat
Lactose
RCT ES
Dry sediment
Density BC
CM size
Viscosity
FPD
Foaming ability
Total Ca Total Mg
Total P
Citrate
SCC
Urea
Total casein
Ash
-7.5
-5
-2.5
0
2.5
5
7.5
-12.5 -10 -7.5 -5 -2.5 0 2.5 5 7.5 10 12.5
F2 (
17
.22
%)
PC 1 (37.79 %)