effect of resveratrol and quercetin on high … · web viewkamada c, da silva e, ohnishi-kameyama...
TRANSCRIPT

Nature and Science 2015;13(5) http://www.sciencepub.net/nature
Effect of Resveratrol and Quercetin on High Fructose Induced Metabolic Syndrome in Rats
Adel Hussein Omar1, Abd El-Rahman Abd EL-fatah Yaseen1, Naglaa Mohamed Ghanayem2, Mahmoud Hamed EL-Odemi1, Mohamed Soliman Rizk2, Mohammed Abdel-Hamid Aleskandarany, Dalia Rifaat AL-Sharaky3 and Safa
Reyad EL-Fiky1
Clinical Pharmacology Department1, Medical Biochemistry Department2 and Pathology Department3- Faculty of Medicine- Menoufia University.
Abstract: Objectives: Studying the effect of resveratrol and quercetin on high fructose induced metabolic syndrome in rats. Background: Resveratrol and quercetin are of natural sources, metabolic syndrome consists of central obesity, insulin resistance, hypertension and dyslipidaemia predisposing to atherosclerotic cardiovascular disease. Methods: The present study was conducted on 40 rats, control group, vehicle treated group, resveratrol treated and quercetin treated groups, each contains 10 rats. For all of them measurement of body weight, Systolic blood pressure, serum TNF-α, leptin, glucose, insulin, Insulin resistance by HOMA-IR calculation, cholesterol, triglycerides, uric acid, catalase, Malondilaldehyde and histopathological assessment by hematoxyline & eosin and NF-κB were done. Results: Quercetin showed better improvement of different measured parameters due to more antioxidant activity, this is revealed by Anova test, paired t-test, Fisher test and Krushkal Wallis test. Conclusion: Quercetin can be a promising treatment than resveratrol for metabolic syndrome prevention and treatment.[Adel Hussein Omar, Abd El-Rahman Abd EL-fatah Yaseen, Naglaa Mohamed Ghanayem, Mahmoud Hamed EL-Odemi, Mohamed Soliman Rizk, Mohammed Abdel-Hamid Aleskandarany, Dalia Rifaat AL-Sharaky and Safa Reyad EL-Fiky. Effect Of Resveratrol and Quercetin On High Fructose Induced Metabolic Syndrome In Rats. Nat Sci 2015;13(5):52-63]. (ISSN: 1545-0740). http://www.sciencepub.net/nature. 7
Key words: Quercetin, resveratrol, Metabolic syndrome.
1.Introduction: Metabolic syndrome (MetS) is a very common
disease, it includes many aspects as obesity, insulin resistance, dyslipidemia, fatty liver and hypertension (1).
The pathophysiology of metabolic syndrome is that adipose tissue has a secretory role. Upon overload of adipose tissue with fat, there is increased secretion of inflammatory cytokines such as tumor necrosis factor (TNF)-α and interleukin (IL)-6.The inflammation propagated by these cytokines has been proposed to contribute greatly to insulin resistance (2).
Adipose tissue also takes up glucose via insulin-induced translocation of GLUT4 to the plasma membrane, a process that is impaired upon insulin resistance. The reduction in GLUT4 translocation occurs due to inhibitory serine phosphorylation of Insulin receptor substrate (IRS)-1 or IRS-2 via a nuclear factor (NFκB/c-Jun amino terminal kinase (JNK)-dependent pathway. JNK activation is also induced by fructose feeding (3).
Resveratrol, a naturally occurring phytoalexin present in numerous plant species such as grapes, exerts beneficial effects in the organism and may be helpful in preventing and treating metabolic syndrome. Antidiabetic effect of resveratrol involves three main aspects: reduction of blood glucose, preservation of β cells, improvement in insulin action (4).
Quercetin, is mainly found in apples, tea, onions, nuts, cauliflower, cabbage and many other foods. It significantly decreased blood glucose in diabetic rats, in a dose dependent manner (5).
Quercetin reduced body weight gain, as well as visceral and hepatic fat accumulation, and improved systemic parameters related to metabolic syndrome (hyperglycemia, hyperinsulinemia and dyslipidemia), probably by decreasing oxidative stress parameters as Malondilaldehyde (MDA), increase activity of antioxidant enzymes as catalase, superoxide dismutase and decrease of inflammatory markers as TNF-α (6).
2. Material and Methods:The present study was conducted in Clinical
pharmacology department Faculty of medicine Menoufia University, Egypt. It was approved by local ethics committee of Faculty of medicine, Menoufia University.
Experimental animals:The studied groups consisted of 40 rats divided
into four groups:Group 1: control group: rats were fed a chow diet
orally for 8 weeks (7).Group 2: vehicle treated group: rats were fed a fructose enriched diet (FED) 65% and received ethyl alcohol 20% orally at the same time for 8 weeks (7).
Group 3: Resveratrol treated group: rats were fed on FED 65% and received at the same time resveratrol
1

Nature and Science 2015;13(5) http://www.sciencepub.net/nature
dissolved in ethyl alcohol 20% in a dose (10 mg /kg/day orally) for 8 weeks (7).
Group 4: Rats rats were fed on FED 65% and received at the same time quercetin dissolved in ethyl alcohol 20% in a dose (50 mg /kg/day orally) for 8 weeks (8).Each contains 10 rats. They had acclimatized for one week prior to the experiment in fully ventilated room at room temperature, rats had free access to water and diet.Measurement of body weight:
Body weight was measured at the beginning and the end of the studyMeasurement of blood pressure:
Systolic blood pressure (SBP) was measured at the begining and the end of the study with rat tail blood pressure monitor system (LE5001 System. Harvard Apparatus, Inc.). Rats were trained for 3 consecutive days (each cession consists of 10 unrecorded measurements) to familiarize the animal with rat tail cuff. Rats of SBP of 140 mmHg or more were considered hypertensive (9).At the end of the experiment, the rats were sacrified. Sample collection and biochemical assay:
Rats were anaesthetized with diethyl ether. Venous blood samples were collected by heparinized capillary tubes from the retro-orbital plexus of rats (10).Samples were incubated at 37 °C until blood was clotted and then centrifuged at 4000 rpm for 10 min for separation of serum which could be stored at -80°C till used for measurement of serum TNFα, leptin, insulin, glucose, triglycerides (TGs), cholesterol(TC) and uric acid. Samples for determination of catalase and MDA were centrifuged at 4000 rpm for 15 minutes at 4°C.1-Determination of serum TNF-α and leptin level:
TNF-α in serum was determined using ELISA kits based on a quantitative sandwich enzyme immunoassay technique that measures TNF-α (11), It was purcashed from (eBioscience,Inc.,USA) and leptin (12), It was purcashed from DRG instruments GmbH, Germany.2-Determination of serum insulin:
Monoclonal antibody directed towards a unique antigenic site on the Insulin molecule, based on the sandwich principle (13). It was purcashed from DRG instruments GmbH, Germany.3- Determination of serum glucose:
Blood glucose was measured using glucometer (Diavue, Muenster-Germany).4-Determination of insulin resistance (HOMA-IR):
It is calculated from fasting blood glucose (mg/dl) and fasting blood insulin (IU/ml) levels as a measure of insulin resistance (14).
5-Determination of serum MDA:It measured using kits for enzymatic calorimetric
determination of the absorbance of the resultant pink product measured at 534 nm (15). It was obtained from Biodiagnostic, Egypt.6- Determination of serum TGs, TC and uric acid:
They were measured using kits for enzymatic calorimetric determination of serum TGs (16), cholesterol (17) and uric acid (18). They were obtained from Spainreact, Egypt.7- Determination of serum catalase:
It was measured using kits for enzymatic calorimetric determination of Serum catalase. The colour intensity inversely proportional to the amount of catalase. In the sample (19). It was obtained from Biodiagnostic, Egypt.8- Histopathological examination:
A- Haematoxylein and eosin (H&E) stained slides. Nuclei and other basophilic structures are blue. Cytoplasm and acidophilic structures are light to dark red (20).B- Immunohistochemical examination of NFκB:Interpretation of immunohistochemical results:
The slides were examined at low magnification (x100) and areas containing highest density of brown cytoplasmic, stain (NF-κB) were evaluated at high magnification (x200). A staining percentage of 10% or above was considered positive in the studied cases and control specimens. Positively stained cells were further evaluated for: Intensity: (mild,moderate or severe),Histo-score (H score): was calculated to all studied cases following the equation:
H score=1*% of mildly stained cells+ 2*% of moderately stained cells+ 3*%of strongly stained cells.Pattern of distribution: either patchy i.e. irregular
(not uniform in distribution) or diffuse i.e.uniform in distribution.
Cellular localization:either cytoplasmic, nuclear or cytoplasmic with focal nuclear.Type of the cells stained by NF-κB: hepatocytes, sinusoids, inflammatory infiltrate (21).Statistical methods:
Results were collected, tabulated and statistically analyzed by an IBM compatible personal computer with SPSS statistical package version 16.
Two types of statistical analysis were done:Normally distributed quantitative data were
expressed as mean (X¯) and standard deviation (SD) and analyzed by One way ANOVA followed by Post hoc test. Paired t test is single test used to collectively indicate the presence of any significant difference
2

Nature and Science 2015;13(5) http://www.sciencepub.net/nature
between different time sequences for a normally distributed quantitative variable, while not normally distributed quantitative data was analyzed by using Kruskal-Wallis test. Normally distributed qualitative data was analyzed by chi-square, and whenever one of the expected cells is less than 5, Fisher’s exact test was used. P-value of < 0.05 was considered statistically significant, Highly significant difference if P < 0.05, Non-significant difference if P > 0.05.
3.Results:As regarding serum TNFα, leptin, blood glucose,
Serum insulin and HOMA-IR, there was significant increase in in group 2 compared to group 1. Group 3, group 4 are significantly decreased compared to group 2 but group 4 is significantly decreased compared to group 3 (Table 1).Concerning serum TC, TGs, uric acid, MDA, there was significant increase in in group 2 compared to group 1. Group 3and 4 are significantly decreased compared to group 2 but group 4 was significantly decreased compared to group 3. As regarding serum catalase, groups 3,4 showed significant increase
compared to group 2. Group 4 showed significant increase compared to group 3. Group 3,4 showed significant increase compared to group 1(Table 2).
There was insignificant difference between studied groups as regarding basal body weight while group 2 showed significant increase compared to group 1. Body weight of groups 3 and 4 is significantly decreased compared to group 2 but group 4 is significantly decreased compared to group 3 (Histogram 1).
There was insignificant difference between studied groups as regarding SBP while group 2 showed significant increase compared to group 1. SBP of group 3and 4 is significantly decreased compared to group 2. but group 4 is significantly decreased compared to group 3 (Histogram 2).
Groups 3,4 showed improved the pathological picture by H&E compared to group 2. Group 4 showed marked improvement of the pathological picture by H&E compared to group 3 (photograph1). Groups 3,4 showed Less NF-κB intensity compared to group2. Group 4 showed Less NF-κB intensity compared to group3. (photograph 2).
Table (1): Effect of resveratrol and quercetin on Serum TNF-α, Serum leptin, Serum glucose, Serum Insulin and HOMA-IR
Parameters
GroupsGroup 1 (control)
Fructose enriched dietGroup 2(Vehicle
treated group)Group 3(resveratrol
treated) Group 4(Quercetin
treated)
Serum TNFα(pg/ml) 11.59± 0.37 56.67± 1.15P1<0.05
34.11± 0.63P2<0.05P4<0.05
27.83± 0.96P2<0.05P3<0.05P4<0.05
Serum leptin(ng/ml) 6.70± 1.88 17.60± 1.64P1<0.05
13.10± 1.28P2<0.05P4<0.05
9.70± 1.33P2<0.05P3<0.05P4<0.05
Serum glucose(mg/dl) 91.90± 9.37 171.10± 18.05P1<0.05
135.9± 4.09P2<0.05P4<0.05
124.4± 2.59P2<0.05P3<0.05P4<0.05
Serum Insulin(IU/ml) 21.90± 2.18 45.60± 3.43P1<0.05
36.0± 2.0P2<0.05P4<0.05
32.70± 1.76P2<0.05P3<0.05P4<0.05
HOMA-IR 4.99± 0.87 19.25± 2.9P1<0.05
12.07± 0.63P2<0.05P4<0.05
10.03± 0.45P2<0.05P3<0.05P4<0.05
N.B: Number of rats in each group=10, each group is expressed as mean±SD P1: comparing results of group 2 with that of group 1. P2: comparing results of group 3 and group 4 to group 2.P3: comparing results of group 4with that of group 3. P4: comparing results of group 3 and group 4 with that of group 1.
3

Nature and Science 2015;13(5) http://www.sciencepub.net/nature
Table (2): Effect of resveratrol and quercetin on Serum TC, Serum TGs, Serum uric acid, Serum MDA and serum catalase.
Parameters
Groups
Group 1 (Control)
Fructose enriched diet (FED)
Group 2 (Vehicle treated)
Group3(Resveratrol
treated)
Group 4 (Quercetin treated)
Serum TC(mg/dl) 87.40± 2.36
194.90±30.33P1<0.05
147.10±5.15 P2<0.05P4<0.05
126.10± 9.90P2<0.05P3<0.05P4<0.05
Serum TGs(mg/dl) 151.80± 3.70 339.40± 4.42
P1<0.05
225.60± 2.06P2<0.05P4<0.05
218.0± 2.30P2<0.05P3<0.05P4<0.05
Serum Uric acid(mg/dl) 1.74± 0.18 2.77± 0.20
P1<0.052.27± 0.23
P2<0.05
2.07± 0.23P2<0.05P3<0.05P4<0.05
Serum MDA(nmol/ml) 1.38± 0.09 1.84± 0.12
P1<0.05
1.66± 0.06P2<0.05P4<0.05
1.53± 0.08P2<0.05P3<0.05P4<0.05
Serum Catalase(nmol/min/ml) 16.0± 0.82 15.90± 2.68
P1>0.05
22.60± 3.40P2<0.05P4<0.05
26.90± 3.98P2<0.05P3<0.05P4<0.05
N.B: Number of rats in each group=10, each group is expressed as mean±SD P1: comparing results of group 2 with that of group 1. P2: comparing results of group 3 and group 4 to group 2.P3: comparing results of group 4with that of group 3. P4: comparing results of group 3 and group 4 with that of group 1.
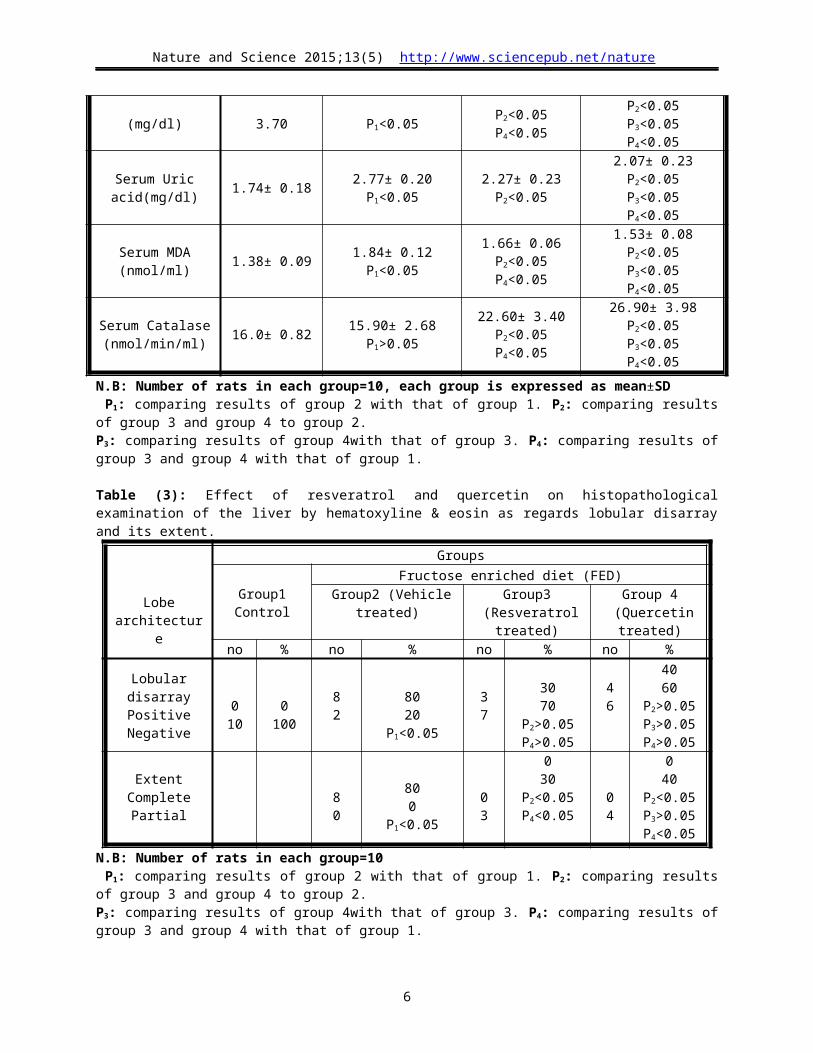
Table (3): Effect of resveratrol and quercetin on histopathological examination of the liver by hematoxyline & eosin as regards lobular disarray and its extent.
Lobe architecture
Groups
Group1 ControlFructose enriched diet (FED)
Group2 (Vehicle treated) Group3 (Resveratrol treated)
Group 4 (Quercetin treated)
no % no % no % no %
Lobular disarrayPositiveNegative
010
0100
82
8020
P1<0.05
37
3070
P2>0.05P4>0.05
46
4060
P2>0.05P3>0.05P4>0.05
ExtentComplete
Partial80
800
P1<0.05
03
030
P2<0.05P4<0.05
04
040
P2<0.05P3>0.05P4<0.05
N.B: Number of rats in each group=10 P1: comparing results of group 2 with that of group 1. P2: comparing results of group 3 and group 4 to group 2.P3: comparing results of group 4with that of group 3. P4: comparing results of group 3 and group 4 with that of group 1.
4

Nature and Science 2015;13(5) http://www.sciencepub.net/nature
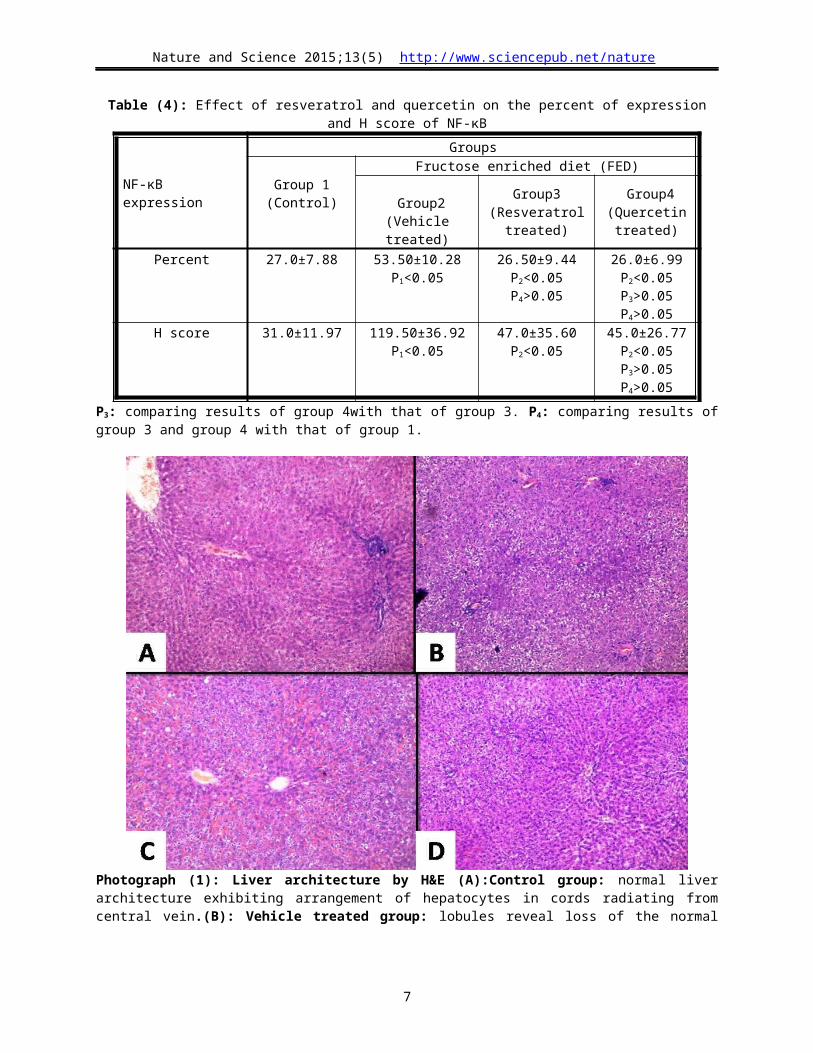
Table (4): Effect of resveratrol and quercetin on the percent of expression and H score of NF-κB
NF-κB expression
Groups
Group 1(Control)
Fructose enriched diet (FED)
Group2 (Vehicle treated)
Group3(Resveratrol
treated)
Group4 (Quercetin
treated) Percent 27.0±7.88 53.50±10.28
P1<0.0526.50±9.44
P2<0.05P4>0.05
26.0±6.99P2<0.05P3>0.05P4>0.05
H score 31.0±11.97 119.50±36.92P1<0.05
47.0±35.60P2<0.05
45.0±26.77P2<0.05P3>0.05P4>0.05
N.B: Number of rats in each group=10 P1: comparing results of group 2 with that of group 1. P2: comparing results of group 3 and group 4 to group 2.P3: comparing results of group 4with that of group 3. P4: comparing results of group 3 and group 4 with that of group 1.
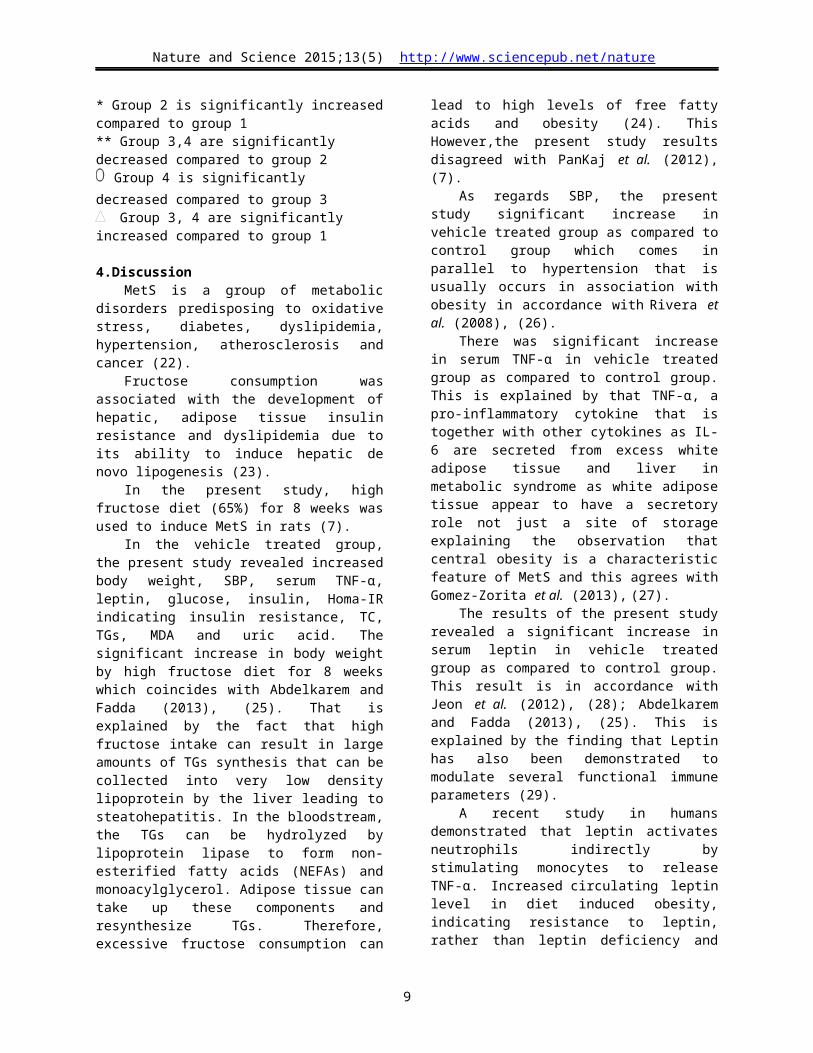
Photograph (1): Liver architecture by H&E (A):Control group: normal liver architecture exhibiting arrangement of hepatocytes in cords radiating from central vein.(B): Vehicle treated group: lobules reveal loss of the normal cord like arrangement of the hepatocytes. The hepatocytes at the periphery of the hepatic lobules exhibit vacuolated cytoplasm. (C): Resveratrol treated group: partial disruption of the architecture together with dilated congested intervening blood sinusoids.(D): Quercetin treated group: the normal liver architecture is partially regained and the intervening blood sinusoids appear normal. (A, B, C & D: Hx & E, 40XHPF).
5
1 2 3 4
**∆
**∆
1 2 3 4
**∆
**∆
Nature and Science 2015;13(5) http://www.sciencepub.net/nature
Photograph (2): Intensity of NF-κB stain in the hepatocytes (A): Control group exhibit mild cytoplasmic NF-κB stain in few hepatocytes, (B) Vehicle treated group exhibit strong cytoplasmic NF-κB stain (C) Resveratrol treated group and (D) Quercetin treated group exhibit moderate cytoplasmic NF-κB stain. (A, B, C & D immunoperoxidase 400xhpf).
Histogram (1): Body weight of different studied groups (Basal and Final) (g)
Histogram (2): SBP of different studied groups (Basal and Final) (mmHg)* Group 2 is significantly increased compared to group 1** Group 3,4 are significantly decreased compared to group 2
Group 4 is significantly decreased compared to group 3 Group 3, 4 are significantly increased compared to group 1
4.DiscussionMetS is a group of metabolic disorders
predisposing to oxidative stress, diabetes, dyslipidemia, hypertension, atherosclerosis and cancer (22).
Fructose consumption was associated with the development of hepatic, adipose tissue insulin resistance and dyslipidemia due to its ability to induce hepatic de novo lipogenesis (23).
In the present study, high fructose diet (65%) for 8 weeks was used to induce MetS in rats (7).
In the vehicle treated group, the present study revealed increased body weight, SBP, serum TNF-α,
6
*
*
Nature and Science 2015;13(5) http://www.sciencepub.net/nature
leptin, glucose, insulin, Homa-IR indicating insulin resistance, TC, TGs, MDA and uric acid. The significant increase in body weight by high fructose diet for 8 weeks which coincides with Abdelkarem and Fadda (2013), (25). That is explained by the fact that high fructose intake can result in large amounts of TGs synthesis that can be collected into very low density lipoprotein by the liver leading to steatohepatitis. In the bloodstream, the TGs can be hydrolyzed by lipoprotein lipase to form non-esterified fatty acids (NEFAs) and monoacylglycerol. Adipose tissue can take up these components and resynthesize TGs. Therefore, excessive fructose consumption can lead to high levels of free fatty acids and obesity (24). This However,the present study results disagreed with PanKaj et al. (2012), (7).
As regards SBP, the present study significant increase in vehicle treated group as compared to control group which comes in parallel to hypertension that is usually occurs in association with obesity in accordance with Rivera et al. (2008), (26).
There was significant increase in serum TNF-α in vehicle treated group as compared to control group. This is explained by that TNF-α, a pro-inflammatory cytokine that is together with other cytokines as IL-6 are secreted from excess white adipose tissue and liver in metabolic syndrome as white adipose tissue appear to have a secretory role not just a site of storage explaining the observation that central obesity is a characteristic feature of MetS and this agrees with Gomez-Zorita et al. (2013), (27).
The results of the present study revealed a significant increase in serum leptin in vehicle treated group as compared to control group. This result is in accordance with Jeon et al. (2012), (28); Abdelkarem and Fadda (2013), (25). This is explained by the finding that Leptin has also been demonstrated to modulate several functional immune parameters (29).
A recent study in humans demonstrated that leptin activates neutrophils indirectly by stimulating monocytes to release TNF-α. Increased circulating leptin level in diet induced obesity, indicating resistance to leptin, rather than leptin deficiency and hyperleptinaemia is associated with characteristic obesity complications as MetS (30).
The current study found significant increase in blood glucose in vehicle treated group.
This result coincides with Rivera et al. (2008), (26); PanKaj et al. (2012), (7) and Adelkarem and fadda (2013), (25). As high fructose diet leads to oxidative stress, insulin resistance, impaired glucose tolerance, type 2 diabetes and causes all the metabolic complications (31).
The present study revealed significantly elevated serum insulin and insulin resistance as demonstrated by HOMA-IR in vehicle treated group.
High fructose intake results in excess TGs that exceed storage capacity of adipose tissue as in obesity, they circulate in high levels in blood (hyperlipidaemia) in addition to increased lipolysis due to signaling abnormalities in adipose tissue augmenting NEFFAs in blood that are taken by liver in addition to hepatic inflammation induction and defects in hepatic insulin signaling cascade, all contribute to hepatic insulin resistance. In adipose tissue, there is reduction in glucose uptake due to reduction of GLUT4 transporter caused by NF-κB/c-JNK-dependent Pathway. This result is in agreement with Rivera et al. (2008), (26); PanKaj et al. (2012), (7) and Adelkarem and fadda (2013), (25).
The present study revealed that high fructose intake results in significant increase in serum TC and TGs. These results coincide with Rivera et al. (2008), (26); PanKaj et al. (2012), (7) and Adelkarem and fadda. (2013), (25) that is explained by the fact that large amount of fructose is taken up by liver aided by GLUT4 transporter. During the metabolism of fructose, it can be converted to glyceraldehyde, dihydroxyacetone-phosphate and glyceraldehyde-3-phosphate, those can be used for the synthesis of glycerol and fatty acids, which through esterification can form TGs.Thus, high fructose intake can result in large amounts of TGs synthesis due to lack of control of this pathway (24).
The present study showed significantly increased uric acid in vehicle treated group.This result is in agreement with PanKaj et al. (2012), (7) as excess fructose consumption is a risk factor for hyperuricemia, Hyperuricemia acts as a predictive mediator of hyperlipidemia and obesity, promoting inflammation and injury (8).
Regarding oxidative stress, the current study showed significant increase of MDA in vehicle treated group as it is an end-product generated by lipid peroxidation and has been used to demonstrate increased oxidative stress as obesity is a state of chronic inflammation. This result coincides with Coskun et al. (2005), (32).
The present study showed non-significant change in serum catalase between vehicle treated group and control group, that is in accordance with PanKaj et al. (2012), (7).
Regarding histopathological examination, the vehicle treated group showed by H&E stain loss of normal cord like arrangement of hepatocytes, feathery like vacuolization of hepatocytes and inflammatory infiltrate (lymphocytes) in the bile ducts with dilated central vein. This result agrees with PanKaj et al. (2012), (7) and Ying et al. (2013), (49). This picture is due to accumulation of fat droplets resulting in steatosis with portal inflammation (49).
7

Nature and Science 2015;13(5) http://www.sciencepub.net/nature
By immunohistochemistry, the vehicle treated group showed strong brown granular cytoplasmic NF-κB expression in hepatocytes with inflammatory aggregates in the portal tract. This result is in agreement with Ying et al. (2013), (49) who found increased NF-κB expression due to steatohepatitis.
Resveratrol treated group showed significant decrease in body weight as compared to vehicle treated group which is explained by its anti-obesity effect.by its ability to reduce body fat and body weight gain as in accordance with Lagouge et al. (2006), (33); Aubin et al. (2008), (34).Resveratrol exerts its effects by induction of genes for oxidative phosphorylation and mitochondrial biogenesis, activation of an NAD+-dependent protein deacetylase, Silent information regulator-1 (Sirt-1), which is activated by resveratrol (33,35).
Sirt1 catalyzes deacetylation and activation of peroxisome proliferator gamma coactivator-1α (PGC-1α), a cofactor in mitochondrial biogenesis (36). Increased expression of PGC-1α in adipose tissues was also observed in mice receiving resveratrol (37).
It is also known that calorie restriction increases expression of Sirt1. There is further evidence that activation of Sirt1 by resveratrol effectively prevented cytokine-induced cytotoxicity (35).
Also resveratrol activates 5′-AMP-activated protein kinase. Once activated, AMPK inhibits acetyl-CoA carboxylase enhancing oxidation of fatty acids and decreasing their synthesis (38). Both AMPK and Sirt1 are important in the energy metabolism and mitochondrial biogenesis (39).
The results of the present study disagreed with Rocha et al. (2009), (40) and Pankaj et al., (2012), (7) who found that resveratrol treated group showed non-significant change in body weight as compared to vehicle treated group.
The current study revealed that resveratrol treated group showed significant reduction of SPB compared to vehicle treated group due enhancement of aortic endothelial nitric oxide synthase (eNOS) expression and activity, that coincides with Rivera et al. (2009), (41).
Resveratrol treated group showed significant decrease in serum TNF-α that coincides with Rivera et al.(2009), (41); Jeon et al. (2012), (28) who explained by the anti-inflammatory effect of resveratrol leading to reduction of proinflammatory cytokines as TNF-α and IL-6.
Resveratrol treated group showed a significant decrease in serum leptin, that agrees with Jeon et al. (2012), (28) who explained this by the body weight reduction effect of resveratrol, so it decreases leptin level as obesity is associated with hyperleptinaemia.
The results of the present study showed a significant decrease in blood glucose level and this result is in agreement with Jeon et al. (2012), (28);
Pankaj et al., (2012), (7).The molecular mechanism of antidiabetic action
of resveratrol is explained by that resveratrol binds to sulphonylurea receptor that is a blocker of pancreatic ATP-sensitive K+ channels (42).
The present study showed significant reduction in insulin and improvement of insulin sensitivity compared to vehicle treated group, that is in accordance with Jeon et al. (2012), (28) and Rivera et al. (2009), (41). Moreover, resveratrol ingestion was found to cause effects that are similar to those induced by calorie restriction. These data imply that short-term exposure to resveratrol results in diminished lipid accumulation in both hepatocytes and adipocytes, so improving insulin action (43).
Resveratrol treated group showed significant decrease in TC and TGs compared to vehicle treated group, which agrees with Pankaj et al. (2012), (7).
Rivera et al. (2009), (41) found that in obese zucker rats, administration of resveratrol resulted in significant reduction in plasma TGs, FFAs, TC and hepatic TGs compared with obese zucher rats not treated with resveratrol. The explanation is that resveratrol increases fatty acid oxidation and decreases their synthesis as a part of its anti-obesity action (38).
The current study showed that resveratrol administration led to significant decrease in uric acid compared to vehicle treated group that is due to anti-adipogenic effect and body weight lowering effect of resveratrol as obesity is usually associated with hyperuricaemia which agrees with Pankaj et al. (2012), (7).
In the present study, resveratrol significantly decreased oxidative stress parameters as MDA that is in accordance with Pankaj et al. (2012), (7) who revealed that resveratrol significantly decreased thiobarbituric acid reactive substances and conjugated diene, as parameters of oxidative stress (15). This effect is due to antioxidant activity of resveratrol due to its higher radical scavenging activity resulting in more stable compounds delaying or preventing lipid peroxidation and its associated damage and diseases (44).
In The present study, resveratrol treated group showed significant increase in Catalase activity, as an antioxidant enzyme, proving the beneficial resveratrol effect in oxidative stress reduction which coincides with Pankaj et al. (2012), (7).
Regarding histopathological examination, Resveratrol treated group showed improvement of the pathological picture of the liver as resveratrol treated group showed by hematoxyline and eosin stain partial
8
Nature and Science 2015;13(5) http://www.sciencepub.net/nature
lobular disarray, some cytoplasmic vacuolization and slight inflammatory infiltrate than control group, this is in accordance with Pankaj et al. (2012), (7) and Jeon et al. (2012), (28) who explained this picture by reduction of fat accumulation and anti-inflammatory effect of resveratrol.
By immunohistochemistry study, resveratrol treated group showed decreased NF-κB expression and inflammatory infiltrate that agrees with Jeon et al. (2012), (28) who explained this effect by the anti-inflammatory effect of resveratrol.
In the current study, quercetin showed significant body weight reduction compared to vehicle treated group that is in accordance with Rivera et al. (2008), (26) but in contrast to Panchal et al. (2012), (45).
The anti-obesity effect of quercetin is explained by that quercetin inhibits fat accumulation in maturing human fat cells in culture, for example, while also suppressing the maturation of new fat cells and simultaneously triggering apoptosis in existing fat cells (46).
Quercetin treated group showed significant reduction of SBP compared to vehicle treated group which is in agreement with Rivera et al. (2008), (26) and Panchal et al. (2012), (45).
The antihypertensive effect of quercetin is related to the beneficial antioxidant properties of it on endothelial dysfunction. In the model of obese Zucker rats, as well as in subjects with insulin resistance. Quercetin restores aortic expression of eNOS in obese Zucker rats, an effect which could explain the improved endothelial function and its antihypertensive effect (47).
The present study revealed that quercetin significantly decreased proinflammatory cytokine TNF-α compared to vehicle treated group as it is explained by anti-inflammatory effect of quercetin which downregulates inducible nitric oxide synthase expression and TNF-α, that is in accordance with Rivera et al. (2008), (26).
The current study revealed that quercetin significantly decreased leptin as compared to vehicle treated group as quercetin attenuates ob gene expression which codes for leptin resulting in reduction of leptin concentration in adipose tissue, which coincides with (25).
In the present study, quercetin showed significant reduction of glucose that is in accordance with Pankaj et al. (2012), (7) and Adelkarem and fadda (2013), (25).
The antidiabetic effect of quercetin may be due to its ability to induce insulin secretion by activation of L-type calcium channels in pancreatic β-cells or by increasing glucose uptake by the tissues. Quercetin has anti-inflammatory effects thus it may protect
against diabetes. A recent report indicates that the administration of quercetin reduces the plasma levels of NO among streptozotocin-treated rats (32).
On the contrary to the results of the present study, Rivera et al., (2008), (26) found no significant reduction in blood glucose by quercetin.
The current study showed that administration of quercetin significantly reduced the hyperinsulinemia and insulin resistance, expressed as HOMA-IR and this is in aggrement with Rivera et al., (2008), (26).
Chuang et al., (2010), (48) compared the extent to which quercetin and resveratrol prevented inflammation or insulin resistance in primary cultures of human adipocytes treated with TNF-α. The cultures of human adipocytes were pretreated with quercetin and resveratrol followed by treatment with TNF-α.The result was that quercetin, and to a lesser extent resveratrol, attenuated the TNF-α induced expression of inflammatory genes such as interleukin IL-6, IL-1b, IL-8, and monocyte chemoattractant protein-1 and the secretion of IL-6, IL-8. Quercetin attenuated TNF-α mediated phosphorylation of extracellular signal–related kinase and c-Jun-NH2 terminal kinase, whereas resveratrol attenuated only c-Jun-NH2 terminal kinase phosphorylation. Quercetin prevented the TNF-α mediated serine phosphorylation of insulin receptor substrate-1, protein tyrosine phosphatase-1B gene expression and the suppression of insulin-stimulated glucose uptake, whereas resveratrol prevented only the TNF-α mediated serine phosphorylation of IRS-1.These data suggest that quercetin is equally or more effective than resveratrol in attenuating TNF- α mediated inflammation and insulin resistance in primary human adipocytes.
In the current study, It was found that quercetin significantly reduced TC and TGs compared to vehicle treated group that coincides with Adelkarem and fadda (2013), (25); Ying et al. (2013), (49).
Quercetin has hypocholesterolemic action in other experimental models (50).The hypocholesterolemic mechanisms of polyphenols have been attributed to their antioxidant action resulting in the inhibition of LDL oxidation, also by alteration of hepatic cholesterol absorption, TGs assembly and secretion, or by beneficial anti-inflammatory effects (51).
On the contrary to the results of the present study Panchal et al. (2012), (45) found that quercetin produced non-significant reduction of TGs and TC.
The present study revealed significant reduction of uric acid in quercetin treated group which is explained by its potential xanthine oxidase inhibitory activity compared to vehicle treated group that agrees with Hu et al. (2012), (8) and Panchal et al. (2012), (45).
9

Nature and Science 2015;13(5) http://www.sciencepub.net/nature
Quercetin treated group showed significant decrease in MDA, which agrees with coskun et al. (2005), (32) who explained this effect by its potent antioxidant activity which reduces inflammation, in the same way, quercetin increases the activity of antioxidant enzymes as catalase.
Regarding histopathological examination, quercetin treated group showed improvement of different pathological picture of steatohepatitis as it showed by hematoxyline and eosin stain almost normal histology except a slight partial lobular disarray, little cytoplasmic vacuolization, slight inflammatory infiltrate than control group and this is due to the effect of quercetin as a modulator of lipid homeostasis in liver by reduction of circulating and endogenous synthesis of TGs preventing their deposition leading to reduction of fat droplets accumulation in hepatocytes. By immunohistochemistry study, quercetin treated group showed decreased NF-κB expression and inflammatory infiltrate due to its anti-inflamatory effect by reducing the gene expression of NF-κB p65 that agrees with Ying et al. (2013), (49).
The results of the present study revealed that quercetin treated groups were slightly improved than resveratrol groups, it may be due to its potent antioxidant effect leading to more potent anti-inflammatory effect, with subsequent more reduction of obesity with its related parameters as blood glucose and insulin resistance (48), SBP, leptin, TC, TGs, MDA, uric acid, increased antioxidant activity of catalase and better improvement of the pathplogical picture by more suppression of NF-κB / TNF-α mediated inflammatory pathway.
No conflict of interestNo funding
Corresponding authorSafa Reyad Abdel-Salam EL-FiKyClinical Pharmacology Department, Medical Biochemistry Department2 and Pathology Department3- Faculty of Medicine- Menoufia [email protected]
References1. Sanayal A. AGA technical review on non –
alcoholic fatty liver disease. Gastroenterology. 2002; 123: 1705 – 1725.
2. Fried S, Bunkin D, Greenberg A. Omental and Subcutaneous adipose tissues of obese subjects release interleukin–6:depot difference and regulation by glucocorticoid. J Clin Endocrinal Metab 1998; 83: 847-850.
3. Kahn B.Alterations in glucose transporter expression and function in diabetes: mechanisms for insulin resistance. J Cell Biochem1992; 48: 122–128.
4. Szkudelski T, Szkudelska K. Anti-diabetic effects of resveratrol. Ann N Y Acad Sci 2011; 215: 34–39.
5. Vessal M, Hemmati M, Vase M.Antidiabetic effect of quercetin in streptozotocin–induced diabetic rats. Comp biochem physiol C: Comp. Pharmacol Toxicol 2003; 135: 357– 64.
6. Kobori M, Masumoto S, Akimoto Y and Oike H.Chronic dietary intake of quercetin alleviates hepatic fat accumulation associated with consumption of a western – style diet in C57 / Bl6J mice. Mol Nutr Food Res 2011;55: 530 – 40.
7. Pankaj K, Haeish M, Saidulu M et al. Attenuation of insulin resistance, metabolic syndrome and hepatic oxidative stress by resveratrol in fructose- fed rats.Pharmacological research 2012; 66: 260-268.
8. Hu Q, Zhang D, Pan Y, Li Y, Kong L. Allopurinol, quercetin and rutin ameliorate renal NLRP3 inflammasome activation and lipid accumulation in fructose fed rats. Biochemical pharmacology 2012; 84: 113–25.
9. Reid J, Ziven J, Kopin I. Central and peripheral adrenergic mechanisms in the development of corticosterone-saline hypertension in rats. Circ Res 1975; 37: 569-79.
10. Schermer S. The blood morphology of laboratory animals.(3rd edition),1967. 42
11. Taylor PC. Anti-TNF therapy for rheumatoid arthritis and other inflammatory diseases. Mol Biotechnol 2001; 19 (2):153-68.
12. Considine R, Sinha M): Serum immunoreactive - Leptin concentrates in normal weight and obese human. The New England J of Medic 1996.
13. Starr J, Mako M, Juhn D, Rubenstein A. Measurement of serum proinsulin-like. Material: cross-reactivity of porcine and human proinsulin in the insulin radioimmunoassay.J of Lab Clin Medic 1978; 91(4): 691-692.
14. Matthews D, Hosker J, Rudens. Homeostasis model assessment: insulin resistance and β-cell function from fasting plasma glucose and insulin concentrations in man. Diabetologia 1985; 28: 412–419.
15. Okhawa H, Oohishi N, Yagi K. Assay for lipid peroxides in animal tissues by thiobarbituric acid reaction. Annals of Biochemistry 1979; 95:351–8.
10

Nature and Science 2015;13(5) http://www.sciencepub.net/nature
16. Kaplan A.Triglycerides.Clinical Chemistry. The C.V. Mosby Co.St Louis.Tronto.Princeton 1984; 437:1194-1206.
17. Naito H, Kaplan A.Cholesterol.Clinical chemistry. The C.V. Mosby Co.St Louis.Tronto. Princeton 1984: 1194-11206 and 437.
18. Schultz A, Kaplan A. Uric acid. Clinical chemistry. The C.V. Mosby Co. St Louis. Tronto. Princeton 1984: 1261-1266 and 418.
19. Aebi H. Catalase in vitro. Methods Enzymol 1984; 105:121-126.
20. Bancroft J, Steven L. Theory and practice of histological techniques, 4th Edition. Churchill Livingstone, Edinburgh 1996:766.
21. Meteoglu I, Erdogdu I, Meydan N, et al. NF-Kappa B expression correlates with apoptosis and angiogenesis in clear renal cell carcinoma tissue. J Exp Clin Cancer research 2008; 27:53
22. Amos A, McCarty D, Zimmet P. The rising global burden of diabetes and its complications: estimates and projections to the year 2010. Diabet Med. 1997; 14 (5): 1–85.
23. Le KA, Tappy L. Metabolic effects of fructose. Curr Opin Clin Nutr Metab Care 2006; 9:469–475.
24. Havel P. Dietary fructose:implications for dysregulation of energy homeostasis and lipid/carbohydrate metabolism. Nutr ev 2005; 63:133-157.
25. Abdelkarem H, Fadda L. Flaxseed and quercetin improve anti-inflammatory cytokine level and insulin sensitivity in animal model of metabolic syndrome, the fructose-fed rats. Arab J of Chem 2013; 1-6.
26. Rivera L, Morón R, Sánchez M, Zarzuelo A, Galisteo M. Quercetin Ameliorates Metabolic Syndrome and Improves the Inflammatory Status in Obese Zucker Rats.Obesity. intervention and prevention. nature publishing group 2008; 16 (9):2081–2087.
27. Gomez-Zorita S, Alfredo, Arrate L, Elizabeth H, Luis B, Maria P. Effects of resveratrol on obesity-related inflammation markers in adipose tissue of genetically obese rats.Nutrition 2013; 29:1374–1380.
28. Jeon B, Eun A, Hyun J, et al. Resveratrol Attenuates Obesity-Associated Peripheral and Central Inflammation and Improves Memory Deficit in Mice Fed a High-Fat Diet.Diabetes 2012; 61:1444–54.
29. Faggioni R, Feingold K, Grunfeld C. Leptin regulation of the immune response and the immunodeficiency of malnutrition. FASEB J 2003; 15:2565-2571.
30. Zarkesh-Esfahani H, Pockley A, Wu Z, Hellewell P, Weetman A, Ross R. Leptin
indirectly activates human neutrophils via induction of TNF-alpha. J of Immunol 2004; 172:1809-14.
31. Veerapur V, Prabhakar K, Thippeswamy B, Bansal P, Srinivasan K, Unnikrishnan M. Antidiabetic effect of Dodonaea viscosa (L.). Lacq. Aerial parts in high fructose-fed insulin resistant rats: a mechanism based study. Ind J of Exp Bio 2010; 48: 800–810.
32. Coskun O, Kanter M, Korkmaz A,Oter S. Quercetin, a flavonoid antioxidant, prevents and protects streptozotocin-induced oxidative stress and cell damage in rat pancreas. Pharmacol Res 2005; 51:117–123.
33. Lagouge M, Argmann C, Grhart-Hines Z,et al. Resveratrol improves mitochondrial function and protects against metabolic disease by activating SIRT1 and PGC-1α. Cell 2006; 127:1–14.
34. Aubin M, Lajoie C, Clement R, Gosselin H, Calderone A, Perrault L. Female rats fed a high-fat diet were associated with vascular dysfunction and cardiac fibrosis in the absence of overt obesity and hyperlipidemia: therapeutic potential of resveratrol. J Pharmacol Exp Ther 2008; 325:961–968.
35. Lee J, Song M, Song E, et al. Overexpression of SIRT1 protects pancreatic beta-cells against cytokine toxicity by suppressing the nuclear factor-kappaB signaling pathway. Diabetes 2009; 58: 344–351.
36. Rodgers J, Lerin C, Haas W, Gygi S, Spiegelman B. Nutrient control of glucose homeostasis through a complex of PGC-1alpha and SIRT1. Nature 2005; 434:113–118.
37. Mayers J, Iliff B, Swoap S. Resveratrol treatment in mice does not elicit the bradycardia and hypothermia associated with calorie restriction. FASEB J 2009; 23:1032–1040.
38. Hardie D, Pan D. Regulation of fatty acid synthesis and oxidation by the AMP-activated protein kinase. Biochem Soc Trans 2002; 30: 1064–1070.
39. Steinberg G, Kemp B. AMPK in health and disease. Physiol Rev 2009; 89:1025–1078.
40. Rocha K, Souza G, Ebaid G, Seiva F, Cataneo A, Novelli E. Resveratrol toxicity: effects on risk factors for atherosclerosis and hepatic oxidative stress in standard and high-fat diets. Food Chem Toxicol 2009; 47:1362–1367.
41. Rivera L, Morón R, Zarzuelo A, Galisteo M. Long-term resveratrol administration reduces metabolic disturbances and lowers blood pressure in obese Zucker rats. Biochem Pharmacol 2009; 77:1053–1063.
11

Nature and Science 2015;13(5) http://www.sciencepub.net/nature
42. Hambrock A, De Oliveira Franz C, Hiller S, et al. Resveratrol binds to the sulfonylurea receptor (SUR) and induces apoptosis in a SUR subtype-specific manner. J Biol Chem 2007; 282: 3347–3356.
43. Barger J, KayoT, Vann J, et al. A low dose of dietary resveratrol partially mimics caloric restriction and retards aging parameters in mice. PloS ONE 2008; 3:2264.
44. Soares X, Lv L, Li W, et al. The interaction of nuclear factor-Kappa B and cytokines is associated with schizophrenia. Biol Psychiatry 2009; 65:481-8.
45. Panchal S, Hemant P, Lindsay B. Quercetin Ameliorates Cardiovascular, Hepatic, and Metabolic Changes in Diet-Induced Metabolic Syndrome in Rats.J Nutr 2012; 142: 1026–1032.
46. Ahn J, Lee H, Kim S, Park J, Ha T.The anti-obesity effect of quercetin is mediated by the AMPK and MAPK signaling pathways. Biochem Biophys Res Commun 2008;373:545-9.
47. Sanchez M, Galisteo M, Vera R. Quercetin downregulates NADPH oxidase, increases
eNOS activity and prevents endothelial dysfunction in spontaneously hypertensive rats. J. Hypertens 2006; 24:75–84.
48. Chuang C, Martinez K, Xie G, et al. Quercetin is equally or more effective than resveratrol in attenuating tumor necrosis factor-a–mediated inflammation and insulin resistance in primary human adipocytes. Am J Clin Nutr 2010; 92:1511–1521.
49. Ying A, Liu Y, Bing Y, Wang Z, Zang J, Yu C. Dietary quercetin ameliorates nonalcoholic steatohepatitis induced by a high-fat diet in gerbils. Food and Chem Toxicol 2013; 52:53–60.
50. Kamada C, Da Silva E, Ohnishi-Kameyama M, Moon J, Terao J. Attenuation of lipid peroxidation and hyperlipidemia by quercetin glucoside in the aorta of high cholesterol-fed rabbit. Free Radic Res 2005; 39:185–194.
51. Zern T, West K, Fernandez M. Grape polyphenols decrease plasma triglycerides and cholesterol accumulation in the aorta of ovariectomized guinea pigs. J Nutr 2003;133: 2268–2272.
4/18/2015
12