effect of matrix resin properties on activity of a mechanochromic fluorescent probe for use in a...
TRANSCRIPT

Effect of Matrix Resin Properties on Activity of a Mechanochromic Fluorescent Probe for use in a novel Non-Destructive Inspection Technique for Aerospace Polymer Matrices
Natalie M. Larson, Alex Jen, Ryan E. Toivola, Zhengwei Shi, Sei-Hum Jang, Gary Georgeson* and Brian D. FlinnUniversity of Washington, *The Boeing Company
13th International Symposium on Nondestructive Characterization of Materials Palais des Congrès et de la Culture du Mans, FranceMay 20, 2013

2
Background
Materials
▪ Matrix▪ Probe
Methods
▪ Sample Characterization▪ Probe Response Testing
Results
▪ Sample Characterization▪ Probe Response Testing
Conclusions
Composite Impact Damage
CompositesBarely Visible Impact Damage (BVID): Subsurface damage produced by impact [2]
Aluminum aircraft fuselage shows dents after impact [1]
Research Goal: Improve Visual Inspection Techniques for Composites
[1] Photo of the day: “Miracle on the Hudson” plane, on I-77, Available Online:http://davidsonnews.net/blog/tag/miracle-on-the-hudson/ [2] Iwahori, Y., JAXA Res. Rep. 14 , www.apg.jaxa.jp/eng/publication
3
Background
Materials
▪ Matrix▪ Probe
Methods
▪ Sample Characterization▪ Probe Response Testing
Results
▪ Sample Characterization▪ Probe Response Testing
Conclusions
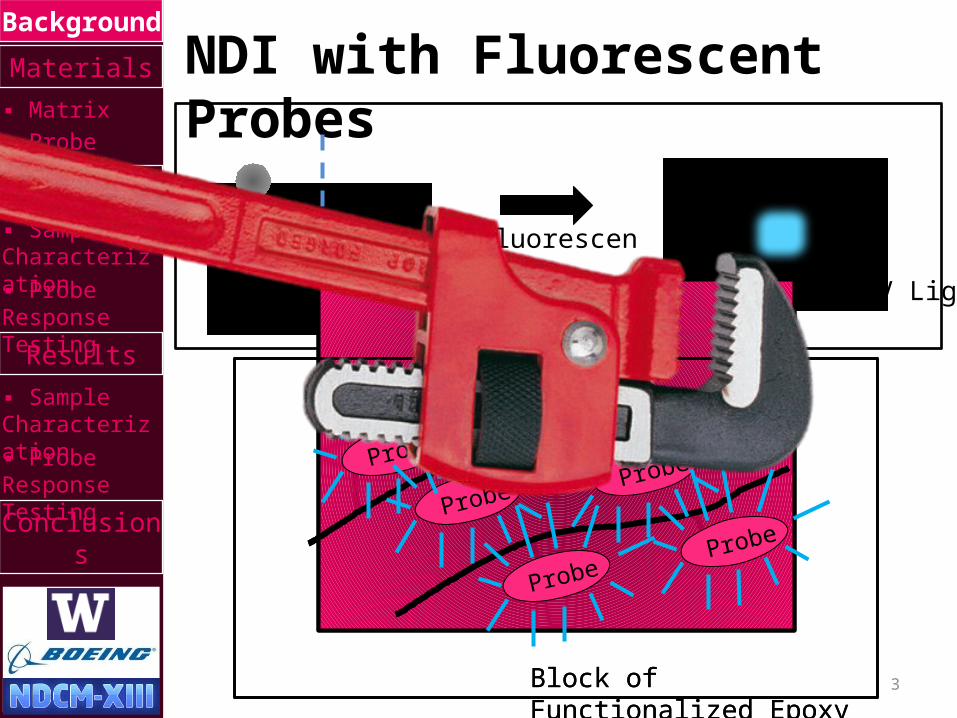
NDI with Fluorescent Probes
Fluorescencebased inspection *Under UV Light
Probe
ProbeProbe
ProbeProbe
Block of Functionalized Epoxy
Probe
ProbeProbe
ProbeProbe
Block of Functionalized Epoxy

4
Background
Materials
▪ Matrix▪ Probe
Methods
▪ Sample Characterization▪ Probe Response Testing
Results
▪ Sample Characterization▪ Probe Response Testing
Conclusions
Research Question
How do the mechanical properties of the matrix affect
the fluorescent probe response?
Motivations for Research Question:• Polymeric materials used in aerospace fall
within a large range of mechanical properties• Research may reveal information about
molecular mechanism of probe
Research Approach: Reduce Elastic Modulus of Functionalized Epoxy with Diluent

5
Background
Materials
▪ Matrix▪ Probe
Methods
▪ Sample Characterization▪Probe Response Testing
Results
▪ Sample Characterization▪ Probe Response Testing
Conclusions
Matrix Materials
Epoxy: Diglycidyl ether of bisphenol-A (DGEBA)
Curing Agent: Diethylenetriamine (DETA)
Epoxide Functionalized Reactive Diluent: Diglycidyl ether (polypropylene glycol) (DGE(PPG))
Neat Epoxy System: (RT Cure, Optically Clear)
6
Background
Materials
▪ Probe
Methods
▪ Sample Characterization▪Probe Response Testing
Results
▪ Sample Characterization▪ Probe Response Testing
Conclusions
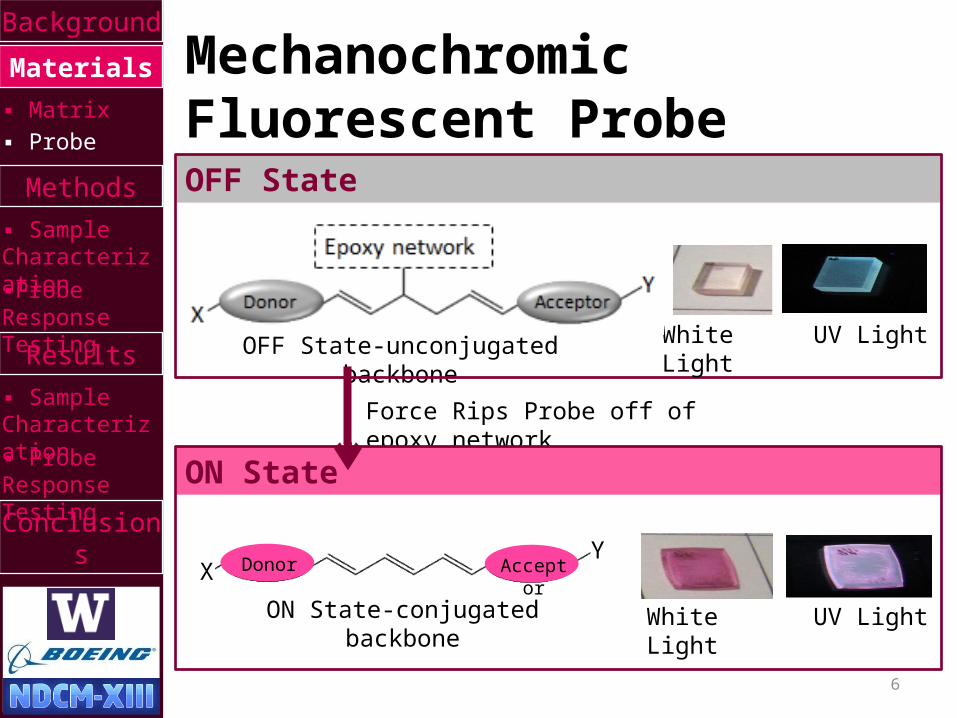
Mechanochromic Fluorescent Probe
Donor Acceptor
ON State-conjugated backbone
OFF State-unconjugated backbone
Force Rips Probe off of epoxy network
YX
OFF State
White Light UV Light
ON State
White Light UV Light
▪ Matrix
7
Background
Materials
▪ Matrix▪ Probe
Methods
▪ Sample Characterization▪Probe Response Testing
Results
▪ Sample Characterization▪ Probe Response Testing
Conclusions
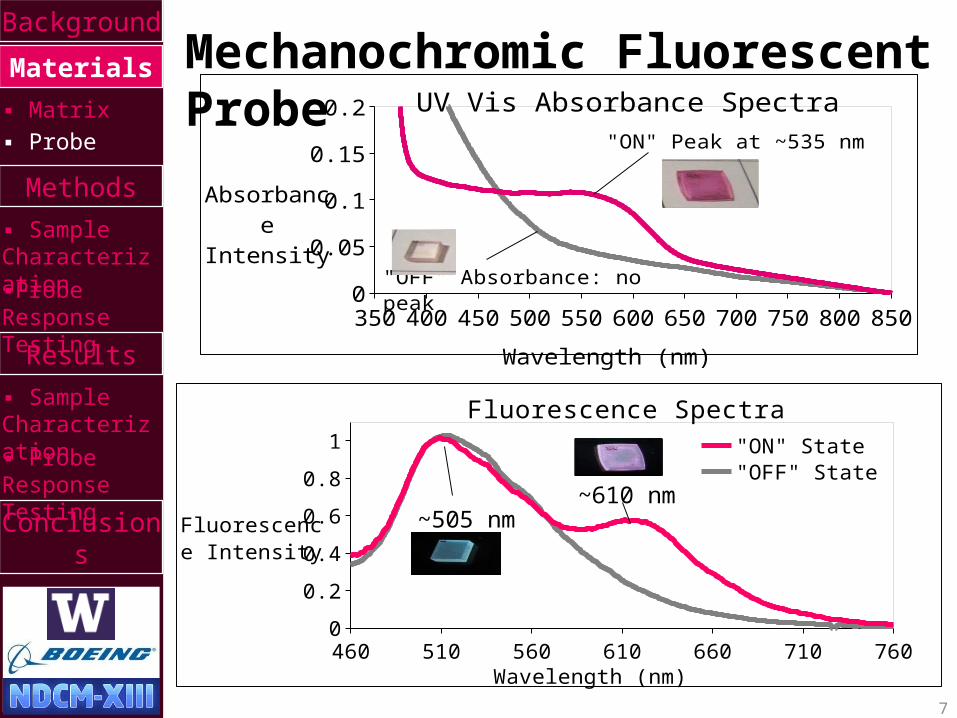
Mechanochromic Fluorescent Probe
350 400 450 500 550 600 650 700 750 800 8500
0.05
0.1
0.15
0.2 UV Vis Absorbance Spectra
Wavelength (nm)
Absorbance Intensity
"ON" Peak at ~535 nm
"OFF" Absorbance: no peak
460 510 560 610 660 710 7600
0.2
0.4
0.6
0.8
1
Fluorescence Spectra
"ON" State"OFF" State
Wavelength (nm)
Fluorescence Intensity
~610 nm~505 nm

8
Background
Materials
▪ Matrix▪ Probe
Methods
▪ Sample Characterization▪Probe Response Testing
Results
▪ Sample Characterization▪ Probe Response Testing
Conclusions
Mixtures FabricatedMixtures Fabricated:• Ranged from 0-100wt% diluent DGE(PPG)• Named by wt% DGE(PPG)
ie. 40wt% DGE(PPG) + 60wt% DGEBA referred to as 40wt% DGE(PPG)
Mixing Procedure
Neat Epoxy (DGEBA)
DiluentDGE(PPG)
DETA + Probe
Light pink solid
Mix, vac, pour
Cure 24h @ RT
yellow liquid
9
Background
Materials
▪ Matrix▪ Probe
Methods
▪ Sample Characterization▪Probe Response Testing
Results
▪ Sample Characterization▪ Probe Response Testing
Conclusions
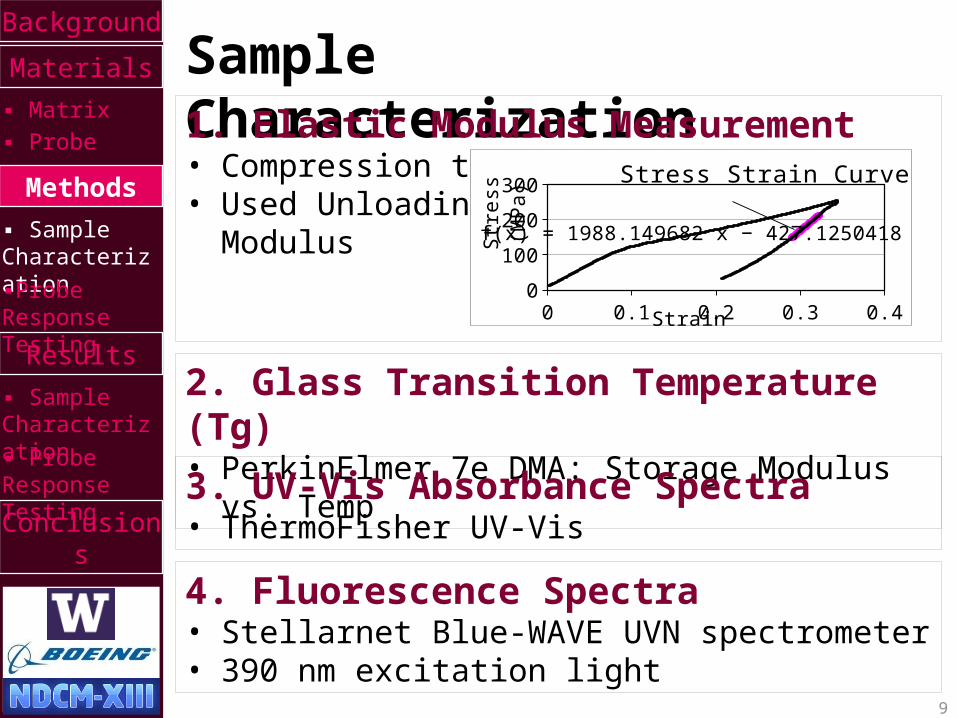
Sample Characterization1. Elastic Modulus Measurement• Compression test• Used Unloading
Modulus
0 0.05 0.1 0.15 0.2 0.25 0.3 0.35 0.40
100
200
300
f(x) = 1988.14968185262 x − 427.125041830675
Stress Strain Curve
Strain
Stre
ss (M
Pa)
2. Glass Transition Temperature (Tg) • PerkinElmer 7e DMA: Storage Modulus vs. Temp
3. UV-Vis Absorbance Spectra• ThermoFisher UV-Vis
4. Fluorescence Spectra• Stellarnet Blue-WAVE UVN spectrometer • 390 nm excitation light
10
Background
Materials
▪ Matrix▪ Probe
Methods
▪ Sample Characterization▪Probe Response Testing
Results
▪ Sample Characterization▪ Probe Response Testing
Conclusions
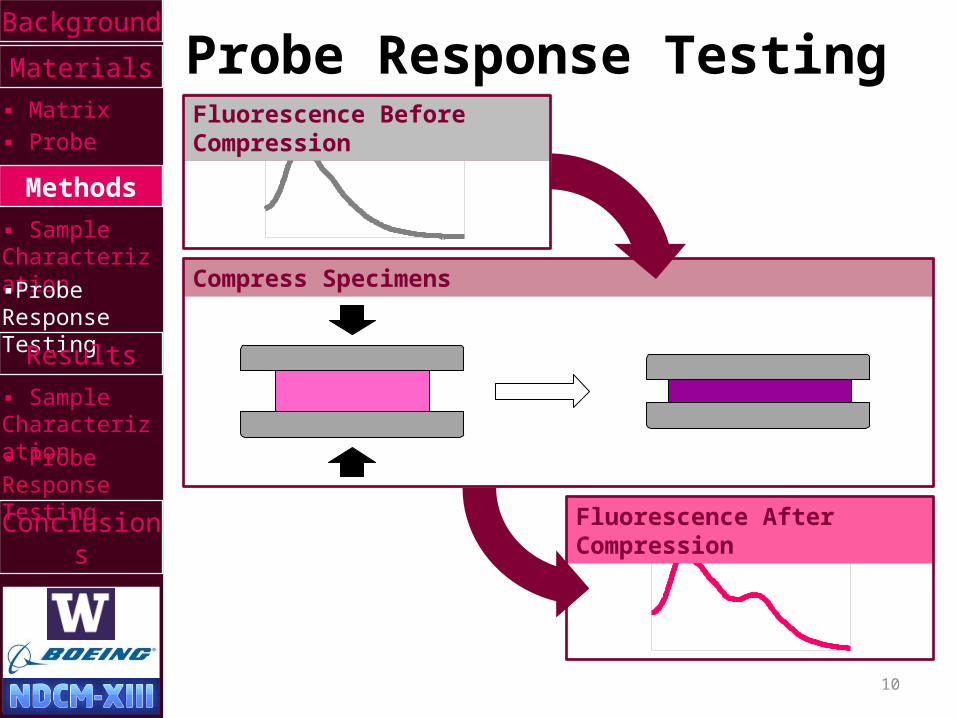
Probe Response TestingFluorescence Before Compression
Compress Specimens
Fluorescence After Compression
11
Background
Materials
▪ Matrix▪ Probe
Methods
▪ Sample Characterization▪Probe Response Testing
Results
▪ Sample Characterization▪ Probe Response Testing
Conclusions
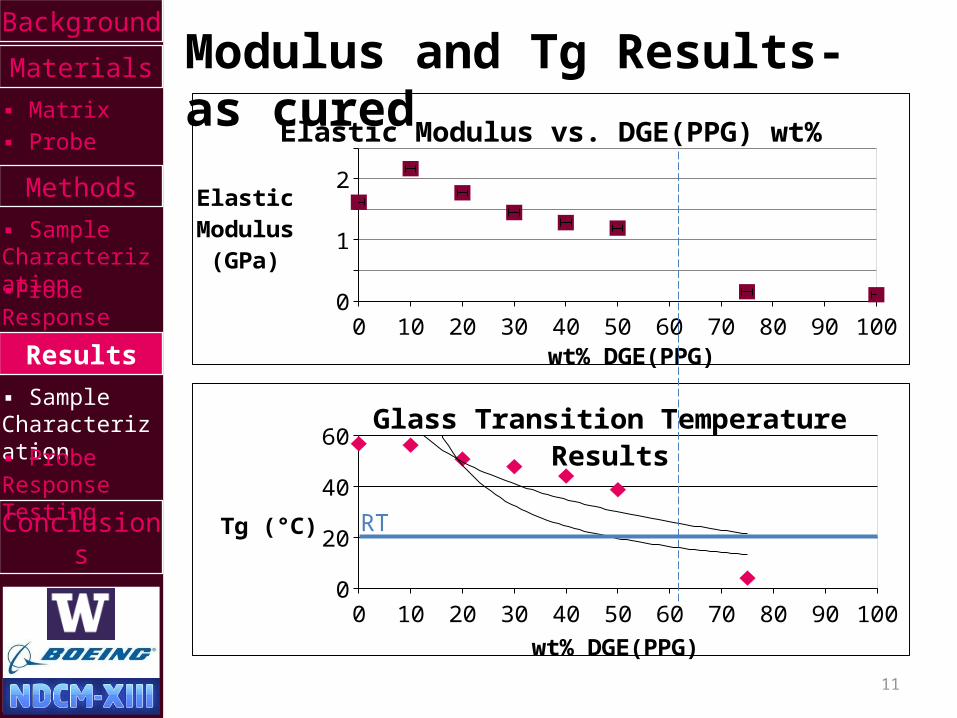
Modulus and Tg Results-as cured
0 10 20 30 40 50 60 70 80 90 1000
0.51
1.52
2.5Elastic Modulus vs. DGE(PPG) wt%
wt% DGE(PPG)
Elastic Modu-lus (GPa)
0 10 20 30 40 50 60 70 80 90 1000
102030405060
Glass Transition Temperature Results
wt% DGE(PPG)
Tg (°C) RT
12
Background
Materials
▪ Matrix▪ Probe
Methods
▪ Sample Characterization▪Probe Response Testing
Results
▪ Sample Characterization▪ Probe Response Testing
Conclusions
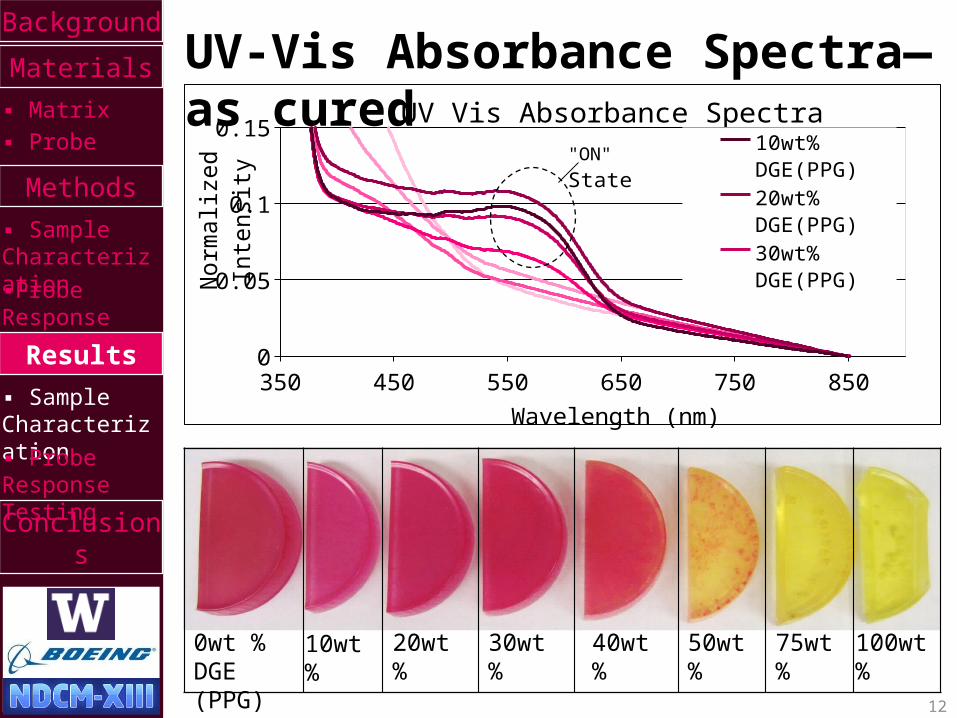
UV-Vis Absorbance Spectra—as cured
350 450 550 650 750 8500
0.05
0.1
0.15UV Vis Absorbance Spectra
10wt% DGE(PPG)20wt% DGE(PPG)30wt% DGE(PPG)40wt% DGE(PPG)50wt% DGE(PPG)75wt% DGE(PPG)100wt% DGE(PPG)
Wavelength (nm)
Nor
mal
ized
Inte
nsity
"ON" State
0wt % DGE (PPG)
10wt % 20wt % 30wt % 40wt % 50wt % 75wt % 100wt %

13
Background
Materials
▪ Matrix▪ Probe
Methods
▪ Sample Characterization▪Probe Response Testing
Results
▪ Sample Characterization▪ Probe Response Testing
Conclusions
Fluorescence Spectra—as cured
460 520 580 640 700 7600
0.2
0.4
0.6
0.8
1
1.2Normalized Fluorescence Spectra of Samples
0%DGE(PPG) 10%DGE(PPG) 20%DGE(PPG) 30%DGE(PPG) 40%DGE(PPG) 50%DGE(PPG) 75%DGE(PPG) 100%DGE(PPG)
Wavelength (nm)
Nor
mal
ized
Flu
ores
cenc
e In
tens
ity
"ON" State
"OFF" State~505 nm
~610 nm

14
Background
Materials
▪ Matrix▪ Probe
Methods
▪ Sample Characterization▪Probe Response Testing
Results
▪ Sample Characterization▪ Probe Response Testing
Conclusions
Probe Response Testing: Typical Compression Behavior
0 0.05 0.1 0.15 0.2 0.25 0.3 0.35 0.4 0.45 0.50
500
1000
1500
2000
2500
True Stress-Strain Curve for Incremental Compression of 10wt% DGE(PPG) Sample
True Strain
True
Str
ess (
MPa
) 12
3456
15
Background
Materials
▪ Matrix▪ Probe
Methods
▪ Sample Characterization▪Probe Response Testing
Results
▪ Sample Characterization▪ Probe Response Testing
Conclusions
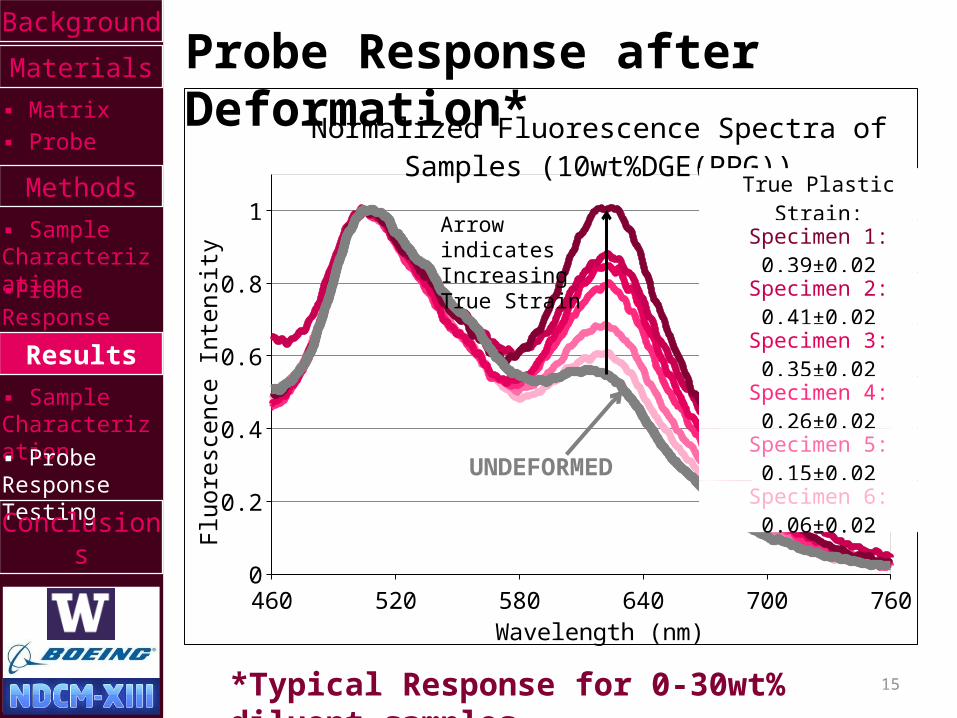
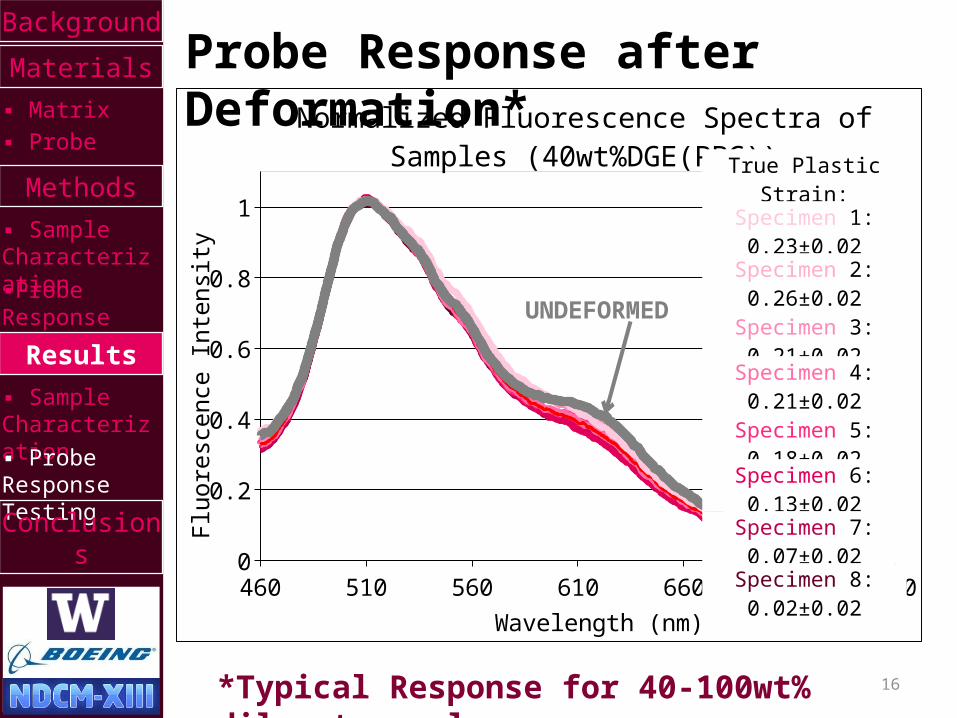
Probe Response after Deformation*
460 520 580 640 700 7600
0.2
0.4
0.6
0.8
1
Normalized Fluorescence Spectra of Samples (10wt%DGE(PPG))
Wavelength (nm)
Fluo
resc
ence
Inte
nsity
True Plastic Strain:Specimen 1: 0.39±0.02Specimen 2: 0.41±0.02Specimen 3: 0.35±0.02Specimen 4: 0.26±0.02Specimen 5: 0.15±0.02Specimen 6: 0.06±0.02
Arrow indicates Increasing True Strain
UNDEFORMED
*Typical Response for 0-30wt% diluent samples
16
Background
Materials
▪ Matrix▪ Probe
Methods
▪ Sample Characterization▪Probe Response Testing
Results
▪ Sample Characterization▪ Probe Response Testing
Conclusions
Probe Response after Deformation*
460 510 560 610 660 710 7600
0.2
0.4
0.6
0.8
1
Normalized Fluorescence Spectra of Samples (40wt%DGE(PPG))
Wavelength (nm)
Fluo
resc
ence
Inte
nsity
True Plastic Strain:Specimen 1: 0.23±0.02Specimen 2: 0.26±0.02Specimen 3: 0.21±0.02Specimen 4: 0.21±0.02Specimen 5: 0.18±0.02Specimen 6: 0.13±0.02Specimen 7: 0.07±0.02Specimen 8: 0.02±0.02
*Typical Response for 40-100wt% diluent samples
UNDEFORMED
17
Background
Materials
▪ Matrix▪ Probe
Methods
▪ Sample Characterization▪Probe Response Testing
Results
▪ Sample Characterization▪ Probe Response Testing
Conclusions
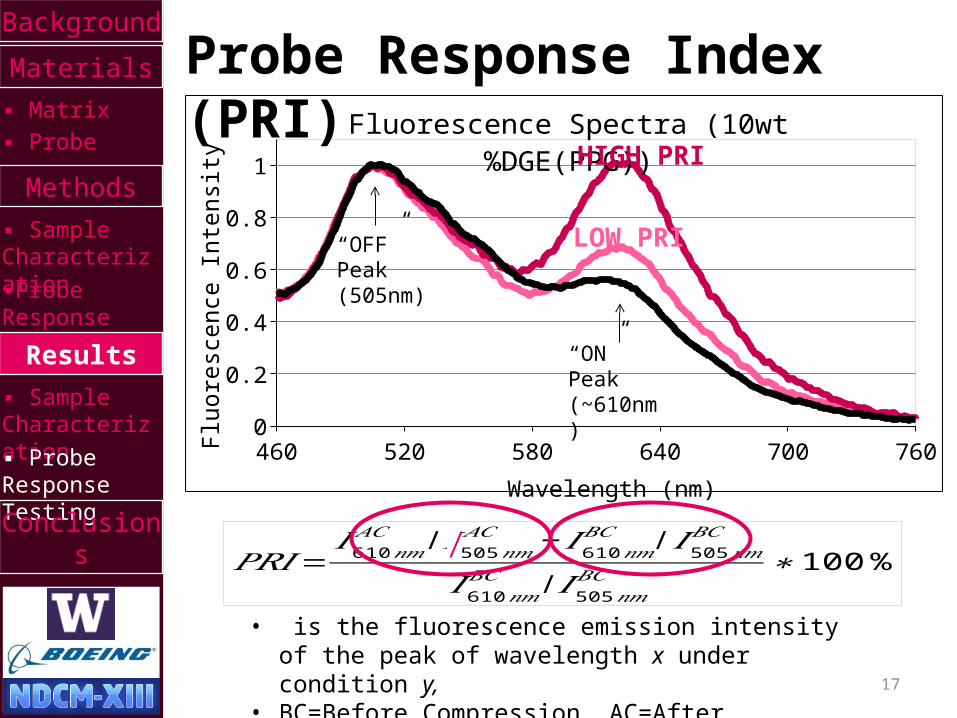
Probe Response Index (PRI)
𝑃𝑅𝐼=𝐼610𝑛𝑚𝐴𝐶 / 𝐼 505𝑛𝑚
𝐴𝐶 − 𝐼610𝑛𝑚𝐵𝐶 /𝐼 505𝑛𝑚
𝐵𝐶
𝐼610𝑛𝑚𝐵𝐶 / 𝐼 505𝑛𝑚
𝐵𝐶 ∗100%
460 520 580 640 700 7600
0.2
0.4
0.6
0.8
1
Fluorescence Spectra (10wt%DGE(PPG))
Wavelength (nm)
Fluo
resc
ence
Inte
nsity
“OFF” Peak(505nm)
“ON” Peak(~610nm)
HIGH PRI
LOW PRI
• is the fluorescence emission intensity of the peak of wavelength x under condition y,
• BC=Before Compression, AC=After Compression
18
Background
Materials
▪ Matrix▪ Probe
Methods
▪ Sample Characterization▪Probe Response Testing
Results
▪ Sample Characterization▪ Probe Response Testing
Conclusions
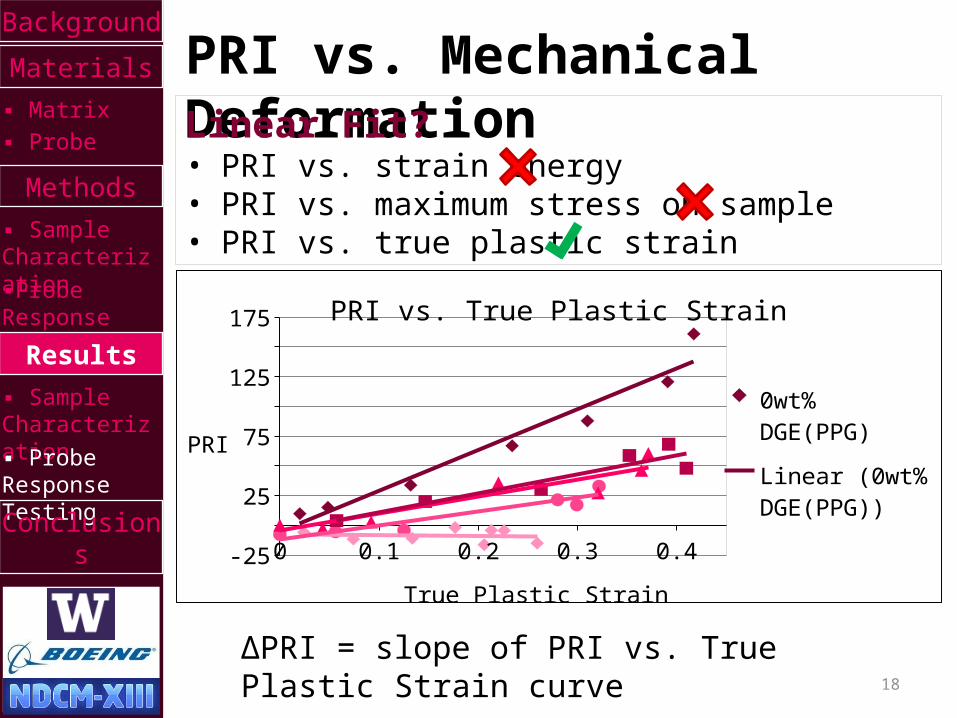
PRI vs. Mechanical Deformation
ΔPRI = slope of PRI vs. True Plastic Strain curve
0 0.05 0.1 0.15 0.2 0.25 0.3 0.35 0.4 0.45-250
255075
100125150175 PRI vs. True Plastic Strain
0wt% DGE(PPG)Linear (0wt% DGE(PPG))10wt%DGE(PPG)Linear (10wt%DGE(PPG))20wt%DGE(PPG)
True Plastic Strain
PRI
Linear Fit?• PRI vs. strain energy• PRI vs. maximum stress on sample• PRI vs. true plastic strain
19
Background
Materials
▪ Matrix▪ Probe
Methods
▪ Sample Characterization▪Probe Response Testing
Results
▪ Sample Characterization▪ Probe Response Testing
Conclusions
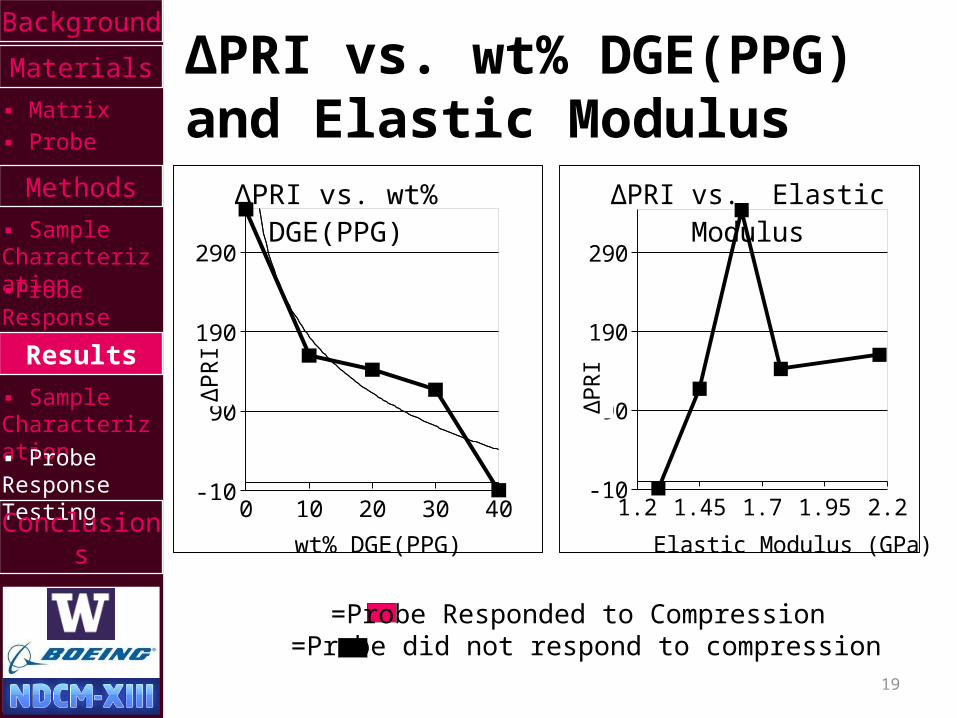
ΔPRI vs. wt% DGE(PPG) and Elastic Modulus
0 10 20 30 40-10
90
190
290
ΔPRI vs. wt% DGE(PPG)
wt% DGE(PPG)
ΔPRI
1.2 1.45 1.7 1.95 2.2-10
90
190
290
ΔPRI vs. Elastic Modulus
Elastic Modulus (GPa)
ΔPRI
=Probe Responded to Compression =Probe did not respond to compression
20
Background
Materials
▪ Matrix▪ Probe
Methods
▪ Sample Characterization▪Probe Response Testing
Results
▪ Sample Characterization▪ Probe Response Testing
Conclusions
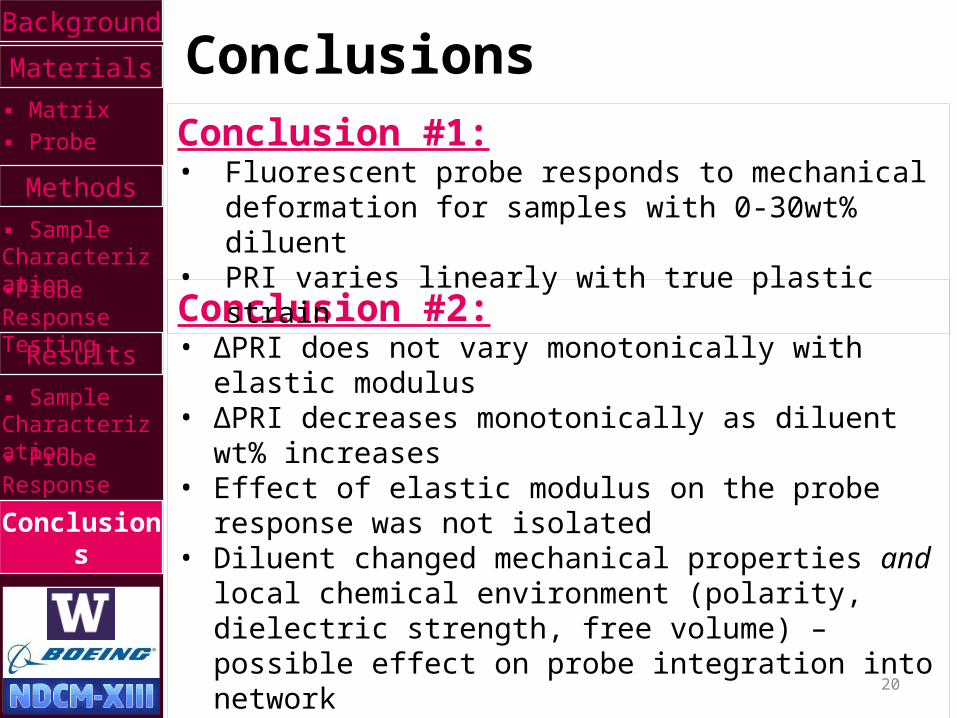
Conclusions
Conclusion #2:• ΔPRI does not vary monotonically with elastic modulus• ΔPRI decreases monotonically as diluent wt% increases• Effect of elastic modulus on the probe response was not
isolated• Diluent changed mechanical properties and local chemical
environment (polarity, dielectric strength, free volume) –possible effect on probe integration into network
• ΔPRI is more significantly affected by the changes in the local chemical environment than the matrix mechanical properties
Conclusion #1:• Fluorescent probe responds to mechanical deformation for
samples with 0-30wt% diluent• PRI varies linearly with true plastic strain
21
Background
Materials
▪ Matrix▪ Probe
Methods
▪ Sample Characterization▪Probe Response Testing
Results
▪ Sample Characterization▪ Probe Response Testing
Conclusions
Plans for Future Work1. Determine how the local chemical environment
affects the interactions between the probe and host polymers.
2. Separate the effects of matrix stiffness from the effects of the local chemical environment
3. Study effects of DGEBA derivatives with varying molecular weights as reactive diluents.
4. In General, a further understanding of • Temporal stability• Thermal stability• Effect of fiber reinforcements

22
Acknowledgements
Flinn Group:• Dr. Brian Flinn• Dr. Ryan Toivola• Students: Dana Rosenbladt, Ashley Tracey, Curtis Hickmott, Tucker
Howie, Kevin Braun, Ali Dillon, Gary Weber, Jonathan Morasch, Dave Pate, David Sapiro
Funding:• The Boeing Company Project Code B8LDL• Washington Research Foundation • UW Office of Research, Mary Gates Endowment, Levinson Emerging
Scholars Program, UW Undergraduate Research Program
Special Thanks (The Boeing Company):• Kelsi Hurley• Grant Zenkner• Mark Wilenski

23
Backup Slides
R2 Values for Linear Fits to PRI vs:wt% DGE(PPG)
True Plastic Strain
Strain Energy
Maximum Stress Applied
0 0.95 0.98 0.8810 0.88 0.82 0.7220 0.88 0.65 0.6130 0.90 0.66 0.56
R2 Values for Linear Fits of PRI vs. Mechanical Testing Values

24
Backup Slides
43 46 49 52 55-10
90
190
290
390ΔPRI vs. Tg
Glass Transition Temperature (°C)
ΔPRI