effect of leadership styles on change management in
TRANSCRIPT

. EFFECT OF LEADERSHIP STYLES ON CHANGE
MANAGEMENT IN SELECTED COUNTY GOVERMENTS IN KENYA
GRACE NYAMBURA KUNG’U
DOCTOR OF PHILOSOPHY
(Leadership and Governance)
JOMO KENYATTA UNIVERSITY OF
AGRICULTURE AND TECHNOLOGY
2019

Effect of Leadership Styles on Change Management in Selected
County Governments in Kenya
Grace Nyambura Kung’u
A Thesis Submitted in partial fulfillment for the Degree of Doctor of
Philosophy in Leadership and Governance in the Jomo Kenyatta
University of Agriculture and Technology
2019

ii
DECLARATION
This thesis is my original work and has not been presented for award of any degree in
any other university.
Signature….................................... Date …....................................
Grace Nyambura Kung’u
This thesis has been submitted for examination with our approval as university
supervisors.
Signature….................................... Date …....................................
Dr Susan Were (PhD)
JKUAT, Kenya
Signature….................................... Date …....................................
Dr. Joyce Nzulwa (PhD)
JKUAT, Kenya

iii
DEDICATION
To the Kingdom of the Almighty God where I serve.

iv
ACKNOWLEDGEMENT
Ultimately above all my gratitude goes to Jehovah the Almighty God who gave me
the life, health, wisdom and strength to pull through this study. I take great gratitude
of the efforts by my two supervisors Dr. Susan Were and Dr. Joyce Nzulwa with
whose guidance, support and encouragement this research has been completed. Their
professional guidance, insightful suggestions and immense cooperation was of
immeasurable benefit in this study. I also want to appreciate the Nairobi, Kiambu,
Kajiado and Machakos County Executive, County Members and Employees who
willingly agreed to take part in this research project.
Special thanks to my Man of God Bishop John Goodnews who not only inspired me
to take this study, he also immensely supported me throughout this study. I also want
to thank my friends Pastor Jennifer Maina and Deaconess Nina Lugonzo for their
labor of love in ensuring that I had enough stationery and helped me ran the errands
throughout my research.
I want to thank my two sons Sammy and Richard for allowing me time off from their
daily schedules. I also want to thank my Mom and Dad for their moral support during
this research.
May the Lord abundantly bless those who inputted to this research.

v
TABLE OF CONTENTS
DECLARATION .......................................................................................................... ii
LIST OF TABLES ....................................................................................................... xi
LIST OF ABBREVIATIONS AND ACRONYM.................................................... xvi
OPERATIONAL DEFINITION OF TERMS ....................................................... xvii
CHAPTER ONE ........................................................................................................... 1
INTRODUCTION ......................................................................................................... 1
1.1 Background of the Study ...................................................................................... 1
1.1.1 Global Perspective of Leadership Style (LS) and Change Management (CM) ........ 4
1.1.2 Regional Perspective of Leadership Styles and Change Management ..................... 6
1.1.3 Local Perspective Leadership Styles and Change Management ............................... 6
1.1.4 Leadership and Leadership Styles ............................................................................. 8
1.1.5 County Culture and Relationship between Leadership Style and Change
Management ............................................................................................................ 11
1.2 Statement of the Problem ................................................................................... 13
1.3 Study Objective .................................................................................................. 14
1.3.1 General Objectives .................................................................................................. 14
1.3.2 Specific Objectives .................................................................................................. 15
1.4. Research Hypotheses ......................................................................................... 15
1.5 Justification of the Study ................................................................................... 16
1.6 Scope of the Study ............................................................................................. 17
1.7 Limitations of the Study .................................................................................... 18
CHAPTER TWO ........................................................................................................ 19
LITERATURE REVIEW ........................................................................................... 19
2.1 Introduction ........................................................................................................ 19
2.2 Theoretical Review ............................................................................................. 19
vi
2.2.1 Fiedler‘s Contingency Theory ................................................................................. 19
2.2.2 Behavioral Theory ................................................................................................... 21
2.2.3 Great Man and Trait Theories ................................................................................ 22
2.2.3 Leader-Member Exchange (LMX) theory.............................................................. 23
2.2.4 Hersey and Blanchard‘s Situational Leadership Theory ........................................ 25
2.2.5 The Vroom-Yetton-Jago Normative Contingency Theory ..................................... 26
2.2.6 The Path-Goal Leadership Theory ......................................................................... 27
2.3 Conceptual Frame Work .................................................................................... 28
2.3.1 Transformational Leadership .................................................................................. 31
2.3.2 Transactional Leadership ........................................................................................ 32
2.3.3 Laissez-Faire Leadership........................................................................................ 34
2.3.4 Autocratic Leadership ............................................................................................ 35
2.3.5 Democratic (Participative) Leadership .................................................................... 35
2.3.6 County Culture ........................................................................................................ 36
2.3.7 Change Management ............................................................................................... 37
2.4 Empirical Review ............................................................................................... 38
2.4.1 Transformational Leadership and Change Management ......................................... 38
2.4.2 Transactional Leadership and Change Management ............................................... 40
2.4.3 Laissez-Faire Leadership ........................................................................................ 40
2.4.4 Democratic (Participative) Leadership and Change Management ........................... 41
2.4.5 Autocratic Leadership .............................................................................................. 42

vii
2.4.6 Change Management .............................................................................................. 43
2.4.7 County Culture, Leadership Styles and Change Management ................................ 44
2.5 Critique of Literature Review ............................................................................ 45
2.6 Research Gap ..................................................................................................... 46
2.7 Summary of Literature ....................................................................................... 47
CHAPTER THREE .................................................................................................... 48
RESEARCH METHODOLOGY .............................................................................. 48
3.1 Introduction ....................................................................................................... 48
3.2 Research Philosophy ......................................................................................... 48
3.3 Research Design ................................................................................................ 48
3.4 Target Population .............................................................................................. 49
3.5 Sampling Frame ................................................................................................ 50
3.5.1 Sampling Technique ................................................................................................ 50
3.6 Sample Size ....................................................................................................... 51
3.7 Data Collection Instruments .............................................................................. 52
3.7.1 Questionnaires......................................................................................................... 53
3.7.2 Interviews ................................................................................................................ 53
3.8 Data Collection Procedure................................................................................. 54
3.9 Pilot Testing ...................................................................................................... 54
3.9.1 Reliability of Instruments......................................................................................... 55
3.9.2 Validity of Instruments ........................................................................................... 55
3.10 Data Analysis and Presentation ........................................................................ 56
3.10.1 OLS Model ........................................................................................................... 58
3.10.2 Heteroscedasticity ................................................................................................ 58

viii
3.10.4 Autocorrelation ..................................................................................................... 59
3.10.5 Multicollineality ................................................................................................... 59
3.10.6 T-statistics ............................................................................................................... 59
3.11 Operationalization of Study Variables .............................................................. 60
3.12 Research Ethics ....................................................................................................... 60
CHAPTER FOUR ....................................................................................................... 62
DATA FINDINGS AND DISCUSSIONS ................................................................. 62
4.1 Introduction ....................................................................................................... 62
4.2 Results of Pilot Test .......................................................................................... 62
4.3 Response Rate ................................................................................................... 63
4.4 Demographics Information ................................................................................ 64
4.4.1 Age Distribution ....................................................................................................... 64
4.4.2 Job Designation ....................................................................................................... 65
4.4.3 Academic Qualifications ......................................................................................... 66
4.4.4 Response Rate across Counties ............................................................................... 67
4.5 Qualitative Data Analysis .................................................................................. 68
4.5.1 Codes to Themes ...................................................................................................... 68
4.5.2 Basic to Organizing to Global Themes ................................................................... 70
4.6 Descriptive Statistics of the Study Variables .................................................... 73
4.6.1 Transformational Leadership .................................................................................. 74
4.6.3 Laissez-Faire Leadership ........................................................................................ 84
4.6.5 Autocratic Leadership ............................................................................................. 95
4.6.6 County Culture ...................................................................................................... 100

ix
4.6.7 Change Management ........................................................................................... 105
4.7 Tests and Assumptions .................................................................................... 110
4.7.1 Testing for Outliers ............................................................................................... 111
4.7.2 Testing for Normality ........................................................................................... 112
4.7.3 Multicollinearity ................................................................................................... 116
4.7.4 Heteroscedasticity .................................................................................................. 117
4.7.5 Autocorrelation Test ............................................................................................. 118
4.7. 6 Exploratory Factor Analysis ................................................................................. 119
4.7. 7 Confirmatory Factor Analysis ............................................................................... 119
4.8 Inferential Statistics ...................................................................................... 121
4.8.1 Correlations of the Study Variables ...................................................................... 121
4.9 Regression analysis Before Moderation and after moderation......................... 124
4.9.1 Transformational Leadership ................................................................................ 124
4.9.2 Transactional Leadership ....................................................................................... 127
4.9.3 Laissez Faire Leadership ....................................................................................... 129
4.9.4 Democratic Leadership ......................................................................................... 132
4.9.5 Autocratic Leadership ........................................................................................... 134
4.9.6 Overall Regression Model before Moderation .................................................... 137
4.9.7 Moderated Regression .......................................................................................... 139
4.10 Model Optimization ........................................................................................ 142
CHAPTER FIVE ....................................................................................................... 145

x
SUMMARY, CONCLUSION AND RECOMMENDATIONS ............................. 145
5.1 Introduction ..................................................................................................... 145
5.2 Summary of Findings ...................................................................................... 145
5.2.1 To establish the effect of transformational leadership on the change ................... 146
5.2.2 To Assess the Effect of Transactional Leadership on the Change ........................ 147
5.2.3 To determine the effect of laissez-faire leadership on the change management in
selected county governments in Kenya. ................................................................ 147
5.2.4 To Assess the Effect of Autocratic Leadership on the Change Management in
Selected County Governments in Kenya. ............................................................. 148
5.2.5 To Establish the Effect of Democratic Leadership on the Change ....................... 149
5.2.6 To examine the moderating effect of organization culture on the relationship
between leadership styles and change management in selected county
governments in Kenya. ......................................................................................... 150
5.2.7 Change Management ............................................................................................ 150
5.3 Conclusion of the Study .................................................................................... 151
5.4 Recommendation of the Study .......................................................................... 152
5.5 Areas of Further Research ............................................................................... 154
REFERENCES .......................................................................................................... 155
APPENDICES ........................................................................................................... 167

xi
LIST OF TABLES
Table 3.1: Target Population ..................................................................................... 50
Table 3.2: Target Sample Size ................................................................................. 52
Table 4.1: Cronbach‘s Alpha‘s Reliability Test for Study Variables ....................... 63
Table 4.2: Response Rate .......................................................................................... 64
Table 4.3: Codes to Themes ...................................................................................... 69
Table 4.4: Organizing to Global Themes .................................................................. 70
Table 4.5: Transformational Leadership ................................................................... 76
Table 4.6: Transactional Leadership ........................................................................ 81
Table 4.7: Laissez-Faire Leadership ......................................................................... 86
Table 4.8: Democratic (Participative) Leadership .................................................... 92
Table 4.9: Autocratic Leadership .............................................................................. 97
Table 4.10: Organizational Culture ......................................................................... 103
Table 4.11: Change Management ........................................................................... 108
Table 4.12: Kolmogorov-Smirnov and Shapiro-Wilk (K-S) statistics .................... 113
Table 4.13: Multicollinearity................................................................................... 117
Table 4.14: Test of Homogeneity of Variances (Levene‗s Test) ............................ 118
Table 4.15: Factor Matrix........................................................................................ 119
Table 4.16: KMO and Bartlett's Test ...................................................................... 120
Table 4.17: Communalities ..................................................................................... 120
Table 4.18: Total Variance Explained..................................................................... 121
Table 4.20: Model Summary for Transformation leadership .................................. 124
Table 4.21: ANOVA Results for Transformation leadership and Change ............. 125
Table 4.22: Coefficient Transformation leadership and Change ............................ 126
Table 4.23: Model Summary for Transactional Leadership and Change Management
.................................................................................................................................. 127
Table 4.24: ANOVA Results for Transactional leadership and Change Management
.................................................................................................................................. 128
Table 4.25: Coefficient Transactional leadership and Change Management.......... 129
Table 4.26: Model Summary for Laissez-Faire Leadership and Change Management
.................................................................................................................................. 130

xii
Table 4.27: ANOVA Results for Laissez-Faire Leadership and Change Management
.................................................................................................................................. 131
Table 4.28: Coefficient for Laissez-Faire Leadership and Change Management ... 131
Table 4.30: Model Summary for Democratic Leadership and Change Management
.................................................................................................................................. 132
Table 4.32: ANOVA Results for Democratic Leadership and Change Management
.................................................................................................................................. 133
Table 4.33: Coefficient for Democratic Leadership and Change Management ...... 134
Table 4.35: Model Summary for Autocratic Leadership and Change Management
.................................................................................................................................. 135
Table 4.36: ANOVA Results for Autocratic Leadership and Change Management
.................................................................................................................................. 135
Table 4.37: Coefficient for Autocratic Leadership and Change Management ....... 136
Table 4.38: Model Summary for Overall Regression Model before Moderation ... 137
Table 4.39: ANOVA Results for Overall Regression Model before Moderation ... 138
Table 4.40: Coefficient for Overall Regression Model before Moderation ............ 138
Table 4.41: Model Summary for Moderated Regression ........................................ 139
Table 4.42: ANOVA Results for Moderated Regression ........................................ 140
Table 4.43: Coefficient for Moderated Regression ................................................. 141
Table 4.44: Hypothesis Results ............................................................................... 144

xiii
LIST OF FIGURES
Figure 4.1: Age Distribution ............................................................................................ 65
Figure 4.2: Job Designation ............................................................................................. 66
Figure 4.3: Academic Qualifications ............................................................................... 67
Figure 4.4: Response rate across Counties....................................................................... 68
Figure 4.5: Motivations to Change Adoption................................................................... 77
Figure 4.6: Needs for Change .......................................................................................... 77
Figure 4.7: Extent Leaders Push Change for Organization .............................................. 78
Figure 4.8: Clarification of Responsibility ...................................................................... 82
Figure 4.9: Recognition and Rewards for Achieving Change ......................................... 83
Figure 4.10: Extent Do Leaders Guide the Employees into Achieving Change in the
Organization ................................................................................................... 84
Figure 4.11: Complete Freedoms to Solve Problems ...................................................... 87
Figure 4.12: Leadership Stays Out Of The Way Of Subordinates ................................... 88
Figure 4.13: Extent Leaders Let Subordinates Work out Problems ................................ 89
Figure 4.14: Leader Helps the Organizational Members See the Need for Change ........ 93
Figure 4.15: Involving Organizational Members in Decision Making ............................ 94
Figure 4.16: Extent Leaders are willing to listen to Organizational Members in the
Decision Making .......................................................................................... 95
Figure 4.17: Leaders Supervised Employees Closely In Change Situations ................... 98
Figure 4.18: Leader Gives out Rewards or Punishment to Motivate Members to
Accepting Change ........................................................................................ 99
Figure 4.19: Leaders Were Seen As the Leader the Chief Judge of the Achievements
of Change ................................................................................................... 100
Figure 4.20: Leadership Styles Are Supported By the County Culture ......................... 104
Figure 4.21: County Culture Contribute To Resistance to Change ............................... 104
Figure 4.22: Change Acceptances in Counties............................................................... 109
Figure 4.23: Leaders Good in Managing the Change Process ....................................... 109
Figure 4.25:Testing for Outliers..................................................................................... 111
Figure 4.26: Normal Q-Q Plot of transformational Leadership ..................................... 113
Figure 4.27: Normal Q-Q Plot of Transactional Leadership ......................................... 114
Figure 4.28: Normal Q-Q Plot of Laissez-Faire Leadership .......................................... 114

xiv
Figure 4.29: Normal Q-Q Plot of Transactional Leadership ......................................... 115
Figure 4.30: Normal Q-Q Plot of Democratic Leadership ............................................ 115
Figure 4.31: Normal Q-Q Plot of Standardized Leadership .......................................... 116

xv
LIST OF APPENDICES
Appendix I: JKUAT Letter……………………………………………………….167
Appendix II: Questionnaire for Research ............................................................... 168
Appendix III: Interview Guide ............................................................................... 181
Appendix IV: Operationalization of Study Variables............................................. 182
Appendix V: Hypothesis Results ............................................................................ 184

xvi
LIST OF ABBREVIATIONS AND ACRONYM
ANOVA: Analysis of Variance
CG: County Government
CL Change Leader
CM: Change Management
FEBM: Faculty of Economics and Business Management
IC: Individualized Consideration
II: Idealized Influence
IM: Inspirational Motivation
IS: Intellectual Stimulation
LG: Leadership Group
LMX: Leader-member exchange theory
LS: Leadership Styles
MAGL: Meta-Analyses of Gender and Leadership
SPSS: Statistical package for social sciences
PGM: Path-Goal Model
RoK: Republic of Kenya
US: United States

xvii
OPERATIONAL DEFINITION OF TERMS
Autocratic Leadership: The autocratic leadership process generally entails one
person making all strategic decisions for subordinates
(Gill, 2014). Refer to a situation where a leader Telling
followers what needs to be done and giving appropriate
guidance along the way. This includes giving them
schedules of specific work to be done at specific times.
Rewards may also be increased as needed and role
ambiguity decreased.
Change Management: It refers to the systematic approach to dealing with
Change both from the perspective of an organization and
on the individual level ((Smith, 2011).
Democratic Leadership: Refers to a leadership style whereby power and authority
are derived from his/her subordinates (Kirkbride, 2006).
Laissez-Faire Style Leadership: Refers to a hands-off approach, where a leader
abdicates his or her responsibilities in decision making,
giving feedback or helping followers to fulfill their needs
(Northouse, 2010).
Leadership: Leadership is a process whereby an individual influence
a group of individuals to achieve a common goal
(Northouse, 2010).
Leadership Style: Leadership style refers to the manner and approach in
which leaders providing direction, implementing plans
and motivation to the individuals or persons under their
authority. There are several types of styles that can be
employed such as transformational, transactional, laissez-
faire, autocratic and democratic (Lovvorn & Chen, 2011).

xviii
Organizational Culture: Organizational culture refers to a system of com
values, belief and assumptions that are used to govern
people‘s behaviors in organizations. The shared values
influence various aspects of organizational members
such as dress code, how they behave and how
they perform their duties in the organization (Yergler,
2012)
Transformational Leadership: Refers to a situation where a leader considers the
needs of the follower, showing concern for their
welfare and creating a friendly working
environment. His includes increasing the follower's
self-esteem and making the job more
interesting (Epitropaki & Martin, 2013).
Transactional Leadership: Setting challenging goals, both in work and in self-
improvement (and often together). High standards are
demonstrated and expected. The leader shows faith in
the capabilities of the follower to succeed. This
approach is best when the task is complex (Pihl-
Thingvad, 2014).

xix
ABSTRACT
The main aim of the study was to assess the leadership styles on change management
in county governments using organization culture as a moderating variable. The study
was guided by the following research variables; to establish the effect of
transformational leadership, transactional leadership, laissez faire leadership,
autocratic leadership, democratic leadership on change management in county
governments in Kenya. The study had a moderating variable which is organizational
culture. This study would be of benefit to civil society, managers in the county
government and future scholars. The study used descriptive study design. The study
used the following theories to explain the relationship between the independent
research variables and the dependent research variable: Fiedler‘s Contingency
Theory, Behavioral Theory, Great Man and Trait Theories, Leader-Member
Exchange (LMX) theory, The Vroom-Yetton-Jago Normative Contingency Model,
Hersey and Blanchard‘s Situational Leadership Model and The Path-Goal Leadership
theory. The target population for this study comprised of county chief officers,
county executives and county assembly members. The target population of the study
was 501 respondents. The sample size for this study was 218 respondents. The study
focused on the following counties: Machakos, Kiambu, Nairobi and Kajiado in
Kenya. These counties have had leadership issues and have been in the limelight due
to the leadership wrangles. These counties were chosen because they form the
Nairobi metropolitan which makes them homogenous. This study used simple
random and convenience sampling methods. Both questionnaires and, interviews
were used to obtain primary data while the review of the county reports provided
secondary data. The data obtained was analyzed using Statistical Package for Social
Sciences (SPSS) version 21. Regression Model was used as the overall model to
determine the relationship between the dependent and all the independent variables.
Autocorrelation of residuals in the dependent variable was tested using the Durbin
Watson test. The study also did other tests for inferential analysis like the correlation
analysis to establish the nature of relationship between each independent variable and
the dependent variable. Q-Q plot was used for checking for the normality of
dependent variable and the outliers. Heteroscedasticity and multicollinearity tests
were also done. The study used t-statistics to test whether the hypothesized model
was significant at 95% significance level. The findings were presented in the form of
frequencies, percentages, bar graphs, tables and pie charts. There was a significant
positive correlation between transformational leadership and Change management at
an r value of 0.581, there was also a positive correlation between transactional
leadership and change management at an r value of 0.463. There was a negative
correlation between laissez-Faire Leadership with change management at an r value
of -0.286. There existed a significant positive correlation between autocratic
leadership and change management at 0.699. Finally, the relationship between
democratic leadership and change management had a positive correlation at an r
value of 0.549. The result of the regression analysis showed that R=0.790 and
R^2=0.624. This result indicates that 62.4% of the changes in the dependent variable
(Change Management). The remainder 37.6% of the changes are explained by other
factors not captured in the study. The study concluded that transformational
leadership did have a significant influence on the change management in county
governments in Kenya. The study further concluded that transactional leadership did
influence the change management in Kenyan counties. The study concluded that

xx
laissez-faire leadership had an influence on the change management in counties in
Kenya. The study concluded that democratic leadership did have an influence on the
change management in county governments. The study concluded that autocratic
leadership had an influence on the change management of counties; this conclusion is
based on the findings of this study. The study concluded that organization culture had
a moderating effect on the relationship between leadership styles and change
management.

1
CHAPTER ONE
INTRODUCTION
This chapter presents the background of the study, statement of the problem, the research
objectives and questions of the study. It also gives the justification of the study together
with the scope of the study and limitations of the study.
1.1 Background of the Study
The world today is characterized by new technologies, unstable demographics,
fluctuating consumer tastes, transforming economies, remodeling governments, and
dynamic competition it is no longer a question of whether the organizations should
change but rather of when, how, where and in what way they need to change (Gupta,
Singh, Kumar, & Bhattachary,2012). Organizations need to regularly align themselves to
their environments by either reacting to an external event or by being proactive in
shaping the businesses environment in which they are operating in (De Wit & Meyer
2010).
Change in organization is inevitable (Peus, Wesche, Streicher, Braun, & Frey, 2012).
Businesses are faced by both unprecedented and planned changes in the environment in
which they operate (Huang, Iun, Liu, & Gong, 2010). Change forces individuals and
organizations out of their comfort zone and forces them to act. Change is inevitable in a
changing environment (Waldman, 2011). Therefore, in the end organizations will have to
change their structures in order to be better and also be able to meet their set goals and
growth.
Change is the result of organizations quest to achieve a strategic fit within an operating
environment (Čater, Lang, & Szabo, 2013). It is a response by the organization to the
opportunities and threats which manifest themselves in the external environment. Change
can also rise from internal challenges which are being encountered by the organization

2
(Caldwell, Hayes& Long, 2010). Organizations have to create better ways of ensuring
planning, forecasting and managing change in order to achieve the planned results of
change and reduce the negative effect on people (Phipps, 2012).
Wegge, Shemla, and Haslam (2014) assert that employee‘s resistance to change includes
behaviors such as disobedience, procrastination, indifference and resignation. Such
responses are as a result of the need for security and change threatens this security. He
noted that resistance is likely so the leader should ensure that he reduces this resistance
through: encouraging employees to express views, increasing supervisor-employee
communication, encouraging employees to support the organization goals, employee
education and training and offering various types of rewards to employees.
Ruiz, Ruiz and Martinez (2011) defined organizational change by identifying that an
organization is formed from open organism requiring transformation plus adjustment
according to both the internal and external environments. Internal adjustments are
intended to advance organizational member‘s behavior and attitudes whilst redefining
the organizational practices (Gans, 2011).
External adjustments determine the organization‘s competitiveness to achieve continuous
growth and increased performance. These strategies and adjustments are known as
organizational reforms. Hu (2010) then classified these changes into both proactive and
reactive ones, according to how proactively a firm initiated the changes. Hsu (2010)
identified that when an organization is in the process of change and innovation the
process encompasses strategies, managerial systems, structures, skills, production
methods, organizational culture, technical innovation, plus approaches for increasing
organizational performance.
This means that the use of development, innovation, turnarounds, transformation and
renewal are important for any organizational change. One of the most effective ways of
ensuring change sustainability is by getting the leaders and followers to participate in the
change procedure from the beginning and ensuring that each person‘s view is observed

3
(Fickenscher &Bakerman, 2011). Miller (2011) posits that leaders in the organization
require being skillful in the capability of integrating themselves into the modification
progressions so as to ensure that change initiated is sustainable. Leaders are also
expected to familiarize with the strengths, weaknesses and culture of various sectors and
have the capability to forge links with them (Miller, 2011).
Chocqueel-Mangan (2011) asserts that the influential leaders should generate a ―shared
purpose‖ between all parties involved in the change process. Leaders are expected to
efficiently change trade units, teams and infrastructures such as policies and systems in
ways that have a sustained and transforming effect on an organization.In combating
confrontation to adjust, the leader has to emphasis on how to contract with fear from
employees or subordinates (Benn, Todd, & Pendleton, 2010).
Edmonds (2011) corroborates that this is amongst the major reasons of resistance to
change. Employees and people affected by change will embrace the change only when
they feel empowered in the change process. This takes place through negotiations
between them and the leader. The leader needs to engage and communicate with the
skeptical groups of staff in a way that develops clarity by communicating the
organizations vision and need for the change being effected (Levine, Christian, & Lyons,
2013). Edmonds (2011) notes that these skills are required by all executive staff in the
public domain in order to encourage employees to retrieve from the comfort zone
moving to the direction of betterment.
To be able to build collaboration with employees and people affected by change the
public manager needs to familiarize with the employees‘ labor and their work style
(Shulman, 2010). Shulman (2010) then notes that unlike the private sector where the
change is effected from the top and the leaders demand and instigate change from the
topmost, the public sector is different since the workers in the public segment have
opinions, strong views, and commitment levels.

4
The leader has to take time to understand these opinions and views in order to effect the
change required (Mahajan, Bishop, & Scott, 2012). If the leader fails to respect these
views the change process can be sabotaged from within making change not possible. The
public managers are required to have strong skills in persuasion plus the ability to
present a compelling vision of the change and how it is necessary (Bhal & Dadhich,
2011). Public leaders need to gain the respect of the workers since this will help them
greatly in achieving the required change (Vijayalakshmi & Bhattacharyya, 2012).
1.1.1 Global Perspective of Leadership Style (LS) and Change Management (CM)
In a society culture highly influences the leadership style of a leader, culture influences
the way people treat others in various aspects such as ethics, their value system, and
perspective of the world. Effective leadership is a prerequisite for bringing effective
changes (Čater, Lang, & Szabo, 2013). Having unique cultural characteristics like
beliefs, values languages, religion, are considered important in the forming of a leader‘s
leadership style. There are clear differences among cultures, mainly considering their
values, attitudes and behavior of people and this deviation has insinuations for leadership
in organizations (Kezar, & Lester, 2010).
In countries like Japan which possess a unique culture which is characterized with higher
masculinity and paternalistic attitudes (Felfe & Heinitz, 2010). Leadership styles
includes transactional, transformational, and passive or avoidant styles which have
continued to be developed within the last more than twenty-five years and have been
broadly used in field research in the US as well as in Korea, Belgium, Singapore,
Canada, Malaysia, Germany, china, Switzerland, Venezuela, South Africa, Great Britain,
Mexico, India, Taiwan, Israel, Ireland, the Netherlands, New Zealand, Japan, Spain, and
Italy.

5
In Japan it is required that one respect and obey leaders and the Japanese mentor
relationship system which strengthens the individual bond amongst both supervisors and
subordinates (Felfe & Heinitz, 2010). The Japanese use both extensive consultation and
collective decision making before making decision. (Chen, 2010). This shows that this
highly democratic type of leadership. Yukl (2010) identifies that managers have a strong
focus on fairness of group participants and agreement which is considered more vital
than making money. In South Korea Leadership the social order stresses deep respect
and obedience to all leaders and the leaders assumes the responsibility for the well-being
of the subordinates or followers. This in turn creates agreement and smooth, conflict-free
relational relations ((Kim, 2010).
Moreover, Chinese organizations, leader behaviors are fairly distinct from
transformational leadership, identifying this leader style as paternalistic leadership (Lau,
2012). Paternalistic leadership is a form of managerial methodology which comprises
having a foremost authority figure that acts as a matriarch or patriarch the leader treats
workers and subordinates as if they are participants of a large, extended family (Rayner,
2011). The leader anticipates loyalty and trust from staffs, as well as obedience from the
employees in the organization (Caldwell, Hayes, & Long, 2010).
In Mexico the leadership style is highly characterized by high collectivism, paternalism,
power distance, and masculinity (Boatwright, Lopez, Sauer, VanderWege &Huber,
2010). This leadership style influences the followers to adopt change. Leaders in this
country are able to use the paternalistic leadership to make their employees follow a
course of action in which they have authority over subordinates. Supportive leadership
has displayed steadily stout positive relationships with follower‘s gratification and
organizational pledge as well as modest to strong relations with followers‘ role
ambiguity and recital in the United States (Kuppelwieser, 2011).

6
1.1.2 Regional Perspective of Leadership Styles and Change Management
In Africa the leadership styles are highly rich in African heritage and have a lot of
leadership aspect, which is not uniform but is similar (Harold, 2011). There are also
alterations from time to time, from place to place and from persons to persons in Africa.
The dissimilarities of leadership in Africa were affected by the both Christian and
Muslim faiths, as they were familiarized in Africa (Nkomo & Cook, 2006). As a result of
the above, three kinds of leadership arose and molded African leaders in several styles.
Jackson (2010) who, via cooperative investigation in several African nations, has
verified that African supervisors have a habit of being extremely skillful in several facets
of management and leadership, in precise working with cultural dive. Jackson (2008)
significant morals that nature leadership and management in sub-Saharan Africa include
sharing, consensus, regard for compromise, deference to rank, sanctity of commitment,
and good social and personal relations. It shows that the ‗hybrid‘ nature of leadership and
management exercise in Africa which is molded by a multifaceted and multi-layered
cultural, social and historical context (Javidan, House, Dorfman, Hanges& de Luque,
2006).
Africa has been a cross-cultural continent since time immemorial and involves a lot of
dynamism. Leadership in modern day Africa still contains such aspects of diverse
cultural ideas and practices (Waldman, 2011). Therefore, it is important to understand
some of these aspects which are essential in order to reconcile, integrate and synergizes
the disparities which are contained within the aspects which are important to
organization development and management activities in Africa (Jackson, 2010).
1.1.3 Local Perspective Leadership Styles and Change Management
The Kenyan devolved governance is based on Article 6(2) laws of Kenyan constitution
2010, which conditions that the governments has two levels of governments which are
separate and inter-dependent of each other (Kenya constitution 2010). The adopting of

7
the present constitution in 2010 marshaled the country to a new system of domination
which replaced the former centralized structure of government to a new decentralized
system of governance. The two governments are expected to conduct their work through
consultation and cooperation.
The counties are tasked in overseeing functions such as health care provision,
maintenance of local roads and pre-primary education which has been devolved from
national government. They are expected to mobilize revenue from source at the county
level and are supposed to collect taxes on property (Kimenyi, 2013). It was established
that 84.5% of the revenues was to be allocated to the national government and the 15 %
to the county government the remaining 0.5% was designated to be an equalization fund.
Kenya county guide (2016) shows that the new structure contains the national
government and 47 county governments. Formation of decentralized components of
government ensures that amenities and self- governance have been conveyed nearer to
the people. The national government has the order to do its purposes and workout its
powers in a way that compliments the useful and organizational honesty of government
at the next level, and compliments the legitimate status and institutions of government.
For county government to perform as anticipated, there are some arrangements that have
been set up which include the office of the Governor, Women Representatives, the
County Executive Committee, the Senate, County Assembly, and County Public Service
Board. With the creation of this level of government the leader who is the governor has
to have the required leadership skill to manage the duties that are bestowed upon him/
her by the constitution. Other countries that have had devolution include Rwanda and
South Africa (Thomas, 2011).
More countries may want the more decentralized government but due to challenges in
creating such structure they have opted to continue with old systems since changing is
difficult (Michalak, 2010). There are various advantages of having county government

8
such countries as Rwanda have been able to use it as a way fight poverty and a way to
enhance reconciliation via the empowerment of local populations (Erkama, 2010).
The Kenyan constitution (2010) entails the intents of decentralized government is to
endorse democratic and answerable implementation of authority, nurturing national unity
by recognizing uniformity, giving supremacies of self-governance to the public and
improve contribution of the public in implementation of the supremacies of the State and
creating verdicts disturbing them, to identify rights of the society to accomplish personal
undertakings and promoting their expansion, to safeguard and endorse the welfares and
rights of interest group and sidelined societies, upholding social and economic expansion
and the endowment of proper, effortlessly reachable facilities all through the country, to
guarantee justifiable distribution of national and local resources all through Kenya, to
ease the devolution of State structures, their purposes and amenities, from the capital city
of Kenya and to improve checks and balances and the splitting of powers.
The county governments have a lot of structures such as the central government thus the
counties leaders have to implement a lot of changes in various areas in their jurisdiction,
thus the leadership must develop ways to manage change in this level of government
(Pasche& Santos, 2010).
1.1.4 Leadership and Leadership Styles
Organizational theorists concur that the existence of operative leadership is one of the
significant contributors to the general organizational achievement (Kraemer, 2011).
Leadership is demarcated as a practice whereby people influence a group of people to
achieve a mutual goal (Northouse, 2010).
Leadership, as defined in Yukl (2010), is the procedure of persuading others to
comprehend and decide around what wants to be done and how to do it, and the
procedure of enabling individual and mutual determinations to achieve shared intentions.
Dixon and Hart (2010) explained an excellent leader does not only inspire subordinates‘

9
potential but enhances efficiency to meet their objective in the achievement of
organizational goals. Waldman (2011) corroborates with these statements by considering
that leadership is a process in which various behavioral approaches are used to guide
employees to a shared goal.
In the process the leader influences the organization members through a series of
interpersonal interactions in which they seek to inspire the organizational members
towards attaining organizational goals. Regardless of the definitions of various scholars
on leadership the key arguments that are similar in all these definitions are that: The task
cannot be achieved or accomplished by one person and so the need to organize the
organizational members to assist in the attainment of the organizational objectives.
Secondly, leadership is a social process with interpersonal relationships between
organizational members and the leader. Finally, the leader acts on behalf of an
assignment that is external to a group.
The above definitions tell us that leadership is round leading individuals and this is
dominant as seen in the above definitions. Cheng (2011) points out that leadership is a
procedure which exists in organizations and that varies in nature and forms used for
accomplishing the organizational objectives. In the leadership procedure a leader
practices his/her power to craft a team spirit and motivation which helps the organization
members to work towards the organizational goals.
Leadership Style according to Strand (2011) describes the style employed by leader to
develop capability and it is aimed at achieving organizational objectives. He continues to
explain that it is a benevolent of technique and competence which aims at the realization
of organizational targets and which affects all organizational activities. Chipunza,
Samuel and Mariri (2011) also shares this view point and refers to leadership style as a
kind of bond that a person uses his privileges and approaches to influence lots of people
to work together on a mutual task. Leadership style is an important factor that play
significant role in an organization in increasing or derailing the interest and commitment
of the organizational members (Obiwuru, Okwu, & Akpa, 2011). Sharifah, Malcolm and

10
Zubaidah (2012) cited several leadership styles which are common in organizations
today which are autocratic, transformative, transactional, bureaucratic, democratic,
charismatic, servant, task oriented, relationship, and laissez-faire leadership.
Yukl (2010) assert that to be quite comprehensive approved a full- range of leadership
styles which consisted of transactional, transformational and passive/avoidant/ Laissez-
faire Style of leadership. They further stated that most leadership forms a new pattern for
accepting the lower and higher command properties of leadership style. The style of
leadership which is approved by a leader is influenced by the leader‘s background,
personal experience, religion, political affiliation, ideology, inclination, culture and also
coordination deprived of essentially being founded on the crescendos of the
circumstances.
The major leadership styles consist of transformational, transactional, and laissez- faire
leadership others that are common are democratic and autocratic types of leaderships.
Transformational Style is the type of leadership style where the leader encourages the
subordinates to go the extra mile to achieve the goals of the organization. The leader
emphasizes on going beyond previous limits through the use of inspiration. The
transformational leader uses the following values to influence the employees such as
creating trust, loyalty, admiration, and respect to motivate the employee to work harder.
This results in higher performance and commitment from the employee. Laissez-faire
Style is the type of leadership where the leader avoids all type of intervention with the
employees and lets them do what they want. This type of leadership is associated with
unproductiveness, dissatisfaction and ineffectiveness in the organization.
Transactional leadership Style is where the leader uses the carrot and stick method to
ensure that the employees do what is required. The relationship between leader and
follower is based on the exchange or reward systems (Kaplan, Brady, Dritz, Hooper,
Linam, Froehle, & Margolis, 2010). The employees behave so that they can get a reward
and so they perform when they don‘t they are punished. The relationship is based on the
contingent rewards or exchange relationship. Autocratic leadership also known as

11
dictatorship is one of the most common form of leadership despite it being the least
popular leadership styles. The leader dictates what should be done and the employees
have to follow his commands. Democratic/participative leadership style is a common
type of leadership where the leader gives everyone a chance to contribute their opinion in
decision making. The employee is allowed to discuss organizational matters with the
leader and give their views.
1.1.5 County Culture and Relationship between Leadership Style and Change
Management
Organizational culture, via its norms, values, assumptions, and symbols, regulates the
manner in which the participants of an organization observe and understand the realism
inside and round their organization, as well as the way they act in that reality (Nebojša,
2012). Organizational culture influences an industry‘s success (Khana & Afzalb, 2011).
Global leaders need to upsurge their abilities to accomplish the intricacy of varied
individuals, comprehend and respect changes, create essential modification in the
leadership, and be prepared for prospects and contests that derive alone (Wang, 2011).
Group dynamic dramas a significant role in global leadership exercise (Takahashi,
Ishikawa & Kanai, 2012). Diverse leadership styles and executive methodologies should
be functional dependent upon group dynamics and situations (Strand, 2011).
Group dynamics play a significant purpose in determining the leadership. One major
variable that ought to be reflected in leadership is cultural setting (Gutierrez, Spencer &
Zhu, 2012). Work ethics, management-labor, communication styles, and behaviors
relationships are diverse from state to state. Leadership capability is intellectualized
inversely in various states (Story & Barbuto, 2011). High setting countries (for instance,
Japan, South Korea, and China), staffs tend to desire indirect communications and
depend profoundly on nonverbal codes; workers from low setting countries (Germany
and Great Britain) have a habit of communicating openly and concept more info in
communications (Smith, 2011).

12
Nevertheless, cooperative relationships are frequently experiential in Asian states, since
Asians have a tendency to feel personal flattering will impact individual coordination,
and the supervisor ought to tribute the whole group rather than a specific group
participant (Roy, 2012).In accord with diverse cultural prospects, various cultural
individuals have distinct prospects of leadership, and this may disturb the performances
of workers and supervisors. It is precarious when workers are conscious of their leaders‘
gratitude for personal cultural modifications without individual prejudice (Ragir &
Brook, 2012). A better manager-employee correlation can considerably impact members‘
performances and upsurge the gradation of their obligation to the leaders of the
organization (Okoro, 2012).
There is a robust agreement that attainment of efficient leadership skills drive bringing
the organization through revolution chaos and subsidize to a justifiable benefit
(Caligiuri& Tarique, 2012; Ulrich &Smallwood, 2012). Leaders are obligatory to
recognize the cultural, strengths, and weaknesses of various sectors thus enabling furnace
links within and amongst them (Miller, 2011). Chocqueel-Mangan (2011) upholds that
leaders require creating a "shared purpose" midst executive‘s unit heads and the rank and
file. For the alteration to uphold, it requires the organizational DNA (Chocqueel-
Mangan, 2011).
Leaders should also be capable of efficiently transforming organizational teams and
organization (systems, policies) in a technique that will withstand modification in an
organization (Lovvorn & Chen, 2011).
1.1.6 County Governments in Kenya
The counties are geographical units envisioned by the 2010 Constitution of Kenya as the
units of government. The county government powers are provided in Articles 191 and
192, and in the fourth schedule of the Constitution of Kenya and the County
Governments Act of 2012. There are 47 counties in Kenya. Following the re-
organization of Kenya's national administration, counties were integrated into a new

13
national administration with the national government posting county commissioners to
represent it at the counties.
The county governments have executive and legislative authority, including the
accompanying mandates and powers, to raise limited revenue, establish policies, plans,
budget and governance. Under the County Governments, the national government is
obliged to support the county governments.
1.2 Statement of the Problem
Several studies have been able to show that a lot of organizations have found change to
be quite challenging (Shiva & Suar, 2012). The change process in different organizations
has been seen as unique in every way, because organizations have different natures, they
engage in different businesses, cultures, values, behavior, management and attitudes of
the employees (Karakas & Sarigollu, 2012). Change happens on a daily basis in county
governments due to the requirements of effectiveness and efficiency in running the
counties and the need to achieve the objectives of devolution. Managing change has thus
become one of the major challenges confronting the county government leaders who are
in charge of enabling change by implementing and coordinating processes of change and
innovation within the county structures.
Change in county governments has been challenging with various counties having
difficulties in effecting the day to day operations, this has manifested itself in various
ways such as strikes and dissatisfaction (Thomas, 2011). Various studies have been done
to explain this challenge in county government such as Kakucha (2014) study sought to
discover out whether the designated County Government is going through any
difficulties as a result, of this modification conveyed by the new Constitution. The study
established that certainly the designated County was struggling with the problem of
change.

14
Leading is one of the several functional areas of management but it is the center to the
success of the county governments. Inefficient leadership style combined with the
uncertainty of the political environment often led county governments to serious
problems. Poor leadership is the main cause of failure for set plans and goals in county
governments in Kenya. Counties such as Machakos, Nairobi, Kiambu and Kajiado have
been in the limelight of change management challenges. They have been seen to be
suffering from various conflicts between the leaders (Chepkemoi, 2015).
Therefore, this study chose these counties to study how county culture affects the
association between leadership style and change management. Empirical studies into the
direct links between leadership style and change management are scarce although a
number of researches have been done on the effect of performance and organizational
commitment, no detailed study on how leadership styles affect change management in
the county governments has been encountered so far.
Thus this study sought to fill the existing research gap by studying the effect of
leadership styles and change management moderated by county culture in county
governments in Kenya. The findings from this study will contribute to greater
productivity and efficiency in running the county governments in Kenya.
1.3 Study Objective
The study was guided by the following general objective and specific objectives.
1.3.1 General Objectives
The main objective of the study was to assess the effect of leadership styles on change
management in selected county governments in Kenya.
15
1.3.2 Specific Objectives
The study was guided by the following research objectives;
i) To establish the effect of transformational leadership on the change management in
selected county governments in Kenya.
ii) To assess the effect of transactional leadership on the change management in
selected county governments in Kenya.
iii) To determine the effect of laissez-faire leadership on the change management
in selected county governments in Kenya.
iv) To assess the effect of autocratic leadership on the change management in selected
county governments in Kenya.
v) To establish the effect of democratic leadership on the change management in
selected county governments in Kenya.
vi) To examine the moderating effect of organization culture on the relationship
between leadership styles and change management in selected county governments
in Kenya.
1.4. Research Hypotheses
The study was guided by the following research hypotheses:
: Transformational leadership has no positive significant influence on the change
management in selected county governments in Kenya.
Transactional leadership has no positive significant influence on the change
management in selected county governments in Kenya.
Laissez-faire leadership has no positive significant influence on the change
management in selected county governments in Kenya.

16
: Autocratic leadership has no positive significant influence on the change
management in selected county governments in Kenya.
Democratic leadership has no positive significant influence on the change
management in selected county governments in Kenya.
Organizational culture does not moderate the relationship between leadership styles
and change management in selected county governments in Kenya.
1.5 Justification of the Study
This was a timely research that would help in the understanding of how leadership styles
affect the management of counties after the new constitutional dispensation in Kenya.
The constitution allows for the existence of county governments in order to improve the
better governance of the country. The findings from this study would have a positive
contribution in understanding matters of leadership and how this can impact the counties
management. This study would benefit the county governments‘ leaders, policy makers,
civil society, development partners who aid in the devolution process and the staff of the
county governments.
1.5.1 The Civil Society
This study would be of importance to the civil society who have been assisting in the
devolution process in Kenya as they would be able to know how leadership styles affect
change management in counties for example. UNDP, Transparency International. They
would be able to help in development of policies and training materials that would
enhance change in the various counties thus minimizing the ongoing wrangles.
1.5.2 Managers in the County Government
The study was seen to be important to the managers of County Governments as it would
help them understand how leadership styles affect the management of change in different

17
levels of decision making. The managers would also be able to understand on when to
apply each style of leadership in different scenarios. This would then contribute to
effective management of the counties thus resulting to effective running of the counties
and thus minimizing wastage of public resources and the leadership wrangles.
1.5.3 Academicians, Researchers and Scholars
The study was also seen to be important to academicians, researchers and scholars for
use in further research and would serve as references on matters on the effect of
leadership styles on the change management in county government. The study is also
expected to add to the existing knowledge and fill gaps on areas that have not been
reviewed by past researchers.
1.6 Scope of the Study
The study confined itself to investigating the effect of leadership styles on managing
change in county governments and did not go beyond the county government level. The
study focused on 4 counties because of the similarity in them being in the Nairobi
metropolis. These counties were Machakos Kiambu, Nairobi, and Kajiado in Kenya.
These 4 counties have been in the lime light due to various leadership challenges. These
counties were also chosen due to the conflicts which have been reported in national
media, which shows that there was need to investigate the leadership styles in these
counties.
The study sought responses from the county executive, county chief officers and the
county assembly members. The study used a descriptive research design. The study
targeted a population of 501.The sample size chosen for this study was 218 respondents.
The study included the following five independent variables Transformational Style,
Laissez-faire leadership Style, Transactional Style, Autocratic leadership style,
Democratic leadership style. The study had the moderating variable organizational
culture and the dependent variable change management.

18
1.7 Limitations of the Study
The researcher encountered a number of challenges when undertaking the study.
However, the limitations did not have a significant interference with the outcome of the
study. The use of self-administered questionnaire was a limiting factor in terms of
respondents getting the time and understanding the questions for which answers were
being sought. The challenge was however reduced as the research assistants were able to
make follow-ups and clarify the questions that respondents were not able to comprehend
or answer. This greatly reduced the number of unfilled sections in the questionnaires and
increased the response rate.
Since the information required was confidential, the respondents were not willing to
participate in the study. This limitation was overcome by assuring the respondents that
the research project was solely for academic purposes and that data confidentiality would
be upheld. Since there were respondents who would not give objective opinions about
leadership styles used in the counties and how they influence the change management the
researcher encouraged the respondent to be more objective as possible.
Some of the respondent had concerns of being victimized for taking part in the study and
hence were not willing to give the required information for the study. However, the
researcher sought to create good rapport with the respondents and encouraged them to
take part in the study since it could help solve the leadership problems in the counties.

19
CHAPTER TWO
LITERATURE REVIEW
2.1 Introduction
This chapter looked into literature that has been reviewed by various scholars and
researchers in various studies that assisted in the explaining of the dependent variable
change management and the independent variables transformational leadership style,
autocratic leadership, transactional leadership style, demographic leadership, and laissez-
faire leadership style. This chapter also looked at the theoretical and conceptual
frameworks which guided the study. The chapter looked at further the critiques, the
research gaps and the summary.
2.2 Theoretical Review
According to Njue (2011) theoretical framework refers to a set of assumptions about the
nature of a certain phenomenon. Mathooko (2007) advances that a theoretical framework
is the basis and foundation in which the whole research project is based on and here the
major concepts and theories are discussed tackling the problems. Therefore, a theoretical
framework refers to a group of interrelated ideas which are based on theories. It is an
attempt for clarifying why phenomena appear the way they are using theories to explain
them.
2.2.1 Fiedler’s Contingency Theory
Fiedler Contingency Model was created by Fred Fiedler in the mid-1960s, who was a
scientist that premeditated leader‘s personality and physiognomies. The model describes
leadership to have no best style. The model explains that leader's effectiveness is
determined by the situation. According to Rowold & Heinitz (2007) assert that Fiedler is
the first person to come up with this theory that shows that the situation is a variable
which influences a leader‘s style of leadership.

20
Fiedler (1967) asserts that leadership style is the replication of some stressing need
which stimulates behavior in different situations. He continues to assert that leadership
styles are continuous and leaders should alter the situation. This means that leadership
styles do not change and the leader‘s effectiveness is highly dependent on the situation at
hand (Fiedler, 1967). There are several situations that a leader may find in the work place
and the leader needs to adapt to each situation to be effective if he or she is unable he
will fail in that situation.
A leader‘s style is seen as duty which is relationship oriented and the leader needs to
apply the right style to maximize performance. Fiedler (1967) explains that situations are
seen in terms of favorableness and they range from extremely favorable to highly
unfavorable. He stresses that the more regulation exercised by the leader in a situation
the more promising the situation was for him or her. Favorableness is strong-minded by
three issues the first being the relationship amongst the leader and the supporters and if a
leader has a good relationship with his follower he has a high chance of success as
opposed to a leader who has a poor relationship. The second factor is the task structure
and the more a task is complicated the likely the situation was unfavorable.
The favorableness is high in simple tasks. The third is the level of formal authority which
means the ability to punish, discipline, assign work, recommend for promotion and
sacking. A high level of formal authority means the situation is favorable than situations
where the leader has a low level of authority. For leaders who are tasked to carry out
duties in which change is likely this theory helps explain how a leader can use different
situations to ensure that he/ she is successful in ensuring change takes place. The leader‘s
relationship with the followers is important in ensuring success of change within
organization since the favorableness is high in situations where the leader are in good
relations with the followers. Managers should ensure that they have health relationships
with employees/ subordinates to ensure change is effective in the organizations.

21
This theory helps us understand that for effective change to happen the leader has to
ensure that the situation in which he/she is implementing the change is highly favorable.
This theory helps explain the leader‘s responsibility in creating the right environment in
which to effect change successfully. Failure to have the right situation leads to failure of
achieving the change. In this study this theory explains how a leader may use a diversity
of leadership styles in situation to effect change in the county. The leader can use any of
the five leadership styles transformational leadership style, demographic leadership style,
transactional leadership style, and the autocratic to bring about the desired change
depending on how favorable a specific leadership style is able to bring the desired
change. This theory supports four independent variables which include: the
transformational leadership style, transactional leadership style, autocratic and the
democratic leadership styles.
2.2.2 Behavioral Theory
The behavioral leadership perspective assumes that leadership is dominant to achieving
organizational goals and objective. The theory focuses on the leader‘s conduct and not
on leader‘s individual traits/characteristics. This style was first started by both the
University of Michigan and Ohio State University (Kirkbride, 2006). They conducted
various studies to identify the leadership behaviors that are important in the effectiveness
of an organization. From their findings it was discovered that there are two main
procedures of leader behavior‘s which are employee-centered and production- centered
(Yukl, 2012).
In the employee-centered behavior the leader is very concerned and is sensitive to
employee‘s feelings. The leader therefore tries to make things pleasant for them to
ensure that they are happy. The second behavior of the production centered leader
emphasis is on the completion of the organization task (Avolio, 2007). The results from
the study showed that leaders need to be high in both behaviors. The behavioral theories
help explain the leader‘s behaviors in which they need to facilitate change within the
organization effectively. The leader needs to have the behavior of being concerned with

22
employees so as to ensure the employees do not reject the change implemented since the
leader consulted them. This study relates to the study since the leader understands the
need to be both people centered and also production centered. The county leader needs to
have both characteristics to ensure change to take place.
Through being people centered the county leader is able to appeal to the followers
through encourage and support their followers to engage in the decision-making process
and coming up with solution together as opposed to the production centered where the
leader is autocratic and sees as achieving set objectives as more important than appealing
to followers. This theory supports both the democratic leadership style and autocratic
leadership styles variables. By being people centered a leader is being democratic and by
being production centered leaders are autocratic.
2.2.3 Great Man and Trait Theories
The Great Man theory advanced around the 19th century the theory was commercialized
in the 1840s by Scottish writer Thomas Carlyle. Nevertheless, in 1860 Herbert Spencer
expressed a counter-argument that has endured persuasive through the 20th century to
the present. Great man theory is rooted on the assertion that leaders are instinctive with
innate, leadership abilities which makes individuals accept them as leaders. The theory is
grounded on the argument that the leaders are always correct and their leadership is
entrenched in their own virtue. Followers elevate the leaders based on their unique
qualities making them powerful and influential.
This results in followers following the leaders without doubting their judgment in
different situations. The trait theories are grounded on the great man theories. Similar to
the great man theories, the trait theories assume that leaders are born with unique
physiognomies which style them diverse from other individuals. Trait perspective to
understanding leadership perceives leadership as the essential of organization efficiency
and goal achievement. Sashkin and Sashkin (2003) argue that scholars such as Stogdill,
in his mission for determining the secret of great leaders by reviewing research reports

23
on leadership were founded on the assertion of great leaders being born. Stogdill was
able to determine that leaders were more intelligent, creative, outgoing, responsible, self-
confident, taller and heavier than the average persons. As Oke, Munshi, & Walumbwa
(2009) did report on leader‘s trait research that it was later more dedicated on the
contrast amongst the leader traits and his ability to be effective rather than the contrast
between leaders and non-leaders. They identified that the possession of some trait may
contribute to leadership effectiveness they emphasized that no set of traits guarantees
leadership effectiveness.
Blanchard (2008) identifies traits such as self-confidence, integrity, emotional maturity,
and stress tolerance as traits that make a leader effective. This theory helps explain traits
that are present in transformational leaders who need certain traits for them to be able to
influence, motivate and stimulate the follower in situations of change management. The
transformational leader with this characteristics and qualities is able to affect change
within the organization though his abilities as a leader and hence reducing the resistance
to change since he has well expressed his vision to his followers.
This theory relates to the study in observing the leaders in the counties on whether they
possess the traits that helped them influence the followers to follow their course of action
over another through the use of charm, creative, outgoing, responsible and assertive
behavior which help the leader to be able to inspire staffs to give up their own personal
ambitions towards the better good of the organization. This theory supports the
transformational leadership style variable.
2.2.3 Leader-Member Exchange (LMX) theory
LMX theory emphases on the relations amid the leader and the employees i.e. the impact
of the leader in the setting of dyadic relationships. The theory was industrialized by Fred
Dansereau, George Graen and William J. Haga, in 1975. Dyadic discusses the correlation
amid two characters i.e., amongst a leader and an employee. The key principle of LMX
model is that supervisors advance on diverse relations with employees and that the

24
excellence of this association impacts several of emotional and behavioral employee
results. As a result, the theory recognizes that supervisors do not treat all employees in
similar manner (Glendon, Clarke, & McKenna, 2006).
Previous researches on the theory exhibited the correlation amongst supervisors and
employees impacting the degree to which the staff was deliberated as part of an ‗in
group‘ or ‗out group‘. Involvement in an ‗in group‘ or ‗out group‘ is dogged by the
degree to which the supervisor is capable of working well with the employees and the
magnitude to which they are prepared to carry out accomplishments that go past his
official job depiction (Bass & Bass, 2008).
Later research enthused from learning the dissimilarities amongst supervisors and ‗out
group‘ and ‗in group‘ employees to scrutinizing how the feature of the theory correlation
influences both persons and organizations (Northouse, 2010). LMX is characterized by
trust, support, and mutual respect, is associated to several positive personal and
organizational effects, comprising more optimistic employee approaches toward the
organization. This result to advanced levels of obligation and general satisfaction and
less intent to abandon improved job presentation and better job promotion chances
(Northouse, 2010; Gerstner & Day, 1997; Bass & Bass, 2008).
The leader-member exchanges develop over time as shown in Northouse (2010) who
suggests that leader-member exchanges go via three phases: the stranger phase, whereby
leaders and staffs relay individually other in an official style and acquiescence with the
supervisor is inspired by personal-benefits. Secondly, acquaintance phase, and forms a
testing period for the supervisors and employees‘ correlation throughout which the leader
attempts to determine if the employees are capable of taking on more roles and
responsibilities. The employees, furthermore, scrutinizes whether the leader is eager to
deliver more tasks and chances. Effective interactions throughout this phase aid advance
faith and respect amongst leaders and employees. Lastly, throughout the final phase,
leader-member contacts advance into developed organizations characterized by trust,
respect and duty. This segment is characterized by quality relations as employees rely on

25
supervisors for provision and reassurance and supervisors rely on workers for extra
projects and help.
High quality LMXs, supervisors and staffs work beyond their personal interests to the
mutual good of the team and the organization (Northouse, 2010). This theory helps
explain the relationship between the leaders and subordinates and how they relate into
when working together. For change to take place without challenges in the organization
there is need for the leader and subordinates to have trust and work together
harmoniously. This theory explains the transactional leadership style where a leader
there is an exchange of rewards and promises between the leader and follower. This
theory helps explain the correlation amongst the leader and the follower and how the
leader can use this relationship to get the follower to do what they want. The leader can
be able to influence change through this relationship with the subordinates in the
organization. This theory is important to the study in looking at how the leader at the
county uses both inspiration and threats to motivate their followers into following a
certain course of action in the county. County leaders resulted to threats if inspiration
fails to motivate the followers to a course of action. Thus this theory helps explain how
leaders would use any method in their power to get the followers to do what they want.
This theory supports the transformational leadership style and the transactional style
variables.
2.2.4 Hersey and Blanchard’s Situational Leadership Theory
This model on situational leadership model by Hersey and Blanchard‘s was established
in 1977 and is founded on the leadership studies done in Ohio. The model comprises of
a two-dimensional model that constitutes four leadership styles (Grint, 2011). The
leadership model emphasizes that there is no one effective leadership style in different
circumstances (Conger, 2010). Leadership to be effective the leader must first determine
the maturity level of the followers before picking a leadership style (Bass, 2008).

26
The model suggests that the leader has to select amongst four leadership styles which
fitted the situation. The leader chooses the situation depending on the maturity readiness
of the subordinates. The model aims at creating a match between the situation and the
leadership style employed. According to Bass & Bass, (2008) they describe maturity or
enthusiasm as being the degree to which subordinates are willingness to accomplish a
task. In change management the leader needs to match the maturity of the subordinates
so as to ensure that change takes place effectively.
The level of maturity of followers helps determines the right leadership style and this
relates to previous training and educational interventions (Bass, 2008). This theory helps
explain the use of one or more leadership styles by a leader to effect change in the
organization. The leader looks at the maturity and readiness of the subordinates to select
the leadership style to practice in that situation. This means the leader used the leadership
style which got the best result and so he/she has no definite leadership style preference.
This theory supports the transformational leadership style, laissez –faire leadership style,
democratic leadership style and autocratic leadership styles variables. This theory applies
to the study since it explains how the county leader will choose a specific leadership
style in a certain situation according to the maturity and readiness of the subordinates.
Therefore, the leader seeks to determine situation in order to come up with a specific
leadership style that helped in the effecting of change in the county government.
2.2.5 The Vroom-Yetton-Jago Normative Contingency Theory
This Vroom-Yetton-Jago model was made originally by Victor Vroom and Philip Yetton
model and was further improved by Vroom and Arthur Jago. Vroom and Jago (1988)
state that this model is related to the path-goal theory which pronounces the way a leader
is supposed to act in different circumstances so as to enhance efficiency. This model
focuses on a major aspect which is the leader`s behavior, when it comes to allowing
subordinate choice making. The leader ought to know which decisions can be made by
the subordinate and which the leader has to make. It is founded on one phase of leader
behavior and that is subordinates‘ participation in decision-making.

27
Vroom and Jago (1988) assert that there exists no leadership style which can be found
appropriate to use for all situations and therefore leaders need to follow or develop
several of responses which may range from autocratic to consultative. The leader has to
apply a leadership style that ought to be appropriate for a certain circumstance. They
advise five decision-making styles of which each requires diverse degree in contribution
by the staffs. These styles are founded on two factors which are individual decisions and
time driven decisions. The time driven influences demand a leader to make verdicts as
fast as conceivable and progress determined issues are employed by the leader when he
wants to develop the subordinates‘ capabilities in decision-making (Barling and Hoption,
2011).
The leader identifies that there are some decisions that can only be made by the leader
and some which he can involve the employees. Therefore, this method asserts that the
leader can use both methods depending on the leader‘s discretion.
This theory applies to the study by helping explain situations in which the county leader
can use his discretion to make some decisions can only be made by the leader and at
other times involve followers for the decisions which the leader feels he need to consult.
This theory supports the autocratic and democratic leadership styles variables depending
on the situation.
2.2.6 The Path-Goal Leadership Theory
Path-goal model (PGM) is based on goal setting and expectancy theories of motivation.
The writers of this model are House and Mitchell who use the model to clarify how
leadership behavior has an influence on performance and the satisfaction of employees.
Motivation helps people to be able to tackle challenges and stay focused on a set goal,
irrespective of professional or personal goals and targets (Chipunza, Samueel & Mariri,
2011). Leadership is the most important factor in motivating employees and improving
productivity. The most essential principle of this leadership model is that behavior by

28
leaders should motivate and satisfy the employee to the extent in which it increases goal
attainment.
The difference between this leadership theory and other models is that this model doesn‘t
have a leader trait and behavior variable. The leader`s responsibility is to increase the
subordinate‘s motivation to achieve organizational goals thus leading to organizational
effectiveness. Motivation refers to the act of clarifying the subordinate`s path towards the
achievement of rewards it is done by identifying and learning behavior that lead towards
the successful accomplishment of task and organizational rewards (King, Lunn &
Michaelis, 2010).
There is an exchange of rewards and promises of reward for taking certain course of
action. The theory is relevant to the study since the county leader used rewards to
motivate the employees to act in a certain way. This theory supports the transactional
leadership style variable were the leaders used both punishment and rewards to motivate
certain courses of action in the county so as to achieve certain changes that the leader
wants to have. By motivating the employees towards a course of action now change
takes place. This model explains the transactional leadership style which followers are
given some type of reward to motivate them to work.
2.3 Conceptual Frame Work
A conceptual framework helps explains the relationship between the independent,
moderating and dependent variables. The conceptual framework of this study looks at
effect of leadership styles on change management in selected county governments in
Kenya. The moderation effect of family characteristics as moderating variable, on
financial management practices as independent variables and growth of family
businesses as the dependent variable. For this study the independent variables were
transformational leadership, autocratic leadership, democratic leadership, laissez faire
leadership, and transactional leadership.

29
The dependent variable was change management. A conceptualization of the connection
of the independent variables, and the dependent variable is illustrated in Figure 2.1.

30
Independent variables Moderating Variable Dependent variable
Figure 2.1: Conceptual framework
Transactional Leadership
Rewards
Punishments
Goal setting
Goal achievement
Laissez Fair Leadership
Passive Management
Employee Decision
Making
Avoidant Leadership
Change
Management
County
Improvement
County
Sustainability
Change
Ownership
Change
Achievement Autocratic Leadership
Controlling
Ordering Of The
Employees
Quick Decision Making
Hands On In
Implementation
Democratic Leadership
Engaging In The
Decision-Making
Process
Participation By
Organizational Players
Positive Evaluation
Increased Morale
Transformational Leadership
Idealized Influence Inspiration motivation Idealized consideration
Intellectual Stimulation
County Culture
Norms
Beliefs
Values

31
2.3.1 Transformational Leadership
According to Peter & James (2013) the transformational leader is apprehensive in
―realizing a revolutionary change in the organizations and human service‖. Bass and
Avolio (2006) definition of transformational leadership was as the competence of a
leader to be able to inspire employees to give up their own personal ambitions towards
the good of the organization. Simola, Barling and Turner (2012) assert that the
transformational leader is morally upright manager who is concerned with development
of the values, moral maturity and standards of the subordinates. This is done by
strengthening the subordinate‘s will to serve for the wellbeing of others and their
organization.
According to Hackman & Johnson( 2009) who defined the transformational leader as an
original and one who was less likely in supporting the present state by looking for
other prospects while facing of risk. The leader attempts to mold and build rather than
reacting to the environment (Simons, 2010). Transformational leaders therefore
motivate subordinates into accomplishing more than focusing on their own individual
values and providing guidelines for the alignment of their values to the ones of the
organization (Petranker, 2010). The leader helps the employees in becoming more
creative, innovative and bringing new ideas to the organization that will permit the
organization to grow familiarize itself to the ever altering external environment (Bushra,
Ahmad& Asvir 2011).
The transforming leader seeks to release employee potential through motivating them
and inspiring them to do than what is necessary. Petranker (2010) assert that
transformational leadership concerns itself with the establishment of one being a role
model and attaining the confidence and trust of the subordinate. The leader then develops
the employee‘s capability through sanctioning and guiding them into excelling beyond
the set organizational obligations. The transformational leader can be characterized being
as an unrealistic or futurist. The leader can be seen as a driver for alteration who assumes
a more proactive approach to change management (Rayner, 2011).

32
Caldwell (2011) asserts that change is the key focus in transformational leadership.
According to Wang & Howell (2010) who notes that the transformational leader needs to
possess characters such as high self-esteem, high self-regard plus self-awareness in order
to be effective in the transform of organizations and employees. Abrell, Rowold,
Weibler and Moenninghoff, (2011) suggested the following as vital characteristics of
transformational leadership which are creating a mutual vision, looking at the bigger
picture and engaging with the complex issues, analytical approach, cheering
participation and motivation, sharing data and enabling trust in working team,
recognizing donations and celebrating accomplishments, creating chances for learning
and supporting employee growth.
This type of leadership tends to increase the team's morale and ends up motivating the
team members (Wilson, 2011). A study done by Wegge, Shemla and Haslam (2014)
found out that the amount of transformational leadership used by a manager had a direct
effect on a business unit's performance.
2.3.2 Transactional Leadership
Rowold, J. (2014) defined transactional leaders as individuals who ―know what they
want to achieve from their work and attempts to determine how they can achieve it. They
determine: whether performance warrants exchange of rewards.; exchanges rewards and
assurances reward for performance; and they are receptive to one‘s direct self-interests if
they are able to be encountered by accomplishing the work done ―. Groves and Larocca
(2011) asserted that workers are encouraged through the use of compensation. Rowold
(2014) asserts that the leader holds the employees accountable regardless of resource
availability or competency.

33
The transactional leader develops a vision, sells the vision to the employees and leads the
way to the accomplishment of that vision Success is determined by the leader having
enough power and strength to have the employees perform the duties required of them
(Pieterse, Van Knippenberg, Schippers & Stam, 2010). Kuppelwieser (2011) reported
that the transactional leaders are mostly concerned with upholding of the ―status quo‖ for
their respective organizations. Transactional leaders have been identified to inaugurate
routine requirements and ascertain they are achieved within a given time frame, limiting
the contentment of workers and fashion low amounts of employee obligation and
satisfaction (Dana & Bing, 2015).
Transactional leadership has been alienated into three distinct procedures that assist in
the influencing of employees: active management by exception, contingent reward, and
passive management by exception (Harold, 2011). In active management by exception,
the transactional leader examines for mistakes, indiscretions, exceptions, divergence
from standards, complaints, infractions of policy and regulations, and failures and he or
she takes remedial act earlier or when these happen (Caldwell, 2011).
Transactional leadership has various shortcomings than advantages. Wegge, Shemla and
Haslam (2014) assert that a transactional leader tends to be commanding and does have
high confidence which is fixated on the job. Wilson (2011) asserts that transactional
leadership is mostly suitable for a group setting that is under crisis since it offers
gratification through a vital resolution. Caldwell, Hayes and Long (2010) noted the
outcomes with transactional leadership are not valuable over time. Often transactional
leaders focus on staff‘s needs; they do not suggest opportunities for obtaining
motivation, job contentment or allegiance (Phipps, 2012).
Commonly the transactional leadership style is castoff frequently in organizations led by
command and control procedures (Dixon, & Hart, 2010). Groves and Larocca (2011)
stated that workers in a transactional framework acquire their position within the
organization over competition and conformity. Furthermore, leaders continue to labor

34
within the transactional style and have a habit of been autocratic (Rowold (2014). With
unanticipated issues, role model through conducts and goal setting, and network
effectively (Eisler, & Carter 2010).
2.3.3 Laissez-Faire Leadership
This leadership style involves an inert leader who doesn‘t concern himself/herself in the
stimulation of subordinates to get them to achieve certain goals (Giri &Santra, 2010).
The Laissez-Faire style of leadership encourages the subordinate centered attribute
where they are left to make decisions (Yukl, 2010). Leaders using this leadership style
fail to offer any positive or negative direction to their employees (Rothfelder,
Ottenbacher & Harrington, 2012). Pieterse, Van Knippenberg, Schippers and Stam
(2010) notes that these leaders renounce their leadership which ends up giving
employees more decision-making power than any other leadership style. This intern
leads to employees amplifying their power and influence in an organization or company.
Mahajan, Bishop and Scott (2012) assessment of the leaders shun any organizational
duties such as goal setting, achievement and other important matters. They assume that
anything that comes the employee way they will be able to solve it and there is no need
for their input. Some advantages for this style of leadership are that it permits
participants to grow working relationship and gives employees a chance to make
decision while there are other disadvantages such as incorrect decision making (Uddin,
Noor and Shamaly, 2011). The absence of any leadership results to goals not being
achieved and promotes cultures of ineffective leadership (Schneider & Schröder, 2012).
This method of leadership is ineffective in managing change since no change will be
successful without inputs of the leaders who in turn offer direction for organizations
(Edwards & Gills, 2012).

35
2.3.4 Autocratic Leadership
This style of leadership was recognized by both the University of Michigan and Ohio
State University studies as being job-centered approach (Boulter, 2010). This means the
leader is after the accomplishment of the goal and will do anything to move towards
ensuring that goal has been achieved. The leader‘s behavior focuses on taking control of
the process of change to ensure that change takes place quickly and that it does not fail
(Dixon & Hart, 2010). The leader makes order of the employees without offering much
clarification and dialogue (Kim, 2010). The leader controls the employees through
threats and reprimand (Awan and Mahmood, 2010).
This type of leadership offers various advantages such as swiftness of activity
completion ensuring that projects are easily completed, the leaders is hands on in
implementation of project (Levine, Christian, & Lyons, 2013). This type of leadership
has the following disadvantages such as the dissociation of group members and the
discouragement of employees to use their own methods to do an activity (Anwar and
Haider, 2015). Pearce and Manz (2011) this method is best when a group is in danger of
not achieving an activity in a timely manner or in crisis management. This method is the
best for initiating change in short implementation periods (Bhal & Dadhich, 2011). It
can help in the implementation of change in a group that is resisting change.
2.3.5 Democratic (Participative) Leadership
Democratic leadership commonly referred as participative is where the leader is
pioneering, adventuresome and has an imaginative mindset used to empower employees
in making decisions in the organization (Lisa, 2013). Participative leaders encourage and
support their employees to engage in the decision-making process (Wegge, Shemla, &
Haslam, 2014). They do this using meeting periodically and by listening to their inputs.
Here the leaders are able to understand the employees and how they can involve their
inputs in the decision by the organizations (Kelly, 2014). Therefore, this type of
leadership necessitates and inspires participation from organizational players and

36
involves them in decision-making to ensure advancement of the organization (Benn,
Todd, & Pendleton, 2010). This is done by giving out financial and self-image awards to
the employees to boost their motivation.
Employees will gain financial gains and positive evaluation that translate to increased
morale (Ruiz, Ruiz, & Martinez, 2011). Groves and Larocca (2011) noted this resulted in
the improvement in labor relations, employee commitment, increased organizational
allegiance, occupational contentment, apparent support, organizational ownership
behavior, and employee performance (Tandoh, 2011). This type of leadership style is
ideal for change management since everyone was invited to input their views and
opinions so ensuring the change is effective.
2.3.6 County Culture
Webster's dictionary (2016) insists that culture is the ideas, arts, skills, customs, etc. of
specific individuals in an assumed period of time. Astute managers have comprehended
that any organization also has its specific corporate culture. It symbolizes an extensive
series of communal phenomena, together with an organization's customary dress,
language, subversion, modes of deference, behavior, myths, beliefs, ceremonies and
rituals, values, symbols of status, and assumptions; all of which aid to describe an
organization's character and norms(Nikčević,2016).
Considering the organization's principal ethics can inhibit potential internal conflict,
which is the key motive for our research into these cultural issues (Awan &Mahmoud,
2010). Culture is socially learnt and transferred by members; it delivers the guidelines
for behavior within organizations (Ag Budin &Wafa, 2015). The essential morals of an
organization start with its leadership, which will then grow to a leadership style
(Chapman, Johnson & Kilner, 2014). Workers will be controlled by these ethics and the
conduct of leaders, such that the behavior of both parties should become increasingly in
line.

37
When strong integrated behavior, values and beliefs have been established, a steady
organizational culture develops. Leaders have to respect their purpose in upholding an
organization's principles. A strong culture is a system of guidelines that influences how
societies should behave (Nikčević, 2016). Culture regulates how people do things within
an organization and acts as a medium to which all organizational members relate to and
act. In the county leadership style is highly influenced by culture and this does affect the
change management in the county, thus the study used the county culture as a
moderating variable to moderate the research findings.
2.3.7 Change Management
Change refers to the set of various actions that result to a shift in ways and procedures
that may affect the ways in which organizations perform (Auer-Rizzi & Reber, 2013).
Change begins after organizational management feels it is dissatisfied with the status
quo. Change can be intentional or unintended. Most planned change is related more to
the management this means that they are a deliberate effort in attempting to make things
happen. There is need for strong pledge and logical approach for planned change. Some
of the most important things to evaluate in scheduled changes are the leader‘s vision and
set objectives. Change in the organizations affects the tasks and factions. The leadership
styles (LS) are a crucial part in managing organizational changes since they are
important in the handling of resistance. The leader has to be able to bring out the best
behaviors in the employees so as to be able to achieve the required change. Therefore,
the leader needs to constructively be able to deal with the human emotions (Pearce &
Manz, 2011).
Organizations that are unable to adopt to change cannot be able to survive long in
market. Organizational change provides various important benefits such as it improved
financial performance, improved competitiveness, enhanced employees and customer
satisfaction and leads towards organization improvement and sustainability (Mwangi,
2015). These are among the benefits an organizational gets from engaging in positive
change and the leader has the responsibility to drive this change (Rothfelder, Ottenbacher

38
& Harrington, 2012). The organizational change process is very challenging but leads the
organization towards success.
Change can lead to the organization being capable to meet future demands (Schneider &
Schröder, 2012). As he continues to note that change for organizations is important in
dealing with complex market situations. Cameron (2011) states there are need for
management of change and he refers to it as being the structured strategy and process in
which change is managed within an organization. It involves also managing the reaction
to change by employees. The failure to adapt appropriately and timely results to
organizational failure. Limbare (2012) argues that as the organization is undergoing
change, the management should exercise leadership styles that promote the achievement
of the change. The leaders should be the role models for the employees and should
exhibit behaviors that promote the required attitudes from employees in relation to the
change taking place.
2.4 Empirical Review
This section will look at the empirical review of the study. This section will look at past
studies that looked at the relationship between leadership and change management.
2.4.1 Transformational Leadership and Change Management
Mwangi and Kwasira (2015) obligation in transformational leadership on organizational
modification in certain public secondary schools in Nakuru north sub county, Kenya.
The aim of this research was to study the importance of transformational leadership in
organizational change in public secondary schools of Nakuru North Sub County, Nakuru
County, Kenya. Moreover, the research wanted to institute the influence of inspirational
leadership on organizational change. The target population comprised an aggregate of
406 tutors and principals. Eighty-one respondents from the sample were drawn from the
board population by means of stratified random sample method. The study showed that
transformational leadership certainly plays a significant in organizational change in that

39
it inspires enthusiasm which is one of its essential fundamentals in organizational change
in the abovementioned schools.
The study suggested that the school heads have to persuade their members of staff by
motivating them in such a way that they will enthusiastically clinch change in their
schools. Datche and Mukulu (2015) in their study on the effects of transformational
leadership on staff engagement: A study of civil service in Kenya. The stress was on the
impact of idealized influence, individualized consideration, intellectual motivation, and
inspirational motivation of supervisors in the civil service in Kenya on engagement of
subordinates to the organizations. An investigation statistics collected from 252 civil
employees from 18 best performance state organizations was used to explore the current
relationships. The results concluded that transformational leadership though positively
relation to employee participation in general; the leader performances of intellectual
stimulation and individualized reflection of supervisor were found to be positive and
moderately linked to employee engagement.
Supervisors‘ inspirational enthusiasm of leader was poor and irrelevant while idealized
influence was negatively associated to employee engagement. The researchers thus
endorse programs for leaders in civil service around transformational leadership with
prominence on inspirational motivation, individualized concern, and intellectual
stimulation if these leaders are to inspire their subordinates‘ participation to their
organizations. Suada and Dževad (2014) study on the significance of transformational
leadership in influencing employee approaches towards organizational change. The
empirical research presented in the paper exhibited that the result of transformational
behavior was mainly striking in the case of variations that are reactive, transformative,
and that will alternate the character of the organization.

40
2.4.2 Transactional Leadership and Change Management
Komor (2012) in his research the relationship amidst transactional and
transformational leadership and organizational change. A non-experimental proportional
research design was used and the research differentiated three departments at a British IT
firm experiencing a major change. The study involved 59 staffs in these departments.
Results shown that personnel with transactional and transformational leaders had
similarly high scores for commitment, performance, satisfaction, and they were positive
to change.
Moore (2012) in her study demonstrated the nature of leadership styles in women and
men. Multifactor Leadership Questionnaire was used as a means of impartial assessment
of the leadership style of several specialists. This study main‘s purpose was to identify
whether women could exhibit more transformational and men more transactional
leadership behaviors on the MLQ. Conflicting with the previously established meta-
analyses of gender and leadership, this study found that neither women nor men have a
tendency to exhibit more transformational or transactional behaviors. Worth noting is the
fact that women did vary extensively from men on one of the five transformational
subscales.
2.4.3 Laissez-Faire Leadership
Inju (2015) study on the Positive effects of laissez-faire leadership: a theoretical study.
The Purpose of the study was to maintain that this conservative opinion is prejudiced
from the start as it is loaded with the notion that laissez-faire leadership is non-tactical
and therefore suggests negative magnitudes. The foremost interpretation of laissez-faire
leadership has so far been termed as zero leadership.
Subsequently, it has been recommended that laissez-faire leadership often leads to
negative concerns in employee‘s performance and attitudes. The findings moreover
argue that to unveil the actual results of laissez-faire leadership, emphasis need to shift to

41
the behavioral feature of laissez-faire leadership, or non-participation of a
leader/leadership. This paper used theoretical presentation and obtained schemes to
encourage the revision of laissez-faire leadership in balanced ways. The findings
insisted on the behavioral aspect of laissez-faire leadership, or non-contribution of a
leader/leadership permits this paper to discover prospective positive results, particularly
with contemplation with dynamics of time.
Present studies about laissez-faire leadership have been limited to negative concerns, this
research explores different settings in which laissez-faire leadership ought be optimistic.
This research is among the first tries to smoke out likely outcomes of laissez-faire
leadership, which ought not just negative, but by encouraging the behavioral feature of
non-participation of a leader.
2.4.4 Democratic (Participative) Leadership and Change Management
Soulita (2015) study on the appropriate leadership styles inspire employees to adapt to
change. The study had 12 respondents who had senior management roles in the FEBM.
The results of the findings revealed that there are five main leadership styles that leaders
in the FEBM employed in order to inspire people to adapt to change. These are
transformational leadership, laissez-faire leadership, charismatic leadership, the
autocratic leadership style, and democratic/participative leadership. The study showed
that some leaders executed more than one leadership style to motivate employees to
participate in the change process.
This is because the leaders would change their leadership styles determined by the
situations and the level of satisfaction of the employees. The study concluded that the
FEBM leaders have an extensive understanding about the most suitable ways to motivate
employees in times of change. Vesterinen et al. (2013) study on the importance of this
research was to investigate nurse managers‘ insights correlated to their leadership styles,
knowledge, and their expertise in these areas in health Centre wards in Finland. The

42
findings were composed from nurse managers (n = 252) in health Centre hospitals in
Finland by means of an organized questionnaire (response rate 63%).
Six leadership styles visionary, isolating, coaching, commanding, demographic, and
affiliate were reflected on. Most respondents in each age group examined four leadership
styles visionary, affiliate, coaching, and democratic to be very important. Nurse
Managers assessed their understanding and abilities in leadership styles to be essentially
impartially sufficient or sufficient. Nurse Managers‘ capabilities to echo, recognize, and,
if necessary, amend their leadership style since they have continued to influence the
work unit‘s achievement and employees‘ job satisfaction.
2.4.5 Autocratic Leadership
Alkahtani (2011) research on the effect of leadership styles considering the ability of
Malaysian managers. This research was aimed at investigating the impact of the
leadership styles leading to modification of various capabilities. A total sample of 105
managers was considered in this study. The findings of the research discovered these
managers have a habit of using consultative leadership style. Surprisingly, they engage
autocratic, democratic and some of them use laissez-faire, but unfortunately the
respondents of this research scored higher in consultative leadership style. The findings
of the research obtained that the leadership style was certainly associated with Principal
Change. Both Openness to Practice and Emotional Firmness were meaningfully and
certainly linked with Consultative Leadership Style that the managers use. Involvement
Leadership Style was termed to be considerably and positively linked with Leading
Change. In conclusion, the research concluded a positively important correlation amid
personality of managers, their leadership styles and their leading change competences.
Van der Voet (2013) research studies to what degree dissimilar alteration approaches and
transformational leadership of direct supervisors add to the efficient application of
organizational change in public organizations, and to what magnitude the administrative
structure of public organizations makes the application of organizational modification
43
difficult. The findings emphasis that administrative organizations may efficiently
implement organizational modification with both planned and emergent change
methodologies. The involvement of transformational leadership is determined by the
type of modification method and organizational configuration.
Transformational leadership conduct of direct managers adds little to intended
procedures of modification, but is vital in developing practices of transformation in a
non-administrative setting. However, the literature on alteration managing often stresses
the leadership of senior directors; the leadership role of direct administrators ought not to
be overlooked throughout organizational change in public organizations.
2.4.6 Change Management
Achitsa (2013) in her study sought to determine the significance of leadership in the
management of strategic change at Equity Bank Kenya Limited, based on the
Transformational theory of leadership, the study determined the effect of the various
leadership styles and behavior on management of change, realization of change
objectives, employee morale, motivation and their overall satisfaction with their jobs.
The results from this study indicated that different leadership styles were adopted in the
organization depending on the situation so as to reinforce the need for change. A
significant majority of interviewees reported that the participation of employees in the
decision making process of the bank made them feel included in the change management
process and the bank‘s leadership recognized the employee‘s efforts by making the work
environment conducive for their participation.
The researcher suggested that basing on the importance of proper leadership throughout
the procedure of management of strategic change in an organization, it is compulsory
that organizations appoint the type of leaders with the essential set of skills and skills in
order to certify that the change management process is handled correctly (Achitsa, 2013).

44
Further research should also be conducted in other banks and organizations to confirm
findings of the study.
Wasim and Imran (2010) research on the significance of management in the phenomena
of organizational change. The findings of study recommended and the findings of life
cases of companies which are intentional for this thesis indicates: that a supervisor with
the capabilities of ―Vision‖ and ―Innovative Approach‖ among other features prove more
efficiently to settle the multifaceted wonders of organizational change with success.
Moreover, effective structural change can result to invention for society, which is the
primary key element success and sustainability. This research as a consequence planned
a study which is derivative from the leadership capabilities, organizational change, and
workable success and invention literature.
The findings articulate relationship amid effective organizational change and leadership
on the base of his/her features, which are ―Vision‖ and ―Innovative Approach‖. With the
help of projected model this correlation can be noticed graphically. Cloete (2011) study
on the relationship between leadership styles and organizational change. The findings
discovered relationship amongst leadership styles and organizational change by
quantitative research. The findings specify that there was a positive correlation (0,749 at
the 0.01 level).
2.4.7 County Culture, Leadership Styles and Change Management
Nikčević (2016) study on the effect of managerial culture on management case study
Montenegro. The purpose of the research is to inspect the stimulus of organizational
culture on management. Empirical research included a sample of 16 organizations (423
employees) in Montenegro where participants responded to the questions. The
examination of information obtained was directed by chi square test. The findings
displayed that diverse types of managerial culture, dependent on their gratified, implying
diverse styles of management.

45
Tsai (2011) Relationship amid Organizational Culture and Leadership Behavior. A cross-
sectional research was carried out that concentrated on hospital nurses in Taiwan. Data
was collected by means of a planned questionnaire; 300 questionnaires were given and
200 valid questionnaires were returned. To test the dependability of the data, they were
examined by Cronbach's α and assenting influences. Correlation examination was
secondhand on the relationships amid organizational cultures and managerial behavior
Organizational cultures were positively correlated with leadership behavior.
2.5 Critique of Literature Review
Mwangi and Kwasira (2015) study on the significance of transformational leadership on
organizational change where the researchers looked only at the inspirational leadership
on organizational change. The researchers did not look into the other elements of
transformational leadership such as the intellectual stimulation, idealized influence and
individual consideration. Datche and Mukulu (2015) in their study on the effects of
transformational leadership on staff engagement. The study did not look into other
leadership styles and only focused on the transformational leadership. Therefore, their
findings were based on one leadership styles and not on all leadership styles.
Moore (2012) in her study examined the properties of management styles in women and
men. Unlike former establishment by meta-analyses of gender and leadership (MAGL),
this research concludes that neither women nor men have a tendency to show more
transformational or transactional behaviors.
In studies dating from 1970 to 1990, male managers perceived male managers as more
transformational (Ojwang, 2013). Achitsa (2013) in her study required to determine the
role of leadership in the management of strategic change at Equity Bank Kenya Limited.
The study major respondents were the top leadership. The researcher should have
interviewed middle managers and workers to get their inputs on the role of leadership on
the strategic change in the bank.

46
2.6 Research Gap
Leadership is considered as the main determinant of the application of organizational
change (Herold et al., 2008; Higgs & Rowland, 2005, 2010, 2011; Liu, 2010). Change
management literature focuses on how to make change possible using leadership. Many
researches have been intensive on structural changes in several types of public sector
organizations, local government organizations (Liguori, 2012; Seijts & Roberts, 2011;
Zorn, Page, & Cheney,2000) and central government organizations (Coram &
Burnes,2001; Ryan, Williams, Charles, & Waterhouse, 2008; Sminia &Van Nistelrooij,
2006; Stewart & Kringas, 2003; Stewart & O‘Donnell, 2007).
Basing the reviews on the literature of structural change organization in public
administrations between 2000 and 2010. These researches often stress the significance of
leadership throughout modification in communal organizations (Karp & Helgø, 2008;
Klarner et al., 2008; Ryan et al., 2008). Previous research done in private sector include
Herold, Fedor, Caldwell, & Liu, 2008; Higgs & Rowland, 2005, 2010; Liu, 2010. A
common view in public management findings is that the private segment understandings
cannot be appropriate in public organizations (Boyne, 2006).
Therefore, there is need to do more studies in the public sector in order to understand
factors in the public sector. Several studies recommend that the specific public
subdivision context may impact structural change (Isett et al., 2012; Klarner et al., 2008;
McNulty & Ferlie, 2004). Recently, studies have recommended adjustment in public
organizations. Few studies have been done examining how the leadership styles affect
the organizations change management and more so in Africa. As such, there is little
empirical evidence about what affects change management specifically in relation to
leadership styles employed in public organizations.
This study identified that from the reviewed literature there is a research gap in the study
of leadership styles in the public area where the majority of research done on leadership
styles is mostly towards performance and organizational commitment.

47
Therefore, it is difficult to convince county leaders and managers of the need for changes
in practices until evidence of the effect of leadership styles on change management is
provided and the relationship between the two variables is proved thus study looked at
how leadership styles affect the county change management to fill in the existing
research gap.
2.7 Summary of Literature
This chapter has looked into the various leadership theories and models found in
literature. These theories include the great man and trait theories, behavioral theories,
Fiedler‘s contingency theories, Leader-member exchange (LMX) theory, Hersey and
Blanchard‘s situational leadership model the Vroom-Yetton-Jago normative contingency
model, the path-goal leadership model. This is followed by a review of literature on each
of the five independent variables under study namely: transformational leadership,
Liassez-faire leadership, transactional leadership, demographic leadership, and autocratic
leadership. The chapter also looks at the empirical studies on the independent variables.
Literature in this chapter has shown that leadership styles have an effect on the
dependent variable change management.

48
CHAPTER THREE
RESEARCH METHODOLOGY
3.1 Introduction
This chapter aims to discuss the following areas which are the research design, target
population, the sampling method, sample size, data collection methods, and data
collection tools and data analysis.
3.2 Research Philosophy
The research philosophy of this study was the positivist paradigm. The overall aim of the
positivist research process is to construct a set of theoretical statements that are
generalizable and service the development of universal knowledge. Positivists claim
there is a single, objective reality that can be observed and measured without bias using
standardized instruments. This approach therefore tends towards the use of
questionnaires for data collection and analytical statistical analysis such as hypotheses
testing, random sampling, aggregation, precision and measurement (Serinyel, 2008).
3.3 Research Design
According to Lavrakas (2008) a research design is a general plan or strategy for
conducting a research study to examine specific testable research questions of interest.
Chandaran (2004) describes it as the glue that holds all the elements in a research project
together. Kothari (2010) described a research design as a master plan that specifies the
methods and procedures for collecting and analyzing the needed information.
There exist several research designs some of the mostly used are the exploratory research
design, observation design, experimental research design and descriptive research
design. Chandaran (2004) defines research design as ―an arrangement of conditions for

49
collection and analysis of data in a way that combines their relationships with purpose of
the research‖. The study used descriptive research design.
According to Creswell (2006), the descriptive method of research is used to gather
information about the present existing condition where the researcher interacts freely
with the respondents without undue influence; the emphasis is on describing rather than
on judging. The study used this method due to its appropriateness to gather first hand
data from the respondents and measure the variables. This helped to understand the
effect of leadership styles on the change management in county governments.
3.4 Target Population
Zikmund, Babin, Carr and Griffin, Zikmund (2010) describe a population (universe) as
any complete group for example, of people, sales territories, stores, or college students
that share some common set of characteristics. Mugenda and Mugenda (2003) define
population as ―a complete set of individual cases or objects with some common
observable characteristics‖. Beck and Polit (2003) refer to the term population as the
aggregate or totality of those conforming to a set of specifications. This shows that a
population refers to a group of subjects or entities which have somewhat similar
variables, concepts and phenomena. The target population for this study comprised of
county executives, county chief officers and assembly members. The study focused on 4
counties Kiambu, Nairobi, Machakos and Kajiado in Kenya. These counties were
selected due to the constant leadership wrangles in the counties which were due to
leadership problems. The target population of the study is 501respondents who
comprised of county executives and county assembly members.

50
Table 3.1: Target Population
County County Executive
and Administration
County Assembly Total
Kiambu 11 89 100
Nairobi 10 128 138
Kajiado 13 127 140
Machakos 12 111 123
Total 46 455 501
Source: Kenya County guide (2016)
3.5 Sampling Frame
According to Fowler (2009) a sampling frame refers to a set of people that have a chance
to be selected. A list containing all sampling units is known as sampling frame (Kothari,
2004). In this study a sample of 218 was identified to take part in the study. The purpose
of doing sampling is to acquire an understanding into the attributes or features of the
target population basing it on the characteristics of the sample.
3.5.1 Sampling Technique
The study adopted a simple random sampling and convenience sampling. According to
Mugenda and Mugenda (2008) the rationale for using simple random sampling method
was to gain a representative sample and which also allowed generalizability of the results
of the entire population. The convenience sampling method was used because it helped
the researcher to use the most available respondents for the study.

51
3.6 Sample Size
Sampling is defined by Chandaran (2004) as a process of selecting a number of
individuals in manner with the selected individuals represent the larger group from
which the sample has been selected. It ensures representation of the whole population.
According to Babbie, (2004), there are two types of sampling design or methods:
probability and non-probability sampling. In probability sampling the principle of equal
opportunity for all members of the population for the selection is assured. Probability
sampling provides accurate information above groups that are too large to study in their
entirety. Probability sampling comprises of simple random sampling systematic random
sampling, stratified sampling, and clusters sampling, (Mugenda & Mugenda, 2003, Berg
(2007). This study used a simple random and convenience sampling methods. This study
had a sample of 218 individuals.
A sample was obtained using the following formula adopted from Zikmund, Babin, Carr
and Griffin (2014).
:
Where:
Z= 1.96
p= 0.5
q= 0.5(1- 0.5)
e2= 0.052
n = sample size

52
N = population size
e = error term or other parameters not used (minimum margin error).
Therefore
The formula is adjusted as follows:
The table below shows the sample size. The total sample size was 218
Table 3.2: Target Sample Size
County County Executive
and
Administration
Sample
size
County
Assembly
Sample
size
Total
Kiambu 11 4 89 38 42
Nairobi 10 4 128 56 60
Kajiado 13 5 127 57 62
Machakos 12 5 111 49 54
Total 46 18 455 200 218
3.7 Data Collection Instruments
Mugenda and Mugenda (2003) define data as all the information gathered by a
researcher for the study. Data is categorized into two: primary data which is information

53
collected from the field and secondary data which is information obtained from
magazines, periodicals, articles, books etc.
There are various methods of collecting data which can be summarized in four broad
categories: interviewing, questionnaire observation and documents review (Orodho
2003). The study used questionnaires and, interviews to obtain primary data while the
review of the county reports provided secondary data. Questionnaires were administered
to the respondents.
The researcher targeted the use of collective administration to improve the response rate.
The use of multiple data collection methods was emphasized in order to enhance the
reliability of the data (Sekaran, 2003). This is ―because each research method has
particular strength and weaknesses‖ (Babbie 2004).
3.7.1 Questionnaires
The questionnaire was structured and unstructured in order to obtain all the relevant
information, and was appropriate for the diverse respondents from different counties
with varied experiences in the public service to produce predetermined response
categories. Sasaka, Namusonge and Sakwa (2014) showed that self-administered
questionnaires are usually preferred for purposes of developing close relationship with
the respondents and also assists in providing clarifications sought by respondents on the
spot.
3.7.2 Interviews
Interviews were conducted to enrich and compare with the data collected through
questionnaires. It was necessary to conduct interviews in this study because interviewees
give details in some specific areas of study. An interview is an oral administration of an
interview schedule and provides an indebt inquiry to meet specific objectives of the
study and guard against confusing questions since the interviewer can make

54
clarifications. However, they can be costly in terms of required technical and skilled
labor (Kothari (2004), Mugenda and Mugenda (2003).
In the interviews the researcher encouraged the interviewees to relate their experiences
freely in order to reveal their opinions and attitudes. Interview was used for collecting
data from all the members of county administration. The researcher‘s choice was based
on the fact that interviews are able to give an in-depth analysis of the subject. The
managers had valuable information which was considered important by the study which
in the opinion of the researcher may not have been exhaustively covered through other
methods.
3.8 Data Collection Procedure
Authorization was sought from the relevant authorities to conduct the study from the
counties. Interviews were conducted with selected county executives, chief officers and
county assembly members. Research assistants were hired to assist in administering
questionnaire and reviewing documents. The questionnaire was structured and
unstructured in order to obtain all the relevant information. The questionnaires were all
administered on a one to one basis and the respondents were given three days after which
the research assistants collected the questionnaires.
Both primary and secondary data was used in this study. Primary data was collected
through issuance of questionnaire through the drop and pick method. The interviews
were carried out in three weeks with each interviewee offering at least 40 minutes for the
interview. The study used the research assistants to distribute the questionnaires.
3.9 Pilot Testing
Pilot testing was carried in the county offices of the chosen counties in the study. Pre-
testing the instrument helps to identify the questions which respondents could have
found confusing or they would have felt uncomfortable to answer. Twenty-two
questionnaires were administered as this constituted 10 percent of the number of sampled

55
respondents. Based on the strata of the sample, the questionnaires were administered to
the participants from Kiambu County to pre-test the questionnaire items. Pre-testing is
done so as to make assessment of questionnaires before the actual study is carried out.
Cooper & Schindler, (2006) and Mugenda and Mugenda (2003), state that the pre-testing
procedure used should be identical to those used during the actual data collection.
Corrections were then made on the questionnaires before they were distributed to the rest
of the respondents. The piloted group was not included in the main study.
3.9.1 Reliability of Instruments
According to Kothari (2004) he asserts that reliability is the consistency of measurement,
he continues to note that the more reliable a data collection instrument is, the more
consistent the measure is. Therefore, reliability is a measure of the degree in which data
collection instruments yielded consistent results after various repeated trials (Mugenda &
Mugenda, 1999). It is concerned with the consistency and stability in measurement in
research instruments (Sekaran, 2003). Consistency is used to indicate how well the items
which are measuring a concept hang together in a set. Cronbach‘s alpha was used to test
for the internal reliability of each variable in the study. Cronbach‘s alpha values range
from 0 to 1 whereas Cronbach alpha coefficient of 0.7 and above was considered high
enough to judge the instrument as reliable (Bryman, 2008).
3.9.2 Validity of Instruments
Validity refers to the meaningfulness and accuracy of inferences, which are based on
study results (Mugenda & Mugenda, 2003). Kothari (2004) refers to validity as being the
extent in which differences existing within a measuring instrument reflect the true
differences among those which were tested. Sekaran (2003) asserts that there are two
types of validities: external validity and internal validity. He continues to explain
external validity as being the extent of generalizability of the results of a causal study to
other settings, people, and events while Internal validity he asserts that it‘s the
confidence in which we place in cause- and- effect relationships.

56
In order to make sure that there is high level of content validity in the study the
researcher sought comments by supervisors whom she considers to be experts and
incorporate the changes given accordingly into data collection instrument. The researcher
also conducted a pilot study in order to be able to check the data instruments ability to
collect the required information by the study. After which the result of the pilot was used
to improve the data instruments.
3.10 Data Analysis and Presentation
Mugenda and Mugenda (2003) describe data analysis as the process of bringing order,
structures and meaning to the mass of information collected. Data analysis involves
interpretation and processing of data to provide answers to the research questionnaires.
This is a qualitative study therefore descriptive statistical techniques were used to
analyse the data which involved sorting, editing and identification of categories, themes
and patterns, analyzing and interpreting of the results. The data obtained was analyzed
using Statistical package for Social Sciences version 21 (SPSS) and the findings were
presented in the form of frequencies, percentages, bar graphs and tables and pie charts
and measures of central tendency such as mean, mode and median.
These assisted in drawing inferences and establishing the extent to which the
independent variables affect the dependent variables in relation to the study. The
collected data was used in assessing the effects of the five leadership styles on change
management. According Chandaran (2004), analysis of descriptive data requires both
measurements and description of measurement. It is essential because the mind may not
understand the raw data therefore may not make sense out of it.
Content analysis was used to analyze the qualitative data which was obtained from the
interviews.
Q-Q plot was used for checking for the normality of dependent variable. The researcher
also tested for autocorrelation of residuals in the dependent variable using the Durbin

57
Watson test. Inferential analysis was used to perform correlation analysis to so as to be
able to establish the nature of relationship between each independent variable and the
dependent variable. The variables were also tested using the F-test to establish whether
they are jointly significant. F values were used to determine their significance in the
model. A regression model was used as the overall model to determine the relationship
between the dependent and all the independent variables. The regression model below
expresses the value of predicted (dependent) variables and the predictor (independent)
variables and an error term.
Where:
Y= Change management
= Transformational leadership
=Transactional leadership
= Laissez-faire leadership
= Autocratic leadership
= Democratic leadership
Z= Organizational Culture
=Error term
is a constant which denotes relationship between the independent variable and the
dependent variables

58
3.10.1 OLS Model
The study also determined the presence of the moderating effect using the OLS model.
This was done by estimating interaction effects using the regression model above which
consists of creating an ordinary least squares (OLS) model and a moderated multiple
regression (MMR) model equations involving scores for a continuous predictor variable
Y, scores for a predictor variable X, and scores for a second predictor variable Z
hypothesized to be a moderator (Aguinis & Gottfredson, 2010).
3.10.2 Heteroscedasticity
This study also tested for Heteroscedasticity. Heteroscedasticity means a state in where
the variance of the dependent variable varies across the data, as opposed to a situation
where Ordinary Least Squares, OLS, makes the assumption that for all j,
meaning that the variance of the error term is constant (homoscedasticity). Normality is
important in knowing the shape of the distribution and helps to predict dependent
variables scores (Paul & Zhang, 2009).
3.10.3 Normality Test
This study also tested for normality. A normality test is used to determine whether
sample data has been drawn from a normally distributed population. Q-Q plot was used
for checking for the normality of dependent variable. Q-Q plot refers to a plot of the
percentiles of a standard normal distribution against the matching percentiles of the
detected data. If the observations follow approximately a normal distribution, the
resulting plot should be roughly a straight line with a positive slope. Q-Q plot should be
linear.

59
3.10.4 Autocorrelation
This study also tested for autocorrelation. Autocorrelation refers to the correlation of a
time series with its own past and future values (Box & Jenkins, 1976). The
autocorrelation function can be used to detect non-randomness in data and also to
identify an appropriate time series model if the data are not random.
3.10.5 Multicollineality
This study also tested for Multicollineality. It refers to the undesirable situation where
the correlations among the independent variables are strong (Martz, 2013). To test for
multicollinearity, Variance Inflation Factor (VIF) was used.
If no two independent variables are correlated, then all the VIFs were 1. If VIF for one of
the variables is around or greater than 5, there is multicollinearity associated with that
variable. In this case one of these variables must be removed from the regression model
(Cohen, Cohen, West& Aiken, 2003).
3.10.6 T-statistics
The study also used the t-statistics to test whether the hypothesized model was
significant at 95% significance level. The hypothesis of the study was tested using
Pearson Product Moment Correlation. The test statistics was generated from Statistical
Package for Social Sciences (SPSS). The study used Pearson Product Moment
Correlation so that the relationship between the leadership styles and change
management was established. If the P (probability) value associated with each test was
less than the significance level < 0.05>, the relationship was deemed statistically
significantly. If greater, the relationship was deemed not statistically significant.

60
3.10.7 Exploratory Data Analysis (EDA)
This study also used the Exploratory Data Analysis (EDA). EDA is an
approach/philosophy for data analysis that employs a variety of techniques (mostly
graphical) to maximize insight into a data set; uncover underlying structure; extract
important variables; detect outliers and anomalies; test underlying assumptions; develop
parsimonious models; and determine optimal factor settings(Borden‘s & Abort, 2014).
In this study, EDA was used to reveal the data structure, assess whether the assumptions
were met before any further statistical inferences are done, and detect outliers.
Exploratory Factor Analysis (EFA) was employed in order to identify the constructs that
were then regressed against the dependent variable (Cooper & Schindler, 2003).
Exploratory Factor Analysis (EFA) was employed in order to identify the constructs that
were then regressed against the dependent variable (Cooper & Schindler, 2003).
3.11 Operationalization of Study Variables
The table below shows the operationalization of the study variable and how they were
measured in the study.
Table 3.2 Operationalization of Study Variables
See Appendix III
3.12 Research Ethics
This study adhered to proper research procedures and all sources of information used
were acknowledged as far as possible. All participants that were selected for the study
were given a letter of informed consent, which was signed prior to participation in the
research study. From the signed and returned letter of consent indicated the subject‘s
agreement to take part in the current study. Each respondent was kept anonymous to the
public, and all information retrieved from the subjects was kept confidential. The study

61
sought a letter of introduction before proceeding to do the data collection from both the
school and the government to collect data. The letter authorizing for data collection by
the National Council of Science, Technology and Innovation (NACOSTI) to issued
permission allowing the research to be carried out. The researcher explained that the
findings from the study would be used strictly for academic purposes only. The research
aimed to adhere to the three principles of ethics which are beneficence, respect for
human dignity as well as justice to enable respect and protection of respondents (Polit &
Beck 2003).

62
CHAPTER FOUR
DATA FINDINGS AND DISCUSSIONS
4.1 Introduction
This chapter comprised of the data analysis, findings and interpretation of the study.
Results are presented using tables, graphs, scatter plots, pie-charts and descriptive
statistics. This chapter includes the response rate of the study, general background
information of the respondents and the descriptive statistics, Tests and assumptions and
inferential statistics. Correlation and regression analysis were also done.
4.2 Results of Pilot Test
The study performed a pilot study on 10 respondents. The test as shown in the table 4.1
in order to test for the reliability of the instrument. The participating respondents in the
pilot test were not included in the final study. Cronbach Alpha was used to evaluate the
reliability of this instrument which measure internal consistency. Cronbach‘s Alpha
value is widely used to verify the reliability of the construct. George & Malley (2003)
provided the following values of the rule of the thumb for Cronbach‗s Alpha values > 0.9
Excellent, > 0.8-0.89 Good, > 0.7-0.79 Acceptable, > 0.6 - 0.69 Questionable, >.5.0.5.9
Poor, <.5.0. The results obtained were above the acceptable limit for all the variables.

63
Table 4.1 Cronbach’s Alpha’s Reliability Test for Study Variables
4.3 Response Rate
The table 4.2 shows the response rate of the study. The researcher administered 218
questionnaires; the researcher was able to get 153 representing 70.2% of the
questionnaires back. 65 questionnaires representing 29.8% of were not recovered.
Babbie (1990) asserts that a response rate of 50% is considered to be adequate; this is
corroborated by Bailey (1987) who asserts a response rate at 75% is considered
Item Cronbach's Alpha No of items Comments
Transformational
leadership
0.757 10 Accepted
Transactional
leadership
0.888 10 Accepted
Laissez-faire
leadership
0.872 10 Accepted
Autocratic
leadership
0.892 10 Accepted
Democratic
leadership
0.768 10 Accepted
Organizational
culture
0.882 10 Accepted
Change
Management
0.868 10 Accepted

64
adequate. Rogers, Miller and Judge (2009) also agree and recommend a response rate of
50% which they considered acceptable for a descriptive/correlation study. This shows
that the response obtained by the study was enough to conduct the study.
Table 4.2 Response Rate
4.4 Demographics Information
This section presented the background information demographics such as the age,
Position, highest level of education and response rate across county.
4.4.1 Age Distribution
The study sought to determine the age of the respondents who took part in the study. The
findings were presented in figure 4.1 shows that the majority of the 59(39%) respondents
were between the ages of 18-30 years, 35(23%) were between the ages of 31-40 years,
22(14%) were of the age of 41-50 years and lastly37(25%) were of the age of above 50
years.
Questionnaires No. of respondents Percentage (%)
Issued 218 100
Returned 153 70.2
Not returned 65 29.8

65
Figure 4.1Age Distribution
4.4.2 Job Designation
The study went on further determine the job designation of the respondent and from the
figure 4.2 show that the majority (73%) of the respondents were from the county
assembly members, 18% were the county secretary, another 5% were directors, and
finally chief officers were also 5%.

66
Figure 4.2 Job Designation
4.4.3 Academic Qualifications
The study further sought to establish the respondent‘s academic qualification of the
respondents in order to understand their qualifications and their ability to provide the
study with the information the study needs. From the study findings as shown in figure
4.3 shows that majority (44%) had a degree as the highest level of education, 36% had a
master‘s degree, 18% had diplomas and 4% had doctorate degrees as the highest level of
education.

67
Figure 4.3 Academic Qualifications
4.4.4 Response Rate across Counties
The study went further to report the response rate of the counties in which the study
performed the study from the findings as displayed in the figure 4.4 shows that the
majority (43%) of the respondents were from Nairobi county, 29% were from Kajiado
County, 18% were from Machakos and 10% were from Kiambu county.

68
Figure 4.4 Response rate across Counties
4.5 Qualitative Data Analysis
An interview is a ―way of accessing people‘s perceptions, meanings, and definitions of
situations and construction of realities‖; the interview is a formal and guided
conversation involving the process of asking question and listening. Many participants
were government appointees and they were a bit reluctant to discuss or divulge
information face-to-face that appear to be critical of the government. The researcher
interviewed 16 of the respondents; this was based on their availability from their busy
schedule. The interviewers were questioned using the interview schedule.
4.5.1 Codes to Themes
The table show the codes used for the qualitative study and the themes that were
identified. The study identified four themes which are leaders are instrument, they ensure
successful change, leadership depends on situation and achieving required change.

69
Table 4.3 Codes to Themes
Codes Issues discussed Themes
identified
Frequency Percentage
(%)
leaders are very
important
proper leadership helps
achieve change
inspires and motivates
Leaders contribution
Leaders efforts
leaders are
instrumental
12 71%
Change took place
Ensures minimal
resistance
Timely change
Guidance to achieve
change
Guidance in change
process
Ensure that
successful
change
15 88%
Approaches
Situations
circumstances
Leadership style
used
Choosing of
leadership style
Leadership
style
depending
on situation
13 77%
Authoritative language
Leadership will impose
some decisions
Use of autocratic
leadership
Use of transactional
leadership
Achieve
Required
change
14 82%
From the above table 12(71%) represented the first identified theme leaders are
instrumental from the 16 interviews, 15(88%) represented the second theme ensure that
successful change, 13(77%) represented the fourth theme leadership style depending on
situation and 14(82%) represent the fourth theme achieve required change.

70
4.5.2 Basic to Organizing to Global Themes
The table 4.4 shows the themes identified the organizing themes and the global theme of
the study.
Table 4.4 Organizing to Global Themes
Themes identified Organizing Themes Global Themes
leaders are very important
proper leadership helps
achieve change
inspires and motivates
Transformational leadership
Leadership style
Change took place fast
Ensures minimal resistance
Timely change
Transactional leadership Leadership style
Approaches
Situations
circumstances
Transactional leadership
Transformational leadership
Democratic leadership
Autocratic leadership
Leadership style
Authoritative language
Leadership will impose some
decisions
Autocratic leadership
Transactional leadership
Leadership style

71
4.5.2.1 Leaders are Instrumental
From the first question in the interview guide where the interviewees were asked to
describe the change management process in their respective counties. Majority of the
respondents responded that change was challenging at first but the county does overcome
through various methods. They insisted that leaders are very important in leading the
change process. This shows that leaders are important in ensuring that the necessary
changes take place which relates to the fundamental role leaders play in ensuring that
change takes place. The leader here is identified as a transformational leader.
Simola, Barling and Turner (2012) assert that the transformational leader is morally
upright manager who is concerned with development of the values, moral maturity and
standards of the subordinates. The leader attempts to mold and build rather than reacting
to the environment (Simons, 2010).
4.5.2.2 Ensure change successful
The researcher continued to ask whether the executive management were considered as
successful change agents during the change process. Majority responded that the
executive did try to do their best in ensuring the change process did go on without any
hiccups.
The researcher asked how the county leadership had contributed to the success of the
change management process. They responded that the county leadership played a big
role in ensuring that change did happen. They continued to argue that the leadership went
out of their way to ensure that change did happen in the required time. The leader here is
seen as a transactional leader who wants change to take place in successful. The
transactional leader develops a vision, sells the vision to the employees and leads the
way to the accomplishment of that vision.
72
Success is determined by the leader having enough power and strength to have the
employees perform the duties required of them (Pieterse, Van Knippenberg, Schippers &
Stam, 2010). Wilson (2011) asserts that transactional leadership is mostly suitable for a
group setting that is under crisis since it offers gratification through a vital resolution.
4.5.2.3 Leadership Style Depending on Situation
When the researcher enquired which leadership style was used by the county leaders,
they indicated that the county leaders did use various leadership styles depending on the
situation urgency and importance. The researcher sought from the respondent whether
the transformational leadership had been adopted during the management of change in
the counties. The most respondents replied that the management did try to use
transformational leadership to motivate the employees but if it failed the management
resulted to other leadership styles.
Transformational leaders therefore motivate subordinates into accomplishing more than
focusing on their own individual values and providing guidelines for the alignment of
their values to the ones of the organization (Petranker, 2010). The researcher asked
whether democratic leadership made a kind of contribution to the management of change
in the county. They replied that it did in certain situation where the management sought
deliberations. Democratic leaders encourage and support their employees to engage in
the decision-making process (Wegge, Shemla, & Haslam, 2014).
The study sought to find out which is the most effective leadership style and from the
response from the majority of the respondent indicated that all leadership style were
important for different times and situations. This implies that the different situation
determines the leadership style employed by the county leadership. This shows the use of
different leadership styles in the county to achieve change. The use of various leadership
styles in different situations shows that management is flexible in employing different
leadership styles. Yukl (2010) assert that to be quite comprehensive approved a full-

73
range of leadership styles which consisted of transactional, transformational and
passive/avoidant/ Laissez-faire Style of leadership.
Sharifah, Malcolm & Zubaidah (2012) cited several leadership styles which are common
in organizations today which are autocratic, transformative, transactional, bureaucratic,
democratic, charismatic, servant, task oriented, relationship, and laissez-faire leadership.
4.5.2.4 Achieve Required Goal
The researcher sought to find out whether the leaders did use authoritative language and
the interviewees confirmed that they did when orders were not followed as instructed.
The last question on the decisions imposed by the county executive, most of the
respondent responded that the management had to impose decisions when a solution was
time bound and had no time for deliberations. This showed the use of both autocratic and
transactional leadership styles.
The leader‘s behavior focuses on taking control of the process of change to ensure that
change takes place quickly and that it does not fail (Dixon & Hart, 2010). The leader
makes order of the employees without offering much clarification and dialogue (Kim,
2010).
4.6 Descriptive Statistics of the Study Variables
The following section will look at the descriptive statistics of the study variables. The
section is arranged according to the study variables transformational leadership,
transactional leadership, laissez-faire leadership, autocratic leadership, democratic
leadership, organization culture and the dependent variable change management.

74
4.6.1 Transformational Leadership
The study used several statements to determine the effect of transformational leadership
on the change management. The findings are shown in the table 4.5. Majority (40.5% )
of the respondents strongly agree with the first statement leaders influence the followers,
30.1% agreed with the first statement, 13.1% were neutral to the statement, 6.5%
disagreed and 9.8% strongly disagreed. The mean for the statement was 3.85.
For the second statement a majority (49.7%) of the respondents strongly agreed with the
statement that leaders influence the followers to accept the change 24.2 % agreed with
this statement, 15.7% were neutral to the statement, 6.5% disagreed and 3.9 % strongly
disagreed. The mean for the statement was 4.09. The third statement on leaders use
intellectual stimulation to make change possible majority (50.3%) of the respondents
strongly agreed with the statement, 26.8% agreed with this statement, 8.5% were neutral
to the statement, 8.5% disagreed and 5.9% strongly disagreed. The mean for the
statement was 4.07.
The fourth statement leaders always instill pride in staff majority (50.3%) of the
respondent strongly agreed with this statement, 20.3% agreed with the first statement,
15.0% were neutral to the statement, 8.5% disagreed and 5.9% strongly disagreed. The
mean for the statement was 3.85.
The respondent responded to the fifth statement on leaders articulate clearly the future
where the majority (45.8%) of the respondents agreed with the statement, 32.0% strongly
agreed with the statement, 15.7% were neutral to the statement, 6.5% disagreed and 0%
strongly disagreed. The mean for the statement was 4.03 while the standard deviation
was 0.86. The sixth statement leaders always instill pride in staff majority (45.1%) of the
respondent strongly agreed with this statement, 27.5% agreed with the first statement,
7.8% were neutral to the statement, 11.8% disagreed and 7.8% strongly disagreed. The
mean for the statement was 3.90.

75
The respondent responded to the seventh statement on leaders build genuine trust
between them and followers. The majority (32.7%) of the respondents agreed with the
statement, 31.4% strongly agreed with the statement, 19.0% were neutral to the
statement, 11.1% disagreed and 5.9% strongly disagreed. The mean for the third
statement was 3.73. Majority (35.9%) of the respondents agree with the eighth statement
leaders adjust the culture to meet the long term needs for change, 33.3% strongly agreed
with the statement, 13.1% were neutral to the statement, 9.8% disagreed and 7.8%
strongly disagreed. The mean for the statement was 3.77.
For the ninths statement a majority (43.1%) of the respondents agreed with the statement
that leaders develop skill of employees to meet the requirement of change 33.1 %
strongly agreed with this statement, 16.3% were neutral to the statement, 3.9% disagreed
and 3.3 % strongly disagreed. The mean for the statement was 3.99. For the tenth and
last statement on leaders seeks different perspectives before initiating change a majority
(43.1%) of the respondents strongly agreed with the statement ,33.3 % agreed with this
statement, 10.5% were neutral to the statement, 6.5% disagreed and 6.5 % strongly
disagreed. The mean for the statement was 3.9.
Findings corroborate Mwangi and Kwasira (2015) study which found out that
transformational leadership indeed plays a role in organizational change. The findings
also concur with Datche and Mukulu (2015) that transformational leadership though
positively related to employee engagement in general; the leader behaviors of intellectual
stimulation and individualized consideration of supervisor were found to be positive and
moderately related to employee engagement.

76
Table 4.5 Transformational Leadership
i) Motivation to Change Adoption
The study sought to determine whether the leaders did go out of their way to motivate
employees into adopting a change in the county. From the findings as displayed in the
figure 4.5 shows that the majority (80%) indicated that leaders did go out of their way to
help motivate employees to accept change in the county a small minority (20%)
indicated that they did not go out of their way to motivate employees to change.
Statements SD D N A SA Mean
Leaders influence the followers to
accept the change
% 9.8 6.5 13.1 30.1 40.5 3.85
1.29
Leaders increase the motivation to
change
% 3.9 6.5 15.7 24.2 49.7 4.09
1.13
Leaders use intellectual stimulation
to make change possible
% 5.9 8.5 8.5 26.8 50.3 4.07 1.21
Leaders always instills pride in staff
after achieving a change
% 5.9 8.5 15.0 20.3 50.3 3.85 1.13
Leaders articulate clearly the future % 0 6.5 15.7 45.8 32.0 4.03 0.86
Leaders inspires others to change % 7.8 11.8 7.8 27.5 45.1 3.90 1.31
Leaders build genuine trust between
them and followers.
% 5.9 11.1 19.0 32.7 31.4 3.73 1.19
Leaders adjust the culture to meet
the long term needs for change
% 7.8 9.8 13.1 35.9 33.3 3.77 1.23
Leaders develop skill of employees
to meet the requirement of change
% 3.3 3.9 16.3 43.1 33.1 3.99 .98
Leaders seeks different perspectives
before initiating change
% 6.5 6.5 10.5 43.1 33.3 3.90 1.13

77
Yes, 122, 80%
No, 31, 20%
Figure 4.5 Motivations to Change Adoption
i) Need for Change
The study sought to find out whether the leaders help in the organizational members see
the need for change. From the response given by the respondent displayed in the figure
4.6 show that a majority (86%) did agree while a small minority (14%) indicated that
they did not help the organizational members to see the need for change.
Yes, 86%
No, 14%
Figure 4.6 Needs for Change

78
i) Extent Leaders Push Change for Organization
The study sought also to determine the extent the leaders help organizational members
see the need for change in the organization. From the findings as displayed in the figure
4.7 shows that a majority (44%) indicated to a great extent leaders did help
organizational members see the need to change, 39% to a very large extent, 8% to a
moderate extent, 6% to a low extent and finally 4% to no extent.
Figure 4.7 Extent to which Leaders Push Change for Organization
4.6.2 Transactional Leadership
The study used several statements to determine the effect of transactional leadership on
the change management. The findings are shown in the table 4.6 Majority (50.3%) of the
respondents agree with the first statement leaders offer rewards for achievement of
change, 34.6% strongly agreed with the first statement, 9.8% were neutral to the
statement and 5.2% disagreed. The mean for the statement was 4.14. For the second
statement a majority (45.8%) of the respondents agreed with the statement that Leader

79
use punishment when change objectives are not achieved, 22.2% were neutral to the
statement, 18.3 % disagreed and 13.7 % strongly agreed with this statement. The mean
for the statement was 3.55.
The third statement on Leader sets clear goals majority (49.7%) of the respondents
agreed with the statement, 30.1% strongly agreed with this statement, 10.5% were
neutral to the statement, 9.8% disagreed and 0% strongly disagreed. The mean for the
statement was 4.0 while the standard deviation was 0.9. The fourth statement the leader
is responsible for goal achievement majority (45.8%) of the respondent strongly agreed
with this statement, 20.9% agreed with the statement, 9.8% were neutral to the statement,
14.4% disagreed and 9.2% strongly disagreed. The mean for the statement was 3.80. The
respondent responded to the fifth statement on leaders motivates followers towards
achievement of change where the majority (38.6%) of the respondents strongly agreed
with the statement, 35.9% strongly agreed with the statement, 12.4 % were neutral to the
statement, 5.9% disagreed and 7.2% strongly disagreed. The mean for the statement was
3.93.
The sixth statement leaders always instill pride in staff majority (41.2%) of the
respondent agreed with this statement, 32.0% strongly agreed with the first statement,
15.0% were neutral to the statement, 8.5% disagreed and 3.3% strongly disagreed. The
mean for the statement was 3.90 while the standard deviation was 1.05. The respondent
responded to the seventh statement on the leadership style has affected county change
process. The majority (37.9%) of the respondents agreed with the statement, 34.6%
strongly agreed with the statement, 20.3% were neutral to the statement, 7.2% disagreed
and 0% strongly disagreed. The mean for the statement was 4.03.
Majority (49.0%) of the respondents agree with the eighth statement Overall success of
the change depends on whether the leader has the power, 26.1% strongly agreed with the
statement, 15.0% were neutral to the statement, 5.9% disagreed and 3.9% strongly
disagreed. The mean for the statement was 3.88 while the standard deviation was 1.00.

80
For the ninths statement a majority (59.5%) of the respondents agreed with the statement
that Leader develops a vision and sells the vision to the followers 27.5 % strongly agreed
with this statement, 7.2% were neutral to the statement, 2.6 % disagreed and 3.3 %
strongly disagreed. The mean for the statement was 4.05.
For the tenth and last statement on leaders are interested creating the conducive
environment for change a majority (54.9%) of the respondents agreed with the statement
,28.1 % strongly agreed with the statement, 12.4% were neutral to the statement, 6.5%
disagreed and 6.5 % strongly disagreed. The mean for this statement was 4.02. The
findings agreed with the results of Moore (2012) revealed that employees with
transactional and transformational leaders had equally high scores for commitment,
satisfaction, performance and they were receptive to change.

81
Table 4.6 Transactional Leadership
i) Clarification of Responsibility
The study sought to determine whether the leaders clarify the responsibility in achieving
change. From the findings as displayed in the figure 4.8 show that a majority (73%)
indicated that the leaders did clarify to the organizational member who was responsible
for various areas in the change process, a small minority (27%) indicated that they did
not.
Statements SD D N A SA Mean Std.
Dev.
Leader offer rewards for
achievement of change
% 0 5.2 9.8 50.3 34.6 4.14 0.8
Leader use punishment when
change objectives are not
achieved
% 0 18.3 22.2 45.8 1.37 3.55 0.95
Leader sets clear goals % 0 9.8 10.5 49.7 30.1 4.0 0.9
The leader are responsible for
goal achievement
% 9.2 14.4 9.8 20.9 45.8 3.8 1.39
Leaders motivates followers
towards achievement of change
% 7.2 5.9 12.4 35.9 38.6 3.93 1.18
The leader dominates the
change process by command
and control procedures
% 3.3 8.5 15.0 41.2 32.0 3.90 1.05
The leadership style has affected
county change process
% 0 7.2 20.3 34.6 37.9 4.03 0.93
Overall success of the change
depends on whether the leader
has the power
% 3.9 5.9 15.0 49.0 26.1 3.88 1.00
Leader develops a vision and
sells the vision to the followers
% 3.3 2.6 7.2 59.5 27.5 4.05 0.86
Leaders are interested creating
the conducive environment for
change
% 0 4.6 12.4 54.9 28.1 4.02 0.91

82
Figure 4.8 Clarification of Responsibility
ii) Recognition and Rewards for Achieving Change
The study sought to determine whether the leaders provides recognition and rewards for
achieving for achieving change. The results are as displayed in the figure 4.10 where the
majority (88%) indicated that they did receive recognition and rewards for achieving a
certain change, a minority (12%) indicated that they did not receive recognition.

83
Yes, 135, 88%
No, 18, 12%
Figure 4.9 Recognition and Rewards for Achieving Change
iii) Do Leaders Guide the Employees into Achieving Change in the Organization
The study sough to determine how the extent do leaders guide the employees into
achieving change in the organization. The findings are displayed in the figure 4.10 where
the majority (44%) indicated to a very great extent leaders did help organizational
members see the need to change, 39% to a great extent, 10% to a moderate extent, 4% to
a low extent and finally 3% to no extent.

84
Figure 4.10 To what Extent Do Leaders Guide the Employees into
Achieving Change in the Organization
4.6.3 Laissez-Faire Leadership
The study used several statements to determine the effect of Laissez-Faire Leadership on
the change management. The findings are shown in the table 4.7. The majority (49.0%)
of the respondents strongly disagreed with the first statement leaders avoids getting
involved when important issues arise, 37.3% disagreed with the first statement, 13.7%
were neutral to the statement. The mean for the statement was 1.76 while the standard
deviation was 0.68. For the second statement a majority (50.3%) of the respondents
disagreed with the statement that leaders let others make decisions, 35.9% strongly
disagreed with the statement, 13.7 % were neutral to the statement. The mean for the
statement was 1.76.

85
The third statement on leaders delaying in responding to urgent questions (64.7%) of the
respondents strongly disagreed with the statement, 26.8% disagreed with this statement
and 8.5%. The mean for the statement was 1.44 while the standard deviation was
0.65.The fourth statement the leaders delay in responding to urgent questions majority
(49.7%) of the respondent strongly disagreed with this statement, 41.2% disagreed with
the statement and 9.82% were neutral to the statement, the mean for the statement was
1.59 .The respondent responded to the fifth statement on leaders use passive
management where the majority (72.5%) of the respondents strongly disagreed with the
statement, 22.9% disagreed with the statement, 4.6 % were neutral to the statement. The
mean for the statement was 1.82.
The sixth statement the leader makes no attempt to help in solving problems majority
(55.6%) of the respondent disagreed with this statement, 36.6% strongly disagreed with
the statement, and 6.5% were neutral to the statement and 1.3% agreed with the
statement. The mean for the statement was 1.73 while the standard deviation was 0.64.
The respondent responded to the seventh statement on the leaders renounce their
leadership. The majority (50.3%) of the respondents disagreed with the statement, 46.4%
strongly disagreed with the statement, and 2.6% were neutral to the statement and 7%
agreed. The mean for the statement was 1.58.
Majority (50.3%) of the respondents disagree with the eighth statement leaders shun
organizational duties, 46.4% strongly disagreed with the statement, 2.6% were neutral to
the statement and 7% agreed. The mean for the statement was 1.67 while the standard
deviation was 0.58.For the ninths statement a majority (54.2%) of the respondents
disagreed with the statement that leaders assume that anything that comes the county
administration 41.2 % strongly disagreed with the this statement, 1.3% were neutral to
the statement and 3.3% agreed .The mean for the statement was 1.67 while the standard
deviation was 0.67.For the tenth and last statement on leader doesn‘t concern themselves
in the stimulation of subordinates a majority (52.9%) of the respondents strongly

86
disagreed with the statement, 32.7 % disagreed with the statement, 11.1% were neutral to
the statement, and 3.3% agreed. The mean for this statement was 1.73.
The findings corroborated Inju (2015) that the possible outcomes of laissez-faire
leadership, which could not be just negative, by adapting the behavioral aspect of non-
involvement of a leader.
Table 4.7 Laissez-Faire Leadership
Statements SD D N A SA Mean Std.
Dev.
Leaders avoids getting involved
when important issues arise
% 37.3 49.0 13.7 0 0 1.76 0.68
Leaders let others make decisions % 35.9 50.3 13.7 0 0 1.78 0.67
Leaders avoids making decisions % 64.7 26.8 8.5 0 0 1.44 0.65
Leaders delay in responding to
urgent questions
% 49.7 41.2 9.2 0 0 1.59 0.65
Leaders use passive management % 22.9 72.5 4.6 0 0 1.82 0.49
The leader makes no attempt to
help in solving problems
% 36.6 55.6 6.5 1.3 0 1.73 0.64
Leaders renounce their leadership % 46.4 50.3 2.6 0.7 0 1.58 0.58
Leaders shun organizational
duties
% 41.2 54.2 1.3 3.3 0 1.67 0.67
Leaders assume that anything that
comes the county administration
way they will be able to solve it
% 52.9 32.7 11.1 3.3 0 1.65 0.81
Leader doesn‘t concern
themselves in the stimulation of
subordinates
% 45.8 40.5 9.2 4.6 0 1.73 0.81
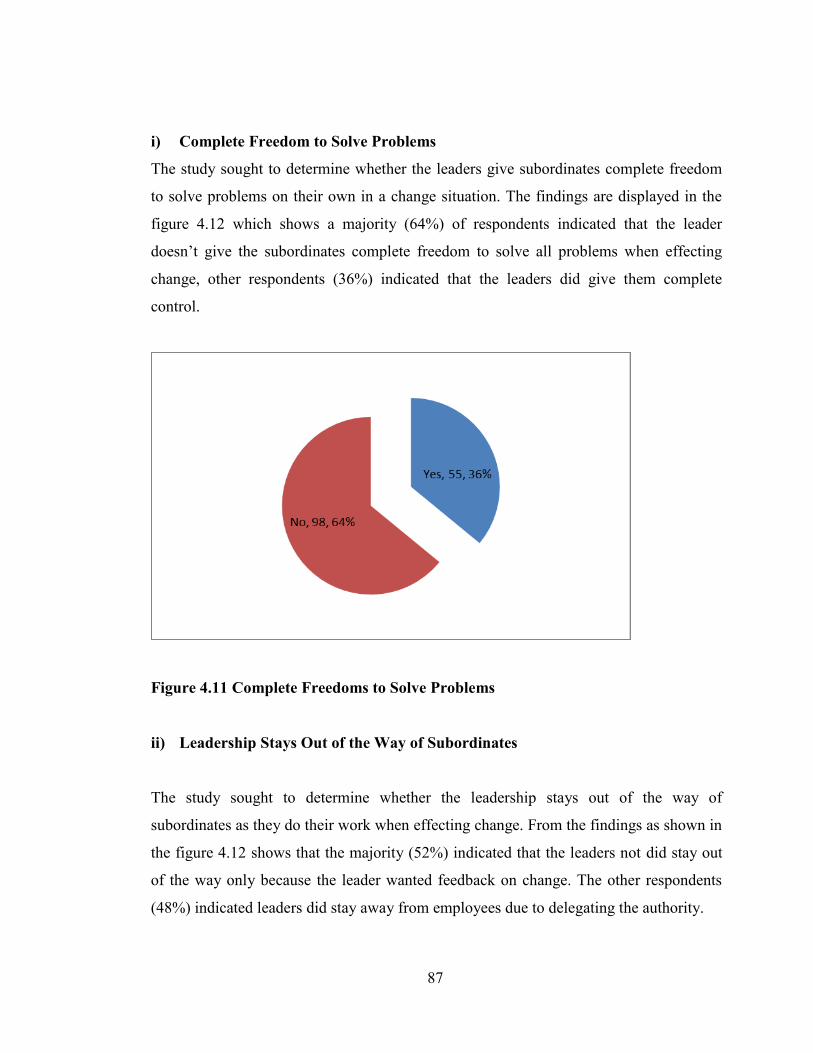
87
i) Complete Freedom to Solve Problems
The study sought to determine whether the leaders give subordinates complete freedom
to solve problems on their own in a change situation. The findings are displayed in the
figure 4.12 which shows a majority (64%) of respondents indicated that the leader
doesn‘t give the subordinates complete freedom to solve all problems when effecting
change, other respondents (36%) indicated that the leaders did give them complete
control.
Figure 4.11 Complete Freedoms to Solve Problems
ii) Leadership Stays Out of the Way of Subordinates
The study sought to determine whether the leadership stays out of the way of
subordinates as they do their work when effecting change. From the findings as shown in
the figure 4.12 shows that the majority (52%) indicated that the leaders not did stay out
of the way only because the leader wanted feedback on change. The other respondents
(48%) indicated leaders did stay away from employees due to delegating the authority.

88
Figure 4.12 Leadership Stays Out of the Way of Subordinates
iii) Extent Leaders Let Subordinates Work out Problems
The study went further to determine leaders let subordinates work problems out on their
own in change situation. From the response in the figure 4.13 show that where the
majority (44%) indicated to a moderate extent leaders did help organizational members
see the need to change, 24% to a low extent, 19% to great extent, 10% to a very great
extent and finally 3% to no extent.
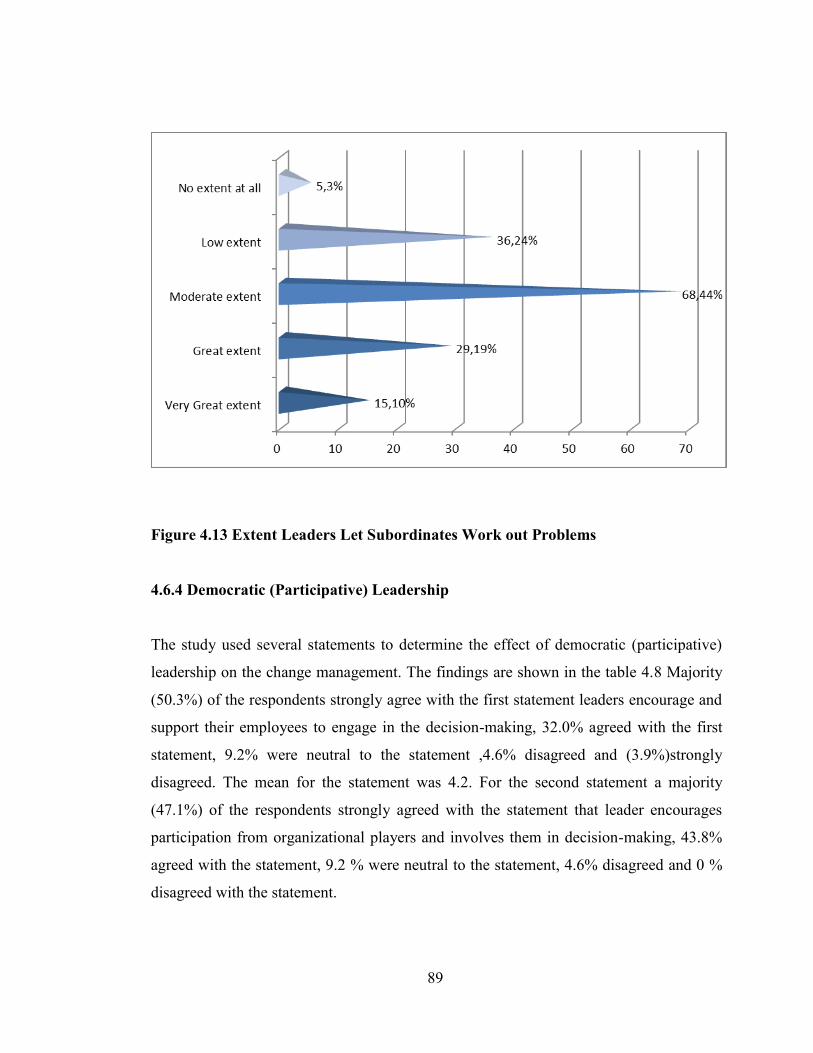
89
Figure 4.13 Extent Leaders Let Subordinates Work out Problems
4.6.4 Democratic (Participative) Leadership
The study used several statements to determine the effect of democratic (participative)
leadership on the change management. The findings are shown in the table 4.8 Majority
(50.3%) of the respondents strongly agree with the first statement leaders encourage and
support their employees to engage in the decision-making, 32.0% agreed with the first
statement, 9.2% were neutral to the statement ,4.6% disagreed and (3.9%)strongly
disagreed. The mean for the statement was 4.2. For the second statement a majority
(47.1%) of the respondents strongly agreed with the statement that leader encourages
participation from organizational players and involves them in decision-making, 43.8%
agreed with the statement, 9.2 % were neutral to the statement, 4.6% disagreed and 0 %
disagreed with the statement.

90
The mean for the statement was 4.3. The third statement on leader ensures employees
ideas are taken seriously (68.0%) of the respondents strongly agreed with the statement,
22.2% agreed with this statement, 4.6% were neutral to the statement and 5.2%
disagreed. The mean for the statement was 4.48 while the standard deviation was 0.99.
The fourth statement the leader increase morale for change to take place majority
(49.7%) of the respondent strongly agreed with this statement, 41.2% agreed with the
statement, 4.6% were neutral to the statement and 4.6% disagreed The mean for the
statement was 4.31.
The respondent responded to the fifth statement on leadership style is ideal for change
management where the majority (45.8%) of the respondents strongly agreed with the
statement, 36.6% agreed with the statement, 13.7 % were neutral to the statement and
3.9% disagreed. The mean for the statement was 4.2. The sixth statement on this
leadership style results in the improvement in labor relations, employee commitment,
increased organizational allegiance, occupational contentment, apparent support,
organizational ownership behavior, and employee performance. Majority (50.3%) of the
respondent strongly agreed with this statement, 27.5% agreed with the first statement,
9.2% were neutral to the statement, 4.6% disagreed and 8.5% strongly disagreed. The
mean for the statement was 4.07.
The respondent responded to the seventh statement on the Leader keeps followers
updated on change process. The majority (57.5%) of the respondents strongly agreed
with the statement, 32.0% strongly agreed with the statement, 7% were neutral to the
statement, 5.2% disagreed and 4.6% strongly disagreed. The mean for the statement was
4.33. Majority (67.3%) of the respondents strongly agree with the eighth statement
leaders are able to understand the followers concerns, 26.8% agreed with the statement
and 5.9% were neutral to the statement. The mean for the statement was 4.61.

91
For the ninths statement a majority (54.9%) of the respondents strongly agreed with the
statement that leader meeting periodically and listening to inputs by followers.27.5 %
strongly agreed with the statement, 7.2% were neutral to the statement, 2.6 % disagreed
and 3.3 % strongly disagreed. The mean for the statement was 4.5. For the tenth and last
statement on it is an effective leadership style a majority (49.7%) of the respondents
agreed with the statement ,32.0% strongly agreed with the statement, 9.2% were neutral
to the statement, 5.2% disagreed and 3.9% strongly disagreed. The mean for this
statement was 4.18. The findings concur with the result by Soulita (2015) which showed
that the leadership style was positively related with Leading Change.

92
Table 4.8 Democratic (Participative) Leadership
Statements SD D N A SA Mean Std.
Dev.
Leaders encourage and support
their employees to engage in the
decision-making
% 3.9 4.6 9.2 32.0 50.3 4.2 1.05
Leader encourages participation
from organizational players and
involves them in decision-
making
% 0 4.6 4.6 43.8 47.1 4.3 0.92
Leader ensures employees ideas
are taken seriously
% 0 5.2 4.6 22.2 68.0 4.48 0.99
Leader increase morale for
change to take place
% 0 4.6 4.6 41.2 49.7 4.31 0.93
Leadership style is ideal for
change management
% 0 3.9 13.7 36.6 45.8 4.20 0.96
This leadership style results in
the improvement in labor
relations, employee commitment,
increased organizational
allegiance, occupational
contentment, apparent support,
organizational ownership
behavior, and employee
performance.
% 8.5 4.6 9.2 27.5 50.3 4.07 1.24
Leader keeps followers updated
on change process
% 4.6 5.2 7 32.0 57.5 4.33 1.05
Leaders are able to understand
the followers concerns
% 0 0 5.9 26.8 67.3 4.61 0.6
Leader meeting periodically and
listening to inputs by followers.
% 0 0 4.6 40.5 54.9 4.50 0.59
It is an effective leadership style % 3.9 5.2 9.2 32.0 49.7 4.18 1.07

93
i) Leader Helps the Organizational Members See the Need for Change
The study sought to determine whether the leader helps the organizational members see
the need for change. The finds are displayed in the figure 4.14 which show a majority
(79%) of respondent indicated that leaders did show the member the need for change a
minority (21%) indicated that they did not.
Figure 4.14 Leader Helps the Organizational Members See the Need for Change
ii) Involving Organizational Members in Decision Making
The study went forward to determine whether the leaders involve the other
organizational member in the decision making in case of a change. The findings
displayed in figure 4.15 show a majority (82%) of respondent indicating that leaders did
involve them in decision making while a small minority (28%) indicated that they were
not involved.

94
Figure 4.15 Involving Organizational Members in Decision Making
iv) Extent Leaders are willing to listen to Organizational Members in the
Decision Making
The study sought to determine extent the leaders willing to listen to other organizational
members in the decision making in case of change. . From the response in the figure 4.13
show that where the majority (45%) indicated to a moderate extent leaders did help
organizational members see the need to change, 22% to great extent, 20% to a low
extent, , 7% to a very great extent and finally 5% to no extent.

95
Figure 4.16 Extent Leaders are willing to listen to Organizational
Members in the Decision Making
4.6.5 Autocratic Leadership
The study used several statements to determine the effect of autocratic leadership on the
change management. The findings are shown in the table 4.9. Majority (59.5%) of the
respondents agreed with the first statement leader is after the accomplishment of the goal
and will do anything to move towards ensuring that goal has been achieved, 32.0%
strongly agreed with the first statement, 4.6% were neutral to the statement and 3.9%
disagreed. The mean for the statement was 4.2.
For the second statement a majority (68%) of the respondents agreed with the statement
that leader‘s behavior focuses on taking control, 19.0% strongly agreed with the
statement, 8.5 % were neutral to the statement and 4.6% disagreed this statement. The

96
mean for the statement was 4.01. The third statement on leader makes order of the
employees without offering much clarification and dialogue a majority (49.0%) of the
respondents agreed with the statement, 35.9% strongly agreed with this statement, 4.1%
were neutral to the statement and 3.9% disagreed. The mean for the statement was
4.17.The fourth statement the leader controls the employees through threats and
reprimand (58.2%) of the respondent strongly agreed with this statement, 32.0% agreed
with the statement, 5.2% were neutral to the statement, 3.9% disagreed and 7% strongly
disagreed this statement The mean for the statement was 4.43.
The respondent responded to the fifth statement on Leadership style offers various
advantages such as swiftness of activity completion ensuring that projects are easily
completed where the majority (68.0%) of the respondents strongly agreed with the
statement, 15.0 % agreed with the statement, 13.1 % were neutral to the statement and
3.9% disagreed. The mean for the statement was 4.47. The sixth statement on the leader
is hands on in implementation of projects. Majority (64.7%) of the respondent strongly
agreed with this statement, 22.5% agreed with the first statement, 9.2% were neutral to
the statement and 3.9% disagreed 8.5%. The mean for the statement was 4.48.
The respondent responded to the seventh statement on the Leaders are swift in handling
activities. The majority (49.7%) of the respondents strongly agreed with the statement,
32.0% strongly agreed with the statement, 13.7% were neutral to the statement and 4.6%
disagreed. The mean for the statement was 4.09 while the standard deviation was 0.82.
Majority (63.4%) of the respondents strongly agree with the eighth leaders‘ direct staff‘s
attention towards failures to meet standards, 27.5% agreed with the statement, 4.6% were
neutral, 3.9% disagreed and 7% strongly disagreed this statement to the statement. The
mean for the statement was 4.45. For the ninths statement a majority (45.8%) of the
respondents strongly agreed with the statement that leader uses punishment in case of
failure.45.1 % agreed with this statement, 5.9% were neutral to the statement and 3.3%
disagreed. The mean for the statement was 4.33 while the standard deviation was 0.73.
For the tenth and last statement on it is an effective leadership style a majority (63.4%)

97
of the respondents agreed with the statement ,22.5% strongly agreed with the statement,
4.6% were neutral to the statement, 3.9% disagreed and 7% strongly disagreed. The
mean for this statement was 4.13. This corroborates with Awan and Mahmood (2010)
and Iqbal, Anwar and Haider (2015) who found authoritative leadership to have effect on
the employees in their respective studies.
Table 4.9 Autocratic Leadership
Statements SD D N A SA Mean Std.
Dev.
Leader is after the accomplishment of
the goal and will do anything to move
towards ensuring that goal has been
achieved
% 0 3.9 4.6 59.5 32.0 4.20 0.70
Leader‘s behavior focuses on taking
control
% 0 4.6 8.5 68.0 19.0 4.01 0.68
Leader makes order of the employees
without offering much clarification
and dialogue.
% 0 3.9 4.1 49.0 35.9 4.17 0.78
Leader controls the employees
through threats and reprimand.
% 7 3.9 5.2 32.0 58.2 4.43 0.82
Leadership style offers various
advantages such as swiftness of
activity completion ensuring that
projects are easily completed
% 0 3.9 13.1 15.0 68.0 4.47 0.87
The leader is hands on in
implementation of projects
% 0 3.9 9.2 22.2 64.7 4.48 0.82
Leaders are swift in handling
activities.
% 0 4.6 13.7 49.7 32.0 4.09 0.80
Leaders direct staff‘s attention
towards failures to meet standards.
% 7 3.9 4.6 63.4 27.5 4.45 0.79
Leader uses punishment in case of
failure
% 0 3.3 5.9 45.1 45.8 4.33 0.73
It is an effective leadership style % 7 3.9 4.6 63.4 22.5 4.13 0.72

98
i) Leaders Supervised Employees Closely in Change Situations
The study sought to determine whether the leaders supervised employees closely when
implementing change from the findings displayed in the figure4.17 shows that a majority
(76%) indicated that the leader did supervise the employees while a minority (24%)
indicated that they did not. They continued to explain that for only important project the
leader did supervise, did not supervise for not very important ones.
Figure 4.17 Leaders Supervised Employees Closely In Change Situations
ii) Leader Gives out Rewards or Punishment to Motivate Members to
Accepting Change
The study sought to determine whether the leader gives out rewards or punishment to
any one in order to motivate them into accepting change. From the findings displayed in
the figure 4.18 show that a majority (64%) indicated that leaders did give either
punishment or reward for motivating change, whilst 36% indicated that they did not.

99
Figure 4.18 Leader Gives out Rewards or Punishment to Motivate
Members to Accepting Change
iii) Leaders were seen as the Leader the Chief Judge of the Achievements
of Change
The study sought to find out extent to which leaders were seen as the leader the chief
judge of the achievements of change. From the findings as displayed in the figure 4.15
show that a majority the majority (49%) indicated to a moderate extent leaders did help
organizational members see the need to change, 22% to great extent, 16% to a low
extent, 9% to a very great extent and finally 4% to no extent.

100
Figure 4.19 Leaders Were Seen as the Leader the Chief Judge of the
Achievements of Change
4.6.6 County Culture
The study used several statements to determine the effect of organizational culture on the
change management. The findings are shown in the table 4.10 Majority (41.2%) of the
respondents agreed with the first statement county has norms that help change, 40.2%
strongly agreed with the first statement and 4.6% were neutral to the statement,5.9%
disagreed this statement and 7.8% strongly disagreed. The mean for the statement was
4.01.

101
For the second statement a majority (59.5%) of the respondents strongly agreed with the
statement that county has beliefs that help change, 9.2% agreed with the statement, 9.2%
were neutral to the statement, 13.1% disagreed this statement and 9.2% strongly
disagreed. The mean for the statement was 3.97. The third statement on county values
influence leadership styles a majority (54.9%) of the respondents agreed with the
statement, 31.4 % strongly agreed with this statement, 9.2% were neutral to the statement
and 4.6% strongly disagreed. The mean for the statement was 4.09.
The fourth statement on county members are collaborative with change (49.0%) of the
respondent agreed with this statement, 31.4% strongly agreed with the statement, 9.2%
were neutral to the statement, 5.2% disagreed and 5.2 % strongly disagreed this
statement. The mean for the statement was 3.96 while the standard deviation was 1.04.
The respondent responded to the fifth statement on county culture affects leadership
(58.8%) of the respondents agreed with the statement, 27.5 % strongly agreed with the
statement, 4.6 % were neutral to the statement and 9.2% strongly disagreed this
statement. The mean for the statement was 4.27.
The sixth statement on there is a culture of refusing change. Majority (63.4%) of the
respondent strongly agreed with this statement, 18.3% agreed with the first statement,
9.2% were neutral to the statement, 2.0% disagreed and 7.2% strongly disagreed this
statement. The mean for the statement was 3.84.
The respondent responded to the seventh statement on county leaders have a way of
influencing county members. The majority (41.2%) of the respondents strongly agreed
with the statement, 39.9% agreed with the statement, 8.5% were neutral to the statement,
5.9% disagreed and 4.6% strongly disagreed this statement. The mean for the statement
was 4.07.

102
Majority (62.1%) of the respondents strongly agree with the eighth county leaders have a
way of influencing county members 32.0% agreed with the statement, 2.0% disagreed
and 3.9% strongly disagreed this statement to the statement. The mean for the statement
was 3.67. For the ninths statement a majority (58.2%) of the respondents agreed with the
statement that change in the county is communicated early 9.2 % strongly agreed with
this statement, 26.8% were neutral to the statement and 2.0% disagreed and 3.9%
strongly disagreed this statement to the statement. The mean for the statement was 4.46.
For the tenth and last statement on counties refuse meaningless change a majority
(45.1%) of the respondents agreed with the statement ,39.9% strongly agreed with this
statement, 9.2% were neutral to the statement and 5.9% strongly disagreed. The mean for
this statement was 4.13. The findings concur with Alkahtani (2011) study where the
results of the study showed that the leadership style was positively related with Leading
Change.

103
Table 4.10 Organizational Culture
i) Leadership Styles Are Supported by The County Culture.
The study sought to determine whether the leadership styles are supported by the county
culture. From the findings displayed in the figure 4.18 shows that the majority (80%) of
the respondents indicated that the county culture did support the leadership styles where
a small minority (20%) indicated that it didn‘t.
Statements SD D N A SA Mean Std.
Dev.
County has norms that help
change
% 7.8 5.9 4.6 41.2 40.5 4.01 1.18
County has beliefs that help
change
% 9.2 13.1 9.2 9.2 59.5 3.97 1.43
County values influence
leadership styles
% 5.2 5.2 9.2 49.0 31.4 4.09 0.90
County members are
collaborative with change
% 5.2 5.2 9.2 49.0 31.4 3.96 1.04
County Culture affects leadership % 9.2 0 4.6 27.5 58.8 4.27 1.18
There is a culture of refusing
change
% 7.2 2.0 9.2 63.4 18.3 3.84 0.99
County member have a way of
voices their views
% 4.6 5.9 8.5 39.9 41.2 4.07 1.07
County leaders have a way of
influencing county members
% 3.9 2.0 0 32.0 62.1 3.67 0.83
Change in the county is
communicated early
% 3.9 2.0 26.8 58.2 9.2 4.46 0.92
Counties refuse meaningless
change
% 5.9 0 9.2 45.1 39.9 4.13 1.00

104
Yes80%
No20%
Figure 4.20 Leadership Styles Are Supported By the County Culture
ii) County Culture Contribute to Resistance to Change
The study went further to determine whether county culture contribute to resistance to
change. From the findings as displayed in the figure 4.20 the majority (77%) of the
respondents indicated that the county contributes to resistance to change, a minority
(27%) indicated that it didn‘t.
Yes, 111, 73%
No, 42, 27%
Figure 4.21 County Culture Contribute to Resistance to Change

105
iii) Extent Leadership Styles are Supported by County Culture
The study sought to determine the extent to which the leadership styles are supported by
county culture. The findings are displayed in the figure 4.23 shows that the majority the
majority (49%) indicated to a great extent leaders did help organizational members see
the need to change, 22% to moderate extent, 16% to a very great extent 9% to a low
extent, finally 4% to no extent.
Figure 4.21 Extent leadership styles are supported by county culture
4.6.7 Change Management
The study used several statements to determine the change management. The findings
are shown in the table 4.11. Majority (45.8%) of the respondents agreed with the first
statement change leads to county improvement, 45.1% strongly agreed with the first
statement and 5.9% were neutral to the statement. The mean for the statement was 4.29.
For the second statement a majority (45.8%) of the respondents strongly agreed with the

106
statement that change leads to county sustainability, 35.9% agreed with the statement,
3.9% were neutral to the statement ,5.2% disagreed this statement and 9.2% strongly
disagreed. The mean for the statement was 3.95.
The third statement on there is ownership of change a majority (39.9%) of the
respondents strongly agreed with the statement, 30.7% agreed with this statement, 18.3%
were neutral to the statement, 6.5% disagreed and 4.6% strongly disagreed. The mean for
the statement was 3.95 while the standard deviation was 1.12. The fourth statement the
change achievement is difficult (36.6%) of the respondent agreed with this statement,
32.0% strongly agreed with the statement, 18.3% were neutral to the statement, 8.5%
disagreed and 4.6% strongly disagreed this statement. The mean for the statement was
3.64.
The respondent responded to the fifth statement on there is no enough support where the
majority (34.6%) of the respondents agreed with the statement, 27.5 % strongly agreed
with the statement, 22.9 % were neutral to the statement ,4.6% disagreed and 10.5%
strongly disagreed this statement. The mean for the statement was 3.83. The sixth
statement on the organization and procedures are not adapted to the new situation.
Majority (53.6%) of the respondent strongly agreed with this statement, 30.7% agreed
with the first statement, 9.2% were neutral to the statement, 7% disagreed and 5.9%
strongly disagreed this statement. The mean for the statement was 4.25.
The respondent responded to the seventh statement on the there is resistance to change.
The majority (66.7%) of the respondents strongly agreed with the statement, 17.0%
agreed with the statement, 4.6% were neutral to the statement, 1.3% disagreed and
10.5% strongly disagreed this statement. The mean for the statement was 4.28.
Majority (45.1%) of the respondents strongly agree with the eighth statements leaders are
responsible for the change process 25.5% agreed with the statement, 13.7% were neutral,
10.5% disagreed and 5.2% strongly disagreed this statement to the statement. The mean
for the statement was 3.95. For the ninths statement a majority (53.6%) of the

107
respondents agreed with the statement that leaders develop skill of employees to meet the
requirement of change 27.5 % strongly agreed with this statement, 8.5% were neutral to
the statement and 5.2% disagreed and 5.2% strongly disagreed this statement to the
statement. The mean for the statement was 4.33.
For the tenth and last statement on leaders seeks different perspectives before initiating
change a majority (45.1%) of the respondents agreed with the statement ,35.3% strongly
agreed with this statement, 13.7% were neutral to the statement and 5.9% strongly
disagreed. The mean for this statement was 4.04. The findings corroborate Achitsa
(2013) the change management process and the leadership recognized the employee‘s
efforts by making the work environment conducive for their participation.

108
Table 4.11 Change Management
i) Change Acceptance in Counties
The study sought to determine whether change easily accepted in the counties. The finds
are displayed in the figure 4.25 which show a majority (63%) of respondent indicated
that change is easily accepted in the county, a minority (37%) indicated that it is not.
Statements SD D N A SA Mean Std.
Dev.
Change leads to county
improvement
% 3.3 0 5.9 45.8 45.1 4.29 0.85
Change leads to county
sustainability
% 9.2 5.2 3.9 35.9 45.8 4.04 1.24
There is ownership of change
% 4.6 6.5 18.3 30.7 39.9 3.95 1.12
Change achievement is
difficult
% 4.6 8.5 18.3 36.6 32.0 3.83 1.11
There is no enough support % 10.5 4.6 22.9 34.6 27.5 3.64 1.23
Organization and procedures
are not adapted to the new
situation
% 5.9 7 9.2 30.7 53.6 4.25 1.06
There is resistance to change % 10.5 1.3 4.6 17.0 66.7 4.28 1.28
Leaders are responsible for the
change process
% 5.2 10.5 13.7 25.5 45.1 3.95 1.23
Leaders develop skill of
employees to meet the
requirement of change
% 5.2 5.2 8.5 53.6 27.5 3.93 1.02
Leaders seeks different
perspectives before initiating
change
% 5.9 0 13.7 45.1 35.3 4.04 1.01

109
Yes63%
No37%
Figure 4.22 Change Acceptances in Counties
ii) Leaders Good in Managing the Change Process
The study sought to determine whether the leaders good in managing the change process.
The finds are displayed in the figure 4.26which show a majority (76%) of respondent
indicated that leaders are good manager of the change process minority (24%) indicated
that they are not.
Yes76%
No24%
Figure 4.23 Leaders Good in Managing the Change Process

110
ii) Leaders able to Manage the Change in the Counties
The study sought to determine the extent to which leaders able to manage the change in
the counties. The findings are displayed in the figure 4.27 shows that a majority the
majority (52%) indicated to a great extent leaders are able to manage the change in the
counties, 19% were moderate extent, 17% responded to a very great extent 8% to a low
extent, finally 4% to no extent.
Figure 4.24 Leaders able to manage the change in the counties
4.7 Tests and Assumptions
This section focuses on the various statistical tests such as testing for normality, mulit-
collinearity, Heteroscedasticity, correlations of the study variables and testing for
outliers.

111
4.7.1 Testing for Outliers
An outlier refers to a case in which an extreme value on study variables that it
indefensibly controls statistics attained from an analysis (Tabachnick & Fidell, 2001).
Stated otherwise, an outlier is a score that is very unlike from the rest and therefore
biases the mean and standard deviation (Field, 2005). There are two various types of
outliers such as the multivariate and univariate outliers. While univariate outliers refer to
cases in with high values on one variable, whereas multivariate outliers are cases with a
rare combination of values on two or more variables (Tabachnick & Fidell, 2001).
Figure 4.25 Testing for Outliers

112
4.7.2 Testing for Normality
Normality testing is performed to identify whether a data set has been well-modeled by a
normal distribution. The test helps compute how possible a random variable which
underlies in a data set can be normally distributed. Study variables which are not
normally distributed distort the significance tests and relationships between the variables.
Razali and Wah (2011) assert when the normality assumption is not observed the
explanation and implications are not valid or reliable. The reason behind this is all
regression analysis undertakes normal distributions. To test for normality various test can
be used such as the Kolmogorov-Smirnov, Shapiro-Wilk, Anderson Darling and
Lilliefors.
Razali and Wah (2011) recommend the Shapiro-Wilk test which they assert is the
furthermost significant normality test. To identify the shape of distribution, Kolmogorov-
Smirnov and Shapiro-Wilk (K-S) statistics are used (Shapiro and Wilk, 1965) which
were calculated for each variable. The study adopted this test and the findings are
presented in Table 4.8.
The table 4.12 shows that the entire variables were significant. This violated the
assumptions of normality; the significance of the K-S test was expected due to the large
sample size (Pallant, 2007). By the variable having a p-value that is less than 0.05
indicated that data was a normal distribution.

113
Table 4.12 Kolmogorov-Smirnov and Shapiro-Wilk (K-S) statistics
The following are Q-Q Plot plots for study variables. The first figure 4.26 is the Q-Q
plots for the first variable transformational leadership.
Figure 4.26 Normal Q-Q Plot of transformational Leadership
The figure 4.27 is the Q-Q plots for the second variable transactional leadership.
Tests of Normality
Kolmogorov-Smirnova Shapiro-Wilk
Statistic df Sig. Statistic df Sig.
Transformational
Leadership .319 153 .000 .737 153 .000
Transactional Leadership .360 153 .000 .714 153 .000
Laissez-faire Leadership .294 153 .000 .782 153 .000
Autocratic Leadership .317 153 .000 .775 153 .000
Democratic Leadership .294 153 .000 .677 153 .000
a. Lilliefors Significance Correction

114
Figure 4.27 Normal Q-Q Plot of Transactional Leadership
The figure 4.28 is the Q-Q plots for the third variable Laissez-Faire leadership.
Figure 4.28 Normal Q-Q Plot of Laissez-Faire Leadership

115
The figure 4.29 is the Q-Q
plots for the fourth
variable Autocratic
leadership
Figure 4.29 Normal Q-Q Plot of Transactional Leadership
The figure 4.30 is the Q-Q plots for the fifth variable Democratic leadership.
Figure 4.30 Normal Q-Q Plot of Democratic Leadership
The figure 4.31 is the Q-Q plots standardized residuals for change.

116
Figure 4.31 Normal Q-Q Plot of Standardized Leadership
4.7.3 Multicollinearity
Multicollinearity refers to a statistical occurrence where two or more study variables are
witnessed in a multiple regression model as being highly correlated to each other. This
means that there is a likely hood that one of the variables is linearly projected from the
others with a significant degree of precision. The bigger the multicollinearity, the bigger
the standard errors. The Variance Inflation Factor (VIF) was used in the study to test for
linearity. If VIF value is above 10 this is indicative presence of damaging collinearity
(Newbert, 2008). Multicollinearity tests in this study were performed using the
regression analysis. All the values in the study were found to be below 5 which mean
that multicollinearity among the study variables was reduced therefore not damaging.
The values are presented in the coefficient tables.

117
Table 4.13 Multicollinearity
Coefficients
Model Collinearity Statistics
Tolerance
VIF
(1/ (1-R2)
VIF
(1-R2)
1
Transformational
Leadership .385 2.594
Transactional Leadership .769 1.300
Laissez-faire Leadership .889 1.125
Autocratic Leadership .402 2.486
Democratic Leadership .549 1.820
Organizational Culture .654 1.529
a) Dependent Variable: Change Management
From the results in the table above it is observed that there no multi-collinearity
problems, since the resulting tolerance values varies in the range from 0.385 to 0.769.
DeVaus (2002) assert that if the tolerance value of the variable is greater than 0.2, it
means this variable may not produce multi-collinearity. The VIF results in the table
above, which refer to the Variable Inflation factor, were ranging from 1.120 to 2.59, they
do not show a problem with multicollinearity since the VIFs are less than 10 (Hair et al.,
2010).
4.7.4 Heteroscedasticity
Following use of the ordinary least square (OLS) estimate assumptions, the error term of
the study should be homoscedastic. This means that the variance that the error term has
should be a constant, therefore the observation of each error term is gotten from the
identical probability distribution. Heteroscedasticity refers to the nonexistence of
homoscedasticity. Heteroscedasticity is a frequent challenge which occurs when using a
cross-sectional dataset. It is present when the error term outcomes are found in diverse
probability distributions (Halcoussis, 2005).
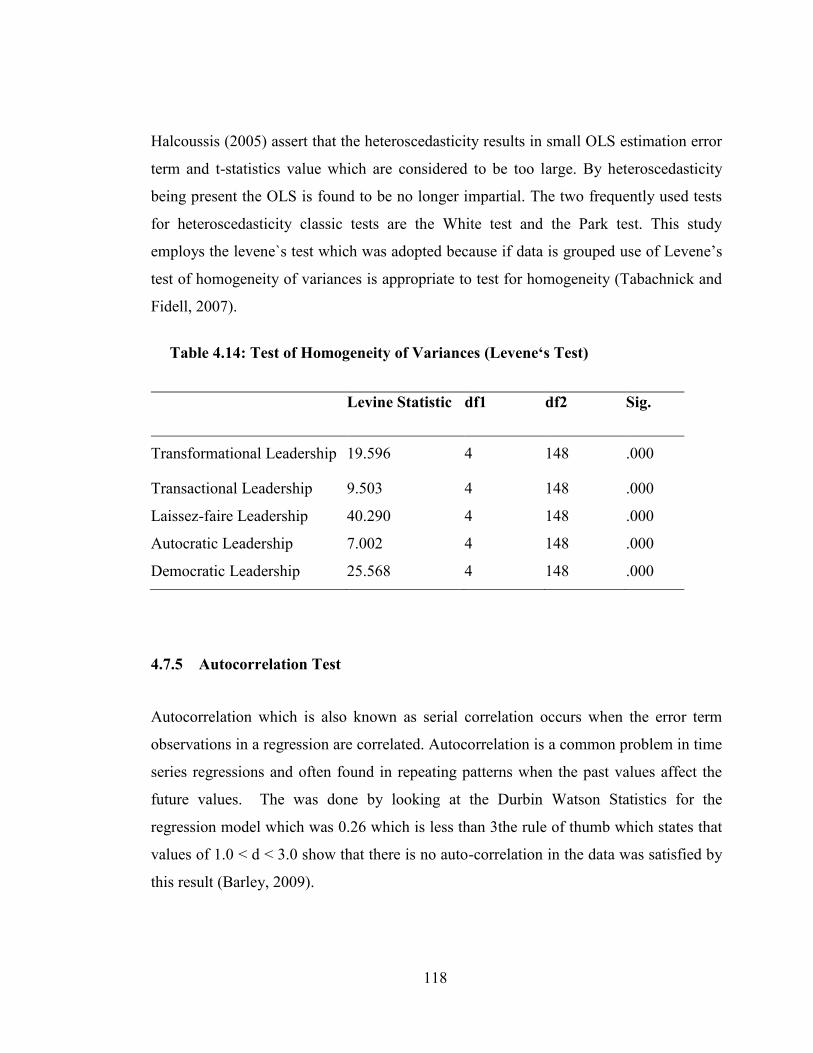
118
Halcoussis (2005) assert that the heteroscedasticity results in small OLS estimation error
term and t-statistics value which are considered to be too large. By heteroscedasticity
being present the OLS is found to be no longer impartial. The two frequently used tests
for heteroscedasticity classic tests are the White test and the Park test. This study
employs the levene`s test which was adopted because if data is grouped use of Levene‘s
test of homogeneity of variances is appropriate to test for homogeneity (Tabachnick and
Fidell, 2007).
Table 4.14: Test of Homogeneity of Variances (Levene‘s Test)
Levine Statistic df1 df2 Sig.
Transformational Leadership 19.596 4 148 .000
Transactional Leadership 9.503 4 148 .000
Laissez-faire Leadership 40.290 4 148 .000
Autocratic Leadership 7.002 4 148 .000
Democratic Leadership 25.568 4 148 .000
4.7.5 Autocorrelation Test
Autocorrelation which is also known as serial correlation occurs when the error term
observations in a regression are correlated. Autocorrelation is a common problem in time
series regressions and often found in repeating patterns when the past values affect the
future values. The was done by looking at the Durbin Watson Statistics for the
regression model which was 0.26 which is less than 3the rule of thumb which states that
values of 1.0 < d < 3.0 show that there is no auto-correlation in the data was satisfied by
this result (Barley, 2009).

119
4.7. 6 Exploratory Factor Analysis
Exploratory factor analysis is a statistical technique that is used to reduce data to a
smaller set of summary variables and to explore the underlining theoretical structure of
the phenomena. It is used to identify the structure of the relationship between the
variable and the respondent.
Table 4.15 Factor Matrix
4.7. 7 Confirmatory Factor Analysis
Confirmatory factor analysis (CFA) is a multivariate statistical procedure that is used to
test how well the measured variables represent the number of constructs. Confirmatory
factor analysis (CFA) and exploratory factor analysis (EFA) are similar techniques, but
in exploratory factor analysis (EFA), data is simply explored and provides information
about the numbers of factors required to represent the data. To conduct the confirmatory
factor analysis the study used the principle component analysis. The table 4.16 shows the
result of the KMO and Bartlett's Test for the analysis. From the table 4.16 the p-value is
less than 0.005 which makes it statistically significant.
Factor Matrix
Factor
1 2
Autocratic Leadership .864
Change Management .755
Transformational Leadership .737
Democratic Leadership .629
Organizational Culture .452
Transactional Leadership
Laissez-faire Leadership .638
Extraction Method: Principal Axis Factoring.
a. 2 factors extracted. 20 iterations required.

120
Table 4.16 KMO and Bartlett's Test
KMO and Bartlett's Test
Kaiser-Meyer-Olkin Measure of Sampling Adequacy. .746
Bartlett's Test of Sphericity
Approx. Chi-Square 341.143
df 21
Sig. .000
The table 4.17 shows the Communalities of study variable.
Table 4.17 Communalities
Communalities
Initial Extraction
Change Management 1.000 .720
Transformational Leadership 1.000 .653
Transactional Leadership 1.000 .444
Laissez-faire Leadership 1.000 .722
Autocratic Leadership 1.000 .758
Democratic Leadership 1.000 .594
Organizational Culture 1.000 .474
Extraction Method: Principal Component Analysis.

121
Table 4.18 Total Variance Explained
4.8 Inferential Statistics
4.8.1 Correlations of the Study Variables
Correlation matrix is used to conclude the degree in which the change in the value of a
variable is related with changes in another variable. Kothari and Garg (2014) assert that
the correlation coefficient should range from -1 to +1, with -1 representing a perfect
negative correlation, +1 representing a perfect positive correlation, and 0 illustrating no
correlation at all.
From the Table 4.18 showed that there was a significant positive correlation between
transformational leadership and Change management at an r value of 0.581, there was
also a positive correlation between transactional leadership and change management at
an r value of 0.463. There was a negative correlation between laissez-Faire Leadership
with change management at an r value of -0.286. There existed a significant positive
correlation between autocratic leadership and change management at 0.699. Finally, the
Total Variance Explained
Component Initial Eigenvalues Extraction Sums of Squared
Loadings
Rotation Sums
of Squared
Loadingsa
Total % of
Variance
Cumulative
%
Total % of
Variance
Cumulative
%
Total
1 3.049 43.555 43.555 3.049 43.555 43.555 2.979
2 1.315 18.792 62.347 1.315 18.792 62.347 1.468
3 .835 11.935 74.281
4 .743 10.617 84.899
5 .418 5.973 90.871
6 .390 5.576 96.448
7 .249 3.552 100.000
Extraction Method: Principal Component Analysis.

122
relationship between democratic leadership and change management had a positive
correlation at an r value of 0.549.
The results of the table show that a majority of the study variables had a positive effect
on the dependent variable. The result corroborates studies by Iqbal, Anwar and Haider
(2015) findings of a positive relationship between study variable and the independent
variables. The study findings also concurred with Kelly (2014) who also posted similar
finding which showed democratic leadership was important in effecting change
management.

123
Table 4.19 Correlations of the Study Variables
Change
Management
Transforma
tional
Leadership
Transact
ional
Leaders
hip
Laissez-
faire
Leadership
Autocratic
Leadership
Democratic
Leadership
Change
Management
Pearson
Correlation 1
Sig. (2-
tailed)
N 153
Transformation
al Leadership
Pearson
Correlation
.581**
1
Sig. (2-
tailed) .000
N 153 153
Transactional
Leadership
Pearson
Correlation
.463**
.433
** 1
Sig. (2-
tailed) .000 .000
N 153 153 153
Laissez-faire
Leadership
Pearson
Correlation
-.216**
-.059 -.163* 1
Sig. (2-
tailed) .007 .472 .045
N 153 153 153 153
Autocratic
Leadership
Pearson
Correlation
.699**
.680**
.352**
.061 1
Sig. (2-
tailed) .000 .000 .000 .457
N 153 153 153 153 153
Democratic
Leadership
Pearson
Correlation
.549**
.493**
.192* .179
* .648
** 1
Sig. (2-
tailed) .000 .000 .017 .027 .000
N 153 153 153 153 153 153

124
4.9 Regression analysis Before Moderation and after moderation
This section will include the regression equations for the study variables before
moderation. According to Hair, et al. (2010) regression is used for analyzing the
relations between one single dependent variable and a group of independent variables.
The main role of linear regression analysis is to determine whether or not a significant
relationship exists between the independent variables such as transformational
leadership, transactional leadership, laissez-faire leadership, democratic leadership and
autocratic leadership and dependent variables change management.
4.9.1 Transformational Leadership
The study went further to run regression analysis on the independent variable
(Transformational leadership) on the dependent variable (Change Management) in order
to determine the statistical significance in the relationship between the two variables. The
result of the regression analysis as displayed in table 4.18 which show that R=0.581 and
=0.338. This result indicates that a 33.8% of the changes in the dependent variable
(Change Management) can be attributed to units of change in transformational
leadership. The remainder 76.2% of the changes is explained by the other four variables.
The p-value showed that the model was statistically significant.
Table 4.20: Model Summary for Transformation leadership and Change
Model Summary
Model R R
Square
Adjusted R
Square
Std. Error of
the Estimate
Change Statistics
R Square
Change
F
Change
df1 df2 Sig. F
Change
1 .581a .338 .334 .85496 .338 77.084 1 151 .000
a. Predictors: (Constant), Transformational Leadership.
b. Dependent Variable: Change Management.

125
An F-test was performed so as to test the null hypothesis of the study on the first variable
that there is no significant relationship between the transformational leadership and
change management. The results of the analysis as shown in the Table 4.20 shows the
significance of the p value for the models is 0.000 which is less than the value of 0.05,
the F statistic = 77.084.The F-Critical was 3.8415.Since F calculated, 77.084,
was greater than F-Critical, 3.8415, the study concluded that the model fits well. This
shows that the null hypothesis should be rejected and is therefore determined that there is
a significant relationship between the transformational leadership on change
management. The above result shows that transformational leadership does have an
effect on change management due to the positive effect displayed in the regression
model. The study concurred with Carter et al (2010) who found that transformational
leadership had a positive effect on change in the company studied. Their study further
revealed the quality of relationships between leaders and employees mediated the
influence of transformational leadership on performance. This shows that
transformational leadership effect on change can lead to improved performance in
counties in Kenya.
Table 4.21 ANOVA Results for Transformation leadership and Change
ANOVAa
Model Sum of
Squares
df Mean Square F Sig.
1
Regression 56.345 1 56.345 77.084 .000b
Residual 110.374 151 .731
Total 166.719 152
a. Dependent Variable: Change Management.
b. Predictors: (Constant), Transformational Leadership.
The study went further to report the regression coefficients are as presented in Table
4.22. The result in Table 4.21 shows that the relationship between transformational
leadership and change management in counties in Kenya was significant at 5% level of

126
significance. The p-value was 0.000. The regression equation for this relationship was
Y=2.084+0.503 . More specifically, this result shows that a unit increase in
transformational leadership was associated with a .503-unit increase in change
management.
Table 4.22 Coefficient Transformation leadership and Change
Model Unstandardized
Coefficients
Standardized
Coefficients
t Sig.
B Std. Error Beta
1
(Constant) 2.084 .239 8.725 .000
Transformational
Leadership .503 .057 .581 8.780 .000
a. Dependent Variable: Change Management
Change Management in County Government = 2.084 + 0.503 Transformational
Leadership
The findings were consistent Mwangi and Kwasira (2015) role of transformational
leadership on organizational change in selected public secondary schools in Nakuru
north sub county, Kenya with the study revealed that transformational leadership indeed
plays a role in organizational change in that inspirational motivation which is one of its
core elements influenced organizational change in the aforesaid schools. They were also
consistent with Datche and Mukulu (2015) in their study on the effects of
transformational leadership on employee engagement.
The findings revealed that transformational leadership though positively related to
employee engagement in general; the leader behaviors of intellectual stimulation and
individualized consideration of supervisor were found to be positive and moderately
related to employee engagement.
The effect of transformational behavior was particularly striking in the case of changes
that are reactive, transformative, and that will change the character of the organization.

127
Suada and Dževad (2014) study on the relevance of transformational leadership in
shaping employee attitudes towards organizational change. The empirical research
presented in the paper showed that the effect of transformational behavior was
particularly striking in the case of changes that are reactive, transformative, and that will
change the character of the organization.
4.9.2 Transactional Leadership
The study went further to run regression analysis on the independent variable
(Transactional leadership) on the dependent variable (Change Management) in order to
determine the statistical significance in the relationship between the two variables. The
result of the regression analysis as displayed in table 4.19 which show that R=0.463 and
=0.215. This result indicates that a 21.5% of the changes in the dependent variable
(Change Management) can be attributed to units of change in transactional leadership.
The remainder 78.5% of the changes is explained by the other four variables.
Table 4.23: Model Summary for Transactional Leadership and Change
Management
Model Summary
Model R R Square Adjusted
R Square
Std. Error
of the
Estimate
Change Statistics
R Square
Change
F
Change
df1 df2 Sig. F
Change
1 .463a .215 .209 .93121 .215 41.260 1 151 .000
a. Predictors: (Constant), Transactional Leadership.
b. Dependent Variable: Change Management.
An F-test was performed so as to test the null hypothesis of the study on the first variable
that there is no significant relationship between the transactional leadership and change
management. The results of the analysis as shown in the Table 4.23 shows the F –test for
this factor in the regression model was found to be significant F statistic = 41.260 and the
significance of the p value for the models is 0.000 which is less than the value of 0.05.

128
The F-Critical was 3.8415.Since F calculated, 41.260, was greater than F-
Critical, 3.8415, the study concluded that the model fits well. This shows that the null
hypothesis should be rejected and is therefore determined that there is a significant
relationship between the transactional leadership on change management.
Table 4.24 ANOVA Results for Transactional leadership and Change Management
ANOVAa
Model Sum of Squares df Mean Square F Sig.
1
Regression 35.779 1 35.779 41.260 .000b
Residual 130.940 151 .867
Total 166.719 152
a. Dependent Variable: Change Management.
b. Predictors: (Constant), Transactional Leadership.
The study went further to report the regression coefficients are as presented in Table
4.25. The result in Table 4.24 shows that the relationship between transactional
leadership and change management in counties in Kenya was significant at 5% level of
significance.
The p-value was 0.000. The regression equation for this relationship was Y=2.746+
0.339 .More specifically, this result shows that a unit increase in transactional
leadership was associated with a .339 unit increase in change management.

129
Table 4.25 Coefficient Transactional leadership and Change Management
Coefficientsa
Model Unstandardized
Coefficients
Standardized
Coefficients
t Sig.
B Std. Error Beta
1
(Constant) 2.746 .223 12.331 .000
Transactional
Leadership .339 .053 .463 6.423 .000
a. Dependent Variable: Change Management
Change Management in County Government = 2.746+ 0.339 Transactional
Leadership
The study corroborated findings by Dana and Bing (2015) study on the effective
leadership in managing NPM-based change in the public sector. The findings also
corroborated with Komor (2012) in his study the relationship between transactional and
transformational leadership and organizational change found similar finding of
transactional leadership having an influence on the change management. Moore (2012)
in her study explored the nature of leadership styles in women and men.
Multifactor Leadership Questionnaire was administered as a means of objective
assessment of the leadership style of various professionals. The study showed that
transactional leadership did affect change when employed in the workforce by both men
and women.
4.9.3 Laissez Faire Leadership
The study went further to run regression analysis on the independent variable (Laissez-
Faire Leadership) on the dependent variable (Change Management) in order to determine
the statistical significance in the relationship between the two variables. The result of the

130
regression analysis as displayed in table 4.26 which show that R=0.216 and =0.042.
This result indicates that a 4.7% of the changes in the dependent variable (Change
Management) can be attributed to units of change in Laissez Faire leadership. The
remainder 95.3% of the changes is explained by the other four variables.
Table 4.26: Model Summary for Laissez-Faire Leadership and Change
Management
An F-test was performed so as to test the null hypothesis of the study on the first variable
that there is no significant relationship between the Laissez-Faire Leadership and change
management. The results of the analysis as shown in the Table 4.23shows the F –test for
this factor in the regression model was found to be significant F statistic = 7.388and the
significance of the p value for the models is 0.007 which is less than the value of 0.05.
The F-Critical was 3.8415.Since F calculated, 7.388, was greater than F-
Critical, 3.8415, the study concluded that the model fits well. This shows that the null
hypothesis should be rejected and is therefore determined that there is a significant
relationship between the Laissez-Faire Leadership on change management.
Model Summaryb
Model R R Square Adjusted R
Square
Std. Error
of the
Estimate
Change Statistics
R Square
Change
F
Change
df1 df2 Sig. F
Change
1 .216a .047 .040 1.02596 .047 7.388 1 151 .007
a. Predictors: (Constant), Laissez-faire Leadership.
b. Dependent Variable: Change Management.

131
Table 4.27 ANOVA Results for Laissez-Faire Leadership and Change
Management
ANOVAa
Model Sum of Squares df Mean Square F Sig.
1
Regression 7.777 1 7.777 7.388 .007b
Residual 158.942 151 1.053
Total 166.719 152
a. Dependent Variable: Change Management.
b. Predictors: (Constant), Laissez-faire Leadership.
The study went further to report the regression coefficients are as presented in Table
4.24. The result in Table 4.24 shows that the relationship between Laissez-Faire
Leadership and change management in counties in Kenya was significant at 5% level of
significance. The p-value was 0.000. The regression equation for this relationship was
Y=4.647-0.299 . More specifically, this result shows that a unit decrease in laissez-
Faire leadership was associated with a -0.299-unit increase in change management.
Table 4.28 Coefficient for Laissez-Faire Leadership and Change Management
Coefficientsa
Model Unstandardized
Coefficients
Standardized
Coefficients
t Sig.
B Std. Error Beta
1
(Constant) 4.647 .221 21.070 .000
Laissez-faire
Leadership -.299 .110 -.216 -2.718 .007
a. Dependent Variable: Change Management

132
Change Management in County Government = 4.647-0.299 Laissez-Faire
Leadership
The findings showed that Laissez-Faire Leadership had a negative effect on change
management this corroborated by Edwards and Gills (2012) Transformational
Leadership across Hierarchical Levels in UK Manufacturing Organizations. This paper
reports an empirical study of the effectiveness of transformational, transactional and
laissez-faire leadership across hierarchical levels in manufacturing organizations in the
UK. Laissez-faire leadership is ineffective at all hierarchical levels.
4.9.4 Democratic Leadership
The study went further to run regression analysis on the independent variable
(Democratic leadership) on the dependent variable (Change Management) in order to
determine the statistical significance in the relationship between the two variables. The
result of the regression analysis as displayed in table 4.25 which show that R=0.549and
=0.302. This result indicates that a 30.2% of the changes in the dependent variable
(Change Management) can be attributed to units of change in democratic leadership. The
remainder 69.8% of the changes is explained by the other four variables.
Table 4.30: Model Summary for Democratic Leadership and Change
Management
Model Summaryb
Model R R
Square
Adjusted R
Square
Std. Error of
the Estimate
Change Statistics
R
Square
Change
F
Change
df1 df2 Sig. F
Change
1 .549a .302 .297 .87804 .302 65.252 1 151 .000
a. Predictors: (Constant), Democratic Leadership.
b. Dependent Variable: Change Management.

133
An F-test was performed so as to test the null hypothesis of the study on the first variable
that there is no significant relationship between the democratic leadership and change
management. The results of the analysis as shown in the Table 4.26 shows the
significance of the p value for the models is 0.000 which is less than the value of 0.05, F
statistic = 65.252. The F-Critical was 3.8415.Since F calculated, 65.252, was
greater than F-Critical, 3.8415, the study concluded that the model fits well. This shows
that the null hypothesis should be rejected and is therefore determined that there is a
significant relationship between the democratic leadership on change management.
Table 4.32 ANOVA Results for Democratic Leadership and Change Management
ANOVAa
Model Sum of Squares df Mean Square F Sig.
1
Regression 50.306 1 50.306 65.252 .000b
Residual 116.413 151 .771
Total 166.719 152
a. Dependent Variable: Change Management.
b. Predictors: (Constant), Democratic Leadership.
The study went further to report the regression coefficients are as presented in Table
4.27. The result in Table 4.27 shows that the relationship between democratic leadership
and change management in counties in Kenya was significant at 5% level of
significance. The p-value was 0.000. The regression equation for this relationship was
Y=1.416+ 0.627 . More specifically, this result shows that a unit increase in democratic
leadership was associated with a 0.627-unit increase in change management.

134
Table 4.33 Coefficient for Democratic Leadership and Change Management
Coefficientsa
Model Unstandardized
Coefficients
Standardized
Coefficients
t Sig.
B Std. Error Beta
1 (Constant) 1.416 .339 4.180 .000
Democratic Leadership .627 .078 .549 8.078 .000
a. Dependent Variable: Change Management.
Change Management in County Government = 1.416+ 0.627 Democratic
Leadership
The findings Tandoh (2011) corroborated with finding from studies from which posted
similar results where democratic leadership had an effect on change management. Kelly
(2014) also posted similar finding which showed democratic leadership was important in
effecting change management. Iqbal, Anwar and Haider (2015) concluded democratic
leadership should be used when organization have competent and talented team
members, when company or department planning meetings for improvements, when
company conducting evaluation sessions, when you are motivating top-performers in an
organization and when you need of innovative and creative work.
4.9.5 Autocratic Leadership
The study went further to run regression analysis on the independent variable (Autocratic
Leadership) on the dependent variable (Change Management) in order to determine the
statistical significance in the relationship between the two variables. The result of the
regression analysis as displayed in table 4.28 which show that R=0.699 and =0.48.9.
This result indicates that a 48.9 % of the changes in the dependent variable (Change
Management) can be attributed to units of change in autocratic leadership. The remainder
51.1% of the changes is explained by the other four variables.

135
Table 4.35: Model Summary for Autocratic Leadership and Change Management
Model Summary
Model R R Square Adjusted R
Square
Std. Error
of the
Estimate
Change Statistics
R Square
Change
F
Change
df1 df2 Sig. F
Change
1 .699a .489 .485 .75144 .489 144.253 1 151 .000
a. Predictors: (Constant), Autocratic Leadership.
An F-test was performed so as to test the null hypothesis of the study on the first variable
that there is no significant relationship between the Autocratic Leadership and change
management. The results of the analysis as shown in the Table 4.29 shows the
significance of the p value for the models is 0.000 which is less than the value of 0.05, F
statistic = 144.253.
The F-Critical was 3.8415.Since F calculated, 144.253, was greater than F-
Critical, 3.8415, the study concluded that the model fits well. This shows that the null
hypothesis should be rejected and is therefore determined that there is a significant
relationship between the Autocratic Leadership on change management.
Table 4.36 ANOVA Results for Autocratic Leadership and Change Management
ANOVAa
Model Sum of Squares df Mean Square F Sig.
1
Regression 81.455 1 81.455 144.253 .000b
Residual 85.264 151 .565
Total 166.719 152
a. Dependent Variable: Change Management.
b. Predictors: (Constant), Autocratic Leadership.

136
The study went further to report the regression coefficients are as presented in Table
4.30. The result in Table 4.30 shows that the relationship between autocratic Leadership
and change management in counties in Kenya was significant at 5% level of
significance. The p-value was 0.005. The regression equation for this relationship was
Y=1.182+0.727 . More specifically, this result shows that a unit increase in autocratic
leadership was associated with a 0.727-unit increase in change management.
Table 4.37 Coefficient for Autocratic Leadership and Change Management
Change Management in County Government = 1.182+ 0.727Autocratic Leadership
The study results on authoritative leadership corroborated with Awan and Mahmood
(2010) and Iqbal, Anwar and Haider (2015) who found authoritative leadership to have
effect on the employees in their respective studies. Iqbal, Anwar and Haider (2015)
concluded that autocratic leadership should be used when new employees are unfamiliar
and don‘t have sufficient know how about their jobs, If the employee constantly
misusing their authority, when company rules are violated by employees when the sole
person responsible for a decision making and implementing.
Coefficientsa
Model Unstandardized
Coefficients
Standardized
Coefficients
t Sig.
B Std. Error Beta
1
(Constant) 1.182 .250 4.735 .000
Autocratic
Leadership .727 .061 .699 12.011 .000
a. Dependent Variable: Change Management.

137
4.9.6 Overall Regression Model before Moderation
The study went further to run regression analysis on the independent variables
(transformational leadership, transactional leadership, laissez-faire leadership,
democratic leadership and autocratic leadership) on the dependent variable (Change
Management) in order to determine the statistical significance in the relationship
between the two variables. The result of the regression analysis as displayed in table 4.37
which show that R=0.790 and =0.624. This result indicates that 62.4% of the changes
in the dependent variable (Change Management). The remainder 37.6% of the changes
are explained by other factors not captured in the study.
Table 4.38: Model Summary for Overall Regression Model before Moderation
The results of the analysis as shown in the Table 4.38 shows the significance of the p
value for the models is 0.000 which is less than the value of 0.000, the F statistic =
48.731. The F-Critical was 3.8415.Since F calculated, 48.731, was greater than
F-Critical, 3.8415, the study concluded that the model fits well. This shows that the
model was highly significant.
Model Summaryb
Model R R
Square
Adjusted
R Square
Std. Error
of the
Estimate
Change Statistics Durbin-
Watson R Square
Change
F
Change
df1 df2 Sig. F
Change
1 .790a .624 .611 .65327 .624 48.731 5 147 .000 .260
a. Predictors: (Constant), Democratic Leadership, Laissez-faire Leadership, Transactional
Leadership, Transformational Leadership, Autocratic Leadership.
b. Dependent Variable: Change Management.

138
Table 4.39 ANOVA Results for Overall Regression Model before Moderation
ANOVAa
Model Sum of Squares df Mean Square F Sig.
1
Regression 103.984 5 20.797 48.731 .000b
Residual 62.735 147 .427
Total 166.719 152
a. Dependent Variable: Change Management.
b. Predictors: (Constant), Democratic Leadership, Laissez-faire Leadership,
Transactional Leadership, Transformational Leadership, Autocratic Leadership.
The study went further to report the regression coefficients are as presented in Table
4.40. The result in Table 4.39 shows that the relationship between study variables and
change management in counties in Kenya was significant at 5% level of significance.
The p-value was 0.000. The regression equation for this relationship was Y=0.944
+0.051 +0.140 -0.347 +0.474 +0.266 .
Table 4.40 Coefficient for Overall Regression Model before Moderation
Coefficientsa
Model Unstandardized
Coefficients
Standardized
Coefficients
t Sig.
B Std. Error Beta
1
(Constant) .944 .296 3.185 .002
Transformational
Leadership .051 .063 .059 .813 .418
Transactional
Leadership .140 .042 .192 3.353 .001
Laissez-faire
Leadership -.347 .073 -.251 -4.743 .000
Autocratic Leadership .474 .083 .455 5.708 .000
Democratic Leadership .266 .078 .233 3.419 .001
a. Dependent Variable: Change Management.

139
Change Management in County Government=1.070 + 0.051 Transformational
leadership+ 0.140 Transactional leadership- 0.347 Laissez-Faire leadership+ 0.474
Autocratic Leadership+ 0.266 Democratic Leadership
4.9.7 Moderated Regression
The study went further to run regression analysis on the independent variables
(transformational leadership, transactional leadership, laissez-faire leadership,
democratic leadership and autocratic leadership) on the dependent variable (Change
Management) in order to determine the statistical significance in the relationship
between the two variables.
The study moderated the regression through the use the moderating variable
organizational culture. From table 4.40, Model 1 shows that R = .790, R² = .624. The
value of R² indicates that 62.4% of the variance in the change management in county
government can be accounted study variables. Model 2 in table 4.40, shows the results
after the moderation which included the moderating variable organizational culture was
added into the model. Table 4.41 also indicates that the inclusion of the interaction term
resulted into an R =0 .792, R² = 0.628. This represents a 62.8% after moderation.
Table 4.41: Model Summary for Moderated Regression
Model Summary
Model R R
Square
Adjusted
R Square
Std. Error
of the
Estimate
Change Statistics Durbin-
Watson R
Square
Change
F
Change
df1 df2 Sig. F
Change
1 .790a .624 .611 .65327 .624 48.731 5 147 .000
2 .792b .628 .613 .65176 .004 1.683 1 146 .197 .258
a. Predictors: (Constant), Democratic Leadership, Laissez-faire Leadership,
Transactional Leadership, Transformational Leadership, Autocratic Leadership.
b. Predictors: (Constant), Democratic Leadership, Laissez-faire Leadership,
Transactional Leadership, Transformational Leadership, Autocratic Leadership,
*Organizational Culture
c. Dependent Variable: Change Management.

140
The results of the analysis as shown in the Table 4.41 shows the significance of the p
value for the models is 0.000 which is less than the value of 0.05, the F statistic =
41.078. The F-Critical was 3.8415.Since F calculated, 41.078, was greater than
F-Critical, 3.8415, the study concluded that the model fits well. This shows that the
model is highly significant at 0.005 since the p-value is 0.000.
Table 4.42 ANOVA Results for Moderated Regression
The study went further to report the result of the table 4.15 which showed the coefficient
where first model equation Y=0.944 +0.051 +0.140 -0.347 +0.474 +0.271
+0.266 which is a significantly fit. The second model equation is Y=1.070 +0.092
+0.133 -0.331 +0.474 +0.271 +0.271 -0.082 .
ANOVAa
Model Sum of Squares df Mean Square F Sig.
1
Regression 103.984 5 20.797 48.731 .000b
Residual 62.735 147 .427
Total 166.719 152
2
Regression 104.699 6 17.450 41.078 .000c
Residual 62.020 146 .425
Total 166.719 152
a. Dependent Variable: Change Management.
b. Predictors: (Constant), Democratic Leadership, Laissez-faire Leadership, Transactional
Leadership, Transformational Leadership, Autocratic Leadership
c. Predictors: (Constant), Democratic Leadership, Laissez-faire Leadership, Transactional
Leadership, Transformational Leadership, Autocratic Leadership, *Organizational Culture.

141
Table 4.43 Coefficient for Moderated Regression
Coefficientsa
Model Unstandardized
Coefficients
Standardized
Coefficients
t Sig.
B Std. Error Beta
1
(Constant) .944 .296 3.185 .002
Transformational
Leadership .051 .063 .059 .813 .418
Transactional Leadership .140 .042 .192 3.353 .001
Laissez-faire Leadership -.347 .073 -.251 -4.743 .000
Autocratic Leadership .474 .083 .455 5.708 .000
Democratic Leadership .266 .078 .233 3.419 .001
2
(Constant) 1.070 .311 3.438 .001
Transformational
Leadership .092 .070 .107 1.310 .192
Transactional Leadership .133 .042 .182 3.167 .002
Laissez-faire Leadership -.331 .074 -.239 -4.457 .000
Autocratic Leadership .474 .083 .455 5.721 .000
Democratic Leadership .271 .078 .237 3.483 .001
*Organizational Culture -.082 .063 -.081 -1.297 .197
a. Dependent Variable: Change Management
Change Management in County Government=1.070 + 0.92 Transformational leadership+
0.133 Transactional leadership- 0.331 Laissez-Faire leadership+ 0.474 Autocratic
Leadership+ 0.271 Democratic Leadership-0.082 Organizational Culture

142
4.10 Model Optimization
From the findings displayed in the table 4.36 shows the model optimization and the
result of the hypothesis testing. The purpose of this model optimization was to act as a
guide to the forming of the new conceptual model (revised conceptual framework). The
model rearranges the constructs of each variable based on the magnitude of their
coefficients of determination with the variable. The model also orders the variables based
on the extent to which each explains the variability in the dependent variable. The model
comprised of the significant variables; transformational leadership, transactional
leadership, laissez faire leadership, democratic leadership and autocratic leadership as
shown in figure 4.32.
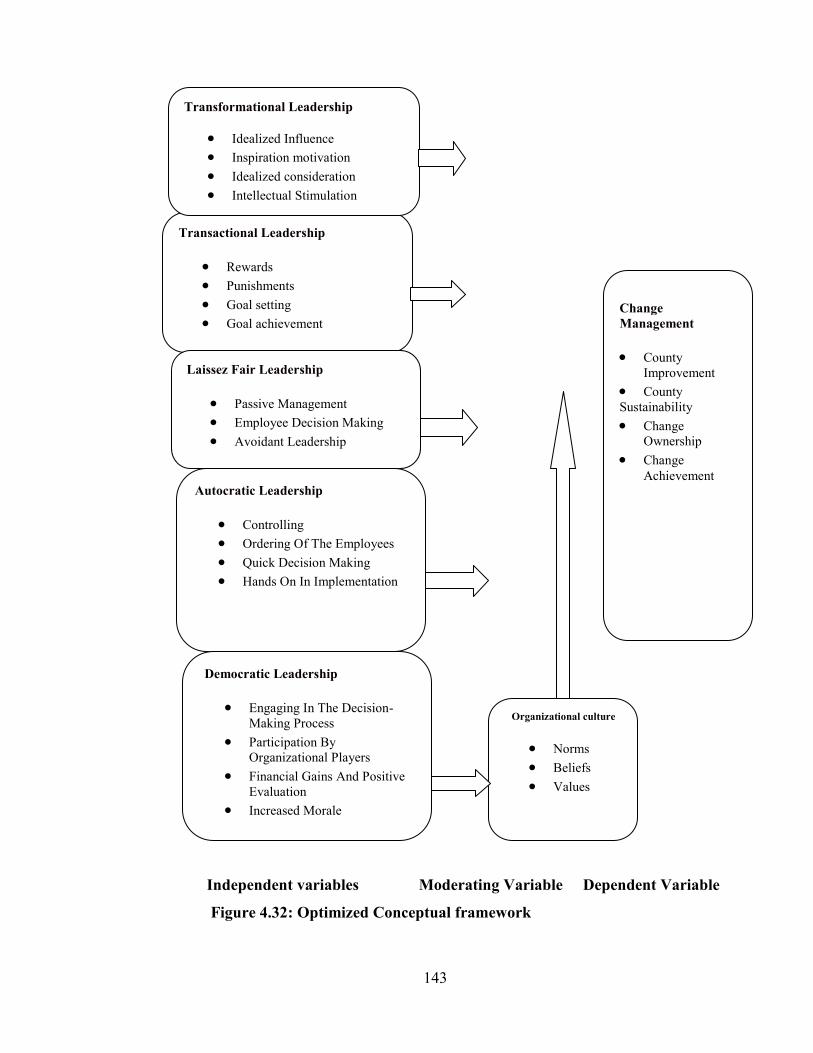
143
Independent variables Moderating Variable Dependent Variable
Figure 4.32: Optimized Conceptual framework
Transactional Leadership
Rewards
Punishments
Goal setting
Goal achievement
Laissez Fair Leadership
Passive Management
Employee Decision Making
Avoidant Leadership
Change
Management
County
Improvement
County
Sustainability
Change
Ownership
Change
Achievement Autocratic Leadership
Controlling
Ordering Of The Employees
Quick Decision Making
Hands On In Implementation
Democratic Leadership
Engaging In The Decision-
Making Process
Participation By
Organizational Players
Financial Gains And Positive
Evaluation
Increased Morale
Transformational Leadership
Idealized Influence
Inspiration motivation
Idealized consideration
Intellectual Stimulation
Organizational culture
Norms
Beliefs
Values

144
Table 4.44 Hypothesis Results
See Appendix IV
All the Null hypotheses were rejected since all the P-values were less than 0.05. The
results were as a result of the F-test performed when doing the regression analysis in the
tables 4.19, 4.22, 4.25, 4.28, 4.31 and 4. 34.

145
CHAPTER FIVE
SUMMARY, CONCLUSION AND RECOMMENDATIONS
5.1 Introduction
In this chapter the summary of the findings, the conclusion and the recommendation of
the study on the effect of leadership styles on change management in selected county
governments in Kenya, the dependent variable change management and the independent
variables transformational leadership style, transactional leadership style, laissez-faire
leadership style, autocratic leadership and democratic leadership style. The study also
had a moderating variable organizational culture. This chapter also has the suggestion for
further research in order to shed light on the key areas which need more research to be
conducted.
5.2 Summary of Findings
The overall objective of this study was to assess the effect of leadership styles on change
management in selected county governments in Kenya. The study collected and
presented data in chapter four with specific attention given to the objectives and research
questions of the study which were used as units of analysis. Theoretical and empirical
literature was used to compare the results of the study with previous studies. The study
targeted the county managers and employees in Kiambu, Nairobi,Machakos and Kajiado
Target population of 501 was used to derive the sample size of 218 using the formula
derived from Zikmund, Babin, Carr and Griffin (2014). A pilot study was conducted to
test reliability of the research instrument using a sample of 10 employees who were
selected randomly. In line with the findings presented and discussed in the previous
chapter, the study derived the following findings.

146
5.2.1 To establish the effect of transformational leadership on the change
management in selected county governments in Kenya.
From the descriptive result on transformational leadership and change management the
findings showed that majority of the respondents agreed with the statement. From the
findings leaders were seen to influence the followers through transformation leadership.
It was also determined that the leaders did influence the followers to accept the change
within the county. It was determined that leaders did use intellectual stimulation to make
change possible within the county. The leaders were also seen to be able to articulate
clearly the future in the county when performing the change management in the county.
The leaders were also determined to instill pride in staff in the change management
process. Leaders were determined to build genuine trust between them and followers
which shows transformational leadership. Leaders were also seen to adjust the culture to
meet the long term needs for change therefore helping achieve change. It was determined
that leaders did develop skill of employees to meet the required skill to make change
management possible. It was determined that leaders did seek different perspectives
before initiating change which helped in getting various inputs.
The inferential analysis and findings showed that there is a positive significant linear
relationship between transformational leadership and change management. The study
showed that transformational leadership, plays a significant role in determining change
management, and thus rejects the null hypothesis that transformational leadership does
not influence change management. The empirical research presented in the paper showed
that the effect of transformational behavior was particularly striking in the case of
changes that are reactive, transformative, and that will change the character of the
organization.

147
5.2.2 To Assess the Effect of Transactional Leadership on the Change
Management in Selected County Governments in Kenya.
The study was able to determine from the finding that leader‘s offer rewards for
achievement of change. The findings also showed that the leader does use punishment
when change objectives are not achieved. From the findings the leader is also determined
to set clear goals for the change management process. The findings also showed that the
leader is responsible for goal achievement in the change management in the county. The
findings showed that leaders motivated followers towards achievement of change in the
implementation of change process. The findings were able to determine that leaders were
able to instill pride in the employees when working towards the change management in
the counties. The transactional leadership process was determined to affect the county
change process through ensuring change achievement in the county. The study was able
to determine that the success of the change depends on whether the leader has the power
to ensure that change takes place. The leader was seen to be someone who develops a
vision and sells the vision to the followers. The findings showed leaders were determined
to interest creating the conducive environment for change.
The inferential analysis and findings showed that there is a positive significant linear
relationship between transactional leadership and change management. The study
showed that transactional leadership plays a significant role in determining change
management. The null hypothesis was rejected since it was determined that transactional
leadership did have an influence on change management in the counties.
5.2.3 To determine the effect of laissez-faire leadership on the change
management in selected county governments in Kenya.
The study did a descriptive analysis to determine the effect of Laissez Faire Leadership
on the change management. The findings showed that leaders did not avoid getting
involved when important issues arise; they are more involved in the change process.
This showed that leaders did not use the laissez Faire Leadership style in the counties.

148
the study showed that respondents disagreed with the statements that leaders let others
make decisions, leaders delaying in responding to urgent questions of the respondents,
leaders use passive management, the leader makes no attempt to help in solving
problems, the leaders renounce their leadership. leaders shun organizational duties,
leaders assume that anything that comes to the county administration and leaders don‘t
concern themselves in the stimulation of subordinates. From the findings above showed
that leadership.
The inferential analysis and findings showed that there is a negative significant linear
relationship between laissez faire leadership and change management. The study shows
that laissez faire leadership plays a significant role in determining change management.
From the findings the study rejected the null hypothesis that Laissez Faire Leadership did
not have an influence the change management in counties. The findings showed that
Laissez-Faire Leadership had a negative effect on change management.
5.2.4 To Assess the Effect of Autocratic Leadership on the Change Management
in Selected County Governments in Kenya.
The study did a descriptive to determine the effect of autocratic leadership on the change
management. The findings were able to determine that the leader is willing do whatever
is necessary to accomplishment of the goal and will do anything to move towards
ensuring that goal has been achieved. The study was able to determine that the leader‘s
behavior focuses on taking control and leader makes order of the employees without
offering much clarification and dialogue. From the findings show the leader controls the
employees through threats and reprimand and showed that leadership style offers various
advantages such as swiftness of activity completion ensuring that projects are easily
completed. The study determined that the leader is hands on in implementation of
projects; leaders are swift in handling activities and leader‘s direct staff‘s attention
towards failures to meet standards.

149
The findings showed that leader used punishment in case of failure and autocratic
leadership was seen to be an effective leadership style. The computed Cronbach‘s Alpha
of the items of autocratic leadership and change management showed a high reliability of
the study instrument and data. The inferential analysis and findings showed that there is a
positive significant linear relationship between autocratic leadership and change
management. The study concludes that autocratic leadership plays a significant role in
determining change management. The study rejected the null hypothesis.
5.2.5 To Establish the Effect of Democratic Leadership on the Change
Management in Selected County Governments in Kenya.
The study conducted a descriptive analysis to determine the effect of democratic
leadership on the change management. From the findings it was determined that leaders
encourage and support their employees to engage in the decision-making. The findings
also showed that leader encourages participation from organizational players and
involves them in decision-making. It was determined that leader ensures employees ideas
are taken seriously. The findings show that the leader increase morale for change to take
place majority of the respondent strongly agreed with this statement. The findings
showed that leadership style is ideal for change management. This leadership Style was
shown to be instrumental on the improvement in labor relations, employee commitment,
increased organizational allegiance, occupational contentment, apparent support,
organizational ownership behavior, and employee performance. With this leadership
style the leader is able to keep followers updated on change process. The leaders were
seen to understand the followers concerns. There were also periodical meetings where
the leader listened to inputs by followers. This leadership style was seen as an effective
leadership style by the respondents. The computed Cronbach‘s Alpha of the items of
democratic leadership and change management showed a high reliability of the study
instrument and data. The inferential analysis and findings showed that there is a positive
significant linear relationship between democratic leadership and change management.

150
The study showed that democratic leadership plays a significant role in determining
change management. The study rejected the null hypothesis.
5.2.6 To examine the moderating effect of organization culture on the relationship
between leadership styles and change management in selected county governments
in Kenya.
The study used descriptive analysis to determine the effect of organizational culture on
the change management. The study found out from the findings that county has norms
that help change. The study was able to further determine that county has beliefs that
help change. The findings showed that county values influences leadership styles and
county members are collaborative with change management process.
The county culture was seen to affect leadership and it was established that there is a
culture of refusing change. County leaders were found to have a way of influencing
county members into accepting change. It was found that change in the county is
communicated early and county members refused meaningless change. The computed
Cronbach‘s Alpha of the items of organizational culture and change management showed
a high reliability of the study instrument and data. The inferential analysis and findings
showed that there is a positive significant linear relationship between organization
culture on the relationship between leadership styles and change management. The study
concludes that organizational culture does, plays a significant role in determining change
management. The study rejected the null hypothesis.
5.2.7 Change Management
The study used descriptive analysis to determine the change management. From the
findings it was determined that change leads to county improvement and change leads to
county sustainability. It was also determined that there is ownership of change and
change achievement was seen as a difficult endeavor. It was determined that there is no

151
enough support and that the organization and procedures are not adapted to the new
situation.
It was identified that the there is resistance to change. The leaders were found to be
responsible for the change process and that leaders had to develop employee‘s skill to
meet the requirement of change. The leaders were also found to seek different
perspectives before initiating change a majority of the respondents agreed with the
statement.
Findings on correlation and regression analyses indicated that there was a significant
positive association between county culture and change management. Therefore, county
culture as a moderating variable, was found to be statistically significant in explaining
the effect of leadership styles on change management in selected counties in Kenya.
5.3 Conclusion of the Study
Based on the study findings, the study concluded that leadership styles did have an
influence on change management in selected counties in Kenya. The study concluded
that transformational leadership style did have a significant influence on the change
management in county governments in Kenya. This was seen from the study findings
which showed that transformational leadership caused change management to be easier
in the county governments.
The study further concluded that transactional leadership style did influence the change
management in Kenyan counties. This is based on the findings of this study. The study
concluded that laissez-faire leadership had an influence on the change management in
counties in Kenya. This conclusion is based on the findings of this study.
The study concluded that democratic leadership style had an influence on the change
management in county governments. This conclusion is based on the findings of the

152
study. The study concluded that autocratic leadership style had an influence on the
change management of counties; this conclusion is based on the findings of this study.
The study concluded that organization culture had a moderating effect on the relationship
between leadership styles and change management in selected county governments in
Kenya. This conclusion is based on the findings of this study.
5.4 Recommendation of the Study
Based on the conclusions made on this study the study was seen to provide important
insights on leadership and change management. Therefore, the results of this study are of
interest to the county leaders, policy makers, civil society and development partners. The
study made the following recommendations.
Transformational leadership was seen to have an effect on change management, the
study recommends that county managers and leaders should use this style to mold and
build employees into accepting change rather than reacting to the environment. The
County leaders should use this leadership style because it motivates followers into
accomplishing organizational goals rather than focusing on their own individual goals
and providing guidelines for the alignment of their goals to the organization. Leaders
need to continue inspiring and motivating employees into accepting change and giving
them a reason to accept the change. The study recommends that the leader helps the
employees into coming up with new ideas through creativity and innovation to help the
organization to realize its growth through understanding a ever changing internal and
external environment.
Transactional leadership style has an effect on the change management. County leaders
can employ this leadership style when there is a time frame since it helps achieve
objectives in a quick efficient manner. The study recommends that leaders should use all
available resources to motivate employees into accepting change in the organization.
leaders need to do more goal setting and using this leadership style to achieve set goals.

153
Transactional leaders have been identified to establish performance requirements and
make sure they are achieved within a given time frame, limit the contentment of workers
and create low amounts of employee commitment and satisfaction.
This leadership style helps to develop a vision, sells the vision to the employees and
leads the way to the accomplishment of that vision. This leadership helps to achieve
objective on a short time. The county leaders can use this style for short-term change.
Laissez faire leadership had a negative effect on the change management and the county
government. The study recommends that more active leadership in order to get good
results. The study recommends that county leaders should avoid this leadership style as it
derails in achieving county goals.
Autocratic leadership was seen to influence change management. Thus this study
recommends that autocratic leadership should be used in the counties when new
employees are unfamiliar and don‘t have sufficient know how about their jobs, If the
employee constantly misusing their authority, when county rules are violated by
employees and when one person is responsible for the decision making process.
Democratic leadership was seen to influence change management, this study
recommends that county leaders should use this leadership style when change is
affecting large numbers of departments and areas so as to get the input from various
county members who will be affected by the change. The study recommends county
leaders should consult employees on their point of view to help make better decisions on
change management.
Autocratic leadership was seen to influence the change management; it was seen to make
change swift. This leadership style is recommended for changes which need to be done
on short time periods. Through this leadership style the county leader can use it to stop
resistance to change and enhance change process.

154
County culture was seen to influence the relationship between leadership styles and
change management. The study recommends that the county should develop a culture
that enables change management. The culture should support the leadership style
employed by the leader when implementing change.
5.5 Areas of Further Research
The study investigated leadership styles on change management in selected county
governments and the moderating effect of organizational culture in Kenya, the dependent
variable change management and the independent variables transformational leadership
style, transactional leadership style, laissez-faire leadership style, autocratic leadership
and democratic leadership style. Further research can be done on how other leadership
styles affect change in county governments.
Further research can also be done on how leadership styles affect change management in
other levels of government such as the central government. The study also suggests
similar study to be done in the private sector as this one dealt only with the public sector.
The study can attempt to look at the effect of leadership styles on the change
management in these private organizations.

155
REFERENCES
Abrell, C., Rowold, J., Weibler, J., & Moenninghoff, M. (2011). Evaluation of a Long-
term Transformational Leadership Development Program. Zeitschrift Für
Personalforschung / German Journal of Research in Human Resource
Management,25(3), 205-224.
Achitsa, Y. (2014). Leadership and management of strategic change at Equity bank
limited Kenya.Unpublished MBA Research Project, and School of Business.
Adair, J. (2010). Strategic leadership: How to think and plan strategically and provide
direction. Retrieved from Eb Lib database.
Atmojo, M. (2012). The influence of transformational leadership on job satisfaction,
organizational commitment, and employee performance. International Research
Journal of Business Studies, 5(2), 113-128.
Aguinis, H., & Gottfredson, R. K. (2010). Best practice recommendations for estimating
interaction effects using moderated multiple regression. Journal of organizational
behavior, 31(6), 776-786.
Babbie, E. (1990). Survey Research Methods. Belmont: Wadsworth Publishing
Company.
Babbie, E. (2004). The practice of social research. Belmont, CA: Wadsworth Publishing
Company.
Bailey, K.D. (1987) Methods of Social Research. 3rd Edition, the Free Press, New York.
Bhal, K., & Dadhich, A. (2011). Impact of Ethical Leadership and Leader-Member
Exchange on Whistle Blowing: The Moderating Impact of the Moral Intensity of
the Issue. Journal of Business Ethics,103(3), 485-496.

156
Benn, S., Todd, L., & Pendleton, J. (2010). Public Relations Leadership in Corporate
Social Responsibility. Journal of Business Ethics,96(3), 403-423.
Blackmore, J. (2011). Leadership in Pursuit of Purpose: Social, Economic and Political
Transformation. Counterpoints,409, 21-36.
Boatwright, K., Lopez, F., Sauer, E., Vander Wege, A., Huber, D. (2010). The Influence
of Adult Attachment Styles on Workers' Preferences for Relational Leadership
Behaviors.The Psychologist-Manager Journal.13(1).1-14.
Box, G. E. P., & Jenkins, G. (1976). Time Series Analysis: Forecasting and Control. San
Francisco: Holden-Day.
Busck O, Knudsen, H., & Lind, J. (2010). The transformation of employee participation:
consequences for the work environment. Democracy, 20(10), 1-21.
Bushra F., Usman, A., & Naveed, A. (2011). Effect of transformational leadership on
employees‟ job satisfaction and organizational commitment in banking sector of
Lahore (Pakistan). International
Čater, T., Lang, R., & Szabo, E. (2013). Values and leadership expectations of future
managers: Theoretical basis and methodological approach of the GLOBE
Student project. Journal for East European Management Studies,18(4), 442-462.
Caldwell, C. (2011). Duties Owed to Organizational Citizens — Ethical Insights for
Today's Leader. Journal of Business Ethics, 102(3), 343-356.
Caldwell, C., Hayes, L., & Long, D. (2010). Leadership, Trustworthiness, and Ethical
Stewardship.Journal of Business Ethics,96(4), 497-512.
Camps, J., & Rodriguez, H. (2011). Transformational leadership, learning and
employability: effects on performance among faculty members. Personnel
Review, 40, 423-442.

157
Chaudhry, A., Javed, H., &Sabir, M. (2012). The Impact of Transformations &
Transactional Leadership Styles On the Motivation of Employees in Pakistan.
Pakistan Economic and Social Review,50(2), 223-231.
Cheng,Kuo-liang (2011). ―Exploration of the Construct Model Linking Leadership Style,
Organizational Culture, Employee Performances and Leadership Effectiveness,‖
PhD, Taiwan: Graduate School of Business and Management, Lunghwa. The
Journal of Human Resource and Adult Learning, Vol. 9, Num. 2, issue 121,
University of Science and Technology.
Chepkemoi N. (2015). Challenges hindering effective strategic change management in
counties in Kenya: a case of Nairobi County. Vol 2, No 2.
Chipunza, C., Samueel, M. O., & Mariri, T. (2011). Leadership style, employee
motivation and commitment: empirical evidence from a consolidated retail bank
operating in a depressed economy. African Journal of Business Management,
5(20), 8337-8346.
Chocqueel-Mangan, J. (2011). Managing transitions.Training Journal, 57–61.
Crossman, J. (2011). Environmental and Spiritual Leadership: Tracing the Synergies
from an Organizational Perspective. Journal of Business Ethics,103(4), 553-565.
Cohen, J., Cohen, P., West, S. G., Aiken, L. S. (2003). Applied multiple
regression/correlation analysis for the behavioral sciences. Lawrence Erlbaum
Associates: London.
Cooper, D. R., & Schindler, P. S. (2003). Business research methods. (8th ed.). Boston:
McGraw-Hill.

158
Datche, A. E. & Mukulu E. (2015). The effects of transformational leadership on
employee engagement: A survey of civil service in Kenya. International Journal
of Economics, Commerce and Management United Kingdom Vol. III, Issue 6.
De Vries, R., Bakker-Pieper, A., &Oostenveld, W. (2010). Leadership =
Communication? The Relations of Leaders' Communication Styles with
Leadership Styles, Knowledge Sharing and Leadership Outcomes.Journal of
Business and Psychology,25(3), 367-380.
Dixon, M., & Hart, L. (2010). The Impact of Path-Goal Leadership Styles on Work
Group Effectiveness and Turnover Intention.Journal of Managerial Issues,22(1),
52-69
Edmonds, J. (2011, April). Making change happen.Training Journal, 33–36.
Eisler, R., & Carter, S. (2010). Transformative leadership: From domination to
partnership. ReVision, 30(3- 4), 98-106.
Gans, K. (2011). Should You Change Your Thinking about Change Management?
Journal of Strategic Finance 93(4),48-50.
Goddard, R., & Miller, R. (2010). The Conceptualization, Measurement, and Effects of
School Leadership: Introduction to the Special Issue. The Elementary School
Journal,111(2), 219-225. doi:10.1086/656298.
Goodwin, V., Whittington, J., Murray, B., & Nichols, T. (2011). Moderator or
Mediator?Examining the Role of Trust in the Transformational Leadership
Paradigm.Journal of Managerial Issues,23(4), 409-425.
Gupta, V., Singh, S., Kumar, S., & Bhattacharya, A. (2012). Linking Leadership to
Employee Creativity: A Study of Indian R&D Laboratories. Indian Journal of
Industrial Relations, 48(1), 120-136.

159
Groves, K., &LaRocca, M. (2011). An Empirical Study of Leader Ethical Values,
Transformational and Transactional Leadership, and Follower Attitudes Toward
Corporate Social Responsibility. Journal of Business Ethics,103(4), 511-528.
Franke, F., Felfe, J., &Pundt, A. (2014). The impact of health-oriented leadership on
follower health: Development and test of a new instrument measuring health-
promoting leadership. Zeitschrift Für Personalforschung / German Journal of
Research in Human Resource Management,28(1/2), 139-161.
Hsu, Nan-hsiung (2010). Terminology of Public Administration, Taipei: Sunny Digital
Education Co.
Huang, X., Iun, J., Liu, A., & Gong, Y. (2010). Does participative leadership enhance
work performance by inducing empowerment or trust? The differential effects
on managerial and non-managerial subordinates.Journal of Organizational
Behavior,31(1), 122-143.
Harold, B. (2011). Arab Women: Emerging Leadership Patterns and Identities.
Counterpoints,409, 342-361.
Isett, K. R., Glied, S. A. M., Sparer, M. S., & Brown, L. D. (2012). When change
becomes transformation: A case study of change management in Medicaid
offices in New York City.Public Management Review, 15(1), 1–17.
Jackson, T.A., Meyer, J. P., & Wang, X. H. F. (2013). Leadership, commitment, and
culture: a meta-analysis. Journal of Leadership & Organizational Studies, 20(1),
84-106.
Kakucha, W. N. (2014). Barriers to effective organizational change: The case of a
selected County Government in Kenya. International Journal of Social Sciences
and Entrepreneurship, 1 (13), 58-68.

160
Kaplan, H., Brady, P., Dritz, M., Hooper, D., Linam, W., Froehle, C., & Margolis, P.
(2010). The Influence of Context on Quality Improvement Success in Health
Care: A Systematic Review of the Literature. The Milbank Quarterly,88(4), 500-
559.
Karakas, F., & Sarigollu, E. (2012). Benevolent Leadership: Conceptualization and
Construct Development. Journal of Business Ethics,108(4), 537-553.
Kezar, A., & Lester, J. (2010). Breaking the Barriers of Essentialism in Leadership
Research: Positionality as a Promising Approach.Feminist Formations,22(1),
163-185.
King, K., Lunn, S. and Michaelis, C. (2010). Director leadership behavior research. HSE
Research Report RR816.
Khan, M. M., Ramzan, M., Ahmed, I., & Nawaz, M. M. (2011). Transformational,
transactional and laissez-faire styles of teaching faculty as predictors of
satisfaction and extra effort among the students: evidence from higher education
institutions interdisciplinary. Journal of Research in Business, 1, 130-135.
Kreitner, R., &Kinicki, A. (2010). Organizational behavior (9th Ed.) New York:
McGraw-Hill.
Komor B.T.J. (2012). The Role of Leader Style during Organizational Change
University of Amsterdam. Institute: University of Amsterdam. Industrial &
Organizational Psychology.
Kim, J. (2010). Strategic Human Resource Practices: Introducing Alternatives for
Organizational Performance Improvement in the Public Sector. Public
Administration Review,70(1), 38-49.

161
Kuppelwieser, V. (2011). Stewardship Behavior and Creativity. Management
Revue,22(3), 274-295.
Levine, H., Christian, N., & Lyons, B. (2013). Organizational Change Skill Acquisition
and Change Agency Preparedness in U.S. NASPAA-Accredited MPA Programs.
Journal of Public Affairs Education, 19(3), 479-492.
Liguori, M. (2012). The supremacy of the sequence: Key elements and dimension in the
process of change. Organization Studies, 33(4), 507–539.
Liu, Y. (2010). When change leadership impacts commitment to change and when it
doesn‘t. A multi-level multi- dimensional investigation (Doctoral dissertation).
Georgia Institute of Technology.
Mahajan, A., Bishop, J., & Scott, D. (2012). Does Trust in Top Management Mediate
Top Management Communication, Employee Involvement and Organizational
Commitment Relationships? Journal of Managerial Issues, 24(2), 173-190.
Miller, J. (2011). How to achieve lasting change. Training Journal, 58–62.
Muchiri, M. K., Cooksey, R. W., & Walumbwa, F. O. (2012). Transformational and
social processes of leadership as predictors of organisational outcomes.
Leadership & Organization Development Journal, 33(7), 662-683.
Mutmainah, A.T. &Noermijati, P.K. (2013). Organizational culture, leadership style
influence on organizational commitment and performance of teachers.
International Journal of Business and Behavioral Sciences, 3(10), 2013.
Mwangi,S. N. & Kwasira J. (2015). Role of transformational leadership on
organizational change in selected public secondary schools in Nakuru. School of
Human Resource Development, Jomo Kenyatta University of Agriculture and
Technology, Kenya

162
Northouse, P. G. (2010). Leadership: Theory and practice. Thousand Oaks, CA: Sage.
Obiwuru T. C., Okwu, A. T., and Akpa, V. O. (2011). ―Effects of Leadership Style on
Organizational Performance: A Survey of Selected Small Scale Enterprises in
Ikosi-Ketu Council Development Area of Lagos State, Nigeria‖. Australian
Journal of Business and Management Research.1 (7). Pp 100-111.
Pearce, C., & Manz, C. (2011). Leadership Centrality and Corporate Social Ir-
Responsibility (CSIR): The Potential Ameliorating Effects of Self and Shared
Leadership on CSIR. Journal of Business Ethics, 102(4), 563-579.
Paul, S. R., & Zhang, X. (2010). Testing for normality in linear regression models.
Journal of Statistical Computation and Simulation, 80(10), 1101-1113.
Peus, C., Wesche, J., Streicher, B., Braun, S., & Frey, D. (2012). Authentic Leadership:
An Empirical Test of Its Antecedents, Consequences, and Mediating
Mechanisms. Journal of Business Ethics, 107(3), 331-348.
Phipps, K. (2012). Spirituality and Strategic Leadership: The Influence of Spiritual
Beliefs on Strategic Decision Making. Journal of Business Ethics,106(2), 177-
189
Petranker, T. (2010). Leading from within the whole time. Revision, 30(3), 57-62.
Phipps, K. (2012). Spirituality and Strategic Leadership: The Influence of Spiritual
Beliefs on Strategic Decision Making. Journal of Business Ethics,106(2), 177-
189.
Pieterse, A., Van Knippenberg, D., Schippers, M., & Stam, D. (2010). Transformational
and transactional leadership and innovative behavior: The moderating role of
psychological empowerment. Journal of Organizational Behavior,31(4), 609-
623.

163
Pearce, C., & Manz, C. (2011). Leadership Centrality and Corporate Social Ir-
Responsibility (CSIR): The Potential Ameliorating Effects of Self and Shared
Leadership on CSIR. Journal of Business Ethics,102(4), 563-579.
Sasaka, P., Namusonge, G., & Sakwa, M., (2014). Effects of Strategic Management
Practices on Corporate Social Responsibility Performance of Parastatals in
Kenya. European Journal of Business and Innovation Research, 2(1), 106-128.
Seijts, G. H., & Roberts, M. (2011). The impact of employee perceptions on change in a
municipal government.Leadership & Organization Development Journal, 32(2),
190–213.
Schulman, J. (2010). Collaborative change: How ARTstor entices 1,300 educational
institutions to work together. Stanford Social Innovation Review, fall 2010, pp.
23–24.
Steward Clegg, C. C. (2011). Strategy Theory and Practice. London: SAGE Publications
Ltd.
Soulita, T. (2015). Appropriate leadership styles inspire employees to adapt to change, at
the national university of LAOS (NUOL). Thesis submitted in partial fulfillment
of the requirements for the degree of Master of Business United Institute of
Technology, New Zealand.
Schneider, A., & Schröder, T. (2012). Ideal Types of Leadership as Patterns of Affective
Meaning: A Cross-cultural and Over-Time Perspective. Social Psychology
Quarterly,75(3), 268-287.
Stam, D., Van Knippenberg, D., &Wisse, B. (2010). The role of regulatory fit in
visionary leadership. Journal of Organizational Behavior,31(4), 499-518.

164
Simola, S., Barling, J., & Turner, N. (2012). Transformational Leadership and Leaders'
Mode of Care Reasoning.Journal of Business Ethics,108(2), 229-237.
Škerlavaj, M., Su, C., & Huang, M. (2013). The moderating effects of national culture on
the development of organisational learning culture: A multilevel study across
seven countries. Journal for East European Management Studies,18(1), 97-134.
Starratt, J. (2011). Preparing Transformative Educators for the Work of Leading Schools
in a Multicultural, Diverse, and Democratic Society.Counterpoints,409, 131-136
Shiva, M., & Suar, D. (2012). Transformational Leadership, Organizational Culture,
Organizational Effectiveness, and Programme Outcomes in Non-Governmental.
.Organizations.Voluntas: International Journal of Voluntary and Nonprofit
Organizations,23(3), 684-710.
Shiva, M. S. A. Mahalinga, and Damodar Suar.―Transformational Leadership,
Organizational Culture, Organizational Effectiveness, and Programme Outcomes
in Non-Governmental Organizations.‖Voluntas: International Journal of
Voluntary and Nonprofit Organizations, vol. 23, no. 3, 2012, pp. 684–710.
Simons, S. (2010). The heart of hearing: A story of transformative leadership and
sustainable development. Revision, 30(3), 63-68.
Rayner, S. (2011). Managing Educational Diversity: Developing Transformative
Leadership and Professional Praxis in the 21st-century Learning Community.
Counterpoints,409, 100-113.
Rothfelder, K., Ottenbacher, M., & Harrington, R. (2012). The impact of
transformational, transactional and non-leadership styles on employee job
satisfaction in the German hospitality industry. Tourism and Hospitality
Research,12(4), 201-214.

165
Rowold, J. (2014). Instrumental leadership: Extending the transformational-transactional
leadership paradigm. Zeitschrift Für Personalforschung / German Journal of
Research in Human Resource Management,28(3), 367-390.
Ruiz, P., Ruiz, C., &Martínez, R. (2011). Improving the "Leader-Follower" Relationship:
Top Manager or Supervisor? The Ethical Leadership Trickle-Down Effect on
Follower Job Response. Journal of Business Ethics, 99(4), 587-608.
Van Dierendonck, D., &Nuijten, I. (2011). The Servant Leadership Survey:
Development and Validation of a Multidimensional Measure. Journal of
Business and Psychology,26(3), 249-267.
Van der Voet, J., Groeneveld, S. M., &Kuipers, B. S. (2013). Talking the talk or walking
the walk? The leadership of planned and emergent change in a public
organization.Journal of Change Management.
Vroom, V. H. & Jago, A. G. (1988). The New Leadership Managing: Participation in
Organisation. New Jersey: Prentice Hall.
Vijayalakshmi, V., & Bhattacharyya, S. (2012). Emotional Contagion and its Relevance
to Individual Behavior and Organizational Processes: A Position Paper. Journal
of Business and Psychology,27(3), 363-374.
Waldman, D. (2011). Moving Forward with the Concept of Responsible Leadership:
Three Caveats to Guide Theory and Research.Journal of Business Ethics,98, 75-
83.
Wegge, J., Shemla, M., & Haslam, S. (2014). Leader behavior as a determinant of health
at work: Specification and evidence of five key pathways. Zeitschrift Für
Personalforschung / German Journal of Research in Human Resource
Management,28(1/2), 6-23.

166
Waldman, D. (2011). Moving Forward with the Concept of Responsible Leadership:
Three Caveats to Guide Theory and Research.Journal of Business Ethics,98, 75-
83.
Wilson, P. (2011). Shared Learning In and From Transformational Development
Programs. Transformation,28(2), 103-113.
Wegge, J., Shemla, M., & Haslam, S. (2014). Leader behavior as a determinant of health
at work: Specification and evidence of five key pathways. Zeitschrift Für
Personalforschung / German Journal of Research in Human Resource
Management,28(1/2), 6-23.
Yukl, G. (2006). Leadership in organizations (6th Ed.) (pp. 117-120). Upper Saddle
River, NJ: Prentice Hall.
Yukl, G. (2010). Leadership in organizations (7th Ed.). Upper Saddle River, NJ: Prentice
Hall.
Zhang, X., &Bartol, K. (2010). Linking Empowering Leadership and Employee
Creativity: The Influence of Psychological Empowerment, Intrinsic Motivation,
and Creative Process Engagement. The Academy of Management Journal,53(1),
107-128.
Zigarmi, P and Hoekstra, J. (2008). Leadership Strategies for Making Change Stick.
SAGE Publications Ltd.
167
APPENDICES
Appendix I: JKUAT Letter.

168
Appendix II: Questionnaire for Research
Dear Sir/Madam,
I am hereby requesting you to take part in survey on the effect of leadership style on the
change management in county governments in Kenya. This is for my thesis for PhD
research from Jomo Kenyatta University of agriculture and technology. I humbly request
you to participate in this study so as to provide the required information which is
necessary for the completion of my research. Kindly answer all items in the
questionnaire below. Kindly use the box (√) to indicate your opinion. Participation in
this survey is voluntary and confidentiality is assured. Information collected will be used
for academic purposes. Kindly read the following information below on how to fill the
questionnaire.
PLEASE READ THE FOLLOWING INSTRUCTIONS CAREFULLY BEFORE
YOU START FILLING THE QUESTIONNAIRE
1. Please read each question carefully.
2. For questions requiring you to choose the extent of agreement or importance
indicate only one appropriate choice on scale of 1-5.
3. Fill in answers to all questions with blank spaces.
4. Do not indicate your name on the questionnaire.
SECTION A
PART I: RESPONDENTS BIO DATA
1. Name of the county _________________________________________.
2. Age____________ (years)

169
3. Position (Title) in the institution.
Department/Section__________________________________.
4. What is your highest leve
Doctorate others, please specify ____________________.
5.
– 10 year‘s – 15 years‘
SECTION B
PART ONE: Transformational Leadership and Change Management in County
Governments in Kenya.
State the extent to which you agree with the following statement regarding
transformational leadership and change management in county governments in Kenya.
Please, indicate with a tick (√) your opinion on each of the statements. The meaning
of the scores 1 -5 is given below. [5 = Strongly Agree, 4 = Agree, 3 = Neutral, 2 =
Disagree, 1 = Strongly Disagree).
Transformational Leadership 1 2 3 4 5
1 Leaders influence the followers to accept the
change.
2 Leaders increase the motivation to change .
3 Leaders use intellectual stimulation to make change
possible
4 Leaders always instills pride in staff after achieving
a change.

170
5 Leaders articulate clearly the future.
6 Leaders inspires others to change
7 Leaders build genuine trust between them and
followers.
8 Leaders adjust the culture to meet the long term
needs for change.
9 Leaders develop skill of employees to meet the
requirement of change.
10 Leaders seek different perspectives before initiating
change.
Any comment on transformational leadership effect on change management
………………………………………………………………………………………
1) Do the leaders go out of their way to motivate employees into adopting a change in the
county?
Yes [ ] No [ ]
If No kindly explain ………………………………………………………
2) Do the leaders help in the organizational members see the need for change within the?
Yes [ ] No [ ]
If No kindly explain …………………………………………………………………..
3) To what extent do the leaders help organizational members see the need for change in the
organization?
To a very great extent [ ]
To a great extent [ ]
To a moderate extent [ ]
To a little extent [ ]

171
PART TWO: Transactional Leadership and Change Management in County.
Governments in Kenya.
1) State the extent to which you agree with the following statement regarding: transactional
leadership and change management in county governments in Kenya. Please, indicate
with a tick (√) your opinion on each of the statements. The meaning of the scores 1 -
5 is given below. [5 = Strongly Agree, 4 = Agree, 3 = Neutral, 2 = Disagree, 1 =
Strongly Disagree).
Transactional Leadership 1 2 3 4 5
1 Leader offer rewards for achievement of change.
2 Leader use punishment when change objectives are
not achieved.
3 Leader sets clear goals.
4 The leader is responsible for goal achievement.
5 Leaders motivate followers towards achievement of
change.
6 The leader dominates the change process by
command and control procedures.
7 The leadership style has affected county change
process.
8 Overall success of the change depends on whether
the leader has the power.
9 Leader develops a vision and sells the vision to the
followers.
10 Leaders are interested creating the conducive
environment for change.

172
Any comments on transactional leadership effect on change management
……………………………………………………………………………………
2) Do the leaders clarify the responsibility in achieving change?
Yes [ ] No [ ]
If No kindly explain
…………………………………………………………………………
3) Do the leaders provide recognition and rewards for achieving for achieving change?
Yes [ ] No [ ]
If No kindly explain ………………………………………………………
4) To what extent do leaders guide the employees into achieving change in the
organization?
To a very great extent [ ]
To a great extent [ ]
To a moderate extent [ ]
To a little extent [ ]
PART THREE: Laissez Fair Leadership and Change Management in County
Governments in Kenya.
1) State the extent to which you agree with the following statement regarding laissez fair
leadership and change management in county governments in Kenya. Please, indicate
with a tick (√) your opinion on each of the statements. The meaning of the scores 1 -
5 is given below. [5 = Strongly Agree, 4 = Agree, 3 = Neutral, 2 = Disagree, 1 =
Strongly Disagree).

173
Laissez Fair Leadership 1 2 3 4 5
1 Leaders avoids getting involved when important
issues arise.
2 Leaders let others make decisions .
3 Leaders avoids making decisions.
4 Leaders delay in responding to urgent questions .
5 Leaders use passive management.
6 The leader makes no attempt to help in solving
problems.
7 Leaders renounce their leadership.
8 Leaders shun organizational duties.
9 Leaders assume that anything that comes the
county administration way they will be able to
solve it.
10 Leader doesn‘t concern themselves in the
stimulation of subordinates .
Any comments on Laissez Fair Leadership effect on change
management………………………………………………………………………………
………………………………………………………………………………
2) Do leaders give subordinates complete freedom to solve problems on their own in a
change situation?
Yes [ ] No [ ]
If No kindly explain. ………………………………………………………
3) Does the leadership stay out of the way of subordinates as they do their work when
effecting change?
Yes [ ] No [ ]

174
If No kindly explain. .………………………………………………………
4) To what extent do leaders let subordinates work problems out on their own in change
situation?
To a very great extent [ ]
To a great extent [ ]
To a moderate extent [ ]
To a little extent [ ]
PART FOUR: Autocratic Leadership and Change Management in County.
Governments in Kenya.
1) State the extent to which you agree with the following statement regarding Autocratic
Leadership and Change Management in County Governments in Kenya. Please, indicate
with a tick (√) your opinion on each of the statements. The meaning of the scores 1 -
5 is given below. [5 = Strongly Agree, 4 = Agree, 3 = Neutral, 2 = Disagree, 1 =
Strongly Disagree).
Autocratic Leadership 1 2 3 4 5
1 Leader is after the accomplishment of the goal and
will do anything to move towards ensuring that
goal has been achieved.
2 Leader‘s behavior focuses on taking control.
3 Leader makes order of the employees without
offering much clarification and dialogue.
4 Leader controls the employees through threats and
reprimand.
5 Leadership style offers various advantages such as
swiftness of activity completion ensuring that
projects are easily completed

175
6 The leader is hands on in implementation of
projects.
7 Leaders are swift in handling activities.
8 Leaders direct staff‘s attention towards failures to
meet standards.
9 Leader uses punishment in case of failure.
10 It is an effective leadership style.
Any comments on Autocratic Leadership effect on change
management………………………………………………………………………………
………………………………………………………………………
2) Do the leaders supervise employees closely when implementing change?
Yes [ ] No [ ]
If No kindly explain.
……………………………………………………………………….
3) Does the leader give out rewards or punishment to any one in order to motivate them into
accepting change?
Yes [ ] No [ ]
If No kindly explain.
…………………………………………………………………………
4) To what extent is the leader the chief judge of the achievements of change?
To a very great extent [ ]
To a great extent [ ]
To a moderate extent [ ]
To a little extent [ ]

176
PART FIVE: Democratic Leadership and Change Management in County Governments
in Kenya.
1) State the extent to which you agree with the following statement regarding democratic
leadership and change management in county governments in Kenya. Please, indicate
with a tick (√) your opinion on each of the statements. The meaning of the scores 1 -
5 is given below. [5 = Strongly Agree, 4 = Agree, 3 = Neutral, 2 = Disagree, 1 =
Strongly Disagree).
Democratic Leadership 1 2 3 4 5
1 Leaders encourage and support their employees to
engage in the decision-making.
2 Leader encourages participation from organizational
players and involves them in decision-making.
3 Leader ensures employees ideas are taken seriously.
4 Leader increase morale for change to take place.
5 Leadership style is ideal for change management.
6
This leadership style results in the improvement in
labor relations, employee commitment, increased
organizational allegiance, occupational contentment,
apparent support, organizational ownership behavior,
and employee performance.
7 Leader keeps followers updated on change process .
8 Leaders are able to understand the followers concerns.
9 Leader meeting periodically and listening to inputs by
followers .
10 It is an effective leadership style.

177
Any comments on Democratic Leadership effect on change
management………………………………………………………………………………
………………………………………………………………………………
2) Does the leader helps the organizational members see the need for change?
Yes [ ] No [ ]
If No kindly explain ………………………………………………………
3) Do the leaders involve the other organizational member in the decision making in case of
a change?
Yes [ ] No [ ]
If No kindly explain ………………………………………………………
4) To what extent are leaders willing to listen to other organizational members in the
decision making in case of change?
To a very great extent [ ]
To a great extent [ ]
To a moderate extent [ ]
To a little extent [ ]
PART SIX: Organizational culture effect on the relationship between leadership style
and change management.
State the extent to which you agree with the following statement regarding
Organizational culture effect on the relationship between leadership style and change
management.
1) . Please, indicate with a tick (√) your opinion on each of the statements. The meaning of
the scores 1 -5 is given below. [5 = Strongly Agree, 4 = Agree, 3 = Neutral, 2 =
Disagree, 1 = Strongly Disagree).

178
Organizational culture 1 2 3 4 5
1 County has norms that help change.
2 County has beliefs that help change.
3 County values influence leadership styles
4 County members are collaborative with change.
5 County Culture affects leadership.
6 There is a culture of refusing change.
7 County member have a way of voices their views.
8 County leaders have a way of influencing county
members.
9 Change in the county is communicated early.
10 Counties refuse meaningless change.
Any comments on culture effect on leadership styles and change
management………………………………………………………………………………
………………………………………………………………………
2) The leadership styles are supported by county culture?
Yes [ ] No [ ]
If No kindly explain ………………………………………………………
3) Does the culture contribute to resistance to change?
Yes [ ] No [ ]
If No kindly explain ………………………………………………………
4) To what extent does county culture affect leadership styles and change management?

179
To a very great extent [ ]
To a great extent [ ]
To a moderate extent [ ]
To a little extent [ ]
PART SEVEN: Change Management in County Governments in Kenya.
2) State the extent to which you agree with the following statement regarding Change
Management in County Governments in Kenya. Please, indicate with a tick (√) your
opinion on each of the statements. The meaning of the scores 1 -5 is given below. [5
= Strongly Agree, 4 = Agree, 3 = Neutral, 2 = Disagree, 1 = Strongly Disagree).
Change Management 1 2 3 4 5
1 Change leads to county improvement .
2 Change leads to county sustainability.
3 There is ownership of change.
4 Change achievement is difficult.
5 There is no enough support.
6 Organization and procedures are not adapted to the
new situation.
7 There is resistance to change.
8 Leaders are responsible for the change process.
9 Time for implementation needed should be longer.

180
Any comments on change management………………………………………
3) Is change easily accepted in the counties?
Yes [ ] No [ ]
If No kindly explain ………………………………………………………
4) Are the leaders good in managing the change process?
Yes [ ] No [ ]
If No kindly explain ………………………………………………………
5) To what extent are leaders able to manage the change in the counties?
To a very great extent [ ]
To a great extent [ ]
To a moderate extent [ ]
To a little extent [ ]
To no extent [ ]
10 Change helps county to become more effective.

181
Appendix III: Interview Guide
1) Describe the change management process at your county?
2) In your own assessment, does the county executive management act as successful
change agents during the change process?
3) How has the county leadership contributed to the success of the change
management process?
4) What leadership style does the management adopt during the process of change
management?
5) How effective do you find the leadership style adopted?
6) To what extent does the county executive adopt the democratic leadership style
during the management of change?
7) Has any aspects of transformational leadership been adopted during the
management of change at the county?
8) What kind of contribution has charismatic leadership made to the management of
change in the county?
9) Do you sometimes find it necessary to be authoritative in order to manage change
in the county?
10) Which leadership style do you find most effective in managing change in the
county?
11) What are the leadership attributes that have been most successful for the
management of change in the county?
12) How often are decisions imposed by the county executive?

182
Appendix IV: Operationalization of Study Variables
Objective
Variable
Measurement
Dependent Variable
(Change Management)
Organizational Improvement
Organizations Sustainability
Change Ownership
Change Achievement
Nominal
Ordinal
Independent Variables
Transformational
Leadership
Influence
Inspiration
Motivation
Intellectual Stimulation(IS)
Nominal
Ordinal
Transactional
Leadership
Rewards
Punishments
Goal setting
Goal achievement
Nominal
Ordinal
Laissez Faire
Leadership
Passive Management
Employee Decision Making
Avoidant Leadership
Nominal
Ordinal
Autocratic Leadership Controlling
Ordering Of The Employees
Swiftness Of Activity
Hands On In Implementation
Nominal
Ordinal

183
Democratic Leadership Engaging In The Decision-
Making Process
Participation By Organizational
Players
Financial Gains And Positive
Evaluation
Increased Morale
Nominal
Ordinal
Moderating Variable
Organizational Culture
Norms
Beliefs
Values
Nominal
Ordinal

184
Appendix V: Hypothesis Results
Null
Hypothesis
Rule
P
value
Comment
1 To establish the effect of
transformational
leadership on the change
management in selected
county governments in
Kenya.
Transformational
leadership does not
have a significant
influence on the
change management
in selected county
governments in
Kenya.
Reject the
Null
hypothesis
if P
value is
less than
0.05
0.000 Reject the
null
hypothesis
2 To assess the effect of
transactional leadership
on the change
management in selected
county governments in
Kenya.
Transactional
leadership does not
have a significant
influence on the
change management
in selected county
governments in
Kenya.
Reject the
Null
hypothesis
if P
value is
less than
0.05
0.000 Reject the
null
hypothesis
3 To determine the effect
of laissez-faire
leadership on the change
management in selected
county governments in
Kenya.
Laissez-faire
leadership does not
have a significant
influence on the
change management
in selected county
governments in
Kenya.
Reject the
Null
hypothesis
if P
value is
less than
0.05
0.007 Reject the
null
hypothesis

185
4 To assess the effect of
autocratic leadership on
the change management
in selected county
governments in Kenya
Autocratic leadership
does not have a
significant influence
on the change
management in
selected county
governments in
Kenya.
Reject the
Null
hypothesis
if P
value is
less than
0.05
0.000 Reject the
null
hypothesis
5 To establish the effect of
democratic leadership on
the change management
in selected county
governments in Kenya.
Democratic
leadership does not
have a significant
influence on the
change management
in selected county
governments in
Kenya.
Reject the
Null
hypothesis
if P
value is
less than
0.05
0.000 Reject the
null
hypothesis
6 To examine the
moderating effect of
organization culture on
the relationship between
leadership styles and
change management in
selected county
governments in Kenya
Organizational
culture does not
moderate the
relationship between
leadership styles and
change management
in selected county
governments in
Kenya.
Reject the
Null
hypothesis
if P
value is
less than
0.05
0.000 Reject the
null
hypothesis