effect of laser shock peening (lsp) on the phase evolution, … · 2018-09-10 · ni-based...
TRANSCRIPT

Lasers in Eng., Vol. 39, pp. 97–112Reprints available directly from the publisherPhotocopying permitted by license only
97
*Corresponding author: E-mail: [email protected], [email protected]
©2018 Old City Publishing, Inc.Published by license under the OCP Science imprint,
a member of the Old City Publishing Group
Effect of Laser Shock Peening (LSP) on the Phase Evolution, Residual
Stress and Hardness of Hastelloy-X Superalloys
S. Nath*, P. Shukla, X-J. SheN aNd J. lawreNce
School of Mechanical, Aerospace and Automotive Engineering, Faculty of Engineering, Environment and Computing, Coventry University, Gulson Road, Coventry, CV1 2JH, UK
Efforts have been made to understand the effect of laser shock peening (LSP) on the phase, residual stress and hardness of Hastelloy-X super-alloys. A 10 J Nd:YAG laser was used for the LSP operation. Following LSP detailed microstructural and phase analysis along with residual stress and hardness studies were undertaken. A parametric window was first established to explore the relationship between LSP process parameters and the respective surface and bulk properties. The effects of an absorptive layer on the properties of the modified layer were also investigated. Qualitative and quantitative information on dislocation density was obtained using X-ray diffraction (XRD) analysis and cor-related with the processing parameters. Residual stress developed fol-lowing LSP was measured using the XRD technique. An increase in the hardness of the Ni-based superalloys was observed. The residual stress on the surface of the laser shock peened Hastelloy-X superalloy showed a maximum compressive stress of 166 MPa. A detailed micro-structure-property relationship was established to understand the mechanism of property enhancement. Further optimization of the LSP process to surface treat the Hastelloy-X superalloys will open up new avenues for the material’s applicability, particularly in the aerospace sector.
Keywords: Nd:YAG laser, Hastelloy-X, superalloy, absorptive layer, laser shock peening (LSP), residual stress, Hugoniot elastic limit (HEL), hardness; microstrain, dislocation density

98 S. Nath et al.
1 INTRODUCTION
Laser shock peening (LSP) is a process normally used to induce compressive residual stress on the surface of the components that are exposed to a cyclic loading in a normal or corrosive environments [1-4]. The compressive resid-ual stress helps to delay the crack initiation and propagation rate [5, 6]. The LSP treatment, under optimised process parameters, strain hardens the treated zone which in turn improves the tribological properties of the metallic sys-tems [4]. The LSP treatment has also been tried on to ceramic systems [7].
Ni-based superalloys are a class of high temperature alloys which shows exceptional strength and resistance in terms of fatigue, creep, and corrosion [8]. Their superior performance at high temperature, allow them to be appli-cable for engine components in aerospace and automotive industry [8]; how-ever, the demands for increasing the engine efficiency have pushed the engine to its extreme operating conditions. The changing operating conditions have increased the thermal and mechanical loads on the system, thereby, lowering their service life. Thus, strengthening of these materials is of great impor-tance as it increases the efficiency and decreases the repair cost of the engines. The term strengthening means to improve the materials mechanical proper-ties (hardness, fatigue strength, creep strength, etc.). It is very well known that the strength of materials can be improved by introducing foreign atoms in the matrix as a solid solution, via the effect of work hardening, by the for-mation of precipitates as a result of alloying, and decreasing the grain size of the matrix [9]. On the other hand, fatigue strength in materials can be improved by introducing compressive residual stress (CRS) on the surface of the component [1, 10]. The introduction of CRS on the surface of these com-ponents are normally achieved by shot peening and LSP [1, 11].
The aim of this investigation was to study the effect of LSP on the proper-ties of the Hastelloy-X superalloys and attempts to further understand and verify the strengthening mechanisms as result of LSP surface treatment. In particular, the effect of LSP on the phase distribution, microstrain and resid-ual stress evolution was studied using X-ray diffraction (XRD) to understand the contribution of LSP process parameters. Studies were also extended to elucidate the effect of absorptive layer on the development of residual stress on the surface of the superalloys. Finally, dislocation densities were mea-sured to understand the work hardening behaviour of the superalloys fol-lowed by a study on the change in the microhardness.
2 EXPERIMENTAL DETAILS
2.1 Materials specifications and sample preparationThe LSP was carried out on rectangular Hastelloy-X superalloys samples of 30 × 10 × 10 mm3 comprising of the composition shown in Table 1. Four
effect of laSer Shock PeeNiNg (lSP) 99
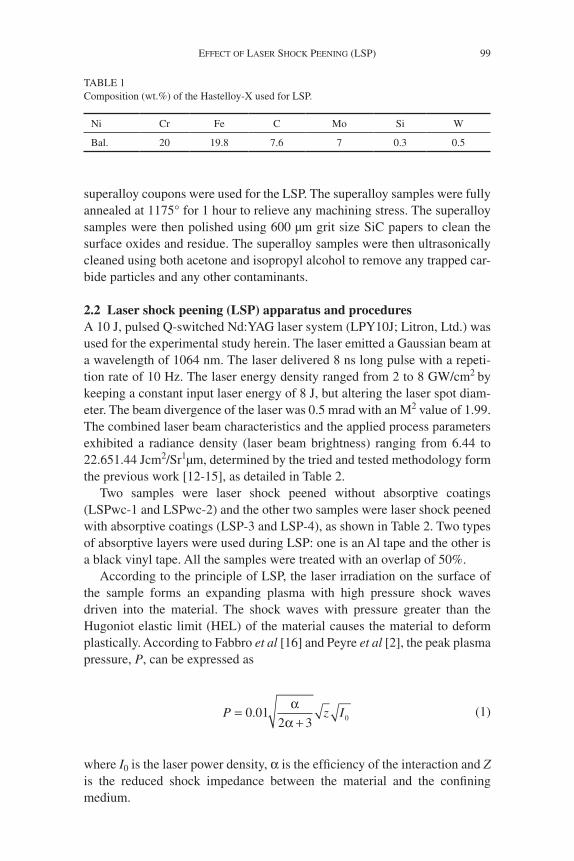
superalloy coupons were used for the LSP. The superalloy samples were fully annealed at 1175° for 1 hour to relieve any machining stress. The superalloy samples were then polished using 600 µm grit size SiC papers to clean the surface oxides and residue. The superalloy samples were then ultrasonically cleaned using both acetone and isopropyl alcohol to remove any trapped car-bide particles and any other contaminants.
2.2 Laser shock peening (LSP) apparatus and proceduresA 10 J, pulsed Q-switched Nd:YAG laser system (LPY10J; Litron, Ltd.) was used for the experimental study herein. The laser emitted a Gaussian beam at a wavelength of 1064 nm. The laser delivered 8 ns long pulse with a repeti-tion rate of 10 Hz. The laser energy density ranged from 2 to 8 GW/cm2 by keeping a constant input laser energy of 8 J, but altering the laser spot diam-eter. The beam divergence of the laser was 0.5 mrad with an M2 value of 1.99. The combined laser beam characteristics and the applied process parameters exhibited a radiance density (laser beam brightness) ranging from 6.44 to 22.651.44 Jcm2/Sr1µm, determined by the tried and tested methodology form the previous work [12-15], as detailed in Table 2.
Two samples were laser shock peened without absorptive coatings (LSPwc-1 and LSPwc-2) and the other two samples were laser shock peened with absorptive coatings (LSP-3 and LSP-4), as shown in Table 2. Two types of absorptive layers were used during LSP: one is an Al tape and the other is a black vinyl tape. All the samples were treated with an overlap of 50%.
According to the principle of LSP, the laser irradiation on the surface of the sample forms an expanding plasma with high pressure shock waves driven into the material. The shock waves with pressure greater than the Hugoniot elastic limit (HEL) of the material causes the material to deform plastically. According to Fabbro et al [16] and Peyre et al [2], the peak plasma pressure, P, can be expressed as
P z I=+
0 012 3 0.
αα
(1)
where I0 is the laser power density, α is the efficiency of the interaction and Z is the reduced shock impedance between the material and the confining medium.
TABLE 1 Composition (wt.%) of the Hastelloy-X used for LSP.
Ni Cr Fe C Mo Si W
Bal. 20 19.8 7.6 7 0.3 0.5

100 S. Nath et al.
The HEL of any material is related to its dynamic yield strength, (σYdyn), by [17]
HEL Ydyn=
−−
1
1 2
ϑϑ
σ (2)
where υ is the Poisson’s ratio of the material.The laser shock peened (laser shock peened) parameters were chosen to
ensure that the peak plasma pressure exceeds the HEL of the material to plas-tically deform the material. The laser shock peened parameters along with peak plasma pressure which was calculated using Equation (1) and HEL which was calculated using Equation (2) are presented in Table 2.
2.3 Material characterisation techniques2.3.1 Phase analysisA detailed analysis of the phase evolution was carried out by X-ray diffrac-tion (XRD, D8 Discover; Bruker Corporation) with a scanning speed of 0.05°/s and time per step of 0.1 seconds using the Cu Kα radiation.
2.3.2 Residual stress measurementResidual stress developed on the surface of the thin films was carefully mea-sured by the XRD using a Bragg-Brentano diffractometer. The X-ray source (Cu Kα radiation) was operated at an accelerating voltage of 40 kV and cur-rent of 25 mA. The XRD was operated at a scanning speed of 0.01°/s and a scanning time of 5 seconds per step. The selected Ψ values were 0, 5, 10, 15, 20, 25, 30, 35, 40 and 45º. For the calculation of residual stress the (331) peak of γ-Ni phase was considered. The sin2 Ψ technique was employed to mea-sure the residual stress values in both the longitudinal and transverse direc-tions. The equation employed to measure residual stress in any given direction, φ, is given by
TABLE 2 Laser shock peening parameters used in the present study.
Sample Energy(J)
Spot Size
(mm)
Peak Power
Density (GW/cm2)
Radiance Density
(Brightness, J.cm2/Sr.µm)
Absorptive Layer
Overlap (%)
Peak Pressure
(GPa)
HEL (GPa)
LSPwc-1 8 4.0 7.96 22.65 No layer 50 2.88 1.11
LSPwc-2 8 7.5 2.26 6.44 No layer 50 1.53 1.11
LSP-3 8 7.5 2.26 6.44 Aluminium tape
50 1.53 1.11
LSP-4 8 7.5 2.26 6.44 Black vinyl tape
50 1.53 1.11

effect of laSer Shock PeeNiNg (lSP) 101
σϑφ =
−
md
E
hkl
1
10
(3)
where m is the slope of the d versus sin2ψ curve, d0 is the stress-free lattice spacing (d0≈dφ0, where dφ0 is the stress free interplanar lattice spacing), E is the Young’s modulus and υ is the Poisson’s ratio. The suffix, hkl, refers to a particular crystallographic plane.
2.3.3 Dislocation density measurementThe dislocation density evolution, in the untreated and laser shock peened samples, was calculated using Williamson and Smallman approach [18]. Wil-liamson and Smallman approach assumes the size and strain are related to dislocation density which is true when mechanical milling is used. However, in the present case as LSP was used to plastically deform the material, microstrain is the only parameter which is affected by plastic deformation and is related to dislocation density. The dislocation density due to strain in the material was calculated from
ρε
=k
b
2
2 (4)
where k = 16.1 for a face-centred cubic (FCC) crystal; ε is the microstrain; and b is the burger vector which for an FCC crystal is (a/2) <110>, where a is the lattice parameter. The lattice parameter in Hastelloy-X superalloy was measured to be 0.255 nm.
2.3.4 Microhardness measurementThe hardness of the untreated and LSP treated samples were measured by Vickers microhardness tester (DURASCAN-70; Struers, Inc.) with 50 mN load and a dwelling time of 10 seconds.
3 RESULTS AND DISCUSSION
3.1 Phase analysisXRD phase scans on the untreated Hastelloy-X superalloy (Plot 1) and laser shock peened Hastelloy-X superalloy samples at 7.96 GW/cm2 with no absorptive tape (Plot 2), 2.26 GW/cm2 with no absorptive tape (Plot 3), 2.26 GW/cm2 with Al as an absorptive tape (Plot 4), and 2.26 GW/cm2 with black vinyl tape as an absorptive tape (Plot 5) are shown Figure 1. The XRD phase scans confirm the presence FCC Ni as the only phase (matrix) in both untreated and laser shock peened samples. The LSP treatment on the Hastel-

102 S. Nath et al.
loy-X superalloys shows no sign of phase transformation. This is usually expected, and it is indicative that the effects generated herein are similar to cold working. Thus, thermal input as a result of the process was negligible for bringing about such phase transformations which could otherwise be a pos-sibility with thermos/mechanical effect which the LSP process could also produce.
3.2 Estimation of lattice deformation stress and microstrain by the uniform stress deformation model (USDM)
The Williamson-Hall method for uniform deformation model (UDM) is based on the assumption that the crystals are homogeneous and isotropic in nature; that is, the strain is uniform in all the crystallographic directions, and is represented by [19]
β θλ
ε θhkl hkl hkl
k
Dcos sin= + (5)
where β is the corrected full width at half maximum (FWHM), θ is the dif-fraction angle, K (≈1) is a constant, λ is the X-ray wavelength and D is the crystallite size (or domain size).
FIGURE 1 XRD scans of untreated and laser shock peened surface under different processing conditions.

effect of laSer Shock PeeNiNg (lSP) 103
It is unrealistic to assume that the crystals are homogeneous and isotropic in nature or the strain is independent of crystallographic directions. So, we have used uniform stress deformation model (USDM) considering the aniso-tropic nature of strain. The model assumes a uniform lattice deformation stress. The microstrain in Equation (5) can be rewritten as
εσ
=Ehkl
(6)
where Ehkl is the Young’s modulus in a crystallographic direction perpendicu-lar to the lattice plain (hkl). The crystallographic dependence of the Young’s modulus in a cubic crystal is given by
1
21
211 11 12 44
2 2 2 2 2 2
2 2 2 2ES S S S
h k k l k l
h k lhkl
= − − −
+ +
+ +( )
(7)
where S11, S12, and S44 are the elastic compliance which, for a Ni alloy, are 7.67, 2.93 and 8.23 TPa-1, respectively [20]. The values of Young’s modulus corresponding to different crystallographic planes are given in Tables 3 to 7. Re-writing Equation (5), whilst considering anisotropy in microstrain or lat-tice deformation stress, gives
β θλ σ
θhkl hklhkl
hkl
k
D Ecos sin= +
4 (8)
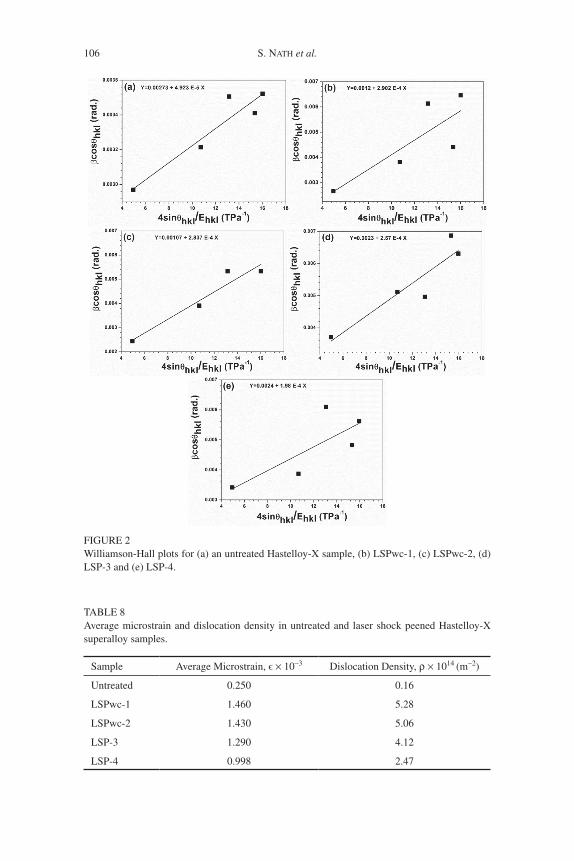
Figure 2 shows the plots between βhklcosθ and 4sinθ/Ehkl for the untreated Hastelloy-X and the laser peened samples. From the slope and intercept of the plot between βhklcosθ and 4sinθ/Ehkl, the lattice deformation stress and the crystallite size have been measured. The measured values of microstrain and lattice deformation stress in an untreated and laser shock peened Hastel-loy-X samples are presented in Tables 3 to 7.
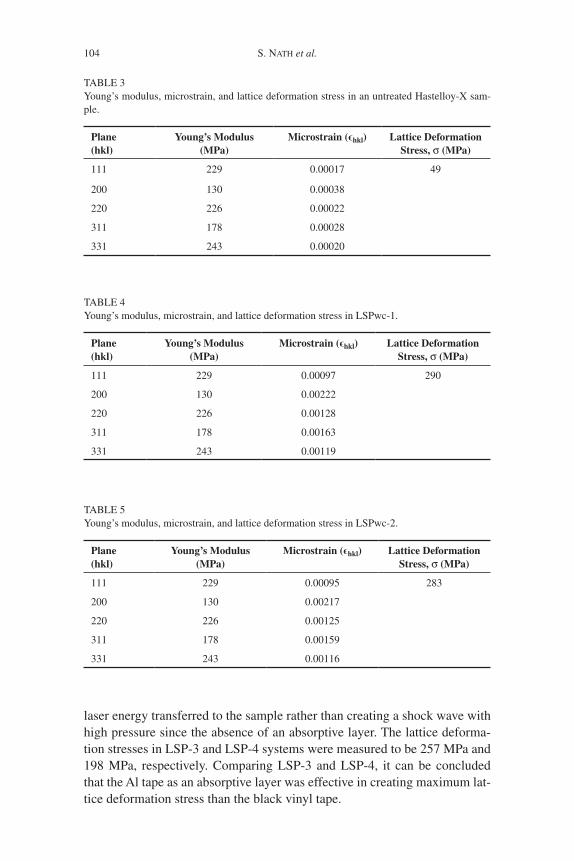
The lattice deformation stress in an untreated Hastelloy-X sample is 49 MPa as shown in Table 3. The lattice deformation stress in LSPwc-1 is 290 MPa which is maximum among the other studied systems (see Tables 4 to 7). A high value of lattice deformation stress in a sample implies that the sample has undergone a significant amount of plastic deformation due to LSP which is attributed to the use of higher power density in LSPwc-1 sample. The lat-tice deformation stress in LSPwc-2 was found to be 283 MPa and is well above the LSP-3 and LSP-4 systems. This was due to a higher portion of the
104 S. Nath et al.
TABLE 3 Young’s modulus, microstrain, and lattice deformation stress in an untreated Hastelloy-X sam-ple.
Plane(hkl)
Young’s Modulus (MPa)
Microstrain (ϵhkl) Lattice Deformation Stress, σ (MPa)
111 229 0.00017 49
200 130 0.00038
220 226 0.00022
311 178 0.00028
331 243 0.00020
TABLE 4 Young’s modulus, microstrain, and lattice deformation stress in LSPwc-1.
Plane(hkl)
Young’s Modulus (MPa)
Microstrain (ϵhkl) Lattice Deformation Stress, σ (MPa)
111 229 0.00097 290
200 130 0.00222
220 226 0.00128
311 178 0.00163
331 243 0.00119
TABLE 5 Young’s modulus, microstrain, and lattice deformation stress in LSPwc-2.
Plane(hkl)
Young’s Modulus (MPa)
Microstrain (ϵhkl) Lattice Deformation Stress, σ (MPa)
111 229 0.00095 283
200 130 0.00217
220 226 0.00125
311 178 0.00159
331 243 0.00116
laser energy transferred to the sample rather than creating a shock wave with high pressure since the absence of an absorptive layer. The lattice deforma-tion stresses in LSP-3 and LSP-4 systems were measured to be 257 MPa and 198 MPa, respectively. Comparing LSP-3 and LSP-4, it can be concluded that the Al tape as an absorptive layer was effective in creating maximum lat-tice deformation stress than the black vinyl tape.

effect of laSer Shock PeeNiNg (lSP) 105
TABLE 6 Young’s modulus, microstrain, and lattice deformation stress in LSP-3.
Plane(hkl)
Young’s Modulus (MPa)
Microstrain (ϵhkl) Lattice Deformation Stress, σ (MPa)
111 229 0.00086 257
200 130 0.00197
220 226 0.00114
311 178 0.00145
331 243 0.00106
TABLE 7Young’s modulus, microstrain, and lattice deformation stress in LSP-4.
Plane(hkl)
Young’s Modulus (MPa)
Microstrain (ϵhkl) Lattice Deformation Stress, σ (MPa)
111 229 0.00066 198
200 130 0.00152
220 226 0.00088
311 178 0.00112
331 243 0.00081
3.3 Dislocation density3.3.1 Qualitative analysis Intensity of plastic deformation in the material due to LSP is directly related to the microstrain developed in the crystal lattice. An increase in the microstrain (peak broadening) implies an increase in the dislocation density. LSP of Hastelloy-X superalloys shows that the microstrain (or the plastic deformation) developed on the surface of the Hastelloy-X samples is depen-dent on the peak power density of the laser as shown in Table 8. With a peak power density of 7.96 GW/cm2, the microstrain in the crystal lattice shows a maximum value of 1.460 × 10⁻³. Lowest microstrain is measured in the LSP-4 sample where the peak power density of 2.26 GW/cm2 was used with a black vinyl tape as an absorptive layer. The increase in microstrain in LSPwc-1 is attributed to increase in the shock wave pressure resulting from higher power density according to Equation (1).
3.3.2 Quantitative analysis Another way to quantify plastic deformation is to measure the dislocation density. Dislocations are the result of plastic deformation in the materials. A higher dislocation density, not only, implies a hardened surface, but also, forms a nanocrystalline structure on the surface which increases its strength.
106 S. Nath et al.
FIGURE 2 Williamson-Hall plots for (a) an untreated Hastelloy-X sample, (b) LSPwc-1, (c) LSPwc-2, (d) LSP-3 and (e) LSP-4.
TABLE 8Average microstrain and dislocation density in untreated and laser shock peened Hastelloy-X superalloy samples.
Sample Average Microstrain, ϵ × 10-3 Dislocation Density, ρ × 1014 (m-2)
Untreated 0.250 0.16
LSPwc-1 1.460 5.28
LSPwc-2 1.430 5.06
LSP-3 1.290 4.12
LSP-4 0.998 2.47

effect of laSer Shock PeeNiNg (lSP) 107
In the present study, dislocation density in the untreated and laser shock peened superalloys were measured using Williamson and Smallman approach [18]. This approach considers crystallite size and microstrain as the factors responsible for dislocations density; however, an increase in the dislocation density increases the full width half maximum (FWHM) of the XRD peak which is directly related to the microstrain in the crystal lattice. Table 8 presents the dislocation densities in an untreated and laser shock peened Hastelloy-X superalloys. The LSP of Hastelloy-X superalloys show an increase in the dislocation density as compared to that of the untreated superalloy. This observation indicates that the chosen Nd:YAG laser pro-cessing parameters are acceptable and corroborate well with the theory of LSP (cf. Equation (1)). Surprisingly, the dislocation density in LSPwc-1 sample is the highest amongst the other laser shock peened samples. The sample laser shock peened with a power density of 7.96 GW/cm2 shows highest dislocation density.
The use of an absorptive layer in LSP decreases the dislocation density as shown in Table 8. This is not usual as it is believed that the use of absorptive coatings increases the shock wave pressure in the material. The observation can be related to the fact that both thermal and mechanical effects were pres-ent in LSPwc-1 and LSPwc-2. The decrease in dislocation densities in LSP-3 and LSP-4 as compared to LSPwc-1 and LSPwc-2 is believed due to the partial loss in the incident laser energy due to melting and evaporation of absorptive coatings in LSP-3 and LSP-4 samples. Comparing LSP-3 and LSP-4, it can be concluded that the Al based absorptive coating increases the dislocation density in the material. This is possibly due to increased shock pressure in the Hastelloy-X superalloys with Al as an absorptive layer as compared to that of black vinyl tape.
3.4 Residual stress analysisResidual stress developed on the surface of the untreated and laser shock peened samples are presented in Table 9. As shown in Table 9, the residual stress in an untreated Hastelloy-X sample is tensile in nature with 23 MPa and 25 MPa in longitudinal and transverse directions, respectively. Lower values of residual stress measured on the surface of an untreated Hastelloy-X are due to the full annealing operation performed on the samples. The resid-ual stresses developed on the surface of laser shock peened Hastelloy-X sam-ples without absorptive coatings show tensile stresses in both longitudinal and transverse directions despite being the obvious benefits which the pro-cess introduces in general.
The reason behind the developed tensile stresses on the surfaces of LSPwc-1 and LSPwc-2 is due to the dominant thermal effect (melting and evaporation) instead of mechanical effect. Normally, an absorptive coating is

108 S. Nath et al.
used to avoid thermal effects and ensure a pure mechanical effect develops on the surface of the samples. But, in the case of LSPwc-1 and LSPwc-2, most of the energy was used to melt and evaporate a thin layer of the sample rather than creating shock pressure which is rather needed for inducing compressive residual stress on the surface. Such phenomena was observed by Masse and Barreau [21] and Gill et al [22]. On the hand, the residual stresses developed on the surface of the LSP-3 and LSP-4 shows compressive in nature.
The measured compressive nature of the stresses in the LSP-3 and LSP-4 samples are due to the use of the absorptive coatings which prevented the samples surface to get melted and generate the necessary shock pressure in the material in order to induce compressive residual stresses. The developed shock pressure on the surface of the samples are responsible for the formation of compressive residual stresses on the surface of LSP-3 and LSP-4.
It is interesting to note that the surface treated with Al tape shows the maximum residual compressive stress than the surface treated with black vinyl tape as shown in Table 9. The reason behind such a difference in gen-eration of stresses on the surface of the Hastelloy-X samples is related to the developed peak pressure in Al tape as compared to black vinyl tape.
3.5 Microhardness distributionThe improvement in microhardness is related to the strain hardening phe-nomena due to LSP. Figure 3 shows the microhardness distribution in the laser shock peened samples LSP-3 and LSP-4. The samples LSP-3 and LSP-4 were chosen for the microhardness measurement as they showed compres-sive residual stress on the surface. From Figure 3, it is evident that the micro-hardness on the surface is higher than the interior. The tail end of the microhardness curve presents the microhardness value of an untreated super-alloy (around 260 VHN). The increased microhardness on the surface of the LSP treated sample is related to the strain hardening of the surface layer due to increased dislocation density (see Table 8).
TABLE 9 Residual stress developed in the untreated and laser shock peened Hastelloy-X superalloy sam-ples.
Sample Residual Stress (MPa)
σ (Longitudinal) σ (Transverse)
Untreated 23 ± 13 25 ± 11
LSPwc-1 149 ± 28 135 ± 25
LSPwc-2 121 ± 11 124 ± 22
LSP-3 -166 ± 15 -132 ± 23
LSP-4 -117 ± 21 -48 ± 18

effect of laSer Shock PeeNiNg (lSP) 109
The gradual decrease in the microhardness values of the LSP-3 and LSP-4 samples with depth is related to the decrease in the dislocation density with depth. The material, normally, experiences a maximum shock pressure due to LSP on the surface which gradually decreases towards the depth. As the amount of plastic deformation is dependent on the shock wave pressure, the plastic deformation decreases with depth. The laser shock peened superalloy with Al as an absorptive layer (LSP-3) shows maximum improvement in hardness with around 380 VHN as compared to around 360 VHN in the LSP-4. The improvement in microhardness in LSP-3 is related to the increased dislocation density and higher compressive residual stress.
4 CONCLUSIONS
A comprehensive investigation of laser shock peening (LSP) surface treat-ment of Hastelloy-X superalloys was undertaken using a 10 J Nd:YAG laser to understand the evolution of structure and properties as well as to under-stand the strengthening mechanisms. The LSP surface treatment was carried out on the bare Hastelloy-X superalloys as well as on the superalloys coated with Al and black vinyl tape as absorptive layers. The process parameters were chosen to ensure plastic deformation in the material based on the clas-
FIGURE 3 Microhardness distribution with depth in LSP-3 (Plot 1) and LSP-4 (Plot 2) Hastelloy-X superal-loy sample.
110 S. Nath et al.
sical theory of shock wave (2.26 and 7.96 GW/cm2). From the study, the following conclusions may be drawn:
(i) The LSP treatment showed no sign of phase transformation ensuring that the sample’s surface structure was stable after LSP treatment;
(ii) The lattice deformation stress was found to increase with increase in the peak power density. A higher lattice deformation stress of 290 MPa was obtained for Hastelloy-X samples LSP treated without an absorptive layer;
(iii) A larger microstrain of 1.520 × 10⁻³ was developed on the surface of the Hastelloy-X sample with LSP treated at highest power density and without an absorptive tape. Use of Al as an absorptive layer during LSP showed an increase in the microstrain (1.290 × 10⁻³) in the crystal lattice of Hastelloy-X superalloy in comparison to the black vinyl tape (0.998 × 10⁻³);
(iv) Tensile stresses were developed on the Hastelloy-X superalloys when they were subjected to LSP without any absorptive layer. On the other hand, compressive residual stresses of 48 to 166 MPa were developed on the surface of Hastelloy-X superalloys when they were laser shock peened with aforementioned absorptive layers. Maximum compressive residual stress of 166 MPa was observed on the Hastelloy-X superalloy when laser shock peened with Al absorptive layer;
(v) Dislocation densities were found to be more when the samples were laser shock peened without an absorptive layers implying higher plastic deformation in the sample. High laser power density was also able to increase the dislocation density in the Hastelloy-X samples; and
(vi) Strain hardening was more on the samples treated with Al absorptive layer compared to black vinyl tape. A maximum hardness of around 380 VHN was found with Al absorptive layer compared to around 360 VHN for black vinyl tape.
ACKNOWLEDGMENTS
The authors of this paper would like to thank the EPSRC funded laser loan pool scheme for granting a state-of-the-art shock peening laser system (Grant No: 13250017 (NSL4)).
NOMENCLATURE
a Lattice parameter (nm)
b Burger’s vector (nm)

effect of laSer Shock PeeNiNg (lSP) 111
d0 Stress-free lattice spacing (nm)
dφ0 Stress free interplanar lattice spacing (nm)
D Crystallite size (nm)
E Young’s modulus (GPa)
HEL Hugoniot elastic limit (GPa)
I0 Laser power density (GW/cm2)
P Shock wave pressure (GPa)
S Elastic compliance factor (TPa-1)
Z Reduced shock impedance between the material and the confining medium (g/cm2s2)
Greek symbols
α Efficiency of the interaction between the material and the confining medium
β Full width half maximum, FWHM (rad ian)
ε Microstrain in a crystal lattice
θ Diffraction angle (°)
λ X-ray wavelength (A°)
ρ Dislocation density (m-2)
σYdyn Dynamic yield strength (GPa)
σ Lattice deformation stress (MPa)
σφ Residual stress at an angle, φ (MPa)
φ Angle between a fixed direction in the plane of the sam-ple and the projection in that plane of the normal of the diffracting plane
Ψ Angle between the normal of the sample and the normal of the diffracting plane (bisecting the incident and dif-fracted beams)
REFERENCES
[1] Peyre P. and Fabbro R. Laser shock processing: A review of the physics and applications. Optical and Quantum Electronics 27(12) (1995), 1213-1229.
[2] Peyre P., Fabbro R., Merrien P. and Lieurade H.P. Laser shock processing of aluminium alloys. Application to high cycle fatigue behaviour. Materials Science & Engineering A. Structural Materials: Properties, Microstructure and Processing 210(1-2) (1996), 102-113.
[3] Lu J.Z., Qi H., Luo K.Y., Luo M. and Cheng X.N. Corrosion behaviour of AISI 304 stain-less steel subjected to massive laser shock peening impacts with different pulse energies. Corrosion Science 80 (2014), 53–59.

112 S. Nath et al.
[4] Lim H., Kim P., Jeong H. and Jeong S. Enhancement of abrasion and corrosion resistance of duplex stainless steel by laser shock peening. Journal of Materials Processing Technol-ogy 212(6) (2012), 1347– 1354.
[5] Montross C.S., Wei T., Ye L., Clark G. and Mai Y.W. Laser shock processing and its effects on microstructure and properties of metal alloys: A review. International Journal of Fatigue 24(10) (2002), 1021–1036.
[6] Rubio-González C., Felix-Martinez C., Gomez-Rosas G., Ocana J.L., Morales M. and Porro J.A. Effect of laser shock processing on fatigue crack growth of duplex stainless steel. Materials Science & Engineering A. Structural Materials: Properties, Microstruc-ture and Processing 528(3) (2011), 914–919.
[7] Shukla P., Nath S., Wang G., Shen X. and Lawrence J. Surface property modifications of silicon carbide ceramic following laser shock peening. Journal of the European Ceramic Society 37(9) (2017), 3027–3038.
[8] Reed R.C. The Superalloys: Fundamentals and Applications. New York: Cambridge Uni-versity Press. 2006.
[9] Callister W.D. and Rethwisch D.G. Materials Science and Engineering. Hoboken: John Wiley & Sons. 2014.
[10] James M.N., Hughes D.J., Chen Z., Lombard H., Hattingh D.G., Asquith D., Yates J.R. and Webster P.J. Residual stresses and fatigue performance. Engineering Failure Analysis 14(2) (2007), 384–395.
[11] Raghavan R., Ayer R., Jin H.W., Marzinsky C.N. and Ramamurty U. Effect of shot peen-ing on the fatigue life of a Zr-based bulk metallic glass. Scripta Materialia 59(2) (2008), 167–170.
[12] Shukla P.P. and Lawrence, J. The influence of brightness whilst laser surface processing of a silicon nitride engineering ceramic. Optics and Lasers in Engineering 50 (2012), 1746–17512.
[13] Shukla, P.P. and Lawrence, J. Role of laser beam radiance in different ceramic processing: A two wavelength comparison. Optics & Laser Technology 54 (2013), 380 388.
[14] Shukla, P., Lawrence J. and Zhang, Yu. Understanding laser-beam brightness: a review on a new prospective in materials processing. Optics and Lasers in Engineering 75 (2015), 40–51.
[15] Shukla, P.P. and Lawrence, J. Identification of optical parameters for determination of radiance. Journal of Optics 44(1) (2015), 12–19.
[16] Fabbro R., Fournier J., Ballard P., Devaux D. and Virmont J. Physical study of laser-pro-duced plasma in confined geometry. Journal of Applied Physics 68(2) (1990), 775–784.
[17] Johnson J.N. and Rohde R.W. Dynamic deformation twining in shock-loaded iron. Jour-nal of Applied Physics 42(11) (1971), 4171–4182.
[18] Williamson G.K. and Smallman R.E. Dislocation densities in some annealed and cold worked metals from measurements on the X-Ray Debye-Scherrer spectrum. Philosophical Magazine 1(1) (1956), 34–46.
[19] Suryanarayana C. and Norton M.G. X-Ray Diffraction: A practical approach. New York: Springer. 1998.
[20] Gale W.F. and Totemeier T.C. (Eds.). Smithells Metals Reference Book. Amsterdam: Else-vier. 2004.
[21] Masse J.E. and Barreau G. Laser generation of stress waves in metal. Surface & Coatings Technology 70(2-3) (1995), 231–234.
[22] Gill A.S., Telang, A. and Vasudevan V.K. Characteristics of surface layers formed on Inco-nel 718 by laser shock peening with and without a protective coating. Journal of Materials Processing Technology 225 (2015), 463–472.