effect of irrigation level on water distribution wetting...
TRANSCRIPT

1
Effect of irrigation level on water distribution wetting patterns under drip and Kapillary
subsurface drip irrigation systems
Abass, M. E.1,2 and H., M. Al-Ghobari1
1Depart, of Agricultural Engineering, College of Food and Agriculture Sciences, King Saud University, Riydah 11451
Saudi Arabia. 2percision Agriculture Research Chair (PARC), Collage of Food and Agriculture Sciences, King Saud University,
Riydah 11451 Saudi Arabia.
Abstract:
Water in the Kingdom of Saudi Arabia, despite its environmental and climatic arid conditions, is the
key factor in the development processes. It is therefore considered that the main objective of this research is
to study the feasibility of saving water through the use of capillary irrigation with special emphasis on
studying the distribution pattern of soil moisture content in the soil under subsurface irrigation systems.
Experiments were designed for two levels of irrigation 4 Liter/h for two hours of application time (Level1 -
100%) and for one hour (Level2 - 50%). The field was divided into 3 major treatments: surface drip,
kapillary irrigation system at depth 25 cm and subsurface drip irrigation at 25cm. moisture measuring device
was used to measure soil moisture content in a grid form: vertically at four depths from and horizontally at
four distances from the emitters. Simulation of wetting patterns showed that the deep percolation in the SIS
was more than in KISSS and DIS, where the volumetric water content at a depth of 50 cm in the DIS (for
example) was 38-40%. While for the SIS was 45-48%, and for the KISSS was 20-18%.
Introduction:
Drip irrigation, also known as trickle
irrigation or microirrigation, is an irrigation method
which saves water and fertilizer by allowing water
to drip slowly to the roots of plants, either onto the
soil surface or directly onto the root zone, through a
network of valves, laterals, tubing, and emitters.
Crop yields can increase through improved
water and fertility management and reduced disease
and weed pressure. When drip irrigation is used
with polyethylene mulch, yields can increase even
further (Najafi, 2009). Advantages of surface drip
irrigation included on studies by (Tom, and Kenny,
2003) and also experiments by (Lawrence, and
Blaine, 2007) Smaller water sources can be used
because the Surface drip irrigation has lower
evaporative losses than surface, sprinkler, or micro
sprinkler irrigation because surface drip systems
wet a smaller surface area.
Design and management are closely linked
in a successful SIS system. Research studies and
on-farm producers both indicate that SIS systems
result in high-yielding crops and water-conserving
production practices only when the systems are
properly designed, installed, operated and
maintained (Rogers and Lamm, 2009) . Where

2
(Juan, 2001) reported that the success of a
subsurface irrigation system (SIS) system for row
crops for example depends on: design, installation,
operation, management and maintenance. Camp,
(1998) and (Behrouz, et al. 2007) illustrated that
Subsurface irrigation system has a higher
susceptibility for decreasing the loss of water by
evaporation, runoff, and deep percolation in
comparison to other irrigation systems that supply
water to the soil surface. In addition, the high cost
of traditional drip irrigation systems, due to annual
replacement of system components, is substantially
reduced when subsurface components are
permanently installed below the soil tillage zone.
Jan, and Kristen, (2011) reported that the
kapillary irrigation subsurface system textile
irrigation is the new generation irrigation
technology providing intelligent water saving
solutions for recreational spaces and sports fields.
KISSS, installed underground, moves water
upwards and outwards to the root zone at the soils
natural absorption rate, effectively wetting large
areas of soil with even distribution. Through this
process, KISSS reduces water usage by eliminating
water evaporation, overspray, and runoff. William,
et al. (2008) found that (KISSS) applied water
directly to the root zone of plants with a minimum
of water loss through runoff, evaporation and deep
drainage. In this system, water is applied below the
ground surface directly to the plants roots area,
resulting in a significant improvement in water
application over traditional drip irrigation system.
Also, since the water is applied below the surface,
the water wastage due to evaporation is almost
eliminated.
Soil Moisture Wetting Patterns:
Designing and planning trickle irrigation
without enough information from moisture
distribution information from moisture distribution
in the soil do not result in the correct result. (Singh,
et, al 2006) mentioned that the information on
depths and widths of wetted zone of soil under
subsurface application of water plays the great
significance in design and management of
subsurface irrigation System (SIS) for delivering
required amount of water and chemical to the plant
Distance of outlets, discharge rate, and time of
irrigation in drip irrigation have to determine so that
volume of wetted soil is close to volume of plant's
root as much as possible.
Due to increasing computer speed and the
availability of more comprehensive numerical
models for simulating flow in variably saturated
soils, numerical approaches are now increasingly
being used for evaluating water flow in (SIS) or
(DIS) (Taghavi et al.1984) and (Angelakis et al.
1993). Several recent studies used for this purpose
the two-dimensional version of HYDRUS as
(Giuseppe, 2007) and (Mohammad, et, al 2011) or
three dimension software SURfer10 software as
(Kekkonen, et, al 2010).
Liga and Slack (2004) used HYDRUS-2D
to estimate the wetting pattern for subsurface drip
irrigation, but did not compare the results of
HYDRUS-2D simulations with actual experimental

3
data. (Skaggs et al. 2004) carried out an extensive
analysis of multiple subsurface drip irrigation field
experiments, and successfully compared observed
wetting patterns with HYDRUS-2D model
predictions. (Lazarovitch et al. 2005) implemented
into HYDRUS-2D a new, system-dependent
boundary condition that considers source
properties, inlet pressure, and effects of the soil
hydraulic properties on calculated subsurface
source discharge and validated resulting code
against transient experimental data.
Material and Methods:
Research field experiments were conducted
on a 26 by 11 m plot located in the educational farm
of the College of Food and Agriculture Sciences,
King Saud University, Riyadh, Saudi Arabia on
Latitude N: 24ᵒ 44 11 and Longitude 46ᵒ 37 04.
Experiment Layout:
Three irrigation systems were used
on experiment: Surface Drip Irrigation (SDI),
Subsurface Irrigation System (SIS) and Kapillary
Irrigation Subsurface System (KISSS). The lateral
lateral for (SIS) and (KISSS) installed at 25cm
depth from soil surface, while the lateral of (DIS)
will be laid on the ground surface. That means the
field divided by five main plots (DIS, SIS25 and
KISSS25). Each system were designed and installed
for each field plot with laterals. Each plot consists
of three laterals lines, with length of 3 m. The
laterals were connected to PVC sub main laterals,
which were connected to galvanize steel main line.
The main line, sub main line and lateral lines are
placed above or the ground surface according the
irrigation system used in the study. These main
plots were replicate three times, as shown on (figure
1).
Water irrigation applied:
Two levels of irrigation will be
applied to the plots 100% of full irrigation that
required for irrigated vegetable crops by the three
irrigation systems (symbolized by I100) and 50% of
full irrigation that required for the crops
(symbolized by I50). These two level irrigation was
applied depending on the time required to irrigate
vegetable crops per day under drip irrigation
system. On irrigation level 100% (I100) were
irrigated 2hours, and on irrigation level 50% (I50)
were irrigated 1hour. Rate of irrigation on emitters
was (4L/h) on pressure (1.5) bar.
4
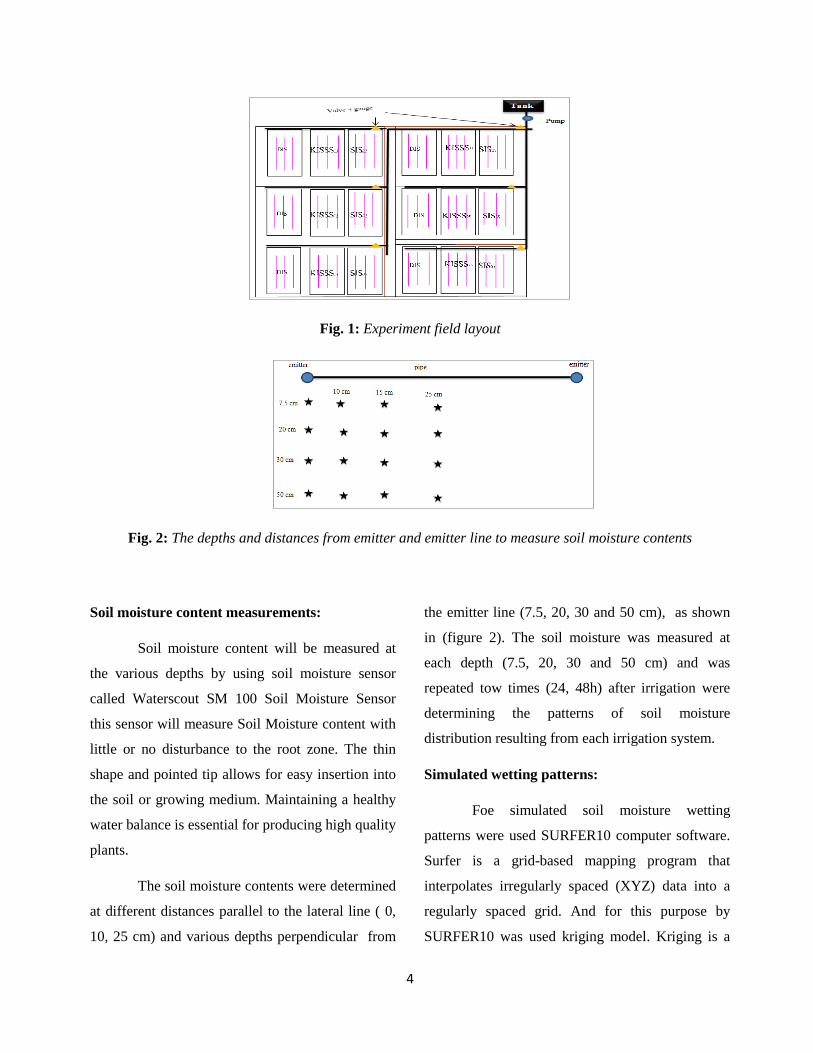
Fig. 1: Experiment field layout
Fig. 2: The depths and distances from emitter and emitter line to measure soil moisture contents
Soil moisture content measurements:
Soil moisture content will be measured at
the various depths by using soil moisture sensor
called Waterscout SM 100 Soil Moisture Sensor
this sensor will measure Soil Moisture content with
little or no disturbance to the root zone. The thin
shape and pointed tip allows for easy insertion into
the soil or growing medium. Maintaining a healthy
water balance is essential for producing high quality
plants.
The soil moisture contents were determined
at different distances parallel to the lateral line ( 0,
10, 25 cm) and various depths perpendicular from
the emitter line (7.5, 20, 30 and 50 cm), as shown
in (figure 2). The soil moisture was measured at
each depth (7.5, 20, 30 and 50 cm) and was
repeated tow times (24, 48h) after irrigation were
determining the patterns of soil moisture
distribution resulting from each irrigation system.
Simulated wetting patterns:
Foe simulated soil moisture wetting
patterns were used SURFER10 computer software.
Surfer is a grid-based mapping program that
interpolates irregularly spaced (XYZ) data into a
regularly spaced grid. And for this purpose by
SURFER10 was used kriging model. Kriging is a

5
geostatistical gridding method that has proven
useful and popular in many fields. This method
produces visually appealing maps from irregularly
spaced data. Kriging attempts to express trends
suggested in your data, so that, for example, high
points might be connected along a ridge rather than
isolated by type contours (Eddie, 2007).
Statistical analysis:
Experiment field divided to 3 main plots
DIS, SIS25 and KISSS25. Also there was 2 sub-plots
for irrigation level 50, 100%. In addition there was
2 Sub-Sub-plot for elapse time measurement. Al
this main plots, sub- plot and sub- sub plot was
replicated three times. For these divisions was used
split- split plot design. For this purpose was used
Costat computer software.
Result and Discussion:
The wetting patterns of soil moisture
content for KISSS generally showed that the KISSS
had higher soil moisture content than SIS,
especially near surface 9 above the laterals,
although the difference significant showed under
laterals. A study by (Viola, 2008) observed that the
soil water content was consistently higher in the
KISSS compared with the conventional SIS. The
result showed that on KISSS saved water at depth
10 and 15 cm long time, where the VWC at depth
10cm was 42,43% at 24h after irrigation as shown
in (Figure 3-a) while at same depth the VWC at 48h
after irrigation within 39, 40%, as shown in (Figure
-b).
Fig. 3: Soil moisture wetting patterns of Kapillary Irrigation Sub-Surface System (KISSS25) at 50%
Irrigation Level, (a) 24h, and (b) 48h after irrigation
a b

6
For tube depth at 25cm the SIS and KISSS
showed that there was different in moisture content
at 24h after irrigation and SIS at pipe depth 25cm
(Figure 4 a,b) where the moisture content in SIS is
a more deep percolation than KISSS. Volumetric
water content at depth 40cm for example in SIS
were 32-34% where for KISSS were 22-23% ,
however at depth 50cm the moisture content in
SIS was 36-38% but in KISSS was less than 20%.
From (Figure 3 a,b) and (Figure 5a,b) the
study showed that the moisture content in the
kapillary irrigation system KISSS is concentrated
near the surface of the soil to depth 25 cm. This
depth near surface is very important for crops,
where (Evans, et, al. 1996) remarked that water
uptake by a specific crop is closely related to its
root distribution in the soil. About 70 percent of a
plant's roots found in the upper half of the crop's
maximum rooting depth. Deeper roots can extract
moisture to keep the plant alive, but they do not
extract sufficient water to maintain optimum
growth. When adequate moisture is present, water
uptake by the crop is about the same as its root
distribution. Thus, about 70 percent of the water
used by the crop comes from the upper half of the
root zone. This zone is the effective root depth.
Fig. 4: Soil moisture wetting patterns of Subsurface Irrigation System (SIS25) at 50%Irrigation Level, (a)
24h, and (b) 48h after irrigation
a b

7
Fig. 5: Soil moisture wetting patterns of Kapillary Irrigation Sub-Surface System (KISSS25) at 100%
Irrigation Level, (a) 24h, and (b) 48h after irrigation
At a distance 25cm and depth 7.5cm
point B (25,7.5) the study showed that the mean soil
water content for KISSS25 was 47.954% for DIS
25.22% , while LSD were 1.1637 in 0.05
Significance level. Decreasing on soil water content
at this depth 7.5cm on DIS showed that there were
lost on water due to evaporation. But the decline in
the moisture content in SIS may be because wetted
patterns move in vertical direction more than
horizontal direction. In addition the plastic tape
glued on the geo-textile above the emitters deflects
the discharged water and prevents tunneling into the
surrounding soil. (Philip and Charlesworth, 2003)
also mentioned that on KISSS the wetting pattern
has been enhanced by the addition of plastic
barriers beneath the drip line.
Simulated wetted width and depth was
affected by discharge rates of laterals. With
increasing discharge rates of laterals depths and
width of wetted patterns soil increased. (Goldberg
and Shmueli 1970) was indicated that the rate of
horizontal direction.
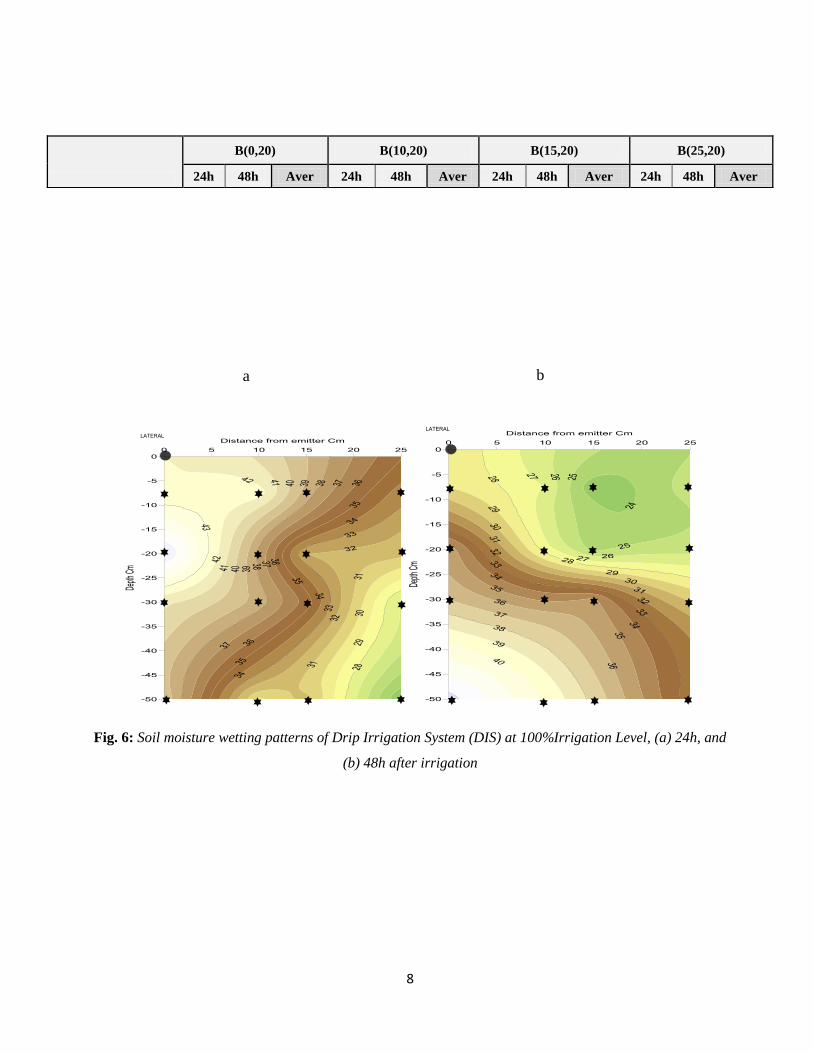
The result shows that SIS25 induced higher
significant (P<0.01) at point B(0,30) than other
system irrigation . However the KISSS25 at 50%
level of irrigation and at 48h after irrigation was
given same values for DIS (Figure 6) at 100%
amount of water after 24h from applied irrigation.
The result showed that the lowest mean values of
moisture content were measured on DIS at I50 after
24h from applied irrigation. From Table (1) the
result also illustrated that there is significant
between kapillary irrigation subsurface system
where found the KISSS25 at I50 is higher than
KISSS15 at I100 after 48h from irrigation.
a b
8
Fig. 6: Soil moisture wetting patterns of Drip Irrigation System (DIS) at 100%Irrigation Level, (a) 24h, and
(b) 48h after irrigation
B(0,20) B(10,20) B(15,20) B(25,20)
24h 48h Aver 24h 48h Aver 24h 48h Aver 24h 48h Aver
a b

9
Table (1) Effect of amount of water and elapsed time on irrigation system at depth 20cm
The result showed that at depth 50cm
underground the SIS25 achieved high significant
(P<0.05) compared with other system. As shown in
Table (2) at point B(0,50) subsurface irrigation
system when installed tube at depth 25m induced
high value of moisture content more than it at
15cm depth tube. Result also showed that the
KISSS25 at the 50% level of irrigation at 48h. The
result also indicated that at point B(0,50) commonly
there is no- significant (P ≤ 0.1343) for irrigation
level and elapse time - 0.05 significance level- to
irrigation system. Also result at this point showed
that there is no-significant (P ≤ 0.1152) for amount
of water on elapsed time for kapillary irrigation
subsurface system as shown in (figure 5).
Fig. 7: Soil moisture wetting patterns of Drip Irrigation System (DIS) at 50%Irrigation Level, (a) 24h, and
(b) 48h after irrigation
Table (2) Effect of amount of water and elapsed time on irrigation system at depth 50cm
Dis L 50% 26.3 25.9 26.1 25.2 24.8 25.0 23.3 24.3 23.8 23.0 21.5 22.3
L100% 47.3 35.6 41.4 43.6 27.5 35.5 32.0 24.7 28.3 31.4 25.7 28.5
Average 36.8 30.7 33.8 34.4 26.1 30.3 27.7 24.5 26.1 27.2 23.6 25.4
SIS25 L 50% 27.5 23.8 25.7 22.9 22.2 22.6 22.8 22.7 22.8 21.8 19.0 20.4
L100% 40.6 36.9 38.8 39.2 32.6 35.9 41.9 33.8 37.9 38.8 31.7 35.3
Average 34.1 30.4 32.2 31.1 27.4 29.2 32.3 28.3 30.3 30.3 25.4 27.8
KISSS25 L 50% 53.7 49.2 51.4 52.5 48.9 50.7 53.0 48.1 50.5 51.5 45.9 48.7
L100% 63.1 54.6 58.8 62.2 53.5 57.9 60.4 51.8 56.1 60.4 52.1 56.3
Average 58.4 51.9 55.1 57.4 51.2 54.3 56.7 50.0 53.3 55.9 49.0 52.5
LSD
Is *IL 1.7591 1.1436 0.9782 0.8830
IL* Te 1.0745 1.0007 0.8571 0.8630
IL*I S *Te 2.4027 2.2377 1.9166 1.9297
a b

10
B(0,50) B(10,50) B(15,50) B(25,50)
24h 48h Aver 24h 48h Aver 24h 48h Aver 24h 48h Aver
Dis L 50% 34.0 37.3 35.6 28.8 34.2 31.5 14.3 30.2 22.2 12.7 27.6 20.1
L100% 39.7 43.4 41.5 29.7 39.9 34.8 32.7 38.5 35.6 23.0 32.5 27.8
Average 36.8 40.3 38.6 29.3 37.0 33.2 23.5 34.3 28.9 17.9 30.0 23.9
SIS25 L 50% 41.3 44.9 43.1 35.5 43.4 39.5 30.7 39.0 34.9 31.2 29.6 30.4
L100% 48.1 51.7 45.9 46.7 41.3 44.0 48.1 35.9 42.0 40.1 35.2 37.7
Average 44.7 44.3 44.5 41.1 42.4 41.7 39.4 37.5 38.4 35.7 32.4 34.0
KISSS25 L 50% 14.5 22.9 18.7 14.4 20.0 17.2 14.5 18.4 16.4 14.9 20.8 17.9
L100% 15.8 21.7 18.7 15.3 20.4 17.9 14.9 16.7 15.8 14.9 19.1 17.0
Average 15.1 22.3 18.7 14.9 20.2 17.6 14.7 17.5 16.1 14.9 20.0 17.5
LSD
Is *IL 1.3072 2.4428 1.4357 1.1848
IL* Te 1.8390 2.2010 1.1442 0.9323
IL*I S *Te 4.1122 4.9215 2.5586 2.0846
There is significant for SIS at this point
B(0,50) for subsurface irrigation system at two depth
layout, where at SIS25 the moisture content was
increased when applied 100% amount of water at
48h. This result consist with (Dabral, et, al. 2012)
observed that wetting pattern is significant in
deciding depth of lateral placement below soil
surface, emitter spacing and system pressure for
delivering required amount of water to the plant.
The higher significant for SIS at depth 50cm
illustrated there a loss of water by a deep
percolation more than kapillary irrigation. At point
B(10,50) there is highly significant (P < 0.05) for
irrigation level and also there is significant for
measurement time 24, 48h after irrigation.
Fig. 8: Soil moisture wetting patterns of Subsurface Irrigation System (SIS25) at 50%Irrigation Level, (a)
24h, and (b) 48h after irrigation
Conclusions:
a b

11
The result indicated that there were significant
differences between irrigation levels I50, I100 at
any irrigation systems. In addition there were
significant differences between the elapsed time
measurements of 24 and 48h after irrigation. The
best wetting patterns were typically observed in the
parallel direction, especially under the emitter, as
compared with the perpendicular direction,
especially in the kapillary irrigation subsurface
system. The plastic tape glued to the geo-textile
above the emitters at KISSS deflected the
discharged water and prevented tunneling into the
surrounding soil.
Reference:
Angelakis, A.N., Kadir, and D.E. Rolston. (1993).
Time-dependent soil-water distribution under a
circular trickler source. Water Resour. Manage.
7:225–235.
Behrouz, M., Roghayeh,K., Saghaian, H. and
Jalalian, A. (2009). The comparison of advance
and erosion of meandering furrow irrigation
with standard furrow irrigation under varying
furrow inflow rates. Irrigation Drainage System
23:181–190. DOI 10.1007/s10795-010-9093-7.
Camp CR (1998) Subsurface drip irrigation: a
review. Trans ASAE 41(5):1353–1367.
Dabral, P. P., Pandey, P. K., Ashish, P., Singh, K.
P. and Sanjoy, M. (2012) Modelling of wetting
pattern under trickle source in sandy soil of
Nirjuli, Arunachal Pradesh (India). Irrig Sci
30:287–292. DOI 10.1007/s00271-011-0283-3
Giuseppe, P. (2007). Using HYDRUS-2D
Simulation Model to Evaluate Wetted Soil
Volume in Subsurface Drip Irrigation Systems.
J. Irrig. Drain Eng.(133) Page 342-349 (2007).
Goldberg D, Gormat B, Bar Y (1971). The
distribution of roots, water and minerals as a
result of trickle irrigation. J. Am. Soc. Hortic.
Sci. 96:645-648.
Jan, S. and Kristen, P, (2011). KISSS Outperforms
Traditional Irrigation in Independent Study for
Sports Field Management. Longmont, Colo.
(PRWEB) July 26, 2011 available online:
http://www.prweb.com/releases/2011/KISSSDo
dds/prweb8671677.htm.
Juan, E. (2001). Installing a Subsurface Drip
Irrigation System for Row Crops. Produced by
Agricultural Communications, The Texas A&M
University System Extension publications. No.
45049-01149. B-6151/7/04 (2001).
Kekkonen, V., Hakola, A. Kajava, T., Sahramo, E.
Malm, Maarit K. and Robin H. Self-erasing and
rewritable wettability patterns on ZnO thin films.
American Institute of Physics. Applied Physics
Letters 97, 044102(2010).
Lawrence, J. and Blaine, R. (2007) Surface Drip
Irrigation. Developments in Agricultural
Engineering, Volume 13, 2007, Pages 431-472.
Lazarovitch N, Warrick AW, Furman A, Sˇimu˚nek
J (2007) Subsurface water distribution from drip
irrigation described by moment analyses.
Vadose Zone J 6:116–123 (2007).
Liga, M. Slack, D. (2004) A design model for
subsurface drip irrigation in Arizona. Dep Agri
Biosys, Arizona. Available online
http://wsp.arizona.edu/sites/wsp.arizona.edu/file
s/uawater/documents/Fellowship200304/liga.pdf
.
Mohammad, R., Shamsnia, S. A. and Gholami, A.
(2011). Evaluation of water flow and infiltration
using HYDRUS model in sprinkler irrigation
system. IPCBEE vol.17 (2011).
Najafi, P. and Tabatabaei S. H. (2009). Application
of sand and geotextile envelope in subsurface
drip irrigation. American Society of Civil
Engineers. ICPTT Page 2026-2030 (2009).
Neilsen, D., P. Parchomchuk,.G. H. Nelson, and E.
J. Hogue. (1998). Using soil moisture
monitoring to determine the effects of irrigation
management and fertigation on nitrogen
availability in high-density apple orchards. J.
Am. Soc. Hort. Sci. 123(4):706-713.
Philip B., Charlesworth., Warren, A. and Muirhead
(2003). Crop establishment using subsurface
12
drip irrigation: a comparison of point and area
sources. DOI 10.1007/s00271-003-0082-6. Irrig
Sci 22: 171–176 (2003).
Rogers D. H. and Lamm, F. R. (2009). KEYS TO
SUCCESSFUL ADOPTION OF SDI:
Minimizing Problems and Ensuring Longevity.
Proceedings of the 21st Annual Central Plains
Irrigation Conference, Colby Kansas, Available
from CPIA, 760 N.Thompson, Colby, Kansas.
February 24-25, (2009).
Singh, D. K., Rajput, T. B., Sikarwar, H. S., ahoo,
R. N. and Ahmad, T. (2006). Simulation of soil
wetting pattern with subsurface drip irrigation
from line source. Sc. Direct: agricultural water
management (8 3). Page 130-134. (2006).
Skaggs T.H., TJ, Simunek, J., Shouse, P. (2004)
Comparison of HYDRUS-2D simulations of
drip irrigation with experimental observations. J
Irrig Drainage Eng 130(4):304–310(2004).
Taghavi, S.A., M.A. Marino, and D.E. Rolston.
(1984). Infiltration from a trickle irrigation
source. J. Irrig. Drain. Eng. 110:331–341.
Tom, M., Kenny, C. (2003). Drip Irrigation. Issued
in furtherance of Cooperative Extension work
University System of West Virginia. (2003).
Viola, D. (2008) A thesis submitted for the Degree
of Master of Science -Agriculture (Honours)
University of Western Sydney, School of
Natural Sciences August 2008
http://www.irrigationfutures.org.au/imagesDB/n
ews/ViolasThesis.pdf .
William Y., Harsharn G. and Basant. (2008)
Evaluating Water Saving Using Smart Irrigation
and Harvesting Systems. Irrigation Australia
Conference May 2008, Melbourne.
http://www.irrigation.org.au/assets/pages/75D13
2F4-1708-51EB-A6BCF9E277043C3E/11%20-
%20Yiasoumi%20Paper.pdf.

13