effect of hydrostatic pressure on the pitting corrosion behavior of
TRANSCRIPT
Int. J. Electrochem. Sci., 9 (2014) 778 - 798
International Journal of
ELECTROCHEMICAL SCIENCE
www.electrochemsci.org
Effect of Hydrostatic Pressure on the Pitting Corrosion
Behavior of 316L Stainless Steel
Zhongyi Wang1, Yuan Cong
2, Tao Zhang
2,3,*
1College of Power and Energy Engineering, Harbin Engineering University, Nantong ST 145, Harbin,
150001, China 2 Corrosion and protection Laboratory, Key Laboratory of Superlight Materials and Surface
Technology (Harbin Engineering University), Ministry of Education, Nantong ST 145, Harbin,
150001, China 3 State Key Laboratory for Corrosion and Protection, Institute of Metal Research, Chinese Academy of
Sciences, Wencui RD 62, Shenyang, 110016, China) *E-mail: [email protected]
Received: 23 September 2013 / Accepted: 12 November 2013 / Published: 8 December 2013
The pitting corrosion behavior of 316L stainless steel (316L SS) was investigated by electrochemical
measurements, nanoindentation and microscopy observation. The experiment results have been
analyzed based upon the stochastic theory. Pitting initiation process has been modeled as
anonhomogeneous Poisson process and analyzed using a Weibull distribution function. Pitting growth
process has been simulated by a nonhomogeneous Markov process and analyzed using Gumbel
distribution function. The analysis results revealed that hydrostatic pressure had three effects on the
pitting corrosion behavior of 316L SS: (1) the increasing hydrostatic pressure enhance the mechanical
properties of passive film; (2) the increasing hydrostatic pressure retarded the B1 process and
accelerated the A3 process; (3) the pitting growth probability decreased with the increase of
hydrostatic pressure. The above three factors led to the improvement of pitting corrosion resistance of
316L SS with the increasing of hydrostatic pressure.
Keywords: hydrostatic pressure; pitting corrosion; stochastic analysis; 316L SS; Deep Ocean
1. INTRODUCTION
Oil and gas exploitation in deep ocean environment imply challenging harsh corrosive
environments for structural materials because of the hydrostatic pressure and the different dissolved
oxygen (DO). Thus, the corrosion problem of materials in deep ocean condition must be considered.

Int. J. Electrochem. Sci., Vol. 9, 2014
779
Some natural ocean tests were reported by American [1-3], Indian [4, 5] and Russian [6, 7].
They revealed that materials undergo serious corrosion in deep ocean. However, deep ocean
environment is a complex system: hydrostatic pressure, different DO, delicately balanced solution of
many salts, suspended silt, and decaying organic material. The individual effect of each of the above
factors affecting corrosion behavior is not readily distinguishable.
Some laboratory experiments simulating deep sea environment [9-14] were investigated, the
results of which demonstrated that hydrostatic pressure was an ineligible aspect to material corrosion.
Beccaria et al. [10] reported the effect of hydrostatic pressure on the corrosion of nickel, showing that
by increasing the hydrostatic pressure, the corrosion rate and the susceptibility to pitting of nickel
increased in NaCl solution and decreased in sea water because of the different nature of the corrosion
layers formed in these solutions. And also influence of hydrostatic pressure on corrosion of aluminum
and 6061-T6 aluminum alloy in sea water were studied by Beccaria and Poggi et al. [11, 15]. The
results revealed that on increasing the hydrostatic pressure the corrosion of aluminum increased,
mainly as a result of increasing in localized corrosion, and the average corrosion rate of 6061-T6
aluminum alloy decreased due to the formation of an Mg-Al oxide layer which was more protective
than aluminum hydroxides. Our previous work also indicated that the hydrostatic pressure increased
the corrosion susceptibility of Fe-20Cr alloy, Ni-Cr-Mo-V steel, Nickel and Zn anode [16-21].
However, there are a number of areas where the effects of hydrostatic pressure are not known,
including its effect on the pitting corrosion resistance, such as pitting potential and passive current
density, on the mechanical property of passive film, on the pitting initiation process, on the pitting
geometry and on the pitting growth probability.
Pitting corrosion is a complicated phenomenon. The pitting generation event has been widely
known to be a stochastic nature [22]. Recently, stochastic analysis has been proposed to investigate the
pitting initiation processes. Localized corrosion of different metals or alloys in vary systems has been
characterized in terms of stochastic analysis [23-34].
In the present work, the corrosion behavior of 316L SS was investigated through a series of
laboratory test in 3.5% NaCl solution during which only the hydrostatic pressure was changed, all
other parameters (DO, temperature, etc.) remaining constant. The effect of hydrostatic pressure on the
corrosion of 316L SS was discussed.
2. EXPERIMENTAL
2.1. Materials
The material was 316L stainless steel (316L SS) whose main compositions were: 19.4% Cr,
11.8% Ni, 2.2% Mn, 2.4% Mo, 0.2% Si. All of the specimens were wet ground to a 1000-grit finish,
degreased with acetone, cleansed with distilled water and dried in a compressed hot air flow. The test
solution was 3.5% NaCl with a DO concentration of about 6.5 ppm.

Int. J. Electrochem. Sci., Vol. 9, 2014
780
2.2. Experimental setup
Figure 1. Schematic diagram of the experimental setup for deep ocean corrosion study. (1) nitrogen
vessel, (2) hydropneumatic pump, (3) valve, (4) colling equipment, (5) temperature monitor,
(6) solid-reference-electrode, (7) thermocouple, (8) working electrode, (9) counter electrode
and (10) pressure meter.
The pressure vessel was shown in Fig.1, which was pressurized with a hydropneumatic pump
by using high purity nitrogen. According to Henry’ law, it can be believed that the oxygen pressure
was unchanged with the increasing of nitrogen pressure. Nitrogen pressure has no influence on the DO
concentration.
2.3. Electrochemical measurements
For all the experiments, a three-electrode cell was used with a counter electrode of platinum
(20mm×20mm) and an Ag/AgCl reference electrode. The potential of the Ag/AgCl reference electrode
was compared (within the pressure range 1-100 atm) with that of identical electrode maintained at 1
atm. The slight change (-5mV at 100 atm) of the pressurized Ag/AgCl reference electrode potential
was noted in further measurements of the working electrode potential at various pressures. The test
pressures were 1 atm and 80 atm.
The potentiodynamic polarization technique was used to determine the pitting potential of
316L SS. The potentiodynamic polarization curves with the scan rate 0.333mV/s were measured,
which were carried out using a model 273A potentiostat (EG&G). At least thirty replicates were used
for each potential sweep velocity. Prior to all electrochemical measurements, the specimens were
initially reduced potentiostatically at -1VSHE for 1 min to remove air-formed oxides from the surface
and then kept for 1hour in the NaCl solution at various hydrostatic pressures.
Int. J. Electrochem. Sci., Vol. 9, 2014
781
Induction time of 316L SS at various hydrostatic pressures was determined by
chronoamperometry curve under a constant potential of 300 mVSHE. Thirty replicates were used for the
specimens.
2.3. Microstructure observation
2.3.1. SEM
The pitting morphology of 316L SS after the potentiostatic measurements were studied by
means of an X-Max SEM.
2.3.2. Pitting mouth size and pitting depth measurement
The tested pitting was gently rinsed and dried for examination with an optical microscope. The
size of the pitting mouth s was determined from photography by measuring the area of the pitting
mouth with a planimeter in the microscope. The estimated error in s is 5%. Pitting depths h, which
were treated with ultrasound to rupture the pitting lacy, were measured by applying the Fine Focus
Technique [35], where the distances required shifting the optical objective between the focal points on
the original surface of sample and on the bottom of the pitting is compared. The estimated error in h is
1μm.
3. RESULTS AND DISCUSSION
3.1. Effect of hydrostatic pressure on the pitting corrosion resistance of 316L SS
3.1.1. Potentiodynamic polarization

Int. J. Electrochem. Sci., Vol. 9, 2014
782
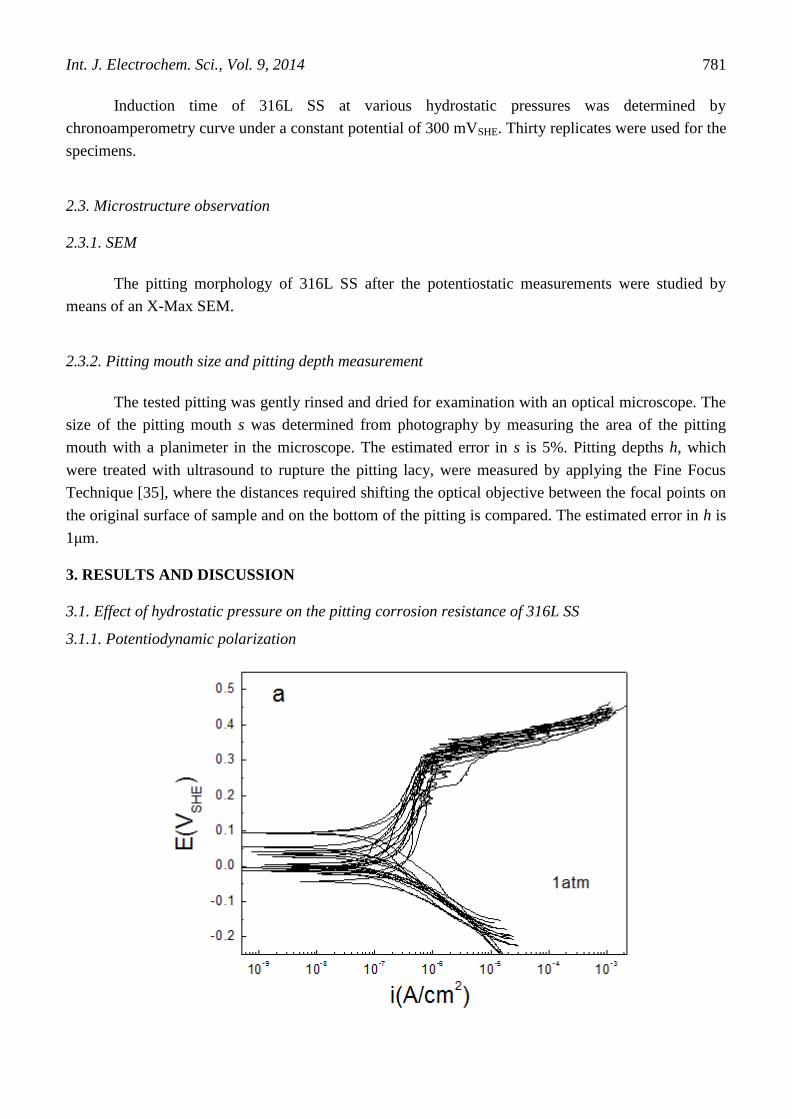
Figure 2. Potentiodynamic polarization curves of 316L SS at (a)1 atm and (b) 80 atm hydrostatic
pressures.
Figure 3. The distribution of pitting potential of 316L SS at (a) 1atm and (b) 80 atm hydrostatic
pressure.
The polarization curves of 316L SS at various hydrostatic pressures were exhibited in Fig. 2.
On the presented curves for each electrode, a pitting potential could be determined. It could be found

Int. J. Electrochem. Sci., Vol. 9, 2014
783
that the pitting potential data were scatted. The distributions of pitting potential for 316L SS at various
hydrostatic pressures were plotted as illustrated in Fig. 3. Cumulative probability shown in a vertical
abscissa was calculated by a mean rank method:
)1( NiPcum (1)
Where Pcum is the cumulative probability of measured pitting potential (Epit), i is the order in
the total number N (i = 1, 2, 3, …, N). All of the pitting potential distributions exhibited a linear
behavior, indicating that the distribution of pitting potentials measured followed the normal probability
distribution.
The median of distribution Em, decided at P = 50%, was determined from Fig. 3. As can be
seen from Fig. 3, the pitting potential Em, shifts to the noble direction with hydrostatic pressure
(increased from 309mV to 323 mV), suggesting that the pitting corrosion resistance was improved
with the increasing of hydrostatic pressure.
3.1.2. Electrochemical impedance spectroscopy
Figure 4. (a) Nyquist plot and (b) Bode plot of 316L SS at different hydrostatic pressures

Int. J. Electrochem. Sci., Vol. 9, 2014
784
The EIS results measured at different hydrostatic pressures were illustrated in Fig.4. The
equivalent circuit in Fig. 5 was used to fit the EIS data.
Figure 5. Equivalent circuits for EIS data
Where Rs was the solution resistance, Qf was the capacitance of passive film and Rf was the
resistance of passive film, Qdl was the double layer capacitance, Rt was the charge transfer resistance. It
could be observed that the equivalent circuits fit the experimental data well in most of the frequency
range, and the fitted results were listed in Table 1.
Table 1. Element values of equivalent circuit to fit the impedance data in Fig.4
Hydrostatic
pressure
Rf(Ω.cm2) CPEf Rt(Ω.cm
2) CPEdl
Y0(Ω-1
.cm-2
.sn) n Y0(Ω
-1.cm
-2.s
n) n
1 atm 1478 7.96×10⁻⁴
0.79 — — —
60 atm 408 4.87×10⁻³
0.74 677 9.13×10⁻⁴
0.79
Both Rf and Rt of 316L SS increased with hydrostatic pressure, indicating the enhance of
corrosion resistance, which was consistent with the results of potentiodynamic polarization.
3.2. Effect of hydrostatic pressure on the mechanic properties of passive film
Fig. 6 exhibited the typical load-depth curves measured with ex-situ indentation tests for 316L
SS surfaces passivated at 300 mVSHE at various hydrostatic pressures. In the unloading direction, the
indentation depth decreased with decreasing load mainly due to the recovery of elastic deformation.

Int. J. Electrochem. Sci., Vol. 9, 2014
785
Figure 6. Load-depth curves for 316L SS surfaces passivated at 300 mVSHE at various hydrostatic
pressures.
Figure 7. Hardness of passive film of 316L SS formed at various hydrostatic pressures

Int. J. Electrochem. Sci., Vol. 9, 2014
786
Figure 8. Elastic modulus of passive film of 316L SS formed at various hydrostatic pressures
The hardness and elastic modulus of passive film of 316L SS formed at various hydrostatic
pressures were illustrated in Fig.7 and Fig.8, respectively. The passive film formed at 80 atm
hydrostatic pressure showed higher value level of hardness and elastic modulus, implying superior
mechanical properties, which indicated that the passive film formed at 80 atm hydrostatic pressure was
more difficult to fracture that that at 1 atm pressure. This suggested that the passive film formed at 80
atm hydrostatic pressure had a higher corrosion resistance [36, 37].
3.3. Effect of hydrostatic pressure on pitting initiation of 316L SS
The time when current increase rapidly is the induction time (τ). Repetition of the same
experiment yielded a number of induction time values.
The pitting formation event has been widely known to be a stochastic process. T. Shibata
presented a stochastic theory of pitting corrosion based upon sensitivity analysis of parameters in the
stochastic model that could rationally explain stochastic distributions of induction time for pitting
formation [23-29]. In the stochastic model, the pitting formation process does not fit a simple
exponential distribution, but could be explained by assuming series or parallel combinations of the
simple birth stochastic process and birth/death process. The proposed models can be divided into two
groups [23-29]: (1) Pure birth stochastic models, which only consider pitting generation events; (2)
Birth and death stochastic models, which assume stochastic pitting generation and pitting
repassivation.

Int. J. Electrochem. Sci., Vol. 9, 2014
787
Table 2. Analytical expressions of the survival probability function for various stochastic models.
Model Survival probability function
Birth process
A1 simple
A2 series
A3 parallel
A4 combination
P(t)=exp[–λ(t–t0)]
P(t)=exp[–mλ(t–t0)]
P(t) =1-{1-exp[–λ(t–t0)]} m
P(t) = Σfi exp[–λi(t–t0)]
Birth and death process
B1 parallel
B2 series
P(t) =μ/(λ+μ) +λ/(λ+μ) exp[-(λ+μ) (t–t0) ]
P(t) = exp[–αλ(t–τc) exp (–μτc) ]
Figure 9. A schematic illustration of ln Psur vs time of various stochastic models.
The expected equations for the survival probability, Psur, and time for pitting formation
formulated for each model are shown in Table 2 [23-29] and corresponding curves between ln(Psur)
and time for each mode are illustrated in Fig. 9 [23-29].
Fig. 10 showed the logarithm of the survival probability, Psur, as a function of induction time, t,
for 316L SS at 1 atm and 80 atm pressure, respectively. This distribution type was the specific
character of the combination of B1 model (parallel birth and death stochastic model) and A3 model
(parallel birth stochastic model). In the other word, the plots of the distribution of induction time for
316L SS at various hydrostatic pressures exhibited analogue shape, which suggested that hydrostatic
pressure did not change the pitting initiation mechanism.

Int. J. Electrochem. Sci., Vol. 9, 2014
788
Figure 10. Plots of survival probability, Psur, vs time for 316L SS at various hydrostatic pressures.
Figure 11. Weibull distribution for pitting induced time of 316L SS at various hydrostatic pressures.
Pitting corrosion initiation is modeled using a nonhomogeneous Poisson process [38, 39]. In
this way, the distribution of corrosion induction times can be simulated using the Weibull distributions.
Weibull distribution function is one of the widely used cumulative probability functions for predicting

Int. J. Electrochem. Sci., Vol. 9, 2014
789
life time in reliability test 40]. This is because it can easily approximate the normal distribution,
logarithmic normal distribution and exponential distribution functions. In addition, it is also possible to
analyze data even when two or more failure modes are present at the same time. The cumulative
probability F(t) of a failure system can be introduced just as Weibull distribution function based upon
a “weakest-link” model [40-42], which is expressed as
)nt(F(t) m exp1 (2)
where m and n are the shape and scale parameters, respectively. From rearrangement of Eq. (2):
ntmF(t))]}/([{ lnln11lnln (3)
By fitting Eq. (3) to the cumulative probability numerically calculated, two parameters m and n
can be determined from the slope of the linear ln {ln [1/(1-F(t))]} versus ln t plots and from the
intercept on the ln {ln [1/(1- F(t))]} axis, respectively.
The Weibull probability plots for 316L SS at various hydrostatic pressures were shown in Fig.
11. Both plots showed satisfactorily good two straight lines. These two slopes represent two limiting
cases corresponding to corrosion initiation process dominant B1 model and A3 model, respectively.
From Fig. 11, the values of m and n for corrosion initiation dominant by different stochastic model
were quantitatively determined, which were listed in Table 3.
Table 3. Weibull distribution parameters of pure magnesium in the absence and presence of magnetic
field.
Hydrostatic
pressure
Stochastic model Shape parameters m Location parameters n
1 atm B1 0.855 248.668
A3 2.013 97841.099
80 atm B1 0.849 335.640
A3 1.127 2612.806
According to stochastic theory, it may be possible to predict the generation probability of
events in the future from the past events. This is so-called “the conditional probability”. Based upon a
stochastic theory, the corrosion initiation rate could be calculated by [43-45]:
1 mtn
mr(t) (4)
The value of r(t)(/s) represents the rate of the corrosion initiation process dominant by different
stochastic model in the next unit time for the specimens. The rate r(t) was determined by inserting the
values of the shape and scale parameter m and n given in Table 3, into Eq. (4).

Int. J. Electrochem. Sci., Vol. 9, 2014
790
Figure 12. Plots of the pitting initiation rate for 316L SS at various hydrostatic pressures.
The resulting rate for corrosion initiation, r(t), was illustrated in Fig. 12. It was observed that
the corrosion initiation rate of A3 model was increased with hydrostatic pressure, while, the corrosion
initiation rate of B1 model decreased with hydrostatic pressure.

Int. J. Electrochem. Sci., Vol. 9, 2014
791
3.4. Effect of hydrostatic pressure on pitting geometry of 316L SS
Figure 13. pitting corrosion morphology of 316L SS at various hydrostatic pressures.
The pitting corrosion morphology of 316L SS was illustrated in Fig.13. The pitting mouth size
and pitting depth were measured by applying the Fine Focus Technique [35].

Int. J. Electrochem. Sci., Vol. 9, 2014
792
Figure 14. The distributions of (a) pitting mouth size and (b) pitting depth of 316L SS at various
hydrostatic pressures.
The distributions of the pitting mouth size and pitting depth of 316L SS at various hydrostatic
pressures were graphically represented in Fig.14. Fig.14 indicated that the pitting mouth size was
increased with the increasing of hydrostatic pressure; meanwhile, the pitting depth was decreased with
hydrostatic pressure.

Int. J. Electrochem. Sci., Vol. 9, 2014
793
Some scientists suggested that the pitting geometry could be described by the ratio of pitting
mouth size s and pitting depth h (s/2h) [46-48]:
s/2h <1, pitting geometry exhibits deep-hole shape;
s/2h =1, pitting geometry shows hemispherical shape;
s/2h >1, pitting geometry demonstrates shallow-disk shape;
The schematic illustration of pitting geometry was exhibited in Fig.15.
Figure 15. A schematic illustration of pitting geometry, s/2h <1, pitting geometry exhibits deep-hole
shape; s/2h =1, pitting geometry shows hemispherical shape; s/2h >1, pitting geometry
demonstrates shallow-disk shape.
Figure 16. The pitting geometry of 316L SS at different hydrostatic pressure.
Int. J. Electrochem. Sci., Vol. 9, 2014
794
Fig.16 showed the pitting geometry of 316L SS at different hydrostatic pressures. The ratio of
measured pitting mouth width to depth s/2h did depend upon the hydrostatic pressure and increased
significantly with increasing hydrostatic pressure. At 1 atm hydrostatic pressure, s/2h data distributed
around 0.35, implying the geometry of pitting cavity characterized as deep-hole shape. However, with
the increasing hydrostatic pressure, the pitting geometry of 316L SS was distinguished by
hemispherical shape and deep-hole shape (s/2h data ranged form 0.36 to 1.13).
The results of Fig.16 indicated that the hydrostatic pressure had significant influence on the
type of pitting geometry. The increasing hydrostatic pressure increased the probability of
hemispherical shape pitting cavity.
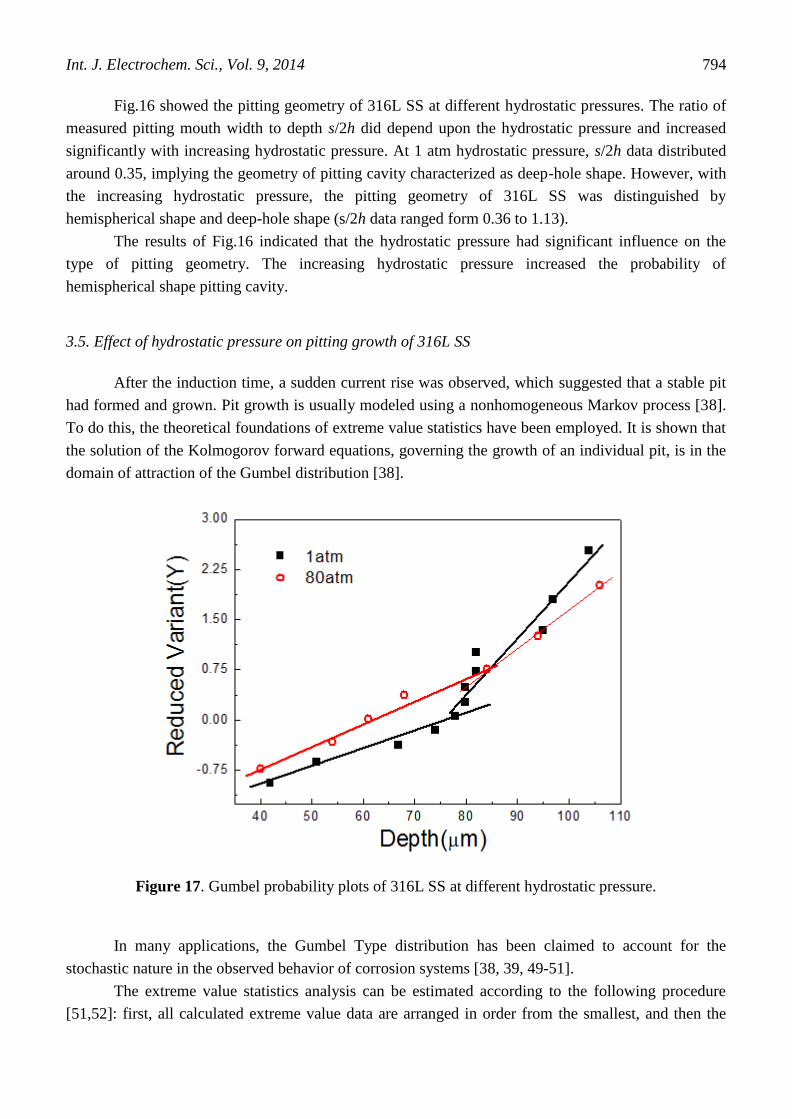
3.5. Effect of hydrostatic pressure on pitting growth of 316L SS
After the induction time, a sudden current rise was observed, which suggested that a stable pit
had formed and grown. Pit growth is usually modeled using a nonhomogeneous Markov process [38].
To do this, the theoretical foundations of extreme value statistics have been employed. It is shown that
the solution of the Kolmogorov forward equations, governing the growth of an individual pit, is in the
domain of attraction of the Gumbel distribution [38].
Figure 17. Gumbel probability plots of 316L SS at different hydrostatic pressure.
In many applications, the Gumbel Type distribution has been claimed to account for the
stochastic nature in the observed behavior of corrosion systems [38, 39, 49-51].
The extreme value statistics analysis can be estimated according to the following procedure
[51,52]: first, all calculated extreme value data are arranged in order from the smallest, and then the

Int. J. Electrochem. Sci., Vol. 9, 2014
795
probability F(Y) is calculated as 1-[M/(N + 1)], where M is the rank in the ordered extreme value and
N the total number of extreme value data. The reduced variant (Y) can be calculated by the formula
Y=-ln {-ln [F(Y)]}.
The probability that the largest value of pit depth is described by a double exponent (Gumbel
Type extreme value distribution) can be calculated by the following form equations [51,52].
SαμPit lnmax (5)
]}α
S])αdepth-[μ-(pitting [{
lnexpexp1depth pitting ofy Probabilit
(6)
where μ is the central parameter (the most frequent value), S is the specimen area and α is the
scale parameter, which defines the width of the distribution.
The largest pit depth within each of the potentiostatic measurements were determined by Fine
Focus Technique [35] and the values were subjected to extreme value statistics analysis. The values of
the reduced variant were plotted against the ordered pitting depth in Fig.17. Fig.17 distinctly showed
two linear regions in one plot, which indicated that two kinds of pitting growth mechanism (deep-hole
shape and hemispherical shape) undertook on 316L SS surface. The observation of straight line
confirmed that the experimental data did in fact fit the Gumbel distribution. The values of α and μ are
the scale and location parameters for the distribution of the largest pitting cavities respectively. These
values are analogous to the standard deviation and average, and describe the shape and centre of the
probability distribution of the maximum stable pitting depth expected from electrodes identical to
those used for the measurements and are treated in the same manner for the same period of time. The
scale and location parameters measured under various hydrostatic pressures were shown in Table 4.
Table 4. Gumbel distribution parameters for pure magnesium in the absence and presence of magnetic
field.
Hydrostatic
pressure
Maximum pitting
depth(μm)
Location parameters
α(μm)
Scale parameters
(μm)
1atm X<78 40.388 79.128
X≥78 12.323 74.686
80atm X<86 28.421 60.943
X≥86 17.420 71.371
The probability of a given pitting depth occurring under various hydrostatic pressures was
calculated using Eq. (6) and the results were shown in Fig. 18. The probabilities could be converted
into an expected time for a pitting cavity with a particular depth to occur by taking the reciprocal of the
probability. That is, calculating the time it takes for the cumulation of the probabilities to equal unity.
For example, a 50 μm pitting depth under 1 atm hydrostatic pressure will occur on average after 46
min, but under 80 atm hydrostatic pressure, the average time for the same 50 μm pitting depth to occur
is 55 min. A 75 μm pitting depth under 1 atm hydrostatic pressure will occur on average after 46 min,
but under under 80 atm hydrostatic pressure the average time for the same 75 μm pitting depth to occur

Int. J. Electrochem. Sci., Vol. 9, 2014
796
is 122 min. These results indicate that a pitting formed on 316L SS had a lower probability of
developing into a larger pitting cavity at higher hydrostatic pressure than at lower hydrostatic pressure.
Figure 18. Probabilities of various depth pittings occurring on 316L SS at various hydrostatic
pressures.
4. CONCLUSION
Both potentiodynamic polarization and EIS results indicated that the corrosion resistance of
316L SS was improved with the increasing hydrostatic pressure.
In case of higher hydrostatic pressure, both the hardness and elastic modulus of the passive film
on 316L SS were increased, which indicated that the passive formed at higher hydrostatic pressure was
difficult to fracture than that formed at lower hydrostatic pressure.
The pitting initiation mechanism was the combination of B1 model (parallel birth and death
stochastic model) and A3 model (parallel birth stochastic model). B1 and A3 model related to deep-
hole shape and hemispherical shape pitting cavity, respectively. The pitting initiation rate was analyzed
based on Weibull distribution function. The increasing hydrostatic pressure retarded the B1 process,
meanwhile, accelerated the pitting initiation process of A3 model.
The pitting growth process was analyzed based on extreme value statistics using Gumbel
distribution function. The increasing hydrostatic pressure decreased the pitting growth probability. In
case of higher hydrostatic pressure, pitting on 316L SS surface was more difficult to develop into a
deeper cavity.

Int. J. Electrochem. Sci., Vol. 9, 2014
797
ACKNOWLEDGEMENTS
The authors wish to acknowledge the financial support of the Hundred Talents Program of Chinese
Academy of Sciences and the National Natural Science Foundation of China (No. 51371182).
References
1. I. Ulanovskii, Prot. Met. 15 (1979) 563.
2. I. Ulanovskii, V. Egorova, Prot. Met. 14 (1978) 137.
3. F. Reinhart, J. Jenkins, “Corrosion of materials in surface seawater after 12 and 18 months,”
Technical Note N-1213, Naval Civil Engineering Laboratory, Port Hueneme, CA, 1972.
4. M. Schumacher: Sea Water Corrosion Handbook, Noyes Data, New Jersey, 1979, 107.
5. S. Chen, W. Hartt, S. Wolfson, Corros. 59 (2003) 721.
6. S. Dexter, Corros. 36 (1980) 423.
7. R. Venkatesan, M. Venkatasamy, T. Bhaskaran, E. Dwarakadasa, Br. Corros. J. 37 (2002) 257.
8. S. Sawant, A. Wagh, Corros. Prevent. Contr. 37 (1990) 154.
9. A.M. Beccaria, G. Poggi, G. Castello, Br. Corros. J. 21 (1986) 19.
10. A.M. Beccaria, P. Fiordiponti, D. Mattongno, Corros. Sci. 29 (1989) 403.
11. A.M. Beccaria, G. Poggi, D. Gingaud, P. Castello, Br. Corros. J. 29 (1994) 65.
12. A.M. Beccaria, G. Poggi, M. Arfelli, D. Mattongno, Corros. Sci. 34 (1993) 989.
13. A.M. Beccaria, G. Poggi, G. Castello, Br. Corros. J. 30 (1995) 283.
14. S. Chen, W. Hartt, Corros. 58 (2002) 38.
15. A.M. Beccaria, G. Poggi, Br. Corros. J. 20 (1985) 183.
16. T. Zhang, Y. Yang, Y. Shao, G. Meng, F. Wang, Electrochim.Acta.54 (2009) 3915.
17. B. Liu, T. Zhang, Y. Shao, G. Meng, F. Wang, Mater. Corros. 62 (2011) 269.
18. B. Liu, T. Zhang, Y. Shao, G. Meng, F. Wang, Int. J. Electrochem. Sci., 7 (2012) 1864.
19. Y. Yang, T. Zhang, Y. Shao, G. Meng, F. Wang, Corros. Sci. 52 (2010) 2697.
20. Y. Yang, T. Zhang, Y. Shao, G. Meng, F. Wang, Corros. Sci. 73 (2013) 250.
21. S. Hu, T. Zhang, Y. Shao, G. Meng, F. Wang, Anti-Corros. Method. Mater. 58 (2011) 238.
22. T. Shibata, T. Takeyama, Nature, 260 (1976) 315.
23. T. Shibata, Corros., 52 (1996)813
24. T. Shibata, Y. Zhu, Corros. Sci. 36 (1994) 153
25. T. Shibata, M. Ameer, Corros. Sci. 33 (1992) 1633.
26. T. Shibata, Corros. Sci. 31 (1990) 413.
27. T. Shibata, Y. Zhu, Corros. Sci. 36 (1994) 1735.
28. T. Shibata, Y. Zhu, Corros. Sci. 37 (1995) 853.
29. S. Fujimoto, T. Shibata, M. Minamida, S. Udaka, Corros. Sci. 36 (1994) 1575.
30. F. Wall, M. Martinez, J. Electrochem. Soc., 150(2003) B146.
31. T. Zhang, C. Chen, Y. Shao, G. Meng, F. Wang, Electrochim. Acta, 53 (2008)7921.
32. T. Zhang, X. Liu, Y. Shao, G. Meng, F. Wang, Corros. Sci. 50 (2008) 3500.
33. G. Meng, L. Zhang, Y. Shao, T. Zhang, F. Wang, Corros. Sci. 51 (2009) 1685.
34. G. Meng, L. Wei, Y. Shao, T. Zhang, F. Wang, J. Electrochem. Soc., 156(2009) C240.
35. ASTM Stand G46-94(2005), “Standard Guide for Examination and Evaluation of Pitting
Corrosion,” ASTM International,West Conshohocken, PA.
36. A. Alamr, D. Bahr,M. Jacroux, Corros. Tech. Sci. Eng., 40(2005)255
37. A. Alamr, D. Bahr,M. Jacroux, Corros. Sci. 48 (2006) 925
38. A. Valor, F. Caleyo, L. Alfonso, D. Rivas, J. Hallen, Corros. Sci. 49 (2007) 559
39. G. Engelhardt, D. Macdonald, Corros. Sci. 46 (2004) 2755
40. E. Lewis, Introduction to Reliability Engineering, John Wiley and Sons, New York, 1987.
41. S. Pyun, E. Lee, G. Han, Thin Solid Films 239 (1994) 74

Int. J. Electrochem. Sci., Vol. 9, 2014
798
42. J. Park, S. Pyun, Corros. Sci. 46 (2004) 285-296
43. K. Na, S. Pyun, Electrochim. Acta 52 (2007) 4363-4373
44. K. Na, S. Pyun, Corros. Sci. 49 (2007) 2663-2675
45. K. Na, S. Pyun, Corros. Sci. 50 (2008) 248-258
46. D. Sun, Y. Jiang, Y. Tang, Q. Xiang, C. Zhong, J. Liao, J. Li, Electrochim. Acta, 54 (2009) 1558
47. M. Moayed, R. Newman, J. Electrochem. Soc., 153 (2006) B330
48. P. Pistorius, G. Burstein, Phil. Trans. R. Soc. Lond. A, 341 (1992) 531
49. A. Turnbull, Br. Corros. J. 28 (1993) 297.
50. A. Tahara, T. Shinohara, Corros. Sci. 47 (2005) 2589
51. A. Trueman, Corros. Sci. 47 (2005) 2240
52. Z. Wang, Y. Cong, T. Zhang, Y. Shao, G. Meng, Int. J. Electrochem. Sci., 6 (2011) 5521.
© 2014 by ESG (www.electrochemsci.org)