effect of high curing temperatures on the strength, durability...
TRANSCRIPT

EFFECT OF HIGH CURING TEMPERATURES ON THE STRENGTH,
DURABILITY AND POTENTIAL OF DELAYED ETTRINGITE FORMATION IN MASS CONCRETE STRUCTURES
By
LUCY ACQUAYE
A DISSERTATION PRESENTED TO THE GRADUATE SCHOOL OF THE UNIVERSITY OF FLORIDA IN PARTIAL FULFILLMENT
OF THE REQUIREMENTS FOR THE DEGREE OF DOCTOR OF PHILOSOPHY
UNIVERSITY OF FLORIDA
2006

Copyright 2006
by
LUCY ACQUAYE

This document is dedicated to David and Anna.

iv
ACKNOWLEDGMENTS
My sincere gratitude goes to Dr. Abdol Chini whose constant advice,
encouragement, patience and dedication to my graduate studies has resulted in this
dissertation. Dr. Chini admitted me into this distinguished university and program where
all my academic and professional goals were met and exceeded. He was the committee
chair for both my master’s thesis and doctoral dissertation, and his kindness and
inspiration have sustained me throughout my studies. Dr. Chini provided outstanding
academic and professional guidance during my doctoral studies and gave me wonderful
opportunities to excel academically and professionally.
The research reported here was sponsored by the Florida Department of
Transportation (FDOT). Sincere appreciation is due to the FDOT State Materials Office
Concrete Lab employees in Gainesville and Richard DeLorenzo for his guidance and help
in sampling and testing concrete specimens. My sincere thanks go to Barbara Beatty of
the FDOT chemical lab for her support
My sincere thanks go to Dr. Jo Hassel for her constant encouragement and financial
assistance during my doctoral studies. My thanks also go to members of my doctoral
committee for their help in completing this dissertation. I am grateful to the faculty and
staff at the Rinker School of Building Construction for providing a stimulating
environment for my graduate studies. My thanks go to the faculty of the Department of
Building Technology, Kwame Nkrumah University of Science and Technology, Ghana,
for their support throughout my studies.

v
I am utterly grateful to God for all the wonderful blessings in my life. I am very
grateful to my parents for all the sacrifices they made to see me to such great heights and
for their constant support. I am grateful to my siblings who supported and expanded my
dreams. I am grateful to my husband, Mark for his support and encouragement. I wish to
thank my children David and Anna, whose interest in “mama’s homework” spurred me
on to complete this dissertation.

vi
TABLE OF CONTENTS page
ACKNOWLEDGMENTS ................................................................................................. iv
LIST OF TABLES............................................................................................................. ix
LIST OF FIGURES ........................................................................................................... xi
ABSTRACT..................................................................................................................... xiv
CHAPTER
1 INTRODUCTION ........................................................................................................1
Background...................................................................................................................1 Objectives and Scope of Research................................................................................5 Research Methodology .................................................................................................6 Importance of Research ................................................................................................7
2 LITERATURE REVIEW .............................................................................................8
Introduction...................................................................................................................8 Cement Hydration.........................................................................................................9 Effect of Curing Temperature on the Microstructure of Hydrated Cement Paste ......12 Dense Shell of Hydration Products.............................................................................14 Effect of Curing Temperature on Concrete Strength Development ...........................15 Effect of Temperature on the Durability of Concrete.................................................17 Fly ash and Slag in Concrete ......................................................................................19 Delayed Ettringite Formation (DEF) in Concrete ......................................................22
3 RESEARCH METHODOLOGY ...............................................................................27
Introduction.................................................................................................................27 Degree of Hydration ...................................................................................................28
Introduction .........................................................................................................28 Methodology........................................................................................................29 Calculations to Determine the Degree of Hydration ...........................................35 Problems Encountered in the Experimental Process ...........................................35
Mass Concrete Experiments .......................................................................................42 Compressive Strength..........................................................................................44

vii
Resistance to Chloride Penetration......................................................................44 Time to Corrosion................................................................................................45 Density and Percentage of Voids in Hardened Concrete ....................................45 Microstructure analysis – Scanning Electron Microscope (SEM) ......................46
Introduction ..................................................................................................46 Signals of Interest.........................................................................................46 SEM Use in Concrete...................................................................................48 Experimental Work ......................................................................................48 Sample Preparation for SEM Examination ..................................................49
4 TEST RESULTS AND DISCUSSION ......................................................................51
Introduction.................................................................................................................51 Phase 1 – Determination of Degree of Hydration ......................................................51 Phase 2 – Tests of Mass Concrete ..............................................................................57
Degree of Hydration Results ...............................................................................63 Compressive Strength Results.............................................................................65 Resistance to Chloride Ion Penetration ...............................................................68 Density and Percentage of Voids Results............................................................69 Time to Corrosion Results...................................................................................72
Phase 3 – Microstructural Analysis ...........................................................................74 SEM Observations of Plain Cement Mixes.........................................................74
Effect of Curing Temperature on the Presence of Ettringite Crystals..........74 Effect of Curing Duration on the Amount of Ettringite Crystals formed ....75
SEM Observations of Fly Ash Mixes..................................................................78 Introduction ..................................................................................................78 Effect of Curing Temperature on the Presence of Ettringite Crystals..........79 Effect of Curing Duration on the Amount of Ettringite Crystals formed
in Voids...................................................................................................80 SEM Observations of Slag Mixes .......................................................................82
Introduction ..................................................................................................82 Effect of Curing Temperature on the Presence of Ettringite Crystals..........83 Effect of Curing Duration on the Amount of Ettringite Crystals formed ....83
5 CONCLUSIONS AND RECOMMENDATIONS.....................................................87
Introduction.................................................................................................................87 Conclusions.................................................................................................................87 Research Implications for Mass Concrete Structures. ................................................92 Recommendations.......................................................................................................93
APPENDIX
A CONCRETE MIX DESIGNS.....................................................................................96
Mix 1 – Plain Cement Mix .........................................................................................96 Mix 2 – 18% Fly Ash Mix..........................................................................................97

viii
Mix 3 – Plain Cement Mix .........................................................................................98 Mix 4- 18% Fly Ash Mix............................................................................................99 Mix 5 – Plain Cement Mix .......................................................................................100 Mix 6 – 50% Slag Mix..............................................................................................101 Mix 7 – Plain Cement Mix .......................................................................................102
B ADDITIONAL SEM IMAGES................................................................................103
Part 1 - Mix 1:Plain Cement Only Mix (0%FA) ......................................................103 Part 2 - Mix 2: 18% Fly Ash Mix .............................................................................109 Part 3 - Mix 3: 50% Slag Mix..................................................................................112
LIST OF REFERENCES.................................................................................................115
BIOGRAPHICAL SKETCH ...........................................................................................119

ix
LIST OF TABLES
Table page 2.1 Major Compounds of Portland Cement .....................................................................9
2.2 Measured Porosity....................................................................................................18
2.3 Results of compressive strength and AASHTO T-277 test......................................21
2.4 AASHTO T-277 tests for charge passed..................................................................22
2.5 Rate of chloride diffusion ppm/day (average of three replicates, Norwegian test)..22
3.1 Properties of Cement and Fly ash ............................................................................30
3.2 Properties of Blast furnace slag –ASTM C 989-97b, AASHTO M302...................30
3.3 Mix proportions of paste mixes................................................................................31
3.4 Time to 70% hydration in plain cement mix............................................................37
3.5 Concrete Mix 1 – 0% Fly Ash (Isothermal Curing).................................................38
3.6 Binders used in mass concrete mixes by the FDOT.................................................41
3.7 Mixture Proportions for FDOT Class IV mass concrete..........................................43
4.1 Nonevaporabe water content for various Fly ash mixes Lam et al. (2000)..............54
4.2 Degree of hydration results for plain cement mixes ................................................55
4.3 Degree of hydration for 18% fly ash mixes .............................................................56
4.4 Degree of hydration for 50% fly ash mixes .............................................................57
4.5 Degree of hydration for cement and blast furnace slag mixes .................................57
4.6 Summary of Plastic Properties of Fresh Concrete. ..................................................58
4.7 Results of concrete mixes M1 and M2.....................................................................58
4.8 Results of concrete mixes M3 and M4.....................................................................59

x
4.9 Results of concrete mixes M5 and M6.....................................................................60
4.10 Results of concrete mixes M7 and M8.....................................................................61
4.11 Summary of Results of concrete mixes M1 , M2, M3 and M4................................62
4.12 Summary of Results of concrete mixes M5, M6, M7 and M8.................................63
4.13 Compressive strength as a ratio of 28-day samples cured at 73oF ..........................66
4.14 Compressive strength as a ratio of the 28-day samples cured at 73oF ....................67
5.1 Compressive strength samples cured isothermally ..................................................89
5.2 RCP for samples cured isothermally........................................................................90
5.3 Compressive strength for adiabatically cured samples ............................................90
5.4 RCP and Ettringite Formation for adiabatically cured samples ...............................93

xi
LIST OF FIGURES
Figure page 2.1 External thermal cracking ........................................................................................10
2.2 Internal thermal cracking .........................................................................................11
2.3 Effect of curing temperature on concrete strength development .............................16
2.4 Pore size distribution with age for 30% Fly ash mix ...............................................20
3.1 Paste samples cast in one-ounce polypropylene screw cap jars...............................32
3.2 Oven used to cure samples at 200ºF.........................................................................32
3.3 Samples cured in four-ounce polypropylene jars after demolding ..........................33
3.4 Samples crushed in mechanical crusher...................................................................33
3.5 Approximately 3 grams of samples weighed. ..........................................................34
3.6 Samples removed after ignition at 1832ºF. ..............................................................34
3.7 Curing tanks used for samples at elevated temperatures..........................................36
3.8 Degree of hydration (wnu = 0.23)............................................................................37
3.9 Compressive strength results....................................................................................38
3.10 Rapid Chloride Permeability (RCP) results .............................................................39
3.11 Degree of hydration based on adiabatic curing (wnu = 0.23) ..................................42
3.12 Different interactions of an electron beam (PE) with the solid target. BSE = backscattered electrons, SE = secondary electrons, X = x-ray, AE = auger electrons ...................................................................................................................47
3.13 The EDAX analysis of “gel” showing calcium, sulfur, and aluminum peaks typical for ettringite ..................................................................................................49
3.14 Mortar samples mounted on stubs for SEM examination ........................................50

xii
4.1 Degree of hydration for 0%FA and 18%FA mixes..................................................64
4.2 Degree of hydration for 0%BFS and 50%BFS mixes..............................................65
4.3 Compressive strengths for 0%FA and 18%FA mixes..............................................66
4.4 Compressive strengths for 0%BFS and 50%BFS mixes..........................................67
4.5 Chloride Ion Penetration results for 0%FA and 18%FA mixes ...............................68
4.6 Chloride Ion Penetration results for 0%BFS and 50%BFS mixes ...........................69
4.7 Density for 0%FA and 18%FA mixes......................................................................70
4.8 Density for 0%BFS and 50%BFS mixes..................................................................70
4.9 Percentage of voids for 0%FA and 18%FA mixes ..................................................71
4.10 Percentage of voids for 0%BFS and 50%BFS mixes ..............................................72
4.11 Time to Corrosion results for all mixes....................................................................73
4.12 The RCP at 91days expressed in terms of Time to Corrosion unit ..........................73
4.13 Well-defined Monosulphate (M) crystals in a void..................................................76
4.14 Void with clusters of Ettringite (E) crystals.............................................................76
4.15 Void containing both Monosulphate (M) and Ettringite (E) crystals.......................77
4.16 Voids containing Ettringite (E) some appear almost full of it. ................................77
4.17 Void completely filled with fibrous Ettringite (E) ...................................................78
4.18 Void containing hexagonal plates of Monosulphate (M).........................................80
4.19 Void showing Monosulphate (M) transformed into Ettringite (E) ..........................81
4.20 Clusters of Fibrous Ettringite (E) in void.................................................................81
4.21 Sample with empty air Voids (V) ............................................................................84
4.22 Higher magnification of 4.32 ...................................................................................84
4.23 Sample with empty air Void (V) ..............................................................................85
4.24 Reacting Slag (S) particle with Ettringite (E) formed..............................................85
4.25 Slag particle completely covered with Ettringite (E) ...............................................86

xiii
B.1 Void with monosulphate (M), no ettringite found .................................................103
B.2 Close-up view of Figure B.1 ..................................................................................104
B.3 Void with ettringite (E) and monosulphate (M).....................................................104
B.4 Void with ettringite (E) crystals .............................................................................105
B.5 Void showing monosulphate and the early formation of ettringite (E) crystals ....105
B.6 Void showing ball of ettringite (E) crystals ...........................................................106
B.7 Void showing balls of ettringite (E) crystals..........................................................106
B.8 Voids showing ettringite (E) crystals some almost full .........................................107
B.9 Voids showing ettringite (E) and monosulphate crystals.......................................107
B.10 Ettringite (E) crystals in and around vicinity of void.............................................108
B.11 Ettringite (E) crystals in void .................................................................................108
B.12 Fly ash particle with reaction around rim...............................................................109
B.13 Fly ash particle with reaction around rim...............................................................109
B.14 Void containing monosulphate...............................................................................110
B.15 Void containing ettringite crystals .........................................................................110
B.16 Close up view of ettringite crystals in Figure B.15................................................111
B.17 Reacting fly ash particle .........................................................................................111
B.18 Slag particles showing some early reaction ...........................................................112
B.19 Slag particles showing reaction on surface ............................................................112
B.20 Slag particle showing reaction on surface..............................................................113
B.21 Slag particle showing reaction on surface..............................................................113
B.22 Ettringite formed around surface of reacting slag particle .....................................114
B.23 Close-up view of Figure B.22................................................................................ 114
xiv
Abstract of Dissertation Presented to the Graduate School of the University of Florida in Partial Fulfillment of the Requirements for the Degree of Doctor of Philosophy
EFFECT OF HIGH CURING TEMPERATURES ON THE STRENGTH, DURABILITY AND POTENTIAL OF DELAYED ETTRINGITE FORMATION IN
MASS CONCRETE STRUCTURES
By
Lucy Acquaye
May 2006
Chair: Abdol Chini Major Department: Design, Construction and Planning
The Florida Department of Transportation (FDOT) has in recent years recorded
high core temperatures of 170oF - 200oF during curing of mass concrete elements.
Frequent reports of such high temperatures have raised concerns of the strength and
durability of concrete cured at such high temperatures. Additional concerns have been
raised of the possibility of expansions of the hardened concrete from delayed ettringite
formation (DEF) and its subsequent deterioration. FDOT specifies a maximum
differential temperature of 35oF between the core and exterior of mass concrete elements
during curing to avoid cracking from high thermal stresses and a shorter service life of
the structure. However no limit is specified for the maximum curing temperature. This
dissertation investigated the effects of high temperatures on the strength, durability and
potential of delayed ettringite formation in mass concrete mixes.

xv
Using typical FDOT Class IV mass concrete mixes it was found that elevated
curing temperatures resulted in lower later-age strengths. Blending the cement with fly
ash and slag resulted in increased strength and durability when compared to the plain
cement mixes for all curing durations and temperatures.
Investigating the potential of delayed ettringite formation in the concrete mixes
cured at elevated temperatures and the effect of permeability on the onset and amount of
ettringite formed showed that:
1. At room temperature curing no ettringite was observed when samples were
examined microscopically using a scanning electron microscope (SEM) at
7, 28 and 91 days, notwithstanding having the highest permeability values.
2. At elevated curing temperatures of 160 and 180oF, the plain cement mixes
had high permeability values and microscopic examination showed
ettringite crystals in void spaces at 28 days. At 91 days these samples
showed voids almost filled with the crystals.
3. Concrete mixes containing 18% fly ash and 50% slag and cured at the
elevated temperatures resulted in much lower permeability. The low
permeability of the blends delayed the onset of ettringite formation as well
as the amount formed when compared to the plain cement mixes. This was
particularly evident in the slag mixes.

1
CHAPTER 1 INTRODUCTION
Background
In recent years, Florida Department of Transportation (FDOT) has recorded high
core temperatures of 170 – 200oF during curing of mass concrete structures. Mass
concrete structures as defined in the FDOT Structures Design Guidelines is “any large
volume of cast-in-place or precast concrete with dimensions large enough to require that
measures be taken to cope with the generation of heat and attendant volume change so as
to minimize cracking" (FDOT, 2002). Although a definite size has not been determined, a
concrete member, which is 2 ft to 3 ft thick, is considered to be mass concrete.
In its mass concrete specifications, FDOT does not set a limit on the maximum core
temperature during curing. FDOT however in its specification for mass concrete, limits
the differential curing temperature between the core and exterior of the mass concrete to
35oF. Limiting the deferential temperature is specified to avoid cracking due to excessive
thermal stresses in the concrete. Cracking due to thermal behavior may cause loss of
structural integrity and monolithic action, or may cause excessive seepage and shortening
of the service life of the concrete structure or may be esthetically objectionable
(American Concrete Institute (ACI), 1999)
The high core temperatures were recorded in mass concrete structures cured in
accordance with maintaining the maximum differential temperature of 35oF throughout
the curing period. These high temperatures have raised concerns on the effects of high
curing temperatures on the strength and durability of mass concrete structures. Of

2
additional concern is the potential of delayed ettringite formation (DEF) in the hardened
concrete when cured at such high temperatures and its associated deterioration of the
concrete structure. Ettringite in Portland cement systems is the first hydrate to crystallize
during the first hour of placing the concrete. At high curing temperatures (>160ºF), the
ettringite becomes unstable and decomposes only to reform later in the hardened concrete
in the presence of moisture with associated cracking of the structure. Concretes cured at
temperatures above 160oF are susceptible to DEF in the hardened concrete. Isolated cases
of expansion and cracking from DEF have occurred in some in-situ concretes of large
section and high cement content in the U.K. These in-situ concretes were cast in the
summer months and the possible early peak temperature was between 185 and 200oF.
The cracking took between 8 and 20 years to manifest itself (Hobbs, 1999). The cement-
water reaction during the hydration of cement is an exothermic reaction. Due to the low
diffusivity of heat from concrete, it acts as a insulator and in a large concrete mass, the
heat liberated from the reaction can accumulate and lead to high temperatures.
A study by Tarkhan (2000) of mass concrete specifications used by state highway
agencies in the United States found that nine highway agencies of the forty-three
respondents had mass concrete specifications. Highway agencies of Illinois and Kentucky
specified a maximum curing temperature of 160oF. A maximum differential temperature
of 35oF was specified by eight of the nine highway agencies with mass concrete
specifications. 65% of all respondents believed that there is a need for further research
into the effects of high curing temperature on concrete properties. Reasons cited to limit
the maximum curing temperature of mass concrete elements included:
Avoid reduction of later age strength,

3
Minimize swelling and shrinkage cracking,
Increase the durability of the concrete and
Decrease the formation of delayed ettringite (DEF) in the hardened concrete and its subsequent damage.
There are several known potential causes of cracking in concrete. One is excessive
stress due to applied loads and another is cracks due to drying shrinkage or temperature
changes in restrained conditions. Mass concrete is often subject to both of these stresses;
therefore, prevention of cracking is a vital consideration in the design of these structures.
However, during the construction process, the most pressing item is the control of drying
shrinkage and differential temperature. The rise in temperature of mass concrete depends
on the initial concrete temperature and volume to surface area ratio. Furthermore, the
increase in temperature is affected predominantly by the chemical composition of
cement, with C3A (Tricalcium Aluminate) and C3S (Tricalcium Silicate) being the
compounds primarily responsible for elevated temperature development. The water-
cement ratio, fineness of the cement, concrete mixture temperature and temperature of
curing are also contributors to the development of heat. When the water-cement ratio,
fineness, or curing temperature is increased, the heat of hydration is increased. The rate
and amount of heat generated are important in any concrete construction requiring
considerable mass. The heat accumulated must be rapidly dissipated in order to impede a
significant rise in concrete temperature at the center of the structure. The excessive rise
in concrete temperature is undesirable since the concrete will harden faster at an elevated
temperature and any non-uniform cooling of the concrete structure may create stresses
due to thermal contraction.

4
The current method of preventing cracking in mass concrete is to maintain a
temperature differential (between the surface and the core) of no more than 35ºF. Control
of temperature gain is possible (Kosmatka and Panarese, 1994) through the following:
Low-heat-of-hydration Portland or blended cement
Reductions in the initial concrete temperature to approximately 50ºF by cooling the concrete ingredients
Cooling the concrete through the use of embedded cooling pipes during curing
Low lifts: 5 ft or less during placement.
Pozzolans: the heat of hydration of pozzolan is approximately 25 to 50% that of cement.
When the massive concrete specified has high cement contents (500 to 1000 lb. per
cu yard), many of the above mentioned placing methods cannot be used. For concretes
that are often used in mat foundations and power plants good placing methods (Kosmatka
and Panarese, 1994), are the following:
Place the entire concrete section in one continuous pour
Avoid external restraint from adjacent concrete elements
Control internal differential thermal strains by preventing the concrete from experiencing excessive temperature differential between the internal concrete and the surface.
In order to control the internal temperature differential, the concrete is insulated to
keep it warm (tenting, quilts, or sand on polyethylene sheeting). Studies have shown that
the maximum temperature differential (MTD) between the interior and exterior concrete
should not exceed 35ºF to avoid surface cracking.
The Florida Department of Transportation Standard Specifications Section 450
allows the maximum curing temperature of 158 to 176ºF for accelerated curing of pre-

5
stressed concrete elements. However, accelerated curing is conducted under suitable
enclosures with a controlled environment to avoid thermal shock and minimize moisture
loss. These conditions do not exist in mass concrete operations and such high
temperatures may have detrimental effects on concrete properties. It is therefore
necessary to revisit the current specification for mass concrete, and examine the need for
additional provisions. The provisions that need to be reconsidered are maximum internal
concrete temperature and/or maximum concrete placing temperature.
Objectives and Scope of Research
The objectives of this dissertation were as follows:
To determine the effects of concrete curing temperature on the strength and durability
of concrete, using typical FDOT Class IV mass concrete mixes.
To determine the effects of fly ash and slag on the strength and durability of concrete
cured at elevated temperatures.
To determine the propensity of typical FDOT class IV mass concrete mixes to DEF
when cured at elevated temperatures.
To determine the effect of permeability of the concrete microstructure on the onset
and amount of ettringite formed.
To determine the effect of replacing part of the cement with fly ash or slag on the
onset and amount of ettringite crystals formed in samples cured at the elevated
temperatures.
The concrete used for this research will be typical class IV FDOT mass concrete
mixes. The use of fly ash and slag as partial replacement of cement is known to increase
the durability and strength of concrete. There is little information available on its
influence on ettringite formation in concrete cured at elevated temperatures. This

6
dissertation reports findings on how the strength and durability of concrete cured at the
elevated temperatures. Additionally by the use of Scanning electron Microscope, this
dissertation presents findings on ettringite formation in concrete curried at elevated
temperatures and how this is influence by the addition of fly ash and slag.
Research Methodology
This dissertation was conducted by performing the following tasks:
1. Performed a state of the art review of work reported on heat generation in mass
concrete and measures taken to avoid cracks and premature deterioration of
concrete.
2. Evaluation of the effects of concrete temperature on the properties of hardened
concrete. The evaluation included the following tests: compressive strengths,
rapid chloride permeability, time to corrosion, volume of permeable voids, and
microstructure analysis using the Scanning Electron Microscope (SEM).
a. Class IV - Structural concrete mixes, consisting of 18% replacement by
weight of cement with class F fly ash, were used. Specimens required for
the above mentioned tests were cast at room temperature and stored in
water tanks where they were subjected to different curing temperatures (73
to 200ºF).
b. Other mixes tested were similar to Part a, except that 50% of cement was
replaced by slag. Molds were cast and stored as explained in part a.
3. Analyzed the test results and determine the maximum internal concrete
temperature above which the concrete properties will be affected (later age
strength reduction, durability problems, and DEF).

7
4. Examination of the current FDOT mass concrete specifications and suggest, if
necessary, the requirement for maximum curing temperature or maximum
concrete placement temperature.
Importance of Research
The research presented in this dissertation will provide information on the effect of
elevated curing temperatures on the strength and durability of typical class IV FDOT
mass concrete mixes. Additionally information from this research will serve as a basis to
decide if the specification for mass concrete used by FDOT should specify a limit on the
maximum curing temperature. Fly ash and slag are used in typical class IV mass concrete
and this research will show their effect at high curing temperatures on the strength and
durability of the concrete and the potential of DEF formation.

8
CHAPTER 2 LITERATURE REVIEW
Introduction
This chapter presents a state-of-the-art review of literature on how strength,
durability and formation of delayed ettringite (DEF) in concrete are affected by high
curing temperatures. In massive concrete structures, high curing temperatures result from
a combination of heat produced by the hydration of concrete and the relatively poor heat
dissipation of concrete. Although various measures are implemented to limit the
maximum temperatures in mass concrete, a high core temperature of 200oF has been
recorded in Florida for a mass concrete structure cast during the summer. While such
concrete meets the specification of maintaining a maximum differential temperature of
35oF between the core and surface of the mass concrete structure, of major concern is
what happens to the strength, durability and DEF in the concrete when subjected to such
high curing temperatures.
This chapter reviews how heat is generated in concrete from the hydration of
cement. Cracking of concrete due to the heat as well as the microstructure formed under
such high temperature curing is examined. The influence of the microstructure formed
under high curing temperatures on the strength and durability of concrete are presented.
To improve the quality of concrete structures cured under high temperatures, other
cementitious materials such as fly ash and blast furnace slag have gained increasing use
in mass concrete structures. The effects on the microstructure of concrete due to the use
of such materials and the influence on strength and durability of mass concrete structure

9
are reviewed. A final review is presented on how high curing temperatures makes
hardened concrete structures susceptible to damage from the formation of delayed
ettringite (DEF).
Cement Hydration
The compounds of Portland cement (see Table 2.1) are nonequilibrium products of
high temperature reactions in a high-energy state. When cement is hydrated, the
compounds react with water to acquire stable low-energy states, and the process is
accompanied by the release of energy in the form of heat (Mehta and Monteiro, 1993).
Cement acquires its adhesive property from its reaction with water by forming products,
which possess setting, and hardening properties.
Table 2.1 Major Compounds of Portland Cement Name of compound Oxide composition Abbreviation
Tricalcium Silicate
Dicalcium Silicate
Tricalcium Aluminate
Tetracalcium Aluminoferritte
3CaO.SiO2
2CaO.SiO2
3CaO.Al2O3
4CaO.Al2O3.Fe2O3
C3S
C2S
C3A
C4AF
The heat generated from the hydration of cement causes a rise in temperature of
concrete. If this rise occurred uniformly throughout a given concrete element without any
external restraint, the element would expand until the maximum temperature has been
reached. The concrete will then cool down with uniform contraction as it loses heat to the
ambient atmosphere. This uniform expansion and contraction will result in no thermal
stresses within the concrete element. According to Neville (1997), restraint exists in all
but the smallest of concrete members. These thermal restraints result in external and
internal cracking of the concrete. Figure 2.1 shows an example of temperature change,

10
which causes external cracking of large concrete mass. The critical 20oC (35oF)
temperature difference occurs during cooling (FitzGibbon, 1976).
Figure 2.1 External thermal cracking
In massive concrete structures, internal
heat to dissipate quickly from the core of the
of the concrete. A temperature differential is
the surface due to the accumulation of the hea
thermal expansion in the various parts of the
compressive in one part and tensile in the oth
tensile stresses at the surface of the element d
tensile strength of the concrete. According to
concrete is reached when an internal thermal
Figure 2.2 shows a pattern of temperature cha
large concrete mass. The critical 20oC (36oF)
Crack condition as surface cools too fast
40oC
60oC
80oC
40oC
60oC
20oC20oC
restraint oc
member du
set up betw
t from the
concrete me
er. Crackin
ue to the ex
FitzGibbon
differential
nge, which
temperatur
Core temp.
Surface temp.
4 days
Core temp.
Surface temp.
4 days
33 22 1120oC20oC
curs from the inability of the
e to the low thermal diffusivity
een the core of the concrete and
hydration process. The unequal
mber results in stresses,
g of the surface results when the
pansion of the core exceed the
(1976), the cracking strain of
of 20oC (36oF) is exceeded.
causes internal cracking of a
e is reached during heating but

11
cracks open only when the interior has cooled through a greater temperature range than
the exterior.
Figure 2.2 Internal thermal cra
Cracking due to thermal
monolithic action or may caus
concrete structure. Various me
concrete pours. Notable among
o The prudent selection o
pozzolans;
o The reduction of the ce
o The careful production
aggregates in efficient
Crack initiated but does not open until core cools through greater range than surface
40oC
20oCcking
behavior may cause loss of structural
e extreme seepage and shorten the ser
asure are undertaken to reduce the tem
these measures include:
f a low-heat-generating cement syste
mentitious content;
control of aggregate gradations and t
mixes with low cement contents;
Core temp.
Surface temp.
s
4 day 3 2 120oC
60oC
integrity and
vice life of the
perature rise in large
m including
he use of large-size

12
o The precooling of aggregates and mixing water (or the batching of ice in place of
mixing water) to make possible a low concrete temperature as placed;
o The use of air-entraining admixtures and chemical admixtures to improve both the
fresh and hardened properties of the concrete;
o Coordinating construction schedules with seasonal changes to establish lift
heights and placing frequencies;
o The use of special mixing and placing equipment to quickly place cooled concrete
with minimum absorption of ambient heat;
o Dissipating heat from the hardened concrete by circulating cold water through
embedded piping;
o Insulating surfaces to minimize thermal differentials between the interior and the
exterior of the concrete.
Despite the application of the above-mentioned measures to control temperature
rise in concrete, maximum core temperatures of 200oF have been recorded in Florida.
This high temperature have been reached while satisfying the specification for mass
concrete of maintaining a maximum temperature differential of 35oF between the core
and the surface of the concrete structure. Of increasing concern is the effect on the
properties of concrete when subjected to such high curing temperatures. An examination
of the microstructure of concrete formed at high curing temperatures is reviewed next.
Effect of Curing Temperature on the Microstructure of Hydrated Cement Paste
Verbeck and Helmuth (1968) found the reactions between cement and water to be
similar to any other chemical reaction, proceeding at a faster rate with increasing
temperature. This rapid initial rate of hydration at higher temperatures they theorize
retards subsequent hydration of the cement producing a non-uniform distribution of the

13
products of hydration within the paste microstructure. At high temperatures, there is
insufficient time available for the diffusion of the products of hydration away from the
cement particles due to the low solubility and diffusivity of the products of hydration.
This results in a non-uniform precipitation of the products of hydration within the
hardened cement paste.
The results of a calorimetric study on the early hydration of cement as reported by
Neville (1997) indicate that a heat evolution peak occurs at about 6 to 8 hours after the
initialization of the hydration process at normal temperatures. This was revealed from
early hydration reactions of cement, using the conduction calorimeter (Verbeck and
Helmuth, 1968). During this period, the cement undergoes very rapid reactions with 20
percent of the cement hydrating over a 2 or 3-hour period. At an elevated temperature of
105oF, these reactions are accelerated with as much as 30 to 40 percent of the cement
hydrating in a 2-hour period. At steam curing temperatures, 50 percent or more of the
cement hydrates in an hour or less.
Products of cement hydration have low solubility and diffusivity and at high curing
temperatures, the rapid hydration does not allow for ample time for the products to
diffuse within the voids. This results in a high concentration of hydration products in a
zone immediately surrounding the grain. This forms a relatively impermeable rim around
the cement grain, which subsequently retards any subsequent hydration (Verbeck and
Helmuth, 1968). This situation does not occur in normal temperature curing where there
is adequate time for the hydration products to diffuse and precipitate relatively uniformly
throughout the interstitial space among the cement grains. The coarse pore structure in

14
the interstitial space from the high temperature has a detrimental effect on the strength of
concrete.
Further evidence from Goto and Roy (1981) confirms the observation by Verbeck
and Helmuth (1968) of retardation of subsequent cement hydration at high temperatures.
In an examination of the structure of the hydrated cement paste subjected to high
temperatures in its early life, Goto and Roy (1981) found out that curing at 60oC (140oF)
resulted in a much higher volume of pores larger than 150nm in diameter compared with
curing at 27oC (81oF). These large pores make the concrete susceptible to deterioration
from harmful substances, which are easily transported through the concrete structure.
A study by Kjelsen et al (1990) of the microstructure of cement pastes hydrated at
temperatures ranging from 41 – 122oF (5 – 50oC) using backscattered imaging found that
the low curing temperatures resulted in a uniform distribution of hydration products and
fine self-contained pores. Elevated temperatures on the other hand resulted in a non-
uniformly distributed hydration products and coarse, interconnected pores. The
microstructure of the hydrated cement paste formed at high curing temperatures affect the
strength and durability of the concrete. The large interconnected pores resulting from
high temperature curing does not make for durable concrete structures. Since strength
resides in the solid parts of a material, the presence of voids as a consequence of high
curing temperature are detrimental to the strength of the concrete.
Dense Shell of Hydration Products
Kjellsen, Detwiler and GjØrv (1990) support the concept that a dense shell of
hydration products surrounding the cement grains is formed at higher curing
temperatures. Hydration products are more uniformly distributed at lower temperatures.
In addition, at higher temperatures of curing there are five phases as opposed to the

15
standard four phases at lower temperatures. The five phases are unhydrated cement,
calcium hydroxide, two densities of C-S-H and pores. The strength of the material is
greatly affected by the uniformity of the microstructure. At the elevated temperatures the
C-S-H close to the grains is much denser and stronger. However, the intervals between
the cement grains determine the strength of the concrete. Therefore curing at elevated
temperatures has a harmful effect on the later-age strength of concrete. Additionally
elevated curing temperatures according to Kjellsen, Detwiler and GjØrv (1990) result in
increased porosity. Kjellsen, Detwiler and GjØrv (1990) further noted that C3S pastes
that were cured at higher temperatures (50-100ºC) had a coarser structure, including an
increase of large pores, over those cured at 25ºC. Even steam curing (97ºC) resulted in
coarser pore structure. The difference in porosity is attributed mostly to the difference in
volume of pores of radius 750-2300 A. For plain cement pastes of equal water-cement
ratios cured to the same degree of hydration, the higher the curing temperature the greater
the total porosity. The results indicate that large pores have the greatest effect on
permeability. Permeability is a contributing component to most durability problems,
therefore it is suggested that higher curing temperatures possibly reduce the durability of
plain cement concretes.
Effect of Curing Temperature on Concrete Strength Development
The strength of concrete is its ability to resist stress without failure. Strength of
concrete is commonly considered its most valuable property. Strength usually gives an
overall picture of the quality of concrete because it is directly related to the structure of
the hydrated cement paste (Neville, 1997).
A rise in curing temperature according to Neville (1997) speeds up the hydration
process so that the structure of the hydrated cement paste is established early. Although a

16
higher temperature during placing and setting increases the very early strength, it may
adversely affect the strength from 7 days (Neville, 1997). This is because the rapid initial
hydration according to Verbeck and Helmuth (1968) appears to form products of a poorer
physical structure, probably more porous, so that a proportion of the pores will always
remain unfilled. Since the voids do not contribute to the strength of concrete, a low
temperature with slow hydration will result in a uniform distribution of hydration
products within the interstitial space and high strengths at latter ages.
A fast hydration of cement from high curing temperatures will result in a high early
strength due to more hydration products being formed. At latter ages however, the
retardation in hydration as a result of a dense shell around the hydrating cement grains
will result in a more porous structure and reduced strengths as shown in Figure 2.3
(Verbeck and Helmuth, 1968).
Figure 2.3 Effect of curing temperature on concrete strength development

17
Effect of Temperature on the Durability of Concrete
According to ACI Committee 201, durability of Portland cement concrete is
defined as its ability to resist weathering action, chemical attack, abrasion, or any other
process of deterioration. Durable concrete will retain its original form, quality, and
serviceability when exposed to its environment. Although designers of concrete
structures have been mostly interested in the strength characteristics of concrete,
durability issues in concrete technology have been brought to the forefront in recent times
as a result of the premature failure of nondurable concrete structures.
The pore structure of the concrete determines the ease with which deleterious
harmful substances such as chloride ions are transported into the concrete. Harmful
substance such as chloride ions in concrete attack and corrode the steel resulting in
premature failure of the structure. High curing temperatures in concrete result in porous
concrete. This is because the low diffusivity of the hydration products does not allow for
uniform distribution at high curing temperatures due to the faster reaction rate. These
hydration products precipitate in the vicinity of the cement grains resulting in a more
porous concrete. At low curing temperatures, the hydration products are uniformly
distributed within the interstitial spaces making it difficult for deleterious harmful
substances to be transported into the concrete
Kjellsen et al. (1990) performed an investigation of the pore structure of plain
cement pastes hydrated at 41, 68 and 122oF (5, 20 and 50oC respectively). The specimens
were tested when they reached 70% hydration, a time marking adequate development of
the microstructure. Two techniques used to measure porosity in this study were mercury
intrusion and backscattered electron images. They theorized that during hydration at
elevated temperatures cement hydration proceeds more rapidly. Subsequently since the

18
cement has low solubility and low diffusibility, cement hydration products are not able to
disperse at a significant distance from the cement grain in the limited time provided at
high temperature curing. This causes areas of dense hydration products that act as a
barrier, preventing further hydration. When there is a development of dense hydration
product there is also a development of greater volume of large pores and a coarser pore
structure. The large pores correspond to a reduction in the modulus of elasticity of the
concrete indicating increased cracking as it is exposed to structural stresses.
The curing temperature clearly affected the pore structure of hydrated cement paste
as shown in Table 2.4. The higher curing temperature resulted in a greater quantity of
larger pores as well as an increase in the total porosity. These results are in agreement
with the observation by Goto and Roy (1981) that curing at 60oC (140oF) resulted in a
much higher volume of pores larger than 150nm in diameter compared to curing at 27oC
(81oF). These larger pores make the concrete more susceptible to attack by harmful
substances since they provide an easier pathway through the concrete. Permeability is a
contributing factor to various kinds of durability problems, therefore suggesting that high
curing temperatures could reduce the durability of plain cement concretes. The increased
permeability also leads to increased water intrusion to the reinforcing steel and promoting
an increase to the rate of corrosion of the members.
Table 2.2 Measured Porosity Curing temperature Porosity (MIP + HP) Porosity (BSEI) Standard deviation
41ºF 33.2% 4.27% .818%
68ºF 34.2% 10.93% 1.086%
122ºF 35.7% 15.11% 1.881%

19
Campbell and Detwiler (1993) explain that the durability of concrete is a primary
contributor to its satisfactory performance. Agencies typically control the durability of
concrete by restricting the water-cement ratio to 0.45 or less. However, the curing
process is often overlooked, though it also affects the durability of the concrete. A basic
principle noted is that the Portland cement concretes resistance to penetration by chloride
ions is reduced due to coarsening of the cement paste pore structure. Specifying a low
water-cement ratio provides limited effectiveness in bettering the performance of the
concrete.
Fly ash and Slag in Concrete
Class F fly ash is an artificial pozzolanic material, which possesses no cementitious
value, but in finely divided form, in the presence of moisture, chemically reacts with
calcium hydroxide from the Portland cement reaction to form compounds possessing
cementitious properties. The fly ash reaction products closely resemble the calcium
silicate hydrate produced by hydration of Portland cement (Neville, 1997). The fly ash
reaction does not start until sometime after mixing. According to Fraay et al (1989), the
glass material in fly ash is broken down only when the pH value of the pore water is at
least about 13.2. The increase in alkalinity required for the fly ash reaction is achieved
through the reaction of the Portland cement. At high temperatures, the fly ash reaction
takes place sooner due to the increased hydration rate of the cement. Prior to the reaction
of the fly ash particles, they act as nuclei for the precipitation of the cement hydration.
When the pH of the pore water becomes high enough, the products of reaction of fly ash
are formed on the fly ash particles and in their vicinity. With the passage of time, further
products diffuse away and precipitate within the capillary pore system, this result in a
reduction of the capillary porosity and consequently a finer pore structure (Fraay et al,

20
1989). Figure 2.8 shows the changes in pore size distribution determined by mercury
porosimetry, in cement paste containing 30 percent of Class F fly ash by means of total
cementitious material (Fraay et al, 1989). The cement paste becomes increasingly denser
after the initiation of the pozzolanic reaction of fly ash.
Figure 2.4 Pore size distribution with age for 30% Fly ash mix
Slag is a waste product in the manufacture of pig iron. Chemically, slag is a
mixture of lime, silica and alumina, the same oxides that make up Portland cement
(Neville, 1997). Compared to the fly ash, finely ground granulated blast-furnace slag is
self-cementing. It does not require calcium hydroxide to form cementitious product such
as calcium silicate hydrates. When used on its own, the amounts of hydration products
formed by the blast-furnace slag is insufficient for application of the material to structural
purposes. Used in combination with Portland cement, the hydration of the slag is
accelerated in the presence of calcium hydroxide and gypsum (Mehta and Monteiro,
1993). The beneficial effects of slag arise form the denser microstructure of the hydrated
cement paste, more of the pore space is filled with the hydration products than in cement
only mixes.

21
Supplementary cementing materials are suggested to increase the performance of
the concrete. Campbell and Detwiler investigated the optimum mix design for
satisfactory strength and durability of steam-cured concrete with 0 .45 water-cement ratio
and various compositions of Canadian Type 10 cement (ASTM Type I) with slag and
silica fume. The compressive strength of the cylinders after 18 hours of steam curing and
one day of moist curing were compared. The results as shown in Table 2.5 reveal that
slag is effective in reducing the rate of chloride ion diffusion and therefore increasing the
durability of the concrete. However the mixes with silica fume and slag, or silica fume
alone were more durable.
Table 2.3. Results of compressive strength and AASHTO T-277 test
Mix no. Description Compressive strength
MPa
Total Charge passes, coulombs, average of three
slices Rating M1 Control:100% PC 27.3 11130* M2 30% Slag 25.3 7800 M3 40% Slag 27.9 7690
M4 50% Slag 28.9 4500
High
M5 5.0% SF 32.6 1780 Low M6 7.5% SF 33.3 910
M7 10.0% SF 36.4 290
M8 30% Slag; 7.5% SF 28.5 350
M9 40% Slag; 7.5% SF 31.3 200
M10 30% Slag; 10% SF 34.5 150
Very Low
*Extrapolated value.
Detwiler, et al. (1994) investigated the chloride penetration of 0.4 and 0.5 water-
cement ratio concretes containing either 5 percent silica fume or 30 percent slag
(substitution by mass) cured at elevated temperatures. They found that higher curing
temperatures resulted in greater penetration of chloride ions. In addition, at any given

22
temperature, both the silica fume and slag concretes performed better than the Portland
cement concrete. Their studies showed that the use of pozzolanic materials is more
effective than lowering the water-cement ratio from 0.5 to 0.4 in improving the resistance
to chloride ions (Tables 2.6 and 2.7).
Table 2.4 AASHTO T-277 tests for charge passed Mix w/c 73ºF 122ºF 158ºF
Portland
Cement
.40
.50
5700
9800
12,000†
13,000†
18,000†
16,000†
5 % Silica Fume .40
.50
1500
1800
3000
3400
4100
13,000
30% Slag .40
.50
1300
1700
1500
2200
4300
5400
*Charge(coulombs) passed in 6 hr for concretes cured at constant temperatures indicated to degree of hydration of approximately 70 percent. †Extrapolated values. These tests were terminated before the full 6 hr had elapsed due to excessive temperature increases.
Table 2.5 Rate of chloride diffusion ppm/day (average of three replicates, Norwegian test)
Concrete w/c 73ºF 122ºF 158ºF
Plain
Cement
.40
.50
10
13
12
15
34
38
5 % Silica Fume .40
.50
4
3
7
5
12
22
30% Slag .40
.50
3
6
4
7
13
18
Delayed Ettringite Formation (DEF) in Concrete
In the early 1980’s, Heinz and Ludwig (1987) observed that precast units made of
high strength concrete that had been heat treated during production, showed damage of
the structure connected with a loss of strength. These damages occurred in those building
components which for several years had been subjected to open-air weathering and
23
therefore to frequent saturation. The damage was characterized by crack formation
emerging from the edges of the building components as well as a loss of bond between
the cement paste and the coarse aggregates. The damage was attributed to the late
formation of ettringite in the hardened concrete. Delayed ettringite formation (DEF) is
the destructive development of ettringite in concrete, months or years after placement in
an environment where moisture exposure is frequent (Hime and Marusin, 1999). DEF is a
worldwide phenomenon having been found in railway ties (sleepers) produced in
Germany, Finland, The United States, Australia and South Africa (Hobbs 1999, Heinz &
Ludwig 1987, Hime & Marusin, 1999).
Ettringite (C6ASH32) in Portland cement systems is the first hydrate to crystallize
during the first hour of placing the concrete. This is because of the high
sulpfate/aluminate ratio in the solution phase during the first hour of hydration. The
precipitation of early ettringite contributes to stiffening (loss of consistency), setting
(solidification of the paste) and early strength development. Later, after depletion of
sulfate in the solution when the aluminate concentration goes up again due to renewed
hydration of C3S and C4AF, ettringite becomes unstable and is gradually converted into
monosulfate (C4ASH18) which is the final product of Portland cements containing more
than 5 percent of C3A (Mehta & Monteiro, 1993). At high curing temperatures, the
decomposed ettringite reforms in the hardened concrete in the presence of moisture with
the resultant expansion and deterioration of the concrete. In a study of expansions in
mortar samples subjected to higher curing temperatures, Lawrence (1995) found that the
minimum curing temperatures for expansion lie between 65 and 70oC. The primary
ettringite is unstable when cured at this temperature due to the amount of alkalis in the

24
pore liquid. If the concrete is exposed to such temperatures, primary ettringite will not be
formed and that which was formed prior to such a heat treatment will decompose (Stark
& Seyfarth, 1999). Under moist conditions, at or below room temperature, ettringite
again becomes the stable phase and may cause DEF (Heinz, Kalde, Ludwig & Ruediger,
1999).
The microsturcture of concretes and mortars after expansion is characterized by the
presence of bands of ettringite around aggregate particles and within cracks, pores and
voids in the cement paste (Scrivener & Lewis, 1999). The expansive process in DEF is
marked by enlargement of the affected concrete and the development of gross cracking.
In extreme cases, the concrete becomes crumbly and soft, proving evidenced of the
destruction of the effectiveness of the cement paste binder (Diamond, 1996).
DEF is not only limited to precast concrete units, recent observations of DEF in
large sections of in-situ concrete have been made in the U.K. (Johansen & Thaulow,
1999). DEF whether formed as a result of steam curing or from high core temperature
from larger sections of concrete cast in-situ has been found by Diamond (1996) to exhibit
similar crack patterns and microstructural features. The observed crack pattern is that of a
network with component crack segments running partly along aggregate peripheries (rim
cracks), but generally connecting through segments running through the cement paste
(paste crack). Two opposing schools of thought exist as to how DEF leads to expansion
of the concrete. The homogeneous paste expansion theory (Johansen & Thaulow, 1999),
maintains that the paste expands and the DEF is deposited in the gaps created between
the aggregates and the paste as the aggregates do not expand. This theory is refuted by
many writers among them Diamond (1996) who maintain that crystal pressure from the

25
formation of ettringite better explains the expansion and subsequent deterioration of the
concrete.
The expansion associated with the formation of ettringite is influenced by the
microstructure of the material in which it is deposited and the amount of pore space
available (Taylor, Famy & Scrivener, 2001). Some of the ettringite produced is deposited
freely in available space and does not contribute to expansion. Thus, the expansion does
not depend simply on the amount of ettringite produced. Additionally, expansion depends
on the quality of the pore space. A given amount of ettringite will produce more
expansion if the pores in which it is deposited are small and poorly connected than if they
are large and more highly connected.
SEM examination at 180 days and 5 years of concrete cured at various
temperatures showed the following (Stark & Seyfarth, 1999):
o For normally cured concrete, there was no evidence of ettringite at 180 days but at
5 years the concrete showed a dense structure with fine ettringite needles covered
the pore surfaces, without filling the pores completely. An accumulation of
ettringite in the available spaces due to transportation processes took place within
the time interval.
o At 180 days samples cured at 60oC showed small needle-like crystals evenly
distributed on pore surfaces and in interfaces between aggregate and hardened
cement paste. At 5 years the ettringite found was in larger crystals and in
substantially larger amounts than found at 180 days. The concrete was crack-free
comparable to the normally cured concrete. The concrete was intact with no hint

26
of damage, indicating that the existence of ettringite in internal damages of
hardened concretes is not an indication of damaging ettringite formation.
o Samples cured at 90oC showed large ettringite crystals in structurally damaged
areas and on surfaces of pores. After 5 years, the concrete was completely
interspersed with microcracks. Pores, microcracks and interfaces were completely
filled with new phase formations of ettringite.

27
CHAPTER 3 RESEARCH METHODOLOGY
Introduction
This chapter presents the materials, mixtures, and test methods used to evaluate the
effects of elevated curing temperatures on the strength, durability and formation of
Delayed Ettringite (DEF) in mass concrete. The work was divided into three phases as
follows:
In phase 1, three mixes of pastes comprising plain cement, cement with 18% fly
ash and cement with 50% fly ash were cured at temperatures of 73, 160 and 200oF for
various durations to determine the age at which a maturity of 70% degree of
hydration of the cement was attained. Once this age was determined for the various
mixes and curing temperatures, mass concrete with binders in the same proportions as
in the paste would be made and tested when they reached 70% degree of hydration.
This would ensure that all the mass concrete properties would be determined at the
same maturity and make for easy comparison. Difficulty in establishing and exact
time to reach 70% degree of hydration as well as inability to reach this maturity in the
cement/fly ash mixes resulted in using the curing durations of 7, 28 and 91 days as
the bases of comparing the mass concrete properties.
In phase II, four FDOT Class IV mass concrete mixtures were made and cured at
temperatures of 73oF, 160oF and 180oF for durations of 7, 28 and 91 days. The
concrete samples were tested to determine the following properties:
□ Compressive strength – ASTM C 39 (ASTM 1996)

28
□ Resistance to chloride penetration – ASTM C 1202 (ASTM 1994)
□ Time to Corrosion – FM 5-522
□ Density and percentage of voids – ASTM C 642 (ASTM 1997)
Phase III. This phase involved microstructure analysis of the mass concrete by the
aid of a scanning electron microscope. Mortar samples sieved from the concrete
mixes were subjected to the same curing regime. At each test age, the mortar samples
were removed and placed in methanol to stop further hydration of the cement. After a
minimum of 7 days in the methanol, ¼ inches thick wafers were cut from the
samples. These wafers were fractured and examined to determine the presence or lack
of ettringite crystals.
Degree of Hydration
Introduction
A well-hydrated Portland cement paste consists mainly of calcium silicate hydrates,
calcium sulphoaluminate hydrates and calcium hydroxide (Metha and Monteiro, 1993).
When the cement paste is ignited to a temperature of 1832oF (1000oC), the nonevaporable
water chemically combine in the hydration products is released. The degree of hydration
is a measure of the nonevaporable water content of the paste expressed as a percentage of
the nonevaporable water content of fully-hydrated cement paste. The nonevaporable
water content of fully-hydrated cement paste is 0.23 grams of water per gram of cement
(Basma et al, 1999).
For this study a degree of hydration of 70% was decided as the maturity level at
which the mass concrete properties would be determined. The choice of 70% degree of
hydration was based on a study by Kjellsen et al (1990) who found that the time required
to attain this level of maturity is not so long as to be impractical to replicate in the

29
laboratory. Additionally, by this point, the rate of hydration has slowed enough that small
variations in curing time will not result in significant error making for easy comparison of
the various samples.
Methodology
Tables 3.1 and 3.2 show the chemical composition and physical properties of the
cement, fly ash and blast furnace slag used in the study. The Portland cement used was
AASHTO Type II. Described here are the methods applied to determine the time to attain
70% degree of hydration for three paste mixes isothermally cured at temperatures of 73,
160 and 200ºF. The three paste mix designs tested are as follows
1. Plain cement paste mix
2. Cement and 18% Fly ash paste mix
3. Cement and 50% Fly ash paste mix

30
Table 3.1 Properties of Cement and Fly ash Chemical Composition Portland Cement Fly Ash
% Silicon Dioxide (SiO2) 20.6
% Aluminum Oxide (Al2O3) 5.1
% Ferric Oxide (Fe2O3) 4.7
86.9
% Magnesium Oxide (MgO) 0.7 -
% Sulfur Trioxide (SO3): 3.2 0.2
% Tricalcium Silicate (C3S) 50.0 -
% Tricalcium Aluminate (C3A) 5.6 -
% Total Alkalis as Na2O 0.52 -
% Insoluble Residue 0.12 -
Loss of Ignition (%) 1.5 3.2
Physical Properties
Fineness: Blaine (m2/kg) - 341 #325 Sieve - 34%
Time of Setting (Gilmore):
Initial (Minutes)
Final (Minutes)
145
235
Fly ash activity index: 7 Days – 69%
28 Days – 78%
Compressive Strength (PSI) – ASTM C-150:
3 Days 3200 -
7 Days 4070 -
Table 3.2. Properties of Blast furnace slag –ASTM C 989-97b, AASHTO M302 Chemical Analysis
% Silicon Trioxide (SiO3) 2.3
% Sulfide Sulfur 0.9
Slag Activity Index 7 Days
28 Days
96%
132%
Physical Properties
Fineness: #325 Sieve (45um) 2%
Compressive Strength (PSI):
7 Days STD Average
7 Days Slag Average
28 Days STD Average
28 Days Slag Average
4750
4380
5900
7810
Blast furnace slag produced by Lafarge in Tampa

31
Table 3.3. Mix proportions of paste mixes Mix design
Cement
(lbs) Fly Ash
(lbs) Water (lbs)
w/b ratio
Mixing Water ºF
18% fly ash at 73ºF 3.540 .777 1.77 .41 73 18% fly ash at 160ºF and 200ºF 5.057 1.110 2.53 .41 136 50% fly ash at 73ºF 2.467 2.467 2.02 .41 73 50% fly ash at 160ºF and 200ºF 3.083 3.083 2.53 .41 136
The proportions of materials used in the paste mixes are shown in Table 3.3. The
pastes were made in accordance to ASTM C 305-99. The procedures followed to
determine the degree of hydration were as follows:
a. Three samples each was made of each paste mix to be tested at each curing period
and temperature. Samples at 73ºF were tested at ages of 1, 3, 7, 10, 14, 28 and 56
days. Samples at 160 and 200ºF were tested at ages of 1, 3, 7, 10 and 14 days.
b. The water used for samples cured at 160ºF and 200ºF was preheated to 136ºF, to
produce a cement paste with temperature of approximately 98ºF. This was done to
reduce the time for samples cured at 160 and 200ºF to be in equilibrium in the
curing environment.
c. Samples were cast in 1-ounce polypropylene screw cap jars (1.78 cubic inches) as
shown in Figure 3.1. The polypropylene jars offer high temperature resistance up
to 275ºF for short periods and 212ºF continuously. Each jar was capped and
placed in watertight bags, which were submerged in a bucket of water. The
watertight bags were used to ensure that during the first 24 hours of curing no
additional water was permitted to affect the designated water cement ratio. The
water in the buckets for samples cured at 160 and 200ºF was preheated to
approximately 100ºF to ensure a short time lag to attain the elevated temperatures
in the ovens as shown in Figure 3.2.

32
Figure. 3.1 Paste samples cast in one-ounce polypropylene screw cap jars.
d. The samples cured at 73ºF were placed in watertight bags immersed in water and
cured in a moisture room kept at 100% humidity and 73ºF, water.
Figure 3.2. Oven used to cure samples at 200ºF
e. After 24 hours, the samples were demolded, placed in four-ounce polypropylene
jars as shown in Figure 3.3 and placed in their curing environment to continue the
isothermal curing for the remaining curing duration.

33
Figure 3.3 Samples cured in four-ounce polypropylene jars after demolding
f. At the end of curing duration three samples for each mix and temperature were
removed and placed in methanol. Samples cured at 160 and 200ºF were cooled to
room temperature before placing in the methanol. This was done to avoid igniting
the methanol. The samples were placed in the methanol to stop further hydration
of the cement.
g. After at least 7 days in the methanol, the samples were removed and wiped clean.
The samples were then crushed in a mechanical crusher (see Figure 3.4). The
crushed sample was then pulverized.
Figure 3.4 samples crushed in mechanical crusher

34
h. Approximately 3 grams of the pulverized sample was then weighed as shown in
Figure 3.5. The scale used was accurate to 1/10,000 of a gram. The samples were
dried for 24 hours in an oven maintained at 221±5ºF (105ºC) to remove the
evaporable water from the sample. After removal from the oven the samples were
cooled to room temperature and the weight was recorded as w1.
i. The samples were then ignited for 45 minutes at 1832ºF (1000ºC) to remove the
nonevaporable water chemically combined in the hydration products. The samples
were cooled to room temperature and the weight recorded as w2. Figure 3.6
shows samples removed from the oven after ignition.
Figure 3.5 Approximately 3 grams of samples weighed.
Figure 3.6 Samples removed after ignition at 1832ºF.

35
Calculations to Determine the Degree of Hydration
The calculation of the degree of hydration was based on the formula given by Zhang et al
(2000).
The nonevaporable water content, wn was calculated according to the following equation:
wn = (w1 – w2) - rfc w2 (1 - rfc) rfc = pf rf + pc rc
The degree of hydration was determined as a ratio of wn / wnu wnu - nonevaporable water content per gram of fully hydrated cement 0.23 w1 - weight of the sample after drying w2 - weight of the sample after ignition pf - weight percent of fly ash in the mix, 18% and 50% pc - weight percent of cement in the mix rf - loss of ignition of fly ash 4.7% rc - loss of ignition of cement 2.1%
Problems Encountered in the Experimental Process
Various problems were encountered during the experimental process to determine
the degree of hydration of the paste samples. These problems and how they were resolved
is presented below.
1. The oven used to cure samples at 160ºF failed five days into the curing process
requiring a new oven to be used.
2. Some of the samples kept cured in the ovens at 160 and 200ºF lost the water in
which they were immersed during the course of the curing duration. Cracking of
the jar covers and evaporation of the water caused this.

36
3. To resolve the above problems, curing tanks as shown in Figure 3.7 were used in
place of the ovens for the elevated temperature curing. These tanks were filled
with water maintained at 160 and 200ºF.
4. The degree of hydration tests were repeated based on curing for elevated
temperatures in the curing tanks. The results of the degree of hydration are shown
in Figure 3.8.
Figure 3.7 Curing tanks used for samples at elevated temperatures.

37
Degree of hydration - Isothermal curing
20
3040
50
60
7080
90
1 3 7 10 14 28 56
Duration (days)
Hyd
ratio
n (%
)
0% FA - 73F0% FA - 160F0% FA - 200F18% FA - 73F18% FA - 160F18% FA - 200F50% FA - 73F50% FA - 160F50% FA - 200F
Figure 3.8 Degree of hydration (wnu = 0.23)
Based on the results of the degree of hydration shown in Figure 3.8, samples made
from the cement fly ash paste mixes did not attain a 70% degree of hydration for the
temperatures and curing durations used in this test. The times to reach 70% degree of
hydration in the plain cement mix was established as shown in Table 3.4.
Table 3.4 Time to 70% hydration in plain cement mix Curing Temperature
(oF) Duration (approximate)
73 160 200
7 3 3
Based on the durations in Table 3.4, samples of FDOT Class IV mass concrete
(Mix 1 – appendix) based on the paste mix were made and cured isothermally following
the curing conditions used for the paste samples. Three samples were tested for each
temperature to determine the compressive strength in accordance with ASTM C 39 – 96.
Compressive strength results are presented in Table 3.5 and Figure 3.9.

38
Table 3.5 Concrete Mix 1 – 0% Fly Ash (Isothermal Curing) Compressive strength (psi) RCP (coulombs)
Temp (oF) 70% DH 28 Days 90 Days 70% DH 28 Days
73 6,839 7,472 8252 5,845 4,720 160 4,621 4,963 5616 8,763 7,110 200 2,910 2,872 2636
9,756 11,070
Concrete 0% FA (ISO) - Compressive strength
2,0003,0004,0005,0006,0007,0008,0009,000
70% DH 28 Days 90 Days
Curing duration (days)
Com
pres
sive
str
engt
h (p
si)
73F160F200F
7 days
3 days
3 days
Figure 3.9. Compressive strength results
Figure 3.9 shows a substantial decrease in compressive strength of samples cured
isothermally at 160 and 200oF compared to samples cured at room temperature. This is
specially pronounced for 200oF curing temperature where compressive strength of a 90
days old sample is less than a 3 days old sample. The reduction in compressive strength
of samples cured at elevated temperatures might be due to high temperature changes (100
to 200oF) as the freshly mixed concrete is introduced into the high temperature curing
environment and thermal shock to concrete.

39
Concrete 0% FA (ISO) - RCP
2,000
4,000
6,000
8,000
10,000
12,000
70% DH 28 Days
Curing duration (days)
Cou
loum
bs 73F160F200F
3 days
7 days
3 days
Figure 3.10 Rapid Chloride Permeability (RCP) results
Figure 3.10 shows the RCP results of the concrete samples cured isothermally at
160oF and 200oF compared to samples cured at room temperature (73oF). Samples cured
at the high temperatures recorded high charges passing through the samples indicating
reduced durability for the concrete. The samples cured at 200oF showed reduced
durability from 7 days to 28 days as the charged passed increased over the curing
duration. At 28 days, the samples cured at 73oF had the least current passing indicating
better durability than the samples cured at 200oF, which recorded the highest charges
passing at 28 days.
With the drastic reduction in compressive strength of the mass concrete samples
cured at the elevated temperatures, the experimental set-up was changed as follows:
1. The curing was done adiabatically to simulate conditions as in mass concrete
cured in the field. All the samples were introduced to the curing environment
approximately 6 hours after the start of the mixing process. Samples at 160ºF and
180ºF were introduced into the curing tanks at 80ºF after which the heat was

40
turned on. The curing temperature of 160ºF was attained within 2 days after
which the heat was turned off. The 180ºF tank attained the maximum temperature
after about 2½ days after which the heat was turned off. The lids of the curing
tanks were kept on whilst the temperature cooled to 73ºF within approximately
two weeks of turning the heat off in both tanks.
2. The maximum temperature was reduced from 200 to 180ºF.
3. A review of mass concrete mixes used by the FDOT, was undertaken to examine
the proportions of binders commonly used by the department. The results as
shown in Table 3.6, indicated that 80 percent of the cement/fly ash mixes had
0.18 and 0.20 of the cement replaced by fly ash. Two (2) per cent of the cement
/fly ash mixes had a fly ash replacement of 0.40. Based on this review, the
proportion of fly ash replacement for the mass concrete tests was limited to 18
percent
4. The samples were then transferred to the moisture room into curing baths, as were
the 73 samples. Lime was then added to the water at this point in the curing cycle.
5. Following the change in the curing conditions, new tests were conducted to
determine the time to achieve 70% degree of hydration for the mix. The results
from this test are shown in Figure 3.11.
6. As can be observed in Figure 3.11, the curves were very erratic making it difficult
to establish the duration to attain maturity of 70% degree of hydration in the
various mixes. This led to the use of curing durations of 7, 28 and 91 days as the
bases to compare the mass concrete properties in this study.

41
7. At specified curing durations, mass concrete samples described in the next section
were tested and the degree of hydration of the cement was determined for that age
and curing temperature.
Table 3.6 Binders used in mass concrete mixes by the FDOT BINDERS USED IN MASS CONCRETE DESIGNS IN FLORIDA
A. Cement mixes Proportion of Cement Number of mixes % Cement Mixes % Total mixes
1.00 10 100 11
B. Cement / Fly Ash mixes Proportion of fly ash Number of mixes % Cement/ Fly ash Mixes % Total mixes
0.18 18 32 21 0.19 6 11 7 0.20 21 37 24 0.21 1 2 1 0.22 5 9 6 0.30 1 2 1 0.35 2 4 2 0.39 2 4 2 0.40 1 2 1
Total 57 100 66 C. Cement / Blast Furnace Slag mixes Proportion of Slag Number of mixes % Cement/Slag Mixes % Total mixes
0.50 11 55 13 0.60 2 10 2 0.70 7 35 8
Total 20 100 23 SUMMARY Binder Number of Mixes % of Mixes Cement 10 11 Cement/ Fly Ash 57 66 Cement/Slag 20 23 Total 87 100

42
Degree of hydration - Adiabatic curing
20
30
40
50
60
70
80
1 2 3 4 5 6 7 8 9 10 14 28
Duration (days)
Hyd
ratio
n (%
)
0% FA - 73F0% FA - 160F0% FA - 180F18% FA - 73F18% FA - 160F18% FA - 180F
Figure 3.11 Degree of hydration based on adiabatic curing (wnu = 0.23)
Mass Concrete Experiments
Two typical FDOT Class IV concrete with fly ash or slag as the supplementary
cementitious material to cement were used in the mass concrete tests (See appendix A).
The goal of the tests was to determine the effects of elevated curing temperate on the
strength and durability of concrete properties. Four mixes with different proportion of
cement, fly ash and blast furnace slag as shown in Table 3.7, were made and tested. The
tests were repeated. The mixes tested were as follows:
o 0% Fly ash mixes (Mix 1 and Mix 3)
o 18% Fly ash mixes (Mix 2 and Mix 4)
o 0% Blast furnace slag mixes (Mix 5 and Mix 7)
o 50% Blast furnace slag mixes (Mix 6 and Mix 8)

43
Table 3.7. Mixture Proportions for FDOT Class IV mass concrete Saturated Surface-Dry Weights, lb/cu yd
Mixture
Cement
Fly ash
Slag Fine
aggregate Coarse
aggregate Air Entrainer
(Darex) Admixture (WRDA)
Water
w/b ratio
Mix 1 & 3 Mix 2 & 4 Mix 5 & 7 Mix 6 & 8
744
610
660
330
-
134 - -
- - -
330
936
918
1076
1066
1746
1729
1794
1785
4 oz
4 oz
5 oz
5 oz
24.4 oz
24.4 oz
33.0 oz
33.0 oz
305
305
267
267
0.41
0.41
0.40
0.40
Samples made from the various mixes were cured adiabaticlly as before described.
All the samples were mechanically vibrated during their preparation. After casting in
their molds, the samples were kept in watertight bags for 24 hours after which they were
demolded and placed directly in the curing water. Samples cured at 73ºF were kept in the
moisture room. The heat in the 160 and 180ºF tanks was turned off after the maximum
temperature was attained. Cooling of the tanks to a temperature of approximately 73ºF
occurred over a 14-day period. The samples in the curing tanks were transferred into the
moisture room and placed in limewater. Samples cured at 73ºF were also places in
limewater at this time.
Various tests were performed on the mass concrete samples after 7, 28 and 91 days
of curing. The tests performed were:
1. Determination of degree of hydration
2. Compressive strength – ASTM C 39 (ASTM 1996)
3. Resistance to chloride penetration – ASTM C 1202 (ASTM 1994)
4. Time to Corrosion – FM 5-522
5. Density and percentage of voids – ASTM C 642 (ASTM 1997)

44
6. Microstructure analysis
Compressive Strength
The compressive strengths of the samples were determined at curing durations of 7,
28 and 91 days. The compressive strengths were determined according to ASTM C 39-
93a, Standard Test Method for Compressive Strength of Cylindrical Concrete Specimens,
by the FDOT physical laboratory. Twenty-seven 4” diameter x 8” cylinders were molded
for each mix. Nine samples for each mix were tested at 7-, 14-, and 28-days age three for
each curing temperature.
Resistance to Chloride Penetration
Each mix cured at the 73, 160 and 180ºF was tested at 28-, and 91-days age to
determine its ability to resist the chloride-ion penetration. The rapid chloride permeability
for each sample was estimated following ASTM C 1202-94, Standard Test Method for
Electrical Indication of Concrete’s Ability to Resist Chloride-Ion Penetration. In this test,
the chloride-ion penetrability of each sample was determined by measuring the number of
coulombs that can pass through a sample in 6 hours. This provided an accelerated
indication of concrete’s resistance to the penetration of chloride-ions, which may corrode
steel reinforcement or prestressed strands. Six 4” diameter x 8” cylinders of each mix,
two for each curing temperature were tested at 28-, and 91-days age. A 2” thick disc was
sawed from the top of each cylinder and used as the test specimen. It has been determined
that the total charge passed is related to the resistance of the specimen to chloride-ion
penetration. The surface resistivity of each sample to the penetration of chloride ions was
measured at the curing durations from the remaining portions of the samples used in the
rapid chloride permeability tests.

45
Time to Corrosion
The time to corrosion test determines the duration of time for reinforcement within
a sample to corrode. The time to corrosion was determined according to Florida Method
of Test for An Accelerated Laboratory Method for Corrosion Testing of Reinforced
Concrete Using Impressed Current. The samples used in this test were cylinders of 4”
diameter x 6” long. Nine samples were made for each mix three for each curing
temperature. Each sample contained a #4 reinforcing bar, 12” long. The bottom of the
reinforcing bar was elevated by 0.75” from the bottom of the mold. Fresh concrete was
placed in each mold and each mold was overfilled. The apparatus that had the reinforcing
bars attached to it was placed over the cylinders. The apparatus was then placed on an
external vibrator that caused the reinforcing bars to submerged into the overfilled fresh
concrete when the vibrator was turned on. After vibration, a trowel was used to slope the
overfilled top of the mold at a 15-degree angle from the outer rim of the sample to the
center of the sample. After 28 days of curing, the samples were further cured in a solution
of 3% NaCl after which they were tested. The tests were performed at the Florida
Department of Transportation Corrosion Laboratory.
Density and Percentage of Voids in Hardened Concrete
The density and percentage of voids for each mix and curing temperature were
determined at curing durations of 7, 28 and 91 days. The tests were done according to
ASTM C 642 - 97, Standard Test Method for Density, Absorption, and Voids in
Hardened Concrete, by the FDOT physical laboratory. Approximately 800 grams of each
sample was tested.

46
Microstructure analysis – Scanning Electron Microscope (SEM)
Introduction
A microscope provides the ability to see much finer details of an object than is
possible to the naked eye. The scanning electron microscope (SEM), which became
commercially available in the 1960s, permits the observation and characterization of
heterogeneous organic and inorganic materials on a nanometer (nm) and micrometer
(um) scale (Goldstein et al, 1992). The resolution of a microscope is the smallest
separation between two points in an object that can be distinctly reproduced in the image.
Today’s SEM has achieved a resolution better than 10nm, an improvement by a factor
about 103 relative to a light microscope (Sarkar, Aimin and Jana, 2001). The popularity
of the SEM stems from its capability of obtaining three-dimensional-like images of the
surfaces of a very wide range of materials.
Signals of Interest
In the SEM, the area to be examined or microvolume to be analyzed is irradiated
with a finely focused beam, which may be swept in a raster across the surface of the
specimen to form images or may be static to obtain an analysis at one position (Goldstein,
Newbury, Joy, Lyman, Echlin, Lifshin, Sawyer and Michael, 1992). When a beam of
primary electrons strikes a bulk solid, the electrons are either reflected (scattered) or
absorbed, producing various signals (Figure 3.12)
The types of signals produced include secondary electrons (SE), backscattered
electron (BSE), characteristic x-rays and other photons of various energies. These signals
are obtained from specific emission volumes within the sample and can be used to
examine many characteristics of the samples such as composition and topography. The
intensity of the backscattered electrons is proportional to the atomic number of the

47
elements in the sample. More electrons are scattered from higher atomic number
elements, and, in an image appear brighter than low atomic number elements which
appear darker in an image. Backscattered electrons therefore respond to the
compositional variations in the sample and enable the distinctions of the various phases
based on the differences in their average atomic numbers.
Figure 3.12. Different interactions of an electron beam (PE) with the solid target. BSE = backscattered electrons, SE = secondary electrons, X = x-ray, AE = auger electrons
Secondary electrons are loosely bound outer shell electrons from the sample atoms
which receive sufficient kinetic energy during inelastic scattering of the beam electrons to
be ejected from the atom and set in motion (Goldstein et al, 1992). Secondary electrons
have a shallow escape depth and collecting them as an imaging signal enable high
topographical resolution of the sample to clearly distinguish between the various shapes
of the phases in the sample. Measuring the energy and intensity distribution of the
characteristic x-ray signals generated by the focused electron beam enables chemical
analysis of the specimen. This chemical analysis is done using the SEM’s adjunct
microanalytical unit, commonly known as the energy dispersive x-ray analyzer (EDAX),
(Sarkar, Aimin and Jana, 2001). Characteristic x-rays are analyzed to yield both the

48
qualitative identification and quantitative compositional information from regions of the
specimen as small as a micrometer in diameter.
SEM Use in Concrete
Most of the properties of concrete are evaluated according to standard procedures.
The SEM does not fall under the realm of any standard procedure. It is a relatively new
technique which is yet to be universally accepted by the concrete technologist. One of the
first applications of SEM was in the study of concrete hydration in the early 1970s
(Sarkar, Aimin and Jana, 2001). The chief interests one has in studying concrete under
SEM are to study the effects of deterioration of concrete or its performance
characteristics, qualitative phase identification, grain morphology, distribution pattern
and association with other phases (Sarkar, Aimin and Jana, 2001).
Experimental Work
The scanning electron microscope used in this research was the SEM JSM 6400.
All analyses were conducted at the Major Analytical and Instrumentation Center at the
University of Florida. The SEM analysis was used to determine the presence of ettringite
crystals in voids of mortar samples sieved from the concrete mixes. The signals of
interest used in this study when the electron beam impinged on the specimen were
secondary electrons and characteristic x-rays. Because of the different morphological
features characteristic of the phases, they could be identified by secondary electron
images. This avoided the use of thin or polished sections using backscatter (BS) electron
which may wash out or grind out ettringite nests and introduce artifacts such as cracks.
Moreover with SE techniques, crevices and both sides of “hills” are revealed. Fly ash
particles used in some of the mixes are clearly revealed by SE techniques, while BS
procedures may reveal them primarily as voids because of their poor backscattered

49
electron yield (Hime, Marusin, Jugovic et. Al, 2000). Measuring the energy and intensity
distribution of the characteristic x-rays enabled a chemical analysis of the samples to
confirm the various phases identified in the secondary electron image. Energy Dispersive
Analysis of the X-rays (EDAX) was used to confirm or deny the presence of the
ettringite. EDAX of an ettringite mass has a “step” pattern of the aluminum, sulfur and
calcium peaks as shown in Figure 3.13 (Hime, Marusin & Jugovic, 2000).
Figure 3.13 The EDAX analysis of “gel” showing calcium, sulfur, and aluminum peaks typical for ettringite
Sample Preparation for SEM Examination
The samples used for the microstructural analysis were made from mortar sieved
from the concrete mixes. The samples were cured adiabatically as the mass concrete
samples. After 24 hours in watertight bags, the samples were demolded from the two-
ounce jar and placed directly in the curing environment. At the end of the curing period,
the samples were removed from the curing tank and placed in methanol to stop further
hydration. After at least 7 days in the methanol, the samples were removed and finely cut
into ¼” thick wafers. The samples were then placed in an oven maintained at a

50
temperature of 230�F for 24 hours to remove all the evaporable water, not used in the
hydration process. The samples were stored in a desiccator after removal from the oven.
To obtain very good images using the SEM and avoid the introduction of cracks or
removal of any ettringite nests, cutting of the surface of the sample was avoided, instead
pieces were fractured and the fractured surfaces were analyzed. The fractured pieces were
cut and coated with carbon. Since the samples were non-conducting, coating was
necessary to eliminate or reduce the electric charge that builds up rapidly in a non-
conducting specimen when it is scanned by a beam of high-energy electrons. Figure 3.14
shows mortar samples mounted and ready for examination in the SEM
Figure 3.14. Mortar samples mounted on stubs for SEM examination
51
CHAPTER 4 TEST RESULTS AND DISCUSSION
Introduction
This chapter presents results of the experimental work conducted to determine the
maximum curing temperature to avoid durability problems and the formation of delayed
ettringite in mass concrete. The study was conducted in three phases:
1. Phase 1 involved tests to determine the time to achieve a maturity of 70% degree
of hydration of cement in mass concrete mixes with cement, fly ash and blast
furnace slag as the cementitious materials.
2. Phase 2 involved tests of two FDOT Class IV mass concretes at temperatures of
73, 160 and 180ºF for 7, 28 and 91 days. Various tests were performed on the
concrete to evaluate the effect of the curing conditions on the strength and
durability of the concrete.
3. In phase 3, mortar samples prepared from the sieved mass concrete mixes were
subjected to the same curing conditions. The samples were then examined under a
scanning electron microscope to determine the formation or otherwise of delayed
ettringite.
Phase 1 – Determination of Degree of Hydration
The results for the degree of the hydration for the different mixes tested are shown
in Tables 4.2 through Table 4.5. Initially, all calculations for the degree of hydration were
based on the fact that the nonevaporable water content for 1 gram of fully hydrated

52
cement was 0.23 grams of water. This value was found to be inapplicable to cement
blends with fly ash or slag.
Scanning Electron Microscope (SEM) observations by Maltais & Marchand (1997)
for pastes some incorporating fly ash as a 10, 20 and 30 per cent replacement of cement
and cured at 68 and 104ºF showed that the fly ash did not react before at least 28 days.
Although the fly ash did not react during the first days of curing, their test results
indicated that it could not be considered as a totally inert material. Despite the very little
pozzolanic activity, Maltais and Marchand (1997) found out that the presence of fly ash
appeared to increase the mortar nonevaporable water content at early days. This increase
was attributed to an acceleration of the early cement hydration in the presence of fly ash.
Two reasons for the acceleration of cement hydration in the presence of fly ash are
physical and chemical effects.
o Physical
o The addition of fly ash tends to increase the number of fine particles in the
system. The presence of these fine particles contributes to increase the
density of the matrix making for better hydration of the cement.
o The replacement of cement particles by fly ash is also believed to increase
the available space in the floc structure created by the cement grains.
o The fine particles provide additional nucleation sites for cement hydration
products.
o Chemical
o According to Maltais and Marchand (1997) the acceleration of cement
hydration in the presence of fly ash is mainly related to the preferential

53
adsorption of calcium ions on the fly ash particles. The phenomenon
contributes to decrease the calcium ion concentration in the liquid phase,
which subsequently favors the dissolution of calcium phases from the
cement grains.
Fly ash reacts with the calcium hydroxide formed from the hydration of the cement.
The reduction in calcium hydroxide content form the pozzolanic reaction will not enable
a value of 0.23 to be a good estimate of the degree of hydration. The pozzolanic reaction
will reduce the amount of calcium hydroxide and replace it with hydrates formed by the
pozzolanic reaction. The amount of water released from a mole weight of the hydrates is
less than the amount of water released form a mole weight of calcium hydroxide due to
its large molecular weight. A more reliable estimate was determined for the cement fly
ash mixes after hydrating paste at 73ºF in the moisture room for 1 year and calculating
the nonevaporable water content. The new values for the nonevaporable water content for
the cement and fly ash mixes were as follows:
o 0.19 for cement and 18% fly ash mix with w/b ratio of 0.41
o 0.15 for cement and 50% fly ash mix with w/b ratio of 0.41.
These values for the nonevaporable water content are comparable to that
determined for various mixes of fly ash by Lam et al. (2000) and shown in Table 4.1
below.

54
Table 4.1. Nonevaporabe water content for various Fly ash mixes Lam et al. (2000) w/b Fly ash replacement
(%) *Wnu at 90 days
0.3 0.3 0.5 0.5
25 55 25 55
0.19 0.15 0.18 0.15
* Calculated from ratio of Wn / Degree of hydration
Legend: Degree of Hydration results
o IOP –Isothermal curing of paste samples in oven
o (Row # - 1, 6, 14, 16, 17, 24, 25, 36, 37, 40, 41, 44, 45, 48, 49)
o ITP –Isothermal curing of paste samples in tanks
o (Row # - 2, 7, 15, 18, 19, 26, 27, 38, 39, 42, 43, 46, 47, 50, 51)
o ATM – Adiabatic curing of mortar samples in tank
o (Row # - 3, 8, 11, 20, 21, 28, 29, 32, 33)
o ATC – Adiabatic curing of mortar sieved from concrete in tank
o (Row # - 4, 5, 9, 10, 12, 13, 22, 23, 30, 31, 34, 35, 52, 53, 54)
o C & F - Calculation of degree of hydration based on total cement and fly ash
content and the nonevaporable water content at full hydration after curing for 1
year at 73oF. the nonevaporable content for 1 gram of 18%FA mix was
determined to be 0.19 and that for the 50%FA was determined to be 0.15.
o C – Calculation of degree of hydration based on cement solely responsible for the
hydration products formed assuming no reaction of fly ash. NA designation is
applied to durations and temperatures for which fly ash reaction is assumed to
have started, invalidating an extension of this calculation.

55
o C & S - Calculation of degree of hydration based on total cement and blast
furnace slag content and the nonevaporable water content at full hydration of 0.23
as for plain cement mixes.
Table 4.2. Degree of hydration results for plain cement mixes Curing Duration (days)
Mix Temp Row Mix design 1 2 3 4 5 6 7 8 9 10 14 28 56 91
1 IOP – 0% .41w/c 58 - 67 - - - 70 - - 71 71 73 74 - 2 ITP – 0% .41 w/c 56 - 64 - - - 69 - - 71 77 78 79 -
3 ATM – 0% .41 w/c 52 60 60 64 61 62 61 62 70 63 68 70 - - 4 ATC – 0% .41 w/c - - - - - - 59 - - - - 64 - 69
73
5 ATC – 0% .40w/c - - - - - - 54 - - - - 64 - 62
6 IOP – 0% .41w/c 68 - 72 - - - 75 - - 73 72 69 69 - 7 ITP – 0% .41 w/c 68 - 72 - - - 76 - - 76 81 79 79 -
8 ATM – 0% .41 w/c 60 73 68 71 67 69 67 69 74 68 70 71 - - 9 ATC – 0% .41 w/c - - - - - - 61 - - - - 61 - 66
160
10 ATC – 0% .40w/c - - - - - - 62 - - - - 59 - 61
11 ATM – 0% .41 w/c 60 73 71 71 68 68 67 69 74 73 70 68 - - 12 ATC – 0% .41 w/c - - - - - - 59 - - - - 63 - 69 180 13 ATC – 0% .40w/c - - - - - - 60 - - - - 59 - 60
14 IOP – 0% .41w/c 73 - 75 - - - 80 - - 78 75 75 76 -
0%
200 15 ITP – 0% .41 w/c 65 - 69 - - - 73 - - 73 75 74 74 -

56
Table 4.3. Degree of hydration for 18% fly ash mixes Curing Duration (days)
Mix Temp Row Mix design 1 2 3 4 5 6 7 8 9 10 14 28 56 91
16 C 63 - 65 - - - 75 - - 78 76 79 NA - 17
IOP – 18% FA 60 63 73 75 74 76 79 -
18 C 51 - 65 - - - 70 - - 75 81 84 NA - 19
ITP – 18% FA 50 - 63 - - - 68 - - 72 78 82 80 -
20 C 51 58 60 63 61 60 61 64 73 69 69 73 - - 21
ATM – 18% FA 49 55 59 61 60 58 59 62 70 66 67 70 - -
22 C - - - - - - 55 - - - - 64 - NA
73
23 ATC – 18% FA
- - - - - - 54 62 76
24 C 78 - 81 - - - 84 - - NA NA NA NA - 25
IOP – 18% FA 75 - 78 - - - 81 83 82 78 76
26 C 73 - 78 - - - 80 - - NA NA NA NA - 27
ITP – 18% FA 70 - 75 - - - 77 79 81 83 82
28 C 61 71 74 75 73 71 70 NA NA NA NA NA - - 29
ATM – 18% FA 59 69 72 73 71 69 68 70 69 72 72 71 - -
30 C - - - - - - 65 - - - - NA - NA
160
31 ATC – 18% FA
- - - - - - 63 64 - 73
32 C 59 71 73 75 71 73 71 NA NA NA NA NA - - 33
ATM – 18% FA 56 69 72 73 69 70 69 70 69 75 73 71 - -
34 C - - - - - - 63 - - - - NA - NA180
35 ATC – 18% FA
- - - - - - 61 - - - - 68 - 70
36 C 80 - 84 - - - 84 - - NA NA NA NA - 37
IOP – 18% FA 78 - 81 - - - 81 - - 83 82 81 84 -
38 C 68 - 70 - - - 74 - - NA NA NA NA -
18%
200
39 ITP – 18% FA
C&F 66 - 68 - - - 71 - - 73 75 79 77 -

57
Table 4.4. Degree of hydration for 50% fly ash mixes Curing Duration (days)
Mix Temp Row Mix design 1 2 3 4 5 6 7 8 9 10 14 28 56 91
40 C 58 - 68 - - - 80 - - 82 84 86 NA - 41
IOP – 50% FA 44 53 61 63 65 66 64
42 C 50 - 70 - - - 78 - - 84 94 102 NA - 73
43 ITP – 50% FA
38 53 60 65 71 78 76
44 C 80 - 80 - - - 82 - - NA NA NA NA - 45
IOP – 50% FA 61 62 63 64 63 66 68
46 C 86 - 88 - - - 88 - - NA NA NA NA -
160
47 ITP – 50% FA
65 67 67 71 74 78 75
48 C 86 - 88 - - - 86 - - NA NA NA NA - 49
IOP – 50% FA 66 67 66 64 65 68 61
50 C 70 - 80 - - - 78 - - NA NA NA NA -
50%
200
51 ITP – 50% FA
53 61 59 60 66 67 68
Table 4.5. Degree of hydration for cement and blast furnace slag mixes Curing Duration (days)
Mix Temp Row Mix design 1 2 3 4 5 6 7 8 9 10 14 28 56 91
73 52 ATC – 50% SL C & S - - - - - - 69 - - - - 78 - 81
160 53 ATC – 50% SL C & S - - - - - - 84 - - - - 86 - 82
50%
180 54 ATC – 50% SL C & S - - - - - - 82 - - - - 85 - 84
Phase 2 – Tests of Mass Concrete
Table 4.6 provides a summary of the plastic properties of the mass concrete mixes
tested. Tests for each mix included determination of the degree of hydration, compressive
strength, time to corrosion, rapid chloride permeability, density and the percentage of
voids at curing durations of 7, 28 and 91 days and curing temperatures of 73, 160 and
180oF. The test for each mix was repeated and the average results for each mix is
provided in Tables 4.7 and 4.8.

58
Table 4.6. Summary of Plastic Properties of Fresh Concrete.
Test #
Mixture Concrete
Temperature (oF)Air
Temperature (oF)
Slump in
Air Content %
Workability w/b ratio
1 72 72
2 70 70
3 72 72
4
Mix 1 Mix 2 Mix 3 Mix 4 Mix 5 Mix 6 Mix 7 Mix 8
75 75
69 70
74 74
75 73 71
70
6.50 5.00
6.50 7.50
5.25 3.25
4.00 2.75
4.0 2.0
4.5 2.5
6.0 3.9
5.50 3.00
Good OK
Good Good
Good Sticky
Good Stiff
0.41 0.41
0.41 0.41
0.40 0.40
0.40 0.40
Table 4.7. Results of concrete mixes M1 and M2 Temp Duration Hydration Comp Density Voids RCP Resistivity Corrosion
Test # Mix ID (oF) (days) (%) (psi) (lbs/ft3) (%) (coulombs) (kohms/cm) (days)
7 56 6048 - - - - -
28 66 6860 155.70 16.00 5507 8.63 12 73
91 70 7457 155.70 16.30 4456 11.07 -
7 56 5992 - - - - -
28 60 6051 157.10 16.70 8701 7.16 8 160
91 63 6280 156.50 16.00 6693 8.28 -
7 56 5761 - - - - -
28 67 5790 159.05 15.95 9317 8.46 5
M1 (0% Fly Ash)
w/c = 0.41 slump = 6.5"
180
91 66 6037 156.50 15.80 7695 8.27 -
7 49 6610 - - - - -
28 58 7770 161.20 16.75 5014 9.04 14 73
91 58 8517 159.90 15.90 2285 17.84 -
7 62 6942 - - - - -
28 61 7149 162.15 16.60 2470 21.33 9 160
91 60 7810 160.30 16.70 1701 29.80 -
7 57 6660 - - - - -
28 62 7069 162.15 16.90 2646 19.42 9
1
M2 (18% Fly Ash)
w/c = 0.41 slump = 5.0"
180
91 61 7437 160.70 16.20 1822 23.06 -

59
Table 4.8. Results of concrete mixes M3 and M4 Temp Duration Hydration Comp Density Voids RCP Resistivity Corrosion
Test # Mix ID (oF) (days) (%) (psi) (lbs/ft3) (%) (coulombs) (kohms/cm) (days)
7 61 5800 154.20 16.30 - -
28 61 6387 156.30 15.30 5616 11.22 15 73
91 69 7043 152.20 14.50 4531 12.18
7 66 5567 155.30 15.90 - -
28 62 5613 155.10 16.20 8565 8.42 5 160
91 70 5957 155.20 15.80 6851 9.78
7 61 5323 155.80 16.00 - -
28 59 5353 155.20 15.80 10459 8.85 7
M3 - same as M1
(0% Fly Ash)w/c = 0.41
slump = 6.5"
180
91 72 5343 154.10 15.50 7370 9.12
7 58 6320 159.70 16.60 - -
28 66 7173 159.40 16.00 5331 10.83 27 73
91 93 8220 158.10 15.70 2272 18.95
7 64 6647 161.40 16.80 - -
28 66 6570 160.40 17.40 2626 21.33 15 160
91 86 7180 158.90 15.80 1872 26.09
7 64 6247 159.00 17.40 - -
28 74 6643 158.70 17.10 2360 18.67 15
2 (repeat
of test 1)
M4 - same as M2
(18% Fly Ash) w/c = 0.41
slump = 7.5"
180
91 90 7187 158.90 15.80 1923 22.13

60
Table 4.9. Results of concrete mixes M5 and M6
Temp Duration Hydration Comp Density Voids RCP Resistivity Corrosion Test # Mix ID
(oF) (days) (%) (psi) (lbs/ft3) (%) (coulombs) (kohms/cm) (days)
7 50 4780 156.2 14.7 - -
28 63 5673 150.0 14.0 5850 9.84 18 73
91 63 6310 152.4 14.2 4105 12.1
7 54 4783 155.6 15.8 - -
28 58 4673 152.9 15.1 10108 7.93 11 160
91 62 4903 153.7 16.6 7770 8.45
7 55 4830 155.1 15.7 - -
28 61 4673 151.9 14.9 8996 11.45 14
M5 (0% Slag) w/c = 0.40
slump = 5.25"
180
91 65 4707 155.9 15.8 9233 9.65
7 69 5293 161.5 16.0 - -
28 80 7165 158.5 14.7 2845 17.88 42 73
91 83 8003 157.5 14.1 2114 24.50
7 80 6790 161.4 16.0 - -
28 84 6877 159.3 15.1 1919 21.68 16 160
91 84 7617 158.5 14.3 1662 25.90
7 80 5853 161.4 15.5 - -
28 84 6273 158.7 14.7 2689 18.49 11
3
M6 (50% Slag) w/c = 0.40
slump = 3.25"
180
91 87 7180 159.5 15.0 1753 25.00

61
Table 4.10. Results of concrete mixes M7 and M8 Temp Duration Hydration Comp Density Voids RCP Resistivity Corrosion
Test # Mix ID (oF) (days) (%) (psi) (lbs/ft3) (%) (coulombs) (kohms/cm) (days)
7 57 5760 152.3 12.3 - -
28 65 6733 155.7 13.6 4430 11.34 21 73
91 61 7307 152.4 12.3 3960 12.5
7 69 5947 151.4 11.9 - -
28 60 5653 156.3 14.3 8135 7.93 11 160
91 60 5890 154.4 14.0 7119 8.45
7 64 5450 152.5 11.8 - -
28 57 5430 154.8 14.7 6175 10.97 7
M7 - same as M5 (0% Slag) w/c = 0.40
slump = 4.0"
180
91 54 5373 153.7 14.0 8347 9.05
7 69 5770 155.5 12.8 - -
28 75 8303 159.8 15.3 2540 19.45 85 73
91 79 9003 155.7 12.6 1890 22.54
7 87 7307 156.3 12.0 - -
28 87 7470 160.5 14.4 1943 23.67 22 160
91 80 8230 156.1 12.9 1481 27.00
7 83 6567 155.4 11.8 - -
28 85 6883 160.8 14.9 2105 20.55 44
4 (repeat of
test 3)
M8 - same as M6 (50% Slag) w/c = 0.40
slump = 2.75"
180
91 80 7370 157.3 12.1 1802 24.76

62
Table 4.11. Summary of Results of concrete mixes M1 , M2, M3 and M4 Temp Duration Hydration Comp Density Voids RCP Resistivity Corrosion
Mix ID (oF) (days) (%) (psi) (lbs/ft3) (%) (coulombs) (kohms/cm) (days)
7 59 5924 154.20 16.30 - - -
28 64 6624 156.00 15.65 5562 9.93 14 73
91 69 7250 153.95 15.40 4494 11.63 -
7 61 5780 155.30 15.90 - - -
28 61 5832 156.10 16.45 8633 7.79 7 160
91 67 6119 155.85 15.90 6772 9.03 -
7 59 5542 155.80 16.00 - - -
28 63 5572 157.10 15.88 9888 8.66 6
M1 & M3 (0% Fly Ash)
w/c = 0.41
180
91 69 5690 155.30 15.65 7533 8.70 -
7 54 6465 159.70 16.60 - - -
28 62 7472 160.30 16.38 5173 9.94 20 73
91 76 8369 159.00 15.80 2279 18.40 -
7 63 6795 161.40 16.80 - - -
28 64 6860 161.30 17.00 2548 21.33 12 160
91 73 7495 159.60 16.25 1787 27.95 -
7 61 6454 159.00 17.40 - - -
28 68 6856 162.15 17.00 2503 19.05 12
M2 & M4 (18% Fly Ash)
w/c = 0.41
180
91 70 7312 159.80 16.00 1873 22.60 -

63
Table 4.12. Summary of Results of concrete mixes M5, M6, M7 and M8 Temp Duration Hydration Compressive Density Voids RCP Resistivity Corrosion
Mix ID (oF) (days) (%) (psi) (lbs/ft3) (%) (coulombs) (kohms/cm) (days)
7 54 5270 154.3 13.5 - -
28 64 6203 152.9 14.2 5140 10.59 20 73
91 62 6808 152.4 13.3 4033 12.3
7 62 5363 153.5 13.9 - -
28 59 5163 154.6 14.7 9122 7.93 11 160
91 61 5397 154.1 15.3 7445 8.45
7 60 5140 153.8 13.8 - -
28 59 5052 153.4 14.8 7586 11.21 11
M5 & M7 (0% Slag) w/c = 0.40
180
91 60 5040 154.8 14.9 8794 9.35
7 69 5532 158.5 14.4 - -
28 78 7734 159.2 15.0 2693 18.67 64 73
91 81 8503 156.6 13.4 2002 23.52
7 84 7049 158.9 14.0 - -
28 86 7174 159.9 14.8 1919 21.68 19 160
91 82 7924 157.3 13.6 1572 26.45
7 82 6210 158.4 13.7 - -
28 85 6578 159.8 14.8 2689 18.49 28
M6 & M8 (50% Slag) w/c = 0.40
180
91 84 7275 158.4 13.6 1778 24.88
Degree of Hydration Results
The degree of hydration was determined from mortar samples sieved from the
concrete mixes. The samples were cured adiabatically for the same durations as the mass
concrete samples. At the end of the curing durations, the hydration process was stopped
by immersion in methanol and then tested to determine the degree of hydration. Figures
4.1 and 4.2 show the results of the hydration tests.

64
Degree of Hydration (0%FA & 18%FA)
50
55
60
65
70
75
80
7 28 91
Duration ( Days)
Hyd
ratio
n (%
) 0% FA - 73F0% FA - 160F0%FA - 180F18% FA - 73F18%FA - 160F18%FA - 180F
Figure 4.1. Degree of hydration for 0%FA and 18%FA mixes
Addition of Fly ash increases the degree of hydration at early ages for the samples
cured at the higher temperatures. Higher curing temperatures have not been effective
however in increasing the degree of hydration at early age for the mix without fly ash. At
later ages, the degree of hydration for the fly ash mix is higher than that without fly ash at
all curing temperatures. The degree of hydration for the fly ash mix at later ages is
highest in the samples cured at 73oF and decreases with increasing curing temperature.

65
Degree of Hydration (0%BFS & 50%BFS)
505560657075808590
7 28 91
Duration ( Days)
Hyd
ratio
n (%
) 0%BFS - 73F0% BFS - 160F0%BFS - 180F50%BFS - 73F50%BFS - 160F50%BFS - 180F
Figure 4.2. Degree of hydration for 0%BFS and 50%BFS mixes
Addition of slag as seen in Figure 4.2, resulted in a drastic increase in the degree of
hydration over the mix without slag at both early and later ages for all curing
temperatures. The slag mixes cured at higher temperatures showed a much higher degree
of hydration at early ages, however at later ages all curing temperatures had reach to
about the same degree of hydration.
Compressive Strength Results
The compressive tests were performed on twenty-seven different cylinders for each
mix. Nine samples of each mix were tested at curing durations of 7, 28 and 91 days from
the mixing date. Three samples each were tested for three different temperatures of 73,
160 and 180oF. The compressive strengths were determined in accordance with ASTM
C39-93a. Figures 4.3 through 4.7 show the results of the compressive strength for the
different mixes and curing conditions.

66
Compressive strengths (0%FA & 18%FA)
500055006000650070007500800085009000
7 28 91
Duration ( Days)
PS0% FA - 73F0% FA - 160F0%FA - 180F18% FA - 73F18%FA - 160F18%FA - 180F
Figure 4.3. Compressive strengths for 0%FA and 18%FA mixes
Table 4.13. Compressive strength as a ratio of 28-day samples cured at 73oF Temperature (oF)
Mix Duration(days) 73 160 180
7 0.89 0.87 0.84
28 1.00 0.88 0.84 0% FA
91 1.09 0.92 0.86
7 0.87 0.91 0.86
28 1.00 0.92 o.92 18% FA
91 1.12 1.00 0.99
Higher curing temperatures resulted in lower strength for all ages and mixtures
except fly ash mix at 7 days age, which had a higher strength at the 160F as shown in
Figure 4.3 and Table 4.13. Addition of fly ash increased the strength at all ages and
curing temperatures when compared to the mix without fly ash, mirroring the higher
degree of hydration of the fly ash mixes over the plain cement mixes. The highest
strength at later age was recorded for the fly ash mix cured at 73oF, which also had the
highest degree of hydration at this age.

67
Compressive strengths (0%BFS & 50%BFS)
4000
5000
6000
7000
8000
9000
7 28 91
Duration ( Days)
PSI
0%BFS - 73F0% BFS - 160F0%BFS - 180F50%BFS - 73F50%BFS - 160F50%BFS - 180F
Figure 4.4. Compressive strengths for 0%BFS and 50%BFS mixes
Table 4.14. Compressive strength as a ratio of the 28-day samples cured at 73oF Temperature (oF)
Mix Duration(days) 73 160 180
7 0.85 0.86 0.83
28 1.00 0.83 0.81 0% Slag
91 1.10 0.87 0.81
7 0.71 0.91 0.80
28 1.00 0.93 0.85 50% Slag
91 1.10 1.02 0.94
Higher curing temperatures resulted in increased early age strength in the slag mix
but reduced later age strength as seen in Figure 4.4 and Table 4.14. Higher curing
temperatures in the mix without slag generally resulted in a decrease in both early and
later age strength. The mix with slag had higher strengths at all curing durations and
temperatures compared to the mix without the slag. This observation agrees with the
higher degree of hydration in the slag mix over the mix without slag.

68
Resistance to Chloride Ion Penetration
Six samples of each mix were tested at 28 and 91 days, two for each curing
temperature. The tests were done in accordance with ASTM C 1202-94. Results of this
test are shown for the various mixes in Figures 4.5 and 4.6. The blended cement mixes
were observed to have a higher resistance to chloride ion penetration than the plain
cement mixes as shown by the lower charges passing through during the test.
Chloride Ion Penetration - RCP (0%FA & 18%FA)
100020003000400050006000700080009000
10000
28 91
Duration ( Days)
Cou
lom
bs
0% FA - 73F0% FA - 160F0%FA - 180F18% FA - 73F18%FA - 160F18%FA - 180F
Figure 4.5 Chloride Ion Penetration results for 0%FA and 18%FA mixes
As shown in Figure 4.5 above, at higher curing temperatures, the mixes without fly
ash, had higher chloride penetration at both 28 and 91 days. For the fly ash mixes
however higher curing temperatures resulted at much reduced chloride ion penetration at
28 days although their influence on chloride penetration at 91 days was about the same as
curing at 73oF. Overall, the fly ash mixes had lower chloride ion penetration at all curing
durations and temperatures when compared to the mixes without fly ash.

69
Chloride Ion Penetration - RCP (0%BFS & 50%BFS)
100020003000400050006000700080009000
10000
28 91
Duration ( Days)
Cou
lom
bs0%BFS - 73F0% BFS - 160F0%BFS - 180F50%BFS - 73F50%BFS - 160F50%BFS - 180F
Figure 4.6. Chloride Ion Penetration results for 0%BFS and 50%BFS mixes
The mix without slag as seen in Figure 4.6, showed increased RCP values at higher
temperatures. The RCP values for the slag mixes were not much affected by the curing
temperatures. Overall, RCP values for the slag mixes were considerably reduced when
compared to the mixes without slag at all curing temperatures and durations.
Density and Percentage of Voids Results
Two samples of each mix for each curing temperature weighing approximately
800g were tested at 7, 28 and 91 days to determine the density and percentage of voids.
Figure 4.7 shows the density for the plain cement and fly ash mixes. Figure 4.8 shows the
density for the blast furnace slag mix.

70
Density (0%FA & 18%FA)
150.00
154.00
158.00
162.00
166.00
170.00
7 28 91
Duration ( Days)
Den
sity
(lbs
/cuf
t) 0% FA - 73F0% FA - 160F0%FA - 180F18% FA - 73F18%FA - 160F18%FA - 180F
Figure 4.7 Density for 0%FA and 18%FA mixes
The mix with fly ash showed a higher density at all curing temperatures and curing
durations, than the mix without it as seen in Figure 4.7. The curing temperature of the
concrete had a minimal influence on the resulting density.
Density (0%BFS & 50%BFS)
150.0
152.0
154.0
156.0
158.0
160.0
7 28 91
Duration ( Days)
Den
sity
(lbs
/cuf
t) 0%BFS - 73F0% BFS - 160F0%BFS - 180F50%BFS - 73F50%BFS - 160F50%BFS - 180F
Figure 4.8. Density for 0%BFS and 50%BFS mixes

71
Addition of slag has increased density for all curing temperatures and ages. Higher
curing temperatures have slightly increased density at 91 days for mixes with and without
slag as seen in Figure 4.8.
Percentage of voids (0%FA & 18%FA)
15.00
15.50
16.00
16.50
17.00
17.50
7 28 91
Duration ( Days)
Void
s (%
)
0% FA - 73F0% FA - 160F0%FA - 180F18% FA - 73F18%FA - 160F18%FA - 180F
Figure 4.9. Percentage of voids for 0%FA and 18%FA mixes
At 7 days, the fly ash mixes had a higher percentage of voids at all curing
temperatures when compared to the mix without fly ash as shown in Figure 4.9. The
percentage voids in the fly ash mixes is higher in the samples cured at elevated
temperatures. For both mixes with and without fly ash, the percentage of voids at 91
days was least in the samples cured at 73oF.

72
Percentage of voids (0%BFS & 50%BFS)
13.0
13.5
14.0
14.5
15.0
15.5
7 28 91
Duration ( Days)
Void
s (%
)0%BFS - 73F0% BFS - 160F0%BFS - 180F50%BFS - 73F50%BFS - 160F50%BFS - 180F
Figure 4.10. Percentage of voids for 0%BFS and 50%BFS mixes
At 7 days, the mixes with slag showed a lower percentage of voids in the samples
cured at the elevated temperatures, however, this situation was reversed at 91 days in
which the percentage of voids was lower in the samples cured at 73oF. At all curing
temperatures and durations, the mix without slag cured at 73oF had the least percentage
of voids as seen in Figure 4.10.
Time to Corrosion Results
The corrosion results for each mix and curing temperature is presented individually
as an average of three samples. The results as shown in Figure 4.11 indicate the increase
in the concrete durability by the use of slag. The use of fly ash also increased the time to
corrosion when compared to the plain cement mixes, but to a smaller extent. Increasing
the curing temperature for all the mixes resulted in reduction of time to corrosion.

73
Time to Corrosion (TTC) - Impressed current
0
10
20
30
40
50
60
70
0% Fly Ash 0% Slag 18% Fly Ash 50% Slag
Mix Designs
Dur
atio
n (d
ays)
73 F160 F180 F
Figure 4.11. Time to Corrosion results for all mixes
RCP (91 days) - Expressed in terms of TTC unit
0
10
20
30
40
50
60
70
0% Fly Ash 0% Slag 18% Fly Ash 50% Slag
Mix designs
Dur
atio
n (d
ays)
73 F160 F180 F
Figure 4.12. The RCP at 91days expressed in terms of Time to Corrosion unit
Three parameters were used in this research to study the durability of the concrete:
1. Percentage of voids
2. Rapid chloride permeability (RCP) and
3. Time to corrosion (TTC) – Impressed current
The following observations were made in relating these parameters:

74
a. The percentage of voids determined for the various samples did not have much
variation in the values and could not be used to establish differences in the
durability of the mixes.
b. The RCP and TTC tests exhibited similar results for the plain cement mixes (0%
FA and 0% BFS), that is both tests showed reduction in durability when curing
temperature increased (see Figures 4.11 and 4.12).
c. The mixes with the Fly ash and slag showed conflicting durability results from the
RCP and TTC tests as seen in Figures 4.11 and 4.12. The TTC test indicated
better durability for the samples cured at 73oF (Figure 4.11), whereas the RCP
test showed that the Fly ash and slag mixes had better durability at the higher
curing temperatures.
Phase 3 – Microstructural Analysis
SEM Observations of Plain Cement Mixes
Effect of Curing Temperature on the Presence of Ettringite Crystals
1. None of the plain cement mixes cured at room temperature showed the
presence of ettringite crystals (Figure 4.13). These samples had the highest
permeability rates. However the high permeability values had no effect on
ettringite formation. This observation agrees with a threshold temperature
of 160oF is required during curing for ettringite to reform in the hardened
concrete.
2. For the plain cement mixes cured at the elevated temperatures of 160 and
180oF, there was no observation of ettringite crystals when examined
microscopically after 7 days of curing.

75
3. For the plain cement mixes cured at the elevated temperatures of 160 and
180oF, ettringite was present when they were examined at 28 and 91 days
(Figures 4.14 & 4.16). These samples had higher permeability values when
compared to the room cured samples.
Effect of Curing Duration on the Amount of Ettringite Crystals formed
1. At the elevated curing temperatures of 160 and 180oF well-formed balls of
ettringite crystals were seen in the voids when examined at 28 days.
2. The high permeability of the samples cured at the elevated temperatures
facilitated the formation and transportation of ettringite within the
microstructure of the hardened samples. Voids observed partially filled with
ettringite when examined at 28 days showed an increased amount of the
ettringite crystals when examined at 91 days. Figures 5 and 7 show voids
completely filled with ettringite when examined at 91 days, a direct
consequence of the increased permeability.

76
Figure 4.13 Well-defined Monosulphate (M)
Figure 4.14. Void with clusters of Ettringite (
M
0%FA - 73F –28days
2500xcrystals in a void
E
0%FA - 160F –28days
350xE) crystals

77
Figure 4.15. Void containing both Monosulphate (M) and Ettringite (E) crystals
Figure 4.16. Voids containing Ettringite (E) some appear almost full of it.
E
0%FA - 160F –91days 300x
M
E
0%FA - 180F – 28days 220x
E

78
Figure 4.17. Void completely filled with fibrous Ettringite (E)
SEM Observations of Fly Ash Mixes
Introduction
Calcium hydroxide crystals formed by the hydrating cement constitute 20 to 25
percent of the volume of solid in the hydrated phase (Neville, 2004). Calcium hydroxide
is water-soluble and may leach out of hardened concrete, leaving voids for ingress of
water. Through its pozzolanic properties, fly ash chemically combines with calcium
hydroxide and water to produce C-S-H, which fills in the spaces between hydrating
cement particles, thus reducing the risk of leaching calcium hydroxide. The long-term
reaction of fly ash refines the pore structure of concrete and reduces the permeability
(ACI 232.2R-96, 1999). At normal temperatures, little pozzolanic activity from fly ash
occurs after 28 days of curing (Malhotra and Ramezanianpour, 1994), this is evident in
0%FA - 180F – 91days 2000x
E

79
the almost identical permeability values for the fly ash mixes and the plain cement mixes
at 28 days cured at room temperatures. At the elevated temperatures however the
pozzolanic activity occurs sooner and this is evident in the much lower permeability of
the fly ash mixes cured at the elevated temperatures when compared to the plain cement
mixes. At the elevated curing temperatures, the permeability values of the plain cement
mixes is about 3 times more than those of the fly ash mixes.
Effect of Curing Temperature on the Presence of Ettringite Crystals
1. The fly ash samples cured at room temperature did not show the presence of
ettringite even though the RCP test indicated the higher permeability values
when compared to the fly ash mixes cured at the elevated temperatures.
2. At the elevated temperature curing of 160oF, ettringite was not present
when examined at 28 days as shown in Figure 4.18. The low permeability
of these samples will inhibit the ingress of water and the formation of
ettringite. At 91 days however these samples showed the presence of
ettringite crystals in the void spaces.
3. Ettringite was observed at 28 days in the fly ash samples cured at 180oF
(Figure 4.19) just as in the plain cement mixes. These samples have almost
identical permeability values to the fly ash samples cured at 160oF. While
the samples cured at 160oF did not show ettringite at 28 days, the higher
curing temperature of 180oF will account for the observation of the
ettringite in the higher cured samples.

80
Effect of Curing Duration on the Amount of Ettringite Crystals formed in Voids
1. At 28 days, the ettringite formed in the voids of samples cured at 180oF was
not as big and in well-formed balls as the crystals seen in the equivalent
plain cement mixes.
2. At 91 days, examination of the fly ash samples cured at 180oF showed
ettringite crystals in pore spaces (Figure 4.20). The amount of ettringite
observed was increased from that observed in these samples at 28 days.
These pores however were not entirely filled with the ettringite when
compared to the equivalent plain cement mixes.
Figure 4.18. Void containing hexagonal plates of Monosulphate (M).
18%FA - 160F – 28days 800x
M

81
Figure 4.19. Void showing Monosulphate (M) transformed into Ettringite (E)
Figure 4.20. Clusters of Fibrous Ettringite (E) in void
18%FA - 180F – 28days 4300x
E
M
18%FA - 180F – 91days 80x
E

82
SEM Observations of Slag Mixes
Introduction
Slag is a waste product in the manufacture of pig iron. Chemically, slag is a
mixture of lime, silica, and alumina, the same oxides that make up Portland cement, but
not in the same proportions (Neville, 2004). The permeability of mature concrete
containing slag is greatly reduced when compared with concrete not containing slag. As
the slag content is increased, permeability decreases. The pore structure of the
cementitious matrix is changed through the reactions of slag with the calcium hydroxide
and alkalis formed during the Portland cement hydration. Pores in concrete normally
containing calcium hydroxide in part get filled with calcium silicate hydrate. Permeability
of concrete depends on its porosity and pore-size distribution. Where slag is used,
reduction in the pore size has been noted prior to 28 days after mixing (ACI 233R-95,
1999).
Miller and Conway (2003) examined the effectiveness of using slag to prevent DEF
expansions in mortar made from expansive cements. One year into the study, they found
that 5% slag substitution reduced or delayed, but did not eliminate expansions at curing
temperatures above 167oF (75oC). Expansion was however completely absent when
17.5% slag substitution was used. Substitution of the cement by slag did not have any
adverse effect on the strength of the mortar cured at 194oF (90oC) which showed superior
strength at all ages for all mixes with 30% slag substitution (Miller and Conway, 2003).
This was also evident in compressive strength tests of the mixes used in this study which
showed higher strengths for the slag mixes cured at elevated temperatures (Chini and
Acquaye, 2005). The beneficial effect of added slag in reducing expansions from DEF
may have to do with the reduced pH of the pore solution. Ettringite is more stable below

83
pH of 12.5 and the slag may reduce the pH to the region where ettringite stability is
enhanced. If there is less decomposition at the elevated temperature, less ettringite may
potentially form later, when its formation may lead to volume instability (Miller and
Conway, 2003).
Effect of Curing Temperature on the Presence of Ettringite Crystals
1. At all curing temperatures, the slag mixes had the lowest permeability
values of the mixes tested.
2. No ettringite was observed at 28 days in the slag samples cured at the
elevated temperatures (Figures 4.21 and 4.23). The slag samples had the
least permeability values when compared to equivalent plain cement and fly
ash mixes.
3. At 91 days, slag mixes cured at the elevated temperatures showed the
presence of ettringite. Inclusion of 50% slag was the most effective at
delaying the onset of the ettringite. However by 91 days, these ettringite
crystals were observed in the void spaces
Effect of Curing Duration on the Amount of Ettringite Crystals formed
1. The amount of ettringite in the voids observed at 91 days in the elevated
cured samples was in much smaller amounts than in the fly ash or plain
cement mixes. They could only be seen at very high magnifications as
shown in Figure 4.22.
2. Some ettringite crystals were formed on the surfaces of slag particles as
seen in Figures 4.24 and 4.25

84
Figure 4.21. Sample with empty air Voids (V)
Figure 4.22 Higher magnification of Figure 4.32
50%BFS - 160F – 28days 450x
V
E M
4800x 50%BFS - 160F – 91days

85
Figure 4.23. Sample with empty air Void (V)
Figure 4.24. Reacting Slag (S) particle with Ettringite (E) formed
50%BFS - 180F – 28days 300x
V
50%BFS - 180F – 91days 500x
S
E

86
Figure 4.25 Slag particle completely covered with Ettringite (E)
50%BFS - 180F – 91days 900x
E
87
CHAPTER 5 CONCLUSIONS AND RECOMMENDATIONS
Introduction
This dissertation investigated the effects of elevated curing temperatures on the
strength, durability and potential of delayed ettringite formation (DEF) in typical FDOT
Class IV mass concrete mixes. The three concrete mix designs tested were plain cement
mixes, mixes with 18% fly ash and mixes with 50% slag. The durability of the concrete
was evaluated through a measure of the permeability of the concrete. Higher permeability
values indicated a greater ease of ingress of deleterious material and a less durable
concrete. Two curing cycles were used for the elevated temperature curing- isothermal
and adiabatic curing. Samples cured isothermally at the elevated temperatures were
placed in tanks set at the elevated temperatures immediately after casting. In the adiabatic
curing cycle, samples were introduced to the elevated curing temperature environment, 6
hours after casting. In the adiabatic curing cycle, the tanks were initially set at 80oF and
the elevated temperatures of 160 and 180oF were attained within 2 and 2½ days
respectively. The adiabatic curing cycles were set to simulate approximate conditions of
mass concrete cured in the field.
Conclusions
Table 5.1 is a summary of the compressive strengths of plain cement mixes cured
isothermally and Table 5.2 gives the permeability values of these samples. Summaries of
results of the compressive strength, permeability and ettringite formation in samples
cured adiabatically are shown in Tables 5.3 and 5.4. Comparing the strength and

88
permeability of the isothermally and adiabatically cured samples, the following
conclusions were observed:
1. There was a substantial decrease in compressive strength of plain Portland
cement concrete samples cast and stored immediately in water tanks under
isothermal curing temperatures of 160 and 200oF compared to samples
cured at room temperature 73oC. This reduction was 34 and 62% for 28-day
compressive strength for samples cured at 160 and 200oF, respectively. In
addition, RCP test of these samples showed a significant increase in
permeability of concrete cured at high temperature.
2. When plain Portland cement concrete samples were subjected to the
adiabatic curing cycle, there was a moderate reduction in 28-day
compressive strength of samples cured at elevated temperatures compared
to samples cured at room temperature. The reduction was approximately
15% and 18% for samples cured at temperatures of 160 and 180oF,
respectively. However, there was still a significant increase in permeability
of concrete measured through the RCP test.
3. Adiabatic curing of fly ash cement concrete samples (18% fly ash by
weight) resulted in 8% reduction of 28-day compressive strength for
samples cured at 160oF and 180oF compared to those cured at room
temperature. However, permeability of concrete measured by RCP test
improved noticeably at higher curing temperatures suggesting that at higher
temperatures the fly ash becomes effective much earlier and reduces the

89
RCP values. At normal curing temperature the RCP reducing effect of fly
ash becomes effective after approximately two months.
4. When 50% (by weight) of Portland cement is replaced by blast furnace slag,
the 28-day compressive strength of samples cured adiabatically at elevated
temperatures reduced by 7.and 15% for curing temperatures of 160oF and
180oF compared to those cured at room temperature. Results of compressive
strength tests and RCP tests revealed that addition of blended cement
improves strength and durability of concrete.
Table 5.1. Compressive strength samples cured isothermally COMPRESSIVE STRENGTH (PSI)
Plain cement mix Temp
(F) Value 28 days 91 days
Avg* 7472 8252 StaDev 304 276 73 95%C.I. ±348 ±319
Avg* 4963 5616 StaDev 276 624 160 95%C.I. ±319 ±711
Avg* 2872 2636 StaDev 276 406 200 95%C.I. ±319 ±464
Avg* – Average of 3 samples, SD – Standard Deviation, C.I. – 95% Confidence Interval

90
Table 5.2. RCP for samples cured isothermally RAPID CHLORIDE PERMEABILITY (RCP)
Plain cement mix
28 days Temp
(F) Value
Coulomb Rate
Avg* 4720.0 SD 74.0 73 95%C.I. ±103
High
Avg* 7110.0 SD 410.0 160 95%C.I. ±568
High
Avg* 11070.0 SD 503 200 95%C.I. ±698
High
Avg* – Average of 2 samples, SD – Standard Deviation, C.I. – 95% Confidence Interval
Table 5.3. Compressive strength for adiabatically cured samples COMPRESSIVE STRENGTH (PSI)
Plain cement mix 18% Fly ash mix 50% Slag mix Temp
(F) Value 7 days 28 days 91 days 7 days 28 days 91 days 7 days 28 days 91 days
Avg* 5924 6624 7250 6465 7472 8369 5532 7734 8503 SD 363.0 363.0 290.0 305.0 406.0 232.0 348.0 638.0 595.0 73 95%C.I. ±290 ±290 ±232 ±247 ±319 ±189 ±290 ±508 ±479
Avg* 5780 5832 6119 6795 6860 7495 7049 7174 7924 StaDev 305.0 334.0 305.0 334.0 406.0 406.0 348.0 392.0 392.0 160 95%C.I. ±247 ±276 ±247 ±261 ±334 ±334 ±276 ±319 ±305
Avg* 5542 5572 5690 6454 6856 7312 6210 6578 7275 StaDev 261.0 348.0 435.0 247.0 276.0 218.0 450.0 406.0 305.0 180 95%C.I. ±203 ±276 ±348 ±203 ±218 ±174 ±363 ±319 ±247
Avg* – Average of 6 samples, SD – Standard Deviation, C.I. – 95% Confidence Interval

91
Relating the mix design, curing temperature, duration of curing and the concrete
permeability to the amount and onset of formation of ettringite crystals in the samples
cured adiabatically, the following conclusions were drawn from Table 5.4:
1. Samples cured at room temperature, resulted in high permeability values for
each respective mix. However no ettringite crystals were observed in these
samples when examined microscopically. This observation agrees with the
fact that a threshold curing temperature of about 160oF is needed for
ettringite to reform in the hardened concrete in the presence of moisture.
2. For samples cured at the elevated temperatures, the plain cement mixes had
the highest permeability values and the largest amount of ettringite crystals
observed in void spaces when examined at 28 and 91 days. The amount of
ettringite increased with increased curing temperature and duration.
3. Addition of 18% fly ash and 50% slag reduced the permeability of the
concrete mixes. At room temperature the slag mixes had the least
permeability values at 28 days due to the early reaction of slag within this
time. The fly ash mixes did not show much reduction in permeability values
at 28 days when cured at room temperature.
4. Addition of fly ash and slag resulted in much reduced permeability values
for samples cured at the elevated temperatures. The reduced permeability
resulted in the delay of the onset of the ettringite and the amounts formed in
the blended mixes.
5. The 50% slag was better at delaying the onset on the ettringite in the
samples cured at 180oF so that at 28 days no ettringite was observed. At

92
160oF however, both the 18% fly ash and 50% slag were effective at
delaying the onset of ettringite prior to 28 days.
Research Implications for Mass Concrete Structures.
This research has very important implications for mass concrete structures. These
include:
a. The samples used in this study were smaller allowing for easier
penetration of water.
b. This fact notwithstanding, the fly ash and slag were beneficial in
delaying as well as limiting ettringite formation in the hardened concrete.
c. In mass concrete structures, the high temperatures will be at the core
of the structure and the dense structures resulting from the addition of slag and fly ash
may prevent the ingress of water to such potential spots for ettringite formation in the
hardened structure.
d. Additionally, the modification of the pore solution by adding fly ash
and slag may prevent ettringite formation in the hardened concreted and the
associated expansion and deterioration.

93
Table 5.4. RCP and Ettringite Formation for adiabatically cured samples
RAPID CHLORIDE PERMEABILITY (RCP) and ETTRINGITE FORMATION (EF)
Plain cement mix 18% Fly ash mix 50% Slag mix
28 days 91 days 28 days 91 days 28 days 91 days Temp (oF)
Value (RCP)
RCP (Coulomb) EF
#
RCP (Coulomb) EF
#
RCP (Coulomb) EF
#
RCP (Coulomb) EF
#
RCP (Coulomb)
EF #
RCP
(Coulomb) EF #
Avg* 5,562 4,494 5,173 2,279 2,692 2,002 SD 236 159.0 205 135 239 290
95%C.I. ±231 ±156 ±201 ±132 ±234 ±284 73
Rate High
No
High
No
High
No
Mod
No
Mod
No
Mod
No
Avg* 8,633 6,772 2,548 1,787 1,931 1,572 SD 1,189 348 242 176 164 182
95%C.I. ±1165 ±341 ±237 ±173 ±160 ±178 160
Rate High
Yes <50%
High
Yes <50%
Mod
No
Low
Yes <50%
Low
No
Low
Yes <50%
Avg* 9,888 7,532 2,503 1855** 2,329 1,778
SD 1,270 1,236 221 64 283 204
95%C.I. ±1245 ±1211 ±217 ±72 ±278 ±200 180
Rate High
Yes >50%
High
Yes >50%
Mod
Yes <50%
Low
Yes <50%
Mod
No
Low
Yes <50%
RCP Avg* –Average of 4 samples, SD – Standard Deviation, C.I. – 95% Confidence Interval ** – Average of 3 samples EF # - Presence of ettringite in sample and percentage of void space filled with crystals formed: < 50% - less than 50% of a void filled with ettringite > 50% - greater than 50% of a void filled with ettringite
Recommendations
The objective of this dissertation was to investigate the performance of Portland
cement concretes cured at elevated temperatures using typical FDOT Class IV concrete
mixes. This was to determine if reported high curing temperatures (170 to 200oF) in
FDOT mass concrete projects have detrimental effects on strength, durability and other
physical/chemical properties of concrete. This research was also conducted to determine
if limits placed on the differential temperatures curing should be extended to include

94
limits on the maximum core curing temperature. Based on findings of this dissertation it
is recommended that:
1. Use of fly ash or slag as a cement replacement should be required in mass
concrete since these fly ash and slag reduce the detrimental effect of high
curing temperature on strength and durability of pure cement concrete.
2. When fly ash and slag are used as a cement replacement, based on ideal
laboratory conditions and accurate batching proportions there was an 8 to
15% reduction in compressive strength due to elevated curing temperatures.
However, this loss could be inflated considerably if the concrete was
produced at a batch plant with wider mixer proportions tolerances and the
ever-present potential of unmetered water in the mix.
3. This research also showed that when the pure cement concrete specimens
were placed in preheated curing tanks as soon as they were molded and
cured under constant temperatures of 160 and 200oF, their compressive
strengths were significantly decreased (34 and 62% for 160 and 200oF,
respectively) and their permeability were increased.
4. Use of fly ash or slag as a cement replacement in the blended concretes
cured at the elevated temperatures resulted in low permeability values,
which delayed the onset and amount of ettringite formed in the
microstructure.
5. Formation of delayed ettringite in samples 28 days and older where
temperature was 160 and 180oF is a point of concern and more study is
needed to look at the microstructural analysis of samples cured at

95
temperatures more than 160oF, specifically for detection of delayed
ettringite formation.
6. More research is needed to evaluate the effects of other proportions of fly
ash and slag. Future research should also evaluate the effect of varying
sample sizes on the observations made as well as observing the samples
over a much longer study period.

96
APPENDIX A CONCRETE MIX DESIGNS
Mix 1 – Plain Cement Mix

97
Mix 2 – 18% Fly Ash Mix

98
Mix 3 – Plain Cement Mix

99
Mix 4- 18% Fly Ash Mix

100
Mix 5 – Plain Cement Mix

101
Mix 6 – 50% Slag Mix

102
Mix 7 – Plain Cement Mix

103
APPENDIX B ADDITIONAL SEM IMAGES
Part 1 - Mix 1:Plain Cement Only Mix (0%FA)
Figure B.1 Void with monosulphate (M), no ettringite found
M
0%FA - 73F –91days 170x

104
Figure B.2 Close-up view of Figure B.1
Figure B.3 Void with ettringite (E) and monosulphate (M)
M
0%FA - 73F –91days 1800x
E
0%FA - 160F –28days 1000x
M

105
Figure B.4 Void with ettringite (E) crystals
Figure B.5 Void showing monosulphate and the early formation of ettringite (E) crystals
E
0%FA - 160F –91days 700x
M
0%FA - 160F –91days 950x
E

106
Figure B.6 Void showing ball of ettringite (E) crystals
Figure B.7 Void showing balls of ettringite (E) crystals
E
0%FA - 160F –91days 1800x
E
0%FA - 180F –28days 3000x

107
Figure B.8 Voids showing ettringite (E) crystals some almost full
Figure B.9 Voids showing ettringite (E) and monosulphate crystals
E
0%FA - 180F –28days 220x
M
0%FA - 180F – 91days 500x
E
E
E

108
Figure B.10 Ettringite (E) crystals in and around vicinity of void
Figure B.11 Ettringite (E) crystals in void
E
0%FA - 180F –91days 1400x
E
0%FA - 180F – 91days 2300x

109
Part 2 - Mix 2: 18% Fly Ash Mix
Figure B.12 Fly ash particle with reaction around rim
Figure B.13 Fly ash particle with reaction around rim
18%FA - 73F – 91days 1200x
F
18%FA - 160F – 91days 650x
F

110
Figure B.14 Void containing monosulphate
Figure B.15 Void containing ettringite crystals
18%FA - 160F – 28days 800x
M
18%FA - 180F – 91days 80x
E
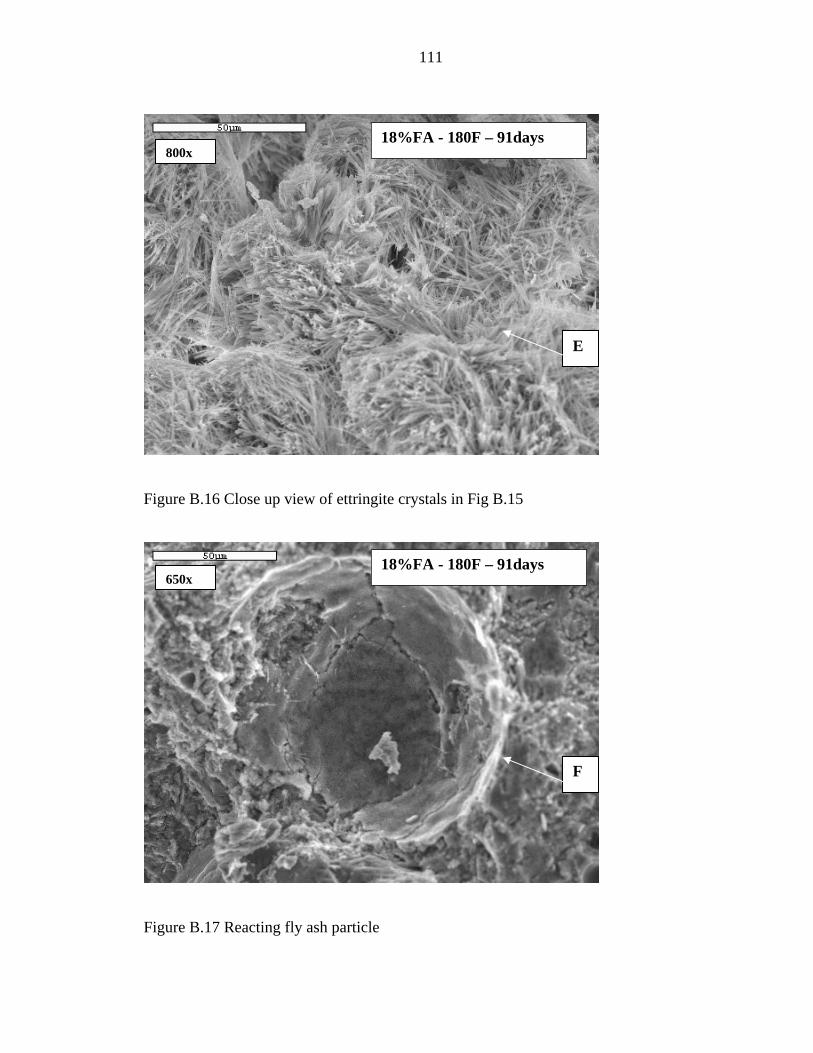
111
Figure B.16 Close up view of ettringite crystals in Fig B.15
Figure B.17 Reacting fly ash particle
18%FA - 180F – 91days 800x
E
18%FA - 180F – 91days 650x
F

112
Part 3 - Mix 3: 50% Slag Mix
Figure B.18 Slag particles showing some early reaction
Figure B.19 Slag particles showing reaction on surface
50%BFS - 73F – 28days 850x
S
50%BFS - 73F – 91days 1000x
S
S

113
Figure B.20 Slag particle showing reaction on surface
Figure B.21 Slag particle showing reaction on surface
50%BFS - 180F – 28days 800x
S
50%BFS - 160F – 28days 150x
S

114
Figure B.22 Ettringite formed around surface of reacting slag particle
Figure B.23 Close-up view of Figure. B.22
50%BFS - 180F – 91days 1000x
E
50%BFS – 180F – 91days 350x
E

115
LIST OF REFERENCES
American Concrete Institute, (ACI) Manual of Concrete practice, Part 1: Materials and General Properties of Concrete, Detroit, Michigan, 1999. ACI 232.2R-96, Use of fly ash in concrete, ACI Manual of Concrete practice, Part 1: Materials and General Properties of Concrete, 34 pp. (Detroit, Michigan, 1999). ACI 233R-95, Granulated Blast-Furnace Slag as a Cementitious Constituent in Concrete, ACI Manual of Concrete practice, Part 1: Materials and General Properties of Concrete, 18 pp. (Detroit, Michigan, 1999). Basma, A., Barakat S., and Al-Oraimi, S., “Prediction of Cement Degree of Hydration Using Artificial Neural Networks”, ACI Materials Journal Vol. 96, No.2, pp.167-172, 1999. Campbell, G. and Detwiler, R., “Development of Mix Designs for Strength and Durability of Steam-Cured Concrete”, Concrete International 37-39, 1993. Chini, A.R., and Acquaye, L., “Effect of Elevated Concrete Temperatures on the Strength and Durability of Concrete,” Materials and Structures/Materiaux et Constructions. Vol. 38, No. 281 pp. 673-679, August/September 2005. Detwiler, R., Fapohunda, C., and Natale, J., “Use of Supplementary Cementing Materials to Increase the Resistance to Chloride Ion Penetration of Concretes Cured at Elevated Temperatures”, ACI Materials Journal Vol.91, No.1, pp. 63-66, 1994. Diamond, S., “Delayed Ettringite Formation – Processes and Problems”, Cement and Concrete Composite. Vol. 18, pp. 205- 215, 1996. FitzGibbon, M.E. “Large pours –2, heat generation and control”. Concrete, Vol.10, No. 4, pp. 33-5. Dec.1976, London. Florida Department of Transportation, “Structures Design Guidelines (LRFD),” 2002. Fraay, A.L.A., Bijen J.M., and de Hann Y.M. “The reaction of fly ash in Concrete; A critical examination”. Cement and Concrete Research. Vol 19, No. 2, pp. 235-46, 1989. Goldstein, J., Newbury, D., Joy, D., Lyman, C., Echlin, P., Lifshin, E., Sawyer L., and Michael, J. Scanning Electron Microscopy and X-ray Microanalysis. A text for Biologists, Material scientists and Geologists. Plenum Press, New York 1992

116
Goto, S., and Roy, D.M. “The effect of w/c ratio and curing temperature on the permeability of hardened cement paste”. Cement and Concrete Research. Vol. 11, No. 7, pp. 575-9, 1981. Heinz, D., Kalde, M., Ludwig, U., and Ruediger, I., “Present State of Investigation on Damaging Late Ettringite Formation (DLEF) in Mortars and Concretes ,” ACI SP-177, Bernard Erlin (Editor), American Concrete Institute, Farmington Hills, MI, 1999, pp. 1-14. Heinz, D., and Ludwig, U., “Mechanism of Secondary Ettringite Formation in Mortars and Concrete Subjected to Heat Treatment,” ACI SP-100, John M. Scanlon (Editor), American Concrete Institute, Framington Hills, MI, 1987, pp. 2059-2071. Hime W.G., and Marusin S. L., “Delayed Ettringite Formation: Many Questions and Some Answers,” ACI SP-177, Bernard Erlin (Editor), American Concrete Institute, Farmington Hills, MI, 1999, pp. 199-206. Hime, W.G., Marusin, S.L., Jugovic, Z.T., Martinek, R.A., Cechner, R.A., and Backus, L.A. “Chemical and Petrographic Analyses and ASTM Test Procedures for the Study of Delayed Ettringite Formation.” Cement, Concrete, and Aggregates. CCAGDP. Vol. 22 No. 2. pp. 160-168 December 2000. Hobbs D.W., “Expansion and Cracking in Concrete Associated with Delayed Ettringite Formation,” ACI SP-177, Bernard Erlin (Editor), American Concrete Institute, Farmington Hills, MI, 1999, pp. 159-177. Johansen V., and Thaulow N., “Heat Curing and Late Formation of Ettringite ,” ACI SP-177, Bernard Erlin (Editor), American Concrete Institute, Farmington Hills, MI, 1999, pp. 199-206. Kjellsen K.O., Detwiler R.J., and Gjorv O.E. “Pore Structure of Plain cement pastes hydrated at different Temperatures”. Cement and Concrete Research. Vol. 20, pp. 927-933, 1990a. Kjellsen K.O., Detwiler R.J., and Gjorv O.E. “Development of Microstructure in plain hydrated at different Temperatures”. Cement and Concrete Research. Vol. 21, pp. 179-189, 1990b. Kosmatka, S., and Panarese, W. “Design and Control of Concrete Mixtures,” thirteen edition, Portland cement Association, Skokie, Illinois, 1994. Lachemi, M. and Aitcin, P., “Influence of Ambient and Fresh Concrete Temperatures on the Maximum Temperature and Thermal Gradient in a High Performance Concrete Structure”, ACI Materials Journal (94)(2)(1997) 102-110.

117
Lam L., Wong, Y.L., and Poon, C.S. “Degree of hydration and gel/space ratio of high-volume fly ash systems”, Cement and Concrete Research. Vol. 30, 474 - 756, 2000. Lawrence C.D., “Mortar Expansions due to Delayed Ettringite Formation. Effects of Curing Period and Temperature”. Cement and Concrete Research. Vol. 25, pp. 903-914, 1995. Maltais, Y., and Marchand, J., “Influence of Curing Temperature on Cement Hydration and Mechanical Strength Development of Fly ash mortars”, Cement and Concrete Research. Vol. 27, No. 7, pp. 1009-1020, 1997. Mehta, P.K., and Monteiro, P.J.M., “Concrete: Microstructure, Properties, and Materials”. The McGraw-Hill Companies, Inc., 1993. Neville, A. M. ‘Properties of Concrete’.4th Edition, John Wiley & Sons Inc., 1997 Neville, A. M. “Properties of Concrete”. 4th Edition, John Wiley & Sons Inc., 2004. Miller M.F., and Conway, T.,” Use of Ground Granulated Blast Furnace Slag for Reduction of Expansion Due to Delayed Ettringite Formation,” Cement, Concrete, and Aggregates, CCAGDP, Vol, 25, No. 2, December 2003, pp. 59-68 Sarkar, L.S., Aimin, X., and Jana, D. “Scanning Electron Microscopy, X-Ray Microanalysis of Concrete,” in Handbook of Analytical Techniques in Concrete Science and Technology. Ramachandran, V.S., and Beaudoin, J.J. (Editors), Noyes Publication, US, 2001, pp. 231-273. Scrivener, K.L., and Lewis, M.C., “Effect of Heat Curing on Expansion of Mortars and Composition of Calcium Silicate Hydrate Gel ,” ACI SP-177, Bernard Erlin (Editor), American Concrete Institute, Farmington Hills, MI, 1999, pp. 199-206. Stark, J and Bollmann, K. “Delayed Ettringite Formation in Concrete”. Bauhaus-University Weimar / Germany Stark, J and Seyfarth, K., “Ettringite Formation in Hardened Concrete and Resulting Destruction ,” ACI SP-177, Bernard Erlin (Editor), American Concrete Institute, Farmington Hills, MI, 1999, pp. 125-140. Tarkhan, S.B. Degree of Hydration for Cement Paste with Fly ash at Elevated Temperatures. Master’s Thesis, University of Florida, 2000. Taylor, H.F.W., Famy, C., and Scrivener, K.L., “Delayed Ettringite Formation”. Cement and Concrete Research. Vol. 31, pp. 683-693, 2001. Verbeck, G.J., and Helmuth R.A. Structures and physical properties of cement paste”. Proc. 5th Int. Symp. On the Chemistry of Cement, Tokyo, Vol. 3, pp. 1-32, 1968.

118
Zhang, Y.M., Sun W., and Yan, D. H., ‘Hydration of high-volume fly ash cement pastes’ Cement and Concrete Composites. Vol. 22, pp. 445 – 452, 2000.

119
BIOGRAPHICAL SKETCH
Lucy Acquaye has a Bachelor of Science degree in Building Technology from
Kwame Nkrumah University of Science and Technology. She taught courses in
construction materials and methods the university after her bachelor’s degree. In 1998,
she was awarded a J.J. Fulbright Scholarship to attend the University of Florida, USA,
where she graduated with a Master of Science in Building Construction in August 2000.
Since August 2003, she has been a graduate instructor at the Rinker School of Building
Construction where she has taught courses in Construction Drawing and Construction
Mechanics. Lucy will graduate with a PhD in Building Construction in May 2006.