effect of heat treatment on α-tocopherol content and...
TRANSCRIPT
Effect of Heat Treatment on α-Tocopherol Content and Antioxidant
Activity of Vegetable Oils
By
Hasan Al-attar
Department of Food Science and Agriculture Chemistry
Macdonald Campus, McGill University,
Montreal, Quebec
A thesis submitted to McGill University in partial fulfillment of the
requirements of the degree of Master of Science
June, 2013
©Hasan Al-attar, 2013

ii
Suggested short Title:
α-Tocopherol content and antioxidant activity of oils
iii
ABSTRACT
The objective of this research was to investigate the effect of heating on α-
Tocopherol content and antioxidant activity of different vegetable oils (EVOO, canola
and palm oil). The highest α-Tocopherol content was found in EVOO followed by canola
oil and palm oil (323 ±5, 271 ±2 and 174 ±2 µg/ml) respectively. The effect of heat was
done at 70, 100 and 130 oC, for time intervals of 0.5, 1, 1.5 and 2 h. Thermal degradation
of α-Tocopherol in the oils was minimal at 70 oC and increased at 100
oC and 130
oC.
Heating at 130 oC for 2 h resulted in 100, 24 and 44 % degradation of α-Tocopherol in
EVOO, canola oil and palm oil respectively; EVOO was completely degraded after 1.5 h
heating at 130 oC. Use of 2 cooking methods, pan-frying (250
oC, 5 min) and oven
cooking (130 oC, 30 min) resulted in the degradation of α-Tocopherol in the oils. In the
pan-frying method, both EVOO and palm oil were completely degraded and canola oil
showed 42 % degradation. .With the oven cooking method the degradation for EVOO,
canola oil and palm oil were 18, 13 and 10 %, respectively. The antioxidant activity was
highest with canola oil followed by palm oil and EVOO (59 ±1.72, 51 ±0.84 and 46 ±0.91
%), respectively. At 70 oC there was no significant decrease in the antioxidant activity of
the heated oils. At 100 oC, EVOO showed highest reduction in antioxidant activity
followed by canola oil and palm oil. At 130 oC, the antioxidant activity decreased
gradually in the oil samples. The highest decrease was observed with EVOO followed by
canola oil and palm oil. The decrease of antioxidant activity in oil samples was also
observed with both pan-frying and oven cooking methods, with greater reduction in
antioxidant activity using the pan-frying method.

iv
RESUME
L’objectif de cette recherche a été d’étudier l’effet de la chaleur sur la quantité
d’α-tocophérol et sur l’activité antioxydant de différentes huiles végétales (l’huile d’olive
extra vierge, l’huile de canola, et l’huile de palme). La quantité la plus élevée d’α-
Tocophérol a été trouvée dans l’huile d’olive extra vierge, suivie par l’huile de canola et
l’huile de palme (323 ±5, 271 ±2 and 174 ±2 µg/ml) respectivement. L’effet de la chaleur
a été étudié à 70, à 100 et à 130 o
C durant 0.5, 1, 1.5 et 2 h. La dégradation thermale d’α-
Tocophérol dans les huiles a été minimale à 70 °C et a augmenté à 100 et 130 °C.
Chauffer à 130 o
C durant 2 h a mené à la dégradations de 100, 24 et 44 % d’α-Tocophérol
dans l’huile d’olive extra vierge, dans l’huile de canola, et dans l’huile de palme,
respectivement; l’huile d’olive extra vierge a été complètement dégradée après 1.5 h de
chauffage à 130 o
C. L’utilisation de deux différents façons de cuire, l’utilisation de la
poêle (250 o
C, 5 min) et l’utilisation du four (130 oC, 30 min), a mené à la dégradation
d’α-Tocophérol dans les huiles. En utilisant la poêle, l’huile d’olive extra vierge et l’huile
de palme ont été complètement dégradées et l’huile de canola a démontré une dégradation
de 42 %. En utilisant le four, la dégradation de l’huile d’olive extra vierge, de l’huile de
canola, et de l’huile de palme a été de 18, 13 et 10 % respectivement. L’activité
antioxydant des échantillons a été le plus élevé avec l’huile de canola, suivi par l’huile de
palme et par l’huile d’olive extra vierge (59 ±1.72, 51 ±0.84 et 46 ±0.91 %),
respectivement. À 70 o
C, il n’y avait pas de réduction significative dans l’activité
antioxydant des huiles chauffées. À 100 o
C, l’huile d’olive extra vierge a démontré une
réduction maximale en activité antioxydant suivi par l’huile de canola et par l’huile de
palme. À 130 o
C, l’activité antioxydant des huiles a baissé graduellement. La réduction la
plus élevée a été observée avec de l’huile d’olive extra vierge, suivie par l’huile de canola
et par l’huile de palme. La réduction en activité antioxydant dans les échantillons d’huile
a été aussi observée avec les deux façons de cuire, d’où une réduction plus importante en
activité antioxydant a été observée en utilisant la poêle.

v
ACKNOWLEDGMENT
This thesis would not have been possible to complete without the support of my
supervisor Dr. Inteaz Alli. I would like to thank him for his excellent guidance, patience
at all times, encouragement as well as for his academic advice, and friendship. Also, I
would like to thank his family for their support too.
I take this opportunity to thank Dr. Selim Kermasha for providing me with the
necessary resources to accomplish my work and finish my experiments, Sarya Aziz for
her help and support in mastering HPLC use, Dr. Salwa Karboune for allowing accessing
her laboratory facilities during my research, and also her students Amanda Waglay and
Sooyoun Seo for their positive collaboration, Dr. Varoujan Yaylayan and Dr. Hosahalli
S. Ramaswamy for permitting me to use their equipments. Finally I like to thank Dr.
Jasim Ahmed for his help.
Sincere thanks to my laboratory colleagues, Mohammed Hassan, Amal
Mohammed and Abdulaziz Gassas for their support, help and friendship.
I would also like to thank Kuwait institute for Scientific Research for allowing me
pursue my Master’s degree by granting me a scholarship Lastly I like to thank my family
for their support and encouragement.

vi
TABLE OF CONTENT
ABSTRACT…................................................................................................iii
RESUME……… ............................................................................................ iv
ACKNOWLEDGMENT ................................................................................. v
TABLE OF CONTENT .................................................................................. vi
LIST OF TABLES ........................................................................................... x
LIST OF FIGURES ....................................................................................... xii
CHAPTER 1….. .............................................................................................. 1
1. INTRODUCTION .................................................................................... 1
1.1 General Introduction ............................................................................ 1
1.2 Research Objectives ............................................................................ 1
CHAPTER 2….. .............................................................................................. 2
2. LITERATURE REVIEW ......................................................................... 2
2.1 Vitamin E components ........................................................................ 2
2.2 Vitamin E sources ............................................................................... 3
2.3 Vitamin E and human health ............................................................... 5
2.3.1 Vitamin E and enzyme inhibition and activation .......................... 5
2.3.2 Other functions of vitamin E ......................................................... 6
2.4 Vitamin E and free radical ................................................................... 6
2.4.1 Free radical chain reaction ............................................................ 8
2.5 Vitamin E antioxidant function ........................................................... 8
2.6 Vitamin E effect on diseases ............................................................... 9

vii
2.6.1 Vitamin E and Cardiovascular disease .......................................... 9
2.6.2 Vitamin E and hypertension ........................................................ 11
2.6.3 Vitamin E and diabetes ............................................................... 12
2.7 Antioxidant content in food ............................................................... 12
2.8 Antioxidants and free radicals ........................................................... 13
2.8.1 Antioxidant and Cardiovascular disease ..................................... 15
2.8.2 Antioxidant and hypertension ..................................................... 15
2.8.3 Antioxidant and cancer ............................................................... 15
2.9 Vegetable oils - Olive oil................................................................... 16
2.9.1 Types of olive oil......................................................................... 16
2.9.2 Olive oil vitamin E and phenolic content .................................... 16
2.10 Olive oil and heart disease risk factors............................................ 17
2.11 Vitamins with antioxidant properties status among the Kuwaiti
population ................................................................................................ 17
2.11.1 Vitamin E status ..................................................................... 17
2.11.2 Vitamin E sources .................................................................. 19
CHAPTER 3….. ............................................................................................ 21
MATERIALS AND METHODS ............................................................... 21
3.1 Materials ............................................................................................ 21
3.2 Preparation of standard solutions and sample solutions ................... 21
3.3 Preparation of standard curve ............................................................ 23
3.4 Effect of heating on standard and oils ............................................... 23
3.5 Cooking of the food samples in oils .................................................. 23
3.6 High Performance Liquid Chromatography (HPLC) analysis .......... 23

viii
3.7 DPPH assay ....................................................................................... 24
3.8 Thermal degradation kinetics ............................................................ 26
3.9 Statistical analysis ............................................................................. 26
CHAPTER 4….. ............................................................................................ 27
RESULTS AND DISCUSSION................................................................. 27
4.1 Standard α-Tocopherol concentration curve ..................................... 27
4.2 Thermal degradation of standard α-Tocopherol and α-Tocopherol in
vegetable oils ........................................................................................... 29
i) Thermal degradation of standard α-Tocopherol .............................. 29
ii) Thermal degradation of α-Tocopherol in extra virgin olive oil
(EVOO) ................................................................................................. 33
iii) Thermal degradation of α-Tocopherol in Canola oil ..................... 37
iv) Thermal degradation of α-Tocopherol in Palm oil ........................ 41
4.3 Comparison of α-Tocopherol degradation in vegetable oils at the
same thermal treatments .......................................................................... 45
4.4 Thermal degradation of α-Tocopherol in vegetable oils during
cooking .................................................................................................... 48
4.5 Antioxidant activity: Standard curve for α-Tocopherol antioxidant
activity ..................................................................................................... 53
4.6 Antioxidant activity of standard α-Tocopherol and heated oils ........ 55
i) Antioxidant activity of standard α-Tocopherol ................................. 55
ii) Antioxidant activity in extra virgin olive oil (EVOO) ..................... 57
iii) Antioxidant activity in canola oil ................................................... 59
iv) Antioxidant activity in palm oil ....................................................... 61
4.7 Comparison of antioxidant activity of heated vegetable oils at the
same thermal treatments .......................................................................... 63

ix
4.8 Effect of cooking on antioxidant activity of oils ............................... 66
GENERAL CONCLUSION ......................................................................... 69
Appendix A…… ............................................................................................ 70
REFERENCES…. ......................................................................................... 72
x
LIST OF TABLES
Table 2.1 Selected food items and α-Tocopherol content ..................... 4
Table 2.2 Free radical species and formation ........................................ 7
Table 2.3 Mechanisms by which vitamin E inhibits atherosclerosis .. 11
Table 2.4 Antioxidants in low density lipoprotein (LDL) .................. 13
Table 2.5 Daily intake of vitamin E by gender and age ..................... 18
Table 2.6 Percentage of participants not meeting the estimated
average requirement (EAR) of vitamin E (mg) by gender
and age ................................................................................ 18
Table 2.7 Percentage contribution of foods to average daily vitamin E
intake by sex and age group ............................................... 20
Table 4.1 Effect of heating time and temperature on standard α-
Tocopherol concentration .................................................... 32
Table 4.2 Effect of heating time and temperature on α-Tocopherol
concentration in extra virgin olive oil ................................. 36
Table 4.3 Effect of heating time and temperature on α-Tocopherol
concentration in canola oil .................................................. 40
Table 4.4 Effect of heating time and temperature on α-Tocopherol in
palm oil ................................................................................ 44
Table 4.5 Effect of heating time and temperature on degradation of α-
Tocopherol in Standard α-Tocopherol and vegetable oils
(µg/ml) ................................................................................. 46
Table 4.6 Effect of cooking method on degradation of α-Tocopherolin
vegetable oils ....................................................................... 51

xi
Table 4.7 Antioxidant activity of standard α-Tocopherol at different
concentration ....................................................................... 53
Table 4.8 Effect of heating time and temperature on antioxidant
activity of standard α-Tocopherol (%) ................................ 56
Table 4.9 Effect of heating time and temperature on antioxidant
activity of extra virgin olive oil (%) .................................... 58
Table 4.10 Effect of heating time and temperature on antioxidant
activity of canola oil (%) ..................................................... 60
Table 4.11 Effect of heating time and temperature on antioxidant
activity of palm oil (%) ....................................................... 62
Table 4.12 Effect of heating time and temperature on antioxidant
activity of standard α-Tocopherol and vegetable oils (%) .. 64
Table 4.13 Effect of cooking method on antioxidant activity of
vegetable oils (%) ................................................................ 67

xii
LIST OF FIGURES
Figure 2.1 Forms of vitamin E ................................................................ 2
Figure 2.2 Various oils and Tocophenol content .................................. 3
Figure 2.3 2R and 2S stereoisomers of α-Tocopherol ............................ 5
Figure 2.4 Vitamin E regeneration cycle ................................................ 9
Figure 2.5 Formation of foam cell ........................................................ 10
Figure 2.6 Potential sources of reactive oxygen species (ROS) .......... 11
Figure 3.1 Diagram of procedure used for measuring α-Tocopherol in
oil samples ........................................................................... 22
Figure 3.2 Diagram of procedure utilized to measure the antioxidant
activity of α-Tocopherol and vegetable oils ........................ 25
Figure 4.1 HPLC chromatogram of standard α-Tocopherol (A) 20
µg/ml , (B) 30 µg/ml and (C) 40 µg/ml ............................ 28
Figure 4.2 α-Tocopherol standard concentration curve ....................... 28
Figure 4.3 HPLC chromatogram for (A) standard α-Tocopherol (B) α-
Tocopherol in EVOO (C) α-Tocopherol in palm oil and (D)
α-Tocopherol in canola oil .................................................. 30
Figure 4.4 Degradation of standard α-Tocopherol at (I) 70 oC, (II) 100
oC and (III) 130
oC (A) 0 time (B) 0.5 h (C) 1 h (D) 1.5 h
and (E) 2 h ........................................................................... 31
Figure 4.5 Degradation kinetics of standard α-Tocopherol (A) 70 o
C,
(B) 100 oC and (C) 130
oC ................................................. 32

xiii
Figure 4.6 Degradation of α-Tocopherol in EVOO at (I) 70 oC, (II) 100
oC and (III) 130
oC (A) 0 time (B) 0.5 h (C) 1 h (D) 1.5 h
and (E) 2 h ........................................................................... 35
Figure 4.7 Degradation kinetics of α-Tocopherol in extra virgin olive
oil (A) 70 oC (B) 100
oC and (C) 130
oC ............................. 36
Figure 4.8 Degradation of α-Tocopherol in canola oil at (I) 70 oC, (II)
100 oC and (III) 130
oC (A) 0 time (B) 0.5 h (C) 1 h (D) 1.5
h and (E) 2 h ........................................................................ 39
Figure 4.9 Degradation kinetics of α-Tocopherol in canola oil (A) 70 oC (B) 100
oC and (C) 130
oC ............................................. 40
Figure 4.10 Degradation of α-Tocopherol in palm oil at (I) 70 oC, (II)
100 oC and (III) 130
oC (A) 0 time (B) 0.5 h (C) 1 h (D) 1.5
h and (E) 2 h ........................................................................ 43
Figure 4.11 Degradation kinetics of α-Tocopherol in palm oil (A) 70 oC
(B) 100 oC and (C) 130
oC .................................................. 44
Figure 4.12 Degradation kinetics of α-Tocopherol in ( ) standard α-
Tocopherol, ( ) EVOO, ( ) canola oil and ( ) palm
oil at (A) 70 oC (B) 100
oC and (C) 130
oC ........................ 47
Figure 4.13 Degradation of α-Tocopherol in (I) EVOO, (II) canola oil
and (III) palm oil during cooking, (A) 0 time (B) oven
cooking and (C) pan-frying ................................................. 50
Figure 4.14 Effect of cooking method on degradation of α-Tocopherol in
extra virgin olive oil, canola oil and palm oil ..................... 51
Figure 4.15 Degradation % of α-Tocopherol in ( ) extra virgin olive
oil, ( ) canola oil and ( ) palm oil in relation to
cooking method ................................................................... 52
Figure 4.14 Standard α-Tocopherol calibration curve ........................... 53

xiv
Figure 4.15 Antioxidant activity of standard α-Tocopherol in 3 different
concentrations ...................................................................... 54
Figure 4.16 Effect of heating on standard α-Tocopherol antioxidant
activity at (A) 70 oC, (B) 100
oC and (C) 130
oC ................ 56
Figure 4.17 Effect of heating on antioxidant activity of extra virgin olive
oil at (A) 70 oC, (B) 100
oC and (C) 130
oC ........................ 58
Figure 4.18 Effect of heating on antioxidant activity of canola oil at (A)
70 oC, (B) 100
oC and (C) 130
oC ....................................... 60
Figure 4.19 Effect of heating on antioxidant activity of palm oil at (A)
70 oC, (B) 100
oC and (C) 130
oC ....................................... 62
Figure 4.20 Effect of heating on antioxidant activity of ( ) standard
α-Tocopherol, ( ) EVOO, ( ) canola oil and ( ) palm
oil at (A) 70 oC, (B) 100
oC and (C) 130
oC ........................ 65
Figure 4.21 Effect of cooking method on antioxidant activity on
vegetable oils ....................................................................... 67
Figure 4.22 Antioxidant activity loss during cooking ( ) extra virgin
olive oil, ( ) canola oil and ( ) palm oil ...................... 68

1
CHAPTER 1
1. INTRODUCTION
1.1 General Introduction
The minimal requirements of nutritional “macro and micro nutrients” ensures a
healthy human being and failure to meet the minimal intake can lead to malnutrition (Al-
hooti et al., 2009). In a recent study (Al-hooti et al., 2009) on Kuwait population it was
found that there was an inadequate consumption of vitamin E in all age groups and the
beneficial effect of vitamin E could enhance the health status of the Kuwaiti population.
Micronutrients such as vitamins, play a crucial role in the growth and
development of the human body; some micronutrients also have a health and disease
protective role in the human body by acting as antioxidants against free radicals.
Antioxidants are known to help the body to fight diseases such as cardiovascular,
diabetes, atherosclerosis and cancer (Meydani et al., 2005; Salonen et al., 1995; Knekt et
al., 1994). In this study the vitamin E α-Tocopherol was studied for its thermal stability
and antioxidant activity in edible oils as extra virgin olive oil, canola and palm oil.
1.2 Research Objectives
The overall objective of this research is to study the effect of heat treatment on α-
Tocopherol content and antioxidant activity in edible oils; the two specific objectives are
to investigate:
i. The effects of different thermal treatments on α-Tocopherol content in extra virgin
olive oil, canola oil and palm oil.
ii. The antioxidant activity of α-Tocopherol and the 3 edible oils and the effect of
thermal treatment on antioxidant activity.

2
CHAPTER 2
2. LITERATURE REVIEW
2.1 Vitamin E components
Vitamin E includes 8 different components or vitamins. Each compound has a
side chain referred to as phytyl tail, and a chromane ring which contains a phenolic
functional group. The 8 compounds are separated into 2 groups, Tocopherols and
Tocotrienols. Tocopherols have a saturated side chain with 16 carbons and Tocotrienol
have an unsaturated side chain with 16 carbons also. According to the position and
number of methyl group (CH3) attached to the aromatic ring, the 2 groups are classified as
α, β, γ and δ (Colombo, 2010). Figure 2.1 illustrates the different Tocopherols and
Tocotrienol classification.
Figure 2.1 Forms of vitamin E (Bender, 2009)

3
2.2 Vitamin E sources
Vitamin E can be found in various types of foods, in both animal and plant sources.
The animal sources of vitamin E are the fatty tissues of animal. The amount that is found
in animal sources is much less than in plant sources. Plant sources and especially
vegetable oils are considered the richest source of vitamin E. Olive oil, canola, sunflower,
and cottonseed are high in α-Tocopherol. On the other hand, corn oil and soybean have
higher amounts of γ-Tocopherol in comparison to the amount of α-Tocopherol. Figure 2.2
shows the different Tocopherol content in various oils. Other plant sources of α-
Tocopherol are whole-grain, cereals, legumes and some fruits such as kiwi and mango
and vegetables such as spinach and broccoli (Table 2.1; USDA, 2000). Gropper et al.
(2005) showed that the green leaves provide mostly α-Tocopherol and some γ-Tocopherol
which are in the nonchloroplast region of the plant and are the main source of γ, β, and δ
Tocopherols. Wheat, barley, rice and oats are some examples of Tocotreinols containing
cereals. Other sources of vitamin E are foods made from vegetable oils such as salad
dressing, mayonnaise, and also margarine also foods made from nuts such as peanut
butter (Gropper et al., 2005).
Figure 2.2 Various oils and Tocophenol content (USDA, 2000)

4
Table 2.1 Selected food items and α-Tocopherol content (USDA, 2000)
Food mg/100 g
Oil
Wheat – germ 149.4
Sunflower 41.08
Cottonseed 35.3
Safflower 34.1
Canola 14.84
Olive oil 14.35
Corn 14.3
Soybean 8.1
Nuts
Almond 26.22
Peanut 8.33
Spinach, raw 2.03
Egg 1.05
Other sources of vitamin E are supplements or by food fortification. These are
synthetic sources of vitamin E which are either all-racemic-α-Tocopherol acetate or all-
racemic-α-Tocopherol succinate; they are a mixture of equal proportion of all 8 possible
stereoisomers and referred as all-rac-α-Tocopherol and are not active as the natural
Tocopherol. Four of these sterioisomers are in the 2R-sterioisomeric form (RRR, RSR,
RRS, and RSS) and the other four are in the 2S-sterioisomric form (SRR, SSR, SRS, and
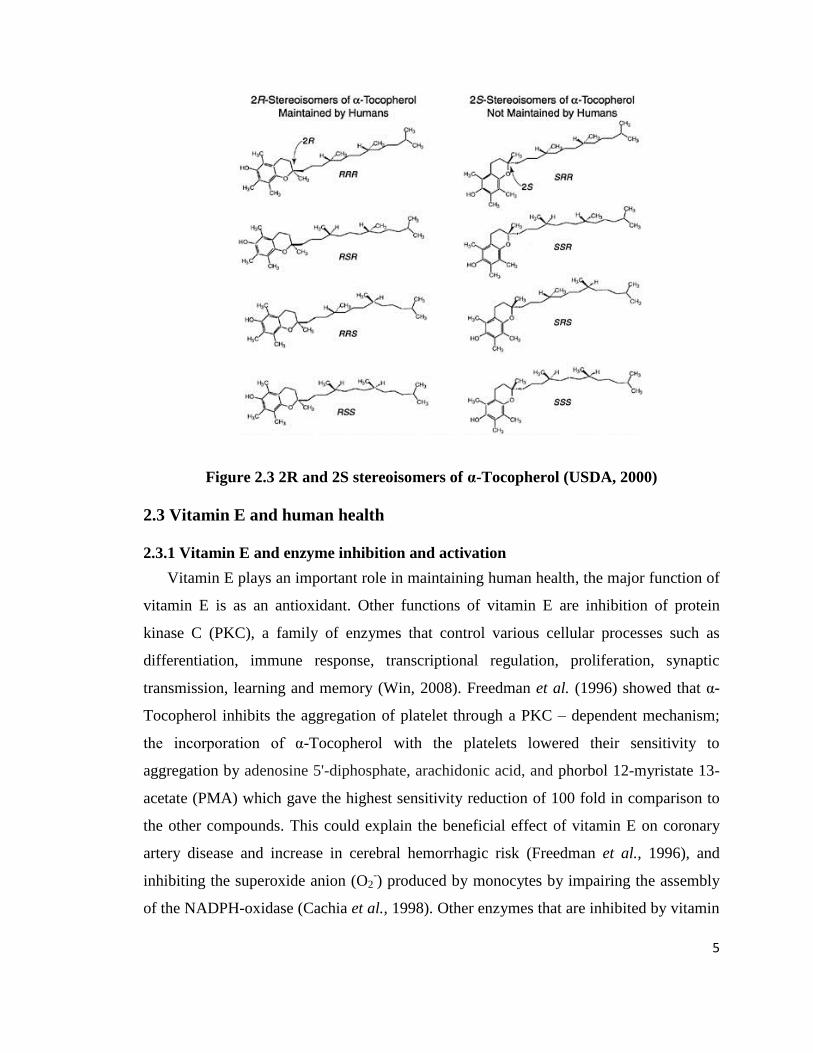
SSS) (Figure 2.3; USDA, 2000).
5
Figure 2.3 2R and 2S stereoisomers of α-Tocopherol (USDA, 2000)
2.3 Vitamin E and human health
2.3.1 Vitamin E and enzyme inhibition and activation
Vitamin E plays an important role in maintaining human health, the major function of
vitamin E is as an antioxidant. Other functions of vitamin E are inhibition of protein
kinase C (PKC), a family of enzymes that control various cellular processes such as
differentiation, immune response, transcriptional regulation, proliferation, synaptic
transmission, learning and memory (Win, 2008). Freedman et al. (1996) showed that α-
Tocopherol inhibits the aggregation of platelet through a PKC – dependent mechanism;
the incorporation of α-Tocopherol with the platelets lowered their sensitivity to
aggregation by adenosine 5'-diphosphate, arachidonic acid, and phorbol 12-myristate 13-
acetate (PMA) which gave the highest sensitivity reduction of 100 fold in comparison to
the other compounds. This could explain the beneficial effect of vitamin E on coronary
artery disease and increase in cerebral hemorrhagic risk (Freedman et al., 1996), and
inhibiting the superoxide anion (O2-) produced by monocytes by impairing the assembly
of the NADPH-oxidase (Cachia et al., 1998). Other enzymes that are inhibited by vitamin

6
E are phospholipase A2, protein kinase B (PKB/Akt), 5-lipoxygenase (5-LO) and
cyclooxygenase-2 (COX-2) (Kempna et al., 2004; Jiang et al., 2000; Douglas et al.,
1986). Protein phosphatase 2A (PP2A), diacylglycerol kinase (DAG) and HMG-CoA
reductase are enzymes activated by vitamin E (Khor and Ng, 2000; Ricciarelli et al.,
1998; Tran et al., 1994).
2.3.2 Other functions of vitamin E
Immune response can be enhanced by increasing vitamin E intake. Immune cells
membrane could be damaged by free radicals causing an impaired ability to respond to
pathogenic challenges. Studies showed that increasing the level of vitamin E consumption
improved T cell-mediated function in the aged (5, 7 – 9) (Meydani et al., 2005) and also a
significant increase in delayed-type hypersensitivity skin response (DTH) was evident in
healthy elderly (> 60 years) when given a dose of 800 mg vitamin E per day (Meydani et
al., 1997).
Vitamin E has been associated with enhanced cognition and short term memory along
with other vitamins such as folate, vitamin B6, B12 and minerals such as iron. A study
done on 2889 patients aging 65 to 102 years, after their eating pattern through modified
food frequency questionnaire, showed an association of low cognitive decline with age
and vitamin E intake. Another function of vitamin E is the protection of vitamin A from
oxidation (Whitney and Sharon, 2009a; Morris et al., 2002).
2.4 Vitamin E and free radical
Free radicals are highly reactive and unstable ions. They are atoms or molecules with
unpaired electrons and play an important role in various biological processes such as
metabolic pathways, cell signaling, immune response and a different number of
pathophysiological conditions (Vikram et al., 2010). Free radicals are classified as
oxygen or nitrogen species. The formation of free radical can be generated from
mitochondria, iron overload or lipids, protein, sugar, DNA during oxidation damage,
photosensitization, and atmospheric pollution. Other sources are redox cycling of
xenobiotics, exposure to physiochemical agents like ionizing radiations such as X – ray

7
and γ – ray, drugs that act as photosensitizer or endogenous compound (Devasagayam et
al., 2004). Table 2.2 illustrates the various types of free radicals and formation.
Table 2.2 Free radical species and formation (Devasagayam et al., 2004)
Reactive
Species
Symbol Half-life (in sec) Reactivity / Remarks
Reactive Oxygen Species
(ROS)
Superoxide O2•- 10
-6 s
generated in mitochondria,
in cardiovascular system and others
Hydroxyl
Radical •OH 10
-9 s
very highly reactive, generated during
iron overload and such conditions in
our body
Hydrogen
Peroxide H2O2 stable
formed in our body by large number
of reaction and yields potent species
like •OH
Peroxyl
Radical ROO
• s
reactive and formed from lipids,
proteins, DNA,
sugar etc. during oxidative damage
Organic
Hydroperoxide ROOH stable
react with transient metal ions to yield
reactive species
Singlet
Oxygen ׀O2 10
-6 s
highly reactive, formed during
photosensitization and chemical
reactions
Ozone O3 s
present as an atmospheric pollutant,
can react with various molecules,
yielding ɪO2
Reactive Nitrogen
Species (RNS)
Nitric Oxide NO• s
neurotransmitter and blood pressure
regulator, can yield potent oxidants
during pathological states
Peroxynitrite ONOO- 10
-3 s
formed from NO• and superoxide,
highly reactive
Peroxynitrous
acid ONOOH fairly stable
protonated from ONOO-
Nitrogen
Dioxide NO2 s
formed during atmospheric pollution
Free radical leads to cell damage if left uncontrolled; they attack proteins, nucleic
acids in DNA, polyunsaturated fatty acids (PUFAs) found in cell membrane or

8
intracellular organelles such as the nucleus, mitochondria or endoplasmic reticulum
(Gropper et al., 2005). The damage to these molecules leads to mutation resulting in
cancer; disrupt the protein structure leading to premature degradation of the protein
through amino acid cross-linking and degradation of lipids (Gropper et al., 2005).
2.4.1 Free radical chain reaction
The generation of free radicals through numerous processes such as the exposure
to ultraviolet light, trace metals or enzymatic reaction in the body leads to a series of
sequential reaction which eventually cause damage to the cell. For example the •OH
(hydroxyl radical) often take electron from a nearby organic molecule such as
polyunsaturated fatty acid (PUFA) located in the cell phospholipid protein membrane.
This reaction leads to the formation of lipid-carbon-center radical (L•) and H2O or
reaction with O2 to generate lipid-carbon-center radical (L•) and hydroperoxyl radical
HO2•; this allows for additional radicals to be formed. The spread of L
• leads to the
formation of peroxyl radical (LO2•) by reacting
with O2 and this can abstract a hydrogen
atom from another organic compound (other PUFA) in the membrane or in lipoprotein
(LH) to generate lipid peroxides (Gropper et al., 2005). The chain reaction is presented as
follows;
1. LH + •OH L
• + H2O OR LH + O2 L
• + HO2
•
2. L• + O2 LO2
•
3. LO2• + LH L
• + LOOH
2.5 Vitamin E antioxidant function
Free radicals go through 3 phases; initiation, propagation and termination. The last
phase involves vitamin E (EH). Before the interaction of peroxyl radicals (LO2•) or lipid-
carbon-centered radical (L•) with fatty acids, vitamin E terminates the chain propagation.
This interaction yields a reduced peroxyl radical (LOOH) and a oxidized state of vitamin
E (E•) as shown below;
OR 1. LO2
• + EH LOOH + E
•
2. L•
+ EH LH + E•
The combined ability of the chromanol ring to stabilize an unpaired electron and
the reactivity of the phenolic hydrogen located on its 6 hydroxyl group, allows vitamin E

9
to provide the hydrogen needed for the reduction process thus leaving an oxidized
vitamin E and in order to regain its ability to terminate free radical, it must be
regenerated. The agents that are involved in this regeneration are vitamin C (ascorbic
acid), reduced glutathione (GSH), NADPH, ubiquinol, and dihydrolipoic acid (Figure 2.4;
Gropper et al., 2005).
Figure 2.4 Vitamin E regeneration cycle (Gropper et al., 2005)
2.6 Vitamin E effect on diseases
2.6.1 Vitamin E and Cardiovascular disease
A study done in Finland showed a positive effect of vitamins E and C on coronary
heart disease; 5,133 healthy men and women aged 30 – 69 years showed an inverse
association in both men and women between vitamin E intake and coronary heart disease
(Knekt et al., 1994). Other studies focus only on beneficial effect of vitamin E
supplementation; for instance, a study done on approximately 90,000 nurses showed a
decreased risk of coronary heart disease in women who took vitamin E supplements
(Stampfer et al., 1993). Another study with men showed similar results (Rimm et al.,
1993). A study done to examine the effect of α-Tocopherol doses on myocardial
infarction (MI) “heart attack” showed a reduction in the rate of non-fatal MI (Stephens et
al., 1996). One of the major causes of cardiovascular disease is atherosclerosis, an
inflammatory disease that is targeted by low density lipoprotein (LDL) cholesterol which
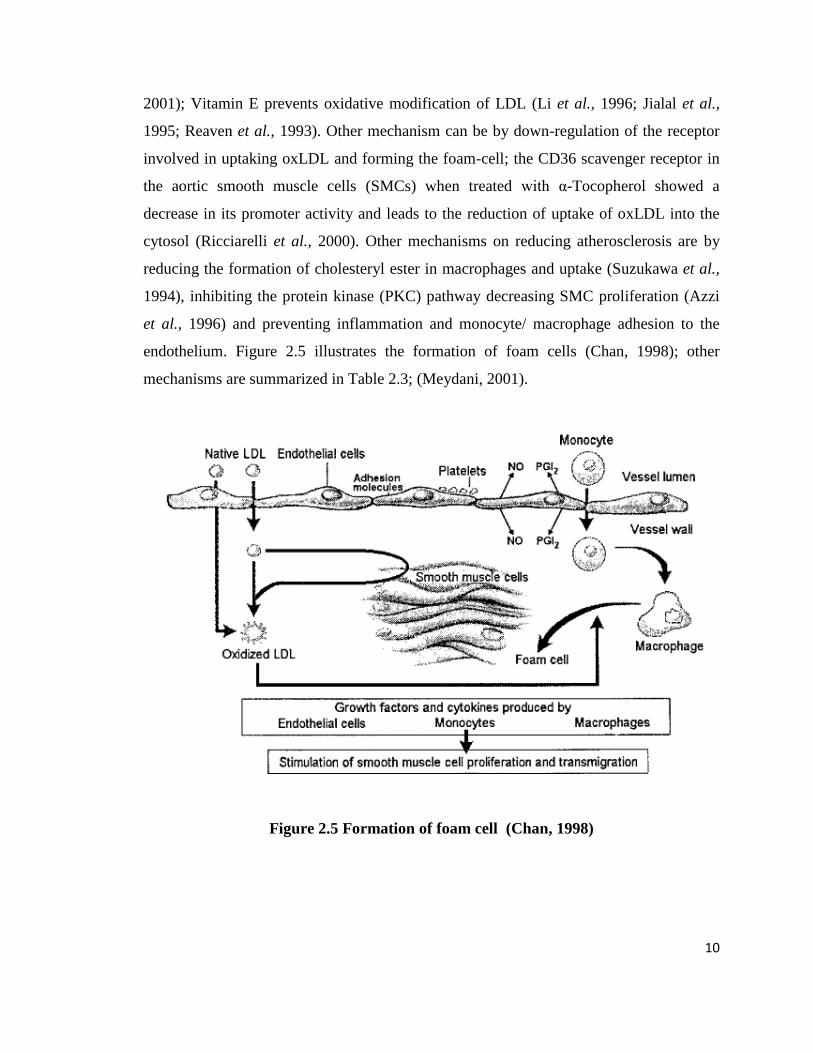
accumulates on arterial wall (Ross, 1999). The oxidized LDL (oxLDL) is absorbed by
the macrophages forming lipid-laden foam cells in the fatty streak lesion (Meydani,
10
2001); Vitamin E prevents oxidative modification of LDL (Li et al., 1996; Jialal et al.,
1995; Reaven et al., 1993). Other mechanism can be by down-regulation of the receptor
involved in uptaking oxLDL and forming the foam-cell; the CD36 scavenger receptor in
the aortic smooth muscle cells (SMCs) when treated with α-Tocopherol showed a
decrease in its promoter activity and leads to the reduction of uptake of oxLDL into the
cytosol (Ricciarelli et al., 2000). Other mechanisms on reducing atherosclerosis are by
reducing the formation of cholesteryl ester in macrophages and uptake (Suzukawa et al.,
1994), inhibiting the protein kinase (PKC) pathway decreasing SMC proliferation (Azzi
et al., 1996) and preventing inflammation and monocyte/ macrophage adhesion to the
endothelium. Figure 2.5 illustrates the formation of foam cells (Chan, 1998); other
mechanisms are summarized in Table 2.3; (Meydani, 2001).
Figure 2.5 Formation of foam cell (Chan, 1998)

11
Table 2.3 Mechanisms by which vitamin E inhibits atherosclerosis (Meydani, 2001)
↓ LDL oxidation, ↓ macrophage uptake of oxLDL
↓ Endothelial cell injury
↓ Adhesion molecule expression
↓ Immune/endothelial cell adhesion
↓ Inflammatory cytokines and chemokines
↓ Smooth muscle cell proliferation
↓ Platelet aggregation
↑ NO production, ↑ arterial dilation
↑ Prostacyclin (PGI2), ↓ Thromboxane A2 (TXA2)
2.6.2 Vitamin E and hypertension
The overproduction of reactive oxygen species (ROS) appeared to be the central
common pathway by which different influences may induce and intensify hypertension.
NADPH oxidase, mitochondria, xanthine oxidase, endothelium-derived NO synthase
(eNOS), cyclooxygenase 1 and 2, cytochrome P450 epoxygenase and transition metals
are potential sources of reactive oxygen species (ROS) (Figure 2.6; Harrison et al., 2007).
Figure 2.6 Potential sources of reactive oxygen species (ROS) (Harrison et al., 2007)
As discussed previously, one of vitamin E functions is acting as an enzyme
inhibitor. This inhibition of NADPH oxidase, lipoxygenase, and cyclooxygenase can

12
lower oxidative stress (Kizhakekuttu and Michael, 2010). One study showed little but
significant reduction in blood pressure when treated with vitamin E along with other
compound; zinc sulphate, ascorbic acid and beta-carotene (Galley et al., 1997).
2.6.3 Vitamin E and diabetes
Type 2 diabetes mellitus formally known as non-insulin dependent diabetes
mellitus (NIDDM) is defined by the decreased uptake of glucose by human cells. In most
patients, the insulin molecules and receptors are normal but several intracellular signaling
pathways defect effects are responsible for insulin resistance. (Nolan, 2006).
The extracellular hyperglycemia leads to tissue damage and pathophysiological
complications such as heart disease, atherosclerosis, cataract formation and other
damages. The hyperglycemia stimulates the formation of reactive oxygen species (ROS)
from oxidative phosphorylation, glucose autooxidation, NADPH oxidase, lipooxygenase,
cytochrome P450, monooxygenases, and nitric oxide synthase (NOS) (Valko et al.,
2007).
Some antioxidants have a significant effect on type 2 diabetes, including β-
cryptoxanthin, vitamin E (α-Tocophenol, β-Tocophenol, ϒ-Tocophenol, δ-Tocophenol
and β-Tocotrienol, but not others such as vitamin C (Montonen et al., 2004). A four year
study of 944 men aged 42 – 60 years showed that 45 participants developed diabetes due
to low concentration of vitamin E, and 22 % were at risk of diabetes (Salonen et al.,
1995). Vitamin E plays an important role in improving glycemic control by possibly
reducing pancreatic β-cells damage caused by free radicals (Ruhe and MaDonald, 2001).
2.7 Antioxidant content in food
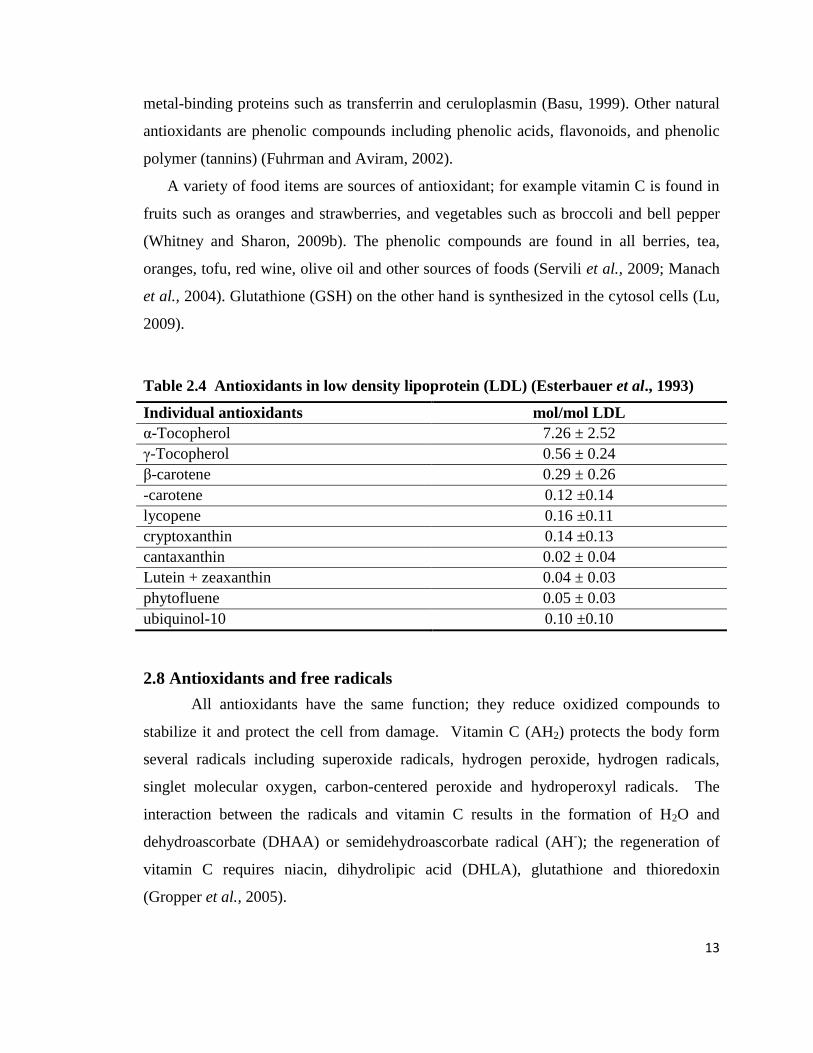
Vitamin E is not the only antioxidant present in food. Other vitamins as vitamin C
and carotenoids including β-carotene, γ-carotene and lycopene act as antioxidants along
with other functions. Vitamin C is a water soluble vitamin and carotenoids are lipid
soluble and therefor carried within lipoprotein particles with different concentrations
Table 2.4; Esterbauer et al., 1993. Antioxidant function is not limited to vitamins alone; it
includes enzymes and coenzymes such as ubiquinol (CoQH) catalase and copper and
zinc-dependent superoxide dismutase, peptides such as glutathione (GSH) and transition
13
metal-binding proteins such as transferrin and ceruloplasmin (Basu, 1999). Other natural
antioxidants are phenolic compounds including phenolic acids, flavonoids, and phenolic
polymer (tannins) (Fuhrman and Aviram, 2002).
A variety of food items are sources of antioxidant; for example vitamin C is found in
fruits such as oranges and strawberries, and vegetables such as broccoli and bell pepper
(Whitney and Sharon, 2009b). The phenolic compounds are found in all berries, tea,
oranges, tofu, red wine, olive oil and other sources of foods (Servili et al., 2009; Manach
et al., 2004). Glutathione (GSH) on the other hand is synthesized in the cytosol cells (Lu,
2009).
Table 2.4 Antioxidants in low density lipoprotein (LDL) (Esterbauer et al., 1993)
Individual antioxidants mol/mol LDL
α-Tocopherol 7.26 ± 2.52
γ-Tocopherol 0.56 ± 0.24
β-carotene 0.29 ± 0.26
-carotene 0.12 ±0.14
lycopene 0.16 ±0.11
cryptoxanthin 0.14 ±0.13
cantaxanthin 0.02 ± 0.04
Lutein + zeaxanthin 0.04 ± 0.03
phytofluene 0.05 ± 0.03
ubiquinol-10 0.10 ±0.10
2.8 Antioxidants and free radicals
All antioxidants have the same function; they reduce oxidized compounds to
stabilize it and protect the cell from damage. Vitamin C (AH2) protects the body form
several radicals including superoxide radicals, hydrogen peroxide, hydrogen radicals,
singlet molecular oxygen, carbon-centered peroxide and hydroperoxyl radicals. The
interaction between the radicals and vitamin C results in the formation of H2O and
dehydroascorbate (DHAA) or semidehydroascorbate radical (AH-); the regeneration of
vitamin C requires niacin, dihydrolipic acid (DHLA), glutathione and thioredoxin
(Gropper et al., 2005).

14
AH2 + O-
2 H2O + DHAA
AH2 + H2O2 2 H2O + DHAA
AH2 + OH• H2O + AH
-
AH2 + LO• LOH + AH
-
Superoxide dismutase (SOD) is dependent on certain minerals to function and
depending on the location of the SOD in the body these minerals changes; for instance, if
the SOD is in the mitochondria, manganese is the activation mineral whereas in the
extracellular or the intracellular, zinc and copper are the activation minerals (Gropper et
al., 2005). SOD acts on superoxide radicals and form hydrogen peroxide and O2 as shown
below;
SOD + 2O-
2 2 H2O + O2
Glutathione peroxidase (GPx) with the help of glutathione (GSH) eliminates
hydrogen peroxide, carbon-centered peroxide and hydroperoxyl radicals; catalase (an iron
dependent enzyme) on the other hand, eliminates hydrogen peroxide only. The activation
of GPx, requires selenium as a cofactor. Carotenoids such as (β-carotene and lycopene)
and ubiquinol (CoQH) eliminate singlet molecular oxygen, carbon-centered peroxide and
hydroperoxyl radicals. Oxidized glutathion (GSSG) is regenerated via reacting with
DHLA or glutathione reductase with niacin as NADPH. Also DHLA helps in
regenerating CoQH or by the thirodoxin-thirodoxin reductase system (Gropper et al.,
2005).
2GSH + GPx-Se + H2O2 2 H2O + GSSG (oxidized glutathione)
β-carotene + 1O2
3O2 + excited β-carotene β-carotene + heat
CoQH + LOO• CoQH
• + LOOH
Antioxidant activity of phenolic compounds comes from the ability to donate a
hydrogen atom to the peroxyl radical to form an alkyl hydroperoxide. The phenolic
radical can be stabilized by donating another hydrogen atom or by reacting with another
radical and they eliminate hydroxyl and peroxyl radicals, and superoxide anion (Fuhrman
and Aviram, 2002). Another pathway of phenolic compound is by chelation achieved

15
either binding of the ion (such as iron) to the chelating agents preventing their
involvement in generating hydroxyl radicals, or by binding the transition metal ion to an
antioxidant; the redox reaction may not be prevented but the formed radicals are directed
into the antioxidant path (Halliwell, 2002).
ROO· + PPH ROOH + PP·
2.8.1 Antioxidant and Cardiovascular disease
Singh et al. (1992) reported a positive association between a diet with increased
fruits, vegetables, fiber and mineral and the reduction of blood lipoproteins; this study
was done on 505 patients with and acute myocardial infarction, they were divided into 2
groups, both had the same diet but group A had more fruits, vegetables and nuts in their
diet and the results showed a reduction in weight and lipids in group A in comparison
with group B.
Another study used the same strategy and divided participants into three groups;
group A the controlled group, group B similar to A but added more fruit and vegetables to
their diet and the last group C with a low fat diet and more fruit and vegetables and
showed that having a low fat and high fruit and vegetable diet lower the rate of lipid
peroxidation (Miller et al., 1998).
2.8.2 Antioxidant and hypertension
Hypertension increases the risk of atherosclerosis and free radicals are associated
with atherogenic process; this means hypertensive patients with low levels of antioxidant
are at greater risk of developing atherosclerosis (Redon et al., 2003). A study showed that
Vitamin C and thiols levels were significantly lower in hypertensive patients thus free
radicals would be at a higher level (Tse et al., 1994). Hypertension patients showed not
only low levels of vitamin C, but also vitamin E as well (Wen et al., 1996).
2.8.3 Antioxidant and cancer
A study was done in Sweden on the effect of vegetable and fruit as antioxidants
on the risk of having cancer and showed that having more fruits and vegetables rich in
vitamin C, β-carotene and vitamin E can reduce the risk of Cardia cancer (Ekstrom et al.,
2000) and distal cancer (Serafini et al., 2002).

16
2.9 Vegetable oils - Olive oil
2.9.1 Types of olive oil
Olive oil is available in the following 3 main categories: virgin olive oil, olive oil
and refined olive oil;virgin olive oil is furthered differentiated into extra virgin olive oil,
virgin olive oil, lampante virgin olive oil and ordinary virgin olive oil (USDA, 2010).
This classification is based on certain quality criteria such as color, odor and flavor.
Another type of olive oil is olive pomace oil which is obtained from the residue
remaining after extracting the olive oil. It is of lower quality and is separated into olive
pomace oil, refined olive pomace oil and crude olive pomace oil (Appendix A; USDA,
2010).
2.9.2 Olive oil vitamin E and phenolic content
Olive oil contains 14 mg/100 g of vitamin E with mainly α-Tocopherol and high
content of antioxidant phenolic compounds (Owen et al., 2004) and especially in extra
virgin olive oil which has higher levels of phenolic compounds (Owen et al., 2000).
These phenolic compounds are present only in virgin olive oil and not in any other
vegetable oil and are classified as follows: mainly tyrosol, hydroxytyrosol, and their
derivatives, derivatives of 4-hydroxybenzoic,4-hydroxyphenylacetic, and 4-
hydroxycinnamic acids, lignans and flavonoids (Ramirez-Tortosa et al., 2006).
The polarity of the phenolic compounds vary; the more polar phenolic compounds
are 4-acetoxy-ethyl-1, 2-dihydroxybenzene, 1-acetoxypinoresinol, apigenin, caffeic acid,
o- and p-coumaric acids, ferulic acid, gallic acid, homovanillic acid, p-hydroxybenzoic
acid, hydroxytyrosol, luteolin, oleuropein, pinoresinol, protocatechuic acid, sinapic acid,
syringic acid, tyrosol, vanillic acid, and vanillin while the less polar phenolic compounds
are aglycones of oleuropein and ligstroside (the hydroxytyrosol and tyrosol esters of
elenolic acid), deacetoxy and di- aldehydic forms of these aglycones the flavones luteolin
and apigenin, the lignans 1-acetoxypinoresinol and pinoresinol and also elenolic acid and
cinnamic acid (Boskou et al., 2006). Olive variety, degree of ripeness, soil composition,

17
climate, processing techniques and storage are factors effecting the quantity (150 – 700
mg/l) and quality of phenolic compounds in olive oil (Corona et al., 2009).
Olive oil has been reported to have positive effect on certain diseases including
cancer, cardio vascular disease, hypertension, hypercholesterolemia and overall health
status (Covas et al., 2006; Marrugat et al., 2004; Weinbrenner et al., 2004; Madigan et
al., 2000; Owen et al., 2000; Visioli and Galli, 1998).
2.10 Olive oil and heart disease risk factors
A European study involving 192 men aged 20 – 60 years (using high, medium and
low polyphenol content olive oils) showed an increase in HDL-cholesterol levels. Also
the oxidation damage of LDL was lowered depending on polyphenol content of olive oils
(Covas et al., 2006).
The Mediterranean diet is characterized by high consumption of fruit, vegetables
and olive oil. For instance, in Crete, the largest island in Greece, the consumption of fats
reaches up to 40 % of the total caloric intake most of it comes from olive oil (Visioli and
Galli 1998).
Weinbrenner et al. (2004) studied the effect of olive oil on 12 healthy men aged
20 – 22 years who were asked to consume olive oil with different phenolic content; high,
moderate and low; 486, 133 and 10 mg/kg, respectively; the results showed a reduction in
oxLDL, 8-oxo-dG in mitochondrial DNA and urine and an increase of HDL and
glutathione peroxidase.
2.11 Vitamins with antioxidant properties status among the Kuwaiti
population
2.11.1 Vitamin E status
In a 2009 National Nutrition Survey in Kuwait, the mean daily intake of vitamin E
was highest among males aging 6 – 9 and 10 – 19 years 6.4 mg. Females aging 20 – 49
had the highest daily intake 5.3 mg. the mean intake between both genders and age group
did not differ (Table 2.5; Al-hooti et al., 2009).

18
Table 2.5 Daily intake of vitamin E by gender and age (Al-hooti et al., 2009)
Average daily intake of vitamin E - alpha equivalents (mg)
Age Group
(years)
Males Females
Median Mean S.E. Median Mean S.E.
Weighted
3-5 2.7 3.5 0.30 3.2 4.2 0.44
6-9 4.3 6.4 1.08 4.0 5.2 0.45
10-19 5.0 6.4 0.40 4.5 5.2 0.27
20-49 4.9 5.7 0.28 4.3 5.3 0.19
50+ 4.8 5.6 0.36 3.4 4.4 0.46
Total 4.5 5.8 0.26 4.0 5.0 0.14
Unweighted
3-5 3.3 4.0 0.34 3.2 4.0 0.44
6-9 4.3 5.7 0.53 4.0 4.9 0.45
10-19 5.2 6.4 0.39 4.5 5.2 0.28
20-49 5.0 6.2 0.31 4.3 5.2 0.21
50+ 5.2 6.0 0.31 3.4 4.5 0.3
Total 4.84 5.92 0.17 3.99 4.95 0.13
The percentage of individuals not meeting the estimated average requirements
(EAR) was highest among females age ≥ 50 (96 %) and 20 – 49 years of age for males
with 94 %. In total, 86 % and 91 % of males and females respectively did not meet the
EAR (Table 2.6; Al-hooti et al., 2009).
Table 2.6 Percentage of participants not meeting the estimated average requirement
(EAR) of vitamin E (mg) by gender and age (Al-hooti et al., 2009)
Gender Age Group (Years)
3-5 6-9 10-19 20-49 ≥ 50 Total
Weighted
Males 85 68 84 94 92 86
Females 75 78 95 95 96 91
Unweighted
Males 80 73 85 91 91 87
Females 97 82 94 95 95 92

19
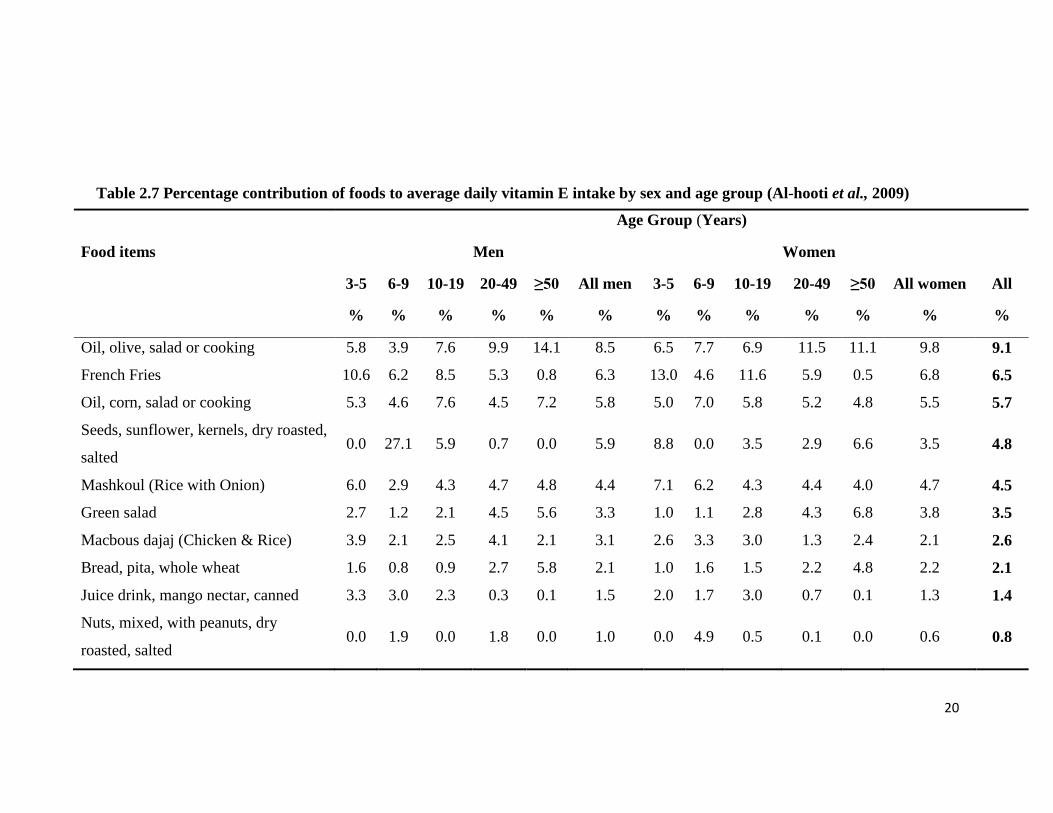
2.11.2 Vitamin E sources
In the Kuwait dietary survey, olive oil was the main contributor of the average
daily intake of vitamin E. the overall percent was 9.1 %. French fried potatoes was second
with an overall contribution of 6.5 %, followed by corn oil 5.7 %, sunflower seeds 4.8 %,
and mashkoul (rice with onions) 4.5 % (Table 2.7; Al-hooti et al., 2009).
20
Table 2.7 Percentage contribution of foods to average daily vitamin E intake by sex and age group (Al-hooti et al., 2009)
Age Group (Years)
Food items Men Women
3-5 6-9 10-19 20-49 ≥50 All men 3-5 6-9 10-19 20-49 ≥50 All women All
% % % % % % % % % % % % %
Oil, olive, salad or cooking 5.8 3.9 7.6 9.9 14.1 8.5 6.5 7.7 6.9 11.5 11.1 9.8 9.1
French Fries 10.6 6.2 8.5 5.3 0.8 6.3 13.0 4.6 11.6 5.9 0.5 6.8 6.5
Oil, corn, salad or cooking 5.3 4.6 7.6 4.5 7.2 5.8 5.0 7.0 5.8 5.2 4.8 5.5 5.7
Seeds, sunflower, kernels, dry roasted,
salted 0.0 27.1 5.9 0.7 0.0 5.9 8.8 0.0 3.5 2.9 6.6 3.5 4.8
Mashkoul (Rice with Onion) 6.0 2.9 4.3 4.7 4.8 4.4 7.1 6.2 4.3 4.4 4.0 4.7 4.5
Green salad 2.7 1.2 2.1 4.5 5.6 3.3 1.0 1.1 2.8 4.3 6.8 3.8 3.5
Macbous dajaj (Chicken & Rice) 3.9 2.1 2.5 4.1 2.1 3.1 2.6 3.3 3.0 1.3 2.4 2.1 2.6
Bread, pita, whole wheat 1.6 0.8 0.9 2.7 5.8 2.1 1.0 1.6 1.5 2.2 4.8 2.2 2.1
Juice drink, mango nectar, canned 3.3 3.0 2.3 0.3 0.1 1.5 2.0 1.7 3.0 0.7 0.1 1.3 1.4
Nuts, mixed, with peanuts, dry
roasted, salted 0.0 1.9 0.0 1.8 0.0 1.0 0.0 4.9 0.5 0.1 0.0 0.6 0.8

21
CHAPTER 3
MATERIALS AND METHODS
3.1 Materials
Extra virgin olive oil, canola oil samples were purchased from a local supermarket
Montreal, Canada and palm oil sample was purchased from a local supermarket Kuwait,
Kuwait City. Meat and salmon fish samples were purchased from a local supermarket in
Montreal, Canada. Vitamin E, DL-all-rac-α-Tocopherol (≥ 95 %) and 2,2-Diphenyl-1-
picryl-hydrazl (DPPH) were purchased from Sigma/Aldrich. Ethyl acetate, methanol,
ethanol and n-hexane were purchased from Fisher Scientific.
3.2 Preparation of standard solutions and sample solutions
Standard solutions were prepared according to Gimeno et el., 2000 with
modifications. Standard α-Tocopherol was weighed (0.2, 0.3 and 0.4 g) in a 10 ml
volumetric flask then diluted with 10 ml ethanol. The solution was mixed using a vortex-
mixer for 10 s; 1 ml was transferred to a 10 ml volumetric flask, 9 ml ethanol added and
mixed for 10 s. This procedure was repeated 3 times to obtain standard solutions of (20,
30 and 40 µg/ml) of the prepared solutions which were kept in a dark volumetric flask at -
20 oC for up to 2 weeks.
Solutions of the oil samples were prepared based on the method of Gimeno et al.,
(2000) with modifications (Figure 3.1). The oil samples were diluted in n-hexane (1:1),
the solution was mixed using vortex-mixer for 10 s then 200 µl was transferred to a
centrifuge tube, and 600 µl methanol and 200 µl ethanol were added. The solution was
mixed using a vortex-mixer and centrifuged at 3000 RPM for 5 min, then filtered through
a 0.45 µm pore size filter and 50 µl was injected directly into the chromatograph (refer to
Section 3.6 for details). The prepared oil solutions were kept in dark at -20 oC for up to 1
week.

22
3 ml oil sample + 3 ml n-hexane
Mixed using vortex-mixer for 10 s
200 µl transferred to Eppendorf centrifuge tube (1.5 ml)
Added 600 µl methanol and 200 µl ethanol
Mixed using vortex-mixer for 10 s and centrifuged at 3000 RPM for 5 min using
(Eppendorf Centrifuge, Model minispin plus, Canada)
Precipitate Supernatant filtered with
(AcetatePlus, supported, plain, 0.45 µ, 13 mm,
USA) filter
50 µl injected into the HPLC
Figure 3.1 Diagram of procedure used for extracting α-Tocopherol in oil samples

23
3.3 Preparation of standard curve
Standard solutions were prepared as described in Section 3.2. The solutions were
allowed to warm-up to room temperature before injecting. 50 µl was injected into the
chromatograph and the area under the curve was calculated using the calibration curve
obtained from standard with dilution factors; the analysis was done in triplicate.
3.4 Effect of heating on standard and oils
Heating of the α-Tocopherol and the oils was done according to the method of
Kalantzakis et al., (2006) with some modifications; an oil bath (IKA-HEIZBAD HB-250)
with grape-seed oil was used as heat transfer medium because of its high smoke point
(190 – 250 oC) (Bail et al., 2008) . The effect of heating was carried out using the method
of Pellegrini et al., 2001 with modifications. Four tubes of 10 ml Pyrex test tubes were
filled with 2 ml standard α-Tocopherol and 9 ml oil samples. The tubes were placed in the
oil bath heated at 3 different temperatures (70, 100, and 130 oC). Four heating time
intervals (0.5, 1, 1.5 and 2 h) were chosen, and after each time period the tube was
covered with aluminum foil and stored at -20 oC until analysis.
3.5 Cooking of the food samples in oils
Cooking was done according to the method of Andrikopoulos et al., (2002) with
modifications. The pan-frying was performed in an uncovered stainless steel (35 mm
high, diameter 220 mm). 3 pieces of meat were fried each time in 15 ml oil, for 5 min at
250 (±2) oC, the oil samples were placed in a 50 ml centrifuge tube, sealed and stored at -
20 oC immediately to prevent any further oxidation until analysis. The oven cooking was
performed in an aluminum foilware (146 mm x 121 mm x 35 mm) covered with
aluminum foil. 3 pieces of salmon were oven cooked using 15 ml oil, for 30 min at 130
(±3) oC. The oil samples were placed in a 50 ml centrifuge tube, sealed and stored at -20
oC immediately to prevent any further oxidation until analysis.
3.6 High Performance Liquid Chromatography (HPLC) analysis
HPLC analysis was carried out with Beckman liquid chromatographic system
equipped with a binary high-pressure delivery system (Model 126), a manual injector
(Rheodyne Model 7125i) with a 50 µl final loop and a UV detector (Model 166). The data

24
were stored and analysed with the Beckman Coulter chromatographic software (23 Karat
8.0). 1 ml of solution was centrifuged (3000 RPM, 5 min, Eppendorf Centrifuge, Model
minispin plus, Canada ), the supernatant was filtered with (AcetatePlus, supported, plain
,0.45 µ, 13 mm, USA) filter and injected into a Phenyl column CSC-Inertsil
150A/Phenyl, 5 µm, 150 x 4.6 mm and pre-column Eclipse XDB-C18, 3.5 µm, 4.6 x 56
mm operated at room temperature. The following conditions were used to elute the
sample at flow-rate of 1 ml min-1
from column: solvent A, methanol in water (96:4, v/v)
over 10 min.
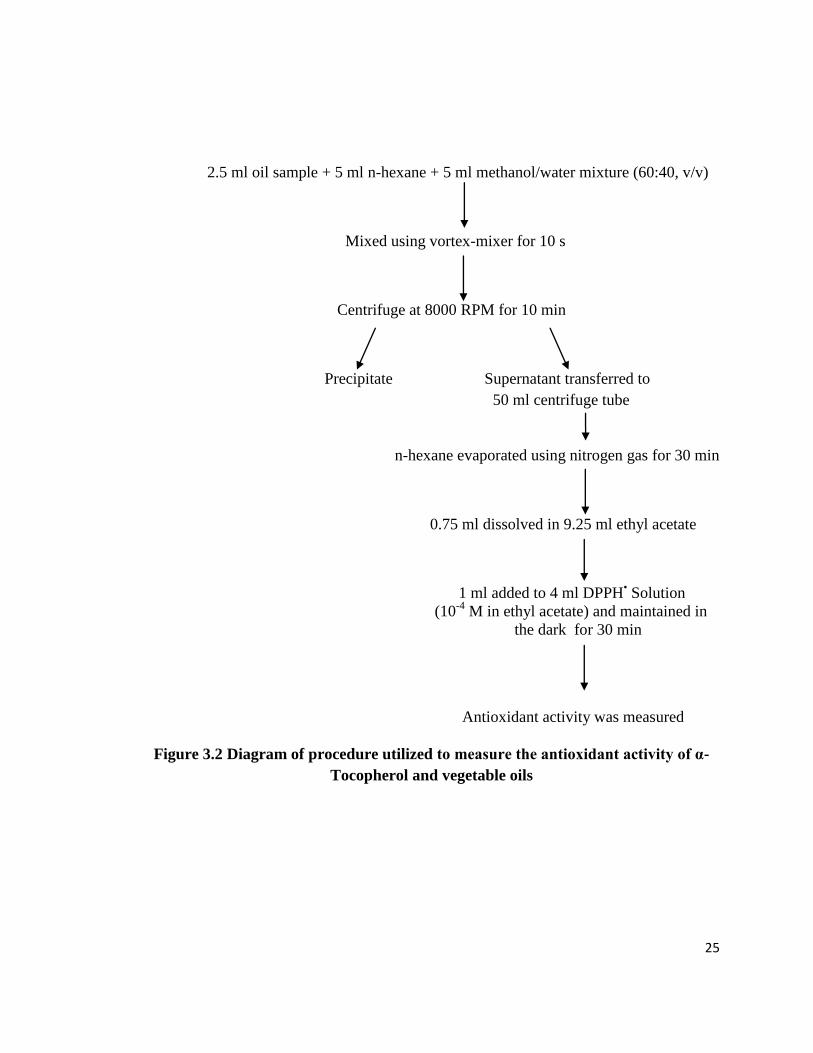
3.7 DPPH assay
A DU800 UV/visible spectrophotometer (version 3.0 build 5, 2001, Beckman
Coulter) was used to measure the antioxidant activity for both the standard and the oil
samples. The method of Kalantzakis et al., (2006) was used with modifications. The
unheated and heated samples at 70, 100 and 130 oC for 2 h, were taken every 30 min.
Samples (2.5 ml) were dissolved in 5 ml n-hexane and extracted with 5 ml of a
methanol/water mixture (60:40, v/v). The resulting mixture was shaken vigorously by
means of a mechanical shaker (Vortex) and centrifuged at 8000 RPM for 10 min. The
methanol/water insoluble fraction in the n-hexane was evaporated using nitrogen gas for
30 min (Figure 3.2).
A 1 ml sample of the oil solution in ethyl acetate (7.5 %, v/v), 1 ml was added to 4
ml of a freshly prepared DPPH• Solution (10
-4 M in ethyl acetate) in a screw-capped 10
ml test tube. The reaction mixture was shaken vigorously for 10 s in a Vortex apparatus
and the tube was maintained in the dark for 30 min, after which a steady state was
reached. The absorbance of the mixture was measured at 515 nm against a blank solution
(without radical) water was used. A control sample (without oil) was prepared and
measured daily. The radical scavenging activity (RSA) toward DPPH0 was expressed as
the % reduction in DPPH• concentration by the constituents of the oils:
% [DPPH•]red = 100 X (1–[DPPH
•]30/[DPPH
•]0)
where [DPPH•]0 and [DPPH
•]30 were the concentrations of DPPH
• in the control sample (t
= 0) and in the test mixture after the 30 min reaction, respectively.
25
2.5 ml oil sample + 5 ml n-hexane + 5 ml methanol/water mixture (60:40, v/v)
Mixed using vortex-mixer for 10 s
Centrifuge at 8000 RPM for 10 min
Precipitate Supernatant transferred to
50 ml centrifuge tube
n-hexane evaporated using nitrogen gas for 30 min
0.75 ml dissolved in 9.25 ml ethyl acetate
1 ml added to 4 ml DPPH• Solution
(10-4
M in ethyl acetate) and maintained in
the dark for 30 min
Antioxidant activity was measured
Figure 3.2 Diagram of procedure utilized to measure the antioxidant activity of α-
Tocopherol and vegetable oils

26
3.8 Thermal degradation kinetics
Using different order kinetics (zero, 1st and 2
nd) the results showed that the 1
st
order kinetics best fit the α-Tocopherol degradation results. The 1st order kinetic equation
is;
(1)
where C is the quantity of α-Tocopherol in µg/ml at any time, T is the time in hour and k
is the reaction rate constant in hour
Integrating Eq. (1) and letting C = Co at T = 0 gives:
(2)
The first order equation was obtained from (Ahmad et al., 2012)
3.9 Statistical analysis
All results presented as means (± standard deviation) of triplicate determinations.
ANOVA, Two-Factor without replication was used to analyze the data for significance. A
value of (P < 0.05) was considered as significant. All statistical analyses were done using
Excel 2007.

27
CHAPTER 4
RESULTS AND DISCUSSION
4.1 Standard α-Tocopherol concentration curve
Figure 4.1 shows the HPLC chromatograms of the standard α-Tocopherol
solutions at 3 different concentrations; Figure 4.2 shows the plot of peak area vs. α-
Tocopherol at the three different concentrations for triplicate injections. The equation
obtained was:
y = 26682x -100355 (R2
= 0.9619)
Gimeno et al. (2000) reported an equation of y = 1.048x -0.011 for HPLC
analysis of α-Tocopherol standard using a concentration range of 1 – 25 µg/ml of α-
Tocopherol standard.

28
Figure 4.1 HPLC chromatogram of standard α-Tocopherol (A) 20 µg/ml , (B) 30
µg/ml and (C) 40 µg/ml
Figure 4.2 α-Tocopherol standard concentration curve

29
4.2 Thermal degradation of standard α-Tocopherol and α-Tocopherol in
vegetable oils
Figure 4.3 shows the HPLC chromatogram of unheated (room temperature, 25 oC)
(A) standard α-Tocopherol, (B) α-Tocopherol in EVOO, (C) α-Tocopherol in palm oil
and (D) α-Tocopherol in canola oil. Average α-Tocopherol concentration in the 3 oils
were 323 (±5), 271 (±2) and 174 (±2) µg/ml, respectively.
i) Thermal degradation of standard α-Tocopherol: Standard α-Tocopherol was heated at
70, 100 and 130 oC for 2 h and HPLC was used to determine the degradation of α-
Tocopherol in relation to time and temperature. Figures 4.4i), 4.4ii) and 4.4iii) show the
HPLC chromatogram of standard α-Tocopherol during the thermal treatment, at half-hour
heating time intervals over 2 h at 70, 100 and 130 oC, respectively. Table 4.1 shows the
α-Tocopherol concentration calculated from the HPLC chromatograms and Figure 4.5
shows the first order degradation kinetics curve for standard α-Tocopherol during the heat
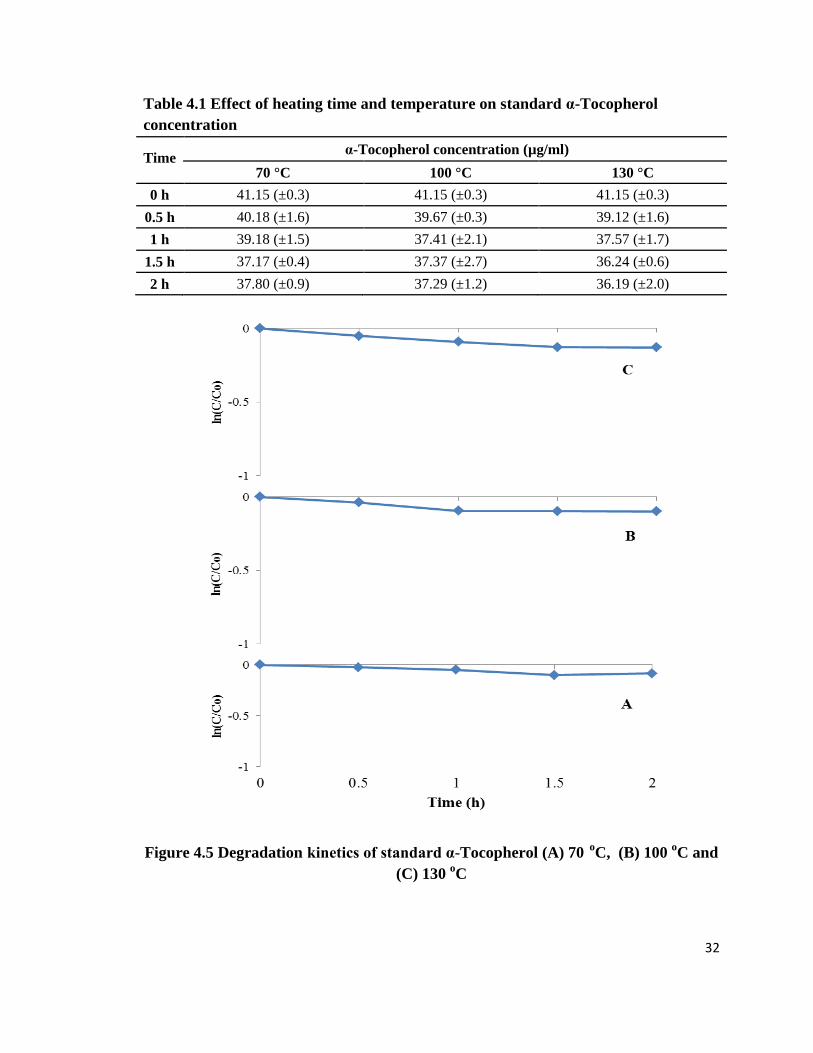
treatment. There was no significant degradation (P > 0.05) of α-Tocopherol at 70 oC; at 0
heating time α-Tocopherol concentration was 41.15 (±0.3) µg/ml compared to 40.18
(±1.6), 39.18 (±1.5), 37.17 (±0.4) and 37.8 (±0.9) µg/ml after 0.5, 1, 1.5 and 2 h heating
time, respectively. At 100 oC also, there was no significant decrease (P > 0.05) in α-
Tocopherol during the 2 h heating period; the α-Tocopherol concentration were 39.67
(±0.3), 37.41 (±2.1), 37.37 (±2.7) and 37.29 (±1.2) µg/ml, after 0.5 , 1, 1.5 and 2 h
heating time, respectively. Similarly at 130 oC there was non-significant decrease (P >
0.05) of α-Tocopherol during the 2 h heating period; the α-Tocopherol concentration were
39.12 (±1.6), 37.57 (±1.7), 36.24 (±0.6) and 36.19 (±2) µg/ml after 0.5, 1, 1.5 and 2 h
heating time, respectively. In general, the results show that there was a slight but
statistically non-significant (P > 0.05) decrease of α-Tocopherol concentration with
increasing time during the 2 h heating period at 70, 100 and 130 oC; there was no effect of
the temperature treatment on α-Tocopherol concentration.
Sabliov et al. (2009) reported the degradation of α-Tocopherol at 40, 60, 120,
and 180 oC; their results showed no significant effect of heat on α-Tocopherol
concentration during the 6 h heating period at 40, 60 and 120 oC, but at 180
oC there was
a significant effect of temperature on the decrease in α-Tocopherol concentration during

30
Time (m)
the 6 h heating period. Siro et al. (2006) also reported α-Tocopherol stability with heating
to temperatures up to 190 oC.
Figure 4.3 HPLC chromatogram for (A) standard α-Tocopherol (B) α-Tocopherol in
EVOO (C) α-Tocopherol in palm oil and (D) α-Tocopherol in canola oil
B
A
B
C
D
α-Tocopherol

31
I II III
Figure 4.4 Degradation of standard α-Tocopherol at (I) 70 o
C, (II) 100 oC and (III) 130
oC (A) 0 time (B) 0.5 h (C) 1 h
(D) 1.5 h and (E) 2 h
Time (m) Time (m) Time (m)
32
Table 4.1 Effect of heating time and temperature on standard α-Tocopherol
concentration
Time
α-Tocopherol concentration (µg/ml)
70 °C 100 °C 130 °C
0 h 41.15 (±0.3) 41.15 (±0.3) 41.15 (±0.3)
0.5 h 40.18 (±1.6) 39.67 (±0.3) 39.12 (±1.6)
1 h 39.18 (±1.5) 37.41 (±2.1) 37.57 (±1.7)
1.5 h 37.17 (±0.4) 37.37 (±2.7) 36.24 (±0.6)
2 h 37.80 (±0.9) 37.29 (±1.2) 36.19 (±2.0)
Figure 4.5 Degradation kinetics of standard α-Tocopherol (A) 70 o
C, (B) 100 oC and
(C) 130 oC

33
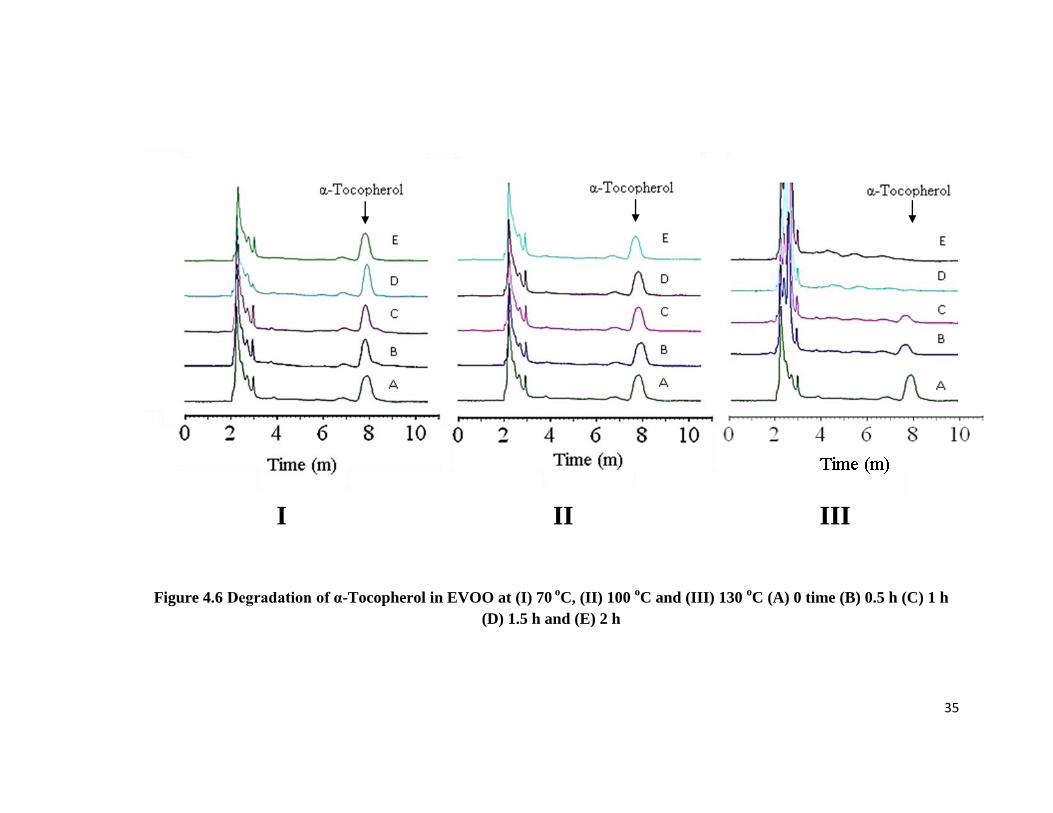
ii) Thermal degradation of α-Tocopherol in extra virgin olive oil (EVOO): Figures 4.6i),
4.6ii) and 4.6iii) show the HPLC chromatogram of α-Tocopherol during the thermal
treatment of EVOO, at half-hour heating time intervals over 2 h at 70, 100 and 130 oC,
respectively. Table 4.2 shows the α-Tocopherol concentration calculated from the HPLC
chromatograms, and Figure 4.7 shows the first order degradation kinetics curve of α-
Tocopherol in EVOO during the heat treatment. There was a gradual but non-significant
degradation (P > 0.05) of α-Tocopherol at 70 oC; at 0 heating time α-Tocopherol
concentration was 323 (±5.3) µg/ml compared to 283 (±9.4), 273 (±4.6), 289 (±10.7) and
304 (±2.6) µg/ml after 0.5, 1, 1.5 and 2 h heating time, respectively. At 100 oC also, there
was no significant decrease (P > 0.05) of α-Tocopherol in EVOO during the 2 h heating
period; the α-Tocopherol concentration were 291 (±6.2), 282 (±9.0), 279 (±5.8) and 269
(±7.7) µg/ml, after 0.5, 1, 1.5 and 2 h heating time, respectively. On the other hand, at
130 oC there was a significant decrease (P < 0.05) of α-Tocopherol during the 2 h heating
period; the α-Tocopherol concentration were 160 (±2.0), 133 (±0.8) µg/ml after 0.5 h and
1 h heating time, respectively and complete destruction of α-Tocopherol after 1.5 and 2 h
of heating. In general the results show that there was increasing destruction of α-
Tocopherol concentration in EVOO with increasing time at 100 oC and complete
destruction of α-Tocopherol after 1.5 h and 2 h at 130 oC.
The concentration α-Tocopherol in extra virgin olive oil was similar to those
reported by other researches. Boskou et al. (2006); Psomiadou (2000) reported that the
level of α-Tocopherol in extra virgin olive oil range were 55 – 370 µg/ml.
Previous studies have reported on the effect of heat treatment of olive oil at
temperatures above 160 oC (Allouch et al., 2007; Pellegrini et al., 2001); these researches
studied the effect of heat treatment at 160, 175,180,185 and 190 oC on extra virgin olive
oil and olive oil and reported a significant reduction of α-Tocopherol during the heat
treatment, and the results showed a significant effect in relation to heat time but not
temperature. Brenes et al. (2002) studied the effect of microwave heating and boiling of
water on α-Tocopherol concentration in virgin olive oil and reported a significant
reduction of α-Tocopherol concentration after 10 min during the microwave heating,
while for water boiling, no significant change was shown after 30 min. Nissiotis and

34
Tasioula-Margari (2002) reported the effect of heat treatment at 60 and 100 oC over an
extended period of time (3 – 30 days and 9 – 100 hours, respectively) on extra virgin
olive oil and fine virgin olive oil; the results showed no significant decrease after 3 d and
9 h of heat treatment, while a significant reduction after 15 d and 20 h of heat treatment.
Bester et al. (2008) also reported a significant reduction in α-Tocopherol concentration
with heating after 142 h of heat treatment.
35
I II III
Figure 4.6 Degradation of α-Tocopherol in EVOO at (I) 70 o
C, (II) 100 oC and (III) 130
oC (A) 0 time (B) 0.5 h (C) 1 h
(D) 1.5 h and (E) 2 h

36
Table 4.2 Effect of heating time and temperature on α-Tocopherol concentration in
extra virgin olive oil
Time α-Tocopherol concentration in Extra virgin olive oil (EVOO) (µg/ml)
70 °C 100 °C 130 °C
0 h 323 (±5.3) 323 (±5.3) 323 (±5.3)
0.5 h 283 (±9.4) 291 (±6.2) 160 (±2.0)
1 h 273 (±4.6) 282 (±9.0) 133 (±0.8)
1.5 h 289 (±10.7) 279 (±5.8) 0
2 h 304 (±2.6) 269 (±7.7) 0
Figure 4.7 Degradation kinetics of α-Tocopherol in extra virgin olive oil (A) 70 oC
(B) 100 oC and (C) 130
oC

37
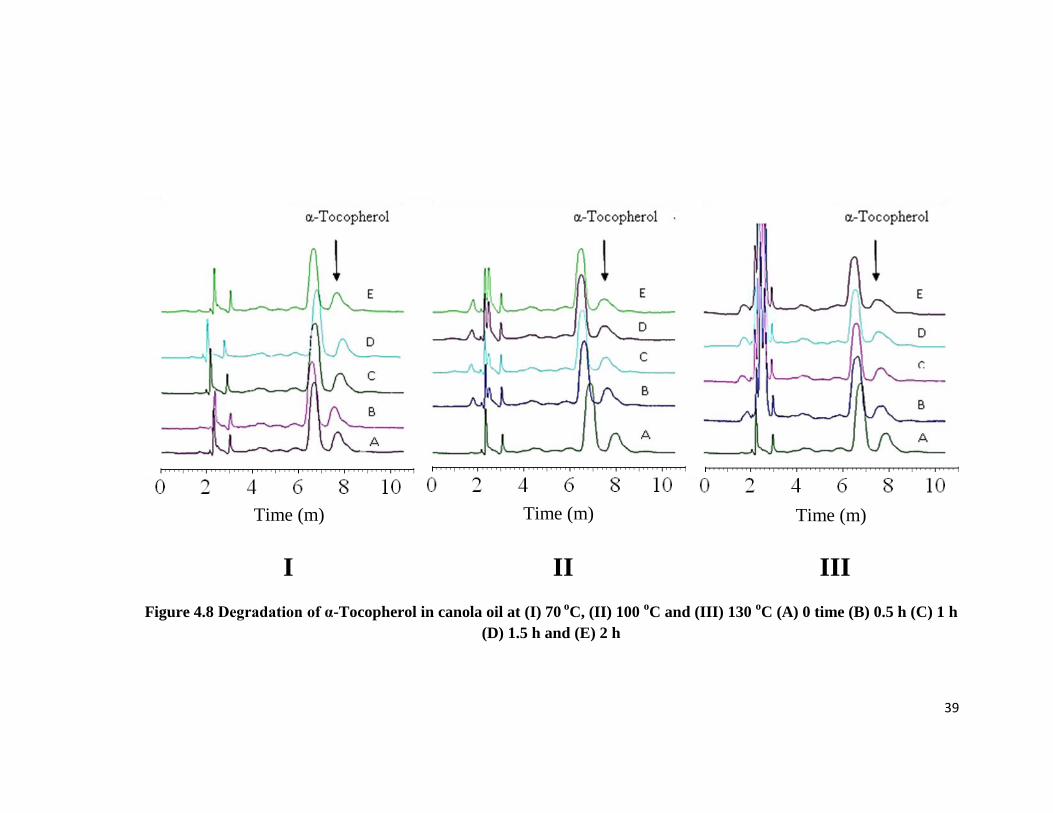
iii) Thermal degradation of α-Tocopherol in Canola oil: Figures 4.8i), 4.8ii) and 4.8iii)
show the HPLC chromatogram of α-Tocopherol during the thermal treatment of canola
oil, at half-hour heating time intervals over 2 h at 70, 100 and 130 oC, respectively. Table
4.3 shows the α-Tocopherol concentration calculated from the HPLC chromatogram and
Figure 4.9 shows the first order degradation kinetics curve of α-Tocopherol during the
heat treatment of canola oil. There was a gradual but non-significant degradation (P >
0.05) of α-Tocopherol at 70 oC; at 0 heating time α-Tocopherol concentration was 271
(±2.2) µg/ml compared to 268 (±6.1), 256 (±8.6), 250 (±1.8) and 249 (±5.6) µg/ml after
0.5, 1, 1.5 and 2 h heating time, respectively. At 100 oC also, there was non-significant
decrease (P > 0.05) of α-Tocopherol during the 2 h heating period; the α-Tocopherol
concentration were 245 (±8.8), 222 (±5.5), 216 (±4.7) and 208 (±2.8) µg/ml, after 0.5, 1,
1.5 and 2 h heating time, respectively. At 130 oC there was also a gradual but non-
significant decrease (P > 0.05) of α-Tocopherol during the 2 h heating period; the α-
Tocopherol concentration were 231 (±8.0), 228 (±11.9), 225 (±8.1) and 205 (±10.7)
µg/ml, after 0.5, 1, 1.5 and 2 h heating time , respectively. In general, the results show
that α-Tocopherol in canola oil was stable at 70 oC during the 2-hour heating period; at
100 and 130 oC the degradation of α-Tocopherol increased with time but this increase in
degradation was statistically not significant (P > 0.05).
The concentration of α-Tocopherol in canola oil was similar to those reported by
other researchers. Normand et al. (2001) reported that the levels of α-Tocopherol for
regular canola oil, high oleic canola oil, high oleic-low linolenic canola oil and low
linolenic acid canola oil were 197 (±10), 180 (±2), 290 (±2) and 152 (±13) µg/g,
respectively. Other researches (Przybylski et al., 2005; Bramley et al., 2000) reported 270
and 210 µg/g α-Tocopherol in canola oil.
Previous studies have reported the effect of heat treatment on canola oil at
temperature above 160 oC (Aladedunye and Roman, 2011; Romero et al., 2007); these
researches reported that the effect of temperature of 185 and 180 oC on canola oil showed
a significant reduction of α-Tocopherol during the heat treatment with a significant effect
in relation to heat time but not temperature. Sharayei et al. (2011) reported the effect of
heat treatment on the total Tocopherol content in canola oil at a temperature of 180 oC;

38
the results showed a significant decrease of total Tocopherol during heating treatment
with a significant effect in relation to heat time but not temperature.
39
I II III
Figure 4.8 Degradation of α-Tocopherol in canola oil at (I) 70 o
C, (II) 100 oC and (III) 130
oC (A) 0 time (B) 0.5 h (C) 1 h
(D) 1.5 h and (E) 2 h
Time (m) Time (m) Time (m)

40
Table 4.3 Effect of heating time and temperature on α-Tocopherol concentration in
canola oil
Time α-Tocopherol concentration in Canola oil (µg/ml)
70 °C 100 °C 130 °C
0 h 271 (±2.2) 271 (±2.2) 271 (±2.2)
0.5 h 268 (±6.1) 245 (±8.8) 231 (±8.0)
1 h 256 (±8.6) 222 (±5.5) 228 (±11.9)
1.5 h 250 (±1.8) 216 (±4.7) 225 (±8.1)
2 h 249 (±5.6) 208 (±2.8) 205 (±10.7)
Figure 4.9 Degradation kinetics of α-Tocopherol in canola oil (A) 70 oC (B) 100
oC
and (C) 130 oC

41
iv) Thermal degradation of α-Tocopherol in Palm oil: Figures 4.10i), 4.10ii) and 4.10iii)
show the HPLC chromatogram of α-Tocopherol during the thermal treatment, at half-
hour heating time intervals over 2 h at 70, 100 and 130 oC, respectively. Table 4.4 shows
the α-Tocopherol concentration calculation from the HPLC chromatogram and Figure
4.11 shows the first order degradation kinetics curve for α-Tocopherol during the heat
treatment. There was a gradual but non-significant degradation (P > 0.05) of α-
Tocopherol at 70 oC; at 0 heating time α-Tocopherol concentration was 174 (±1.7) µg/ml
compared to 174 (±0.7), 166 (±0.9), 166 (±6.1) and 159 (±2.7) µg/ml after 0.5, 1, 1.5 and
2 h heating time, respectively. At 100 oC also, there was a decrease (non-significant; P >
0.05) of α-Tocopherol during the 2 h heating period; the α-Tocopherol concentration were
158 (±3.6), 156 (±2.2), 152 (±8.7) and 150 (±5.7) µg/ml, after 0.5, 1, 1.5 and 2 h heating
time, respectively. At 130 oC there was also a gradual but non-significant (P > 0.05) of α-
Tocopherol in palm oil during the first 1-hour heating period. During the 2 h heating
period; the α-Tocopherol concentration was 156 (±6.1) and 154 (±6.7) after 0.5 and 1 h
heating time, respectively. There was a significant (P < 0.05) degradation of α-
Tocopherol after the 1.5 and 2 h heating period; the α-Tocopherol concentration was 127
(±1.9) and 97 (±0.9) µg/ml, after 1.5 and 2 h heating time, respectively. In general, the
results show that the α-Tocopherol in palm oil was stable at 70 oC during the 2-hour
heating period; at 100 oC the degradation of α-Tocopherol increased with time but this
increase in degradation was statistically not significant (P > 0.05) while at 130 oC the
degradation of α-Tocopherol increased and this was statistically significant (P < 0.05) at
the 1.5 and 2 h heating times.
The concentration of α-Tocopherol in palm oil was similar to those reported by
other researchers. Simonne and Eitenmiller (1998) reported that the level of α-Tocopherol
for palm oil was 155 (±5) µg/g. Other researches (Marco et al., 2007) reported 185 ppm
of α-Tocopherol in palm oil and Schroeder et al. (2006) reported 193 (±8) and 288 (±9) α-
Tocopherol in yellow palm oil and red palm oil, respectively.
Previous studies have reported on the effect of heat treatment of palm oil and palm
olein (Adam et al., 2007; Barrera-Arellano et al., 2002; Simonne and Eitenmiller, 1998);
these researchers studied the effect of heat treatment at 180 and 185 oC, on palm oil and

42
reported a significant reduction of α-Tocopherol with a significant effect in relation to
heat time but not temperature. Corsini et al. (2009) reported no significant decrease of α-
Tocopherol under the similar heating conditions. Schroeder et al. (2006) studied the
effect of repeated heat treatment at 160 oC on yellow and red palm oil and reported a
significant reduction of α-Tocopherol with repeated heat treatment.

43
I II III
Figure 4.10 Degradation of α-Tocopherol in palm oil at (I) 70 o
C, (II) 100 oC and (III) 130
oC (A) 0 time (B) 0.5 h (C) 1 h
(D) 1.5 h and (E) 2 h
Time (m) Time (m) Time (m)
α-Tocopherol
E
D
C
A
B
α-Tocopherol
E
C
α-Tocopherol
E
D
C
B
A
D
B
A

44
Table 4.4 Effect of heating time and temperature on α-Tocopherol in palm oil
Time α-Tocopherol concentration in Palm oil (µg/ml)
70 °C 100 °C 130 °C
0 h 174 (±1.7) 174 (±1.7) 174 (±1.7)
0.5 h 174 (±0.7) 158 (±3.6) 156 (±6.1)
1 h 166 (±0.9) 156 (±2.2) 154 (±6.7)
1.5 h 166 (±6.1) 152 (±8.7) 127 (±1.9)
2 h 159 (±2.7) 150 (±5.7) 97 (±0.9)
Figure 4.11 Degradation kinetics of α-Tocopherol in palm oil (A) 70 oC (B) 100
oC
and (C) 130 oC
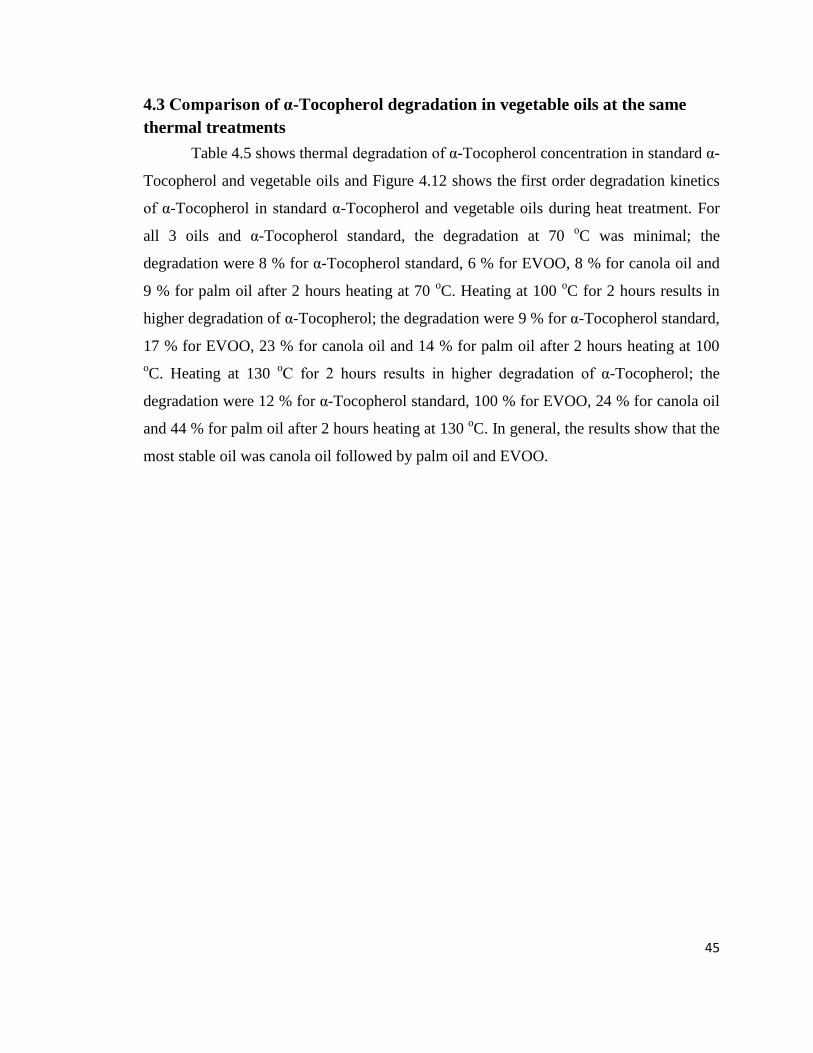
45
4.3 Comparison of α-Tocopherol degradation in vegetable oils at the same
thermal treatments
Table 4.5 shows thermal degradation of α-Tocopherol concentration in standard α-
Tocopherol and vegetable oils and Figure 4.12 shows the first order degradation kinetics
of α-Tocopherol in standard α-Tocopherol and vegetable oils during heat treatment. For
all 3 oils and α-Tocopherol standard, the degradation at 70 oC was minimal; the
degradation were 8 % for α-Tocopherol standard, 6 % for EVOO, 8 % for canola oil and
9 % for palm oil after 2 hours heating at 70 oC. Heating at 100
oC for 2 hours results in
higher degradation of α-Tocopherol; the degradation were 9 % for α-Tocopherol standard,
17 % for EVOO, 23 % for canola oil and 14 % for palm oil after 2 hours heating at 100
oC. Heating at 130
oC for 2 hours results in higher degradation of α-Tocopherol; the
degradation were 12 % for α-Tocopherol standard, 100 % for EVOO, 24 % for canola oil
and 44 % for palm oil after 2 hours heating at 130 oC. In general, the results show that the
most stable oil was canola oil followed by palm oil and EVOO.
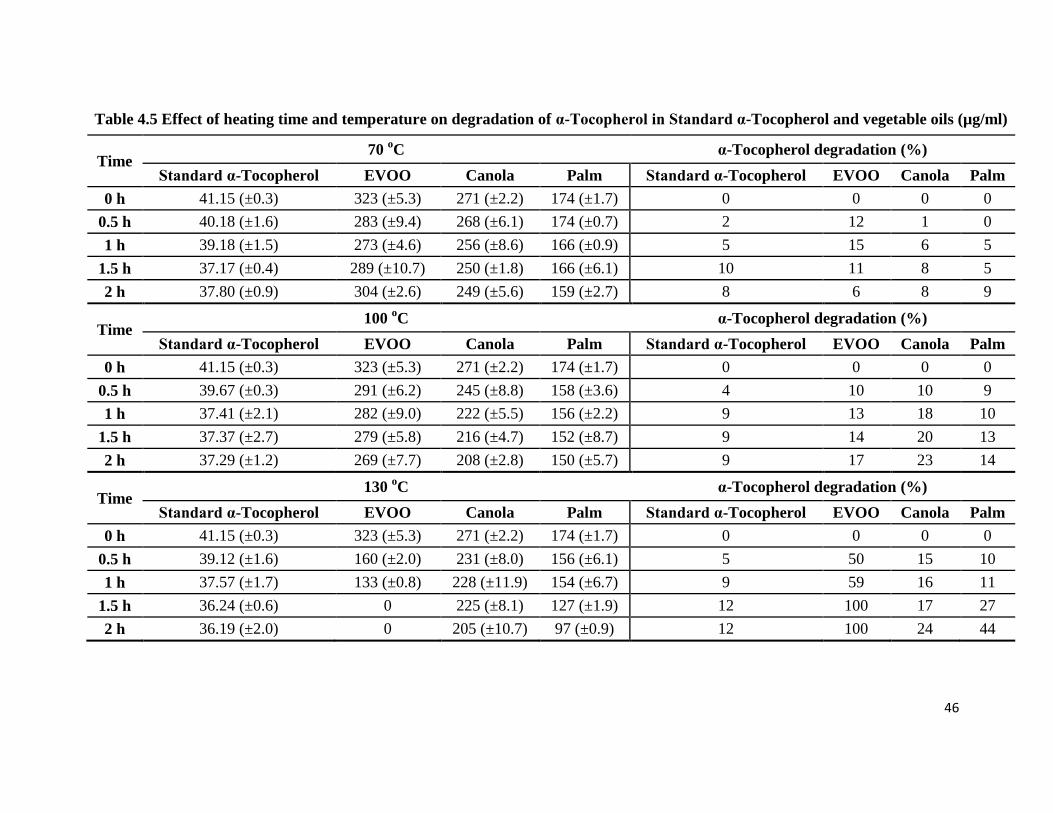
46
Table 4.5 Effect of heating time and temperature on degradation of α-Tocopherol in Standard α-Tocopherol and vegetable oils (µg/ml)
Time 70
oC α-Tocopherol degradation (%)
Standard α-Tocopherol EVOO Canola Palm Standard α-Tocopherol EVOO Canola Palm
0 h 41.15 (±0.3) 323 (±5.3) 271 (±2.2) 174 (±1.7) 0 0 0 0
0.5 h 40.18 (±1.6) 283 (±9.4) 268 (±6.1) 174 (±0.7) 2 12 1 0
1 h 39.18 (±1.5) 273 (±4.6) 256 (±8.6) 166 (±0.9) 5 15 6 5
1.5 h 37.17 (±0.4) 289 (±10.7) 250 (±1.8) 166 (±6.1) 10 11 8 5
2 h 37.80 (±0.9) 304 (±2.6) 249 (±5.6) 159 (±2.7) 8 6 8 9
Time 100
oC α-Tocopherol degradation (%)
Standard α-Tocopherol EVOO Canola Palm Standard α-Tocopherol EVOO Canola Palm
0 h 41.15 (±0.3) 323 (±5.3) 271 (±2.2) 174 (±1.7) 0 0 0 0
0.5 h 39.67 (±0.3) 291 (±6.2) 245 (±8.8) 158 (±3.6) 4 10 10 9
1 h 37.41 (±2.1) 282 (±9.0) 222 (±5.5) 156 (±2.2) 9 13 18 10
1.5 h 37.37 (±2.7) 279 (±5.8) 216 (±4.7) 152 (±8.7) 9 14 20 13
2 h 37.29 (±1.2) 269 (±7.7) 208 (±2.8) 150 (±5.7) 9 17 23 14
Time 130
oC α-Tocopherol degradation (%)
Standard α-Tocopherol EVOO Canola Palm Standard α-Tocopherol EVOO Canola Palm
0 h 41.15 (±0.3) 323 (±5.3) 271 (±2.2) 174 (±1.7) 0 0 0 0
0.5 h 39.12 (±1.6) 160 (±2.0) 231 (±8.0) 156 (±6.1) 5 50 15 10
1 h 37.57 (±1.7) 133 (±0.8) 228 (±11.9) 154 (±6.7) 9 59 16 11
1.5 h 36.24 (±0.6) 0 225 (±8.1) 127 (±1.9) 12 100 17 27
2 h 36.19 (±2.0) 0 205 (±10.7) 97 (±0.9) 12 100 24 44

47
Figure 4.12 Degradation kinetics of α-Tocopherol in ( ) standard α-Tocopherol, ( )
EVOO, ( ) canola oil and ( ) palm oil at (A) 70 oC (B) 100
oC and (C) 130
oC

48
4.4 Thermal degradation of α-Tocopherol in vegetable oils during cooking
Figure 4.13 shows the HPLC chromatograms for EVOO, canola and palm oil
during cooking, (A) no cooking (B) oven cooking and (C) pan-frying. Table 4.6 shows
the α-Tocopherol concentration calculation from the HPLC chromatograms while Figure
4.14 shows the degradation of α-Tocopherol during cooking and Figure 4.15 shows the
degradation % of α-Tocopherol during cooking .The results suggest that the loss of α-
Tocopherol depended on the type of oil and cooking method. With the oven cooking
method (0.5 h cooking at 130 ±3 oC) extra virgin olive oil showed an α-Tocopherol
concentration of 264 (±8.0) µg/ml; with the frying method (5 min at 250 ± 3 oC) there
was complete degradation of α-Tocopherol. Palm oil showed similar behavior to extra
virgin olive oil with α-Tocopherol concentration of 156 (±2.9) µg/ml; with the oven
cooking method and a complete degradation of α-Tocopherol with the frying method.
With the same oven cooking method, canola oil showed a α-Tocopherol concentration of
236 (±2.3) µg/ml and with the same frying method α-Tocopherol concentration was 156
(±12.0) µg/ml. Overall, the results suggest that α-Tocopherol in canola oil was the most
stable of the three oils when the oils were subjected to the same cooking conditions; α-
Tocopherol in extra virgin olive oil and palm was completely degraded by the higher
temperature of the frying method while α-Tocopherol in canola oil showed a 42 %
degradation.
Andrikopoulos et al. (2002) reported that pan-frying of potatoes in virgin olive oil
at 180 oC 10 times for 6 min, showed a 92 % loss of α-Tocopherol. Brenes et al. (2002)
used microwave cooking (0.5 kW power at 2450 MHz) and reported that the degradation
of α-Tocopherol of extra virgin olive oil decreased with time during microwave heating at
maximum power for 5 and 10 min; for the Picual cultivar of olive oil the α-Tocopherol
degradation was 26 and 62 %, respectively and for Arbequina cultivar the degradation
was 35 and 81 %, respectively. Allouche et al. (2007) reported that the degradation of α-
Tocopherol of extra virgin olive oil decreased with time during heating over 36 hours at
180 oC; for the Arbequina cultivar the α-Tocopherol degradation ranged from 10 – 90%
and for the Picual cultivar the degradation ranged from 8 – 80 %. Normand et al. (2001)
reported that the level of degradation of α-Tocopherol varied depending on canola oil

49
type; canola oils were subjected to a temperature of 175 oC of 72 h. The results showed
the degradation of α-Tocopherol depended on the type of oil. Adam et al. (2007) showed
that heating palm oil for 10 min at 180 oC resulted in α-Tocopherol degradation ranging
from 98.13 and 55.70 % depending on the heating conditions during cooking; similar
results were reported by Bansal et al. (2010) and Schroeder et al. (2006).

50
I II III
Figure 4.13 Degradation of α-Tocopherol in (I) EVOO, (II) canola oil and (III) palm oil during cooking, (A) 0 time (B)
oven cooking and (C) pan-frying
α-Tocopherol α-Tocopherol α-Tocopherol
C
C
B
A
B
A
C
B
A
Time (m) Time (m) Time (m)

51
Table 4.6 Effect of cooking method on degradation of α-Tocopherol in vegetable oils
Oil type α-Tocopherol concentration (µg/ml) α-Tocopherol degradation (%)
No cooking Oven cooking (130 oC) Pan-Frying (250
oC) Oven cooking (130
oC) Pan-Frying (250
oC)
Extra virgin olive oil 323 (±5.3) 264 (±8.0) 0 18 100
Canola oil 271 (±2.2) 236 (±2.3) 156 (±12.0) 13 42
Palm oil 174 (±1.7) 156 (±2.9) 0 10 100
Figure 4.14 Effect of cooking method on degradation of α-Tocopherol in extra virgin olive oil, canola oil and palm oil

52
Figure 4.15 Degradation % of α-Tocopherol in ( ) extra virgin olive oil, ( )
canola oil and ( ) palm oil in relation to cooking method

53
4.5 Antioxidant activity: Standard curve for α-Tocopherol antioxidant
activity
Table 4.7 shows the antioxidant activity of α-Tocopherol standard at 3 different
concentrations; Figures 4.14 and 4.15 shows the standard curve for α-Tocopherol
antioxidant activity and the antioxidant activity of α-Tocopherol at 3 different
concentrations; from the standard curve, a concentration of 7.5 % was selected for
determination of the antioxidant activity in the oil samples.
Table 4.7 Antioxidant activity of standard α-Tocopherol at different concentration
Standard α-Tocopherol concentration DPPH reduction (%)
2.5% 99 (±0.05)
5.0% 99 (±0.54)
7.5% 98 (±0.45)
Figure 4.14 Standard α-Tocopherol calibration curve
0
0.004
0.008
0.012
0.016
0.02
0.024
2.5 5 7.5
Abso
rbance
(nm
)
Standard α-Tocopherol concentrations (%)

54
Figure 4.15 Antioxidant activity of standard α-Tocopherol in 3 different
concentrations
0
20
40
60
80
100
120
2.5 5 7.5
DP
PH
red
uct
ion
%
Standard α-Tocopherol concentrations (%)

55
4.6 Antioxidant activity of standard α-Tocopherol and heated oils
i) Antioxidant activity of standard α-Tocopherol: Table 4.8 and Figure 4.16 show the
antioxidant activity of standard α-Tocopherol, at a half –hour heating time over 2 h at 70,
100 and 130 oC. For the standard α-Tocopherol there was no significant effect of heating
at 70, 100 and 130 oC over the 2 hour heating period; this suggests that the antioxidant
activity of α-Tocopherol was not affected by the heat treatment.
A previous study reported the effect of heat treatment on the antioxidant activity
of standard α-Tocopherol (Larrauri et al., 1998); this research studied the effect of heat
treatment at 20, 80, 100 and 120 oC on standard α-Tocopherol and reported no significant
decrease; the results showed no significant effect in relation to temperature or heating
time.

56
Table 4.8 Effect of heating time and temperature on antioxidant activity of standard
α-Tocopherol (%)
Time Temperature
70 oC 100
oC 130
oC
0 h 99 (±0.05) 99 (±0.05) 99 (±0.05)
0.5 h 99 (±0.19) 99 (±0.06) 99 (±0.08)
1 h 99 (±0.05) 99 (±0.10) 99 (±0.49)
1.5 h 99 (±0.10) 99 (±0.08) 99 (±0.36)
2 h 98 (±0.32) 99 (±0.08) 98 (±0.59)
Figure 4.16 Effect of heating on standard α-Tocopherol antioxidant activity at (A) 70 oC, (B) 100
oC and (C) 130
oC
0
20
40
60
80
100
120
0 0.5 1 1.5 2
DPP
H re
duct
ion
%
Time (h)
A
0
20
40
60
80
100
120
DPP
H re
duct
ion
%
B
0
20
40
60
80
100
120
DPP
H re
duct
ion
%
C
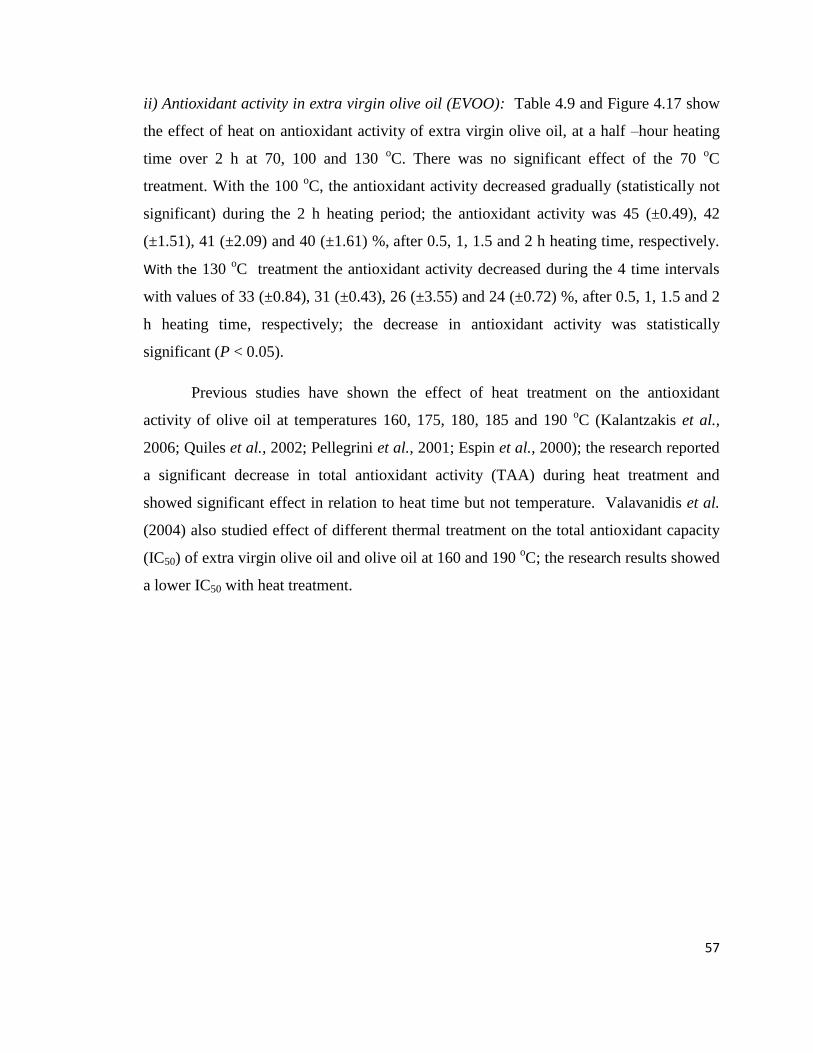
57
ii) Antioxidant activity in extra virgin olive oil (EVOO): Table 4.9 and Figure 4.17 show
the effect of heat on antioxidant activity of extra virgin olive oil, at a half –hour heating
time over 2 h at 70, 100 and 130 oC. There was no significant effect of the 70
oC
treatment. With the 100 oC, the antioxidant activity decreased gradually (statistically not
significant) during the 2 h heating period; the antioxidant activity was 45 (±0.49), 42
(±1.51), 41 (±2.09) and 40 (±1.61) %, after 0.5, 1, 1.5 and 2 h heating time, respectively.
With the 130 oC treatment the antioxidant activity decreased during the 4 time intervals
with values of 33 (±0.84), 31 (±0.43), 26 (±3.55) and 24 (±0.72) %, after 0.5, 1, 1.5 and 2
h heating time, respectively; the decrease in antioxidant activity was statistically
significant (P < 0.05).
Previous studies have shown the effect of heat treatment on the antioxidant
activity of olive oil at temperatures 160, 175, 180, 185 and 190 oC (Kalantzakis et al.,
2006; Quiles et al., 2002; Pellegrini et al., 2001; Espin et al., 2000); the research reported
a significant decrease in total antioxidant activity (TAA) during heat treatment and
showed significant effect in relation to heat time but not temperature. Valavanidis et al.
(2004) also studied effect of different thermal treatment on the total antioxidant capacity
(IC50) of extra virgin olive oil and olive oil at 160 and 190 oC; the research results showed
a lower IC50 with heat treatment.

58
Table 4.9 Effect of heating time and temperature on antioxidant activity of extra
virgin olive oil (%)
Time Temperature
70 oC 100
oC 130
oC
0 h 46 (±0.91) 46 (±0.91) 46 (±0.91)
0.5 h 44 (±0.62) 45 (±0.49) 33 (±0.84)
1 h 44 (±1.23) 42 (±1.51) 31 (±0.43)
h 44 (±0.75) 41 (±2.09) 26 (±3.55)
2 h 44 (±1.24) 40 (±1.61) 24 (±0.72)
Figure 4.17 Effect of heating on antioxidant activity of extra virgin olive oil at (A) 70 oC, (B) 100
oC and (C) 130
oC
0
20
40
60
80
100
0 0.5 1 1.5 2
DPP
H re
duct
ion
%
Time (h)
A
0
20
40
60
80
100
DPP
H re
duct
ion
%
B
0
20
40
60
80
100
DPP
H re
duct
ion
%
C

59
iii) Antioxidant activity in canola oil: Table 4.10 and Figure 4.18 show the effect of heat
on antioxidant activity of canola oil, at a half-hour heating time intervals over 2 h at 70,
100 and 130 oC. There was little effect of the 70
oC treatment. With 100
oC treatment, the
antioxidant activity of canola oil decreased gradually (statistically non-significant) during
the 4 time intervals (58 ±1.64, 57 ±0.96, 55 ±1.76 and 53 ±1.48 %, after 0 .5, 1, 1.5 and 2
h heating time, respectively). With 130 oC treatment, the antioxidant activity decreased
(statistically non-significant) during the 4 time intervals with values of 54 (±1.04), 54
(±1.08), 50 (±0.90) and 48 (±1.57) %, after 0.5, 1, 1.5 and 2 h heating time, respectively.
Previous studies have shown the effect of heat treatment on canola oil antioxidant
activity at temperatures of 55 and 95 oC (Cheung at al., 2007; Su et al., 2004) the research
reported a significant decrease in total antioxidant activity (TAA) during heat treatment
with significant effect in relation with heat time but not temperature. Chiavaro et al.
(2010) reported a slight but significant increase of trolox equivalent antioxidant capacity
(TEAC) during microwave heating for up to 6 min, followed by a subsequent decrease
reaching values similar to the initial value and a significant decrease of oxidative stability
index (OSI).

60
Table 4.10 Effect of heating time and temperature on antioxidant activity of canola
oil (%)
Time Temperature
70 oC 100
oC 130
oC
0 h 59 (±1.72) 59 (±1.72) 59 (±1.72)
0.5 h 59 (±0.66) 58 (±1.64) 54 (±1.04)
1 h 58 (±1.80) 57 (±0.96) 54 (±1.08)
1.5 h 58 (±2.54) 55 (±1.76) 50 (±0.90)
2 h 59 (±2.22) 53 (±1.48) 48 (±1.75)
Figure 4.18 Effect of heating on antioxidant activity of canola oil at (A) 70 oC, (B)
100 oC and (C) 130
oC
0
20
40
60
80
100
0 0.5 1 1.5 2
DPP
H re
duct
ion
%
Time (h)
A
0
20
40
60
80
100
DPP
H re
duct
ion
% B
0
20
40
60
80
100
DPP
H re
duct
ion
% C

61
iv) Antioxidant activity in palm oil: Table 4.11 and Figure 4.19 show the effect of heat on
the antioxidant activity of palm oil, at a half-hour heating time intervals over 2 h at 70,
100 and 130 oC and. There was little effect of 70
oC and 100
oC treatments. With 130
oC
treatment the antioxidant activity decreased gradually (statistically non-significant) during
the 4 time intervals with values of 33 (±0.84), 31 (±0.43), 26 (±3.55) and 24 (±0.72) %
after 0.5, 1.0, 1.5, 2 h heating time, respectively.
Previous studies have shown the effect of heat treatment on palm oil antioxidant
activity at temperatures of 170, 180, 210, 250 oC (Valantina et al., 2010; Andrikopoulos
et al., 2002); the research reported that antioxidants were lost during frying. Schroeder et
al. (2006) reported a decrease in antioxidant activity in yellow palm olein and red palm
olein, during repeated deep-fat frying at 163 oC.

62
Table 4.11 Effect of heating time and temperature on antioxidant activity of palm oil
(%)
Time Temperature
70 oC 100
oC 130
oC
0 h 51 (±0.84) 51 (±0.84) 51 (±0.84)
0.5 h 51 (±0.98) 50 (±1.00) 49 (±0.83)
1 h 50 (±0.40) 50 (±0.23) 47 (±0.77)
1.5 h 51 (±1.21) 50 (±0.28) 45 (±0.77)
2 h 50 (±0.49) 49 (±1.14) 39 (±0.30)
Figure 4.19 Effect of heating on antioxidant activity of palm oil at (A) 70 oC,
(B) 100 oC and (C) 130
oC
0
20
40
60
80
100
0 0.5 1 1.5 2
DPP
H re
duct
ion
%
Time (h)
A
0
20
40
60
80
100
DPP
H re
duct
ion
%
B
0
20
40
60
80
100
DPP
H re
duct
ion
%
C

63
4.7 Comparison of antioxidant activity of heated vegetable oils at the same
thermal treatments
Table 4.12 and Figure 4.20 show antioxidant activity of standard α-Tocopherol
and the 3 oils during the thermal treatments at 3 temperatures. The results showed no
significant antioxidant activity reduction as a result of the treatment at 70 oC. At 100
oC,
of the 3 oils, the highest stability of antioxidant activity to the heat treatment was with
palm oil followed by canola oil and EVOO. At 130 oC there was a significant decrease in
antioxidant activity for all oils; the highest stability of antioxidant activity was with
canola oil followed by palm and finally by EVOO (19, 24 and 48 % decrease in
antioxidant activity, respectively).

64
Table 4.12 Effect of heating time and temperature on antioxidant activity of standard α-Tocopherol and vegetable oils (%)
Time 70
oC Antioxidant activity loss (%)
Standard α-Tocopherol EVOO Canola Palm Standard α-Tocopherol EVOO Canola Palm
0 h 99 (±0.05) 46 (±0.91) 59 (±1.72) 51 (±0.84) 0 0 0 0
0.5 h 99 (±0.19) 44 (±0.62) 59 (±0.66) 51 (±0.98) 0.1 4.3 0 0
1 h 99 (±0.05) 44 (±1.23) 58 (±1.80) 50 (±0.40) 0.1 4.3 1.7 2.0
1.5 h 99 (±0.10) 44 (±0.75) 58 (±2.54) 51 (±1.21) 0.1 4.3 1.7 0
2 h 98 (±0.32) 44 (±1.24) 59 (±2.22) 50 (±0.49) 0.7 4.3 0 2.0
Time 100
oC Antioxidant activity loss (%)
Standard α-Tocopherol EVOO Canola Palm Standard α-Tocopherol EVOO Canola Palm
0 h 99 (±0.05) 46 (±0.91) 59 (±1.72) 51 (±0.84) 0 0 0 0
0.5 h 99 (±0.06) 45 (±0.49) 58 (±1.64) 50 (±1.00) 0.2 2.2 1.7 2.0
1 h 99 (±0.10) 42 (±1.51) 57 (±0.96) 50 (±0.23) 0.2 8.7 3.4 2.0
1.5 h 99 (±0.08) 41 (±2.09) 55 (±1.76) 50 (±0.28) 0 10.9 6.8 2.0
2 h 99 (±0.08) 40 (±1.61) 53 (±1.48) 49 (±1.14) 0.1 13.0 10.2 3.9
Time 130
oC Antioxidant activity (%)
Standard α-Tocopherol EVOO Canola Palm Standard α-Tocopherol EVOO Canola Palm
0 h 99 (±0.05) 46 (±0.91) 59 (±1.72) 51 (±0.84) 0 0 0 0
0.5 h 99 (±0.08) 33 (±0.84) 54 (±1.04) 49 (±0.83) 0.2 28.3 8.5 3.9
1 h 99 (±0.49) 31 (±0.43) 54 (±1.08) 47 (±0.77) 0.1 32.6 8.5 7.8
1.5 h 99 (±0.36) 26 (±3.55) 50 (±0.90) 45 (±0.77) 0.1 43.5 15.3 11.8
2 h 98 (±0.59) 24 (±0.72) 48 (±1.57) 39 (±0.30) 0.5 47.8 18.6 23.5

65
Figure 4.20 Effect of heating on antioxidant activity of ( ) standard α-Tocopherol, ( )
EVOO, ( ) canola and ( ) palm oil at (A) 70 oC, (B) 100
oC and (C) 130
oC

66
4.8 Effect of cooking on antioxidant activity of oils
Table 4.13 and Figure 4.21 show the effect of cooking on the antioxidant activity
of the 3 oils while Figure 4.22 shows the antioxidant activity loss during cooking. Canola
oil showed the highest antioxidant activity followed by EVOO and palm oil; antioxidant
reduction percentages were 24, 57 and 57 % for canola oil, EVOO and palm oil
respectively. With canola oil, the antioxidant activity was not affected by the oven
cooking method, while in the frying method there was a significant reduction (P < 0.05)
in the antioxidant activity from 59 (±1.98) to 45 (±1.55) %. With EVOO the antioxidant
activity decreased slightly during the oven cooking method, while in the frying method
produced a significant decrease (P < 0.05) in the antioxidant activity from 46 (±0.91) to
24 (±0.63) %. Palm oil showed similar behavior to canola oil and EVOO; the cooking
oven method produced small decrease in antioxidant activity while frying method showed
a significant decrease (P < 0.05) in the antioxidant activity from 51 (±0.84) to 24 (±0.74)
%.
Gomez-Alonso et al. (2003) showed that the antioxidant activity of virgin olive
oil decreased as the number of frying operations increased. Similar results were obtained
by Quiles et al., (2002) using electrospin resonance as an indication of antioxidant
activity.
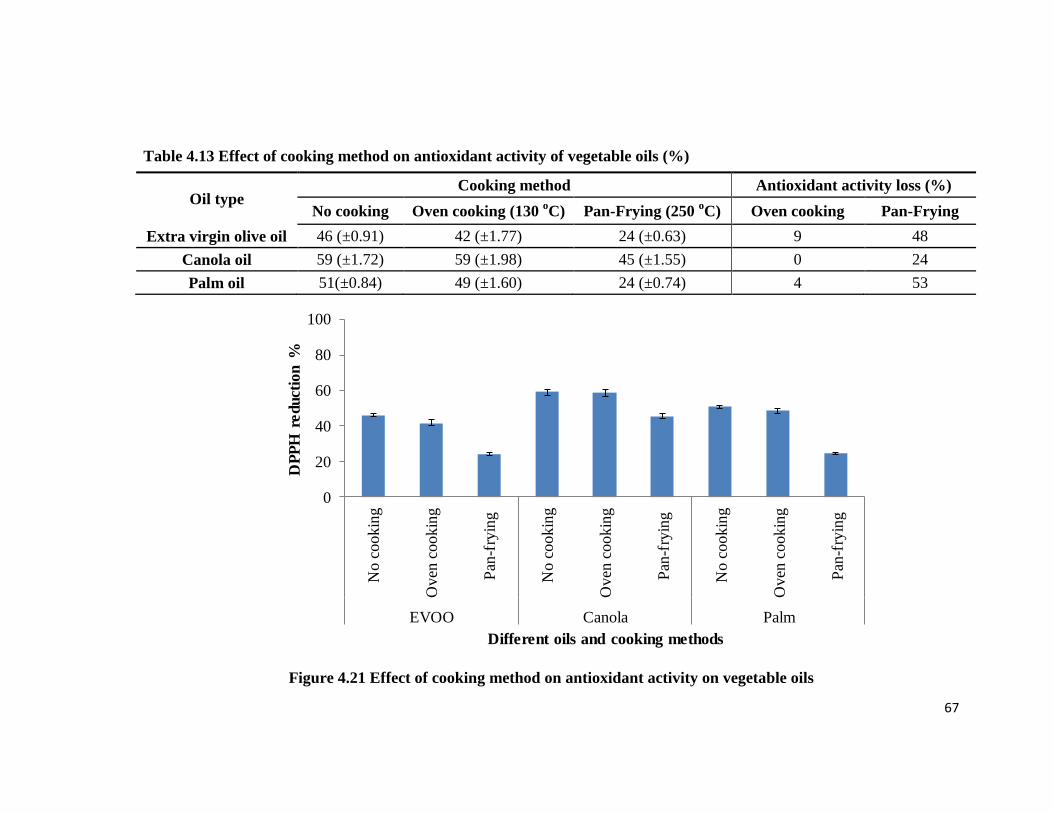
67
Table 4.13 Effect of cooking method on antioxidant activity of vegetable oils (%)
Oil type Cooking method Antioxidant activity loss (%)
No cooking Oven cooking (130 oC) Pan-Frying (250
oC) Oven cooking Pan-Frying
Extra virgin olive oil 46 (±0.91) 42 (±1.77) 24 (±0.63) 9 48
Canola oil 59 (±1.72) 59 (±1.98) 45 (±1.55) 0 24
Palm oil 51(±0.84) 49 (±1.60) 24 (±0.74) 4 53
Figure 4.21 Effect of cooking method on antioxidant activity on vegetable oils
0
20
40
60
80
100
No
co
ok
ing
Ov
en c
oo
kin
g
Pan
-fry
ing
No
co
ok
ing
Oven
cookin
g
Pan
-fry
ing
No
coo
kin
g
Oven
cookin
g
Pan
-fry
ing
EVOO Canola Palm
DP
PH
re
du
ctio
n %
Different oils and cooking methods
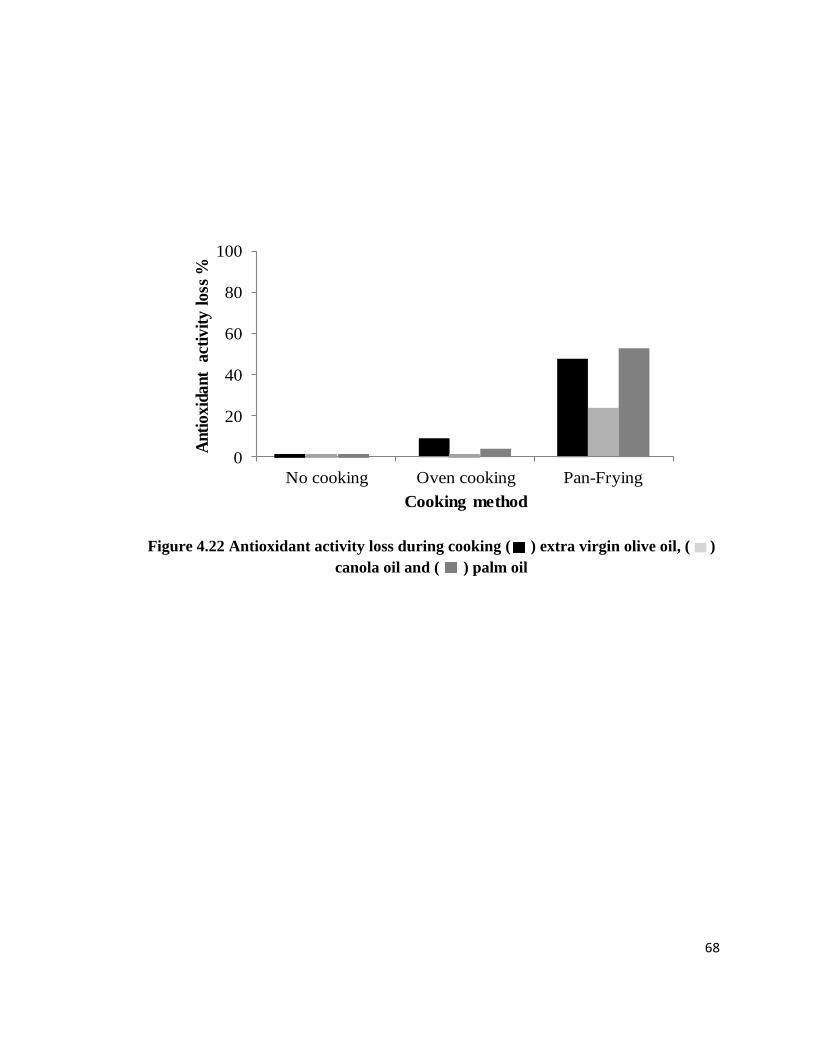
68
Figure 4.22 Antioxidant activity loss during cooking ( ) extra virgin olive oil, ( )
canola oil and ( ) palm oil
0
20
40
60
80
100
No cooking Oven cooking Pan-Frying
An
tio
xid
an
t a
ctiv
ity
lo
ss %
Cooking method

69
GENERAL CONCLUSION
The effect of heating on α-Tocopherol content and antioxidant activity in
different vegetable oils was investigated; the samples selected were EVOO, canola and
palm oil. These oils were chosen due to their use in the Kuwaiti cuisine, amount of α-
Tocopherol and use in Kuwaiti bakery products. α-Tocopherol content varied depending
on the oil samples; the highest content was found in EVOO followed by canola oil and
finally palm oil (323 ±5, 271 ±2 and 174 ±2 µg/ml) respectively. The effect of heat was
done at 70, 100 and 130 oC, for the following 4 time intervals: 0.5, 1, 1.5 and 2 h.
Thermal degradation of α-Tocopherol in the oils was minimal at 70 oC and increased at
100 oC and 130
oC. Heating at 130
oC for 2 h resulted in 100, 24 and 44 % degradation of
α-Tocopherol in EVOO, canola oil and palm oil respectively; EVOO was completely
degraded after 1.5 h heating at 130 oC. Use of 2 cooking methods, pan-frying (250
oC, 5
min) and oven cooking (130 oC, 30 min) resulted in the degradation of α-Tocopherol in
the oils. In the pan-frying method, both EVOO and palm oil were completely degraded
and canola oil showed 42 % degradation. With the oven cooking method the degradation
for EVOO, canola oil and palm oil were 18, 13 and 10 %, respectively.
DPPH method was used for examining the antioxidant activity of the oil
samples; it was found that highest antioxidant activity was observed with canola oil
followed by palm oil and EVOO (59 ±1.72, 51 ±0.84 and 46 ±0.91 %) respectively. At
70 oC there was no significant decrease in the antioxidant activity of the heated oils. At
100 oC, EVOO showed highest reduction in antioxidant activity followed by canola oil
and palm oil. At 130 oC, the antioxidant activity decreased gradually in the oil samples.
The highest decrease was observed with EVOO followed by canola oil and palm oil. The
decrease of antioxidant activity in oil samples was also observed with both pan-frying and
oven cooking methods, with greater reduction in antioxidant activity using the pan-frying
method.

70
Appendix A

71

72
REFERENCES
Adam S. K., Sulaiman N. A., Md Top A. G., and Jaarin K. 2007. Heating Reduces
Vitamin E Content in Palm and Soy Oils. J. Biochem. Molec. Biol. 15 (2): 76 – 79.
Ahmad J., Dolan K. and Mishra D. 2012. Chemical reaction kinetics pertaining to
food. In Handbook of food process design. Ahmad J. and Rahman M.S. (eds).
Blackwell. West susses, UK. pp 116 – 117.
Aladedunye F.A. and Przybylski R. 2011. Rapid Assessment of Frying Performance
Using Small Size Samples of Oils/Fats. J. Am. Oil Chem. Soc. 88: 1867 – 1873.
Al-hooti S.N., Zaghlol S., Al-omira H., Al-zanki S., Al-mazeedi H., Al-othman A.,
Al-sager J., and Al-mutawah Q. 2009. National Nutritional for the State of Kuwait.
Kuwait institute for science research.
Allouche Y., Jimenez A., Gaforio J. J., Uceda M. and Beltran G. 2007. How Heating
Affects Extra Virgin Olive Oil Quality Indexes and Chemical Composition. J. Agric.
Food Chem. 55: 9646 – 9654.
Andrikopoulos N.K., Kalogeropoulos N., Falirea A. and Barbagianni M. N. 2002.
Performance of virgin olive oil and vegetable shortening during domestic deep-frying
and pan-frying of potatoes. Int. J. Food Sci. Technol. 37: 177 – 190.
Azzi A., Cantoni O., Ozer N. Boscoboinik D. and Spycher S. 1996. The role of
hydrogen peroxide and RRR-alpha-tocopherol in smooth muscle cell proliferation.
Cell Death Differ. 3: 79 – 90.
Bail S., Stuebiger G., Krist S., Unterweger H. and Buchbauer G. 2008.
Characterisation of various grape seed oils by volatile compounds, triacylglycerol
composition, total phenols and antioxidant capacity. Food Chem. 108: 1122 – 1132.
Barrera-Arellano D., Ruiz‐Méndez V., Velasco J., Márquez‐Ruiz G. and Dobarganes
C. 2002. Loss of tocopherols and formation of degradation compounds at frying
temperatures in oils differing in degree of unsaturation and natural antioxidant
content. J. Sci. Food Agric. 82: 1696 – 1702.
Bansal G., Zhou W., Barlow P. J., Lo H. L. and Neo F. L. 2010. Performance of palm
olein in repeated deep frying and controlled heating processes. Food Chem. 121: 338
– 347.
Basu T.K. 1999. Potential Role of Antioxidant Vitamins. In Antioxidants in human
health and disease. Basu T. K., Temple N.J. and Garg M. L. (eds.). CAB
international. Wallingford, Oxon. UK. pp 15 – 26.

73
Bender D.A. 2009. The vitamins. In Introduction to human nutrition. Gibney M. J.,
Lanham-New S.A., Cassidy A. and Vorster H.H. (eds.), wiley-blackwell, Iowa, USA.
pp 132 – 187.
Bester E., Butinar B., Bučar-Miklavcic M. and Golob T. 2008. Chemical changes in
extra virgin olive oils from Slovenian Istra after thermal treatment. Food Chem. 108
(2): 446 – 454.
Brenes M., Garcia A., Dobarganes M. C., Velasco J. and Romero C. 2002. Influence
of Thermal Treatments Simulating Cooking Processes on the Polyphenol Content in
Virgin Olive Oil. J. Agric. Food Chem. 50: 5962 – 5967.
Boskou D., Tsimidou M. and Blekas G. 2006. Polar Phenolic Compounds. In Olive
oil chemistry and technology. Boskou D. (ed.). AOCS Press. Champaign, Il, USA. pp.
40 – 92.
Bramley P.M., Elmadfa I., Kafatos A., Kelly F. J., Manios Y., Roxborough H. E.,
Schuch W., Sheehy P .J. A. and Wagner K.H. 2000. Vitamin E. J. Sci. Food Agric. 80:
913 – 938.
Cachia O., El Benna J., Pedruzzi E., Descomps B., Gougerot-Pocidalo M. A. and
Leger C. L. 1998. α-Tocopherol Inhibits the Respiratory Burst in Human Monocytes.
J. Bio. Chem. 273: 32801 – 32805.
Chan A.C. 1998. Vitamin E and atherosclerosis. J. Nutr. 128: 1593 – 1596.
Cheung S.C.M., Szeto Y.T. and Benzie I.F. 2007. Antioxidant Protection of Edible
Oils. Plant Foods Hum. Nutr. 62: 39 – 42.
Chiavaro E., Rodriguez-Estrada M. T., Vittadini E. and Pellegrini N. 2010.
Microwave heating of different vegetable oils: Relation between chemical and
thermal parameters. Food Sci. Tech. 43: 1104 – 1112.
Colombo M.L. 2010. An Update on Vitamin E, Tocopherol and Tocotrienol—
Perspectives. Molecules.15: 2103 – 2113.
Corona G., Spencer J.P.E. and Dessi1M.A. 2009. Extra virgin olive oil phenolics:
absorption, metabolism, and biological activities in the GI tract. Toxical. Ind. Health.
25: 285 – 293.
Corsini M. S., Silva M. G. and Jorge N. 2009. Loss in tocopherols and oxidative
stability during the frying of frozen cassava chips. Grasas Y Aceites. 60 (1): 77 – 81.
74
Covas M.I., Nyyssonen K., Poulsen H.E., Kaikkonen J., Zunft H.F., Kiesewetter H.,
Gaddi A., Torre R., Mursu J., Baumler H., Nascetti S., Salonen J.T., Fito M., Virtanen
J. and Marrugat J. 2006. The Effect of Polyphenols in Olive Oil on Heart Disease
Risk Factors. Ann. Intern. Med. 145: 333 – 341.
Devaraj S. and Jialal I. 2005. Alpha-tocopherol decreases tumor necrosis factor-alpha
mRNA and protein from activated human. Free Radic. Biol. Med. 38: 1212 – 1220.
Devasagayam T., Tilak J.C., Boloor K. K., Sane K., Ghaskadbi S. and Lele R. 2004.
Free Radicals and Antioxidants in Human Health: Current Status and Future
Prospects. J. Assoc. Physicians India. 52: 794 – 804.
Douglas C.E., Chan A.C. and Choy P.C. Vitamin E inhibits platelet phospholipase A2.
1986. Biochim. Biophys. Acta. 876: 639 – 645.
Esterbauer H., Wag G. and Puhl H. 1993. Lipid peroxidation and its role in
atherosclerosis. Br. Med. Bull. 49: 566 – 576.
Ekstrom A.M., Serafini M., Nyren O., Hansson L. E., Ye W. and Wolk A. 2000.
Dietary Antioxidant Intake and the Risk of Cardia Cancer and noncardia Cancer of
the Intestinal and Diffuse Types A Population-Based Case-Control Study in Sweden.
Int. J. Cancer. 87: 133 – 140.
Freedman J.E., Farhat J. H., Loscalzo J. and Keaney J.F. 1996. α-Tocopherol Inhibits
Aggregation of Human Platelets by a Protein Kinase C–Dependent Mechanism.
Circulation. 94: 2434 – 2440.
Espin J.C., Soler-Rivas C. and Wichers H. J. 2000. Characterization of the Total Free
Radical Scavenger Capacity of Vegetable Oils and Oil Fractions Using 2,2-Diphenyl-
1-picrylhydrazyl Radical. J. Agric. Food Chem. 48: 648 – 656.
Fuhrman B. and Aviram M. 2002. Polyphenols and Flavonoids Protect LDL Against
Atherogenic Modifications. In hand book of antioxidants. Cadenas E. and Packer L.
(eds.). Marcel Dekker, Inc. New York, NY. USA. pp 303 – 336.
Galley H.F., Thornton J., Howdle P.D., Walker B.E. and Webster N.R. 1997.
Combination oral antioxidant supplementation reduces blood pressure. Clin Sci. 92:
361– 365.
Gimeno E., Castellote A.I., Lamuela-Raventos R.M., De la Torre M.C. and
Lopez-Sabater M.C. 2000. Rapid determination of vitamin E in vegetable oils by
reversed phase high-performance liquid chromatography. J. Chromatogr. A. 88:1 251
– 254.

75
Gropper S.S., Smith J.L. and Groff J.L. 2005. The Fat Soluble Vitamins. In advance
nutrition and human metabolism. Gropper S.S., Smith J.L. and Groff J.L. (eds.).
Wadsworth Belmont, CA, USA. pp 325 – 377.
Gomez-Alonso S., Fregapane G., Salvador M.D. and Gordon M.H. 2003. Changes in
Phenolic Composition and Antioxidant Activity of Virgin Olive Oil during Frying. J.
Agric. Food Chem. 51: 667 – 672.
Halliwell B. 2002. Food-Derived Antioxidants: How to Evaluate Their Importance in
Food and In Vivo. In Handbook of antioxidant. Madison Avenue, New York, NY. pp
1 – 46.
Harrison D.G., Gongora M.C., Guzik T.J. and Widder J. 2007. Oxidative Stress and
Hypertension. Hypertention. 1: 30 – 44.
Jialal I., Fuller C.J. and Huet B.A. 1995. The effect of alpha-tocopherol
supplementation on LDL oxidation: a dose-response study. Arterioscler. Thromb.
Vasc. Biol. 15: 190 – 198.
Jiang Q., Elson-Schwab I., Courtemanche C. and Ames B.N. 2000. γ-Tocopherol and
its major metabolite, in contrast to α-tocopherol, inhibit cyclooxygenase activity in
macrophages and epithelial cells. Proc. Natl. Acad. Sci. USA. 97: 11494 – 11499.
Kalantzakis G., Blekas G., Pegklidou K. and Boskou D. 2006. Stability and radical-
scavenging activity of heated olive oil and other vegetable oils. Eur. J. Lipid Sci.
Technol. 108: 329–335.
Kempna P., Reiter E., Arock M., Azzi A. and Zingg J.M. 2004. Inhibition of HMC-1
Mast Cell Proliferation by Vitamin E Involvement of the protein kinase B pathway.
Biol. Chem. 279: 50700 – 50709.
Khor H.T. and Ng T.T. 2000. Effects of administration of alpha-tocopherol and
tocotrienols on serum lipids and liver HMG CoA reductase activity. Int. J. Food Sci.
Nutr. 51: S3 – S11.
Kizhakekuttu T.J. and Widlansky, M. E. 2010. Natural Antioxidants and
Hypertension: Promise and Challenges. Cardiovasc. Ther. 28: e20 – e32.
Knekt P., Reunanen A., Javinen R., Seppanen R., Heliovaara M. and Aromaa A.1994.
Antioxidant Vitamin Intake and Coronary Mortality in a Longitudinal Population
Study. Am. J. Epidemiol. 139 (12): 1180 – 1189.
Larrauri J.A., Sanchez-Moreno C. and Saura-Calixto F. 1998. Effect of Temperature
on the Free Radical Scavenging Capacity of Extracts from Red and White Grape
Pomace Peels. J. Agric. Food Chem. 46: 2694 – 2697.

76
Li D., Devaraj S., Fuller C. Bucala, R.and Jialal I. 1996. Effect of alpha-tocopherol on
LDL oxidation and glycation: in vitro and in vivo studies. J Lipid Res. 37: 1978 –
1986.
Lu S.C. 2009. Regulation of glutathione synthesis. Mol. Aspects Med. 30: 42 – 59.
Madigan C., Ryan M., Owens D., Collins P. and Tomkin G.H. 2000. Dietary
Unsaturated Fatty Acids in Type 2 Diabetes: higher levels of postprandial lipoprotein
on a linoleic acid-rich sunflower oil diet compared with an oleic acid-rich olive oil
diet. Diabetes Care. 23: 1472 – 1477.
Manach C., Scalbert A., Morand C., Remesy C. and Jimenes L. 2004. Polyphenols:
food sources and bioavailability. Am. J. Clin. Nutr . 79: 727 – 747.
Marco E.D., Savarese M., Parisini C., Battimo I., Falco S. and Sacchi R. 2007.
Frying performance of a sunflower/palm oil blend in comparison with pure palm oil.
Eur. J. Lipid Sci. Technol. 109: 237 – 246.
Marrugat J., Covas M., Fito M., Schroder H., Miro-Casas E., Gimeno E., Lopez-
Sabater M.C., De la Torre R. and Farre M. 2004. Effects of differing phenolic content
in dietary olive oils on lipids and LDL oxidation A randomized controlled trial. Eur.
J. Nutr. 43: 140 – 147.
Miller E.R., Apple L.J. and Risby T.H. 1998. Effect of Dietary Patterns on Measures
of Lipid Peroxidation Results From a randomized clinical trial. Circulation. 98: 2390
– 2395.
Meydani M. 2001. Vitamin E and atherosclerosis: Beyond prevention of LDL
Oxidation. J. Nutr. 131: 366S – 368S.
Meydani S.N., Han S.N. and Wu D. 2005. Vitamin E and immune response in the
aged: molecular mechanisms and clinical implications. Immunol. Rev. 205: 269 – 284.
Meydani S.N., Meydani M., Blumberg J.B., Leka L.S., Siber G., Loszewski R.,
Thompson C., Pedrosa M.C., Diamond R.D. and Stollar B.D. 1997. Vitamin E
supplementation and in vivo immune response in healthy subjects: A randomized
controlled trial. JAMA. 277: 1380 – 1386.
Montonen J., Knekt P., Javinen R. and Reunanen A. 2004. Dietary antioxidant intake
and risk of type 2 diabetes. Diabetes Care. 27: 362 – 366.
Morris M.C., Evans D.A., Bienias J.L., Tangney C.C. and Wilson R.S. 2002. Vitamin
E and Cognitive Decline in Older persons. Arch. Neurol. 59: 1125 – 1132.

77
Nissiotis M.E. and Tasioula-Margari M. 2002. Changes in antioxidant concentration
of virgin olive oil during thermal oxidation. Food Chem. 77: 371 – 376.
Nolan J.J. 2006. What is type 2 diabetes?. Medicine. 34: 52 – 56.
Normand L., Eskin N.A.M. and Przybylski R. 2001. Effect of Tocopherols on the
Frying Stability of Regular and Modified Canola Oils. J. Am. Oil Chem. Soc. 78 (4):
369 – 373.
Owen R.W., Giacosa A., Hull W.E., Haubner R., Wurtele G., Spiegelhalder B. and
Bartsch H. 2000. Olive-oil consumption and health: the possible role of antioxidants.
Lancet. Oncol. 1: 107 – 112.
Owen R.W., Haubner R., Wurtele G., Hull E., Spiegelhalder B. and Bartsch H. 2004.
Olives and olive oil in cancer prevention. Eur. J. Cancer Prev. 13: 319 – 326.
Pellegrini N., Visioli F., Buratti S. and Brighenti F. 2001. Direct analysis of total
antioxidant activity of olive oil and studies on the influence of heating. J. Agric. Food
Chem. 49 (5): 2532 –2538.
Przybylski R., Mag T., Eskin N.A.M. and McDonald B.E. 2005. Canola oil. In
Bailey’s Industrial Oil and Fat Products. Shahidi F. (ed). John Wiley & Sons 61 –
121.
Psomiadou E., Tsimidou M. and Boskou D. 2000. α-Tocopherol Content of Greek
Virgin Olive Oils. J. Agric. Food Chem. 48: 1770 – 1775.
Quiles J.L., Ramıirez-Tortosa M.C., Gomez J.A., Huertas J.R. and Mataix J. 2002.
Role of vitamin E and phenolic compounds in the antioxidant capacity, measured by
ESR, of virgin olive, olive and sunflower oils after frying. Food Chem. 76: 461 – 468.
Ramirez-Tortosa M. C., Granados S. and Quiles J.L. 2006. Chemical Composition,
Types and Characteristics of Olive Oil. In Olive oil and health. Quiles J.L., Ramirez-
Tortosa M.C. and Yaqoob P. (eds.). CAB international. Cambridge, MA, USA. pp. 45
– 62.
Reaven P.D., Khouw A., Beltz W.F., Parthasarathy S. and Witztum J.L. 1993. Effect
of dietary antioxidant combinations in humans: protection of LDL by vitamin E but
not by β-carotene. Arterioscler. Thromb. 13: 590 – 600.
Redon J., Oliva M.R., Tomos C., Giner V., Chaves J., Iradi A. and Saez G.T. 2003.
Antioxidant Activities and Oxidative Stress Byproducts in Human Hypertension.
Hypertention. 41: 1096 – 1101.

78
Ricciarelli R., Tasinato A., Clement S., Ozer N.K., Boscoboinik D. and Azzi A. 1998.
α-Tocopherol specifically inactivates cellular protein kinase C alpha by changing its
phosphorylation state. Biochem. J. 334: 243 – 249.
Rimm E.B., Stampfer M. J., Ascherio A., Giovannucci E., Colditz G.A. and Willett
W.C. 1993. Vitamin E consumption and the risk of coronary heart disease in men. N.
Engl. J. Med. 328: 1450 – 1456.
Ruhe R.C. and McDonald R.B. 2001. Use of Antioxidant Nutrients in the Prevention
and Treatment of Type 2 Diabetes. J. Am. Coll. Nutr. 20: 363S – 369S.
Romero N., Ropert P., Masson L., Ortiz J., Gonzalez K., Tapia K. and Dobaganes C.
2007. Effect of a-tocopherol, a-tocotrienol and Rosa mosqueta shell extract on the
performance of antioxidant-stripped canola oil (Brassica sp.) at high temperature.
Food Chem. 104: 383 – 389.
Ross R. 1999. Atherosclerosis – an inflammatory disease. N. Engl. J. Med. 340: 115 –
126.
Sabliov C.M., Astete C.E., Astete C.E., Khachaturyan M., Khachatryan L. and
Leonardi C. 2009. Effects of Temperature and UV Light on Degradation of a-
Tocopherol in Free and Dissolved Form. J. Am. Oil Chem. Soc. 86: 895 – 902.
Salonen J.T., Nyyssoenen K., Tuomainen T-P., Maenpaa P. H. Korpela H., Kaplan
G.A., Lynch J., Helmrich S.P. and Salonen R. 1995. Increased risk of non-insulin
dependent diabetes mellitus at low plasma vitamin E concentrations: a four year
follow up study in men. BMJ. 311: 1124 – 1127.
Schroeder M.T., Becker E.M. and Skibsted L.H. 2006. Molecular Mechanism of
Antioxidant Synergism of Tocotrienols and Carotenoids in Palm Oil. J. Agric. Food
Chem. 54: 3445 - 3453.
Serafini M., Bellocco R., Wolk A. and Ekstrom A.M. 2002. Total Antioxidant
Potential of Fruit and Vegetables and Risk of Gastric cancer. Gastroenterology. 123:
985 – 991.
Servili M., Esposto S., Fabiani R., Urbani S., Taticchi A., Mariucci F., Selvaggini R.
and Montedoro G.F. 2009. Phenolic compounds in olive oil: antioxidant, health and
organoleptic activities according to their chemical structure. Inflammopharmacology.
17: 76–84
Sharayei P., Farhoosh R., Poorazrang H., Khodaparast M.H.H. 2011. Effect of Bene
Kernel Oil on the Frying Stability of Canola Oil. J. Am. Oil Chem. Soc. 88: 647 – 654.
Simonne A.H. and Eitenmiller R.R. 1998. Retention of Vitamin E and Added Retinyl
Palmitate in Selected Vegetable Oils during Deep-Fat Frying and in Fried Breaded

79
Products. J. Agric. Food Chem. 46: 5273 – 5277.
Singh R.B., Rastogi S.S., Verma R., Laxmi B, Singh R., Ghosh S. and Niaz M.A.
1992. Randomised controlled trial of cardioprotective diet in patients with recent
acute myocardial infarction results of one year follow up. BMJ. 304: 1015 – 1019.
Siro I., Fenyvesi E., Szente L., De Meulenaer B., Devlieghere F., Orgovanyi J., Senyi
J. and Barta J. 2006. Release of alpha-tocopherol from antioxidative low-density
polyethylene film into fatty food simulant: Influence of complexation in beta-
cyclodextrin. Food Addit. Contam. 23 (8): 845 – 853.
Stampfer M.J., Hennekens C.H., Manson J.E., Colditz G.A., Rosner B. and Willett
W.C. 1993. Vitamin E consumption and the risk of coronary disease in women. N.
Engl. J. Med. 328: 1444 – 1449.
Stephens N.G., Parsons A., Schofield P.M., Kelly F., Cheeseman K., Mitchison M.J.
and Brown M.J. 1996. Randomised controlled trial of vitamin E in patients with
coronary disease: Cambridge Heart Antioxidant Study (CHAOS). Lancet. 347: 781 –
786.
Su Y-L, Xu J-Z., Ng C., Leung L., Huang Y. and Chen Z-Y. 2004. Antioxidant
Activity of Tea Theaflavins and Methylated Catechins in Canola Oil. J. Am. Oil
Chem. Soc. 81: 269 – 274.
Suzukawa M., Abbey M., Clifton P. and Nestel P. J. 1994. Effects of supplementing
with vitamin E on the uptake of low density lipoprotein and the stimulation of
cholesteryl ester formation in macrophages. Atherosclerosis. 110: 77 – 86.
Tran K., Proulx P.R. and Chan A.C. 1994. Vitamin E suppresses diacylglycerol
(DAG) level in thrombin-stimulated endothelial cells through an increase of DAG
kinase activity. Biochim. Biophys. Acta. 1212: 193 – 202.
Tse W.Y., Maxwell S.R., Thomason H., Blann A., Thorpe G.H., Waite M. and Holder
R. 1994. Antioxidant status in controlled and uncontrolled hypertension and its
relationship to endothelial damage. J. Hum. Hypertens. 8 (11): 843 – 849.
U.S. Department of Agriculture. 2000. Vitamin E. In Dietary reference intake for
energy, carbohydrate, fiber, fat, fatty acids, cholesterol, protein, and amino acids
(macronutrients). National Academy press. Washington, D.C. pp 186 – 283.
U.S. Department of Agriculture. 2011. National nutritional Database for standard
reference, release 24.
http://ndb.nal.usda.gov/ndb/foods/list
U.S. Department of Agriculture. 2010. United States Standards for Grades of Olive oil
and Olive –pomace oil.

80
http://www.ams.usda.gov/AMSv1.0/getfile?dDocName=STELDEV3011889
Valantina S.R., Sahayaraj P.A. and Prema A.A. 2010. Antioxidant Stability In Palm
and Rice Bran Oil Using Simple Parameters. Rasayan J. Chem. 3: 44 – 50.
Valavanidis A., Nisiotou C., Papageorgiou Y., Kremli I., Satravelas N., Zinieris N.
and Zygalaki H. 2004. Comparison of the Radical Scavenging Potential of Polar and
Lipidic Fractions of Olive Oil and Other Vegetable Oils under Normal Conditions and
after Thermal Treatment. J. Agric. Food Chem. 52: 2358 – 2365.
Valko M., Leeibfritz D., Moncol J., Cronin M.T.D., Mazur M. and Telser J. 2007.
Free radicals and antioxidants in normal physiological functions and human disease.
Int. J. Biochem Cell Biol. 39: 44 – 84.
Vikram D.S, Rivera B.K. and Kuppusamy P. 2010. In vivo imaging of free radicals
and oxygen. Methods Mol. Biol. 610: 3 – 27.
Visioli F. and Galli C. 1998. The Effect of Minor Constituents of Olive Oil on
Cardiovascular Disease: New Findings. Nutr. Rev. 56 (5): 142 – 147.
Wen Y., Killalea S., McGettigan P. and Feely J. 1996. Lipid peroxidation and
antioxidant vitamins C and E in hypertensive patients. Ir. J. Med. Sci. 165: 210 – 212.
Weinbrenner T., Fito M., De la Torre R., Saez G.T., Rijken P., Tormos C., Coolen S.,
Albaladejo M.F., Abanades S., Schroder H., Marrugat J. and Covas M-I. 2004. Olive
Oils High in Phenolic Compounds Modulate Oxidative/Antioxidative Status in Men.
J. Nutr. 134: 2314–2321.
Whitney E. and Rolfes S.R. 2009a. The fat soluble vitamins. In Understanding
nutrition. Whitney E. and Rolfes S.R. (eds.).Wadsworth. Beltmont, CA. USA. pp 354
– 376.
Whitney E. Rolfes S.R. 2009b. The water soluble vitamins. In Uderstanding nutrition.
Whitney E. and Rolfes S.R. (eds.).Wadsworth. Beltmont, CA. USA. pp 310 – 353.
Win H.Y. 2008. Role of protein kinase C-iota in prostate cancer. ProQuest.