effect of groove shape on flow characteristics around a
TRANSCRIPT

©2004 The Visualization Society of Japan and Ohmsha, Ltd. Journal of Visualization, Vol. 7, No. 3 (2004) 209-216
Effect of Groove Shape on Flow Characteristics around a Circular Cylinder with Grooves
Yamagishi, Y. *1 and Oki, M.*
2
*1 Department of Mechanical Engineering, Kanagawa Institute of Technology, 1030 Shimoogino, Atugi-shi, Kanagawa 243-0292, Japan.
E-mail:[email protected] *2 School of High-Technology for Human Welfare, Tokai University, 317 Nishino, Numazu-shi, Shizuoka
410-0395, Japan.
Received 30 January 2004 Revised 1 April 2004
Abstract : In the flow around a circular cylinder, a sudden decrease in the drag force occurs at a high Reynolds number, but the same phenomenon occurs at a lower Reynolds number in the case where there exist grooves or roughness on the circular cylinder surface. In this paper, in order to make clear the flow characteristics around a circular cylinder in the case of changing the shapes of grooves, the drag coefficient, pressure distribution, velocity distribution and turbulent distribution were measured. Moreover the flow around the cylinder was analyzed by applying the RNG k - � turbulent model, and the surface flow pattern was investigated using the oil-film technique. From these results, it is clear that the drag coefficient of a circular cylinder with triangular grooves decreases by about 15% compared with that of a circular cylinder with arc grooves.
Keywords : Circular Cylinder with Grooves, Flow Characteristics, Drag Coefficient, Flow Visualization, Numerical Analysis.
1. Introduction In the case of a circular cylinder in uniform flow, a sudden decrease in the drag force occurs at a high Reynolds number Re =3x10⁵, but it is known that the same phenomenon occurs at a lower Reynolds number in the case where there exist grooves or roughness on the circular cylinder surface. Such a drag reduction phenomenon can be applied to a vessel, an airplane, an electricity line, etc. for improving energy efficiency, or reducing the wind load.
A cylinder with roughness was examined experimentally by Achenbach and others (Achenbach, 1971 and Achenbach et al., 1981) and Adachi and others (Adachi et al., 1989). A cylinder with grooves was examined by Oki and others (Oki et al., 1994 and Oki et al., 1999), Lee and others (Lee et al., 1996) and Kimura and others (Kimura et al., 1991) and a flat plate and a sphere with grooves were examined by Aoki and others (Aoki et al., 2000 and Aoki et al., 2003). However, the effect of changing the shape of the grooves on the flow characteristics around a circular cylinder has yet to be completely clarified.
The purpose of this study is to investigate the mechanism underlying the flow of two cylinders with triangular grooves and arc grooves placed at the same intervals in the vertical direction using experiments, numerical analysis and visualization.

Effect of Groove Shape on Flow Characteristics around a Circular Cylinder with Grooves
210
2. Experimental Apparatus and Method 2.1 Experimental apparatus Figure 1(a) shows the circular cylinder with grooves used for this experiment. The circular cylinder with grooves is made of aluminum and is 420 mm in length and 48 mm in diameter. The triangular grooves and arc grooves of 3.6 mm in width and 0.5 mm in depth were attached to the surface of each circular cylinder at intervals of 11.25° in the vertical direction, and the number of grooves was 32, as shown in Figs.1 (b) and (c). Pressure holes 0.7mm in diameter were made on the convex and concave parts of the middle section 210mm from the end of the circular cylinder with grooves.
(A-A section)
(a) Circular cylinder with grooves (b) Triangular grooves (c) Arc grooves
Fig. 1. Shape of grooves and location of the pressure holes (Unit : mm).
A schematic diagram of the experimental apparatus is shown in Fig.2. The experiments were conducted in a 400mm x 400mm wind tunnel. The wind tunnel is a circulating type, with a turbulence intensity of about 0.65% and a maximum speed of around 35 m/s. The circular cylinder is placed vertically in the measuring section of the wind tunnel. The flow around the circular cylinder was examined for Reynolds numbers Re=Ud/� (d : diameter of cylinder, U : uniform flow velocity, � : kinematics viscosity) ranging from 1x10⁴ to 1x10⁵ .
Fig. 2. Experimental apparatus.
2.2 Measurement and visualization The drag is obtained from changing the momentum in front of and behind the cylinder. Measurements of the velocity were made using an IHW hot-wire anemometer by moving the hot-wire probe in the y-axis direction. The output signals were digitized on a personal computer. Previously, the drag coefficients CD of the smooth circular cylinder were obtained using this drag measurement method. Confirming that these drag coefficients CD equal the drag coefficients of a smooth cylinder shown by Wieselsberger (Wieselsberger, 1921), the drag coefficients CD of the circular cylinder with grooves were obtained.
The circular cylinder is placed vertically in the measuring section of the wind tunnel and the convex part is set facing the direction of flow. The difference in pressure between the surface pressure of the circular cylinder and the static pressure of the tunnel wall was measured using a digital manometer and imported into a personal computer.
For visualization, the surface of the circular cylinder was painted black and covered by a white

Yamagishi, Y. and Oki, M.
211
oil-film that was dissolved in a solution of titanium oxide composed of liquid paraffin and olein-acid. The photographs of the circular cylinder surface were taken using a digital camera.
3. Numerical Analysis The numerical analysis was performed using the versatile fluid analysis software package Fluent 6.1 using the finite volume method. The analysis was made in unsteady two-dimensional turbulent flow. The RNG k–� model was used as a turbulent model.
A complete view of the mesh is shown in Fig.3. The boundary conditions are listed in Table 1.
Table 1. Boundary conditions.
Fig. 3. Whole meshes (Grid number=9x10
4).
4. Results and Consideration 4.1 Drag coefficient The drag coefficient CD is given from the result of drag measurements. Figure 4 shows the variations in the drag coefficients CD with the Reynolds number Re for cylinders with grooves.
Fig. 4. Drag coefficient of circular cylinders with grooves and a smooth cylinder.
The measurement by Wieselsberger (Wieselsberger, 1921) on a smooth cylinder is also
included for comparison. From this figure, the experimental value for the smooth cylinder agrees with the measurement of Wieselsberger (Wieselsberger, 1921) in the range of Reynolds numbers Re =1x10⁴ ~ 1x10⁵. The drag coefficient CD for the cylinder with triangular grooves falls abruptly to a minimum value of about 0.59 at a Reynolds number Re =4x10⁴, and then increases slightly, reaching a constant value of about 0.8. It is clear that the drag coefficient CD for a circular cylinder with triangular grooves decreases by about 15% compared with a circular cylinder with arc grooves in the range of the supercritical and hypercritical region from the critical region. Moreover, the results of numerical analysis show a tendency to agree well with the experimental values.

Effect of Groove Shape on Flow Characteristics around a Circular Cylinder with Grooves
212
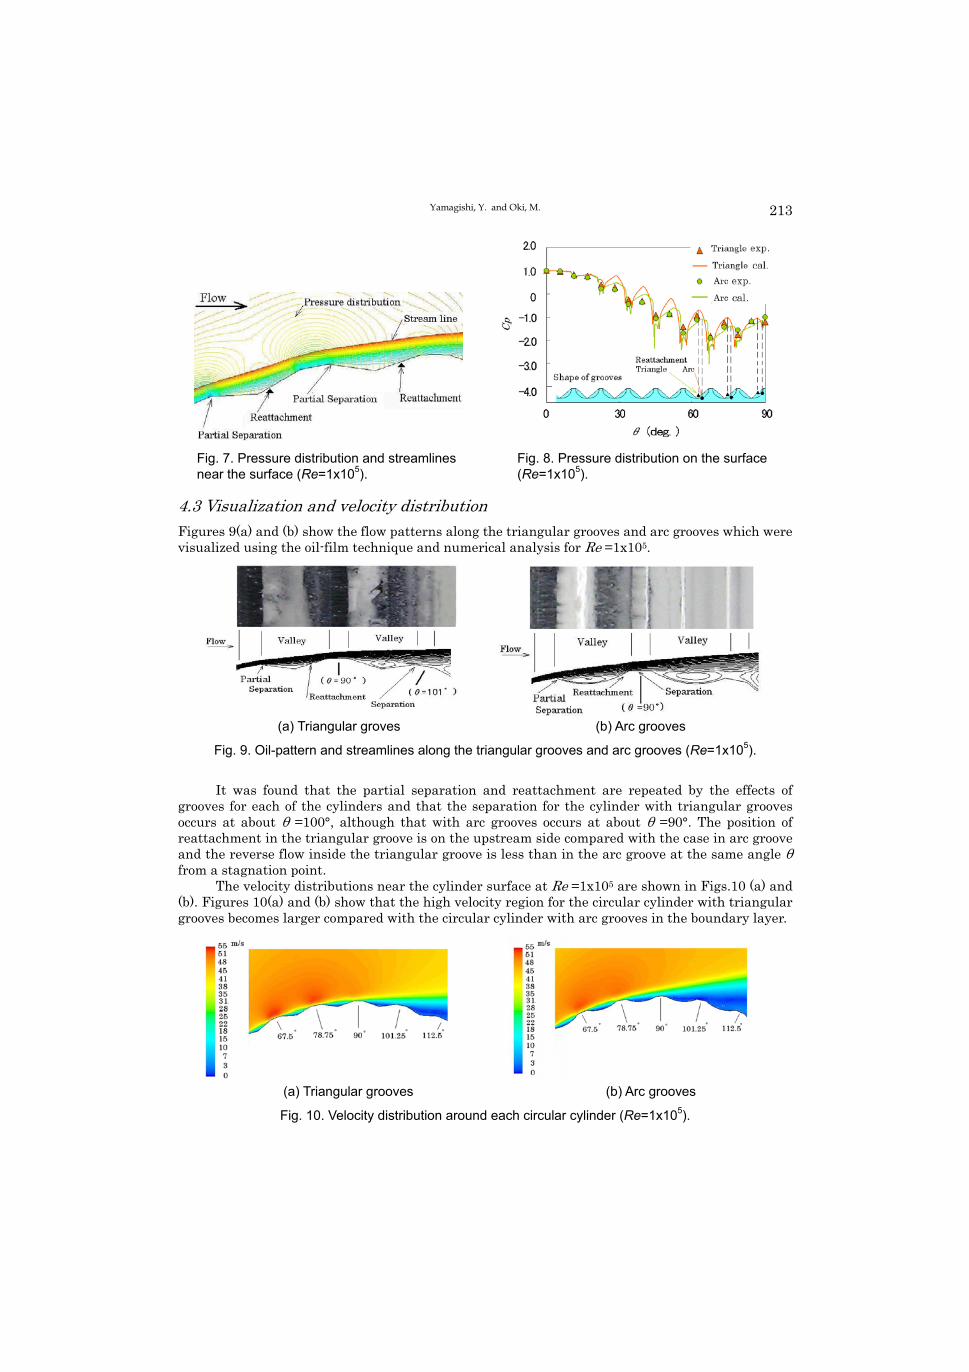
4.2 Pressure distribution The computational results of the pressure coefficient Cp distributions near the cylinder surface at Re =1x10⁵ are shown in Figs.5 (a) and (b). From these results, it is clear that the pressure coefficient in the convex part of the circular cylinder with triangular grooves becomes smaller compared with that of the circular cylinder with arc grooves.
The computational and experimental results of the pressure coefficients Cp on the cylinder surface at Re =1x10⁵ are shown in Fig.6. The ordinate shows the pressure coefficients Cp and the abscissa shows the angle � from the stagnation point. The results of the numerical analysis show a tendency to agree well with the experimental values. From the cylinders with triangular grooves and arc grooves in the upstream (� =0~90°), it was found that the values of Cp change periodically, the pressure becomes large in the concave and small in the convex grooves. The backpressure coefficient Cpb in the downstream becomes almost constant.
(a) Triangular grooves (b) Arc grooves
Fig. 5. Pressure distribution near each circular cylinder (Re=1x10⁵).
Fig. 6. Pressure distribution on each circular cylinder (Re=1x10
5).
The computational results of the pressure distribution and streamlines near the surface of the
triangular grooves for Re =1x10⁵ (as in Fig.6) are shown in Fig.7. This figure shows the state of the streamlines along the surface of the cylinder. They are separated into parts in the convex part of the groove and reattach in the concave part of the groove. It was found that the position of reattachment is located near the point of maximum pressure from the pressure distribution.
Figure 6 focuses on the details of the pressure coefficient distribution for the cylinder with each groove in the upstream side shown in Fig.8. From Fig.8, it is clear that the flow around the cylinders with triangular grooves and arc grooves display repeating partial separation and reattachment from upstream of the grooves to downstream; the reattachment position in the concave part of the groove shifts to the downstream side in the concave part of the groove. It is also clear that in the groove of the same angle from the stagnation point, the reattachment position of the cylinder with the triangular grooves is located on the upstream side compared with that of the arc grooves in the concave part of the groove.
Yamagishi, Y. and Oki, M.
213
Fig. 7. Pressure distribution and streamlines Fig. 8. Pressure distribution on the surface
near the surface (Re=1x10⁵). (Re=1x10
5).
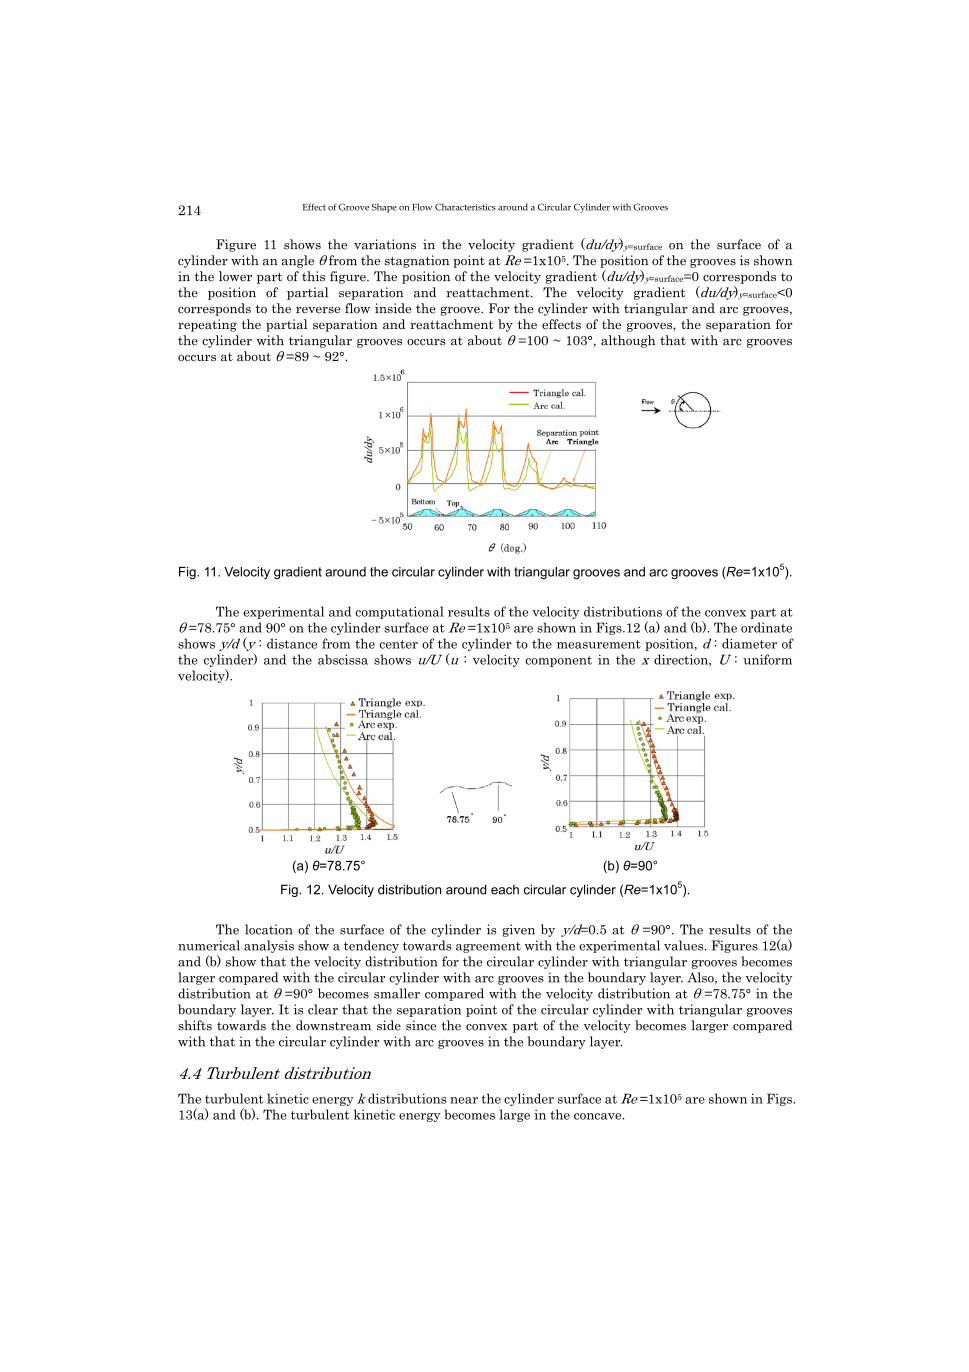
4.3 Visualization and velocity distribution Figures 9(a) and (b) show the flow patterns along the triangular grooves and arc grooves which were visualized using the oil-film technique and numerical analysis for Re =1x10⁵.
(a) Triangular groves (b) Arc grooves
Fig. 9. Oil-pattern and streamlines along the triangular grooves and arc grooves (Re=1x10⁵).
It was found that the partial separation and reattachment are repeated by the effects of
grooves for each of the cylinders and that the separation for the cylinder with triangular grooves occurs at about � =100°, although that with arc grooves occurs at about � =90°. The position of reattachment in the triangular groove is on the upstream side compared with the case in arc groove and the reverse flow inside the triangular groove is less than in the arc groove at the same angle � from a stagnation point.
The velocity distributions near the cylinder surface at Re =1x10⁵ are shown in Figs.10 (a) and (b). Figures 10(a) and (b) show that the high velocity region for the circular cylinder with triangular grooves becomes larger compared with the circular cylinder with arc grooves in the boundary layer.
(a) Triangular grooves (b) Arc grooves
Fig. 10. Velocity distribution around each circular cylinder (Re=1x10⁵).
Effect of Groove Shape on Flow Characteristics around a Circular Cylinder with Grooves
214
Figure 11 shows the variations in the velocity gradient (du/dy)y=surface on the surface of a cylinder with an angle � from the stagnation point at Re =1x10⁵. The position of the grooves is shown in the lower part of this figure. The position of the velocity gradient (du/dy)y=surface=0 corresponds to the position of partial separation and reattachment. The velocity gradient (du/dy)y=surface<0 corresponds to the reverse flow inside the groove. For the cylinder with triangular and arc grooves, repeating the partial separation and reattachment by the effects of the grooves, the separation for the cylinder with triangular grooves occurs at about � =100 ~ 103°, although that with arc grooves occurs at about � =89 ~ 92°.
Fig. 11. Velocity gradient around the circular cylinder with triangular grooves and arc grooves (Re=1x10
5).
The experimental and computational results of the velocity distributions of the convex part at
� =78.75° and 90° on the cylinder surface at Re =1x10⁵ are shown in Figs.12 (a) and (b). The ordinate shows y/d (y : distance from the center of the cylinder to the measurement position, d : diameter of the cylinder) and the abscissa shows u/U (u : velocity component in the x direction, U : uniform velocity).
(a) �=78.75° (b) �=90°
Fig. 12. Velocity distribution around each circular cylinder (Re=1x10⁵).
The location of the surface of the cylinder is given by�y/d=0.5 at � =90°. The results of the
numerical analysis show a tendency towards agreement with the experimental values. Figures 12(a) and (b) show that the velocity distribution for the circular cylinder with triangular grooves becomes larger compared with the circular cylinder with arc grooves in the boundary layer. Also, the velocity distribution at � =90° becomes smaller compared with the velocity distribution at � =78.75° in the boundary layer. It is clear that the separation point of the circular cylinder with triangular grooves shifts towards the downstream side since the convex part of the velocity becomes larger compared with that in the circular cylinder with arc grooves in the boundary layer.
4.4 Turbulent distribution The turbulent kinetic energy k distributions near the cylinder surface at Re =1x10⁵ are shown in Figs. 13(a) and (b). The turbulent kinetic energy becomes large in the concave.

Yamagishi, Y. and Oki, M.
215
(a) Triangular grooves (b) Arc grooves
Fig. 13. The turbulent kinetic energy distribution around each circular cylinder (Re=1x10⁵).
The experimental results of the turbulent distribution ut/U (ut :turbulent velocity component in
the x direction) and the computational results of the turbulent kinetic energy distribution k /U 2 of the convex part at � =73.1° on the cylinder surface at Re =1x10⁵ are shown in Fig.14 and Fig 15. The tendency of the turbulent distribution and the turbulent kinetic energy distribution is well in agreement.
Fig. 14. Turbulent distribution in the Fig. 15. Turbulent kinetic energy distribution
concave part at �=73.1°(Re=1x10⁵). in the concave part at �=73.1°(Re=1x10
5).
5. Conclusions The results of experiments and numerical analysis around cylinders with grooves lead to the following conclusions: (1) The drag coefficient CD for circular cylinder with triangular grooves decreases by about 15% compared with circular cylinder with arc grooves. (2) From the pressure distribution, the position of reattachment in the groove was found to be located near the value of maximum pressure. (3) The position of reattachment for the triangular groove exists on the upstream side compared with that for arc groove and the reverse flow inside triangular groove is less than that for arc groove at the same angle � from a stagnation point. (4) For the cylinder with triangular and arc grooves, repeating the partial separation and reattachment by the effects of grooves, the separation for the cylinder with triangular grooves occurs at about � =100 ~ 103° although that with arc grooves occurs at about � =89 ~ 92°. (5) It was found that the separation point of the circular cylinder with triangular grooves shifts to the downstream side since the turbulent kinetic energy becomes large in the concave beyond � = 90°.

Effect of Groove Shape on Flow Characteristics around a Circular Cylinder with Grooves
216
References Achenbach, E., Influence of surface roughness on the cross-flow around a circular cylinder, Journal of Fluid Mechanics,
46-2(1971), 321-335. Achenbach, E. and Heinecke, E., On vortex shedding from smooth and rough cylinders in the range of Reynolds numbers 6x10³
to 5x10⁶, Journal of Fluid Mechanics, 109(1981), 239-251. Adachi, T., Ono, H., Matsuuchi, K., Kawai, T. and Cho, T., Flow around a circular cylinder in the high Reynolds number range,
Transactions of the Japan Society of Mechanical Engineers (in Japanese), 55- 511, B(1989), 685-692. Aoki, K., Okanaga, H. and Nakayama, Y., Control of Boundary Layer on a Flat Plate by Means of Cavity Flow, Journal of
Visualization, 3-3(2000),211-220. Aoki, K., Ohike, A., Yamaguchi, K. and Nakayama, Y., Flying Characteristics and Flow Pattern of a Sphere with Dimples,
Journal of Visualization, 6-1(2003),67-76. Kimura, T. and Tsutahara, M., Fluid dynamic effects of grooves on circular cylinder surface. AIAA J., 29-12(1991), 2062-2068. Lee, S., Aoki, K., Okanaga, H. and Oki, M., The flow pattern and characteristics around a rotating circular cylinder with
grooves, Proc. of the 4th Asian Symp. on Visualization, Beijing, (1996), 613-618. Oki, M., Suehiro, M., Okanaga, H., Aoki, K. and Nakayama, Y., Effect of grooves’ depth on circular cylinder, FLUCOME’94,
Toulouse, (1994), 811-816. Oki, M., Aoki, K. and Nakayama, Y., Effect of grooves’ depth for flow characteristics around a circular cylinder with grooves,
Transaction of the Japan Society of Mechanical Engineering (in Japanese), 65-631, B(1999), 870-875. Wieselsberger, C., Phys. Z., 22(1921), 321.
Author Profile Yoichi Yamagishi : He received his M.Sc. (Eng.) degree in Mechanical Engineering in 1978 from Tokai University. After obtaining M.Sc. he worked as an engineer at Hibiya Engineering, Ltd. He then became a research assistant of Kanagawa Institute of Technology. His current research interests are experimental and computational fluid dynamics. Makoto Oki : He received his M.Sc. (Eng.) degree in Mechanical Engineering in 1976 from Tokai University and his Ph.D. in Mechanical Engineering in 2000 from the same university. After obtaining M.Sc. he worked as a system engineer at Japan Advanced Numerical Analysis, Inc.. He then became a assistant professor of Tokai University, and currently is a associate professor. His current research interests are computational fluid dynamics, computer graphics and internet application.