effect of frictional heat generation on the temperature...
TRANSCRIPT

Journal of Mechanical Science and Technology 31 (3) (2017) 1477~1487
www.springerlink.com/content/1738-494x(Print)/1976-3824(Online) DOI 10.1007/s12206-017-0247-5
Effect of frictional heat generation on the temperature distribution in
roller linear motion rail surface† De-Jun Cheng1, Je-Hong Park1, Jeong-Se Suh1, Su-Jin Kim1,* and Chun-Hong Park2
1Department of Mechanical Engineering, Gyeongsang National University, Jinju, Korea 2Korea Institute of Machinery & Materials, Daejeon, Korea
(Manuscript Received January 4, 2016; Revised August 16, 2016; Accepted October 24, 2016)
----------------------------------------------------------------------------------------------------------------------------------------------------------------------------------------------------------------------------------------------------------------------------------------------
Abstract The temperature distribution in roller Linear motion (LM) rail surface heated with moving frictional heat source was investigated ex-
perimentally and numerically. The operating conditions which had not been regarded by previous research, such as the type of the LM guide and operating temperature, were taken into account for improving the previous model of friction force. Frictional heat generation model and heat partitioning coefficient were proposed to calculate the heat transferred to the LM rail. The numerical solutions were cal-culated in combining a heat conduction equation and the rate of frictional heat flowing into the rail. Frictional heat generation model and heat partitioning coefficient were verified by comparing experimental and numerical results. Simulation results showed that smaller LM block size or higher velocity leads to the higher temperature distribution in the rail surface. Results also indicated that larger motion stroke results in a lower and wider temperature distribution in the rail surface.
Keywords: Roller linear motion guide; Moving frictional heat source; Frictional heat generation; Numerical solution; Temperature distribution ---------------------------------------------------------------------------------------------------------------------------------------------------------------------------------------------------------------------------------------------------------------------------------------------- 1. Introduction
In the operation of machine tools, temperature rise has an important effect on the accurate positioning of a Linear mo-tion (LM) guide system [1]. Roller LM guides using rollers have many advantages, such as high stiffness, smooth motion and long-term maintenance-free operation. However, there is friction force between LM block and rail, and thus, heat due to friction affects the temperature rise and accurate positioning in an LM guide system. Therefore, it is important to predict the heat generation and the temperature rise of the roller LM guide system under different operating conditions.
Ramesh et al. [2] analyzed the thermal behavior of a three-axis vertical machining center under the influence of various operating conditions, such as spindle speed, external load and federate. Some researchers also have dealt with the thermal behavior of machine tool structures, spindles, linear motors, ball screw systems [3-9]. In the course of these researches, the Finite element method (FEM) and the Finite difference method (FDM) have often been employed to estimate the thermal behavior of machine tool.
Some authors also have already solved different kinds of bearing thermal problem, such as railroad tapered-roller bear-
ing, railroad bearing and ball bearing, using analytical method [10-13]. The computational methods used in these works are helpful for determination of heat generation rate and tempera-ture distribution. In contrast to the thermal analysis of the above bearings, the thermal analysis of the roller LM guide has not been addressed thoroughly. There is little research on the thermal behavior of the LM guide. Hence, only a few ex-perimental and theoretical investigations are available to assist the designers.
This study analyzes numerical solutions of the temperature distribution in roller linear motion rail surface heated with a periodically moving frictional heat source. The operating con-ditions, which have not been considered by previous research, such as the type of the LM guide system and temperature, are taken into account for improving the previous model of fric-tion force. Then a numerical model for prediction of frictional heat generation is developed with consideration of the im-proved friction model, which can be used to calculate the heat generation rate of roller linear motion guide. To predict the surface temperature distribution, the heat partitioning coeffi-cient is defined as a constant value to calculate the portion of frictional heat transferred to the LM rail. The numerical solu-tions of temperature distribution are calculated in combining a heat conduction equation and the rate of frictional heat flow-ing into the LM rail. To validate the numerical results, ex-periments were performed on a roller linear motion guide
*Corresponding author. Tel.: +82 55 772 1636, Fax.: +82 55 772 1577 E-mail address: [email protected]
† Recommended by Associate Editor Chang Yong Park © KSME & Springer 2017

1478 D.-J. Cheng et al. / Journal of Mechanical Science and Technology 31 (3) (2017) 1477~1487
system for different moving speeds and models. Further simu-lations investigated the importance of different parameters on the temperature distribution response of the roller LM rail surface.
2. Experiment
2.1 Measurement of friction force
To investigate the frictional behavior of the roller LM guide in response to different operating conditions, a friction meas-urement system was created to measure the friction force [14]. Fig. 1 shows a schematic of the roller LM guide and Fig. 2 plots of the experimental setup for measuring friction force of roller linear motion guide.
In this measurement system, a symmetry LM guide system was used to measure the friction force. The double rails and four blocks were fixed by using a vise and the external load was given by rotating vise handle. To measure the applied external load, compression load cell (CAS C1E-2TS) was placed on the LM block for adjustment of the external load (load capacity: 2000 kgf). The measurement of friction force was realized using a tension load cell between the LM rail and NC machine. The load cell had a rated capacity of 10 kgf un-der tensile compression loads. The accuracy class of the fric-tion force measurements was C3 (combined error ≤±0.02 %FS). A data acquisition system was used to measure the force continuously when the system was working and these data were sent directly to the computer.
2.2 Measurement of temperature rise
To investigate the thermal behavior of a roller linear motion guide, a test rig was designed and constructed. The rig was designed for installing double roller LM guides to operate at variable speeds and external loads. In our temperature meas-urement method, a symmetry LM guide system was used to measure the temperature rise. Then, the bottom of LM rail can be considered as insulation. But in a real machine tool, the LM rail is fixed on the machine bed and the LM block is used to support machining table. This working system was different from our experiment method. Fig. 3 shows the graph of roller LM guide temperature measurement method. The compres-sion load cell was put on the LM block. The external load was given by rotating the vise handle, which was measured di-rectly by compression load cell (CAS C1E-2TS). The LM rail and L-clamp were connected by one-handed clamp, which was moved by NC machine. Furthermore, the steady state LM rail velocity was also controlled by NC machine.
The temperature rise of the roller LM rail surface was measured by using T- type thermocouples that have an accu-racy of ± 0.5 °C. Moreover, RS Pro thermo attachment pads were used for attaching small thermocouples to the roller LM rail surface. Fig. 2 shows the positions where the temperatures on the roller LM rail surface were measured. Thermocouples 1 and 2 monitored the surface temperature distributions at the
location of spots 1 and 2, respectively; thermocouple 3 was located at spot 3 and measured surface temperature of the LM rail. Two T-type thermocouples were used to measure the ambient temperature approximately 1.5 m away from the LM guide. The thermocouples were connected to a data acquisi-tion system, which was connected to the controller through the GL220 interface. Thermocouple data were set at a sampling rate of 50 Hz and the temperatures were measured every 5 s during motion. Table 1 indicates the experimental equipment.
3. Uncertainty analysis
Measurement error can be handled in two types of experi-mental errors: Random and systematic. Random errors are evaluated using statistical methods, while systematic error can be reduced by means of calibration. Error analysis is the de-termination of the systematic and random errors in the ex-perimental results. In the experiment study the uncertainty analysis method proposed by Taylor [18] was used.
Uncertainty analysis of measuring friction force can be de-fined by calculating the standard deviation. For a set of N
Fig. 1. Schematic of the roller linear motion guide.
Fig. 2. Plots of the experimental setup for measuring friction force of roller linear motion guide [14].

D.-J. Cheng et al. / Journal of Mechanical Science and Technology 31 (3) (2017) 1477~1487 1479
measured values for some quantity x, the mean of x is repre-sented by the symbol <x>, then, the standard deviation of the measured values is represented by the symbol σx and is given by the formula:
( )2
1
11
N
ii
x xN
s=
= -- å . (1)
Uncertainty analysis of measuring temperature was defined
by calculating percent difference. The difference between the measured values E1 and E2 is expressed as a fraction the aver-age of the two values. The equation to use to calculate the percent difference is:
1 2
1 2
100 %
2
E EDifference
E E-
= ´+æ ö
ç ÷è ø
. (2)
4. Numerical analysis
4.1 Improvement of friction force model
To follow the real friction behavior of the roller LM guide more accurately, the previous model for friction force was improved and validated by experiments. The operating condi-tions, which were not regarded by previous research, such as the type of the LM guide and operating temperature, were taken into account for improving the previous model of fric-tion force.
From THK catalog (Sec. A-1 pp. 412-441), the type of the LM guide can be represented by standard LM block length Lb
[16]. Fig. 4 shows the relationship between the type of the LM guide and friction force under C1 (2.5 μm) preload. It can be seen clearly that the friction force increases as the LM guide size increases, because the contacting area increases along with the increase of model size.
In Fig. 5, the experimental results from different operating temperatures are compared. It can be seen from this graph that the friction forces increase as temperature increases when the velocity is lower than 0.005 m/s. This is because the two sur-faces are partly separated and partly in contact, and an in-crease in the grease temperature decreases both the viscosity and the oil film thickness [15]. Therefore, as the temperature increases, the oil film thickness is further reduced and metal-to-metal contact becomes stronger, which increases the fric-tion force. However, for velocities above 0.005 m/s, the fric-tion forces decrease as temperature increases because of vis-cous friction. In viscous friction regime, a lower viscosity decreases the oil film thickness, which will also decrease the friction force, and hence the friction force with small kine-matic viscosity value is smaller. In this study, each of friction experiments was repeated more than ten times, and the friction force measured varied within a variation of ±0.25 N, which calculated from Eq. (1); this value can be found from Figs. 4-6.
Table 1. Experimental equipment.
LM guide model SRG 25C SRN 35C SRG 45C
Lb (mm) 97
120.2 159
Preload class Normal (Low preload)
C1 (Light preload) C0 (Medium preload)
Compression load cell CAS C1E-2TS 2000 kgf
Data logger GL220 sampling interval 30 s
NC machine HYUNDAI-KIA machine KV 25
Type T thermocouple accuracy ±0.5 °C
Fig. 3. The graph of roller linear motion guide temperature measure-ment method.
Fig. 4. Relationship between the type of the LM guide and friction force.

1480 D.-J. Cheng et al. / Journal of Mechanical Science and Technology 31 (3) (2017) 1477~1487
The characteristics of friction force in response to external load, preload, velocity and lubrication were examined experi-mentally [14]. However, the type of the LM guide and operat-ing temperature were not considered in previous research. Therefore, the previous model for friction force was modified with consideration of the type of the LM guide and operating temperature. The improvement of friction force model con-sisted of coulomb friction, viscous friction and Stribeck effect.
Coulomb friction (fCoulomb) was modeled from Ref. [14], as shown in Eq. (1):
3
1 2( ) 10 .Coulomb cf k k p P -= - ´ (3)
Coulomb friction is proportional to the friction coefficient
(k1 - k2 pc) and external load (P). However, coulomb friction decreases with increase of preload class (pc).
Viscous friction (fViscous) was improved from Ref. [14], as shown in Eq. (4):
0( )Viscous b v cf L p V fm n= + . (4)
Eq. (4) clearly shows that the viscous friction increases as all parameters increase.
The Stribeck effect force (fStribeck) was also improved from Ref. [14], That is,
St
VVc b
Stribeck St
p Lf emn
-
= . (5)
The viscosity of lubricants drops exponentially with a rise
in temperature according to the following formula [13]:
( )iT Tie
bn n - -= . (6) The Stribeck effect force is high at low velocity and drops
off exponentially as velocity (V) increases. Moreover, the Stribeck effect force decreases with increase of kinematic viscosity (ν). However, for other parameters, high values will result in higher Stribeck effect force.
The improvement of friction force model can be obtained from summing up the coulomb friction, viscous friction and Stribeck effect force. As a result, the improved governed equation of the friction force can be expressed as Eq. (7):
f Coulomb Stribeck ViscousF f f f= + +
31 2 ( )( ) 10 St
i
VVSt c b
c T Ti
p Lk k p P ee b
mn
--
- -= - ´ +
( )0( )iT T
b V c iL p V e fbm n - -+ + . (7) The values of k1, k2, μSt, VSt, μv, β and f0 can be obtained
from experimental data, then Eq. (7) becomes as follows:
3 0.0150.067( )
1.52(0.315 0.03 ) 10i
Vc b
f c T Ti
p LF p P een
--- -
= - ´ +
0.067( )(0.003 0.029)iT Tb b c iL L p V en - -+ + . (8)
To validate the improved governing equation, the predic-
tions from Eq. (8) were compared with experimental results in the roller LM guide SRN 35C (120.2 mm). Fig. 6 plots the comparison between the prediction results and those from experimental results. The maximum error between experimen-tal values and prediction values is about 12.6 %. Although the predicted values of friction force are different from experi-mental friction force, the agreement is reasonable.
4.2 Frictional heat generation model
In contrast to the heat generation model of rotational movement bearings, which have been developed by many researchers, the modeling of heat generation in the roller linear motion guide has not been addressed. This was the first inves-tigation on the heat generation in a roller linear motion guide. Moreover, the frictional heat generation model was proposed and verified through experiments.
The total frictional heat generated in a roller linear motion
Fig. 5. Relationship between operating temperature and friction force.
Fig. 6. Comparison between experimental and prediction results for different preloads, velocities and external loads.
D.-J. Cheng et al. / Journal of Mechanical Science and Technology 31 (3) (2017) 1477~1487 1481
guide comes from the friction force between the rolling ele-ments, the LM rail and the LM block. Almost all friction loss in a bearing is transformed into heat within the bearing itself and causes the temperature of the bearing to rise. The heat generated by the roller LM guide can be expressed as heat flow rate (Qf ) under a thermal load at the boundary [21]:
f fQ F Vh= , (9)
where Ff is the friction force calculated from Eq. (8) and V is the velocity. In this study, friction force was assumed as com-pletely converted into heat (η = 1) [21].
Subtracting Eq. (8) into Eq. (9) gives a relation for the fric-tional heat generation as follows:
3 0.015
0.067( )
1.52(0.315 0.03 ) 10i
Vc b
f c T Ti
p LQ p VP V een
--- -
= - ´ +
0.067( )(0.003 0.029)iT Tb b c iVL L p V en - -+ + . (10)
With this model one can attempt to capture the roles of
various frictions by changing operating parameters. The heat flow rate increases with increase of operating parameters such as velocity (V), external load (P) and preload class (pc). How-ever, at lower velocity region, there is not an exponential de-cline phenomenon in heat generated model where the Stribeck effect can be neglected.
The heat source of LM guide cannot be measured directly using a measurement instrument. However, the heat source can be validated through measuring the surface temperature rise at different locations on the LM rail. If a good agreement was found between experimental results and simulation results, the proposed heat generation model was thought to be associ-ated with the real heat source. Also, the verification process for the proposed model is presented in Sec. 5.1.
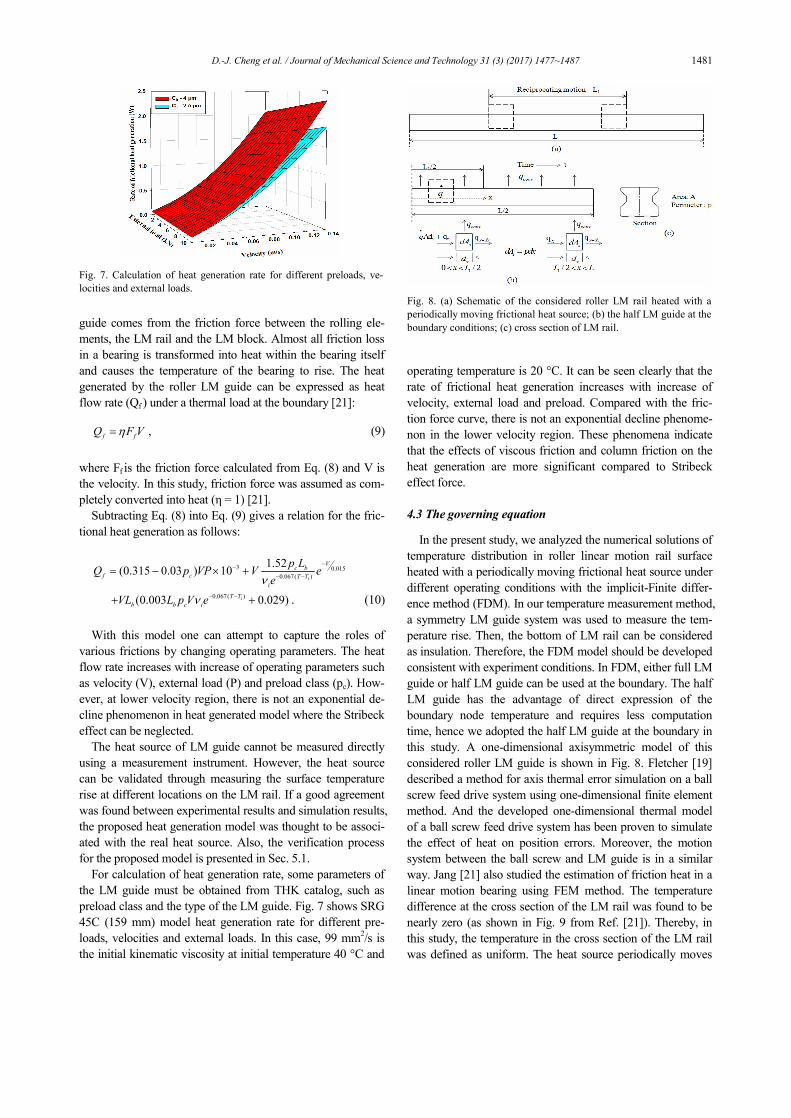
For calculation of heat generation rate, some parameters of the LM guide must be obtained from THK catalog, such as preload class and the type of the LM guide. Fig. 7 shows SRG 45C (159 mm) model heat generation rate for different pre-loads, velocities and external loads. In this case, 99 mm2/s is the initial kinematic viscosity at initial temperature 40 °C and
operating temperature is 20 °C. It can be seen clearly that the rate of frictional heat generation increases with increase of velocity, external load and preload. Compared with the fric-tion force curve, there is not an exponential decline phenome-non in the lower velocity region. These phenomena indicate that the effects of viscous friction and column friction on the heat generation are more significant compared to Stribeck effect force.
4.3 The governing equation
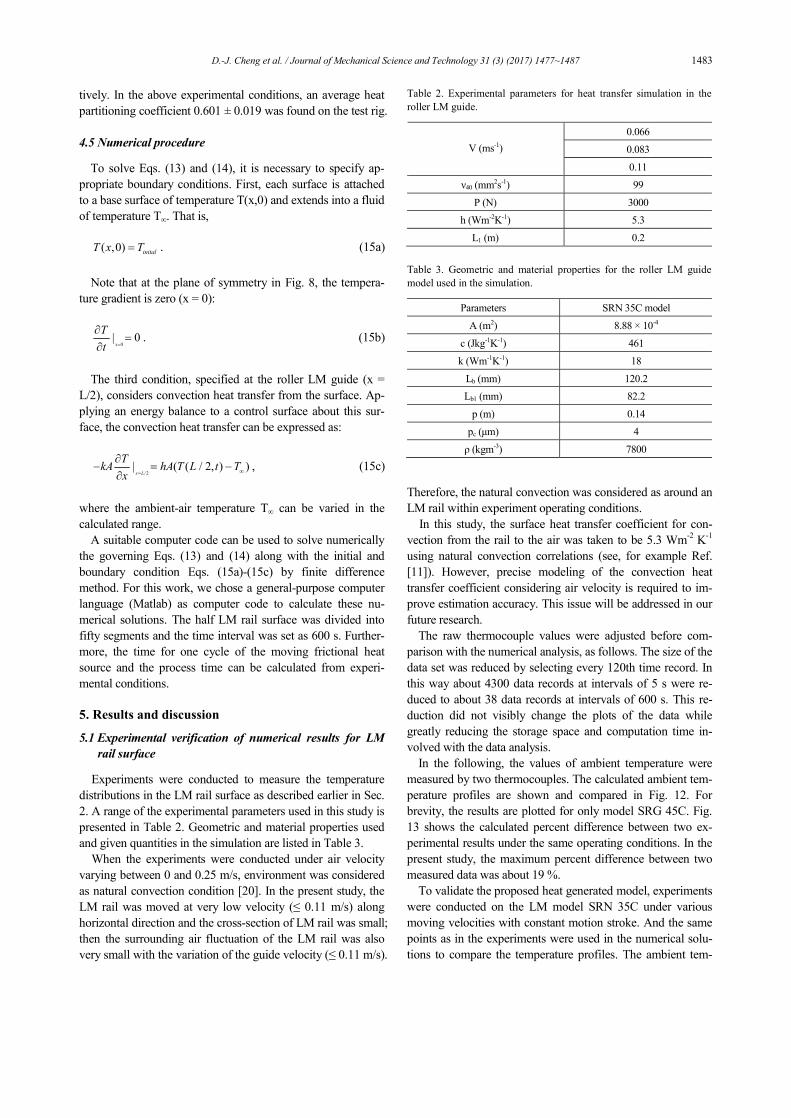
In the present study, we analyzed the numerical solutions of temperature distribution in roller linear motion rail surface heated with a periodically moving frictional heat source under different operating conditions with the implicit-Finite differ-ence method (FDM). In our temperature measurement method, a symmetry LM guide system was used to measure the tem-perature rise. Then, the bottom of LM rail can be considered as insulation. Therefore, the FDM model should be developed consistent with experiment conditions. In FDM, either full LM guide or half LM guide can be used at the boundary. The half LM guide has the advantage of direct expression of the boundary node temperature and requires less computation time, hence we adopted the half LM guide at the boundary in this study. A one-dimensional axisymmetric model of this considered roller LM guide is shown in Fig. 8. Fletcher [19] described a method for axis thermal error simulation on a ball screw feed drive system using one-dimensional finite element method. And the developed one-dimensional thermal model of a ball screw feed drive system has been proven to simulate the effect of heat on position errors. Moreover, the motion system between the ball screw and LM guide is in a similar way. Jang [21] also studied the estimation of friction heat in a linear motion bearing using FEM method. The temperature difference at the cross section of the LM rail was found to be nearly zero (as shown in Fig. 9 from Ref. [21]). Thereby, in this study, the temperature in the cross section of the LM rail was defined as uniform. The heat source periodically moves
Fig. 7. Calculation of heat generation rate for different preloads, ve-locities and external loads.
Fig. 8. (a) Schematic of the considered roller LM rail heated with a periodically moving frictional heat source; (b) the half LM guide at the boundary conditions; (c) cross section of LM rail.

1482 D.-J. Cheng et al. / Journal of Mechanical Science and Technology 31 (3) (2017) 1477~1487
with a constant speed in the x-direction on the reciprocating motion contact surface, and the surfaces exposed to air are subjected to convection heat transfer. To obtain the tempera-ture distributions, we assumed that the heat generated per unit volume at the scope of the reciprocating motion was uniform and the thermal properties of the LM guide did not change with temperature.
Consider the one-dimensional axisymmetric model of Fig. 8(b), in which there is a uniform energy generation per unit volume (0 ≤ x ≤ L1/2) and the surfaces are exposed to air (0 ≤ x ≤ L/2) are subjected to convection heat transfer. For constant thermal conductivity and convection heat transfer coefficient, the one-dimensional heat transfer governing equation can be expressed as Eqs. (11) and (12):
2
2 ( )T q hp c TT Tx k kA k t
r·
¥
¶ ¶+ - - =
¶ ¶ (0 ≤ x ≤ L1/2), (11)
2
2 ( )T hp c TT Tx kA k t
r¥
¶ ¶- - =
¶ ¶ (L1/2 < x ≤ L/2). (12)
As is apparent from these equations, the temperature, T, de-
pends on x and t (T = T(x,t)). Using the finite difference dis-cretization, Eqs. (11) and (12) can be rearranged as follows:
1, 1 , 1 1, 12 2 2
2 1( ) ( ) ( )i j i j i j
k t k t hp t k tT T Tx c x c A c x cr r r r- + + + +
é ùD D D D+ + + -ê úD D Dë û
,i j
q t hp tT Tc A cr r
·
¥
D D= + + (0 ≤ x ≤ L1/2), (13)
1, 1 , 1 1, 12 2 2
2 1( ) ( ) ( )i j i j i j
k t k t hp t k tT T Tx c x c A c x cr r r r- + + + +
é ùD D D D+ + + -ê úD D Dë û
,i j
hp tT TA cr ¥
D= + (L1/2 < x ≤ L/2), (14)
where 1
f
b
ALa·
= .
4.4 Heat partitioning coefficient
The heat partitioning coefficient is very important to calcu-late the partition of frictional heat between the two contacting bodies. Some studies assumed heat partitioning coefficient as 0.5 to calculate the portion of heat without experimental veri-fication [4, 17]. But the heat participating coefficient was a variable value in different systems. In the present study, 3D structure of LM guide system was assumed as a one-dimensional model with some assumptions: such as the cross section of LM rail was defined as uniform from Refs. [19, 21]. To obtain a more-accurate value in the symmetry LM guide system, the heat partitioning coefficient was verified through measured surface temperature results in this study. Fig. 9 shows a schematic of the roller LM guide in contact as con-sidered in the present study. The quantity α was defined as the heat partitioning coefficient. Besides, the rate of frictional heat flowing into the LM rail and LM block was calculated as αQf
and (1-α)Qf, respectively. In the following, the value of heat partitioning coefficient
was verified by matching the surface temperatures between simulation and experimental results. For this task, experiments were conducted for roller LM guide models SRG45C (159 mm) and SRN 35C (120.4 mm) with different operating con-ditions. The calculated temperature profiles at location of spot #1 are shown and compared to the experimental values in Fig. 10. For brevity, the results are plotted for only model SRG 45C. Fig. 11 shows the calculated errors between experimen-tal and simulation results for different values of α and operat-ing conditions. The value of heat partitioning coefficient can be obtained from Fig. 11, which was calculated as 0.593, 0.61, 0.61 and 0.586 from different experimental conditions, respec-
Fig. 9. A simplified model for heat partitioning during LM guide slid-ing contact.
Fig. 10. Comparisons between experimental results and temperature values computed for the model SRG 45C at location of spot #1 with different values of α.
Fig. 11. Calculated errors between experimental and simulation results for various values of α and operating conditions.
D.-J. Cheng et al. / Journal of Mechanical Science and Technology 31 (3) (2017) 1477~1487 1483
tively. In the above experimental conditions, an average heat partitioning coefficient 0.601 ± 0.019 was found on the test rig.
4.5 Numerical procedure
To solve Eqs. (13) and (14), it is necessary to specify ap-propriate boundary conditions. First, each surface is attached to a base surface of temperature T(x,0) and extends into a fluid of temperature T∞. That is,
( ,0) initalT x T= . (15a)
Note that at the plane of symmetry in Fig. 8, the tempera-
ture gradient is zero (x = 0):
0| 0
x
Tt =
¶=
¶. (15b)
The third condition, specified at the roller LM guide (x =
L/2), considers convection heat transfer from the surface. Ap-plying an energy balance to a control surface about this sur-face, the convection heat transfer can be expressed as:
/2| ( ( / 2, ) )
x L
TkA hA T L t Tx = ¥
¶- = -
¶, (15c)
where the ambient-air temperature T∞ can be varied in the calculated range.
A suitable computer code can be used to solve numerically the governing Eqs. (13) and (14) along with the initial and boundary condition Eqs. (15a)-(15c) by finite difference method. For this work, we chose a general-purpose computer language (Matlab) as computer code to calculate these nu-merical solutions. The half LM rail surface was divided into fifty segments and the time interval was set as 600 s. Further-more, the time for one cycle of the moving frictional heat source and the process time can be calculated from experi-mental conditions.
5. Results and discussion
5.1 Experimental verification of numerical results for LM rail surface
Experiments were conducted to measure the temperature distributions in the LM rail surface as described earlier in Sec. 2. A range of the experimental parameters used in this study is presented in Table 2. Geometric and material properties used and given quantities in the simulation are listed in Table 3.
When the experiments were conducted under air velocity varying between 0 and 0.25 m/s, environment was considered as natural convection condition [20]. In the present study, the LM rail was moved at very low velocity (≤ 0.11 m/s) along horizontal direction and the cross-section of LM rail was small; then the surrounding air fluctuation of the LM rail was also very small with the variation of the guide velocity (≤ 0.11 m/s).
Therefore, the natural convection was considered as around an LM rail within experiment operating conditions.
In this study, the surface heat transfer coefficient for con-vection from the rail to the air was taken to be 5.3 Wm-2 K-1 using natural convection correlations (see, for example Ref. [11]). However, precise modeling of the convection heat transfer coefficient considering air velocity is required to im-prove estimation accuracy. This issue will be addressed in our future research.
The raw thermocouple values were adjusted before com-parison with the numerical analysis, as follows. The size of the data set was reduced by selecting every 120th time record. In this way about 4300 data records at intervals of 5 s were re-duced to about 38 data records at intervals of 600 s. This re-duction did not visibly change the plots of the data while greatly reducing the storage space and computation time in-volved with the data analysis.
In the following, the values of ambient temperature were measured by two thermocouples. The calculated ambient tem-perature profiles are shown and compared in Fig. 12. For brevity, the results are plotted for only model SRG 45C. Fig. 13 shows the calculated percent difference between two ex-perimental results under the same operating conditions. In the present study, the maximum percent difference between two measured data was about 19 %.
To validate the proposed heat generated model, experiments were conducted on the LM model SRN 35C under various moving velocities with constant motion stroke. And the same points as in the experiments were used in the numerical solu-tions to compare the temperature profiles. The ambient tem-
Table 2. Experimental parameters for heat transfer simulation in the roller LM guide.
0.066
0.083 V (ms-1)
0.11
ν40 (mm2s-1) 99
P (N) 3000
h (Wm-2K-1) 5.3
L1 (m) 0.2
Table 3. Geometric and material properties for the roller LM guide model used in the simulation.
Parameters SRN 35C model
A (m2) 8.88 × 10⁻⁴
c (Jkg-1K-1) 461
k (Wm-1K-1) 18
Lb (mm) 120.2
Lb1 (mm) 82.2
p (m) 0.14
pc (μm) 4
ρ (kgm-3) 7800

1484 D.-J. Cheng et al. / Journal of Mechanical Science and Technology 31 (3) (2017) 1477~1487
perature was measured, which plays an important role in the determination of simulation results. The temperature distribu-tion of the LM rail surface was analyzed by using heat con-duction equation, heat partitioning coefficient and heat gener-ated model.
Figs. 14-16 show the comparisons of the experimental and numerical results with different operating conditions in a roller LM guide model SRN 35C (120.2 mm). For each velocity, it shows a good agreement between measured and simulated temperature distribution in the transient phase as well as the steady state condition. From Figs. 14(a), 15(a) and 16(a), the temperature rises sharply during initial operation and then increases slowly until it reaches a stable condition and then remains constant. The time it takes to reach a stable state var-ies according to the amount of heat generated and the sur-rounding ambient temperature.
Also from Figs. 14(b), 15(b) and 16(b), the temperature in-tervals between location points of spots 1, 2 and 3 decrease as the velocity decreases. This is due to the heat generated rate and the time scale of heat transfer. The rate of heat transfer depends on the temperature gradient and the thermal conduc-tivity of the material. The test material has a finite heat capac-ity and thermal conductivity, hence the temperature at any point changes at a rate proportional to the local gradient in the heat flow. The generated frictional heat decreases as the veloc-
Fig. 12. The values of ambient temperature were measured by two thermocouples for the model SRG 45C.
Fig. 13. Calculated percent difference between two experimental re-sults under the same operating conditions.
(a) Temperature rise vs. time
(b) Temperature distribution vs. position
Fig. 14. Comparison of the numerical results to the measured valueswith constant velocity of 0.11 m/s and variable ambient temperatures.
(a) Temperature rise vs. time
(b) Temperature distribution vs. position
Fig. 15. Comparison of the numerical results to the measured valueswith constant velocity of 0.083 m/s and variable ambient temperatures.

D.-J. Cheng et al. / Journal of Mechanical Science and Technology 31 (3) (2017) 1477~1487 1485
ity decreases, so there is a lower temperature gradient over the change in distance. Also, the time scale of heat transfer is enlarged with decreasing the velocity; thus the temperature intervals of the different location points with low velocity value are smaller.
A good agreement was found between numerical results and experimental data. A maximum error of 12 % was found from comparison results.
5.2 Numerical results
The effects of velocity, LM block size and motion stroke were investigated. In the numerical solutions, each time, all parameters were set to be same except for the examined factor. The value of measured ambient temperature with a constant velocity of 0.11 m/s was used in the simulation. At the steady state, the calculated average value of ambient temperature was about 26 ± 0.2 °C from Fig. 14(a).
5.2.1 Effects of velocity
From Eq. (10) and Fig. 7, viscous friction has a significant effect on the frictional heat generation. Hence, viscous friction, which was dominated by velocity, was used to calculate the effect of heat generation rate on the temperature distribution. Fig. 17 shows the temperature distributions in the LM rail
surface obtained by calculation and experiment at the constant external load of 3 kN and 0.11 m/s. The calculated tempera-ture distribution shows a good agreement with the experimen-tal results. From the above results, we might expect a reason-able calculated temperature distribution even in high or low external load and velocity. It can be noticed from this graph that the value of temperature distribution profiles with high velocity is much higher compared to the results of the LM guide with low velocity due to the shortened period for heat conduction and higher frictional heat generated. As shown in Fig. 17, under the same velocity, the magnitudes of tempera-ture distribution profiles slightly increase with increase of external loads, which is due to the generated frictional heat slightly increasing as the external loads increased. Comparing between velocity and external load, it can be concluded that the impact of velocity on the temperature rise is more signifi-cant than that of external load.
5.2.2 Effects of LM block size
Fig. 18 shows the temperature distribution profiles for dif-ferent values of the LM block size at steady state conditions. The calculated results at the block size of SRN 35C (120.2 mm) show a good agreement with the experimental results. The value of the temperature distribution profile is smaller at the larger LM block size because of more heat dissipation into
(a) Temperature rise vs. time
(b) Temperature distribution vs. position
Fig. 16. Comparison of the numerical results to the measured values with constant velocity of 0.066 m/s and variable ambient temperatures.
Fig. 17. Effect of the velocity and external load on the temperature distribution at steady state condition.
Fig. 18. Effect of the LM block size on the temperature distribution at steady state condition.

1486 D.-J. Cheng et al. / Journal of Mechanical Science and Technology 31 (3) (2017) 1477~1487
the air. The geometric values of A, p and Lb increase with the increase of the LM block size; then when frictional heat is generated in the LM guide system, the larger LM block size results in more heat dissipation from the LM roller guide to the air, hence the temperature distribution of the larger LM block size reaches a lower steady state value.
5.2.3 Effects of motion stroke
Shown in Fig. 19 is the calculated and experimental tem-perature distribution profile at steady state with different val-ues of the reciprocating motion stroke. However, the experi-ment was carried out only for the motion stroke of 0.2 m due to the experiment limitation under the larger motion stroke conditions. The calculated results show a good agreement with the experimental results at the motion stroke of 0.2 m. The temperature reaches a lower value in the center of the LM rail, and the temperature is distributed wider under larger mo-tion stroke conditions. This is because the time scale of a mov-ing heat source passes repeatedly over the same point on the surface with larger reciprocating motion stroke. This results in a smaller temperature gradient from the larger reciprocating motion stroke surface. However, when the motion stroke is enlarged, the temperature reaches a higher value at the edge of the LM rail due to shorten distance between edge points and the heat source area.
6. Conclusions
We investigated the temperature distributions in roller lin-ear motion rail surface heated with a periodically moving fric-tional heat source experimentally and numerically. The previ-ous model of friction force was improved with taking addi-tional parameters into consideration, such as the type of the LM guide and operating temperature. The improved model was validated through experiments, and the friction forces in prediction and experimental showed a good agreement. Then frictional heat generated was estimated from the improved friction force model and the moving velocity, which was taken as the thermal load in the numerical solutions. Also, the heat partitioning coefficient was defined as a constant value to
calculate the portion of frictional heat to the LM rail. The nu-merical solutions of temperature distribution were calculated in combining a heat conduction equation and the rate of fric-tional heat flowing into the LM rail.
Through comparing experimental and simulation results, the heat partitioning coefficient was obtained from a symme-try LM guide system under various ambient temperatures and low velocities. The friction heat was estimated from heat gen-erated model and heat partitioning coefficient, which was taken as thermal load in the numerical solutions. Then, the temperature rises were measured and compared with numeri-cal results. Good agreement was found between experimental and numerical results.
Simulation results showed that the smaller LM block size or higher velocity leads to a higher temperature distribution pro-file in the LM rail surface. Results also showed that the tem-perature reached a lower value in the center of the LM rail, and the temperature was distributed wider under larger motion stroke conditions; however, for larger motion stroke, the tem-perature reached a higher value at the edge of the LM rail. In addition, from the simulation results, it can also be concluded that the impact of velocity on the temperature rise is more significant than that of external load.
The work described in this study can be used to simulate the motion accuracy of the linear feed table considering the ther-mal deformation of the rail and the accuracy of distance mea-surement by the linear scales fixed to the LM rail.
Nomenclature------------------------------------------------------------------------
A : Cross-sectional area of LM rail (m2) c : Specific heat (Jkg-1K-1) Ff : Friction force (N) f0 : Base friction force (N) h : Convection heat transfer coefficient (Wm-2K-1) k : Thermal conductivity (Wm-1K-1) k1 : Factor dependent on the type of bearing k2 : Factor dependent on the type of bearing (1/um) K : LM block thickness (mm) L : Length of the LM rail (mm) Lb : Type of the LM guide (mm) Lb1 : Standard LM block length (mm) L1 : Reciprocating motion stroke (m) p : Perimeter (m) P : External load (N) pc : Preload class (μm) q·
: Heat generated per unit volume (Wm-3) Qf : Total frictional heat generation (W) t : Time (s) T : Operating temperature (°C) T∞ : Ambient temperature (°C) Tinitial : Initial temperature (°C) Ti : Initial temperature of kinematic viscosity (°C) V : Velocity (ms-1) VSt : Sliding speed coefficient in the Stribeck force (ms-1)
Fig. 19. Effect of the motion stroke on the temperature distribution at steady state condition.

D.-J. Cheng et al. / Journal of Mechanical Science and Technology 31 (3) (2017) 1477~1487 1487
νi : Initial viscosity (mm2s-1) of the lubrication at initial tem-perature 40 °C
α : Heat partitioning coefficient β : Temperature-viscosity coefficient μSt : Stribeck effect force coefficient (kNmms-1) μv : Viscous friction coefficient (Ns2mm-4) ρ : Density (kgm-3)
References
[1] Y. S. Yi, Y. Y. Kim, J. S. Choi, J. H. Yoo, D. J. Lee, W. L. Suk and S. J. Lee, Dynamic analysis of a linear motion guide having rolling elements for precision devices, J. of Mechani-cal Science and Technology, 62 (2008) 50-60.
[2] R. Ramesh, M. A. Mannan and A. N. Poo, Thermal error measurement and modeling in machine tools. PartⅠ. Influ-ence of varying operating conditions, Int. J. Mach. Tools Manuf., 43 (2003) 391-404.
[3] C. H. Wu and Y. T. Kung, Thermal analysis for the feed drive system of a CNC machine center, Int. J. Mach. Tools Manuf., 43 (2003) 1521-1528.
[4] Z. Z. Xu, X. J. Liu, H. K. Kim, J. H. Shin and S. K. Lyu, Thermal error forecast and performance evaluation for an air-cooling ball screw system, Int. J. Mach. Tools Manuf., 51 (2011) 605-611.
[5] J. J. Kim, Y. H. Jeong and D. W. Cho, Thermal behavior of a machine tool equipped with linear motors, Int. J. Mach. Tools Manuf., 44 (2004) 749-758.
[6] S. K. Lee, J. H. Yoo and M. S. Yang, Effect of thermal de-formation on machine tool slide guide motion, Tribology Int., 36 (2003) 41-47.
[7] N. S. Main, S. Fletcher, A. P. Longstaff and A. Myers, Effi-cient estimation by FEA of machine tool distortion due to environmental temperature perturbations, Precis. Eng., 37 (2013) 372-379.
[8] E. Creighton, A. Honegger, A. Tulsian and D. Muk-hopadhyay, Analysis of thermal errors in a high-speed mi-cro-milling spindle, Int. J. Mach. Tools Manuf., 50 (2010) 386-393.
[9] H. Wu, H. T. Zhang, Q. J. Guo, X. S. Wang and J. G. Yang, Thermal error optimization modeling and real-time compen-sation on a CNC turning center, J. Mater. Process. Technol., 207 (2008) 172-179.
[10] C. Jin, B. Wu and Y. M. Hu, Heat generation modeling of ball bearing based on internal load distribution, Tribology Int., 45 (2012) 8-15.
[11] K. D. Cole, C. M. Tarawneh, A. A. Fuentes, B. M. Wilson and L. Navarro, Thermal models of railroad wheels and bearings, Int. J. Heat Mass Transfer, 53 (2010) 1636-1645.
[12] C. M. Tarawneh, K. D. Cole, B. M. Wilson and F. Alnai-mat, Experiments and models for the thermal response of railroad tapered-roller bearings, Int. J. Heat Mass Transfer,
51 (2008) 5794-5803. [13] J. Takabi and M. M. Khonsari, Experimental testing and
thermal analysis of ball bearings, Tribology Int., 60 (2013) 93-103.
[14] D. J. Cheng, W. S. Yang, J. H. Park, T. J. Park, S. J. Kim, G. H. Kim and C. H. Park, Friction experiment of linear mo-tion roller guide THK SRG25, Int. J. Precis. Eng. Manuf., 15 (3) (2014) 545-551.
[15] M. Kasai, M. Fillon, J. Bouyer and S. Jarny, Influence of lubricants on plain bearing performance: Evaluation of bear-ing performance with polymer-containing oils, Tribology Int., 46 (2012) 190-199.
[16] THK Linear Motion System Catalog, THK Co., Ltd, Tokyo, Japan, Sec. A-1 (2013) 412-441.
[17] M. Amiri, M. M. Khonsari and S. Brahmeshwarkar, On the relationship between wear and thermal response in sliding systems, Tribology Lett, 38 (2010) 147-154.
[18] J. Taylor, An introduction to error analysis: The study of uncertainties in physical measurements, 2nd ed., University Science Books (1997).
[19] S. Fletcher and D. G. Goed, Measuring and modeling heat transfer and thermal errors on a ballscrew feed drive system, Trans. Eng. Science, 44 (2003) 349-359.
[20] D. Hakan, Experimental and numerical studies of natural convection from horizontal concrete cylinder heated with a cylindrical heat source, Int. Comm. Heat Mass Transfer, 37 (2010) 422-429.
[21] S. H. Jang, G. H. Kim and C. H. Park, Estimation of fric-tion heat in a linear motion bearing using Box-Behnken de-sign, Int. J. Adv. Manuf. Technol. (2016).
De-Jun Cheng is a Ph.D. candidate in Mechanical Engineering at the Gyeong-sang National University. He received a B.S. from Huaihai Institute of Technol-ogy in 2011 and an M.S. in Mechanical Engineering from Gyeongsang National University in 2013. His research inter-ests include tribology and heat and mass
transfer.
Su-Jin Kim is a Professor of Mechani-cal Engineering at Gyeongsang National University. He received a B.S. in Agri-cultural Mechanical Engineering from Seoul National University in 1998 and an M.S. and Ph.D. in Mechanical Engi-neering from Korea Advanced Institute of Science and Technology in 2000 and
2005, respectively. His research interests include computer-aided manufacturing and NC machining simulation.