effect of fly ash and am fungus ( glomus fasciculaum...
TRANSCRIPT

97
EFFECT OF FLY ASH AND AM FUNGUS (GLOMUS FASCICULAUM) ON GROWTH OF FOUR FIBER YIELDING PLANTS.
INTRODUCTION
Fly ash is a particulate residue of thermal power plants. The safe disposal, effective
and economic utilization of fly ash voluminously generating from various coal based thermal
power stations and strict compliance of the environmental regulation are of immense concern.
The chemical properties of fly ash are influenced to a great extent by those of the coal type
burned and the technologist used for handling and storage. As a soil pollutant fly ash is
highly alkaline and rich in salts (Adriano et al., 1998). Fly ash affected the growth,
productive and reproductive abilities of a number of plants (Satyanarayan and Pushpalata,
1991; Saquib and Khan, 1999). A large amount of elements (C, K, Ca, Mg, Cu, and Zn )
(Raularay et al., 2003, Lee et al., 2006 and Tiwari et al., 2008) get in to the soil as a result of
fly ash used at different doses and may probably change the physiochemical properties of
soil, which in turn may determine the biological properties soil, which in turn determine the
biological properties irrespective of the crop (Dhankar, 2003; Kumar et al., 1999, Srivastva et
al., 2002). Fly ash studies show that one can grow commercially important plant species in
fly ash covered area (Adholeya, 2000).
Arbuscular mycorrhizal fungi, through their mycelia net work accumulate heavy
metals from fly ash and retain them with in their cells or carry them on their body surface
when they form association with the plants. These mycelia threads, along with dense root
biomass assist in binding ash particles. AM fungi have been used as bioremediation agents
(Leyval and Haselwander, 1997) and biofertilizers for agricultural, horticultural and
silvicultural plant species in polluted area (Anonymous 2001; Lakshman, 2009). AM fungi
helps in binding the fine particles of ash and arrests the uptake of heavy metals by host plants
(Sarangi and Mishra, 1998) Experiments were conducted to study the effect of fly ash with

98
AM fungi inoculation on growth response of Corchorus capsularis L., Crotalaria juncea L.,
Gossypium hirsutum L., and Hibiscus cannabinus L. Root colonization, and spore count of
AM fungi in plant rhizosphere was also consideration.

99
REVIEW OF LITERATURE
Remediation of contaminated sites may be facilitated by selection of tolerant plant
species as well as microorganisms which play a critical role to establish early ecosystem
development, due to functional abilities such as nitrogen fixation, organic matter turnover,
mycorrhizal symbiosis, and potential facilitation of plant establishment (Hodkinson et al.,
2002; Walker et al., 2003). Among soil microorganisms, arbuscular mycorrhizal (AM) fungi
play relevant roles for establishment, survival of plant species, and improved soil properties
in stressed environments (Ortega-Larrocea et al., 2010). Arbuscular mycorrhizal fungi also
alter the soil microbial communities in rhizosphere directly or indirectly through changes in
root exudation patterns (Barea et al., 2005) and enhance the soil enzyme activities (Wang et
al., 2006). The effects of selected isolates of AM fungi play an important role on the plant
growth, nutrient uptake, and aggregation of fly ash (Enkhtuya et al., 2005; Wu et al., 2009).
However, spontaneous selection of infective and effective AM fungi is a long process in fly
ash ponds. It has also been demonstrated that the use of adapted AM fungal strains, in
restoration and bioremediation studies, is more effective than applying non-adapted strains
(Vivas et al., 2005).
Oliveira et al. (2010) reported that AM fungi quickly lose their symbiotic efficacy
when cultivated without edaphic stresses of the environment from where they are originally
isolated. They also recommended that the inoculum should be produced with original edaphic
stresses especially for AM isolates from extreme environments. We have isolated AM fungi
from the plants growing in fly ash pond and multiplied in pots using fly ash to maintain its
adaptation. Many fungi can survive and grow at high concentrations of toxic metals and the
genus Aspergillus play multi-fascinated roles such as P solubilization, heavy metal
bioleaching, plant growth promotion, and synergetic effects with mycorrhizal fungi (Medina
et al. 2006; Yang et al.,2009). The selection of A. tubingensis in this study is based on its

100
ability to solubilize the insoluble phosphates and improvement of growth of plants under
stress conditions (Krishna et al. 2005).
(Kalra et al., 1997; Singh et al., 1997), reported that agricultural utilization of fly ash
has been reported because of its considerable content of K, Ca, Mg, S and P Fly ash addition
generally increases plant growth and nutrient uptake (Aitken et al., 1984). Weinstein et al.
(1989) reported that fly ash increased crop yield of alfalfa (Medicago sativa), barley
(Hordeum vulgare), Bermuda grass (Cynodon dactylon) and white clover (Trifolium repens).
Addition of unweathered western US fly ash up to 8% (w/w) to either calcareous or acidic
soils resulted in higher yield of several agronomic crops (Page et al., 1979) mainly due to
increased availability of S to plants. Furr et al. (1977) demonstrated that alfalfa, sorghum
(Sorghum bicolor), field corn (Zea mays), millet (Echinochloa crusgalli), carrots (Daucas
carota), onion (Allium cepa), beans (Phaseolus vulgaris), cabbage (Brassica oleracea),
potatoes (Solanum tuberosum) and tomatoes (Lycopersicon esculentum) could be grown on a
slightly acidic soil (pH 6.0) treated with 125 mt ha-1 of unweathered fly ash. These plants
exhibited higher contents of As, B, Mg and Se. Also winter wheat (Triticum aestivum) grown
on a deep bed of fly ash produced grains containing higher Se (Stoewsand et al., 1978).
Greenhouse experiments conducted by Sikka and Kansal (1994) showed that application of 2-
4% fly ash significantly increased N, S, Ca, Na and Fe content of rice (Oryza sativa) plants.
The foliar application of fly ash also enhances growth and metabolic rates, as well as
increasing the photosynthetic pigments of crops like maize and soybean (Mishra and Shukla,
1986).
Fly ash contains many essential plant nutrients and their availability to the plant may
be problematic as reported by different authors (Pandey et al., 1994; Singh et al., 1997).
However, inoculation of AM fungi supports the growth and nutrient uptake of plants and
aggregation of fly ash (Enkhtuya et al. 2005; Wu et al., 2009). The AM fungi may enhance

101
plant P nutrition and increase the plant growth by diluting metal effect in host plant or by
binding of the metal to the fungal mycelium and immobilize them in rhizosphere or roots
(Chen et al., 2001).

102
MATERIALS AND METHOD
The used soil for the experiments was sandy loam having pH 7.0, organic carbon
0.84%, Nitrogen 1.41 mg/kg, Potassium 2.41 mg/kg, phosphorus, 0.18 mg/kg, zinc, 202
mg/kg, copper, 1.04 mg/kg, magnesium 1.42 mg/kg and E.C 10.17m mho/cm. The soil was
steam sterilized for one hour on two consecutive days. The physicochemical property of the
soil was determined as per Jackson (1973). Per cent of organic matter was determined
according to Piper (1950). Electric conductivity was measured using Bridge meter and pH by
1:1 (w/v) soil to water ratio. The fly ash was collected from poly fiber industry Harihar in
Davangeri district of Karnataka (India).
Experimental design
The experimental pots were filled with growth media (Soil: Sand in 3:1.) each
experimental potting mixture was amended with three different levels of fly ash (1%, 3% and
5%) with provided with 10 g of AM fungal inoculum. (Glomus fasciculatum). The control
treatment was maintained with out AM fungal inoculum and fly ash. The treatments
maintained for each plants species were as follows.
1) Control (Uninioculated)
2) Mycorrhiza (Glomus fasciculatum) inoculated
3) Mycorrhiza (GF) + 1% fly ash (100g/10kg soil)
4) Mycorrhiza (GF) + 3% fly ash (300g/10kg soil)
5) Mycorrhiza (GF) + 5% fly ash (500g/10kg soil)
All the experimental pots were arranged incompletely randomized block design with
triplicate per treatment. The experimental pots were kept free of weeds, insects, pets, rodents
etc. the pots were watered every alternate day and 10 ml of Hoagland solution without P was
given to each seedling at the interval of 15 days.

103
Analysis of growth parameters:
Plants were harvested after 60, 90 and 120 days after sowing. The plants parameters
like shoot and root length, fresh weight of shoot and root, shoot and root dry weight, stem
diameter and number of leaves, the per cent root colonization, spore number per 50 g soil,
and phosphorus uptake in shoot were recorded. After the harvest, experimental plants shoot
and root was oven dried at 700C until a constant weight was obtained to determine the dry
weight.
Root colonization
The per cent root colonization was evaluated microscopically followed by clearing of
roots in 10% KOH and staining with 0.05% trypan blue in lactophenol according to method
described by Phillips and Hayman (1970). The following formula was used to calculate the
root colonization (Giovannetti and Mosse, 1980).
Percent mycorrhizal colonization = Number of root segments colonized X 100
Total number of root segments examined
Determination of AM fungal spores
Spores were separated from the soil by wet sieving and decanting technique (Gerdemann
and Nicolson, 1963). 50 g of soil was mixed with water. The mixture was pour through
different sieve size (250, 106, 45µm). After several times of sieve washing, the supernatant
was collected in petridish and spores counted under binocular-microscope.
Determination of Fiber content
Smallholder plots are usually harvested by hand. The plants are cut at 2 to 3 cm above
the soil and left on the ground to dry. The cut Corchorus capsularis L., Crotalaria juncea L.,

104
and Hibiscus cannabinus L., is laid in swathes to dry for up to four days. This was followed
by water retting (the bundled hemp floats in water) and the fiber yield in Gossypium hirsutum
L., was measured by taking dry weight of fruits.
Phosphorus content:
The phosphorus content in the shoots was determined by the vanado-molybdate
phosphoric acid yellow color method outlined by Jackson (1973).
Statistical Analysis
Analysis of variance (ANOVA) was performed on all data and the means were
separated using Duncan’s multiple Range Test (DMRT), by the help of SPSS student version-
9 software.

105
RESULTS
The different dosages of fly ash with AM fungus Glomus fasciculatum inoculated to
test the effect of fly ash on mycorrhizal and four fiber yielding plants. All the plant species
inoculated with 3% fly ash with AM fungus have shown increased growth parameters over
the other treatments and control plants (Plate XV- XVI). The experimental results revealed
that, not only the growth parameters of four experimental plants were increased but also the
nutrient uptake and mycorrhizal status was significant compared to plants provide with high
levels of fly ash.
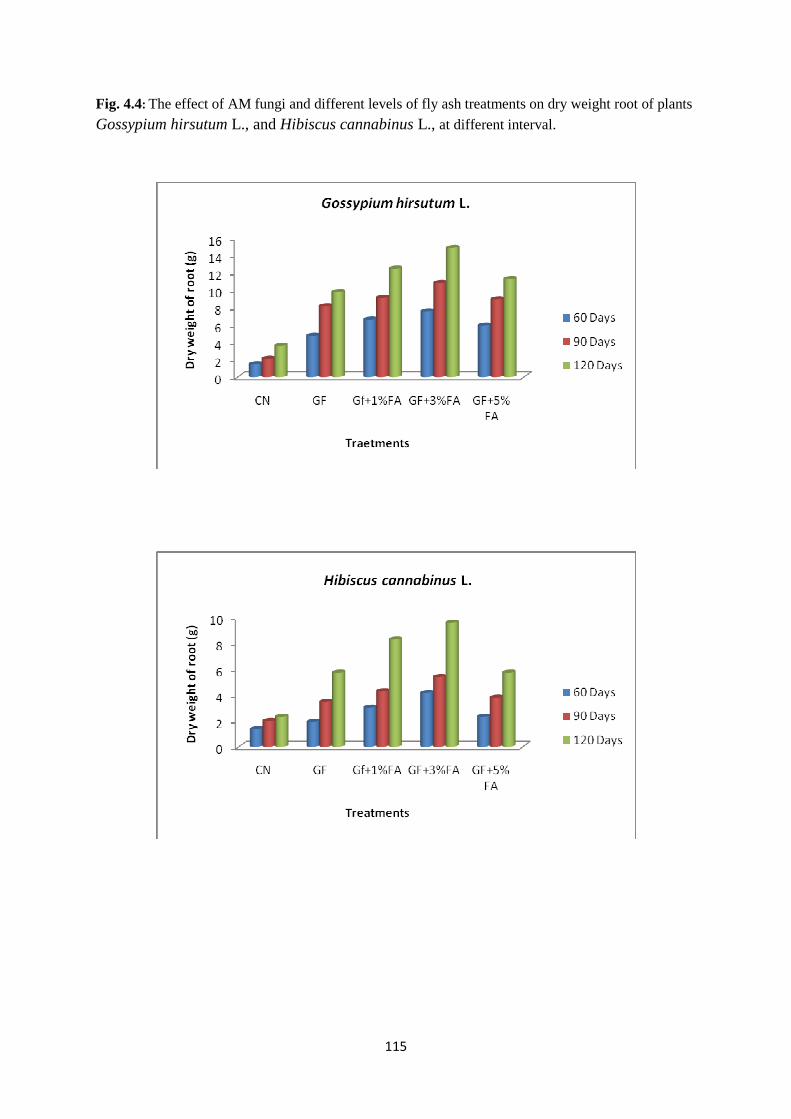
The growth parameters of all the experimental plants were determined at 60, 90 and
120 days after sowing. The greater values for growth parameters such as shoot length, fresh
weight of shoot, dry weight of shoot, root length, fresh weight of root, dry weight of root,
stem diameter, number of flowers, numbers of fruits and increased “P” uptake were recorded
in experimental plants with 3 % fly ash and AM fungus Glomus fasciculatum over the
reaming treatments. Where as, plants provided with 5% fly ash have shown to be less
significant (Fig. 4.1-4.10). The intermediate growth rate had been recorded in plants provided
with 1% fly ash in presence of AM fungus. (Table 4.1-4.4).
Mycorrhizal parameters like per cent colonization, and spore number were determined
at 60, 90 and 120 days. The mycorrhizal root colonization was found to be varied in each
experimental plant. It was less in beginning (at 45-60 days) but steadily increased after
90 days. It was observed that at 120 there was maximum colonization in the experimental
plants roots grown with 3% fly ash over control plants. The maximum per cent mycorrhizal
colonization (PMC) was recorded in Crotalaria juncea L., and very least PMC was observed
in the roots of Hibiscus cannabinus L., whereas, intermediate PMC was recorded in
remaining two experimental pants. (Fig 4.5 and 4.6)

106
AM fungal spore number was recorded in all experimental plants. It was found to be
highest at 120 days and least was noticed at 60 days, with increase in duration the spore
number was increased. Maximum AM fungal spore number was observed in the rhizosphere
soils of the experimental plants inoculated with Glomus fasciculatum and 3% fly ash. It was
least in plants inoculated with Glomus fasciculatum and 5% fly ash whereas,, moderate spore
number was noticed in plants provided with 1% fly ash (Fig. 4.7 and 4.8).
The plants were also analyzed for its nutrient continent in shoot, particularly
phosphorus. Maximum increased P uptake was observed in plants inoculated with Glomus
fasciculatum in presence of 3% fly ash (Fig 4.9 and 4.10) The moderately increased P Uptake
in shoots was estimated in plants grown with 1% fly ash and it was least in plants with 5% fly
ash in the potting mixture. The fiber content in all the experimental plants was measured
(Table. 4.5). The fiber content in the mycorrhizal plant with 3% fly ash was more when
compared to control plants and mycorrhizal plants with 5% fly ash (Fig. 4.11).
It can be evident from the above results that, AM fungus Glomus fasciculatum with
3% fly ash was found to be the more efficient treatment of the enhancement of plant growth
and fiber yield in four experimental plants.

PLATE XV 1. Effect of different levels of fly ash on Corchorus capsularis L inoculated with AM
fungus.
A. Control (Uninoculated).
B. Glomus fasciculatum.
C. Glomus fasciculatum + 1 % fly ash.
D. Glomus fasciculatum + 3 % fly ash.
E. Glomus fasciculatum + 5 % fly ash.
2. Effect of different levels of fly ash on Crotalaria juncea L. inoculated with AM fungus.
A. Control (Uninoculated).
B. Glomus fasciculatum.
C. Glomus fasciculatum + 1 % fly ash.
D. Glomus fasciculatum + 3 % fly ash.
E. Glomus fasciculatum + 5 % fly ash.

PLATE XVI 1. Effect of different levels of fly ash on Gossypium hirsutum L. inoculated with AM
fungus.
A. Control (Uninoculated).
B. Glomus fasciculatum.
C. Glomus fasciculatum + 1 % fly ash.
D. Glomus fasciculatum + 3 % fly ash.
E. Glomus fasciculatum + 5 % fly ash.
2. Effect of different levels of fly ash on Hibiscus cannabinus L. inoculated with AM
fungus.
A. Control (Uninoculated).
B. Glomus fasciculatum.
C. Glomus fasciculatum + 1 % fly ash.
D. Glomus fasciculatum + 3 % fly ash.
E. Glomus fasciculatum + 5 % fly ash.


107
Table: 4.1: Effect of Glomus fasciculatum and fly ash different levels treatments on the growth of Corchorus capsularis L., plants at different interval (60, 90 and 120 days).
Note: SL: Shoot length, FWS: Fresh weight of Shoot, DWS: Dry weight of Shoot, RL: Root Length, FWR: Fresh weight of Root, DWR: Dry weight of Root, STD: Stem Diameter, PC: per cent of mycorrhizal colonization, NFL: Number of Flowers, NFR: Number of fruits, SP: Spore Number, P: Phosphorous. Values represent the mean ± SD. Means followed by the same letter within a column are not significantly P= 0.05 according to DMRT.
Treatments SL FWS DWS RL FWR DWR STD PMC NFL NFR SPN P-uptake
60 DAYS
CN 22.80 ±0.057e
8.766 ±0.296e
4.766 ±0.088e
12.60 ±0.115e
2.000 ±0.057e
2.066 ±0.057e
1.133 ±0.066e
0.000 ±0.000e
0.000 ±0.000
0.000 ±0.000
0.000 ±0.000e
0.040 ±0.000e
GF 44.73 ±0.120d
16.43 ±0.120d
11.23 ±0.185d
21.43 ±0.328d
6.600 ±0.033d
3.600 ±0.300d
1.466 ±0.033d
51.33 ±0.881d
0.000 ±0.000
0.000 ±0.000
121.6 ±1.201d
0.100 ±0.000d
Gf+1%FA 53.76 ±0.088b
20.70 ±0.152b
14.76 ±0.088b
24.86 ±0.033b
9.366 ±0.251b
4.600 ±0.200b
1.633 ±0.066b
57.00 ±1.527b
0.000 ±0.000
0.000 ±0.000
138.3 ±1.201b
0.120 ±0.000b
GF+3%FA 62.56 ±0.176a
26.70 ±0.152a
19.40 ±0.115a
29.56 ±0.145a
12.66 ±0.115a
5.733 ±0.152a
1.800 ±0.057a
67.66 ±.881a
0.000 ±0.000
0.000 ±0.000
152.3 ±2.027a
0.150 ±0.000a
GF+5% FA 50.33 ±0.133c
18.80 ±0.100c
11.73 ±0.120c
21.50 ±0.288c
6.633 ±0.208c
3.633 ±0.251c
1.533 ±0.066c
51.66 ±0.333c
0.000 ±0.000
0.000 ±0.000
127.3 ±1.201c
0.110 ±0.000c
90 DAYS
CN 33.60 ±0.057e
12.60 ±0.057e
6.200 ±0.173e
13.56 ±0.033e
4.866 ±0.066e
2.366 ±0.033e
1.400 ±0.057e
0.000 ±0.000e
0.666 ±0.333e
0.000 ±0.000e
0.000 ±0.000e
0.070 ±0.000e
GF 61.43 ±0.088d
24.70 ±.1000d
8.566 ±0.202d
24.50 ±0.057d
9.900 ±0.057d
5.166 ±0.088d
1.866 ±0.033d
65.00 ±0.577d
6.333 ±0.881d
2.333 ±0.881d
148.3 ±7.881d
0.140 ±0.000d
Gf+1%FA 70.63 ±0.133b
32.76 ±0.288b
13.73 ±0.088b
29.63 ±0.088b
12.53 ±0.233b
6.400 ±0.115b
2.066 ±0.033b
72.66 ±0.333b
8.000 ±1.000b
5.000 ±1.000b
179.6 ±2.333b
0.160 ±0.000b
GF+3%FA 82.36 ±0.066a
39.63 ±0.088a
19.60 ±0.115a
33.03 ±0.296a
14.60 ±0.173a
7.733 ±0.120a
2.100 ±0.057c
74.33 ±2.333c
12.66 ±1.333c
9.666 ±0.333c
196.3 ±0.881c
0.190 ±0.000c
GF+5% FA 67.73 ±0.120c
28.10 ±0.611c
10.56 ±0.033c
26.00 ±0.264c
11.00 ±0.152c
6.300 ±0.208c
2.000 ±0.057a
65.33 ±0.666a
7.000 ±1.000a
5.333 ±0.666a
167.6 ±1.333a
0.150 ±0.000a
120 DAYS
CN 48.66 ±0.120e
13.83 ±0.202e
8.233 ±0.088e
18.90 ±0.251e
6.766 ±0.088e
2.133 ±0.033e
1.866 ±0.033e
0.000 ±0.000e
12.33 ±0.333e
9.000 ±0.577e
0.000 ±0.000e
0.080 ±0.000e
GF 74.86 ±0.033d
34.30 ±0.404d
21.26 ±0.384d
33.13 ±0.033d
14.86 ±0.033d
6.633 ±0.088d
1.633 ±0.318d
87.33 ±1.666d
17.00 ±1.000d
12.33 ±0.333d
193.3 ±2.309d
0.160 ±0.000d
Gf+1%FA 88.60 ±0.208b
40.06 ±0.296b
28.63 ±0.133b
36.70 ±0.115b
18.26 ±0.120b
8.466 ±0.066b
2.066 ±0.033b
89.33 ±0.333b
18.33 ±0.881b
15.00 ±0.577b
208.0 ±2.645b
0.180 ±0.000b
GF+3%FA 100.7 ±0.218a
54.20 ±0.503a
36.83 ±0.033a
39.33 ±0.066a
20.53 ±0.033a
10.60 ±0.208a
2.700 ±0.152a
93.33 ±0.666a
20.33 ±0.881a
16.00 ±0.577a
229.6 ±5.033a
0.210 ±0.000a
GF+5% FA 78.53 ±0.033c
36.8 ±0.088c
21.46 ±1.453c
35.13 ±0.470c
16.13 ±0.033c
7.600 ±0.115c
2.066 ±0.033c
87.00 ±1.527c
17.66 ±1.453c
14.00 ±1.154c
202.3 ±3.214c
0.170 ±0.000c

108
Table:4.2: Effect of Glomus fasciculatum and fly ash different levels treatments on the growth of Crotalaria juncea L., plants at different interval (60, 90 and 120).
Note: SL: Shoot length, FWS: Fresh weight of Shoot, DWS: Dry weight of Shoot, RL: Root Length, FWR: Fresh weight of Root, DWR: Dry weight of Root, STD: Stem Diameter, PC: per cent of mycorrhizal colonization, NFL: Number of Flowers, NFR: Number of fruits, SP: Spore Number, P: Phosphorous. Values represent the mean ± SD. Means followed by the same letter within a column are not significantly P= 0.05 according to DMRT.
Treatments SL FWS DWS RL FWR DWR STD PC NFL NFR SP P-uptake
60 DAYS
CN 24.66 ±0.088e
10.60 ±0.115e
4.433 ±0.120e
10.73 ±0.088e
2.666 ±0.120e
1.233 ±0.120e
2.993 ±1.006e
0.000 ±0.000e
0.000 ±0.000
0.000 ±0.000
0.000 ±0.000e
0.050 ±0.000e
GF 39.63 ±0.088d
15.70 ±0.057d
9.700 ±0.057d
18.40 ±0.057d
4.766 ±0.088d
2.033 ±0.033d
1.500 ±0.208d
52.00 ±1.154d
0.000 ±0.000
0.000 ±0.000
107.3 ±1.763d
0.100 ±0.000d
Gf+1%FA 45.76 ±0.088b
21.46 ±0.120b
13.76 ±0.088b
20.50 ±0.057b
5.800 ±0.057b
2.600 ±0.115b
1.466 ±0.066b
60.66 ±0.666b
0.000 ±0.000
0.000 ±0.000
116.6 ±0.881b
0.140 ±0.000b
GF+3%FA 57.10 ±0.152a
25.76 ±0.088a
16.70 ±0.152a
24.63 ±0.088a
6.466 ±0.033a
3.100 ±0.057a
1.733 ±0.088a
64.00 ±1.154a
0.000 ±0.000
0.000 ±0.000
130.3 ±2.728a
0.170 ±0.000a
GF+5% FA 40.70 ±0.152c
18.43 ±0.088c
10.96 ±0.185c
20.13 ±0.033c
5.666 ±0.066c
2.033 ±0.033c
1.233 ±0.120c
57.66 ±0.881c
0.000 ±0.000
0.000 ±0.000
114.6 ±2.603c
0.120 ±0.000c
90 DAYS
CN 36.80 ±0.057e
16.10 ±0.100e
10.30 ±0.152e
15.80 ±0.057e
3.733 ±0.166e
1.966 ±0.088e
1.433 ±0.033e
0.000 ±0.000e
0.333 ±0.333e
0.000 ±0.000e
0.000 ±0.000e
0.070 ±0.000e
GF 55.13 ±1.334d
23.63 ±0.120d
14.26 ±0.120d
28.60 ±0.057d
9.033 ±0.066d
4.533 ±0.120d
1.633 ±0.033d
61.00 ±0.577d
1.333 ±0.333d
1.000 ±0.577d
147.6 ±2.962d
0.150 ±0.000d
Gf+1%FA 64.80 ±0.057b
32.73 ±0.088b
20.23 ±0.202b
32.66 ±0.120b
12.60 ±0.115b
6.566 ±0.088b
1.766 ±0.033b
65.33 ±0.666b
1.666 ±0.333b
1.000 ±0.577b
158.0 ±2.309b
0.180 ±0.000b
GF+3%FA 72.76 ±0.088a
39.40 ±0.057a
24.73 ±0.088a
36.83 ±0.033a
15.66 ±0.120a
8.600 ±0.115a
2.033 ±0.033a
72.00 ±1.154a
3.666 ±0.333a
2.000 ±0.577a
178.6 ±2.027a
0.210 ±0.000a
GF+5% FA 61.66 ±0.120c
29.70 ±0.100c
17.93 ±0.145c
30.03 ±0.272c
10.43 ±0.033c
5.866 ±0.145c
1.666 ±0.033c
63.66 ±0.333c
1.666 ±0.333c
1.333 ±0.333c
155.0 ±2.081c
0.170 ±0.000c
120 DAYS
CN 49.53 ±0.033e
28.73 ±0.088e
13.06 ±0.033e
27.43 ±0.120e
10.90 ±0.173e
5.700 ±0.100e
1.666 ±0.033e
0.000 ±0.000e
2.333 ±0.881e
1.666 ±0.333e
0.000 ±0.000e
0.080 ±0.000e
GF 69.76 ±0.088d
38.76 ±0.133d
25.10 ±0.057d
38.76 ±0.088d
16.70 ±0.115d
10.43 ±0.033d
2.133 ±0.033d
77.33 ±0.666d
5.666 ±0.333d
2.333 ±0.333d
174.0 ±1.000d
0.160 ±0.000d
Gf+1%FA 81.20 ±0.230b
46.66 ±0.120b
30.43 ±0.088b
42.60 ±0.173b
18.73 ±0.088b
11.96 ±0.088b
2.366 ±0.033b
83.33 ±0.666b
7.333 ±0.333b
5.333 ±0.666b
196.0 ±3.055b
0.190 ±0.000b
GF+3%FA 96.83 ±0.033a
55.86 ±0.033a
36.83 ±0.033a
49.76 ±0.088a
20.63 ±0.145a
13.90 ±0.208a
2.766 ±0.088a
95.33 ±0.666a
9.666 ±0.333a
7.000 ±0.577a
228.6 ±2.027a
0.230 ±0.000a
GF+5% FA 76.33 ±0.240c
42.56 ±0.202c
27.60 ±0.057c
39.60 ±0.264c
17.10 ±0.200c
10.66 ±0.284c
2.233 ±0.033c
79.66 ±0.333c
6.666 ±0.333c
5.000 ±0.577c
185.6 ±2.027c
0.180 ±0.000c

109
Table:4.3 : Effect of Glomus fasciculatum and fly ash different levels treatments on the growth of Gossypium hirsutum L., plants at different interval (60, 90 and 120).
Note: SL: Shoot length, FWS: Fresh weight of Shoot, DWS: Dry weight of Shoot, RL: Root Length, FWR: Fresh weight of Root, DWR: Dry weight of Root, STD: Stem Diameter, PC: per cent of mycorrhizal colonization, NFL: Number of Flowers, NFR: Number of fruits, SP: Spore Number, P: Phosphorous. Values represent the mean ± SD. Means followed by the same letter within a column are not significantly P= 0.05 according to DMRT.
Treatments SL FWS DWS RL FWR DWR STD PC NFL NFR SP P-uptake
60 DAYS
CN 29.53 ±0.081e
15.76 ±0.088e
6.966 ±0.033e
10.76 ±0.088e
2.900 ±0.000e
1.466 ±0.066e
4.400 ±0.033e
0.000 ±0.000e
0.000 ±0.000
0.000 ±0.000
0.000 ±0.000e
0.040 ±0.000e
GF 40.63 ±0.145d
26.56 ±0.033d
15.96 ±0.088d
20.43 ±0.033d
8.666 ±0.120d
4.733 ±0.166d
1.133 ±0.088d
40.66 ±0.333d
0.000 ±0.000
0.000 ±0.000
110.3 ±0.881d
0.100 ±0.000d
Gf+1%FA 49.76 ±0.088b
33.46 ±0.133b
21.51 ±0.148b
26.53 ±0.133b
12.80 ±0.100b
6.600 ±0.057b
1.333 ±0.088b
48.66 ±0.333b
0.000 ±0.000
0.000 ±0.000
125.6 ±2.027b
0.140 ±0.000b
GF+3%FA 56.73 ±0.120a
36.76 ±0.088a
24.86 ±0.031a
30.56 ±0.202a
15.86 ±0.033a
7.533 ±0.066a
1.333 ±0.066a
52.66 ±0.666a
0.000 ±0.000
0.000 ±0.000
135.0 ±2.081a
0.160 ±0.000a
GF+5% FA 44.76 ±0.088c
29.43 ±0.088c
17.90 ±0.200c
23.13 ±0.266c
10.56 ±0.033c
5.900 ±0.057c
1.250 ±0.050c
43.33 ±0.666c
0.000 ±0.000
0.000 ±0.000
117.6 ±1.855c
0.120 ±0.000c
90 DAYS
CN 34.70 ±1.000e
18.70 ±0.100e
10.70 ±0.100e
13.80 ±0.100e
3.866 ±0.033e
2.100 ±0.057e
1.033 ±0.033e
0.000 ±0.000e
0.000 ±0.000e
0.000 ±0.000
0.000 ±0.000e
0.060 ±0.00e
GF 60.40 ±0.115d
36.76 ±0.088d
24.66 ±0.066d
22.30 ±0.115d
12.06 ±0.033d
8.133 ±0.066d
1.433 ±0.033d
56.66 ±0.333d
1.333 ±0.333d
0.000 ±0.000
162.6 ±1.855d
0.120 ±0.00d
Gf+1%FA 74.83 ±0.033b
42.76 ±0.088b
29.83 ±0.033b
24.70 ±0.057b
13.40 ±0.115b
9.100 ±0.057b
1.766 ±0.033b
60.66 ±0.333b
2.333 ±0.333b
0.000 ±0.000
177.3 ±1.201b
0.160 ±0.00b
GF+3%FA 80.63 ±0.145a
50.56 ±0.202a
34.73 ±0.066a
29.60 ±0.173a
15.56 ±0.088a
10.80 ±0.057a
2.066 ±0.033a
71.33 ±0.666a
3.666 ±0.333a
0.000 ±0.000
196.0 ±1.154a
0.180 ±0.00a
GF+5% FA 70.70 ±0.057c
40.33 ±0.088c
27.43 ±0.120c
22.26 ±0.484c
12.76 ±0.088c
8.933 ±0.033c
1.566 ±0.033c
58.66 ±0.333c
1.666 ±0.333c
0.000 ±0.000
172.0 ±1.732c
0.140 ±0.00c
120 DAYS
CN 45.66 ±0.088e
25.83 ±0.033e
17.50 ±0.057e
6.833 ±0.066e
6.833 ±0.066e
3.600 ±0.173e
1.833 ±0.033e
0.000 ±0.000e
3.000 ±0.577e
1.333 ±0.333e
0.000 ±0.000e
0.080 ±0.000e
GF 74.86 ±0.033d
40.66 ±0.120d
27.80 ±0.057d
15.86 ±0.033d
15.86 ±0.033d
9.766 ±0.088d
2.066 ±0.033d
77.00 ±1.527d
5.666 ±0.881d
3.000 ±0.577d
173.6 ±0.881d
0.150 ±0.000d
Gf+1%FA 82.76 ±0.066b
47.73 ±0.033b
32.53 ±0.185b
18.53 ±0.088b
18.53 ±0.088b
12.46 ±0.185b
2.300 ±0.057b
83.00 ±1.527b
8.000 ±0.577b
4.666 ±0.333b
203.6 ±5.925b
0.190 ±0.000b
GF+3%FA 92.60 ±0.057a
54.63 ±0.033a
37.43 ±0.066a
20.73 ±0.120a
20.73 ±0.120a
14.83 ±0.066a
2.766 ±0.033a
92.66 ±0.666a
9.333 ±0.333a
8.000 ±0.577a
234.3 ±2.905a
0.230 ±0.000a
GF+5% FA 78.66 ±0.120c
44.60 ±0.057c
28.96 ±0.417c
16.36 ±0.218c
16.36 ±0.218c
11.23 ±0.088c
2.266 ±0.033c
81.00 ±0.577c
6.666 ±1.333c
3.666 ±0.333c
188.0 ±1.527c
0.160 ±0.000c

110
Table: 4.4 : Effect of Glomus fasciculatum and fly ash different levels treatments on the growth of Hibiscus cannabinus L., plants at different interval (60, 90 and 120).
Note: SL: Shoot length, FWS: Fresh weight of Shoot, DWS: Dry weight of Shoot, RL: Root Length, FWR: Fresh weight of Root, DWR: Dry weight of Root, STD: Stem Diameter, PC: per cent of mycorrhizal colonization, NFL: Number of Flowers, NFR: Number of fruits, SP: Spore Number, P: Phosphorous. Values represent the mean ± SD. Means followed by the same letter within a column are not significantly P= 0.05 according to DMRT.
Treatments SL FWS DWS RL FWR DWR STD PC NFL NFR SP P-uptake
60 DAYS CN 26.06
±0.218e 10.60 ±0.115e
4.000 ±0.100e
8.500 ±0.208e
2.566 ±0.088e
1.366 ±0.066e
1.066 ±0.033e
0.000 ±0.000e
0.000 ±0.000
0.000 ±0.000
0.000 ±0.000e
0.040 ±0.000e
GF 40.60 ±0.115d
18.36 ±0.033d
8.366 ±0.088d
14.86 ±0.120d
4.433 ±0.088d
1.933 ±0.088d
2.033 ±0.033d
42.66 ±0.333d
0.000 ±0.000
0.000 ±0.000
128.6 ±2.027d
0.100 ±0.000d
Gf+1%FA 53.90 ±0.208b
24.63 ±0.088b
12.26 ±0.088b
18.40 ±0.115b
6.766 ±0.318b
3.033 ±0.033b
2.066 ±0.033b
51.66 ±1.453b
0.000 ±0.000
0.000 ±0.000
145.6 ±2.027b
0.150 ±0.000b
GF+3%FA 67.76 ±0.088a
30.70 ±0.152a
15.60 ±0.115a
22.43 ±0.088a
8.700 ±0.152a
4.166 ±0.066a
2.133 ±0.033c
63.33 ±0.666c
0.000 ±0.000
0.000 ±0.000
161.6 ±1.453a
0.180 ±0.000a
GF+5% FA 44.76 ±0.088c
16.80 ±0.057c
9.166 ±0.033c
15.96 ±0.120c
5.466 ±0.066c
2.333 ±0.033c
2.066 ±0.033a
49.33 ±0.666a
0.000 ±0.000
0.000 ±0.000
131.0 ±5.686c
0.120 ±0.000c
90 DAYS CN 34.16
±0.352e 15.13 ±0.176e
4.900 ±0.173e
10.63 ±0.145e
2.900 ±0.057e
2.000 ±0.057e
1.166 ±0.033e
0.000 ±0.000e
0.000 ±0.000e
0.000 ±0.000c
0.000 ±0.000e
0.060 ±0.000e
GF 62.73 ±0.120d
32.40 ±0.152d
15.86 ±0.033d
18.76 ±0.088d
7.533 ±0.176d
3.466 ±0.066d
2.066 ±0.033d
62.00 ±1.154d
1.000 ±0.577d
0.000 ±0.000c
143.3 ±3.844d
0.130 ±0.000d
Gf+1%FA 73.50 ±0.152b
42.13 ±0.088b
20.60 ±0.115b
21.60 ±0.152b
9.100 ±0.057b
4.300 ±0.057b
2.100 ±0.000b
65.00 ±0.577b
1.000 ±0.333b
0.333 ±0.333b
158.6 ±3.756b
0.170 ±0.000b
GF+3%FA 81.73 ±0.088a
46.33 ±0.202a
24.80 ±0.057a
24.43 ±0.328a
11.13 ±0.066a
5.400 ±0.057a
2.133 ±0.033a
72.00 ±1.154a
1.3333 ±0.333a
0.666 ±0.333z
177.6 ±2.962a
0.200 ±0.000a
GF+5% FA 66.73 ±0.120c
37.33 ±0.566c
17.70 ±0.152c
18.80 ±0.0100c
8.133 ±0.033c
3.800 ±0.057c
2.033 ±0.033c
60.66 ±0.666c
1.000 ±0.333c
0.000 ±0.000c
141.0 ±0.577c
0.150 ±0.000c
120 DAYS
CN 43.66 ±0.120e
20.66 ±0.120e
10.76 ±0.033e
13.66 ±.0120e
3.666 ±0.120e
2.333 ±0.066e
1.333 ±0.066e
0.000 ±0.000e
1.333 ±0.333e
1.333 ±0.333e
0.000 ±0.000e
0.090 ±0.000e
GF 80.36 ±0.120d
43.66 ±0.120d
24.63 ±0.088d
22.66 ±0.088d
9.933 ±0.480d
5.733 ±0.352d
2.066 ±0.240d
79.00 ±3.214d
3.000 ±0.577d
2.666 ±0.333d
155.0 ±2.081d
0.150 ±0.000d
Gf+1%FA 92.76 ±0.088b
48.90 ±0.173b
28.50 ±0.057b
26.66 ±0.088b
14.76 ±0.133b
8.300 ±0.057b
2.733 ±0.066b
85.33 ±1.763b
5.333 ±0.666b
3.333 ±0.333b
175.3 ±2.027b
0.190 ±0.000b
GF+3%FA 104.4 ±0.240a
56.73 ±0.120a
36.56 ±0.088a
30.23 ±0.218a
17.53 ±0.318a
9.600 ±0.115a
2.966 ±0.033a
89.33 ±0.333a
6.666 ±0.881a
5.333 ±0.666a
192.3 ±2.027a
0.210 ±0.000a
GF+5% FA 86.73 ±0.120c
45.73 ±0.120c
26.63 ±0.088c
22.60 ±0.305c
10.56 ±0.088c
5.733 ±0.066c
2.400 ±0.100c
73.00 ±0.577c
3.000 ±0.577c
3.000 ±0.577c
165.0 ±1.732c
0.180 ±0.000c

111
Table: 4.5: Effect of Glomus fasciculatum and fly ash different levels treatments on the Fiber
yield of Corchorus capsularis L., Crotalaria juncea L., Gossypium hirsutum L and Hibiscus
cannabinus L., at different interval plants at different interval (60, 90 and 120).
Values represent the mean ± SD. Means followed by the same letter within a column are not significantly P= 0.05 according to DMRT.
Treatments Corchorus capsularis L.
Crotalaria juncea L.
Gossypium hirsutum L.
Hibiscus cannabinus L.
CN 2.100±0.100e 3.200±0.057e 1.533±0.185e 2.000±0.057e
GF 4.633±0.251d 7.366±0.088d 2.600±0.115d 6.900±0.057d
GF+1%Fly ash
5.866±0.057b 8.566±0.202b 3.866±0.033b 8.400±0.115b
GF+3% Fly ash 8.800±0.173a 10.93±0.202a 4.133±0.120a 11.300±0.057a
GF+5 % Fly ash 5.166±0.152c 8.066±0.088c 2.766±0.088c 7.466±0.666c

112
Fig 4.1: The effect of AM fungi and different levels of fly ash treatments on dry weight shoot of
plants Corchorus capsularis L., and Crotalaria juncea L., at different interval.

113
Fig 4.2: The effect of AM fungi and different levels of fly ash treatments on dry weight shoot of
plants Gossypium hirsutum L., and Hibiscus cannabinus L., at different interval.

114
Fig. 4.3: The effect of AM fungi and different levels of fly ash treatments on dry weight root of plants
Corchorus capsularis L., and Crotalaria juncea L., at different interval.
115
Fig. 4.4: The effect of AM fungi and different levels of fly ash treatments on dry weight root of plants
Gossypium hirsutum L., and Hibiscus cannabinus L., at different interval.

116
Fig. 4.5: The effect of AM fungi and different levels of fly ash treatments on Per cent of root
colonization of plants Corchorus capsularis L., and Crotalaria juncea L., at different interval

117
Fig. 4.6: The effect of AM fungi and different levels of fly ash treatments on Per cent root
colonization of plants Gossypium hirsutum L., and Hibiscus cannabinus L., at different interval.

118
Fig. 4.7: The effect of AM fungi and different levels of fly ash treatments on Spore number/50 g soil
of plants Corchorus capsularis L., and Crotalaria juncea L., at different interval

119
Fig. 4.8: The effect of AM fungi and different levels of fly ash treatments on Spore number/ 50 g soil
of plants Gossypium hirsutum L., and Hibiscus cannabinus L., at different interval.

120
Fig: 4.9: The effect of AM fungi and different levels of fly ash treatments on P-uptake of plants
Corchorus capsularis L., and Crotalaria juncea L., at different interval

121
Fig. 4.10: The effect of AM fungi and different levels of fly ash treatments on P-uptake of plants
Gossypium hirsutum L., and Hibiscus cannabinus L., at different interval.

122
Fig 4.11: The effect of AM fungi and different levels of fly ash treatments on Fiber yield of plants
Corchorus capsularis L., Crotalaria juncea L., Gossypium hirsutum L., and Hibiscus
cannabinus L., at different interval.

123
DISCUSSION
In the present study the best effects on biomass production were noticed in AMF
inoculated plants grown with 3% fly ash. The experimental results revealed that, AM
inoculation with fly ash was successful in enhancing the plant growth parameters due to
improved supply of nutrients, especially phosphorus and minerals such as Zn, Cu, K and Ca
(Copper and Tinker, 1978). In the present study increased growth and higher values for
mycorrhizal colonization and spore number have been reported with AMF and 3% fly ash.
The AMF helps in binding the fine particles of fly ash and arrest the movement heavy metals
and also helps in uptake of micronutrients and phosphorus solubilization (Adholeya, 2000).
Similarly Garampalli et al., (2005) revealed on the basis of pot-culture experiment that, using
sterile, phosphorus-deficient soil to study the effect of fly ash at three different concentrations
(10 g, 20 g and 30 g fly ash kg−1 soil) on the infectivity and effectiveness of arbuscular
mycorrhizal fungus (Glomus aggregatum) on pigeon pea (Cajanus cajan L.) cv. Maruti. All
the concentrations of fly ash amendment in soil were found to significantly affect the
intensity of AM colonization inside the plant roots. They also reported that higher
concentration of fly ash (30 g fly ash kg−1 soil) suppresses the formation of AM fungal
structure. The low rate of AM fungal colonization and the presence of very few spores in
rhizosphere of plants grown on fly ash were attributed to adverse conditions. The soil
structure and composition not only affect the spore population but also the biological activity
of AM fungi (Mosse, 1975). In the present study reduction in mycorrhizal colonization was
observed at higher fly ash concentration. The dry weight of the experimental plants under the
influence of 5 % fly ash amendment in AM fungus-inoculated soils was found to be
considerably less when compared to the plants grown with 3% fly ash. However, fly ash
amendment with AM inoculation was also found to enhance the growth of plants as
compared to control plants. These findings were in accordance with report of Sheela and

124
Sundaram (2003) on Black gram in abandoned ash ponds of thermal power plants. The
present experimental results were strongly supports these findings.
Increased concentration of fly ash decreases the plant growth as well as mycorrhizal
status in root and rhizosphere of all the experimental plants. Increased tolerance of
mycorrhizal plants to toxic heavy metal concentration in the soil makes mycorrhizae
significant. Therefore fly ash is used as a nutrient in agriculture or horticulture and also as a
limiting agent in acidic agricultural soil. Similar observations were made by Plank, Martens
and Hallock, (1975); Sheela and Sundaram, (2003). Present investigations were strongly
supported by these workers.
Fly ash contains many essential plant nutrients and their availability to the plant may
be problematic as reported by Pandey et al., (1994) and Singh et al., (1997). In the present
study, inoculation of AM fungus along with 3% fly ash significantly increased biomass of all
the experimental plants. The uptake of nutrients such as P significantly increased in the shoot
tissues compared to other treatments. The AM fungi may enhance plant P nutrition and
increase the plant growth by diluting metal effect in host plant or by binding of the metal to
the fungal mycelium through chitin or glomalin and immobilize them in rhizosphere or roots
(Chen et al., 2001 and Gonza´lez-Cha´vez et al., 2004). It has also been found that AM fungi
alleviate metal toxicity of fly ash and enhance plant growth (Ning, 2000).