effect of flux powder sio for the welding of 304
TRANSCRIPT

MultiCraft International Journal of Engineering, Science and TechnologyVol. 9, No. 1, 2017, pp. 34-45
INTERNATIONALJOURNAL OF
ENGINEERING,SCIENCE ANDTECHNOLOGYwww.ijest-ng.com
www.ajol.info/index.php/ijest 2017 MultiCraft Limited. All rights reserved
Effect of flux powder SiO2 for the welding of 304-austenitic stainless steelusing gas tungsten arc welding
Vijander Kumar
Sant Longowal Institute of Engineering and Technology, Longowal – 148106, Punjab, INDIA*Corresponding Author: e-mail: [email protected]
Abstract
Three input machine parameters namely current, welding speed and gas flow rate at three different levels have beenconsidered in order to find out the influence of parameters on weld bead geometry, i.e. weld bead width, penetration andangular distortion. Taguchi method has been used in order to analyse the effect of various parameters on the weld geometry.Orthogonal array L9 has been applied for conduct in the experimentation. Based on the experimental data, the mathematicalmodel has been developed using analysis of variance (ANOVA). It is found that TIG welding with flux powder SiO2 increasesthe penetration and decreases the bead width, and tends to reduce angular distortion of the welds.
Keywords: 304- austenitic stainless steel, SiO2 flux, GTAW, Weld Geometry
DOI: http://dx.doi.org/10.4314/ijest.v9i1.3
1. Introduction
TIG welding originally developed for Al, Mg and other metals such as SS, HC steels, Cu, monel, inconel (Cr+Cr+Fe) brass,bronze, molybdenum, etc. (Narayanan et al., 2013) due to non consumable tungeston electrode and low penetration restricts themaximum thickness of plate which can be joined by GTAW directly up to 5mm. Improvement in weld penetration has long beensought in Gas Tungsten Arc Welding because this welding process has a single pass welding process. The technique of usingactive fluxes increase penetration makes it possible to join thick material by single-pass welds (Howse and Lucas, 2000; Patel andPatel, 2014). To enhance the quality of TIG welding activating flux is used study show the effect of different fluxes on hardnessand microstructure of stainless steel (Duhan and Choudhary, 2014) flux used in GTAW welding, are Fe2O3, MgCl2, MnO2, andZnO as activating flux to investigate the effect of activated tungsten inert gas (activated TIG) (Liu et al., 2006) results showed thatMnO2 flux can only led to increase in the hardness (306Hv) in weld zone except the other flux used (Tseng and Hsu, 2011; Kumaret al., 2014). Few researchers observed that the increase of the weld penetration was due to the constriction of the electric arc(Alsabti et al., 2014) where as other believed that the increase in penetration was due to the change in the liquid flow of moltenmetal in weld pool (Li et al., 2007; Xu et al., 2007). Some researchers’ work for the selection of process parameters to obtained anoptimal weld pool geometry in the tungsten inert gas (TIG) welding of stainless steel was presented (Juang and Tarng, 2002;Mukesh, 2013). The most dominant mechanism for increased penetration was considered to be arc constriction rather than achange in the surface tension of the molten pool (Shyu et al., 2008). The most plausible mechanism at present is that the arc orplasma was constricted by the action of the A-TIG fluxes and that the associated increase in current density results in increasedforces which alter the molten pool flow to give increased penetration (Li et al., 2012).
Literature shows that welding operations are utilized for joining of variety of ferrous and non-ferrous materials. Quality ofwelding depends upon the thickness and composition of material (Xi-He et al., 2009; Salleh et al., 2011) and experiments relatedto finding of relevant process parameters for different factors are going on (Rao et al., 2008). To reduce the number of experimentsTaguchi method can be used (Reis et al., 2013). The effect of current, gas flow rate, travel speed with different flux powder has tobe explored.

Kumar / International Journal of Engineering, Science and Technology, Vol. 9, No. 1, 2017, pp. 34-4535
From the above literature, it can be conclude that most of the research was done for materials such as Steel, Nimonic 263 alloy,Stainless Steel 308, Ferritic Stainless Steel and 202Stainless Steel with fluxes such as TiO, TiO2 Fe2O3, MnO2, MgCl2, ZnO TiO3
Cr2O3 etc. Very little research was done on 304 Austenitic Stainless Steel with flux SiO2. Most of the researchers investigated fewparameters on the responses of TIG welding process. In this study the effect of the process parameters such as current, weld speedand gas flow rate on distortion, weld bead penetration and weld bead width had been done.
2. Materials and methods
Stainless steel 304 is used for the experiment.
Table 1. Chemical composition of stainless steelConstituent C Mn P S Cr Ni SiPercentage .036 1.08 .038 .005 18.52 8.05 .23
Specimen size of 100 mm x 100 mm x 5 mm were cut from the plate which were roughly polished with 400 grit abrasive paperto remove surface impurities and washed with acetone. Flux powder was mixed with acetone, acetone and flux powder typicallymixed in a ratio 1:1 to produce paint like paste then flux powder paste is applied manually with paintbrush on the surface wherewelding is to be performed. Acetone evaporates leaving behind a thin layer of active flux. The coating density of flux is about 10mg/cm2 and thickness of flux layer is about 0.2mm after that welding is done in a single pass. Trail runs have been conducted tofind out suitable factors and their levels for welding the specimen. The process parameters at different levels are listed in Table.2.The most important parameters which have greater influence on the weld bead geometry were welding current, travel speed andgas flow rate. Similarly factor levels were evaluated the trail runs and subsequently inspecting the weld bead geometry. From trailfinal selected parameter and their ranges shown in Table 2.
Table 2: Experimental parameters and their rangesLevelsFactors
1 2 3
Current 130 140 150Gas flow rate 12 13 14Travel speed 150 175 200
In Table 2, current is measured in ampere, gas flow rate in lit/min and travel speed measured in mm/min also experimentalparameters and their ranges are same with and without SiO2 coating. The experimental layout for the parameter, using the L9 (3
3)orthogonal arrays is shown in Table 3.
Table 3: Levels of Process Parameters used in Taguchi L9 Orthogonal ArraySr.No
Current(A)
Gas flow rate(lit/min)
Travel speed(mm/min)
1 130 12 1502 130 13 1753 130 14 2004 140 12 1755 140 13 2006 140 14 1507 150 12 2008 150 13 1509 150 14 175
Welding was done in two phases in first phase no flux is used in second phase SiO2 flux was used such that The flux was mixedwith acetone which make paste form then paste is manually applied at the area where welding to be done. A layer of paste isshown in Fig. 1.
After welding, the cross-sections of the welded seams were prepared by standard metallographic procedures, such as sectioning,polishing and etching. In sectioning, samples were cut into size of 50x20mm from welded pieces to measure weld bead profile.After that polishing was done on all the samples with the help of emery papers of grade 160, 220, 320, 400, 600, 800, 1000 and1200. All the above emery papers were used in ascending order on every sample as given in above list. After using abrasive paper,Velvet Cloth, Alumina Powder and Diamond Paste 5μ were also used for getting reflecting surface. After using diamond paste,specimen are ready for etching operation. Etching is done to highlight the weld bead and identify microstructure feature or phasespresent. For detecting the weld bead border we need etching with a proper solution that attacks the metal in such a way that the

Kumar / International Journal of Engineering, Science and Technology, Vol. 9, No. 1, 2017, pp. 34-4536
specific features are made to stand out.
Fig. 1 SiO2 powder layer deposit on the workpiece
Etching operation requires chemical mixture of HCL and HNO3 in equal proportion of 10 ml. Specimen was dipped into theetchant for two minutes. The exothermic reaction takes place results in revealing the weld bead of the sample. The sample wasimmediately washed under running water and dried with air blower. After proper etching of the specimen, the weld bead gotvisible.
3 Results and Discussion
Etched samples with flux and without flux has been analysis separately
3.1 Analysis without flux3.1.1 Analysis of bead width without fluxThe variation of the S/N ratio and bead width w.r.t. to current, gas flow rate and travel speed is shown graphically. For qualitypurpose one should have desire for minimum heat affected zone that is possible with minimum weld width hence for optimal resultone should try to kept minimum weld width. For this a smaller S/N value adopted for a better performance when smaller the bettermethod is used. Therefore, the optimal level of the bead width is the level with the smallest S/N value.
a
b
Kumar / International Journal of Engineering, Science and Technology, Vol. 9, No. 1, 2017, pp. 34-4537
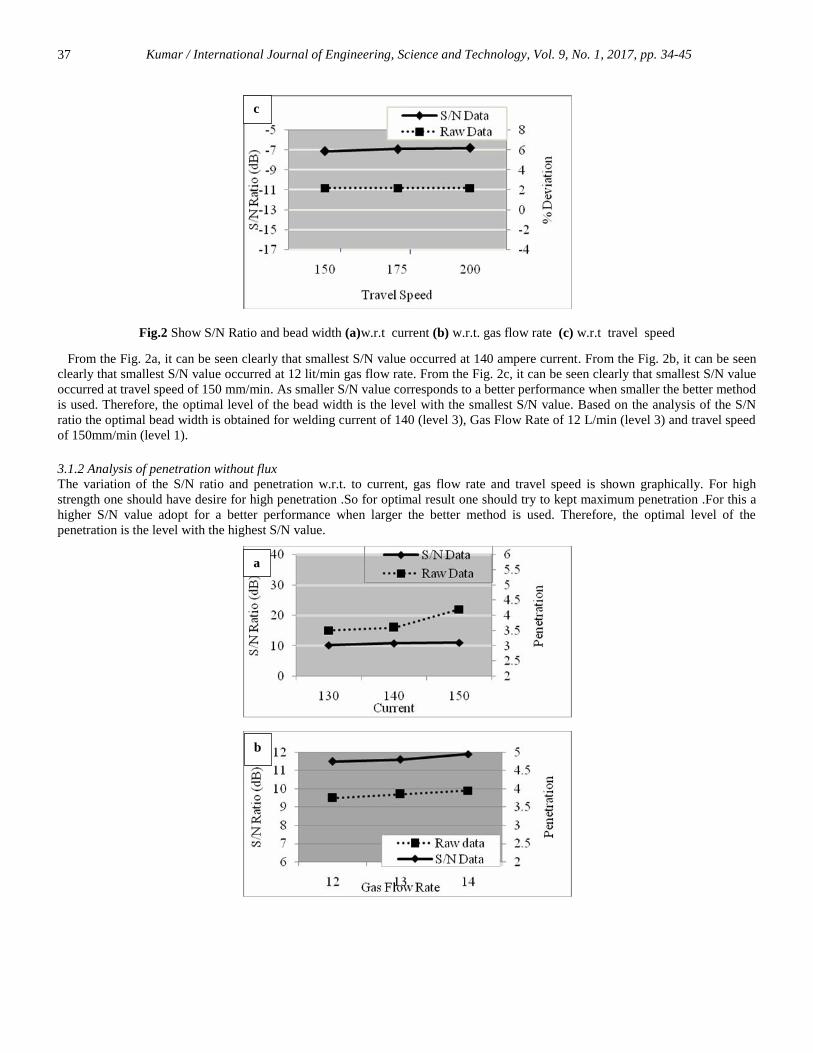
Fig.2 Show S/N Ratio and bead width (a)w.r.t current (b) w.r.t. gas flow rate (c) w.r.t travel speed
From the Fig. 2a, it can be seen clearly that smallest S/N value occurred at 140 ampere current. From the Fig. 2b, it can be seenclearly that smallest S/N value occurred at 12 lit/min gas flow rate. From the Fig. 2c, it can be seen clearly that smallest S/N valueoccurred at travel speed of 150 mm/min. As smaller S/N value corresponds to a better performance when smaller the better methodis used. Therefore, the optimal level of the bead width is the level with the smallest S/N value. Based on the analysis of the S/Nratio the optimal bead width is obtained for welding current of 140 (level 3), Gas Flow Rate of 12 L/min (level 3) and travel speedof 150mm/min (level 1).
3.1.2 Analysis of penetration without fluxThe variation of the S/N ratio and penetration w.r.t. to current, gas flow rate and travel speed is shown graphically. For highstrength one should have desire for high penetration .So for optimal result one should try to kept maximum penetration .For this ahigher S/N value adopt for a better performance when larger the better method is used. Therefore, the optimal level of thepenetration is the level with the highest S/N value.
c
a
b

Kumar / International Journal of Engineering, Science and Technology, Vol. 9, No. 1, 2017, pp. 34-4538
Fig. 3 Show S/N Ratio and penetration (a)w.r.t current(b) w.r.t. gas flow rate (c) w.r.t travel speed
From the Fig. 3a, it can be seen clearly that the highest S/N value occurred at current 140 ampere. From the Fig. 3b, it can beseen clearly that the highest S/N value occurred at gas flow rate 14 lit/min. From the Fig. 3c, it can be seen clearly that the highestS/N value occurred at travel speed 150 mm/min. Based on the analysis of the S/N ratio the highest penetration is obtained forwelding current of 150A (level 3), Gas Flow Rate of 14 L/min (level 3) and travel speed of 150 mm/min (level 1).
3.1.3Analysis of angular distortion without fluxThe variation of the S/N ratio and angular distortion w.r.t. to current, gas flow rate and travel speed is shown graphically .Forquality purpose one should have desire no angular distortion . So for optimal result one should try to kept minimum angulardistortion. For this a smaller S/N value adopted for a better performance when smaller the better method is used. Therefore, theoptimal level of the bead width is the level with the smallest S/N value.
c
a
b

Kumar / International Journal of Engineering, Science and Technology, Vol. 9, No. 1, 2017, pp. 34-4539
Fig. 4 Show S/N Ratio and angular distortion (a)w.r.t current(b) w.r.t. gas flow rate (c) w.r.t travel speed
From the Fig. 4a, it can be seen clearly that the smallest S/N value occurred at current 140 ampere. From the Fig. 4b, it can beseen clearly that the smallest S/N value occurred at 12 lit/min gas flow rate. From the Fig. 4c, it can be seen clearly that thesmallest S/N value occurred at 150 mm/min travel speed. Based on the analysis of the S/N ratio the minimum distortion is obtainedfor welding current of 140 (level 1), Gas Flow Rate of 12L/min (level 1) and travel speed of 150mm/min (level 3).
3.2 Analysis with fluxNow all the specimens with same parameter but with fluxes were analysed. In conventional GTAW the flow of molten metal
take place from centre to edge because surface tension at the centre of weld pool is lower than at the edge this result in less depthand more width of the weld pool. But when SiO2 flux added reversal of Marangoni effect take place which lead to high arcconcentration. Due to this weld penetration increase and bead width decrease considerably.3.2.1 Analysis of bead width with flux
The variation of the S/N ratio and bead width w.r.t. to current, gas flow rate and travel speed is shown graphically. For qualitypurpose one should have desire for minimum heat affected zone that is possible with minimum weld width hence for optimal resultone should try to kept minimum weld width. For this a smaller S/N value adopted for a better performance when smaller the bettermethod is used. Therefore, the optimal level of the bead width is the level with the smallest S/N value.
c
a

Kumar / International Journal of Engineering, Science and Technology, Vol. 9, No. 1, 2017, pp. 34-4540
Fig. 5 Show S/N Ratio and bead width (a)w.r.t current(b) w.r.t. gas flow rate (c) w.r.t travel speed
From the Fig. 5a, it can be seen clearly that smallest S/N value occurred at 140 ampere current. From the Fig. 5b, it can be seenclearly that smallest S/N value occurred at 12 lit/min gas flow rate. From the Fig. 5c, it can be seen clearly that smallest S/N valueoccurred at 150 mm/min travel speed. Based on the analysis of the S/N ratio the optimal bead width is obtained for welding currentof 140 (level 3), Gas Flow Rate of 12 L/min (level 3) and travel speed of 150 mm/min (level 1).
3.2.2 Analysis of penetration with fluxThe variation of the S/N ratio and penetration w.r.t. to current, gas flow rate and travel speed is shown graphically . For highstrength one should have desire for high penetration .So for optimal result one should try to kept maximum penetration .For this ahigher S/N value adopt for a better performance when larger the better method is used. Therefore, the optimal level of thepenetration is the level with the highest S/N value.
b
c
Kumar / International Journal of Engineering, Science and Technology, Vol. 9, No. 1, 2017, pp. 34-4541
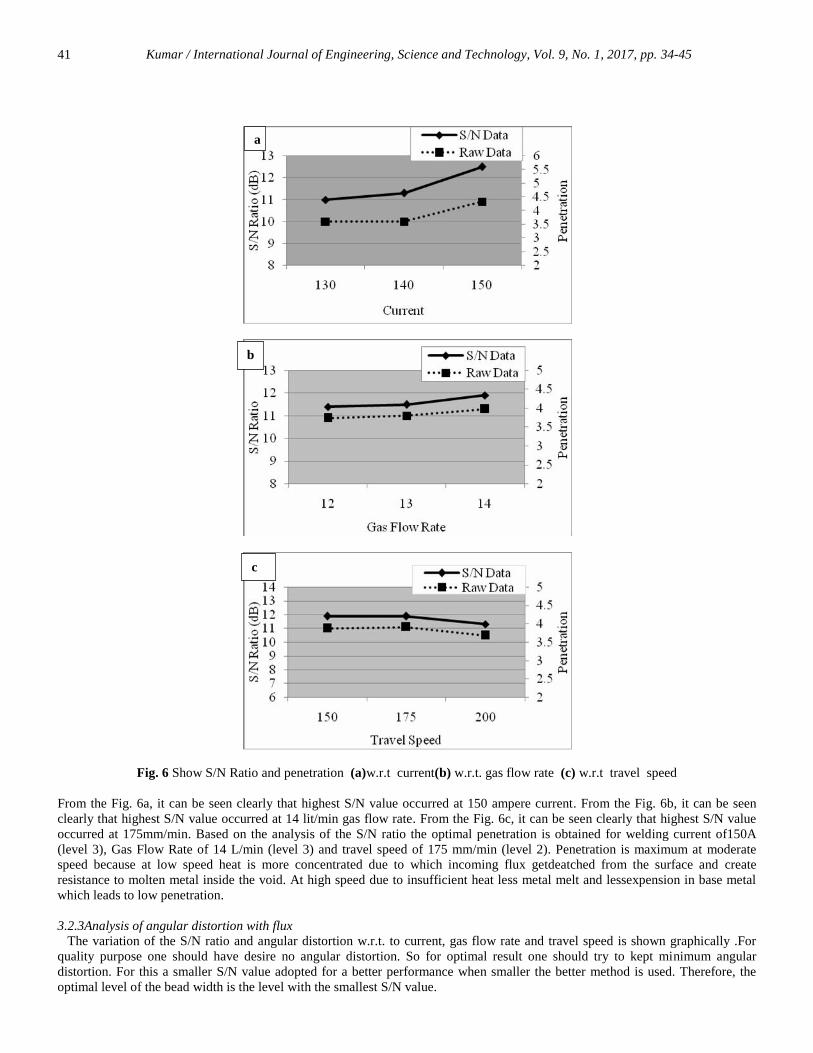
Fig. 6 Show S/N Ratio and penetration (a)w.r.t current(b) w.r.t. gas flow rate (c) w.r.t travel speed
From the Fig. 6a, it can be seen clearly that highest S/N value occurred at 150 ampere current. From the Fig. 6b, it can be seenclearly that highest S/N value occurred at 14 lit/min gas flow rate. From the Fig. 6c, it can be seen clearly that highest S/N valueoccurred at 175mm/min. Based on the analysis of the S/N ratio the optimal penetration is obtained for welding current of150A(level 3), Gas Flow Rate of 14 L/min (level 3) and travel speed of 175 mm/min (level 2). Penetration is maximum at moderatespeed because at low speed heat is more concentrated due to which incoming flux getdeatched from the surface and createresistance to molten metal inside the void. At high speed due to insufficient heat less metal melt and lessexpension in base metalwhich leads to low penetration.
3.2.3Analysis of angular distortion with fluxThe variation of the S/N ratio and angular distortion w.r.t. to current, gas flow rate and travel speed is shown graphically .For
quality purpose one should have desire no angular distortion. So for optimal result one should try to kept minimum angulardistortion. For this a smaller S/N value adopted for a better performance when smaller the better method is used. Therefore, theoptimal level of the bead width is the level with the smallest S/N value.
a
b
c

Kumar / International Journal of Engineering, Science and Technology, Vol. 9, No. 1, 2017, pp. 34-4542
Fig. 7 Show S/N Ratio and angular distortion (a)w.r.t current (b) w.r.t. gas flow rate (c) w.r.t travel speed
From the Fig. 7a, it can be seen clearly that the smallest S/N value occurred at 140 ampere current. From the Fig. 7b, it can beseen clearly that the smallest S/N value occurred at 12 lit/min gas flow rate. From the Fig. 7c, it can be seen clearly that thesmallest S/N value occurred at 150mm/min travel speed. Based on the analysis of the S/N ratio the optimal angular distortion isobtained for welding current of 140A (level 2), Gas Flow Rate of 12L/min (level 1) and travel speed of 150mm/min (level 1).
4 Comparison of Weld Geometry with Flux and Without Flux
4.1 Comparison of angular distortion between with flux and without fluxFig. 8 shows that angular distortion line without flux above the angular distortion line with flux. Comparing these two, 42.75 %
reductions have been noticed in angular distortion with flux.
a
b
c

Kumar / International Journal of Engineering, Science and Technology, Vol. 9, No. 1, 2017, pp. 34-4543
Fig. 8. Variation of angular distortions of experiment with flux and without flux
4.2 Comparison of bead width between with flux and without fluxFig. 9 shows that the bead width is narrow with flux powder as compared to bead width without flux powder. With comparingthese two, 7.75% reductions have been noticed in bead width with flux powder
Fig. 9. Variation of bead width of experiment with flux and without flux
4.3 Comparison of penetration between with flux and without fluxFig. 10 shows that the penetration is more with flux powder as compared to penetration without flux powder. With comparingthese two, 41.63% improvements have been noticed penetration with flux powder.
Fig. 10. Variation of penetration of experiment with flux and without flux
5. Conclusion
The results of present experimental work showed that the welding current and speed are the most effective parameters for weldgeometry i.e. bead width, penetration and angular distortion with flux and without flux . It was found that penetration increase withdecrease in weld travel speed and increase in current. With use of active flux, penetration can be increased in a single pass. Resultshowed that Angular distortion and bead width decreased with the use of SiO2 flux powder as compared to without flux. In short itcan be concluded that weld quality improve with the use of SiO2 flux. The application of activating flux in welding cansubstantially decrease angular distortion, increase penetration and decrease weld width as compared to welding without active flux.

Kumar / International Journal of Engineering, Science and Technology, Vol. 9, No. 1, 2017, pp. 34-4544
Nomenclature
C CarbonCr CromiumCu CopperGTAW Gas tungeston arc weldingFe IronMn MagneseMg MagnesiumNi NickleP PhasphorseSi SiliconSiO2 Silicon dioxideSS Stainless SteelTi Titanium
Acknowledgement
While bringing out this research paper to its final form, I came across a number of people whose contributions in various wayshelped my field of research and they deserve special thanks. It is a pleasure to convey my gratitude to all of them. I express mysincere thanks to my wife Meenakshi Dhull for providing useful support to complete this research paper.
References
Narayanan A., Mathew C., Baby V.Y., Joseph J., 2013, Influence of gas tungsten arc welding parameters in aluminium 5083 alloy,International Journal of Engineering Science and Innovative Technology, Vol. 2, No. 5, pp. 269-277.
Patel A.B., Patel S.P., 2014, The effect of activating fluxes in TIG welding by using ANOVA for SS 321, International Journal ofEngineering Research and Applications, Vol. 4, No. 5, pp. 41-48.
Howse D.S. and Lucas W., 2000, An investigation in to arc construction by active flux for TIG welding, Science and Technologyof Welding and Joining, Vol. 5, No. 3, pp. 189-193.
Duhan R. and Choudhary S., 2014, Effect of different fluxes on hardness and microstructure of SS 304 in GTAW welding,International Journal of Mechanical Engineering, Vol. 3, No. 4, pp. 1-8
Liu L., Zhang Z., Song G. and Shen Y., 2006, Effect of cadmium chloride flux in active flux TIG welding of magnesium alloys,Materials Transactions, Vol. 47, No. 2, pp. 446-449.
Kumar.R.D., Elangovan S., Shanmugam.N.S., 2014, Parametric optimisation of pulsed-TIG welding process in butt joining of 304austenitic stainless steel sheets, International Journal of Research in Engineering and Technology, Vol. 3, No. 11, pp. 213-219.
Tseng K. H., and Hsu C. Y., 2011, Performance of activated TIG process in austenitic stainless steel welds, Journal of MaterialsProcessing Technology, Vol. 211, No. 3, pp. 503-512
Alsabti T., Alshawaf A., and Liu S., 2014, Flux assisted gas tungsten arc and laser welding of titanium with cryolite containingfluxes: arc spectroscopy and corrosion resistance studies, Welding Journal, Vol. 93, No. 10, pp. 379S-387S
Li Q.-M., Wang X.-H., Zou Z.-D., Jun W., 2007, Effect of activating flux on arc shape and arc voltage in tungsten inert gaswelding, Transactions of Nonferrous Metals Society of China, Vol. 17, No. 3, pp. 486-490.
Xu Y. L., Dong Z. B., Wei Y. H., Yang C. L., 2007, Maragoni convection and weld shape variation in A-TIG welding process,Theoretical and Applied Fracture Mechanics, Vol. 48, No. 2, pp. 178-186.
Juang S.C., Tarng Y.S., 2002, Process parameter selection for optimizing the weld pool geometry in the tungsten inert gas weldingof stainless steel, Journal of Materials Processing Technology, Vol. 122, pp. 33-37.
Mukesh, S.S., 2013, Effect of parameters on weld pool geometry in 202 stainless steel welded joint using tungsten inert gas (TIG)process, International Journal of Science and Modern Engineering, Vol. 1, no. 12, pp. 23-32.
Shyu S.W., Huang H.Y., Tseng K.H., and Chou C.P., 2008, Study of the performance of stainless steel A-TIG welds, Journal ofMaterials Engineering and Performance, Vol. 17, No. 2, pp. 193-201.
Li D., Lu S., Dong W., Li D., Li Y., 2012, Study of the law between the weld pool shape variations with the weldingparameters under two TIG processes, Journal of Materials Processing Technology, Vol. 212, pp. 128-136.
Salleh M.S., Ramli M.I., , Yahaya S.H., 2011, Study on mechanical properties and microstructure analysis of AISI 304l stainlesssteel weldments, Journal of Mechanical Engineering and Technology, Vol. 3, No. 2, pp. 71-82.
Xi-He W., , Ji-Tai N., Shao-Kang G., Le-Jun W., Dong-Feng C., 2009, Investigation on TIG welding of SiCp-reinforcedaluminum–matrix composite using mixed shielding gas and Al–Si filler, Materials Science and Engineering: A, Vol. 499, No.1-2, pp. 106-110.
Rao R.S., Kumar C.G., Prakasham R.S., Hobbs P.J., 2008, The Taguchi methodology as a statistical tool for biotechnologicalapplica-tions: A critical appraisal, Biotechnology Journal, Vol. 3, pp. 510-523.
Reis R. P., Scotti A., Norrish J., Cuiuri D., 2013, Investigation on welding arc interruptions in the presence of magnetic fields: Arc

Kumar / International Journal of Engineering, Science and Technology, Vol. 9, No. 1, 2017, pp. 34-4545
length, torch angle and current pulsing frequency influence, IEEE Transactions on Plasma Science, Vol. 41, No. 1, pp. 133-139.
Biographical notes
Vijander Kumar received M. Tech from National Institute of Technology Jalandhar .He is working as a Assistant Professor in SLIET Longowal a Deemeduniversity under MHRD Govt. of India .His current area of research include weld bead geometry, to study weld arc, different factor that effect weld strength andweld quality
Received February 2017Accepted March 2017Final acceptance in revised form April 2017