effect of elevated temperature on green gram [vigna
TRANSCRIPT
Vol. 23, No. 1 SINGH et al. 3Journal of Agrometeorology 23 (1) : 3-13 (March 2021)
Pulses are rich in proteins and found to be main
source of protein to vegetarian people of India. It is the
second important constituent of Indian diet after cereals.
Green gram, one of the major pulse crops holds great
significance in agriculture for its low requirement of inputs
and its ability to restore soil fertility through symbiotic
nitrogen fixation. The short crop duration and its wider
adaptability to different environment and soil types make
this crop important, particularly for resource poor farmers.
In India, it is one of the important pulse crops having more
than 60% and 50% of world’s acreage and production,
respectively. The area under this crop in India has increased
from 1.99 to 4.31 million ha and production has increased
Effect of elevated temperature on green gram [Vigna radiata (I).Wilczek]
performance under temperature gradient tunnel (TGT) environment in Punjab
HARPREET SINGH, PRABHJYOT KAUR, S.K. BAL1* and B.U. CHOUDHURY2
Department of Agricultural Meteorology, Punjab Agricultural University, Ludhiana, 141004, India;1ICAR-Central Research Institute for Dry Land Agriculture, Hyderabad, 500059, India;
2ICAR-Research Complex for Northeast Hill Region, Umiam, 793103, India;
Corresponding author: [email protected]
ABSTRACT
Physiology of green gram is highly sensitive to fluctuations in the thermal environment. Abnormallyhigh temperatures during pod setting to pod development stage induces reduction in pod setting, non-healthy development and early maturity of grain which results in yield decline. We evaluated the effect ofelevated temperatures in a Temperature Gradient Tunnel (TGT) on phenology, physiology and cropperformance of green gram cultivars at semi-arid climate of Indian Punjab (Ludhiana). Five green gramcultivars were grown in TGT chambers in a factorial randomized block design with varying level of elevatedtemperatures (+3.3° C to 5.2° C) for two consecutive kharif seasons (2015-2016). The results reveal thatthe phenological stages of green gram, were advanced under elevated temperature within the TGTcompared to open / ambient condition by 12-13 days. Maximum influence was observed in pod formationand pod maturity stages. W ith rise in temperatures by 3.3 to 5.2°C in TGT over ambient condition, theplant height increased but the number of branches per plant and the total above ground biomass as wellas grain yield decreased consistently. It was found that with 1 oC increase in average seasonal temperature,the grain yield decreased by 75 kg ha-1. On the other hand, the harvest index was in general lower insideTGT chamber implying adverse influence of elevated temperature on biomass production although thepartitioning of biomass was more efficient inside the TGT as evident from increase in harvest index.There was strong negative correlation of elevated temperature (inside TGT) with different yield attr ibuteslike 1000 seed weight, number of seeds per pod and number of pods per plant. Among the five greengram cultivars, ML-2037 was the most tolerant while cv. SML-1811 was the most susceptible to elevatedtemperature condition. In general, the grain yield decreased linearly with gradual increase in temperature.Average seasonal temperature of 29-30 oC may be considered as the favourable thermal conditions forthe green gram crop in semi-arid conditions of Punjab. However, the future thrust will be to create moretemperature gradients in the lower side so that the critical temperature threshold limits for optimum yieldof green gram can be ascertained more accurately.
Keywords : Green gram, temperature gradient tunnel, growth, yield, yield attributes and elevated temperature.
from 0.60 to 2.07 million tonnes during 1964-65 to 2016-
17.
The optimum temperature for potential yield of green
gram lies between 28-30°C. According to Aggarwal et al.
(1977), green gram strains differ in their flowering response
to photoperiod and to mean temperature. A temperature
range of 27 to 32°C was found to be congenial for the
reproductive development in green gram and increased
temperature under delayed sowing significantly reduced
the pod number (Tzudir et al., 2014). Michelle (2001-02)
observed that 52% of the green gram seeds germinated at 32
°C while 43% of the seeds germinated at 21°C and none of
the seeds germinated at 10°C. In nodules, heat stress may
4 Effect of elevated temperature on green gram March 2021
either affect nitrogenase activity leading to decreased N
fixation efficiency or accelerate nodule senescence resulting
in reduced nodule longevity (Bordeleau and Prévost, 1994;
Hungria and Vargas, 2000).
The low productivity of green gram can be ascribed
to shorter crop duration and sensitivity to various abiotic
stresses. Temperature is one of the major factors affecting
the yield and quality of legumes including green gram. High
temperature negatively affects photosynthesis, respiration,
water relations and membrane stability, and also modulate
levels of hormones, primary and secondary metabolites in
field crops. Terminal heat and drought stress lead to flower
drop and reduced yield (Singh et al., 2011). Increased
flower shedding under high temperature, precipitation or
desiccating winds during flowering period in legumes have
also been reported in different studies (Sinha, 1977; Rainey
and Griffiths, 2005). The low yield of this crop is due to the
shedding of bud and flower resulting in low pod formation
(Kumari and Varma, 1983). Significant flower shedding
above 40°C in Green gram was reported by Khattak et al.
(2009).
The rapid changes in climatic patterns in the recent
years have made arid and semi-arid regions across the globe
more vulnerable. Crops like green gram which is grown
mostly in marginal lands and under rainfed conditions are
therefore at higher risk. The country’s productivity still
remains low and therefore shortage of pulses will thus
continue to be a cause of concern in the near future. Under
high temperature induced atmospheric stress, the challenge
to improve the crop productivity will be of an immense
challenge for the farming community (Bal and Minhas,
2017). Therefore, it is imperative to generate information
regarding sensitivity of green gram genotypes to higher
temperature through screening and identifying suitable
genotypes (Bal et al., 2018). Keeping the above facts in
view, this study was conducted to evaluate five cultivars of
green gramunder controlled elevated temperature
conditions.
MATERIALS AND METHODS
Study location
The present investigation was carried out in a
Temperature Gradient Tunnel (TGT) during kharif seasons
for two consecutive years (2015 and 2016) at the Research
Farm, Punjab Agricultural University, Ludhiana. The climate
at Ludhiana is characterized as semi-arid with extreme winters
and the soil type is of loamy-sand. The soil is medium in
organic carbon, available nitrogen, phosphorous and
potassium with neutral in pH.
Crop and plot details
Five green gram cultivars (PAU-911, ML-818, ML-
2037, SML-1811 and ML-2056) were sown with row to row
spacing of 30 cm and plant to plant spacing of 15 cm were
grown in open and in Temperature Gradient Tunnel (TGT)
that provides five elevated temperature regimes. Altogether
there were 30 treatment combinations (6 temperature regimes
x 5 varieties) grown in factorial randomized block design
with three replications. The sowing was done on 7 July 2015
and 12 July 2016. The recommended doses of fertilizers
(Nitrogen @ 11 kg per acre in form of urea and potassium @
16 kg P2O
5 in form of muriate of potash) were applied at the
time of sowing as per the package of practices of Punjab
Agricultural University.
Temperature gradient tunnel (TGT) structure
The TGT, a tunnel like structure (Length-30m; width-
5m; height-3m) was fabricated using galvanized iron pipes
frame and covered with UV stabilized polythene sheet having
85% transparency. Air inside the TGT was naturally warmed
up by the incident solar radiation due to greenhouse effect
making the inside air temperature higher as compared to that
of outside. However, the TGT had cooling-pad at one end,
on which water is sprinkled with a pump to produce a cool
draft. Four exhaust fans were installed at the other end of
TGT suck ambient air into tunnel through the cooling-pad
to create variable thermal regimes (temperature gradient)
along the whole length of the TGT. The inside of the tunnel
was divided into 5 sections (5m each) and 3 individual plots
in a section representing as 3 replications. Each section
represents one level of temperature along the gradient. One
set of temperature and Relative humidity sensors were
installed at each section within TGT to record the daily
progress of temperature and relative humidity during the
crop season (Fig. 1). One set of temperature and relative
humidity sensors were also installed outside the TGT to
monitor the ambient air outside the TGT. The data was
monitored by the data logger (Delta-T devices make) at five
minutes interval and recorded at half-hour interval.
Elevated temperature treatment detail
The experiment on green gram crop was performed
with one ambient temperature (S1) outside TGT and five
levels of elevated temperatures (oC) inside TGT namely +3.3
(S2), +3.9 (S
3), +4.1 (S
4), +4.3 (S
5), +4.8 (S
6) during 2015 and
similarly one outside S1 (ambient) and five inside TGT +3.9
Vol. 23, No. 1 SINGH et al. 5
(S2), +4.3 (S
3), +4.6 (S
4), +4.8 (S
5), +5.2 (S
5) during 2016.
Five thermal sensors were installed inside the tunnels at S2,
S3, S
4, S
5 and S
6 separated by 1m between two levels. The S
2
was installed near the cooling pad of the tunnel, while S6 was
near the outlet point. However, the seasonal temperature
outside tunnel was 29.6oC and 29.8oC for the crop seasons
of 2015 and 2016, respectively.
Crop observations
The duration of crop phenological stages e.g., flower
initiation (P1), 50 % flowering (P2), start pod formation (P3),
pod filling and physiological maturity (P5) were recorded.
The periodic data on plant height, number of branches/plant
and LAI were recorded at 30 days interval from the tagged
plants in two replications after sowing of the crop. At
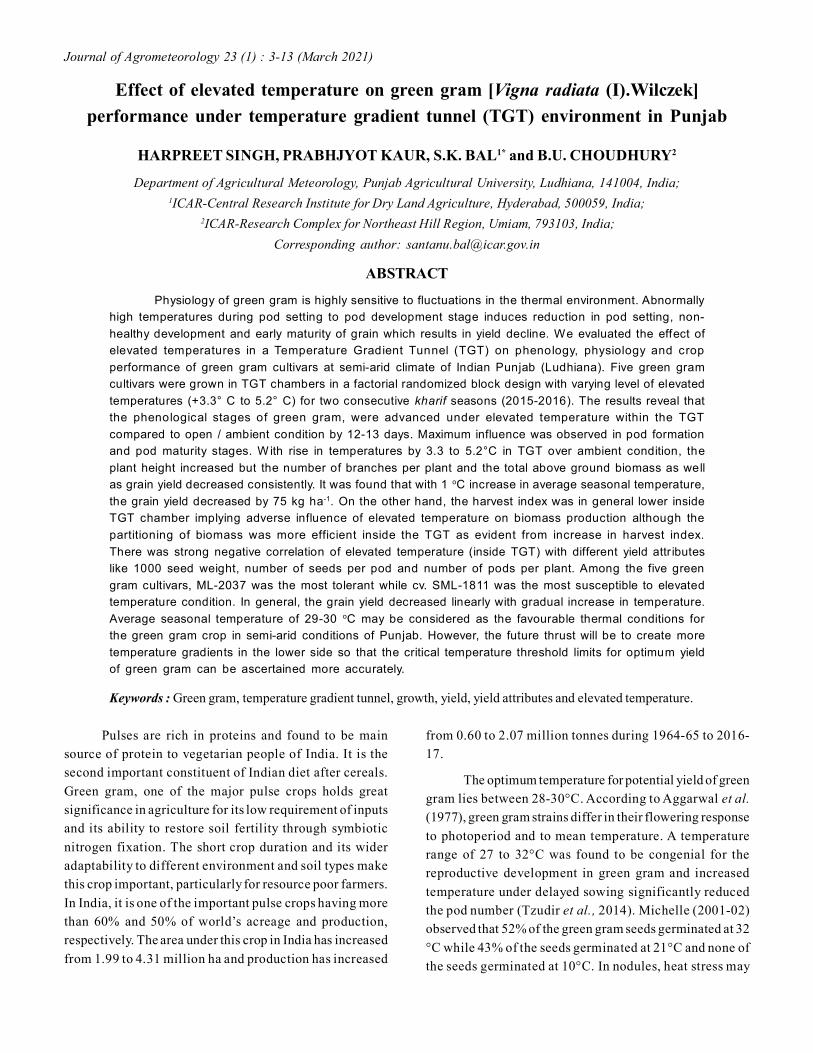
Table 1: Effect of different elevated temperature regimes (inside TGT) on growth attributes of mungbean cultivars during kharif
2015
Treatments Plant height Number of branches per plant
30 DAS 45 DAS 60 DAS 30 DAS 45 DAS 60 DAS
Elevated temperature gradient (oC)
S0: 29.6 (Ta) 35.9 50.1 79.2 6.3 8.2 8.6
S1:Ta + 3.3 31.1 44.3 68.2 5.7 7.7 8.5
S2:Ta + 3.9 31.2 45.5 70.4 5.3 7.5 8.3
S3:Ta + 4.1 32.6 45.5 70.8 5.4 7.3 7.8
S4:Ta + 4.3 33.1 46.4 73.9 5.2 7.2 7.7
S5:Ta + 4.8 33.9 47.6 75.6 5.0 7.1 7.4
CD (P=0.05) 0.77 1.5 3.6 0.18 0.19 0.18
Cultivar
PAU 911 30.8 42.9 66.4 4.9 6.8 7.7
ML 818 32.7 46.1 72.9 5.1 7.2 7.8
ML 2037 32.4 44.7 72.4 5.6 7.7 8.5
SML 1811 29.8 49.7 62.2 4.6 6.6 7.4
ML 2056 30.7 42.5 66.1 5.3 7.3 8.2
CD (P=0.05) 0.66 1.3 3.2 0.11 0.17 0.17
CD (temp x cultivar) at P = 0.05 1.62 3.4 4.1 NS NS NS
Note: Ta = Ambient temperature, outside the Temperature Gradient Tunnel
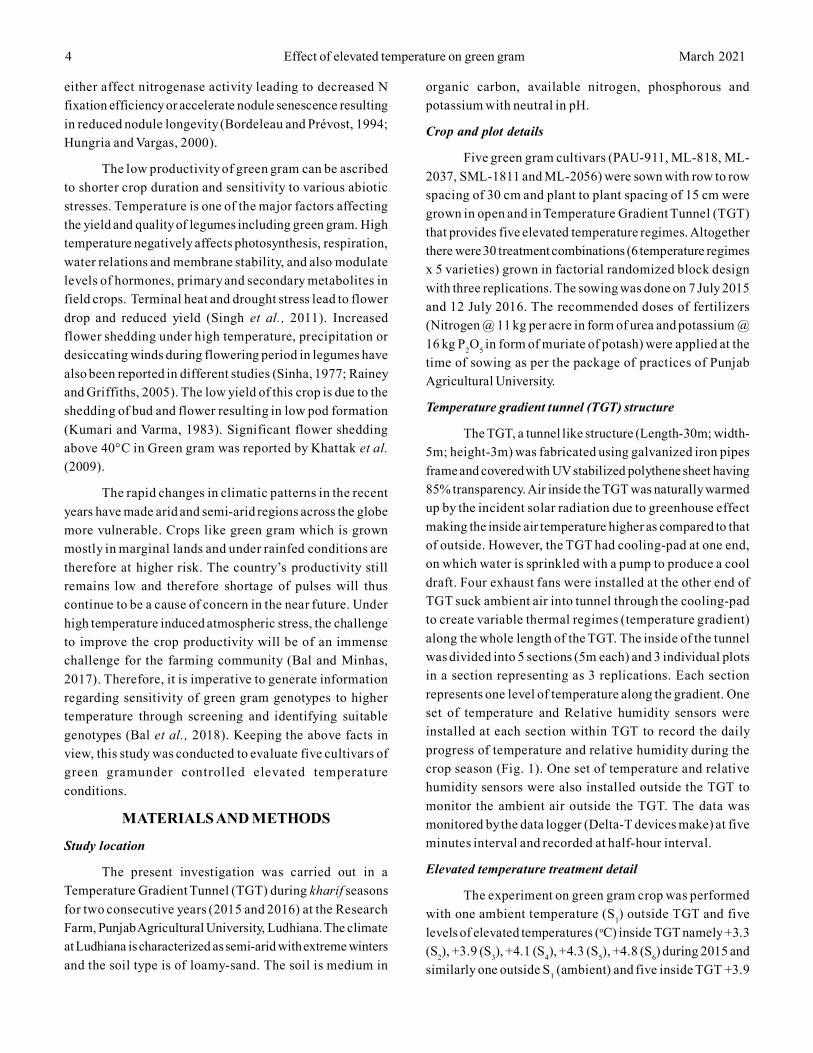
Fig.1: Elevated temperature (TGT temp – Ambient temp)
regimes within theTGTduring the crop growing
seasons (2015 and 2016)
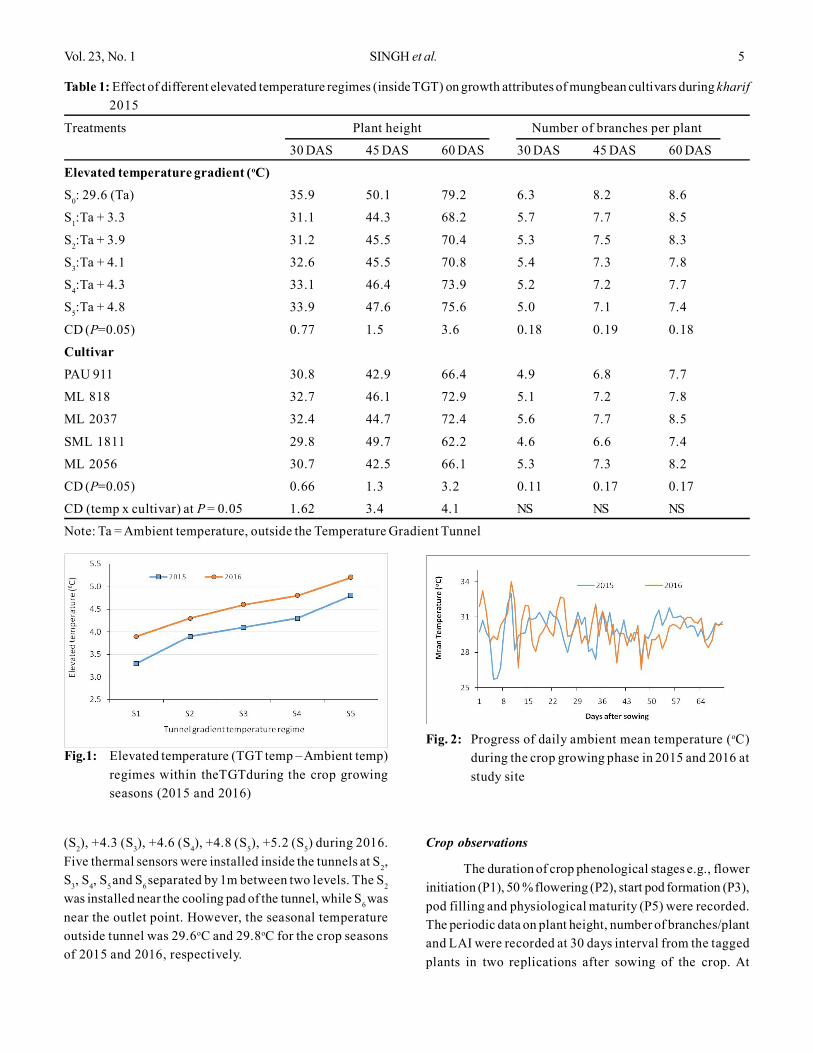
Fig. 2: Progress of daily ambient mean temperature (oC)
during the crop growing phase in 2015 and 2016 at
study site

6 Effect of elevated temperature on green gram March 2021
maturity, yield and yield attributes (plant height, pod per
plant, number of grains per pod, 100 grain weight, grain
yield and biomass yield, harvest index) were recorded.
Statistical analysis
Analysis of variance (ANOVA) was done to compare
the treatment effects and linear regression analysis done to
analyze the impact of elevated temperature on crop growth
and development by following the standard statistical
procedures (Panse and Sukhatme, 1967). As the temperature
regimes in during two study years were not identical the
pooeld analysis was not done. Furthermore, there was 15%
difference in radiation receipt between inside and outside
TGT. Hence, for linear regression study only the TGT
treatments of both the years were considered to avoid the
effect differences in radiation regime between inside and
outside TGT treatments.
RESULTS AND DISCUSSION
The average temperature gradient was +3.3, +3.9,
+4.1, +4.3 and +4.8 oC in 2015 and +3.9, +4.3, +4.6, +4.8 and
+5.2oC in 2016 where three levels of temperature i.e., +3.9,
+4.3 and +4.8 oC were common for both years (Fig. 1).
Phenological response
The phenological calendar of green gram cultivars
PAU-911, ML-818, ML-2037, SML-1811 and ML-2056
inside TGT and ambient condition for both years is presented
in Fig. 4. The crop duration of green gram reduced with
increase in temperatures in all the varieties. Crop sown under
TGT took 12-13 days less as compared to ambient conditions
to achieve different physiological events for both the years.
Green gram cultivars took 62-67 days to reach physiological
maturity under TGT during both the years. The crop duration
was minimum in +4.8oC environment and gradually increased
with lower temperature conditions. As the average
temperature of entire 2015 crop season was lesser than 2016
crop season, it resulted in the crop to mature late in 2016 (79
days) as compared to 2015 (76 days). Earlier studies have
also shown that warmer temperature hastened the crop
development and shortened the growth period (Sadras and
Mazon, 2006; Tao et al., 2006; Challinor and Wheeler,
2008). Among the cultivars, it was found that the window for
crop maturity was narrow for variety ML2037 as compared
to in stressed conditions. This signifies its better adaptability
under heat stress conditions.
Table 2:Effect of different elevated temperature regimes (inside TGT) on growth attributes of mungbean cultivars during
kharif 2016
Treatments Plant height Number of branches per plant
30 DAS 45 DAS 60 DAS 30 DAS 45 DAS 60 DAS
Elevated temperature gradient (oC)
S0: 29.8 (Ta) 41.2 68.8 88.8 5.9 7.8 7.8
S1: Ta +3.9 31.6 31.6 71.1 5.3 7.1 7.1
S2: Ta +4.3 36.6 36.6 77.8 5.1 6.9 6.9
S3: Ta +4.6 36.7 36.7 81.5 4.9 6.8 6.8
S4: Ta +4.8 37.6 37.6 82.7 4.8 6.6 6.6
S5: Ta +5.2 37.8 37.8 84.4 4.5 6.5 6.5
CD (P=0.05) 2.8 1.8 1.9 0.19 0.12 0.12
Cultivar
PAU 911 33.4 61.8 77.3 4.5 6.3 7.3
ML 818 34.8 63.8 80.4 4.7 6.6 7.4
ML 2037 34.6 63.6 77.5 5.3 7.2 8.1
SML 1811 31.9 57.0 73.5 4.3 6.1 7.0
ML 2056 33.3 59.2 74.1 4.9 6.8 7.8
CD (P=0.05) NS* 1.6 1.7 0.17 0.11 0.14
CD (temp x cultivar) at P = 0.05 2.4 4.1 4.3 NS NS NS
Note: Ta = Ambient temperature, outside the Temperature Gradient Tunnel

Vol. 23, No. 1 SINGH et al. 7
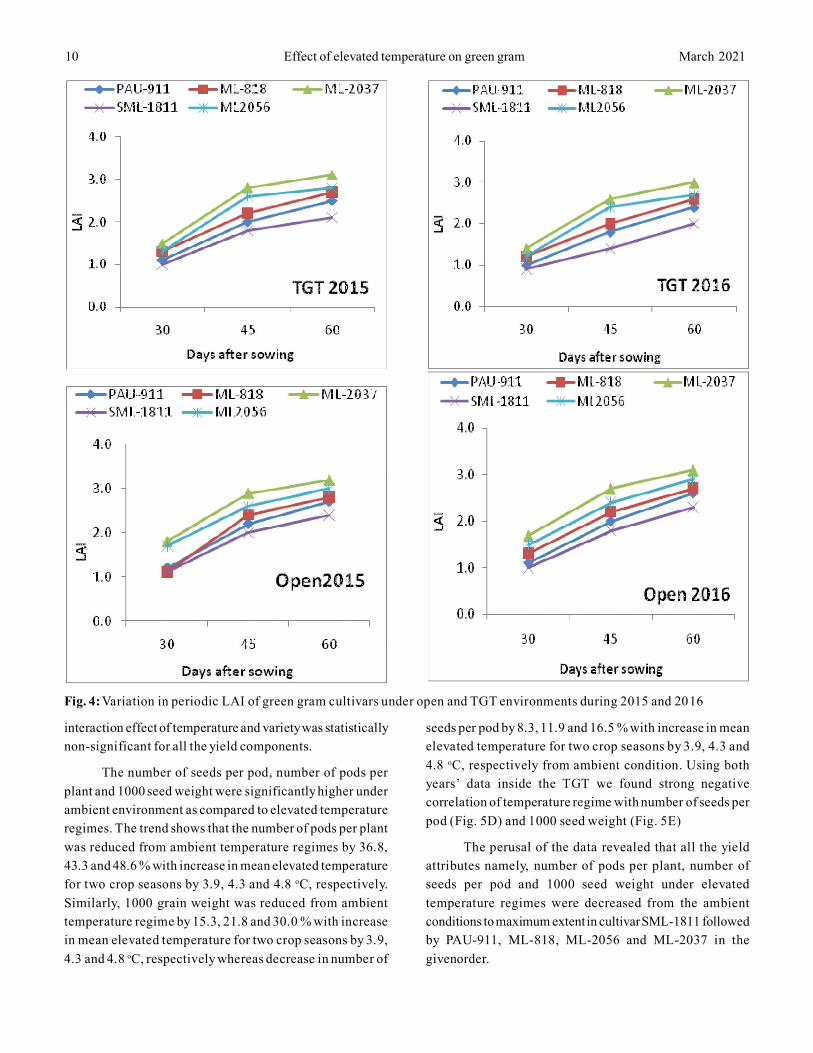
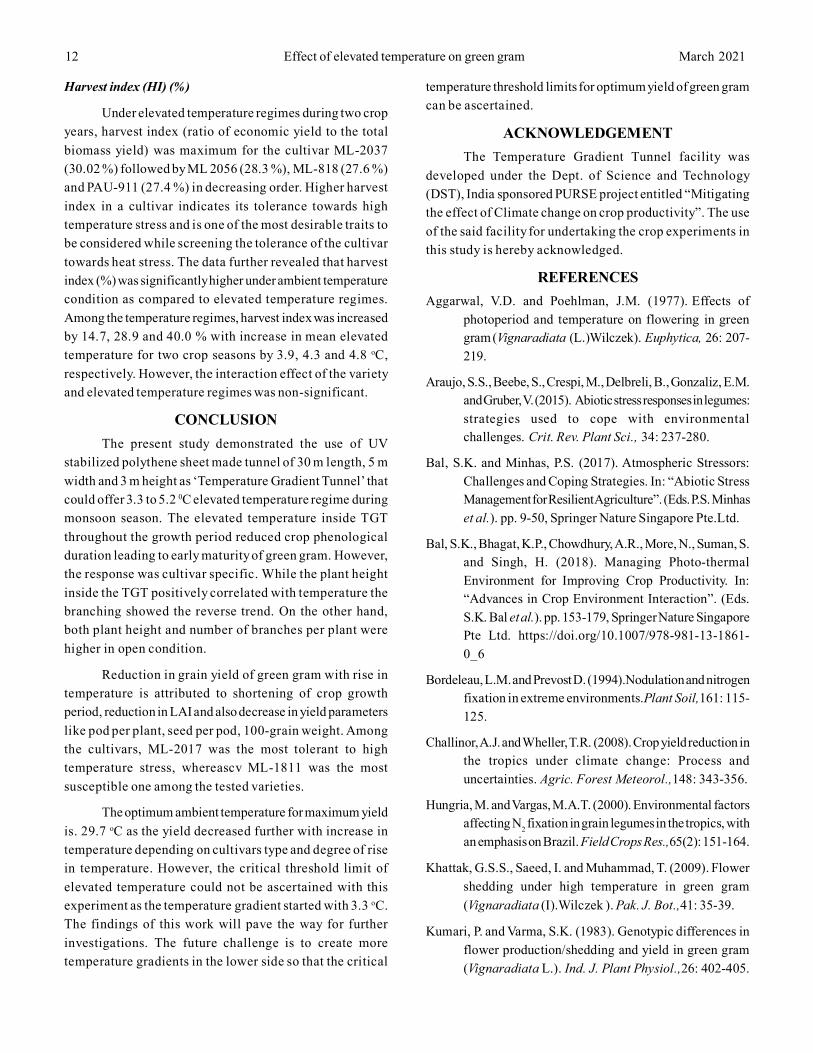
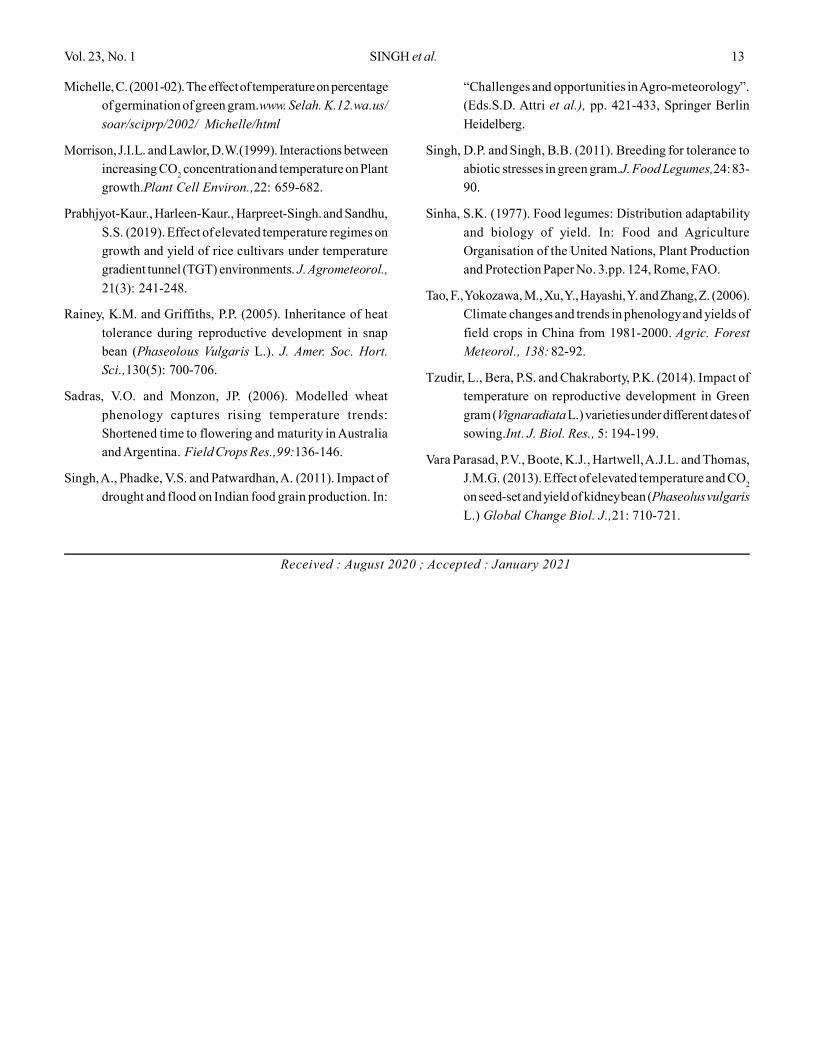
Leaf area index (LAI)
Amongst the cultivars, the decrease in LAI was
maximum in SML-1811 (2.2) followed by that of PAU-911
(2.5), ML-818 (2.7), ML-2056 (2.8) and ML-2037 (3.1) in
crop seasons 2015 and 2016 (Fig. 5) in both open and TGT
chambers under elevated temperature condition. In all the
cultivars, leaf area of the crop decreased with increase in
temperature. The variability in leaf area under TGT was more
pronounced as compared to open condition. Earlier studies
indicated that the initiation and expansion of roots, leaves,
shoots, tillers, branches and reproductive organs are strongly
driven by temperature (Morrison and Lawlor, 1999) and
warmer condition both accelerated rate of organ initiation
and shortened duration of organ growth, thereby leading to
Fig. 3: Effect of elevated temperature on the phenology of five green gram cultivars in the year 2015 and 2016 (The
phonological duration inside TGT expressed as deviation from ambient condition)
[P1: flower initiation (P1), P2: 50 % flowering (P2), P3: start pod formation (P3),
P4: pod filling and P5: physiological maturity (P5)]

8 Effect of elevated temperature on green gram March 2021
reduced growth of plants at higher temperature. Shah and
Paulsen (2003) also stated that high temperature adversely
affected photosynthesis in wheat.
Plant height
The comparison among the varieties shows that the
variety ML818 recorded maximum plant height in both
2015 and 2016 whereas the var, SML1811 recorded the
lowest plant height. The plant height was significantly
higher under ambient condition than under elevated
temperature regimes (Table 2). The plant height increased
maximum up to 60 DAS in ambient temperature regimes and
decreased by 4.7, 7.1, 9.2, 11.8 and 17.1% with increase in
mean elevated temperature of two crop seasons by +3.9,
+4.3 and +4.8 oC, respectively. The analysis showed that
although the ambient temperature condition recorded higher
plant height, there was strong positive correlation between
air temperature and plant height (P <0.001) inside TGT (Fig.
5A). While under open condition the plants get ample
amount light for higher growth and plant height, the plants
inside TGT received 15% less light. However, under reduced
light condition higher thermal regime has led to increase
plant height. The interaction effect of thermal regime and
cultivar was significant with respect to plant height with rate
of decrease minimum (4.7 %) and maximum (17.1%) for
varieties ML 2037 and SML 1811, respectively.
Number of branches per plant
The analyzed data reveal that number of branches per
plant was significantly higher under ambient conditions as
compared to elevated temperature regimes. Compared to
ambient temperature, the reduction in number of branches
per plant was 3.5 to 14.1% under elevated temperatures
during the two crop seasons. It was also revealed that, under
elevated temperature regimes during two crop seasons, the
number of branches was maximum in cultivar ML-2037 (5.4)
followed by ML-2056 (5.1), ML-818 (4.9), PAU-911 (4.7),
SML-1811 (4.5), respectively. However, the interaction
effect of cultivar and elevated temperature was statistically
non-significant.
Biomass yield
Rise in temperature inside the TGT caused significant
reduction in biomass in both the crop seasons. The biomass
yield was about 1.6 times higher under ambient conditions
(4631.6 kgha-1) as compare to elevated temperature regimes
Table 3: Effect of elevated temperature regimes (inside TGT) on yield and yield components of mungbean cultivars during
kharif, 2015
Treatments Grain yield Biomass Seeds per Pods per 1000 grain Harvest
(kg ha-1) yield (kg ha-1) pod plant weight (g) index (%)
Elevated temperature gradient (oC)
S0: 29.6 (Ta) 1040.0 4631.6 10.9 44.3 42.7 22.3
S2: Ta + 3.3 758.3 2998.3 10.2 27.6 35.6 25.7
S3: Ta + 3.9 745.8 2879.9 9.8 25.5 34.1 25.6
S4: Ta + 4.1 706.6 2292.4 9.5 22.8 32.0 30.6
S5: Ta + 4.3 683.3 2163.3 9.4 21.6 31.0 31.2
S5: Ta + 4.8 650.8 2112.8 9.2 20.4 29.3 30.7
CD (P=0.05) 31.8 72.7 0.27 1.7 1.5 2.1
Cultivar
PAU 911 720.8 2728.4 9.4 23.2 32.2 26.4
ML 818 763.2 2874.2 10.1 26.0 34.3 27.5
ML 2037 843.7 3122.9 10.6 32.4 37.2 27.9
SML 1811 701.3 2466.6 9.0 23.9 30.9 28.9
ML 2056 791.6 3042.3 10.3 29.5 36.1 27.7
CD (P=0.05) 29.1 66.4 0.25 1.6 1.4 NS
CD (temp x cultivar) at P = 0.05 NS 162 NS NS NS NS
Note: Ta = Ambient temperature, outside the Temperature Gradient Tunnel
Vol. 23, No. 1 SINGH et al. 9
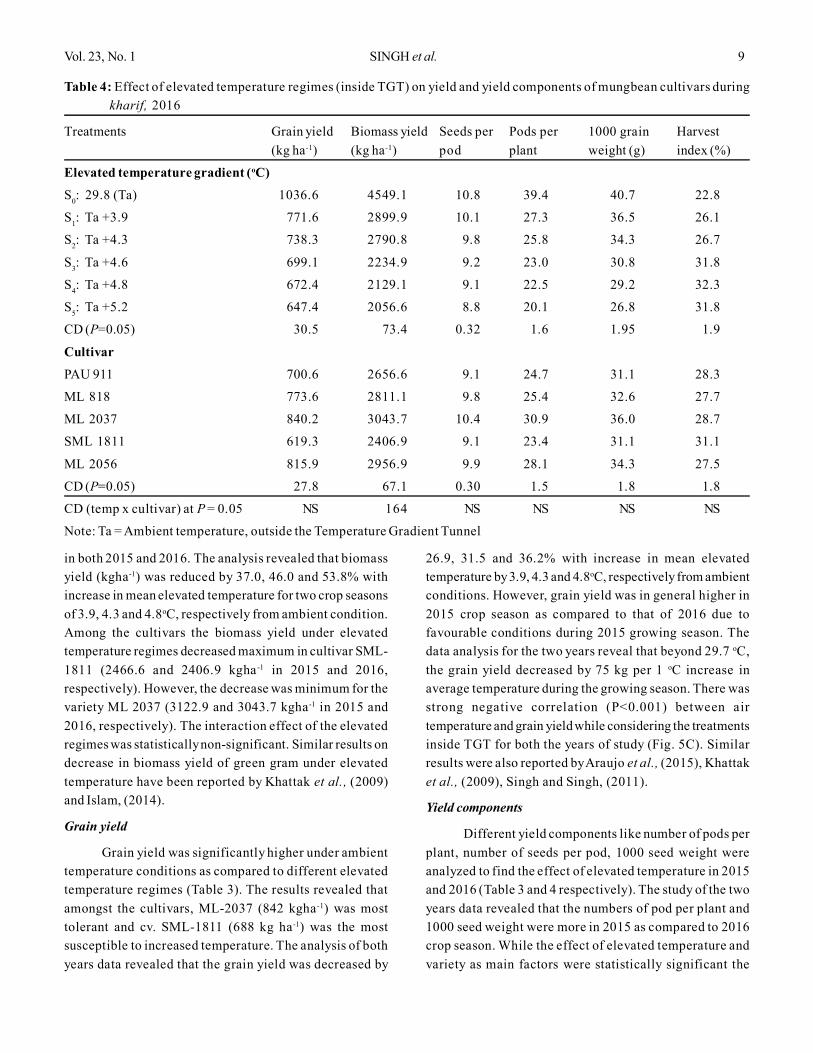
Table 4: Effect of elevated temperature regimes (inside TGT) on yield and yield components of mungbean cultivars during
kharif, 2016
Treatments Grain yield Biomass yield Seeds per Pods per 1000 grain Harvest
(kg ha-1) (kg ha-1) pod plant weight (g) index (%)
Elevated temperature gradient (oC)
S0: 29.8 (Ta) 1036.6 4549.1 10.8 39.4 40.7 22.8
S1: Ta +3.9 771.6 2899.9 10.1 27.3 36.5 26.1
S2: Ta +4.3 738.3 2790.8 9.8 25.8 34.3 26.7
S3: Ta +4.6 699.1 2234.9 9.2 23.0 30.8 31.8
S4: Ta +4.8 672.4 2129.1 9.1 22.5 29.2 32.3
S5: Ta +5.2 647.4 2056.6 8.8 20.1 26.8 31.8
CD (P=0.05) 30.5 73.4 0.32 1.6 1.95 1.9
Cultivar
PAU 911 700.6 2656.6 9.1 24.7 31.1 28.3
ML 818 773.6 2811.1 9.8 25.4 32.6 27.7
ML 2037 840.2 3043.7 10.4 30.9 36.0 28.7
SML 1811 619.3 2406.9 9.1 23.4 31.1 31.1
ML 2056 815.9 2956.9 9.9 28.1 34.3 27.5
CD (P=0.05) 27.8 67.1 0.30 1.5 1.8 1.8
CD (temp x cultivar) at P = 0.05 NS 164 NS NS NS NS
Note: Ta = Ambient temperature, outside the Temperature Gradient Tunnel
in both 2015 and 2016. The analysis revealed that biomass
yield (kgha-1) was reduced by 37.0, 46.0 and 53.8% with
increase in mean elevated temperature for two crop seasons
of 3.9, 4.3 and 4.8oC, respectively from ambient condition.
Among the cultivars the biomass yield under elevated
temperature regimes decreased maximum in cultivar SML-
1811 (2466.6 and 2406.9 kgha -1 in 2015 and 2016,
respectively). However, the decrease was minimum for the
variety ML 2037 (3122.9 and 3043.7 kgha-1 in 2015 and
2016, respectively). The interaction effect of the elevated
regimes was statistically non-significant. Similar results on
decrease in biomass yield of green gram under elevated
temperature have been reported by Khattak et al., (2009)
and Islam, (2014).
Grain yield
Grain yield was significantly higher under ambient
temperature conditions as compared to different elevated
temperature regimes (Table 3). The results revealed that
amongst the cultivars, ML-2037 (842 kgha-1) was most
tolerant and cv. SML-1811 (688 kg ha-1) was the most
susceptible to increased temperature. The analysis of both
years data revealed that the grain yield was decreased by
26.9, 31.5 and 36.2% with increase in mean elevated
temperature by 3.9, 4.3 and 4.8oC, respectively from ambient
conditions. However, grain yield was in general higher in
2015 crop season as compared to that of 2016 due to
favourable conditions during 2015 growing season. The
data analysis for the two years reveal that beyond 29.7 oC,
the grain yield decreased by 75 kg per 1 oC increase in
average temperature during the growing season. There was
strong negative correlation (P<0.001) between air
temperature and grain yield while considering the treatments
inside TGT for both the years of study (Fig. 5C). Similar
results were also reported by Araujo et al., (2015), Khattak
et al., (2009), Singh and Singh, (2011).
Yield components
Different yield components like number of pods per
plant, number of seeds per pod, 1000 seed weight were
analyzed to find the effect of elevated temperature in 2015
and 2016 (Table 3 and 4 respectively). The study of the two
years data revealed that the numbers of pod per plant and
1000 seed weight were more in 2015 as compared to 2016
crop season. While the effect of elevated temperature and
variety as main factors were statistically significant the
10 Effect of elevated temperature on green gram March 2021
Fig. 4:Variation in periodic LAI of green gram cultivars under open and TGT environments during 2015 and 2016
interaction effect of temperature and variety was statistically
non-significant for all the yield components.
The number of seeds per pod, number of pods per
plant and 1000 seed weight were significantly higher under
ambient environment as compared to elevated temperature
regimes. The trend shows that the number of pods per plant
was reduced from ambient temperature regimes by 36.8,
43.3 and 48.6 % with increase in mean elevated temperature
for two crop seasons by 3.9, 4.3 and 4.8 oC, respectively.
Similarly, 1000 grain weight was reduced from ambient
temperature regime by 15.3, 21.8 and 30.0 % with increase
in mean elevated temperature for two crop seasons by 3.9,
4.3 and 4.8 oC, respectively whereas decrease in number of
seeds per pod by 8.3, 11.9 and 16.5 % with increase in mean
elevated temperature for two crop seasons by 3.9, 4.3 and
4.8 oC, respectively from ambient condition. Using both
years’ data inside the TGT we found strong negative
correlation of temperature regime with number of seeds per
pod (Fig. 5D) and 1000 seed weight (Fig. 5E)
The perusal of the data revealed that all the yield
attributes namely, number of pods per plant, number of
seeds per pod and 1000 seed weight under elevated
temperature regimes were decreased from the ambient
conditions to maximum extent in cultivar SML-1811 followed
by PAU-911, ML-818, ML-2056 and ML-2037 in the
givenorder.

Vol. 23, No. 1 SINGH et al. 11
Fig-5: Relation between temperature and grain yield and yield attributes of green gram cultivars inside the TGT[ **
Regression significant at P = 0.001, * Regression significant at P = 0.005]
Khattak et al. (2009) reported shedding of pods in
green gram crop with increase in temperature. Morrison and
Lawrol (1999) also reported that number of pods decreased
with increase in temperature. Kumari and Varma (1983) have
reported the adverse effect of elevated temperature on
number of seeds per pod. Vara Parsad et al. (2013) opined
that grain development in green gram is highly susceptible
to high temperature stress. The effect of heat stress on yield
and yield components might be attributed to the nitrate
assimilation in legumes by lowering synthesis of ureides and
decreasing levels and activities of nitrate reductase and
glutamate synthase (Hungria and Vargas, 2000). The strong
negative correlation of different yield components with
temperature in the present studies is in agreement with the
earlier studies.
12 Effect of elevated temperature on green gram March 2021
Harvest index (HI) (%)
Under elevated temperature regimes during two crop
years, harvest index (ratio of economic yield to the total
biomass yield) was maximum for the cultivar ML-2037
(30.02 %) followed by ML 2056 (28.3 %), ML-818 (27.6 %)
and PAU-911 (27.4 %) in decreasing order. Higher harvest
index in a cultivar indicates its tolerance towards high
temperature stress and is one of the most desirable traits to
be considered while screening the tolerance of the cultivar
towards heat stress. The data further revealed that harvest
index (%) was significantly higher under ambient temperature
condition as compared to elevated temperature regimes.
Among the temperature regimes, harvest index was increased
by 14.7, 28.9 and 40.0 % with increase in mean elevated
temperature for two crop seasons by 3.9, 4.3 and 4.8 oC,
respectively. However, the interaction effect of the variety
and elevated temperature regimes was non-significant.
CONCLUSION
The present study demonstrated the use of UV
stabilized polythene sheet made tunnel of 30 m length, 5 m
width and 3 m height as ‘Temperature Gradient Tunnel’ that
could offer 3.3 to 5.2 0C elevated temperature regime during
monsoon season. The elevated temperature inside TGT
throughout the growth period reduced crop phenological
duration leading to early maturity of green gram. However,
the response was cultivar specific. While the plant height
inside the TGT positively correlated with temperature the
branching showed the reverse trend. On the other hand,
both plant height and number of branches per plant were
higher in open condition.
Reduction in grain yield of green gram with rise in
temperature is attributed to shortening of crop growth
period, reduction in LAI and also decrease in yield parameters
like pod per plant, seed per pod, 100-grain weight. Among
the cultivars, ML-2017 was the most tolerant to high
temperature stress, whereascv ML-1811 was the most
susceptible one among the tested varieties.
The optimum ambient temperature for maximum yield
is. 29.7 oC as the yield decreased further with increase in
temperature depending on cultivars type and degree of rise
in temperature. However, the critical threshold limit of
elevated temperature could not be ascertained with this
experiment as the temperature gradient started with 3.3 oC.
The findings of this work will pave the way for further
investigations. The future challenge is to create more
temperature gradients in the lower side so that the critical
temperature threshold limits for optimum yield of green gram
can be ascertained.
ACKNOWLEDGEMENT
The Temperature Gradient Tunnel facility was
developed under the Dept. of Science and Technology
(DST), India sponsored PURSE project entitled “Mitigating
the effect of Climate change on crop productivity”. The use
of the said facility for undertaking the crop experiments in
this study is hereby acknowledged.
REFERENCES
Aggarwal, V.D. and Poehlman, J.M. (1977). Effects of
photoperiod and temperature on flowering in greengram (Vignaradiata (L.)Wilczek). Euphytica, 26: 207-
219.
Araujo, S.S., Beebe, S., Crespi, M., Delbreli, B., Gonzaliz, E.M.and Gruber, V. (2015). Abiotic stress responses in legumes:
strategies used to cope with environmentalchallenges. Crit. Rev. Plant Sci., 34: 237-280.
Bal, S.K. and Minhas, P.S. (2017). Atmospheric Stressors:
Challenges and Coping Strategies. In: “Abiotic StressManagement for Resilient Agriculture”. (Eds. P.S. Minhas
et al.). pp. 9-50, Springer Nature Singapore Pte.Ltd.
Bal, S.K., Bhagat, K.P., Chowdhury, A.R., More, N., Suman, S.and Singh, H. (2018). Managing Photo-thermal
Environment for Improving Crop Productivity. In:“Advances in Crop Environment Interaction”. (Eds.
S.K. Bal et al.). pp. 153-179, Springer Nature SingaporePte Ltd. https://doi.org/10.1007/978-981-13-1861-
0_6
Bordeleau, L.M. and Prevost D. (1994).Nodulation and nitrogenfixation in extreme environments.Plant Soil,161: 115-
125.
Challinor, A.J. and Wheller, T.R. (2008). Crop yield reduction inthe tropics under climate change: Process and
uncertainties. Agric. Forest Meteorol.,148: 343-356.
Hungria, M. and Vargas, M.A.T. (2000). Environmental factorsaffecting N
2 fixation in grain legumes in the tropics, with
an emphasis on Brazil. Field Crops Res.,65(2): 151-164.
Khattak, G.S.S., Saeed, I. and Muhammad, T. (2009). Flower
shedding under high temperature in green gram
(Vignaradiata (I).Wilczek ). Pak. J. Bot.,41: 35-39.
Kumari, P. and Varma, S.K. (1983). Genotypic differences in
flower production/shedding and yield in green gram
(Vignaradiata L.). Ind. J. Plant Physiol.,26: 402-405.
Vol. 23, No. 1 SINGH et al. 13
Michelle, C. (2001-02). The effect of temperature on percentage
of germination of green gram.www. Selah. K.12.wa.us/
soar/sciprp/2002/ Michelle/html
Morrison, J.I.L. and Lawlor, D.W.(1999). Interactions between
increasing CO2 concentration and temperature on Plant
growth.Plant Cell Environ.,22: 659-682.
Prabhjyot-Kaur., Harleen-Kaur., Harpreet-Singh. and Sandhu,
S.S. (2019). Effect of elevated temperature regimes on
growth and yield of rice cultivars under temperature
gradient tunnel (TGT) environments. J. Agrometeorol.,
21(3): 241-248.
Rainey, K.M. and Griffiths, P.P. (2005). Inheritance of heat
tolerance during reproductive development in snap
bean (Phaseolous Vulgaris L.). J. Amer. Soc. Hort.
Sci.,130(5): 700-706.
Sadras, V.O. and Monzon, JP. (2006). Modelled wheat
phenology captures rising temperature trends:
Shortened time to flowering and maturity in Australia
and Argentina. Field Crops Res.,99:136-146.
Singh, A., Phadke, V.S. and Patwardhan, A. (2011). Impact of
drought and flood on Indian food grain production. In:
“Challenges and opportunities in Agro-meteorology”.
(Eds.S.D. Attri et al.), pp. 421-433, Springer Berlin
Heidelberg.
Singh, D.P. and Singh, B.B. (2011). Breeding for tolerance to
abiotic stresses in green gram.J. Food Legumes,24: 83-
90.
Sinha, S.K. (1977). Food legumes: Distribution adaptability
and biology of yield. In: Food and Agriculture
Organisation of the United Nations, Plant Production
and Protection Paper No. 3.pp. 124, Rome, FAO.
Tao, F., Yokozawa, M., Xu, Y., Hayashi, Y. and Zhang, Z. (2006).
Climate changes and trends in phenology and yields of
field crops in China from 1981-2000. Agric. Forest
Meteorol., 138: 82-92.
Tzudir, L., Bera, P.S. and Chakraborty, P.K. (2014). Impact of
temperature on reproductive development in Green
gram (Vignaradiata L.) varieties under different dates of
sowing.Int. J. Biol. Res., 5: 194-199.
Vara Parasad, P.V., Boote, K.J., Hartwell, A.J.L. and Thomas,
J.M.G. (2013). Effect of elevated temperature and CO2
on seed-set and yield of kidney bean (Phaseolus vulgaris
L.) Global Change Biol. J.,21: 710-721.
Received : August 2020 ; Accepted : January 2021