effect of electron beam irradiation on proximate...
TRANSCRIPT

28
CHAPTER – 3
EFFECT OF ELECTRON BEAM IRRADIATION ON
PROXIMATE COMPOSITION OF MIXED FRUIT JAM AND
JELLY PRODUCTS
3.1 INTRODUCTION
Jams, jellies, fruit bars and preserves are the most important fruit products
manufactured in industries based on the high solids high acid principle and prepared
from a combination of two or more fruits and they possess substantial nutritive value
(Vidhya and Anandhi Narain, 2011). The knowledge of qualitative and quantitative
chemical composition of product is of prime importance for enhancing the quality of
products at various stages of production i.e. preparation, processing, packing,
transportation, storage, trade and marketing.
Proximate analysis of food products were intended to establish the nutritional
value of the products. The proximate properties of foods are ultimately determine their
perceived quality, nutritional, sensorial attributes, shelf life and behavior of the food
product during production, storage and consumption. There are usually a number of
different analytical techniques available to determine the proximate composition of
food material (Mazumdar and Majumder, 2003). In the present study, mixed fruit jam
and jelly products were exposed to electron beam irradiation at doses of 2.5, 5, 7.5 and
10 kGy. The proximate values of control and irradiated samples were analyzed
immediately after irradiation and at monthly intervals over a period of storage to
evaluate the effect of electron beam irradiation on jam and jelly products. In this study
proximate parameters of jam and jelly products including pH, electrical conductivity,
acidity, moisture, total solids, ash, pectin, crude fibre, total and reducing sugars, total
protein and lipids, calorific value, UV-Visible spectrum analysis and microscopic
structure analysis were determined in irradiated and control samples by using standard
food analytical methods (AOAC, 1984).

29
3.2 MATERIALS AND METHODS
3.2.1 Preparation of Fruit Products
The chosen fruit based products, mixed fruit jam and jellies were prepared
without any chemical preservatives to determine the preservation efficiency of electron
beam irradiation in jam and jelly products. It was prepared at Community Food and
Nutrition Extension Unit, Madurai, Tamil Nadu. Jam and jellies can be prepared either
from an individual fruit or mixed fruits. The important constituents in the preparation
of jams and jellies are pectin, sugar and acids in correct proportion for proper gel
formation. The fruits were selected for jam and jelly preparation as fresh, healthy,
matured and firmly ripped wherein the pectin and acid contents are good and provide
better nutrients.
3.2.1.1 Mixed Fruit Jam
Jam is prepared by boiling the fruit with sufficient quantity of sugar to
reasonably thick consistency. The fruits such as papaya, banana, mango, apple,
pineapple and guava were procured with the optimum stage of maturity for jam
production from local wholesale market at Tirunelveli, Tamil Nadu. The fruits were
washed in running tap water, peeled and cut into small pieces. For pulping, the fruits
were passed through a sieve and ground into suitable consistency with using a mixer.
The pulps were taken in equal proportions from various fruits used in this study; it has
mixed with sugar and boiled in stainless steel kettle till the end point was reached. The
end point can be determined by looking bubbles at the sides of the vessel while heating
and plate method was also used for confirmation. In plate method, a drop of boiling
mixture was taken on a stainless steel plate, cool and tilt the plate when the mixture
moved as a single mass, if jam is ready to set. Finally the acidity of jam was adjusted
with addition of lemon juice (source of acid) in the finished product (Singh et al., 2009;
FPO, 1955). After preparation, the jam was placed in sterile glass jars and it cooled
down to room temperature. The ingredients used for jam making was given in
Table 3.1.

30
Table 3.1 Materials required for jam preparation
Ingredients Quantity
Fruit pulps 1 kg
Sugar 800 gm
Acids (Lemon juice) Sufficient quantity
Red raspberry powder a pinch
Pineapple essence ½ tsp
3.2.1.2 Mixed Fruit Jelly
Jelly can be prepared by boiling pectin rich fruit extract with sufficient quantity
of sugar and acids which it will form a clear gel. The pectin rich fruits such as guava,
apple and papaya were obtained from local wholesale market with the optimum stage
of maturity for jelly preparation. The fresh sound fruits were selected and washed with
running tab water, cut into thin circular pieces and it was boiled in water for extraction
and meshed up slightly with wooden ladle. After, it was filtered through a strainer. The
strained fruit extract (free from pulp) was collected and the amount of pectin present in
the extract was determined by using clotting method for determining the quantity of
pectin, sugar and acid required for jelly preparation. In clotting method, a drop of
strained fruit extract is mixed with pinch of sugar and acids. Then observe the clot
formation efficiency which is mainly based on the amount of pectin present in the
extract. For preparation of jelly, the strained fruit extract was mixed with sugar, acid
and boiled in stainless steel kettle till the end point was reached. The end point was
determined by sheet method, using wooden ladle to pick up the boiled mixture, cool
and drop it slowly. If jelly is ready to set it will fall in the form of sheet. After
preparation, the jelly was poured in sterile glass jars and it cooled down to room
temperature (FPO, 1955). The ingredients used for jelly preparation was given in
Table 3.2.

31
Table 3.2 Materials required for jelly preparation
Ingredients Quantity
Strained fruit extract 1 kg
Sugar 750 gm
Acids (Lemon juice) Sufficient quantity
Pineapple essence ½ tsp
3.2.2 Electron Beam Irradiation
The freshly prepared mixed fruit jam and jelly products were packed separately
in polypropylene bags (6×6 cm). Each bag was packed with approximately 75 – 100 g
of the product. The packed samples were exposed to Electron beam radiation at
Microtron Centre, Mangalore University, Mangalagangothri, Karnataka (Plate 3.1).
The conditions of the Microtron accelerator were maintained as: Dose rate, 3kGy min-
1; Beam energy, 8MeV; Electron pulse current, 15mA; Beam Uniformity, 8×8 cm. The
samples were exposed to double side irradiation for uniformity in dose delivery. The
dose levels applied to jam and jelly were 2.5, 5.0, 7.5 and 10 kGy. The absorbed dose
was measured by using chemical dosimetry. All the irradiated samples were stored at
room temperature for subsequent analysis and it was shown in the Plate 3.2 and Plate
3.3. The quality parameters were analyzed at monthly intervals over a period of storage
(Ramathilaga and Murugesan, 2011).
3.2.2.1 Preparation of Control Samples
Jams and jellies are sugar containing food products which are possible to
getting microbial spoilage immediately after preparation. The shelf life of traditional
jam and jelly products have minimum storage period when without use of any
preservation method. The commercially available jam and jelly products were routinely
preserved with addition of chemical preservatives which have relatively long storage
period than traditional products. Hence, the control jam and jelly samples were
prepared based on the method stated above but with added chemical preservative (0.1%
of Sodium benzoate) and packed separately in polypropylene bags. These packed
32
samples without irradiation were used as control sample in the entire study. The control
samples used in this study are also defined as non-irradiated sample and 0 kGy. It was
stored at room temperature and the quality parameters were analyzed at monthly
intervals over a period of storage (Plate 3.2 and Plate 3.3).
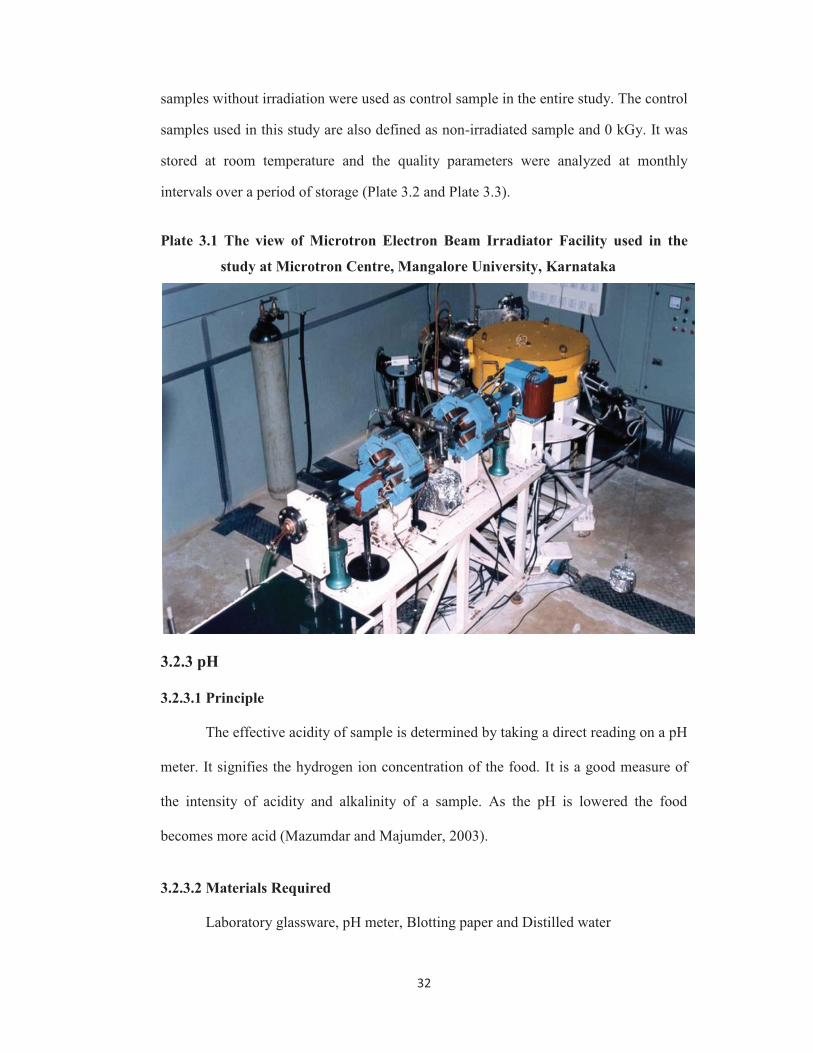
Plate 3.1 The view of Microtron Electron Beam Irradiator Facility used in the
study at Microtron Centre, Mangalore University, Karnataka
3.2.3 pH
3.2.3.1 Principle
The effective acidity of sample is determined by taking a direct reading on a pH
meter. It signifies the hydrogen ion concentration of the food. It is a good measure of
the intensity of acidity and alkalinity of a sample. As the pH is lowered the food
becomes more acid (Mazumdar and Majumder, 2003).
3.2.3.2 Materials Required
Laboratory glassware, pH meter, Blotting paper and Distilled water

33
Plate 3.2 The packages of electron beam irradiated and control (0 kGy) mixed
fruit jam products
Plate 3.3 The packages of electron beam irradiated and control (0 kGy) mixed
fruit jelly products

34
3.2.3.3 Procedure
The pH meter was standardized with a pH 4.0 buffer solution.
Five gram of food sample was thoroughly mixed in 100 ml of distilled water
The sample was stirred well and then allowed to settle down
The electrode was immersed carefully into the suspension
The pH of the samples was recorded digitally
3.2.4 Electrical Conductivity
3.2.4.1 Principle
Conductivity (EC) is a measure of the ability of an aqueous solution to carry an
electric current. This ability depends on the presence of ions; on their total
concentration, mobility, valence and temperature of measurement. The conductivity
indicates dissolved inorganic salts. The unit of conductivity is reported as millisiemens
per meter (mS/m) (Ramathilaga and Murugesan, 2011).
3.2.4.2 Materials Required
Distilled water, Thermometer, Blotting paper Conductivity meter, 0.1N
Potassium chloride, Calcium sulphate solution
3.2.4.3 Procedure
The instrument was switched on and leave it undisturbed for about few minutes
The accuracy of the instrument was checked by using a solution of known EC
such as saturated calcium sulphate solution and 0.1N potassium chloride
Five gram of sample was dissolved in 100ml of distilled water
It was stirred well and then allowed to settle
Before analysis the temperature of the solution was corrected to 25°C

35
The electrode was washed with double distilled water and it was immersed into
the suspension
The electrical conductivity of suspension was measured digitally
3.2.5 Total Titrable Acidity
3.2.5.1 Principle
The titrable acidity is directly related to the concentration of organic acids
present in the sample. The total acidity of a sample could be determined by titrating
with known amount of aqueous extract of a sample against an alkali solution of known
normality. It is expressed as equivalence of any organic acid, e.g., citric acid, malic
acid (Mazumdar and Majumder, 2003).
3.2.5.2 Materials Required
Laboratory glassware, Phenolphthalein indicator, 0.1N NaOH, Burette and
Distilled water.
3.2.5.3 Procedure
Five gram of the sample was taken and extracted with known volume of
distilled water by crushing
Filtered the extract and it was made upto with again a known volume of
distilled water
A known volume of aliquot was taken in a conical flask
Few drops of Phenolphthalein solution was added to this and shaken well
The sample was titrated against 0.1N NaOH solution
The appearance of pink colour and its persistence for few seconds as end
point of this titration

36
3.2.5.4 Calculation
1 ml of 0.1N NaOH solution can neutralize 0.064g of Citric acid. Therefore the
percentage of total titrable acidity present in the sample as equivalence of Citric acid
3.2.6 Percentage of Moisture and Total Solids
3.2.6.1 Principle
The moisture and total solids contents were determined by measuring the mass
of a food before and after the water is removed by evaporation methods it is necessary
to remove all of the water molecules that were originally present in the food, without
changing the mass of the food matrix and drying the sample in the oven at a
temperature not exceeding 70°C until the sample reaches to a constant mass (El-
Sohaimy and Hafez, 2010).
3.2.6.2 Materials Required
Evaporating dish and Hot air oven
3.2.6.3 Procedure
Five gram of the sample was taken in pre-weighed evaporating dish
It was dried at 70°C and drying was continued upto the constant weight was
achieved when weighing at every two hours of intervals
It was cooled in a desiccators and final weight has been taken

37
3.2.6.4 Calculation
3.2.7 Total Ash
3.2.7.1 Principle
The ash content of food products represents the inorganic residue remaining
after destruction of organic matter in food sample (such as protein, carbohydrates and
fat) by ignited at 525°C into a white ash. The ash value is the measure of amount of
inorganic minerals present in food products (Mazumdar and Majumder, 2003).
3.2.7.2 Materials Required
Silica dish and Muffle Furnace
3.2.7.3 Procedure
Five gram of dried sample was taken in pre-weighed silica dish kept in
Muffle furnace at 525°C
It was cooled in desiccator and weighed
Percentage of ash was calculated by following formula
3.2.7.4 Calculation

38
3.2.8. Total Pectic Substances
3.2.8.1 Principle
Pectic substances are polyuronides and are composed of mainly 1, 4 linked α-
D-galactouronic acid, or its methyl ester with neutral sugars, i.e., galactose and
arabinose as the side chains. After the extraction of pectin, it is saponified with alkali
and precipitated as calcium pectate. After washing the precipitate is dried and weighed
(Mazumdar and Majumder, 2003).
3.2.8.2 Materials Required
HCl (0.05N), 1N NaOH, 1N Acetic acid, 1N Calcium chloride and Whatman
No.4 Filter paper
3.2.8.3 Procedure
Five gram of sample was taken and boiled with known volume of 0.05N HCl at
a temperature of 80°C for 2 hrs for extraction of pectic substances.
After extraction, the mixture was allowed to cool. It was then filtered by
Whatman No.4 filter paper. The extraction was repeated for upto maximum
recovery of the pectin.
The filtrate was made upto 50 ml with distilled water which was neutralized
and made slightly alkaline with 1N NaOH solution. The solution was allowed
to stand overnight.
Then 10 ml of 1N Acetic acid solution was added to it. After 5 min, 5 ml of 1N
Calcium chloride solution was mixed with constant stirring. It was kept left for
an hour to precipitate as a calcium pectate.

39
The solution was then filtered through pre-weighed filter paper (Whatman
No.4). The precipitate was washed repeatedly with boiling water to eliminate
chloride ions present in the precipitate
The filter paper containing calcium pectate was dried at 50°C and weighed
3.2.8.4 Calculation
Percentage of pectic substances (as calcium pectate) present in the sample
3.2.9 Crude Fibres
3.2.9.1 Principle
The crude fibre is considered as the material left after making digestion of the
tissue. It is mainly composed of cellulose, lignin and some minerals. Cellulose and
lignin in plant tissues are digested by reacting with acid and alkali. On filtration, the
residue is obtained and weighed after drying. It is then ashed and reweighed. From the
ash weight, the amount of fibre present in the sample is determined (Mazumdar and
Majumder, 2003).
3.2.9.2 Materials Required
Laboratory glasswares, Ether - Ethanol mixture, Sulphuric acid (0.255N),
Sodium hydroxide (0.313N), Ethanol (70%)
3.2.9.3 Procedure
Five gram of sample was taken and extracted with ether-ethanol mixture and
the sample was heated (less than 50ºC) to remove the lipid substances present.
It was filtered and residues were obtained.
The residue was boiled with 0.255N Sulphuric acid for 30minutes.

40
The residue was cooled and filtered and washed in boiling water. The washed
material was again boiled with the 0.313N Sodium hydroxide solvent for 30
minutes.
The residue was washed with water and ethanol
The residue was taken in pre-weighed crucible and dried at 1000C for 2 hrs. The
crucible containing residue was cooled and reweighed
Then crucible containing residue was ignited at 6000C for few minutes in a
muffle furnace and it was cooled and reweighed
3.2.9.4 Calculation
The amount of fibre present in the sample is calculated by the following
formula
Where,
a- Weight of sample; b- Weight of crucible;
c- Initial weight of crucible containing tissue sample before ignition
d- Final weight of crucible containing ash after ignition
3.2.10 Total Sugar
3.2.10.1 Principle
Carbohydrates are first hydrolyzed into simple sugars using dilute hydrochloric
acid. In hot acidic medium glucose is dehydrated to hydroxymethyl furfural. It forms a
green coloured solution on reaction with anthrone. This intensity of the colour
appeared is then measured colorimetrically at 630 nm to determine the amount of
carbohydrate present in the sample (AOAC, 1984).

41
3.2.10.2 Materials Required
2.5N of HCl, Sodium carbonate, Anthrone, Sulfuric acid, Glucose
3.2.10.3 Procedure
100 mg of sample was taken in a boiling tube and it was hydrolyzed by kept in
boiling water bath for 3 hrs with 5 ml of 2.5 N of HCl and then cool to room
temperature.
It was neutralized with solid sodium carbonate until the effervescence ceases.
Then make up the volume of the sample to 100 ml with distilled water and it
was centrifuged at 4000 rpm for 10 min.
0.2 ml of supernatant was taken for analysis and made up the volume to 1 ml
with distilled water.
4 ml of anthrone reagent was added to the solution and heated for 8 min in a
boiling water bath.
The sample was allowed to cool and the green to dark green colour was appears
and read at 630 nm in spectrophotometer.
The amount of total sugars present in the sample was calculated from the
standard graph of glucose.
3.2.11 Reducing Sugar
3.2.11.1 Principle
Sugars with reducing property (due to the presence of a potential aldehyde or
keto group) are called reducing sugars. Reducing sugars have the property to reduce
many of the reagents. The reagent 3, 5-dinitrosalicylic acid (DNS) in alkaline solution
is reduced to 3 amino 5 nitro salicylic acid and to form orange-red colour. The intensity
of the colour appeared is then measured colorimetrically at 510 nm to determine the
amount of reducing sugars present in the sample (AOAC, 1984).

42
3.2.11.2 Materials Required
Laboratory glassware, Dinitrosalicylic acid reagent, 40% Rochelle salt solution
and Distilled water.
3.2.11.3 Procedure
100 mg of sample was taken and the sugars are extracted twice with hot 80%
ethanol. The supernatant was collected and kept in water bath at 80°C for
evaporation.
10 ml water was added and the sugars are dissolved. 3 ml of extract was taken
in a test tube.
DNS reagent (3 ml) was added and it was heated by kept in boiling water bath
for 5 min.
1 ml of 40% Rochelle salt solution was added at when contents of the tube are
still warm.
The tubes were cooled and the intensity of dark red colour was read at 510 nm.
The amount of reducing sugars present in the sample was calculated from the
standard graph of Glucose.
3.2.12 Total Protein
3.2.12.1 Principle
Protein reacts with Folin and Ciocalteu’s phenol reagent and gives a blue
colored complex. The colouration is formed due to reaction of alkaline copper of the
reagent with protein and the reduction of phospho-molybdate by the amino acids,
tyrosine and tryptophan, present in the protein molecules. The intensity of the
developed coloration of the protein solution depends on the amount of these aromatic
amino acids present and hence, it varies for different proteins (Lowry et al., 1951).

43
3.2.12.2 Materials Required
Laboratory glasswares, 0.1N Sodium hydroxide, 10% Trichloroacetic acid,
0.5% Copper sulphate, 1% Sodium potassium tartrate, 1% Sodium carbonate, 1N Folin
and Ciocalteu’s phenol reagent and Bovine Serum Albumin (BSA).
3.2.12.3 Procedure
Five gram of sample was taken and extracted with known volume of 0.1N
Sodium hydroxide solution for 30 minutes
The extract was centrifuged and the supernatant was collected. 10% of
Trichloro acetic acid was added in the supernatant solution for precipitation of
protein
The precipitated protein was recovered by centrifugation at 5000 rpm for 10
minutes
The protein pellet was dissolved in 0.1N Sodium hydroxide solutions and made
upto known volume with the same solvent
The aliquot was taken in test tube and 4ml of protein reagent was added to it. It
was incubated at room temperature for 10 minutes
0.5ml of Folin and Ciocalteu’s phenol reagent was added to the test tube to
develop blue colouration in the solution
Allowing for 10minutes, the optical density value of the coloured solution was
measured through 750nm wavelength against blank
Total protein in a sample was calculated from standard graph of protein

44
3.2.13 Total Lipids
3.2.13.1 Principle
Lipids are fatty materials which are extracted in non-polar solvents. On
extraction and subsequent evaporation of the solvent, the lipid extractive remains as
residue and this is determined by weight (Mazumdar and Majumder, 2003).
3.2.13.2 Materials Required
Laboratory glasswares, Ether-Ethanol mixture.
3.2.13.3 Procedure
10 g of sample was taken and crushed with known volume of ethanol. The
crushed sample was refluxed with ether ethanol mixture in a soxhlet’s apparatus
not exceeding a temperature of 500 C for 3-4 hours.
The supernatant containing the lipid matter was taken in a pre weighed
container. The container with material was weighed again and warmed at the
temperature below 500
C to evaporate the solvent.
After cooling, the container with the material was weighed once again.
3.2.13.4 Calculation
Percentage of Lipid (Ether extractives) present in sample was calculated by
using this formula
Where,
a = Weight of sample; b = Weight of glass container
c = Weight of glass container with material before evaporation of solvent
d = Weight of glass container with material after evaporation of solvent

45
3.2.14 Calorific Value
The energy producing capacity of the food is usually characterized by using
calorific values of the food. The amount of energy available from an item of food when
digested usually measured in units of energy, calories per unit mass. Total energy
values of the food products (kcal/100gm) calculated by the amount (gram) of protein,
lipid and carbohydrate contents were found in the food products was multiplied by the
factor of 4, 9 and 4 kcal/g, respectively (Mares et al., 2010).
3.2.15 UV-VIS Spectrum Analysis
3.2.15.1 Principle
UV-Visible spectrum analysis is one of the indirect measurements for
evaluation of radiolytic products and internal component changes in the irradiated
products (Brasoveanu et al., 2005). The extract of irradiated and control samples were
analyzed in UV-VIS Spectrophotometer the wavelength range of 200-1100 nm. From
the spectrum, to assess any changes in the absorption spectra of food product caused by
irradiation when compared with spectrum of control sample.
3.2.15.2 Materials Required
Laboratory glasswares, ethanol, UV-Visible Spectrophotometer
3.2.15.3 Procedure
Five gram of sample was weighed and extraction was prepared by crushing in
the mortar and pestle by the addition of known volume of ethanol and stored in
refrigerated condition (40C) for overnight.
After the incubation, samples were centrifuged at 5000 rpm for 10 minutes and
the extract was collected.
The extract was scanned by UV-Visible Spectrophotometer at different
wavelength ranges from 200-1100 nm.

46
3.2.16 Microscopic Structure Analysis
3.2.16.1 Principle
Jams and jellies were commonly prepared from mixture of fruits. The visible
decomposition or filth in the fruit is generally altered by the processing; thus, required
indirect microscopic methods for evaluation of these defects. The changes in cell
structures due to irradiation and the determination of foreign ingredients are based on
the examination of cellular structures and morphological features of fruit tissues or
non-food ingredients (pieces of hair, nylon fibre etc) were easily detected by
microscopic analysis. Jams and preserves may be occasionally adulterated by the
addition of other fruit tissues, which can be easily detected microscopically (Winton
and Winton, 1935).
3.2.16.2 Materials Required
Glass slide, Cover slip, Microscope and Distilled water
3.2.16.3 Procedure
Weighed out about 5 gram of food sample into a 20 mL beaker. Added
sufficient amount of water to fill the beaker then stirred and allowed to stand
for 10 minutes
The supernatant was discarded and the sediment was taken in a slide
It was viewed under microscope using low magnification

47
3.3 RESULTS
3.3.1 pH
3.3.1.1 pH Values of Mixed Fruit Jam
The pH values of jam were recorded in the range of 3.30 - 3.41 (Fig. 3.1).
After irradiation of jam, the pH values were slightly decreased with increasing
irradiation dose, it was found to be 3.39, 3.35, 3.35 and 3.30 in 2.5, 5.0, 7.5 and 10
kGy, respectively and in control it was 3.41. The same trend was found throughout the
storage period. In 3rd
month the pH values were recorded as 3.39, 3.39, 3.36, 3.33, 3.30
and in 6th
month 3.38, 3.38, 3.36, 3.34, 3.30 for control and 2.5, 5, 7.5, 10 kGy of
irradiated samples, respectively. The pH values of control and irradiated samples were
3.38, 3.39, 3.35, 3.35, 3.31 and 3.39, 3.37, 3.34, 3.34, 3.30 for 9th
month and 12th
months of storage, respectively. The storage not altered the pH values of irradiated jam
at different doses while slight variation was observed in control sample.
3.3.1.2 pH Values of Mixed Fruit Jelly
The pH values were recorded in mixed fruit jelly after irradiation and storage
period and it was shown in Fig. 3.2. The pH values were observed in the range of 3.04
- 3.13. After irradiation, the pH values of control and irradiated samples (2.5, 5, 7.5, 10
kGy) were found to be 3.13, 3.13, 3.13, 3.12 and 3.10, respectively. The pH values of
jelly were not altered by irradiation except at higher doses where slight variation was
observed. During storage the pH values were slightly lowered in both irradiated and
control samples. The pH values were recorded as 3.12, 3.12, 3.11, 3.11, 3.11 for 3rd
month, 3.10, 3.10, 3.09, 3.09, 3.07 for 6th
month, 3.07, 3.07, 3.07, 3.06, 3.06 for 9th
month and 3.07, 3.07, 3.07, 3.04, 3.04 for 12th
month of storage in control and
irradiated samples 2.5, 5, 7.5, 10 kGy, respectively.

48
Fig. 3.1 Effect of electron beam irradiation on the pH values of mixed fruit jam
Fig. 3.2 Effect of electron beam irradiation on the pH values of mixed fruit jelly
3.1
3.2
3.3
3.4
3.5
0 1 2 3 4 5 6 7 8 9 10 11 12
pH
Storage Period (Month)
Control 2.5 kGy 5 kGy 7.5 kGy 10 kGy
2.90
2.95
3.00
3.05
3.10
3.15
3.20
0 1 2 3 4 5 6 7 8 9 10 11 12
pH
Storage Period (Month)
Control 2.5 kGy 5 kGy 7.5 kGy 10 kGy

49
3.3.2 Electrical Conductivity
3.3.2.1 Electrical Conductivity Values of Mixed Fruit Jam
The electrical conductivity (EC) values of mixed fruit jam were recorded in the
range of 0.13 – 0.16 mS/m (Fig. 3.3). The EC values of mixed fruit jam were 0.15,
0.14, 0.14, 0.15, 0.15 mS/m for control and irradiated samples (2.5, 5, 7.5, 10 kGy),
respectively. In 3rd
month the EC values were recorded as 0.15, 0.15, 0.16, 0.14, 0.14
mS/m and in 6th
month 0.15, 0.16, 0.15, 0.15, 0.15 mS/m for control and 2.5, 5, 7.5, 10
kGy of irradiated samples, respectively.
The EC values of control and irradiated samples were 0.15, 0.13, 0.14, 0.15,
0.14 mS/m and 0.15, 0.15, 0.14, 0.15, 0.14 mS/m for 9th
month and 12th
months of
storage, respectively. The EC values of mixed fruit jam was not changed after
irradiation and the same values was found during storage period in irradiated and
control samples.
3.3.2.2 Electrical Conductivity Values of Mixed Fruit Jelly
The electrical conductivity (EC) values of mixed fruit jelly were recorded in the
range of 0.11 – 0.13 mS/m and it was depicted in Fig. 3.4. After irradiation, it was
found to be 0.11, 0.11, 0.12, 0.11, 0.12 mS/m for control and 2.5, 5, 7.5, 10 kGy of
irradiated samples, respectively. The EC values of mixed fruit jelly were not altered by
irradiation and on further storage period.
In 3rd
month it was recorded as 0.11, 0.11, 0.12, 0.11, 0.13 mS/m and in 6th
month 0.11, 0.12, 0.11, 0.12, 0.11 mS/m for control and 2.5, 5, 7.5, 10 kGy of
irradiated samples, respectively. The EC values of control and irradiated samples were
0.11, 0.12, 0.11, 0.12, 0.12 mS/m and 0.12, 0.12, 0.11, 0.12, 0.12 mS/m for 9th
month
and 12th
months of storage, respectively.

50
Fig. 3.3 Effect of electron beam irradiation on the conductivity values of mixed fruit jam
Fig. 3.4 Effect of electron beam irradiation on the conductivity values of mixed fruit jelly
0.00
0.04
0.08
0.12
0.16
0.20
0 1 2 3 4 5 6 7 8 9 10 11 12
Ele
ctri
cal
Co
nd
uct
ivit
y (
mS
/m)
Storage Period (Month)
Control 2.5 kGy 5 kGy 7.5 kGy 10 kGy
0.06
0.08
0.10
0.12
0.14
0.16
0 1 2 3 4 5 6 7 8 9 10 11 12
Ele
ctri
cal
Co
nd
uct
ivit
y (
mS
/m)
Storage Period (Month)
Control 2.5 kGy 5 kGy 7.5 kGy 10 kGy
51
3.3.3 Acidity
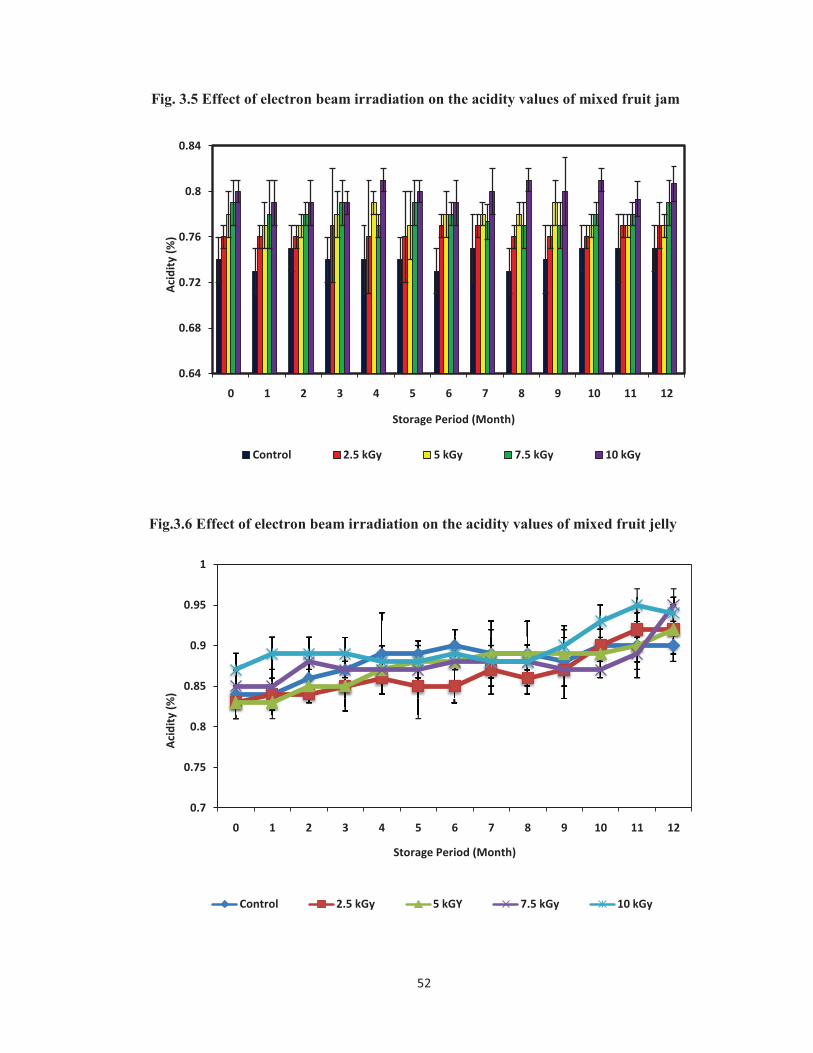
3.3.3.1 Acidity Values of Mixed Fruit Jam
The acidity values of control and irradiated mixed fruit jam were studied (Fig.
3.5). The acidity values of mixed fruit jam was recorded after irradiation as 0.76, 0.78,
0.79, 0.80% for 2.5, 5, 7.5 and 10 kGy of irradiated samples, respectively. In control
sample, it was 0.74%. After irradiation, the acidity values were slightly increased based
on increasing irradiation doses. The same trend was maintained throughout the study
period. The acidity values of control and irradiated samples were not altered during
storage period. The values were 0.74, 0.77, 0.78, 0.79, 0.79% for 3rd
month, 0.73, 0.77,
0.78, 0.78, 0.79% for 6th
month and 0.74, 0.76, 0.79, 0.77, 0.80% for 9th
month of
storage in control and 2.5, 5, 7.5, 10 kGy of irradiated samples, respectively. At the end
of storage, in 12th
month it was 0.75, 0.77, 0.77, 0.79, 0.81% for control and irradiated
samples, respectively.
3.3.3.2 Acidity Values of Mixed Fruit Jelly
In mixed fruit jelly, the acidity values were found in the range of 0.83 – 0.95%.
The values are illustrated in Fig. 3.6. After irradiation the acidity values were observed
as 0.84, 0.83, 0.83, 0.85 and 0.87% in control and irradiated samples (2.5, 5, 7.5, 10
kGy), respectively. After irradiation, the acidity values were slightly increased based
on increasing irradiation doses. The same trend was maintained throughout the study.
The acidity values of control and irradiated samples were slightly increased during
storage period. The values were 0.87, 0.85, 0.85, 0.87, 0.89% for 3rd
month, 0.90, 0.85,
0.88, 0.88, 0.89% for 6th
month and 0.88, 0.87, 0.89, 0.87, 0.90% for 9th
month of
storage in control and 2.5, 5, 7.5, 10 kGy of irradiated samples, respectively. At the end
of storage, in 12th
month it was 0.90, 0.92, 0.92, 0.95, 0.94% for control and irradiated
samples, respectively.
52
Fig. 3.5 Effect of electron beam irradiation on the acidity values of mixed fruit jam
Fig.3.6 Effect of electron beam irradiation on the acidity values of mixed fruit jelly
0.64
0.68
0.72
0.76
0.8
0.84
0 1 2 3 4 5 6 7 8 9 10 11 12
Aci
dit
y (
%)
Storage Period (Month)
Control 2.5 kGy 5 kGy 7.5 kGy 10 kGy
0.7
0.75
0.8
0.85
0.9
0.95
1
0 1 2 3 4 5 6 7 8 9 10 11 12
Aci
dit
y (
%)
Storage Period (Month)
Control 2.5 kGy 5 kGY 7.5 kGy 10 kGy
53
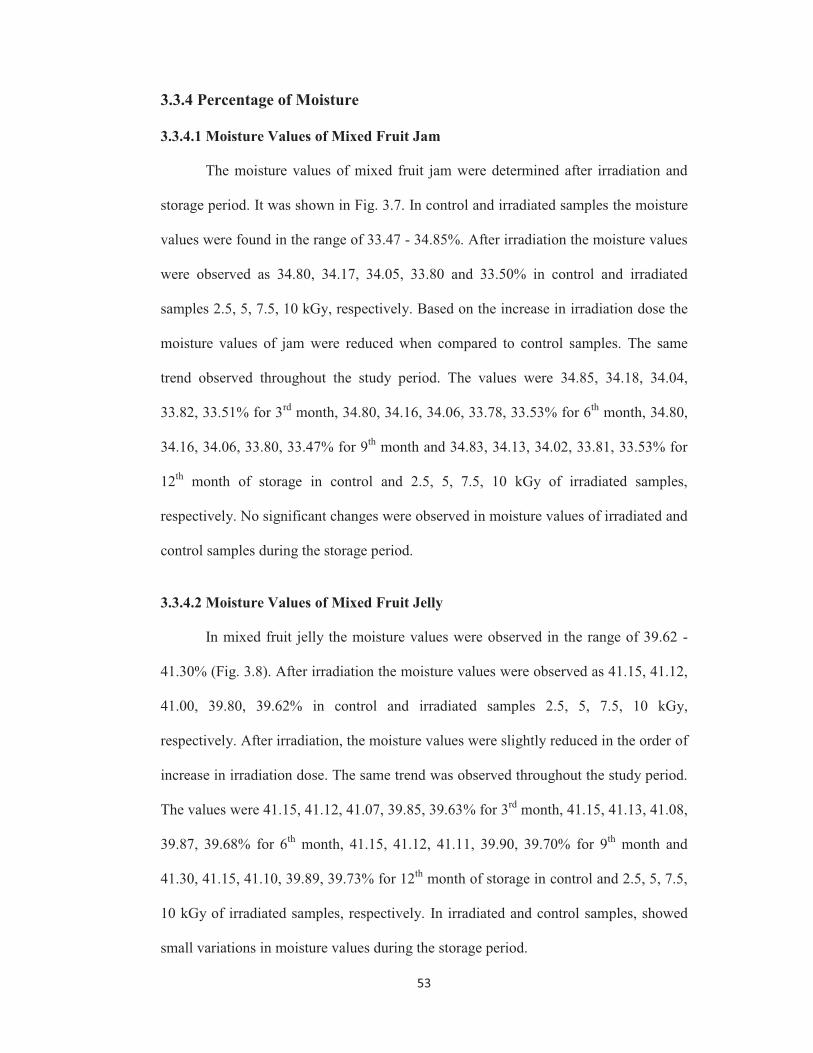
3.3.4 Percentage of Moisture
3.3.4.1 Moisture Values of Mixed Fruit Jam
The moisture values of mixed fruit jam were determined after irradiation and
storage period. It was shown in Fig. 3.7. In control and irradiated samples the moisture
values were found in the range of 33.47 - 34.85%. After irradiation the moisture values
were observed as 34.80, 34.17, 34.05, 33.80 and 33.50% in control and irradiated
samples 2.5, 5, 7.5, 10 kGy, respectively. Based on the increase in irradiation dose the
moisture values of jam were reduced when compared to control samples. The same
trend observed throughout the study period. The values were 34.85, 34.18, 34.04,
33.82, 33.51% for 3rd
month, 34.80, 34.16, 34.06, 33.78, 33.53% for 6th
month, 34.80,
34.16, 34.06, 33.80, 33.47% for 9th
month and 34.83, 34.13, 34.02, 33.81, 33.53% for
12th
month of storage in control and 2.5, 5, 7.5, 10 kGy of irradiated samples,
respectively. No significant changes were observed in moisture values of irradiated and
control samples during the storage period.
3.3.4.2 Moisture Values of Mixed Fruit Jelly
In mixed fruit jelly the moisture values were observed in the range of 39.62 -
41.30% (Fig. 3.8). After irradiation the moisture values were observed as 41.15, 41.12,
41.00, 39.80, 39.62% in control and irradiated samples 2.5, 5, 7.5, 10 kGy,
respectively. After irradiation, the moisture values were slightly reduced in the order of
increase in irradiation dose. The same trend was observed throughout the study period.
The values were 41.15, 41.12, 41.07, 39.85, 39.63% for 3rd
month, 41.15, 41.13, 41.08,
39.87, 39.68% for 6th
month, 41.15, 41.12, 41.11, 39.90, 39.70% for 9th
month and
41.30, 41.15, 41.10, 39.89, 39.73% for 12th
month of storage in control and 2.5, 5, 7.5,
10 kGy of irradiated samples, respectively. In irradiated and control samples, showed
small variations in moisture values during the storage period.

54
Fig. 3.7 Effect of electron beam irradiation on the moisture values of mixed fruit jam
Fig. 3.8 Effect of electron beam irradiation on the moisture values of mixed fruit jelly
28
30
32
34
36
38
0 1 2 3 4 5 6 7 8 9 10 11 12
Mo
istu
re (
%)
Storage Period (Month)
Control 2.5 kGy 5 kGy 7.5 kGy 10 kGy
37
37.5
38
38.5
39
39.5
40
40.5
41
41.5
42
42.5
43
0 1 2 3 4 5 6 7 8 9 10 11 12
Mo
istu
re (
%)
Storage Period (Month)
Control 2.5 kGy 5 kGy 7.5 kGy 10 kGy

55
3.3.5 Percentage of Total Solids
3.3.5.1 Total Solids of Mixed Fruit Jam
The total solids values of control and irradiated mixed fruit jam were studied
(Fig. 3.9). The total solids values of mixed fruit jam was recorded after irradiation as
65.83, 65.95, 66.20, 66.50% for 2.5, 5, 7.5 and 10 kGy of irradiated samples,
respectively. In control sample, it was 65.20%. After irradiation, the total solids values
were increased based on increasing irradiation doses. The same trend was maintained
throughout the study. The total solids values of control and irradiated samples were not
altered during storage period. The values were 65.15, 65.82, 65.96, 66.18, 66.50% for
3rd
month, 65.20, 65.84, 65.94, 66.22, 66.51% for 6th
month and 65.20, 65.86, 65.94,
66.21, 66.52% for 9th
month of storage in control and 2.5, 5, 7.5, 10 kGy of irradiated
samples, respectively. At the end of storage, in 12th
month it was 65.17, 65.87, 65.98,
66.19, 66.47% for control and irradiated samples, respectively.
3.3.5.2 Total Solids of Mixed Fruit Jelly
In mixed fruit jelly, the total solids values were found in the range of 58.70 –
60.38%. The values are illustrated in Fig. 3.10. After irradiation the total solids values
were observed as 58.85, 58.88, 59.00, 60.20 and 60.38% in control and irradiated
samples 2.5, 5, 7.5, 10 kGy, respectively. After irradiation, the total solids values were
slightly increased based on increasing irradiation doses. The same trend was
maintained throughout the study. In total solids values of control and irradiated
samples small reduction were noticed during storage period. The values were 58.85,
58.88, 58.93, 60.15, 60.37% for 3rd
month, 58.85, 58.87, 58.92, 60.13, 60.32% for 6th
month and 58.85, 58.88, 58.89, 60.10, 60.30% for 9th
month of storage in control and
2.5, 5, 7.5, 10 kGy of irradiated samples, respectively. At 12th
month of storage, it was
58.70, 58.85, 58.90, 60.11, 60.27% for control and irradiated samples, respectively.

56
Fig. 3.9 Effect of electron beam irradiation on the total solids of mixed fruit jam
Fig. 3.10 Effect of electron beam irradiation on the total solids of mixed fruit jelly
60
62
64
66
68
70
0 1 2 3 4 5 6 7 8 9 10 11 12
To
tal
So
lid
s (
%)
Storage Period (Month)
Control 2.5 kGy 5 kGy 7.5 kGy 10 kGy
56
57
58
59
60
61
62
0 1 2 3 4 5 6 7 8 9 10 11 12
To
tal
So
lid
s (%
)
Storage Period (Month)
Control 2.5 kGy 5 kGy 7.5 kGy 10 kGy

57
3.3.6 Percentage of Total Ash
3.3.6.1 Ash Values of Mixed Fruit Jam
The total ash values were tested in irradiated and control samples of mixed fruit
jam. It was shown in Fig. 3.11. After irradiation the ash values were found to be 0.35,
0.34, 0.34, 0.35, 0.35% in control and irradiated samples 2.5, 5, 7.5, 10 kGy,
respectively. Irradiation did not affect the ash values of mixed fruit jam. The values
were 0.35, 0.35, 0.36, 0.34, 0.34% for 3rd
month, 0.35, 0.36, 0.35, 0.35, 0.34% for 6th
month and 0.35, 0.33, 0.34, 0.35, 0.34% for 9th
month of storage in control and 2.5, 5,
7.5, 10 kGy of irradiated samples, respectively. At 12th
month of storage, it was 0.35,
0.35, 0.34, 0.35, 0.34% for control and irradiated samples, respectively. No significant
changes were observed in ash values of irradiated and control samples during the
storage period.
3.3.6.2 Ash Values of Mixed Fruit Jelly
The ash content in control and irradiated samples of mixed fruit jelly were
estimated and it was ranged from 0.17 – 0.21% (Fig. 3.12). After irradiation similar ash
values were found in the all doses of irradiated and control samples. It was found to be
0.21, 0.22, 0.21, 0.22 and 0.22% of ash in the control, 2.5, 5, 7.5 and 10 kGy
respectively. The values were 0.21, 0.21, 0.23, 0.20, 0.20% for 3rd
month, 0.21, 0.20,
0.21, 0.19, 0.19% for 6th
month and 0.19, 0.19, 0.20, 0.19, 0.22% for 9th
month of
storage in control and 2.5, 5, 7.5, 10 kGy of irradiated samples, respectively. At 12th
month of storage, it was 0.17, 0.20, 0.20, 0.20, 0.19% for control and irradiated
samples, respectively. All doses of irradiated samples, no significant changes were
observed in ash values during the storage period and in control sample, small reduction
was noticed in ash values.

58
Fig. 3.11 Effect of electron beam irradiation on the total ash values of mixed fruit jam
Fig. 3.12 Effect of electron beam irradiation on the total ash values of mixed fruit jelly
0
0.05
0.1
0.15
0.2
0.25
0.3
0.35
0.4
0 1 2 3 4 5 6 7 8 9 10 11 12
To
tal
Ash
(%
)
Storage Period (Month)
Control 2.5 kGy 5 kGy 7.5 kGy 10 kGy
0
0.05
0.1
0.15
0.2
0.25
0.3
0.35
0 1 2 3 4 5 6 7 8 9 10 11 12
To
tal
Ash
(%
)
Storage Period (Month)
Control 2.5 kGy 5 kGy 7.5 kGy 10 kGy

59
3.3.7 Percentage of Pectic Substances
3.3.7.1 Pectic Substances of Mixed Fruit Jam
The effect of electron beam irradiation on pectic substances of mixed fruit jam
was studied (Fig. 3.13). After irradiation, it was noticed that 1.03, 1.03, 1.02, 1.00,
0.98% of pectin in control, 2.5, 5, 7.5 and 10 kGy, respectively. The pectin values were
slightly reduced based on the order of increase in irradiation dose. The condition was
maintained throughout the study. The values were 1.02, 1.01, 1.01, 1.00, 0.95% for 3rd
month, `1.00, 0.97, 0.98, 0.97, 0.94% for 6th
month and 0.98, 0.96, 0.96, 0.94, 0.92%
for 9th
month of storage in control and 2.5, 5, 7.5, 10 kGy of irradiated samples,
respectively. At 12th
month of storage, it was 0.97, 0.93, 0.92, 0.90, 0.86% for control
and irradiated samples, respectively. During storage small reductions were observed in
pectin values of all doses of irradiated and control samples.
3.3.7.2 Pectic Substances of Mixed Fruit Jelly
The pectic substances of mixed fruit jelly were determined after irradiation and
storage period. It was shown in Fig. 3.14. The pectic substances of mixed fruit jelly
was ranged from 1.24 – 1.37%. After irradiation it was showed that 1.37, 1.37, 1.37,
1.34, 1.34% in control and 2.5, 5, 7.5, 10 kGy, respectively. After irradiation, the
pectin values of jelly were slightly reduced with an increase in irradiation dose. The
values were 1.35, 1.35, 1.36, 1.32, 1.34% for 3rd
month, 1.35, 1.34, 1.32, 1.32, 1.32%
for 6th
month and 1.31, 1.32, 1.28, 1.29, 1.28% for 9th
month of storage in control and
2.5, 5, 7.5, 10 kGy of irradiated samples, respectively. At 12th
month of storage, it was
1.28, 1.31, 1.28, 1.26, 1.24% for control and irradiated samples, respectively. During
storage the pectin values were slightly lowered in all doses of irradiated and control
samples.

60
Fig. 3.13 Effect of electron beam irradiation on the pectic substances of mixed fruit jam
Fig. 3.14 Effect of electron beam irradiation on the pectic substances of mixed fruit jelly
0
0.2
0.4
0.6
0.8
1
1.2
1.4
0 1 2 3 4 5 6 7 8 9 10 11 12
Pe
ctic
Su
bst
an
ces
(%)
Storage Period (Month)
Control 2.5 kGy 5 kGy 7.5 kGy 10 kGy
0.9
1
1.1
1.2
1.3
1.4
1.5
1.6
0 1 2 3 4 5 6 7 8 9 10 11 12
Pe
ctic
Su
bst
an
ces
(%)
Storage Period (Month)
Control 2.5 kGy 5 kGY 7.5 kGy 10 kGy

61
3.3.8 Crude Fibres
3.3.8.1 Crude Fibre Values of Mixed Fruit Jam
The crude fibre values of mixed fruit jam were determined after irradiation and
storage period (Fig. 3.15). The crude fibre values of mixed fruit jam was ranged from
2.11 – 2.17%. After irradiation, it was found to be 2.14, 2.12, 2.13, 2.14, 2.14% in
control and 2.5, 5, 7.5, 10 kGy, respectively. The crude fibre values of mixed fruit jam
were not changed by irradiation and on further storage period. The values were 2.16,
2.12, 2.12, 2.12, 2.12% for 3rd
month, 2.14, 2.13, 2.12, 2.14, 2.14% for 6th
month and
2.12, 2.14, 2.12, 2.13, 2.14% for 9th
month of storage in control and 2.5, 5, 7.5, 10 kGy
of irradiated samples, respectively. At 12th
month of storage, it was 2.13, 2.13, 2.12,
2.14, 2.12% for control and irradiated samples, respectively.
3.3.8.2 Crude Fibre Values of Mixed Fruit Jelly
The crude fibre values of mixed fruit jelly were determined after irradiation and
storage period. Fig. 3.16 showed the crude fibre values of mixed fruit jelly. The crude
fibre values of mixed fruit jelly was ranged from 1.41 – 1.49%. After irradiation, it was
found to be 1.47, 1.47, 1.47, 1.44, 1.44% in control and 2.5, 5, 7.5, 10 kGy,
respectively. The crude fibre values of mixed fruit jelly were not changed by irradiation
but slight variations were observed at higher doses. The values were 1.45, 1.45, 1.46,
1.42, 1.44% for 3rd
month, 1.45, 1.44, 1.42, 1.42, 1.42% for 6th
month and 1.41, 1.42,
1.48, 1.49, 1.48% for 9th
month of storage in control and 2.5, 5, 7.5, 10 kGy of
irradiated samples, respectively. At 12th
month of storage, it was 1.48, 1.41, 1.48, 1.46,
1.44% for control and irradiated samples, respectively. During storage no significant
changes were observed in crude fibre values of irradiated and control samples.

62
Fig. 3.15 Effect of electron beam irradiation on the crude fibre of mixed fruit jam
Fig. 3.16 Effect of electron beam irradiation on the crude fibre of mixed fruit jelly
1.95
2
2.05
2.1
2.15
2.2
2.25
0 1 2 3 4 5 6 7 8 9 10 11 12
Cru
de
Fib
re
(%)
Storage Period (Month)
Control 2.5 kGy 5 kGy 7.5 kGy 10 kGy
1
1.1
1.2
1.3
1.4
1.5
1.6
1.7
1.8
0 1 2 3 4 5 6 7 8 9 10 11 12
Cru
de
Fib
re (
%)
Storage period (Month)
Control 2.5 kGy 5 kGY 7.5 kGy 10 kGy
63
3.3.9 Total Sugar
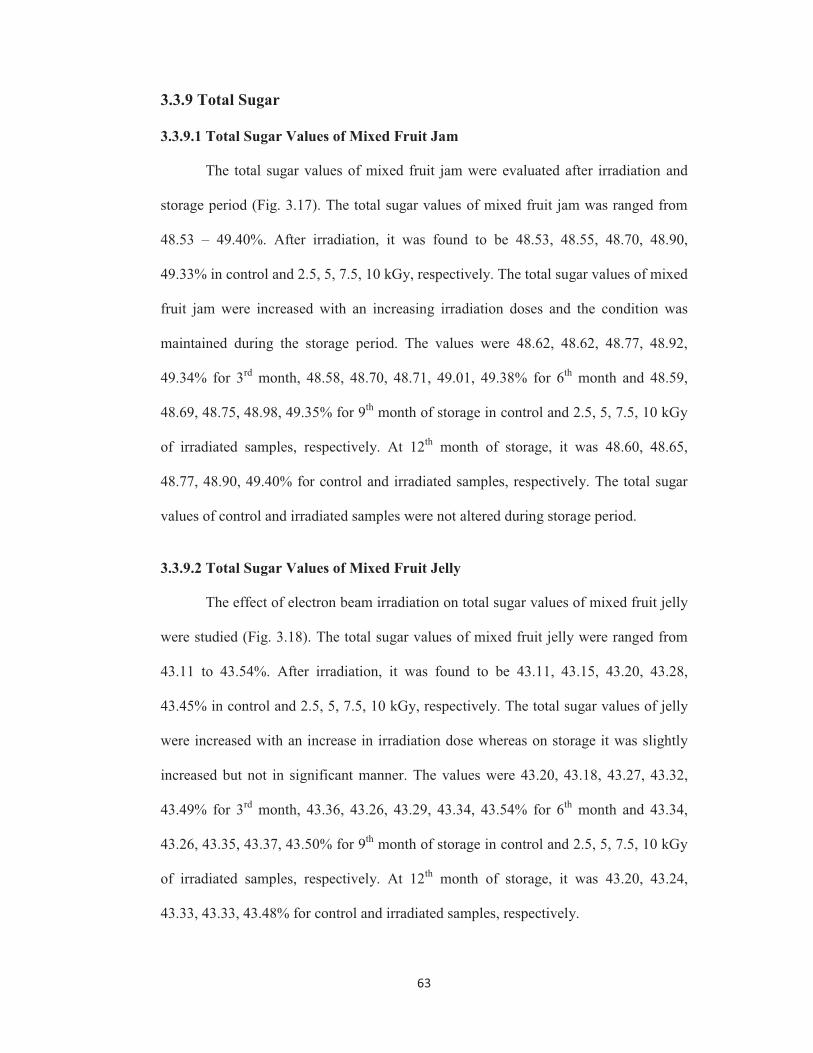
3.3.9.1 Total Sugar Values of Mixed Fruit Jam
The total sugar values of mixed fruit jam were evaluated after irradiation and
storage period (Fig. 3.17). The total sugar values of mixed fruit jam was ranged from
48.53 – 49.40%. After irradiation, it was found to be 48.53, 48.55, 48.70, 48.90,
49.33% in control and 2.5, 5, 7.5, 10 kGy, respectively. The total sugar values of mixed
fruit jam were increased with an increasing irradiation doses and the condition was
maintained during the storage period. The values were 48.62, 48.62, 48.77, 48.92,
49.34% for 3rd
month, 48.58, 48.70, 48.71, 49.01, 49.38% for 6th
month and 48.59,
48.69, 48.75, 48.98, 49.35% for 9th
month of storage in control and 2.5, 5, 7.5, 10 kGy
of irradiated samples, respectively. At 12th
month of storage, it was 48.60, 48.65,
48.77, 48.90, 49.40% for control and irradiated samples, respectively. The total sugar
values of control and irradiated samples were not altered during storage period.
3.3.9.2 Total Sugar Values of Mixed Fruit Jelly
The effect of electron beam irradiation on total sugar values of mixed fruit jelly
were studied (Fig. 3.18). The total sugar values of mixed fruit jelly were ranged from
43.11 to 43.54%. After irradiation, it was found to be 43.11, 43.15, 43.20, 43.28,
43.45% in control and 2.5, 5, 7.5, 10 kGy, respectively. The total sugar values of jelly
were increased with an increase in irradiation dose whereas on storage it was slightly
increased but not in significant manner. The values were 43.20, 43.18, 43.27, 43.32,
43.49% for 3rd
month, 43.36, 43.26, 43.29, 43.34, 43.54% for 6th
month and 43.34,
43.26, 43.35, 43.37, 43.50% for 9th
month of storage in control and 2.5, 5, 7.5, 10 kGy
of irradiated samples, respectively. At 12th
month of storage, it was 43.20, 43.24,
43.33, 43.33, 43.48% for control and irradiated samples, respectively.

64
Fig. 3.17 Effect of electron beam irradiation on the total sugar values of mixed fruit jam
Fig. 3.18 Effect of electron beam irradiation on the total sugar values of mixed fruit jelly
44
46
48
50
52
0 1 2 3 4 5 6 7 8 9 10 11 12
To
tal
Su
ga
r (
%)
Storage Period (Month)
Control 2.5 kGy 5 kGy 7.5 kGy 10 kGy
41
42
43
44
45
0 1 2 3 4 5 6 7 8 9 10 11 12
To
tal
Su
ga
r (%
)
Storage Period (Month)
Control 2.5 kGy 5 kGy 7.5 kGy 10 kGy

65
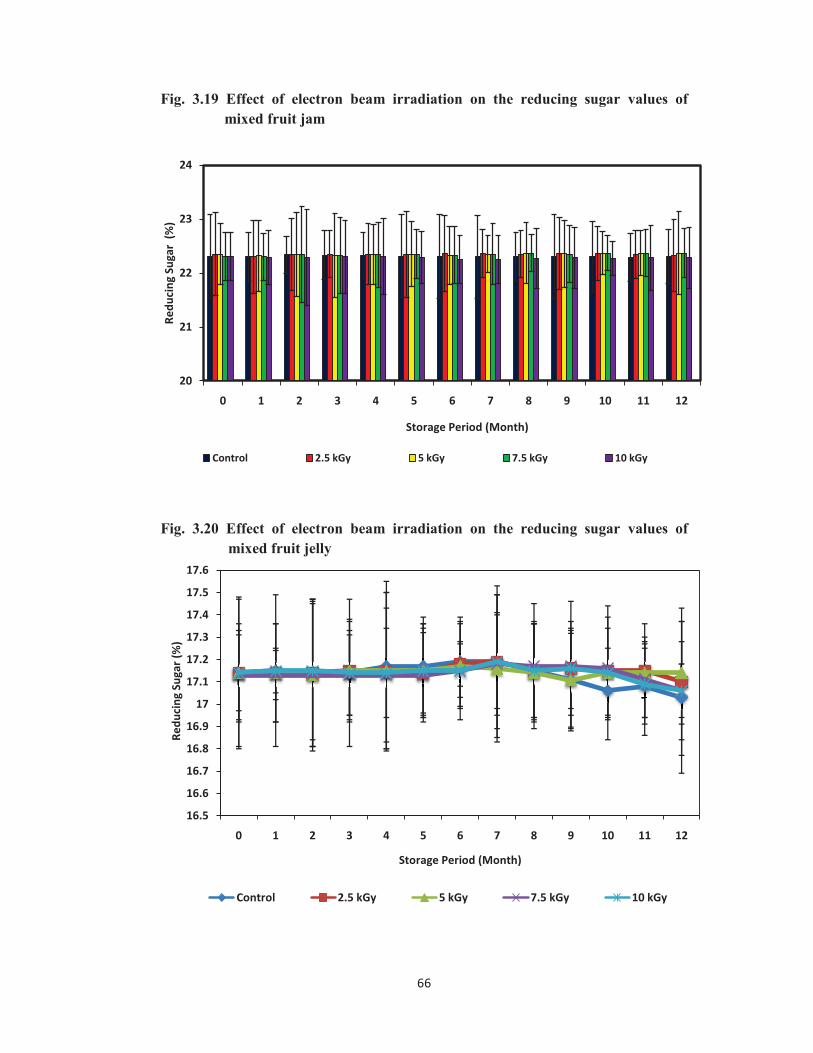
3.3.10 Reducing Sugar
3.3.10.1 Reducing Sugar Values of Mixed Fruit Jam
The reducing sugar values of mixed fruit jam were recorded in the range of
22.25 to 22.31% (Fig. 3.19). The reducing sugar values of mixed fruit jam were 23.31,
23.35, 23.35, 23.31, 23.31% for control and irradiated samples (2.5, 5, 7.5, 10 kGy),
respectively. After irradiation and further storage, no significant differences were found
in reducing sugar values of both irradiated and control samples. In 3rd
month the
reducing sugar values were recorded as 22.33, 22.35, 22.33, 22.33, 22.33, 22.30% and
in 6th
month 22.31, 22.36, 22.33, 22.33, 22.25% for control and 2.5, 5, 7.5, 10 kGy of
irradiated samples, respectively. The reducing sugar values of control and irradiated
samples at 9th
month were 22.31, 22.36, 22.36, 22.35, 22.28% and 22.30, 22.33, 22.37,
22.37, 22.28% for 12th
month of storage, respectively.
3.3.10.2 Reducing Sugar Values of Mixed Fruit Jelly
The reducing sugar values of mixed fruit jelly were recorded in the range of
17.03 to 17.19% and it was depicted in Fig. 3.20. After irradiation, it was found to be
17.14, 17.14, 17.14, 17.13, 17.14% for control and 2.5, 5, 7.5, 10 kGy of irradiated
samples, respectively. The reducing sugar values of mixed fruit jelly was not changed
after irradiation and the same values was found during storage period in irradiated and
control samples. In 3rd
month it was recorded as 17.14, 17.15, 17.15, 17.13, 17.14%
and in 6th
month 17.19, 17.18, 17.17, 17.15, 17.15% for control and 2.5, 5, 7.5, 10 kGy
of irradiated samples, respectively. The reducing sugar values of control and irradiated
samples at 9th
month were 17.11, 17.16, 17.11, 17.17, 17.16% and 17.03, 17.10, 17.14,
17.06, 17.06% for 12th
month of storage, respectively.
66
Fig. 3.19 Effect of electron beam irradiation on the reducing sugar values of
mixed fruit jam
Fig. 3.20 Effect of electron beam irradiation on the reducing sugar values of
mixed fruit jelly
20
21
22
23
24
0 1 2 3 4 5 6 7 8 9 10 11 12
Re
du
cin
g S
ug
ar
(%
)
Storage Period (Month)
Control 2.5 kGy 5 kGy 7.5 kGy 10 kGy
16.5
16.6
16.7
16.8
16.9
17
17.1
17.2
17.3
17.4
17.5
17.6
0 1 2 3 4 5 6 7 8 9 10 11 12
Re
du
cin
g S
ug
ar
(%)
Storage Period (Month)
Control 2.5 kGy 5 kGy 7.5 kGy 10 kGy

67
3.3.11 Total Protein
3.3.11.1 Total Protein Values of Mixed Fruit Jam
The total protein values were tested in irradiated and control samples of mixed
fruit jam. It was shown in Fig. 3.21. After irradiation the total protein values were
found to be 0.34, 0.33, 0.34, 0.35, 0.35% in control and irradiated samples 2.5, 5, 7.5,
10 kGy, respectively. Irradiation did not affect the total protein values of mixed fruit
jam. The values were 0.34, 0.32, 0.33, 0.34, 0.33% for 3rd
month, 0.33, 0.33, 0.34,
0.34, 0.32% for 6th
month and 0.32, 0.31, 0.32, 0.34, 0.32% for 9th
month of storage in
control and 2.5, 5, 7.5, 10 kGy of irradiated samples, respectively. At 12th
month of
storage, it was 0.31, 0.31, 0.32, 0.32, 0.32% for control and irradiated samples,
respectively. In total protein values of irradiated and control samples, no significant
changes were observed during the storage period.
3.3.11.2 Total Protein Values of Mixed Fruit Jelly
The total protein values in control and irradiated samples of mixed fruit jelly
were estimated and it was ranged from 0.20 – 0.25% (Fig. 3.22). After irradiation
similar total protein values were found in the all doses of irradiated and control
samples. It was found to be 0.23, 0.23, 0.24, 0.25 and 0.24% of total protein in the
control, 2.5, 5, 7.5 and 10 kGy respectively. The values were 0.22, 0.22, 0.23, 0.24,
0.22% for 3rd
month, 0.22, 0.23, 0.23, 0.24, 0.22% for 6th
month and 0.20, 0.21, 0.22,
0.23, 0.22% for 9th
month of storage in control and 2.5, 5, 7.5, 10 kGy of irradiated
samples, respectively. At 12th
month of storage, it was 0.20, 0.21, 0.22, 0.22, 0.22% for
control and irradiated samples, respectively. In total protein values of all doses of
irradiated samples, no significant changes were observed during the storage period.

68
Fig. 3.21 Effect of electron beam irradiation on the total protein values of mixed fruit jam
Fig. 3.22 Effect of electron beam irradiation on the total protein values of mixed fruit jelly
0
0.05
0.1
0.15
0.2
0.25
0.3
0.35
0.4
0 1 2 3 4 5 6 7 8 9 10 11 12
To
tal
Pro
tein
(%
)
Storage Period (Month)
Control 2.5 kGy 5 kGy 7.5 kGy 10 kGy
0.15
0.17
0.19
0.21
0.23
0.25
0.27
0 1 2 3 4 5 6 7 8 9 10 11 12
To
tal
Pro
tein
(%
)
Storage Period (Month)
Control 2.5 kGy 5 kGy 7.5 kGy 10 kGy
69
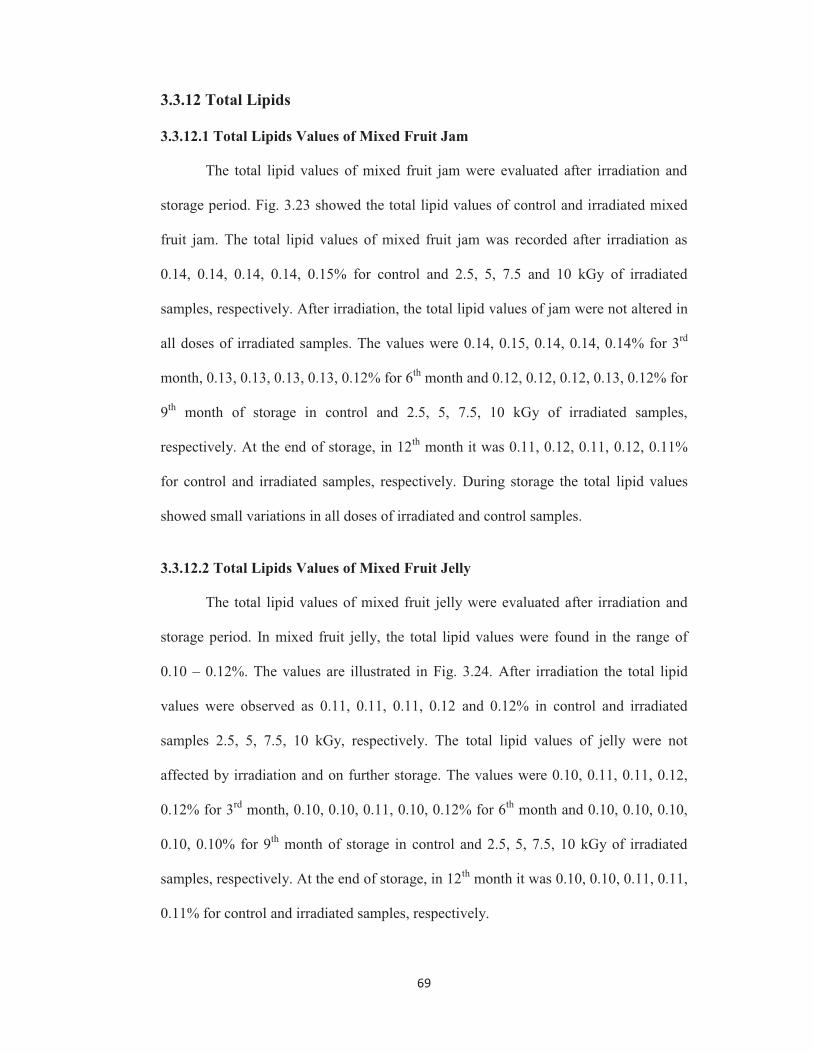
3.3.12 Total Lipids
3.3.12.1 Total Lipids Values of Mixed Fruit Jam
The total lipid values of mixed fruit jam were evaluated after irradiation and
storage period. Fig. 3.23 showed the total lipid values of control and irradiated mixed
fruit jam. The total lipid values of mixed fruit jam was recorded after irradiation as
0.14, 0.14, 0.14, 0.14, 0.15% for control and 2.5, 5, 7.5 and 10 kGy of irradiated
samples, respectively. After irradiation, the total lipid values of jam were not altered in
all doses of irradiated samples. The values were 0.14, 0.15, 0.14, 0.14, 0.14% for 3rd
month, 0.13, 0.13, 0.13, 0.13, 0.12% for 6th
month and 0.12, 0.12, 0.12, 0.13, 0.12% for
9th
month of storage in control and 2.5, 5, 7.5, 10 kGy of irradiated samples,
respectively. At the end of storage, in 12th
month it was 0.11, 0.12, 0.11, 0.12, 0.11%
for control and irradiated samples, respectively. During storage the total lipid values
showed small variations in all doses of irradiated and control samples.
3.3.12.2 Total Lipids Values of Mixed Fruit Jelly
The total lipid values of mixed fruit jelly were evaluated after irradiation and
storage period. In mixed fruit jelly, the total lipid values were found in the range of
0.10 – 0.12%. The values are illustrated in Fig. 3.24. After irradiation the total lipid
values were observed as 0.11, 0.11, 0.11, 0.12 and 0.12% in control and irradiated
samples 2.5, 5, 7.5, 10 kGy, respectively. The total lipid values of jelly were not
affected by irradiation and on further storage. The values were 0.10, 0.11, 0.11, 0.12,
0.12% for 3rd
month, 0.10, 0.10, 0.11, 0.10, 0.12% for 6th
month and 0.10, 0.10, 0.10,
0.10, 0.10% for 9th
month of storage in control and 2.5, 5, 7.5, 10 kGy of irradiated
samples, respectively. At the end of storage, in 12th
month it was 0.10, 0.10, 0.11, 0.11,
0.11% for control and irradiated samples, respectively.

70
Fig. 3.23 Effect of electron beam irradiation on the total lipid values of mixed fruit jam
Fig. 3.24 Effect of electron beam irradiation on the total lipid values of mixed fruit jelly
0.04
0.08
0.12
0.16
0.2
0 1 2 3 4 5 6 7 8 9 10 11 12
To
tal
Lip
ids
(%
)
Storage Period (Month)
Control 2.5 kGy 5 kGy 7.5 kGy 10 kGy
0.04
0.06
0.08
0.10
0.12
0.14
0.16
0 1 2 3 4 5 6 7 8 9 10 11 12
To
tal
Lip
id (
%)
Storage Period (Month)
Control 2.5 kGy 5 kGy 7.5 kGy 10 kGy

71
3.3.13. Calorific Value
3.3.13.1 Calorific Value of Mixed Fruit Jam
The calorific values of mixed fruit jam were ranged from 196.59 – 200.12
kcal/100gm of sample (Fig. 3.25). After irradiation, it was found to be 196.74, 196.74,
197.41, 198.35, 199.99 kcal/100gm of sample in control and 2.5, 5, 7.5, 10 kGy,
respectively. The calorific values of mixed fruit jam were increased with an increasing
irradiation and the same trend was maintained throughout the study period. The values
were 197.10, 197.07, 197.67, 198.34, 199.94 for 3rd
month, 196.77, 197.30, 197.31,
198.57, 199.89 for 6th
month and 196.68, 197.09, 197.34, 198.41, 199.74 kcal/100gm
of sample for 9th
month of storage in control and 2.5, 5, 7.5, 10 kGy of irradiated
samples, respectively. At 12th
month of storage, it was 196.67, 196.96, 197.37, 197.99,
199.91 kcal/100gm of sample. The calorific values of control and irradiated samples
were slightly lowered during storage period.
3.3.13.2 Calorific Value of Mixed Fruit Jelly
The calorific values of mixed fruit jelly were ranged from 174.34 to 176.13
kcal/100gm of sample (Fig. 3.26). After irradiation, it was found to be 174.34, 174.50,
174.74, 175.20, 175.84 kcal/100gm of sample in control and 2.5, 5, 7.5, 10 kGy,
respectively. The calorific values of jelly were increased with an increase in irradiation
dose and the condition was maintained throughout the storage period. The values were
174.58, 174.58, 175.00, 175.32, 175.93 for 3rd
month, 175.23, 174.85, 175.08, 175.31,
176.13 for 6th
month and 175.07, 174.79, 175.19, 175.40, 175.78 kcal/100gm of sample
for 9th
month of storage in control and 2.5, 5, 7.5, 10 kGy of irradiated samples,
respectively. At 12th
month of storage, it was 174.51, 174.71, 175.18, 175.19, 175.80
kcal/100gm of sample for control and irradiated samples, respectively.

72
Fig. 3.25 Effect of electron beam irradiation on the calorific values of mixed fruit jam
Fig. 3.26 Effect of electron beam irradiation on the calorific values of mixed fruit jelly
194
195
196
197
198
199
200
201
0 1 2 3 4 5 6 7 8 9 10 11 12
Ca
lori
fic
Va
lue
(k
cal/
10
0g
m o
f S
am
ple
)
Storage Period (Month)
Control 2.5 kGy 5 kGy 7.5 kGy 10 kGy
173
173.5
174
174.5
175
175.5
176
176.5
0 1 2 3 4 5 6 7 8 9 10 11 12
Ca
lori
fic
Va
lue
(k
cal/
10
0g
m o
f S
am
ple
)
Storage Period (Month)
Control 2.5 kGy 5 kGy 7.5 kGy 10 kGy
73
3.3.14 UV-VIS Spectrum Analysis
After irradiation, UV-Visible spectrum analysis was carried out for irradiated
and control samples of mixed fruit jam and jelly products. It was shown in Fig. 3.27
and Fig. 3.28. In the spectrum analysis of irradiated and control samples, the absorption
curves were found between 200 and 600 nm. In both jam and jelly products, the shape
of the spectrum was similar in all doses of irradiated (2.5, 5, 7.5, 10 kGy) and control
samples. The absorption values of irradiated samples, only slight variation were found
between 200 and 300 nm.
3.3.15 Microscopic Structure Analysis
The microscopic structure of electron beam irradiated and control jam and jelly
products were studied. It was given in Plate 3.4 and Pate 3.5. In jam, the crushed pieces
of fruit tissues and fragments of fibre with varying size and shape were observed under
the microscope. In jelly, tiny fruit particles only were found. These are observed in all
doses of irradiated and control samples. Extraneous materials were not found out in
both jam and jelly products. In microscopic structure analysis, there is no any notable
differences showed in electron beam irradiated jam and jelly products compared to
control samples.
3.4 DISCUSSION
In the present study, mixed fruit jam and jelly products were exposed to
electron beam irradiation at doses of 2.5, 5, 7.5 and 10 kGy. The proximate values
were analyzed after irradiation and storage period to evaluate the effect of irradiation
on jam and jelly products. The pH values of irradiated jam and jelly products were
recorded in the range of 3.30 - 3.39 and 3.04 - 3.13, respectively.

74
Fig. 3.27 UV-Visible spectrum for electron beam irradiated and control mixed fruit jam
a) Control b) 2.5 kGy
c) 5 kGy d) 7.5 kGy
e) 10 kGy

75
Fig. 3.28 UV-Visible spectrum for electron beam irradiated and control mixed fruit jelly
a) Control b) 2.5 kGy
d) 7.5 kGy c) 5 kGy
e) 10 kGy

76
Plate 3.4 Microscopic structures of electron beam irradiated and control mixed
fruit jam products
(a) (b)
(d)(c)
(e)
(a) Control, (b) 2.5 kGy, (c) 5.0 kGy, (d) 7.5 kGy, (e) 10 kGy

77
Plate 3.5 Microscopic structures of electron beam irradiated and control mixed
fruit jelly products
(a) (b)
(d)(c)
(e)
(a) Control, (b) 2.5 kGy, (c) 5.0 kGy, (d) 7.5 kGy, (e) 10 kGy

78
After irradiation of jam, the pH values were slightly decreased with an
increasing irradiation dose. The same trend was found throughout the experimental
period. The storage not altered the pH values of jam. After irradiation of jelly, only
slight variation was observed in pH values at higher irradiation doses (7.5 and 10 kGy).
During storage the pH values of jelly were slightly lowered in both irradiated and
control samples. The similar findings were reported by Al-Bachir (2014), electron
beam and gamma irradiated chamomile powder sample showed decrease in pH value
with increasing irradiation dose (10 and 20 kGy), it was probably due to release of the
organic acids during irradiation treatment. It is an agreement with the Aleid et al.
(2013) reported that pH value was slightly lowered in dates treated with low-energy X-
ray irradiation at doses of 3, 5 and 7 KGy and it did not affect the overall quality of the
dates. The pH value is one of the main factors in influencing the quality of product. It
always controls some physical, chemical and microbiological properties of product
(Liu et al., 2011). The desirable level of pH for jam is 3.20 to 3.60 and for jelly 3.00 to
3.20, within this level the products were keeping their quality and shelf life as good
(Frey, 2005). In this study, pH value of irradiated and control samples were maintained
under the desirable level. It is inferred that electron beam irradiation did not affect the
pH value of jam and jelly products.
Contrary to these results was reported by Moreno et al. (2006) the increase in
pH values were observed in the Tommy Atkins mango fruit samples treated with the
higher doses of irradiation due to reduction of acid contents of the fruits. Rico et al.
(2010) reported that irradiation treatment with 10 kGy did not affect the pH values of
dried red pepper. No significant change was observed in pH values of lyceum fruit
exposed to gamma irradiation at doses of 4 kGy, 8 kGy and 15 kGy (Wen et al., 2006).

79
The pH value of herbals, rose, guggul, chirata and gulvel and herbal formulations were
not affected by gamma radiation treatment with 10 kGy (Kumar et al., 2010).
The acidity values were found in the range of 0.73 – 0.81% for jam and 0.83 –
0.95% for jelly. After irradiation, the acidity values of jam and jelly products were
slightly increased with increasing irradiation doses. The same trend was maintained
throughout the study. In jam, acidity values of control and irradiated samples were not
altered by storage whereas in jelly it was slightly increased during storage period.
Similar findings were reported by Kim et al. (2008) the acidity value of irradiated
organic materials were increased could be due to release of organic acids and it might
be due to the formation of carboxylic groups during irradiation treatment. Wang and
Yu (2009) reported that the titratable acidity of gamma irradiated wheat flour increased
from 4.9 to 30%. The acidity value was increased in gamma irradiated mango samples
at doses between 0.5 and 1 kGy (Youssef et al., 2002). Aleid et al. (2013) stated that
the increase in the acidity value of irradiated products may contribute to stability of the
products against microbial spoilage. The ascorbic acid, pectin and sugar degradation
may be responsible for formation of acidic compounds (Sogi and Singh, 2001; Iftikhar
et al., 2007). The fruits Tommy Atkins mangoes exposed to electron beam irradiation
at doses of 1, 1.5 and 3.1 kGy had an acceptable acidity level and that remain
unaffected during storage period (Moreno et al., 2006). In irradiated jam and jelly
products the increased acidity and decrease in pH values were recorded but not at
significant level. Generally pH and acidity of the food products are interrelated when
acidity increased, pH decreased. It did not affects the overall quality of jam and jelly
the products.
The electrical conductivity (EC) values of jam and jelly products were recorded
in the range of 0.13 – 0.16 mS/m for jam and 0.11 – 0.13 mS/m for jelly. After

80
irradiation, EC values of jam and jellies were not altered. Also during the storage
period, EC values of irradiated and control jam and jellies were remain unchanged.
Similar findings were reported by Ramathilaga and Murugesan (2011) the electron
beam irradiated chyavanaprash herbal ayurvedic formulations at doses of 0, 2.5, 5 and
7.5 and 10 kGy, the EC values was found in the range of 0.09 – 0.12 mS/m and EC
values were not altered by electron beam irradiation. Most of the irradiated vegetables
EC values showed no consistent variations were found between irradiated and control
samples (Hayashi and Kawashima, 1983).
Contrary to these results was reported by Ahamed (1998) EC values of dried
fruits and nuts showed variations between irradiated and control samples. The
differentiated EC values were observed between control and irradiated samples of
potatoes (Hayashi and Kawashima, 1983) and fish samples (Ehlermann, 1972). The
concentration of mineral salts, organic acids and proteins were determine the electrical
conductivity values of honey samples and the ionic strength of a food material directly
influences their conductivity values (Terrab et al., 2004). It is inferred that the electron
beam irradiation did not affect the EC values of jam and jellies.
The moisture content is an important quality factor in the preservation and
packaging of food products as excess moisture can promote microbial growth, which
rapidly deteriorates the quality of food (Fennema, 1996). The moisture and water
activity of sample is most importance as its controls radiochemical changes (Wilkinson
and Gould, 1998). In the present study, the increase in irradiation doses the moisture
values of jam and jelly products were slightly reduced. The moisture values of
irradiated jam and jelly products were lowered than control samples. The same trend
was observed throughout the study. The moisture values of irradiated and control jam

81
samples did not showed any significant changes during storage period whereas in jelly
small variations were observed.
The similar findings were reported by Bhat and Sridhar (2008) the electron
beam irradiation could significantly reduce the moisture content in lotus seeds based on
increase in radiation dose and it has advantageous in maintenance and improvement of
shelf life of lotus seeds. The same trend was observed by Sarker et al. (2014)
cucumber, tomato, carrot, green leaf lettuce and green capsicum were treated with 1, 2,
2.5 and 3 kGy of gamma irradiation showed decrease in moisture value with increasing
irradiation doses. The moisture decreases are in agreement with the findings of Bhat et
al. (2008) for electron beam irradiation of Mucuna pruriens seeds and Warchalewski et
al. (1998) for gamma and microwave irradiation of wheat grain. On contrary to this
results Nortje et al. (2005) reported that moisture content was significantly increased in
gamma irradiated moist beef biltong at doses between 2 and 8 kGy. No significant
changes were found in moisture values by absorbed radiation doses in irradiated feta
cheese (Konteles et al., 2009), chicken tissues (Heath et al., 1990), Tilapia nilotica
(Cozzo-Siqueira et al., 2003), rawa (Rae et al., 1994).
The total solids values of electron beam irradiated and control samples of jam
and jellies were studied. It was ranged from 65.15 – 66.53% total solids for jam and
58.70 – 60.38% total solids for jelly. The increase in irradiation doses the moisture
values of jam and jelly products were decreased and consequently total solids content
of the products were increased. Similar results were reported for total solids and
moisture changes in gamma irradiated apples by Mostafavi et al. (2012). After
irradiation, the total solids values of jam were increased based on increasing irradiation
doses. The condition was maintained throughout the storage period. The total solids
values of control and irradiated jam samples were not altered during storage period.

82
The same trend was also observed in jelly. The products with absence of
microorganisms as well as stable pH, moisture, total soluble solids, color and viscosity
values during storage indicate the stability of the product is more (Martina Avasoo and
Linda Johansson, 2009). The increased solid content of the food materials results in
increased protein, minerals, carbohydrates and other nutrients (Akther et al., 2012).
It was agreed with Aleid et al. (2013) the moisture and total solids values of X-
ray irradiated dates at doses between 3 and 7 kGy showed increased values of total
solids and decreased values of moisture. The similar findings were reported by
Ladaniya et al. (2003) the increase in total soluble solids of irradiated mandarins and
oranges at doses upto 1.5 kGy. The increase in total soluble solids values were
observed in irradiated blueberries and cherries (Eaton et al., 1970) and irradiated
mangoes (Lacroix et al., 1992). The different findings were reported by Mitchell et al.
(1992) showed no variations in soluble solids of irradiated mango at doses of 75, 300
and 600 Gy and reduction in the soluble solids of peaches at 75 Gy, these differences
may be associated with variation between the samples. Innocenzo and Lajolo (2001)
reported that total soluble solids of papaya fruits were not affected by irradiation.
According to the Codex standards for jam and jellies, the total solids content should be
between 60 - 65% for jam and 40 - 65% for jelly (CODEX, 2009). The total solids
content of electron beam irradiated jam and jellies had an acceptable level of total
solids and that remain unchanged during storage period.
The total ash content of irradiated and control samples were studied. It was
ranged from 0.33 – 0.36% ash for jam and 0.17 – 0.21% ash for jelly. In this study the
ash content of jam and jelly was also similar with cherries and apricots jam (0.28%)
(Belitz et al., 2009), strawberry jelly (0.19%) (Miguel et al., 2008) and cubiu jelly
(0.22%) (Yuyama et al., 2008). After irradiation similar ash values were found in all

83
the doses of irradiated and control samples. Irradiation did not affect the ash values of
mixed fruit jam and jelly. Also during storage period, no significant changes were
observed in ash values. Similar findings were reported by Ramathilaga and Murugesan
(2011) in chyavanaprash ayurvedic formulations the total ash value was not changed
by electron beam irradiation at doses of 2.5 - 10 kGy. Similarly, the irradiation had
does not affect the ash content of electron beam irradiated wheat straw (Shawrang et
al., 2013) and gamma irradiated Castanea sativa (Fernandes et al., 2011a).
Different findings were reported in earlier studies as Bhat et al. (2008) the ash
values of Mucuna pruriens seeds were significantly declined after electron beam
irradiation and Azelmat et al. (2006) reported that the gamma irradiation (0.6, 0.9 and
1.8 kGy) increased ash content of Moroccan dates. Bhat and Sridhar (2008) reported
that increased ash value was found in electron beam irradiated lotus seeds. Ash values
of food products are used as an index of the quality of food materials. (Pomeranz and
Clifton, 1981). The ash values of food products represents amount of minerals present
in food products, high ash represents high in minerals (Vadivel and Janardhanan,
2004). The minerals (phosphorus, potassium, sodium, calcium and iron) were also
found in jam and jelly products, showed minerals values remain unchanged after
irradiation and storage period. No significant changes were observed in ash values of
irradiated jam and jelly samples. The results of this study showed that there was a
relation between ash and minerals values, so that, the same trend was observed after
electron beam irradiation in both ash and minerals values of jam and jelly products.
The important constituents of jams and jellies are pectin, sugar, acids. These
constituents should be maintained in correct proportion for retain the gel structure and
to keep the stability of product (Costell et al., 1993). The effect of electron beam
irradiation on pectic substances of mixed fruit jam and jellies were studied. The

84
insignificant reduction of pectin values was observed after irradiation and storage
based on increase in radiation dose. The same condition was observed in both jam and
jelly products. The decrease in pectin values was observed in irradiated dehydrated
vegetables, fruits and legumes at doses of 3 to 10 kGy (Agarwal et al., 1972). It was
agreed with Tripathi et al. (2013) reported that the decreased firmness values of gamma
irradiated ready-to-cook (RTC) ash gourd at the dose range of 0.5 – 2.5 kGy due to
radiation induced breakdown of pectin and other cell wall components. Generally, the
firmness values of food samples are associated with pectin contents of food material.
The decreased firmness and pectin values were reported in gamma irradiated apple
slices (Gunes et al., 2001) and electron beam irradiated strawberries (Yu et al., 1996)
and some irradiated fresh cut fruits and vegetables (Fan et al., 2008) and electron beam
irradiated sliced mushrooms (Yurttas et al., 2014) but it did not affect the overall
quality of the products.
During storage, the reductions in pectin values were also observed in control
samples of jam and jellies. In fruits, decreased pectin values was also observed in non-
irradiated samples during storage might be due to the presence of higher microbial
counts could produce pectinolytic enzymes that hydrolyze the pectic substances (Juven
et al., 1985; Fraaije et al., 1997; Liao et al., 1997). The different results were reported
by Chuanyao et al. (1993) the firmness of irradiated apples (0.3–0.9 kGy) was higher
than control samples with increasing storage time. Irradiation had delaying the pectin
degradation in climacteric fruits (Khan et al., 1974; Akamine and Moy, 1983; Zhao et
al., 1996). The jellying power is the most important property of pectin (Doesburg,
1965). In this study, the slight variations were observed in pectin values after
irradiation and storage but the values were comparable to traditional jams and jellied

85
products and it showed that, the electron beam irradiation did not affect the gel
structure and overall acceptability of the product.
Fruits and fruit-based products are good source of fibre. The advantages of fibre
containing foods are essential for healthy life. It is mostly preferred in many diets
because of their ability to prevent digestive disorders, constipation, help in regulating
bowel movements and reduce blood cholesterol level (Champ et al., 2003). The crude
fibre values of jam and jelly were determined after irradiation and storage period. The
crude fibre values of jam was ranged from 2.11 – 2.17% and in case of jelly, 1.41 –
1.49%. These values were close to that of commercial jam and jellies (Belitz et al.,
2009). The crude fibre values of mixed fruit jam were not changed by irradiation. In
jelly, slight variations in fibre values were observed only at higher doses. During
storage, no significant changes were observed in crude fibre values of irradiated and
control samples of jam and jellies. Similar findings were reported by Aleid et al.
(2013) there was no differences observed in crude fibre values of dates treated with x
ray irradiation (3, 5, 7 kGy).
Different results were observed by Bhat and Sridhar (2008) the electron beam
irradiation decreased the crude fibre of lotus seeds at doses of 2.5 – 30 kGy. The fibre
content of African oil bean seed was significantly reduced by gamma irradiation at
dose of 10 kGy (Enujiugha et al., 2012). Shawrang et al. (2013) and Banchorndhevakul
(2002) were reported that at higher doses of irradiation (250 to 500 kGy), the decrease
of neutral detergent fibre (NDF) and acid detergent fibre (ADF) of agricultural residues
significantly as a result of radiation induced degradation of cellulose and hemicellulose
into soluble substances. Irradiated fruits, the insoluble fibre contents were broken down
to soluble compounds, causing the fruit to become soft (Aleid et al., 2013; Lund et al.,
1983). Fibre levels of irradiated fruits decreased based on the level of absorbed dose of

86
irradiation may be due to depolymerisation and delignification (Jerome et al., 1952).
The results of this study showed that the electron beam irradiation at this dose level
(2.5 to 10 kGy) did not affect the crude fibre values of jam and jellies.
The ratio of sugar and acid is often used as an index of consumer acceptability
and quality in fruits and fruit products (Vidhya and Anandhi Narain, 2011). The total
sugar values of jam and jelly were evaluated after irradiation and storage period. After
irradiation, it was found to be 48.53, 48.55, 48.70, 48.90, 49.33% total sugar for jam
and in case of jelly 43.11, 43.15, 43.20, 43.28, 43.45% in control and 2.5, 5, 7.5, 10
kGy, respectively. The total sugar values of jam and jelly were increased slightly with
an increase in irradiation dose and the condition was maintained throughout the
experimental period. The total sugar values of control and irradiated samples were also
slightly increased during storage period in both jam and jelly products. The same trend
was also reported by Bhat and Sridhar (2008) the electron beam irradiation could
increase the sugar content in lotus seeds with an increase in radiation dose, might be
due to breakdown of complex polysaccharides into simpler forms of sugars. Similar
results were observed in Moroccan dates were treated with gamma irradiation, at 0.9
kGy significantly increased glucose and total sugars contents (from 81.58 to 87.43%)
and reduction in the starch content was also observed during storage (Azelmat et al.,
2006). The reducing sugar values of jam and jelly products was not changed after
irradiation and the same values was found during storage period in irradiated and
control samples. It was recorded in the range of 22.25 to 22.31% reducing sugar for
jam and in jelly it was 17.03 to 17.19% reducing sugar.
Different findings have been reported in the effect of irradiation on the sugar
values of food products. Total sugar and reducing sugar values were not changed by
irradiation in Maroc Late oranges at doses of 0.125 - 0.5 kGy (Moussaid El Idrissi et

87
al., 2002) and the same trend observed in kiwifruits by low-dose e-beam irradiation at
0.3 and 0.6 kGy (Kim et al., 2007) and in onions (Diehl, 1977; Thomas et al., 1986;
Guma and Rivetti, 1970). El-Samahy et al. (2000) reported that the gamma irradiation
(0.5 to 1.5 kGy) of mangoes had no effect on total sugars but it was slightly increased
the reducing sugars values. Castell-Perez et al. (2004) reported no effect of electron
beam irradiation (1.0, 1.5 and 3.1 kGy) on the total sugars content in cantaloupe. Wall
(2007) reported that X-ray irradiated dwarf Brazilian bananas, starch and total sugar
concentrations were similar and not changed by irradiation (200 - 800 Gy). Din et al.,
(2011) reported that the total sugar values of dates significantly decreased with increase
in irradiation dose (1, 2 and 3 kGy). In the traditionally formulated wood apple jam,
fruit bar (Vidhya and Anandhi Narain, 2011) and cereal based papaya powder (Aruna
et al., 1998) showed the total sugar, reducing sugar and total soluble solids values were
increased with an increase in storage time due to the conversion of starch and insoluble
carbohydrate into sugars but it did not cause negative effect on the quality of products.
In view of that, the irradiation did not affect the quality of jam and jelly products as a
result of increase in sugar values.
In the present study, the total protein and lipid values were tested in irradiated
and control samples. After irradiation similar protein values were found in all doses of
irradiated and control samples. Irradiation did not affect the total protein values of jam
and jelly products. The same trend was also observed during storage period. Similar
findings were reported by Shawrang et al. (2013) the effect of electron beam irradiation
on the chemical composition of wheat straw showed irradiation had no effect on lipids,
crude protein and ash values even at doses of 250 and 500 kGy. The different results
were reported by Dario and Salgado (1994) the protein value was increased
significantly in gamma irradiated cowpea. Mucuna pruriens seeds treated with electron

88
beam irradiation at doses of 2.5 to 30 kGy could increase seed protein values might be
attributed to the dissociation of complex protein molecules into simpler forms. In
Mucuna pruriens seeds, a dose dependent decrease of crude lipid values was also found
(Bhat et al., 2008). Bhat and Sridhar (2008) reported that the decreased crude protein
and lipid values were found in electron beam irradiated lotus seeds. In the present
study, the total lipid values of jam and jellies were not changed after irradiation and on
further storage period. Only small variations were observed in lipid values of irradiated
and control jams during storage period. Irradiation of higher lipid containing foods, the
production of off-odour might be attributed to breakdown of lipids on irradiation which
is limiting the shelf life of the products (Diehl, 1995). In the present study, the low
level of protein and lipids was found in jam and jellies; it ranged from 0.10 - 0.15% of
lipids and 0.20 - 0.36% of protein, thereby the impact of electron beam irradiation on
protein and lipid values of jam and jellies was insignificant.
In general, after irradiation the macronutrients like protein, lipid and
carbohydrates quality does not loss (WHO, 1999) and micronutrients like minerals also
shown to remain stable (Diehl, 1995). AL-Bachir (2010) reported that the proximate
composition of gamma irradiated Sheesh Tawoq showed that irradiation doses (2, 4, 6
kGy) had no effect on the major constituents moisture, protein and fat values of Sheesh
Tawoq. Aleid et al. (2013) reported that the dates treated with X-ray irradiation (3, 5, 7
kGy), has produce no negative effect on the physical and chemical quality parameters
such as crude fibre, soluble dietary fibre, sucrose, glucose, fructose, moisture, total
soluble solids, pH, water activity and colour. Irradiation is also known to cause fewer
overall physical and chemical changes than cooking, refrigeration and canning
(Enujiugha et al., 2012; Josephson et al., 1978; Molins, 2001).

89
The energy producing capacity of the food is usually characterized by using
calorific values of the food (Mares et al., 2010). The calorific values of jam were
ranged from 196.59 – 200.12 kcal/100gm of Sample and in jelly it was 174.34 to
176.13 kcal/100gm of Sample. After irradiation, it was slightly increased with an
increasing irradiation dose in both jam and jelly products and the same trend was
maintained throughout the study period. During storage period, small variations were
found in calorific values but not at significant level. Similar findings were obtained by
Bhat and Sridhar (2008) the electron beam irradiation could increase the calorific value
of lotus seeds at doses of 2.5, 5 and 7.5 kGy due to increased carbohydrate content and
preserved the concentration of other nutrients of lotus seeds after irradiation. The same
trend was observed by Fernandes et al. (2011b) carbohydrates, fat and energy value of
gamma irradiated chestnut (0.25, 0.5, 1 and 3 kGy) was greater than control samples. It
was also agreed with Enujiugha et al. (2012) the cooking and combined treatment of
gamma irradiation (10 kGy) increased the energy value of African oil bean seed as a
result of increase in fat and calorific content. Different results were reported by Bhat et
al. (2008) the electron beam irradiation slightly decreased the total energy values of
Mucuna pruriens seeds with increase in irradiation dose (2.5 to 30 kGy) might be
attributed to crude lipid, crude fibre and ash content of seeds declined after irradiation.
Jam and jellies are prepared from combination of different fruit pulps which is a
good source of carbohydrates, vitamins, minerals, pectin, dietary fibers and high
energy value that are essential components for normal growth and development
(Vidhya and Anandhi Narain, 2011). In this study, the electron beam irradiation had
produced no significant effect on proximate composition of jam and jellies. In
irradiated jam and jelly products, there was no variation observed in crude fibre,
protein, lipids values whereas total solids, total sugar and reducing sugar values were
increased slightly based on irradiation dose and storage period. These results indicate
that, electron beam irradiated jam and jelly products contains higher amount of
90
nutrients and thereby the calorific value of irradiated samples were relatively increased
than control sample. In this study, after irradiation and storage period, the proximate
composition of jam and jelly products were found within the standard limits and
comparable to earlier reports on various jam and jelly products (Ferreira et al., 2004;
Touati et al., 2014; Belitz et al., 2009).
UV-Visible spectrum analysis is one of the indirect measurements to evaluate
the radiolytic products formed and internal component changes in the food products
after irradiation (Brasoveanu et al., 2005). Orozco et al. (2012) reported that the UV-
Visible absorption and FTIR analysis was carried out to assess the physico-chemical
changes between various doses of gamma irradiated (600 – 3500 kGy) and control
samples of orange peels and found that similar spectra patterns in control and irradiated
samples but at higher doses of irradiation, the changes in functional groups and
decreased the sugar absorption values as a results of substrate degradation by
radiolysis. In the present study, the UV-VIS absorption spectrum of jam and jelly
samples were not altered by irradiation doses. In irradiated samples, the absorption
values only slight variation was found between 200 and 300 nm.
Similar results were reported by Brasoveanu et al. (2005) the UV-VIS
absorption spectrum of Spirulina platensis was not altered by electron beam irradiation
even at higher doses (80 kGy). Nemtanu et al. (2006) reported that the slight decrease
and increase in absorption values was also found in irradiated Spirulina and the same
trend was reported by Lee and Song (2002) in irradiated myoglobin. Similar results
were reported by Akram et al. (2012) the radiation-induced changes in gamma
irradiated mushroom was analysed by using FTIR analysis (400 to 4000 cm−1
) had a
comparable spectra pattern found between control and irradiated samples (2 to 50
kGy). In this study, the shape of the spectrum was similar in all doses of irradiated (2.5,
5, 7.5, 10 kGy) and non-irradiated jam and jelly products. The same condition was also
found during storage period. From the results, no radiolytic products were found in

91
both jam and jelly products after electron beam irradiation at this dose level (2.5 to 10
kGy) and it was not significantly altered the overall composition of jam and jelly
products.
In general, the processing of foods brings about changes in their microstructure.
However, the physical changes of food material upon irradiation are less or non-
significant than other conventional food processing methods like cooking, heating,
refrigeration and drying (Akram et al., 2012). In this study, the microscopic structural
analysis was carried out in irradiated and control samples by using light microscopy. In
microscopic structure analysis of jam and jelly products, showed no significant
differences between irradiated and control samples. Similar findings were reported by
Moreno et al. (2006) during SEM analysis the minimum changes were observed in
microstructure of electron beam irradiated Tommy Atkins mangoes (at 1 kGy). Akram
et al. (2012) reported that the radiation-induced physical changes in gamma irradiated
dried mushroom (0-50 kGy) was analysed by using scanning electron microscopy
(SEM) showed microstructural damage after irradiation due to decreased percentage of
rehydration but it did not cause significant effect on the quality of the mushroom.
The light microscopy analysis is an important food quality analysis tool to
identify the extraneous materials and authenticity in commercial fruit products such as
jam, jelly and preserves (Morais et al., 2004). According to food standards, jams and
jellies are must be prepared with sound fruits and free of any extraneous material
(Ministry of Health, 1978). In this study, there was no extraneous material and foreign
plant tissues found in both irradiated and control samples of jam and jelly products.
The results of present study reveals that electron beam irradiation at this dose level (2.5
to 10 kGy) did not altered the proximate composition of jam and jelly products and it
can be used as a potential treatment to preserve the quality attributes of jam and jelly
products.