effect of electrical stimulation on muscle recruitment as
TRANSCRIPT

University of ConnecticutOpenCommons@UConn
Master's Theses University of Connecticut Graduate School
12-14-2015
Effect of Electrical Stimulation on MuscleRecruitment as it Relates to Maximal VoluntaryContractionKelly StrattonUniversity of Connecticut - Storrs, [email protected]
This work is brought to you for free and open access by the University of Connecticut Graduate School at OpenCommons@UConn. It has beenaccepted for inclusion in Master's Theses by an authorized administrator of OpenCommons@UConn. For more information, please [email protected].
Recommended CitationStratton, Kelly, "Effect of Electrical Stimulation on Muscle Recruitment as it Relates to Maximal Voluntary Contraction" (2015).Master's Theses. 862.https://opencommons.uconn.edu/gs_theses/862

Effect of Electrical Stimulation on Muscle Recruitment as it Relates
to Maximal Voluntary Contraction
By
Kelly Stratton
B.S., University of Connecticut, 2013
A Thesis
Submitted in Partial Fulfillment of the
Requirements for the Degree of
Master of Science
at the
University of Connecticut
2015

ii
Copyright by
Kelly Stratton
2015

iii
APPROVAL PAGE
Masters of Science Thesis
Effect of Electrical Stimulation on Muscle Recruitment as it Relates to Maximal
Voluntary Contraction
Presented by
Kelly Stratton, B.S.
Major Advisor _________________________________________________________________
Pouran Faghri
Associate Advisor ______________________________________________________________
Tania B. Huedo-Medina
Associate Advisor ______________________________________________________________
Yusuf Khan
University of Connecticut
2015

iv
TABLE OF CONTENTS
LIST OF TABLES ..................................................................................................................................... vi
LIST OF FIGURES .................................................................................................................................. vii
LIST OF EQUATIONS ........................................................................................................................... viii
ABSTRACT ................................................................................................................................................ ix
I. INTRODUCTION ............................................................................................................................... 1
Anatomy of a skeletal muscle ................................................................................................................. 1
Monitoring muscle response .................................................................................................................. 4
Electromyography ................................................................................................................................. 4
Voluntary muscle recruitment ............................................................................................................... 5
Muscle response with Electrical Stimulation ........................................................................................ 7
Parameters of ES and effects on muscle force production .................................................................. 7
Recruitment with Electrical Stimulation ............................................................................................ 11
Reverse selection recruitment theory .................................................................................................. 11
Non-selective recruitment theory ........................................................................................................ 12
Stimulation Artifact .............................................................................................................................. 13
Stimulation Artifact Removal Options ............................................................................................... 15
II. OBJECTIVES .............................................................................................................................. 17
II. LITERATURE REVIEW............................................................................................................. 17
Voluntary and ES-activated motor units ............................................................................................ 17
Stimulation Artifact Removal .............................................................................................................. 19
III. SIGNIFICANCE ........................................................................................................................... 21
IV. METHODOLOGY ....................................................................................................................... 23
Participants ............................................................................................................................................ 23
Design ..................................................................................................................................................... 24
Instruments ............................................................................................................................................ 24
Electrical Stimulation device .............................................................................................................. 24
Electromyography (EMG)................................................................................................................... 24
Dynamometer ...................................................................................................................................... 25
Experimental Set-Up ............................................................................................................................ 25
Procedure ............................................................................................................................................... 26
Part One: MVC Contractions ............................................................................................................. 26
Part Two: ES-Elicited Contractions ................................................................................................... 27
Data Analysis ......................................................................................................................................... 28
Signal Processing ................................................................................................................................ 28
v
Signal Parameters ............................................................................................................................... 33
Statistical Analysis .............................................................................................................................. 35
V. RESULTS .......................................................................................................................................... 37
Comparison of voluntary muscle responses for different muscle types ........................................... 37
Evaluation of effectiveness of stimulation artifact removal .............................................................. 42
Comparison of muscle responses at different frequencies ................................................................ 43
Required intensity to reach 25% MVC................................................................................................ 43
ES-induced muscle response at 25% MVC ......................................................................................... 44
Comparison of muscle responses voluntarily and electrically-elicited ............................................. 45
Hybrid activation muscle response at 50% and 75% MVC ................................................................ 45
Isolated voluntary muscle response at 50% and 75% MVC ............................................................... 48
VI. DISCUSSION ................................................................................................................................ 49
Comparison of voluntary muscle responses for different muscle types ........................................... 49
Evaluation of effectiveness of stimulation artifact removal .............................................................. 52
Comparison of muscle responses at different frequencies ................................................................ 55
Required intensity to reach 25% MVC................................................................................................ 55
ES-induced muscle response at 25% MVC ......................................................................................... 56
Comparison of muscle responses voluntarily and electrically-elicited ............................................. 58
Hybrid activation muscle response at 50% and 75% MVC ................................................................ 58
Isolated voluntary muscle response at 50% and 75% MVC ............................................................... 60
VII. CONCLUSION AND CLINICAL IMPLICATIONS ................................................................ 63
VIII. REFERENCES .......................................................................................................................... 65

vi
LIST OF TABLES
Table 1: Commonly Used Artifact Rejection Techniques Regarding Four Criteria ................................... 15
Table 2: Linear Regression Results for Voluntary Signal Outputs (n=10) ................................................. 39
Table 3: Pre and Post EMD Processing SNR, PR, and EI for 10Hz, 35 Hz, and 50Hz .............................. 42
Table 4: Electrical Activity (uV) During Hybrid Activation. ..................................................................... 47

vii
LIST OF FIGURES
Figure 1: Anatomy of a Skeletal Muscle ...................................................................................................... 2
Figure 2: Small and Large Motor Units ........................................................................................................ 3
Figure 3: Abductor Pollicis Brevis and Vastus Lateralis Muscles ................................................................ 4
Figure 4: sEMG Recording of Compiled Motor Unit Signals ...................................................................... 5
Figure 5: Representation of Progressive Recruitment During Voluntary Activation ................................... 6
Figure 6: Relationship between Muscle Recruitment and Electrical Activity .............................................. 7
Figure 7: Monophasic and Biphasic Current Signal ..................................................................................... 8
Figure 8: Force-Frequency Relationship ....................................................................................................... 9
Figure 9: Force Output at Different Stimuli Frequencies ........................................................................... 10
Figure 10: M-Wave with Stimulus Artifact ................................................................................................ 14
Figure 11: Force Pattern in Two Phases ..................................................................................................... 19
Figure 12: Experimental Set-up .................................................................................................................. 26
Figure 13: Muscle Activation in Terms of Force Levels ............................................................................ 27
Figure 14: Force Measurement During Isometric Contractions ................................................................. 28
Figure 15: Illustration of the Sifting Process Using EMD .......................................................................... 30
Figure 16: Steps of Empirical Mode Decomposition .................................................................................. 32
Figure 17: iEMG and Normalized Electrical Activity ................................................................................ 40
Figure 18: MDF and Frequency Distributions of APB and VL Muscles.................................................... 41
Figure 19: Frequency-Intensity Response of APB and VL Muscles at 25% MVC .................................... 43
Figure 20: Electrical Activity (Post-Processing) Generated by Stimulating APB at 25% MVC................ 44
Figure 21: Electrical Activity (Post-Processing) Generated by Stimulating VL at 25% MVC .................. 44
Figure 22: Electrical Activity Generated During ES-Elicited APB Tests .................................................. 46
Figure 23: Electrical Activity Generated During ES-Elicited VL Tests ..................................................... 47
Figure 24: Isolated voluntary muscle response post-ES removal ............................................................... 48

viii
LIST OF EQUATIONS
Equation 1: Discrete Fourier Transform ..................................................................................................... 29
Equation 2: Median Frequency ................................................................................................................... 29
Equation 3: Intrinsic Mode Function Step 1 ............................................................................................... 29
Equation 4: Intrinsic Mode Function Step 2 ............................................................................................... 31
Equation 5: Intrinsic Mode Function Step 3 ............................................................................................... 31
Equation 6: Signal-to-Noise Ratio .............................................................................................................. 33
Equation 7: Power Reduction Equation ...................................................................................................... 34
Equation 8: Operative Signal-to-Noise Ratio ............................................................................................. 34
Equation 9: Voluntary Signal-to-Noise Ratio ............................................................................................. 34
Equation 10: Efficiency Index Equation ..................................................................................................... 34
Equation 11: Isolated Voluntary Response ................................................................................................. 36

ix
ABSTRACT
Regeneration of complex muscle tissue, particularly at the interface between distinct
tissue types such as muscle and tendon, remains an intricate and challenging issue. One approach
recommended for regeneration is electrical stimulation (ES), which involves delivering an
electrical pulse into the body to induce muscle contraction. Despite its well-documented
effectiveness with muscle and tissue hypertrophy in both clinical rehabilitation and tissue
engineering, little is known in terms of monitoring direct muscle response to stimulation. The
recruitment mechanism for muscular contraction with stimulation is unclear, and to understand
the muscle capabilities, it is necessary to filter out the electrical stimulation pulses from
electromyographic (EMG) muscle activity, as the frequency spectra often overlap, distorting the
muscular signal.
The aim of this thesis is to investigate voluntary and ES-induced activation patterns in
small (abductor pollicis brevis, APB) and large (vastus lateralis, VL) muscles, and to make
recommendations for measuring optimal muscle recruitment with ES. In the first part, voluntary
recruitment patterns for muscles of different sizes and fiber types are compared. Next, the
efficacy of a stimulus-removal technique called empirical mode decomposition (EMD) is
evaluated for use with multiple frequencies and contraction levels. This filtering method is then
applied to EMG data to determine the optimal stimulation parameters in terms of greatest
electrical activity emitted from the muscles. Finally, voluntary and ES-induced activation
patterns are compared to evaluate differences in recruitment mechanisms.
The results of the investigation show differences between muscle types in terms of
electrical activity measured with EMG. For both voluntary and electrically-induced contractions,
smaller muscles with smaller fiber types output more electrical signal. EMD was successful in

x
removing stimulus artifact from the signal, and it was possible to compare muscle responses for
varying levels of stimulation. Stimulation delivered at higher frequencies appeared to induce
greater muscle response measured with EMG.
The author recommends further investigation of voluntary and ES-elicited muscle
activations, particularly using protocols with greater participants and more varied muscle types.

I. INTRODUCTION
Electrical stimulation (ES) involves the application of electrical impulses delivered
through the skin to elicit skeletal muscle contractions. Electrical stimulation has shown
promising results in enhancing cell multiplication and tissue regeneration in connective tissues
and in forming new collagen and muscles in injured tissues1-3. The technique has also been used
extensively during rehabilitation and following neuromuscular injuries. Further advantages with
using ES for tissue regeneration include the ability to provide treatment in a controlled exercise
routine4 and to localize and steer an electric field to activate specific locations of skeletal muscle
cells.
Overall, there is considerable evidence supporting ES as an effective treatment modality
on multiple levels, including increased muscle fiber vascularization and collagen synthesis 1-3 as
well as enhanced functionality in patients with neuromuscular dysfunctions5-8. However,
monitoring muscle activity during stimulation remains a challenge. As a result, the mechanism of
action for ES in activating skeletal muscle is still disputed. The relationship between voluntarily
activated muscle and ES-induced activation of healthy muscle should be established prior to full
implementation of ES as a mechanism for muscle regeneration or recovery from injury.
Anatomy of a skeletal muscle
Skeletal muscle function relies on the coordination of the nervous and musculoskeletal
systems. To complete a muscular contraction, the process begins at the spinal cord. The spinal
cord is considered the first level of motor hierarchy. A motor neuron pool, located in the spine,
contains the cell bodies of motor neurons capable of innervating skeletal muscle. Axons of motor
neurons are contained in nerves that connect the spine to individual muscle fibers. To prompt a

2
muscle contraction, motor neurons release acetylcholine, a type of neurotransmitter, at the
neuromuscular junction between the neuron and the muscle fiber. When acetylcholine binds to
receptors on the muscle fiber, an action potential propagates along the muscle fiber triggering
contraction (Figure 1).
Figure 1: Anatomy of a Skeletal Muscle
Motor neurons make up motor units, which innervate muscle fibers9.
A normal muscle is made up of hundreds to thousands of individual fibers. These are
each then grouped into units called motor units, which differ according to function. A motor unit
is composed of a motor neuron and the group of muscle fibers, which it innervates. There are
two major types of motor units found in skeletal muscle: Type I and Type II. Typically, small
motor units have smaller axon diameters, less fibers that make up the complete unit, and more
fatigue-resistance. These motor units innervate slower fibers and are often referred to as Type I
motor units. Larger motor units (Type II) innervate larger, faster fibers which are more fatigable.

3
The number of muscle fibers in a motor unit is directly related to the size of the motor
neuron for that unit10. A small cell body has a lower excitation threshold to cause an action
potential. Correspondingly, less input stimulation is required for the unit to fire. For example, a
motor unit that has a smaller cell body also has a small nerve fiber that innervates fewer fibers
upon activation than a larger motor unit, shown in Figure 2. For this reason, smaller, Type I
motor units are more easily discharged and must be resistant to fatigue. Alternatively, Type II
motor units can activate up to hundreds of muscle fibers synchronously with a single action
potential from a motor neuron. Due to their direct relationship, fibers are generally referred to by
their motor unit type, and ‘Type I’ or ‘Type II’ fiber compositions are often found in literature.
Figure 2: Small and Large Motor Units
Small and large motor units activate proportional numbers of fibers11
Muscles composed of smaller motor units are capable of finer, more precise control. This
would be advantageous for muscles required for refined movements of the hand, such as the
abductor pollicis brevis (APB) muscle in the thumb (Figure 3A). Alternatively, the quadriceps
muscle group is responsible for powering movement of the entire leg, so fast activation of large
amounts of muscle tissue would be more valuable. The vastus lateralis (VL), one of the muscles
in the quadriceps (Figure 3B), is composed of 67% fast-twitch, Type II fibers12,13, allowing fast
Small Motor Unit Larger Motor Unit

4
activation of many muscle fibers to coordinate functions such as walking and running.
Respectively, the APB muscle is composed of 63% slow-twitch, Type I muscle fibers12,
permitting precise movements needed for turning dials and grabbing objects.
Figure 3: Abductor Pollicis Brevis and Vastus Lateralis Muscles
Illustrations of the (a) Abductor Pollicis Brevis14 and (b) Vastus Lateralis Muscles 15.
Monitoring muscle response
Electromyography
With the release of an action potential from a single motor neuron, many muscle fibers
can be activated synchronously. The action potential current from a motor neuron generates an
electrical signal that can be recorded with an electrode. This process is called
‘electromyography’ (EMG). EMG recording can be done with a surface electrode on top of the
skin, which records electrical activity from fibers directly underneath the electrode surface, or
can be done with intra-muscular needles, for more precise recording of a single muscle fiber.
Due to its non-invasive nature, surface electrodes are more commonly used in clinical
settings. The timing and amplitude of the electrical activity patterns recorded with surface EMG
a b
5
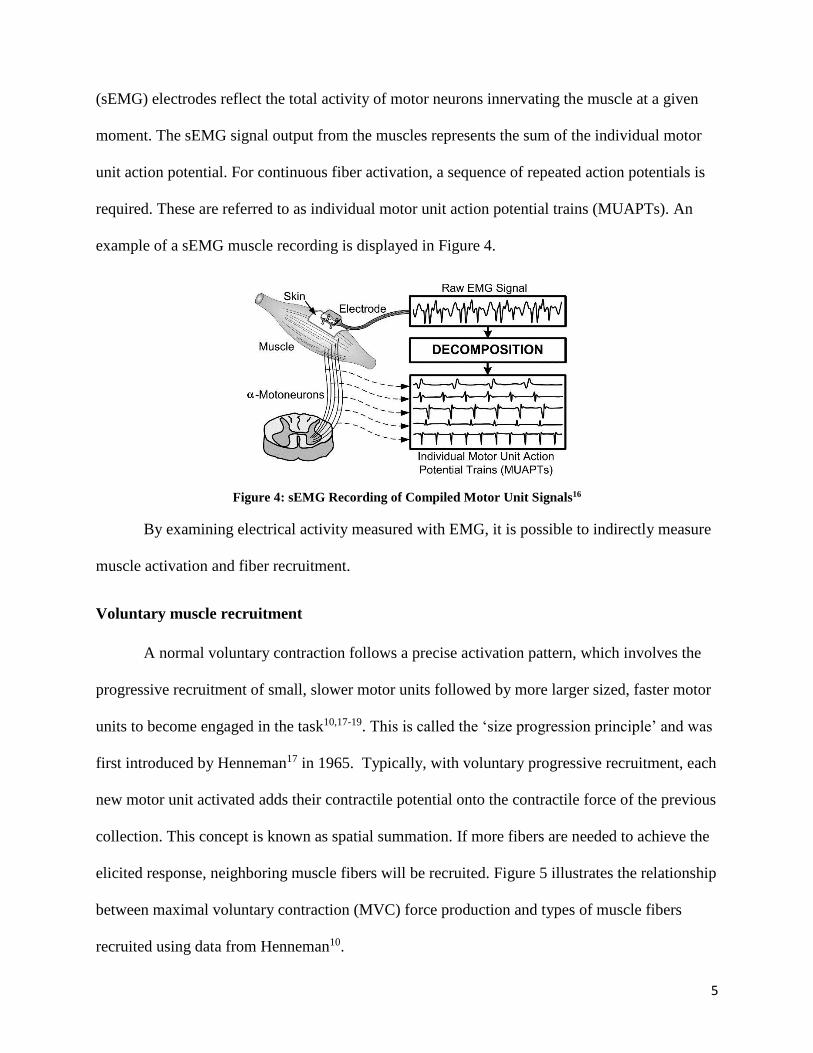
(sEMG) electrodes reflect the total activity of motor neurons innervating the muscle at a given
moment. The sEMG signal output from the muscles represents the sum of the individual motor
unit action potential. For continuous fiber activation, a sequence of repeated action potentials is
required. These are referred to as individual motor unit action potential trains (MUAPTs). An
example of a sEMG muscle recording is displayed in Figure 4.
Figure 4: sEMG Recording of Compiled Motor Unit Signals16
By examining electrical activity measured with EMG, it is possible to indirectly measure
muscle activation and fiber recruitment.
Voluntary muscle recruitment
A normal voluntary contraction follows a precise activation pattern, which involves the
progressive recruitment of small, slower motor units followed by more larger sized, faster motor
units to become engaged in the task10,17-19. This is called the ‘size progression principle’ and was
first introduced by Henneman17 in 1965. Typically, with voluntary progressive recruitment, each
new motor unit activated adds their contractile potential onto the contractile force of the previous
collection. This concept is known as spatial summation. If more fibers are needed to achieve the
elicited response, neighboring muscle fibers will be recruited. Figure 5 illustrates the relationship
between maximal voluntary contraction (MVC) force production and types of muscle fibers
recruited using data from Henneman10.

6
Figure 5: Representation of Progressive Recruitment During Voluntary Activation
Representation of progressive recruitment of motor units during voluntary activation of skeletal muscle.
Displays slow (type I) and fast (type IIa and IIb) motor units. Data taken from Hennenman10 and graphically
represented by Gregory and Bickel20.
MVC values are commonly used to standardize measurements among participants. By
using MVC as a standard, it is possible to measure the degree of participation of the muscle
fibers engaged in the contraction based on an EMG response21, quantifying muscle recruitment.
In fact, in most studies identifying the prevalence of fatigue with and without stimulation,
participants are either electrically stimulated to get the maximal contraction value using a
supramaximal stimulation twitch technique22-24 or asked to voluntarily produce a force equal to a
specific percentage of their maximal voluntary contraction (MVC). A dynamometer, or other
force measurement mechanism, can be used as an indication tool to determine when a participant
has reached a desired force level. By using a percentage of MVC instead of a standard force
measurement, total muscle strength variability between participants and muscles are minimized,
and recruitment can be compared. For example, Figure 6 shows results from participants
engaged in voluntary contractions21, comparing EMG electrical activity output (muscle activity)
and percentage of muscular recruitment (%MVC). Because muscle electrical activity is related to
activated motor units, according to this relationship, increased muscle recruitment is correlated
with increased muscle action potential, and subsequently overall greater force output.

7
Figure 6: Relationship between Muscle Recruitment and Electrical Activity
Relationship between muscle recruitment (%MVC) and electrical activity (EMG amplitude in mV) from
muscle fibers in the tibialis anterior muscle (TA) in two age groups21
Muscle response with Electrical Stimulation
Neuromuscular electrical stimulation (ES) is a therapeutic technique that uses electrical
impulses delivered through the skin to elicit skeletal muscle contractions. Impulses are delivered
via electrodes, similar to an action potential from the nervous system, causing muscle fibers
exposed to the electrical field to contract. ES has been used clinically for rehabilitation to target
skeletal muscle dysfunctions. Specifically, ES has been used successfully after central nervous
system injuries, such as stroke or paralysis, to regain muscle function, improve motor control,
and decrease muscle atrophy caused from disuse5-8. Electrical stimulation treatments are
successful in enhancing cell multiplication in connective tissue and forming new collagen and
muscles in injured tissues1-3. However, the mechanism of recruitment for ES in activating
skeletal muscle is still disputed.
Parameters of ES and effects on muscle force production
ES parameters can have a significant effect on muscle force production and motor unit
recruitment. Stimulation parameters typically manipulated include the following: electrode type
and placement, waveform type, intensity, pulse frequency and duration. These are generally the
settings that can be manipulated with a clinical stimulation machine, and each can change muscle
force generation and performance.
8
To minimize variability with electrode placement, placement guidelines have been
released by Surface ElectroMyoGraphy for the Non-Invasive Assessment of Muscles (SENIAM).
Surface electrodes are able to depolarize many fibers at once, and result in contractions, while
needle electrodes can target one specific cell to elicit a twitch.
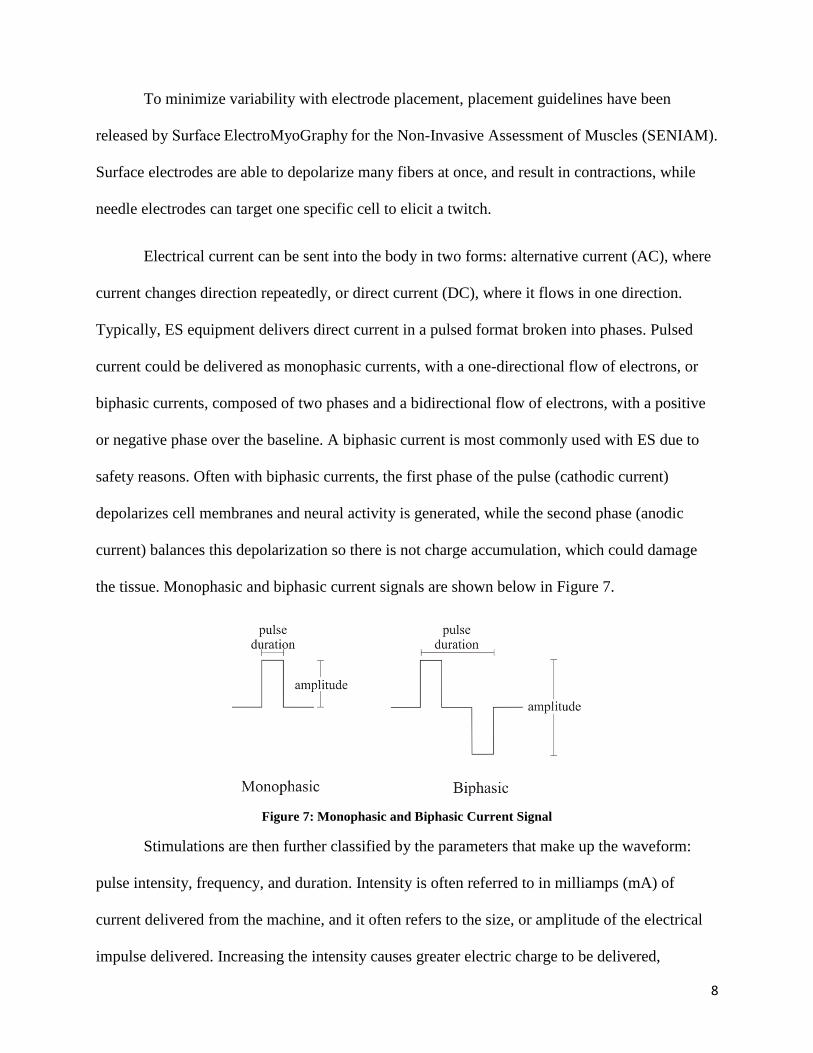
Electrical current can be sent into the body in two forms: alternative current (AC), where
current changes direction repeatedly, or direct current (DC), where it flows in one direction.
Typically, ES equipment delivers direct current in a pulsed format broken into phases. Pulsed
current could be delivered as monophasic currents, with a one-directional flow of electrons, or
biphasic currents, composed of two phases and a bidirectional flow of electrons, with a positive
or negative phase over the baseline. A biphasic current is most commonly used with ES due to
safety reasons. Often with biphasic currents, the first phase of the pulse (cathodic current)
depolarizes cell membranes and neural activity is generated, while the second phase (anodic
current) balances this depolarization so there is not charge accumulation, which could damage
the tissue. Monophasic and biphasic current signals are shown below in Figure 7.
Figure 7: Monophasic and Biphasic Current Signal
Stimulations are then further classified by the parameters that make up the waveform:
pulse intensity, frequency, and duration. Intensity is often referred to in milliamps (mA) of
current delivered from the machine, and it often refers to the size, or amplitude of the electrical
impulse delivered. Increasing the intensity causes greater electric charge to be delivered,
9
increasing the number of activated axons and motor units25. By increasing the intensity, force
output increases linearly in both healthy and paralyzed muscle26,27. Pulse frequency refers to the
rate at which stimulation is delivered into the body, expressed in terms of pulses per second (pps
or Hz).
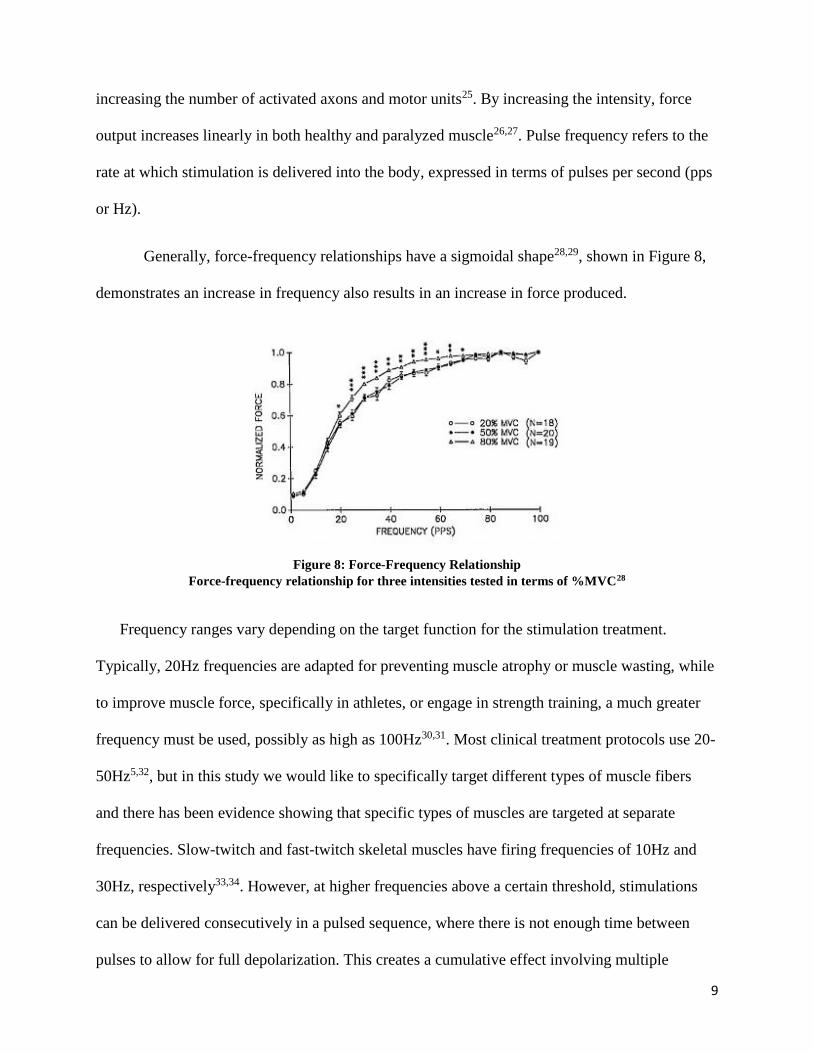
Generally, force-frequency relationships have a sigmoidal shape28,29, shown in Figure 8,
demonstrates an increase in frequency also results in an increase in force produced.
Figure 8: Force-Frequency Relationship
Force-frequency relationship for three intensities tested in terms of %MVC28
Frequency ranges vary depending on the target function for the stimulation treatment.
Typically, 20Hz frequencies are adapted for preventing muscle atrophy or muscle wasting, while
to improve muscle force, specifically in athletes, or engage in strength training, a much greater
frequency must be used, possibly as high as 100Hz30,31. Most clinical treatment protocols use 20-
50Hz5,32, but in this study we would like to specifically target different types of muscle fibers
and there has been evidence showing that specific types of muscles are targeted at separate
frequencies. Slow-twitch and fast-twitch skeletal muscles have firing frequencies of 10Hz and
30Hz, respectively33,34. However, at higher frequencies above a certain threshold, stimulations
can be delivered consecutively in a pulsed sequence, where there is not enough time between
pulses to allow for full depolarization. This creates a cumulative effect involving multiple

10
stimuli, known as temporal summation, or tetanic contractions. Tetanic contractions are
generally induced by 50 Hz stimulation20. Higher frequencies produce stronger muscle
contractions, as seen in Figure 8, and are helpful to increase muscular strength, but also increase
the likelihood for muscle fatigue to occur. To target separate types of muscles and compare the
differences in muscle recruitment between slow-twitch (activated at 10Hz), fast-twitch (activated
at 30Hz), and then finally the tetanic contractions (typically generated at 50Hz), an intervention
that compares the three frequencies is needed.
Figure 9 shows representations of force outputs from a model of the feline
caudofemoralis, a predominately fast-twitch muscle, while the muscle nerve is stimulated
electronically at several frequencies35. Separate and discrete force twitches are seen at the lowest
frequency tested, 15 Hz. When exposed to 37.5 Hz, the muscle releases successive twitch
contractions causing summation. Contractions increase at first, but a stable level is achieved.
Finally, higher forces and more summation is seen when the muscle is stimulated at 50 Hz.
Figure 9: Force Output at Different Stimuli Frequencies
Force output from successive isometric stimuli delivered to the motor nerve at (a) 15 Hz, (b) 37.5 Hz and (c)
50 Hz 35
11
Finally, pulse duration can be manipulated to result in additional motor unit recruitment
as well. Pulse duration is the length of time of the pulse, measured in milliseconds (ms) or
microseconds (µs). A hyperbolic relationship between pulse duration and intensity has been
established. Using this relationship, by extending the duration of the pulse, it could be possible to
get the same force production with less intensity required. In fact, increasing the duration has
shown increased muscle force outputs without increasing fatigue36,37.
By manipulating these stimulation parameters, it is possible to use ES to invoke
stimulation and alter motor unit recruitment to achieve a task.
Recruitment with Electrical Stimulation
With the addition of electrical current to elicit a contraction, a change occurs in the
distribution of motor unit recruitment. The exact mechanism of action for skeletal muscle
contraction activated with ES is currently debated and can be summarized with two different
theories: reverse selection recruitment, in which faster, more fatigable motor units are recruited
first followed successively by slower units, and non-selective recruitment theory, which does not
involve a size preference for recruitment.
Reverse selection recruitment theory
According to the reverse selection theory, larger fibers are recruited first, reversing the
size-progression principle. Several studies have shown that the axons from larger motor units,
which innervate faster, more fatigable fibers, are more easily depolarized38,39. Therefore, there is
an advantage to activate these types of fibers first, followed by less easily depolarized, smaller,
slower motor units, essentially reversing the voluntary progressive recruitment pattern. In fact,
one study demonstrated that ES-evoked contractions showed a reversal of the size principal in
30% of tibialis anterior (TA) motor units40. Based on depolarization capacities, ES activates
12
larger, more fatigable units, progressively followed by smaller ones, which explains why often
ES-stimulated muscles fatigue more quickly.
Non-selective recruitment theory
Contenders of the reversal theory believe that, in fact, there is no size selectivity involved
in the recruitment of muscle fibers during ES. Instead, selection occurs based on random
recruitment in the area near the stimulating electrode. The non-selective recruitment theory
claims that the instances where reverse size progression was found is most likely due to more
random occurrences rather than a designated pattern20,41,42. Twitch and force-frequency
relationships were explored with the quadriceps muscle group at different ES intensities, and
when forces were tested at 20,50, and 80% MVC, twitch times at 20% were not slower than
80%, as would have been predicted with a reversed recruitment order, and in fact there was no
differences amongst the three levels28. The force-frequency relationship between 20 and 50%
was also no different in the same study, favoring random recruitment of fibers in the area to
perform the desired force response.
Muscle response studies with ES have commonly examined fatigue, as fatigue in a
stimulated muscle occurs more quickly than a voluntarily-contracted muscle. In a normal
voluntary contraction, fatigue-resistant, slow muscle fibers should be recruited first, followed by
faster, more fatigable fibers. However, when fibers were exposed to different stimulation
intensities (25 and 50% MVC), there was no difference in fatigue, lending more support to the
non-selective recruitment theory for recruitment43.
The mechanism for motor unit recruitment will lead to differences in summation and
fatigue progression. A variety of approaches have been used to support different theories for

13
recruitment with stimulation, but a determination has yet to be reached. Therefore, more research
should be done to investigate recruitment patterns that occur voluntarily and elicited by ES.
Stimulation Artifact
One of the predominant challenges in studying muscle behavior when exposed to ES is the
removal of the stimulation artifact. The stimulation artifact is due to three superimposed
components44. First, current from the ES traveling through the muscle tissue crosses the
recording electrodes, causing a voltage gradient. Next, a second current occurs due to the stray
capacitance between the stimulating electrodes and ground, creating another voltage gradient.
Finally, there is some electromagnetic coupling between the stimulating and recording leads,
which further contributes to the stimulus artifact.
When exposed to muscle, the EMG output is generally spike-shaped followed by an
exponential decay, similar to the one modeled by O’Keefe45 in Figure 10. Following the
stimulation, the electrically evoked myoelectric signal (m-wave) can be seen, representative of
the muscle response46. Conduction latency is affected by the distance between the stimulation
and recording sites. If the recording site is sufficiently far away from the stimulus location and
the rate of stimulation is low, the artifact and muscle response will not overlap47.

14
Figure 10: M-Wave with Stimulus Artifact
Contaminated data (stimulus artifact + m-wave)45
To understand the muscle capabilities, it is necessary to filter out the electrical
stimulation pulses from sEMG muscle activity, as the frequency spectras often overlap,
distorting the muscular signal48. If electrical stimulation artifacts remain in the signal, subsequent
analysis of the underlying muscular response is difficult. However, accurately blocking only the
stimulation and not the muscle response remains a challenge49 and has been attempted with
varying techniques.

15
Stimulation Artifact Removal Options
Removal of the corrupting electrophysiological recordings has been attempted previously
with sEMG using either hardware or software blocking techniques. Table 1 contains an overview
of different methods and their limitations from a review by Heffer and Fallon49.
Table 1: Commonly Used Artifact Rejection Techniques Regarding Four Criteria49
Previous methods for eliminating the stimulus artifact include hardware blanking,
software blanking with a comb filter or thresholds, and using a sample-and-interpolation method,
but none have reported computationally effective results, specifically when using higher
frequencies.
One of the most popular hardware options with EMG involves a blanking technique
using a sample-and-hold design, where the stimulus pulse from the circuit triggers a response to
stop the electrophysiological recording during the duration of the pulse46,50,51. However, if the
stimulation waveform changes or if the interval is set for too long or too short, m-wave response
may either be unnecessarily blanked out along with the artifact or some of the artifact may
survive the editing. Alternatively, manipulating amplifier gains has been used as well, where
stimuli gains of x 1000 are used, but the same inability to adapt to artifact changes applies52,53.
Hardware filtering with a Chebyshev low pass filter at 550Hz was able to successfully remove
high frequency elements of the stimulus, but not low frequencies38.
Other artifact rejection techniques include using software-based blanking using
mathematically derived templates54-56, sample-and-interpolate techniques that average

16
neighboring pulses49, or threshold-based blanking methods45. These methods all assume that the
stimulation parameters are set and the distance between the stimulation and recorded electrodes
are far enough apart so the m-wave and the artifact are not overlapping in time. Therefore, these
techniques, although more flexible and adaptable to varying waveforms, cannot be used under all
stimulation conditions. Overall, it is essential to remove as much of the artifact as possible,
without eliminating much of the muscle response, in order to accurately examine the muscle
response when exposed to stimulation. None of the filtering techniques commonly used are able
to adjust to non-stationary and non-linear data to isolate the muscle response. Isolation of muscle
activity from the artifact is crucial to determine the mechanism of muscle fiber recruitment with
stimulation and presents the major challenge for researchers in the field.
In order to successfully isolate the muscle response from the ES signal, optimal muscle
recruitment must be achieved. Therefore, the purpose of this study was to investigate muscle
recruitment potential using two different muscles (APB and VL) and various frequencies and
intensities of stimulation and compare the results with voluntary activations.

17
II. OBJECTIVES
The following are objectives of this study:
1 - Compare voluntary activation patterns in terms of force production and muscle
recruitment for muscles of different fiber types and sizes.
2 - Effectively eliminate the stimulus artifact from a surface electromyography (sEMG)
signal using a technique called Empirical Mode Decomposition (EMD). Evaluate the
effectiveness of the removal procedure in eliminating the artifact for different
frequencies.
3 - Compare electrically-elicited muscle responses at different frequencies in terms of
maximal muscle recruitment for muscles of different fiber types and sizes.
4 - Compare voluntary and electrically-elicited contractions in terms of force production
and muscle recruitment.
II. LITERATURE REVIEW
Voluntary and ES-activated motor units
Differences between voluntary and ES-activated muscle present additional challenges for
interventions that combine both. Superimposing stimulation on voluntarily activated muscle has
been explored for neuroprosthetic and therapeutic purposes7,8,57,58. This is known as combination,
or ‘hybrid’ activation. Hybrid activation is more tolerable for human subjects59, is capable of
greater force output60, and causes less fatigue22,60,61 than ES-alone. However, voluntary and ES-
induced muscle behavior can be unpredictable due to possible differences in activation

18
mechanisms. To the best of our knowledge, only a few papers have looked at muscle recruitment
with a combination of voluntary and electrically-elicited contraction.
Generally, to get to the specific contraction level, standardized by individual participant,
the intensity of the contraction is steadily increased until reaching a predetermined %MVC level.
Ramping intensity until reaching a desired MVC21 or to maximum tolerable intensity62 has been
used successfully in the past. Fling et al. looked at outcome measures in terms of 20% and 50%
MVC such as recruitment threshold, EMG amplitude output, and intensity21. Binder-Macleod et
al. electrically stimulated muscles until reaching thresholds of 20%, 50%, and 80% MVC with
the same outcomes28, although EMG data was not recorded and comparing muscle recruitment
was based purely on force responses in terms of MVC. By standardizing the contraction for each
individual in terms of their MVC, comparing differences in outcome measures is more
generalizable.
Binder-Macleod et al. reported a force-frequency relationship sigmoidal in shape28,29,
shown in Figure 8, indicating an increase in frequency also results in an increase in force
produced. Because 20%, 50%, and 80% MVC electrically-elicited contractions all displayed the
same S-shape and no difference in twitch times, this data lends support to the non-selective
theory of recruitment. According to the reversal recruitment principle, it would be likely that
20% MVC would produce faster twitch times and a difference in the force-frequency
relationship when compared with 80% MVC. However, the data displayed characteristics that
would be more likely prone from non-selective recruitment of muscle fibers more proximal to
the area stimulated.
Another group, Frigo et al., collected EMG data with voluntary knee extension
contractions of 100% and 40% MVC63. ES was then delivered to produce a force equal to 40%

19
MVC. At this point, voluntary contraction (40% MVC) was superimposed over the stimulation-
elicited contraction (40% MVC) for a total force output of 80% MVC, and then the stimulation
element was eliminated, dropping back to voluntarily-contracted 40% MVC and then to 0,
shown in Figure 11.
Figure 11: Force Pattern in Two Phases
Phase 1 included voluntary contraction at 100% and 40% MVC. Phase II included 2s stimulation causing
40% MVC force, then 4s of voluntary 40% MVC superimposed on the stimulated contraction, then 4s of only
voluntary 40% MVC63
Although the protocol examined voluntary and stimulated contraction conditions, Frigo’s
outcomes did not focus on muscle recruitment but instead on stimulation filtering efficiency by
comparing signal-to-noise ratios for electrode placement, frequencies, and different filtering
techniques. Comb filtering plus blanking stimulation pulses was found to be more effective in
eliminating the stimulation artifact but preserving the muscle response than comb filtering by
itself.
Stimulation Artifact Removal
One of the main reasons why voluntary contraction with stimulation is so relatively
unexplored is due to the difficulty in isolating muscle response data from stimulations that are
contained in the same spectra, regardless if the contraction is elicited voluntarily or electrically.
Generally, hardware and software filtering techniques are template-based with fixed features and

20
many limitations, specifically when using higher frequencies. These methods also assume that
the stimulation parameters are set and the distance between the stimulation and recorded
electrodes are far enough apart so the m-wave and the artifact are not overlapping in time.
Therefore, these techniques cannot be used under all stimulation conditions.
One recent development has addressed the limitation in adaptability of typical filters by
introducing an ‘adaptive matched filter’64. More robust than traditional filters, this approach
simulates contaminated EMG signal to determine ideal parameters to use with an adaptive filter
based on a genetic algorithm, which is then applied to the real contaminated EMG signal.
Although more flexible and adaptable, this process relies on the local features of the signal to
develop a template for filtering, increasing computational difficulty.
To address many inconsistencies in signal processing, a method was needed to analyze
non-stationary and non-linear data while preserving signal information in the time and frequency
domains. Empirical mode decomposition (EMD) is a signal processing method proposed by
Huang et al., and has been applied to removing stimulus artifacts previously65,66. Using this
technique, the EMG signal is decomposed into physically meaningful intrinsic modes using an
EMD algorithm. One of the most difficult complications of stimulus removal is the overlap of
stimulus and m-wave in the time domain, and overlap of the power-spectrum in the frequency
domain. EMD signal processing appears to be the better option for difficult stimulus removals, as
it is dynamic, computationally efficient, and not based on a template.
The use of EMD to remove the stimulation artifact has only been validated with one subject
at one stimulation frequency66. Further research must be done to determine if this technique can
be applied to additional frequencies and muscles. Therefore, this investigation tested the efficacy
of the EMD removal technique when used with multiple muscles and different frequencies.

21
III. SIGNIFICANCE
There is an increasing need for novel treatment options for difficult-to-treat areas such as
the rotator cuff. ES has shown positive results in research and clinical settings for these types of
areas. However, knowledge on the optimal parameters of ES to be used in rehabilitation with
muscles of different sizes and muscle types is lacking. Additionally, the recruitment pattern of
muscle fibers activated with stimulation is crucial to fully understand muscle response using this
modality, and this is currently unknown. This protocol aims to address both these areas by
comparing the abductor pollicis brevis (APB) and vastus lateralis (VL) muscle when engaged in
stimulation at various frequencies and intensities. Furthermore, it aims to evaluate the
effectiveness of a stimulation removal procedure, EMD.
Overall, no study has focused specifically on the percent muscle recruitment of two
different muscles and three different frequencies engaged in electrical stimulation with a non-
fatiguing protocol. Binder-Macleod et al. recorded muscular data while ramping up intensity to
MVC thresholds of 20, 50, and 80%28, although different muscle sizes were not tested and they
did not focus on percent muscle recruitment required to contract. Fling et al. examined 0-50%
MVC forces in terms of recruitment thresholds in small (first dorsal interosseous, FDI), and large
(tibialis anterior, TA) muscles21, but did not compare muscle responses elicited with electrical
stimulation as well.
The APB and VL muscle were selected for a few reasons. First, the biomechanical
properties of both have been well-studied and EMG data on both muscles are available. The APB
is a small hand muscle and has predominately more slow-twitch fibers, while the VL muscle is a
large leg muscle with more fast-twitch fibers12. Overall, these two muscles have opposite muscle
fiber ratios and differ in size, so they are ideal to compare muscle recruitment. Muscle
22
recruitment between small hand and large leg muscles has been compared previously21, but
focused on the first dorsal interosseous (FDI) and tibialis anterior (TA), which also have
different fiber ratios. In fact, muscle recruitment associated with abduction of the thumb and
extension of the knee have been monitored with EMG67, but no one has examined recruitment
for both muscle groups with and without electrical stimulation. If a relationship is discovered
between these muscles with varying fiber type concentrations, the results could be generalized to
other muscles with varying fiber distributions.
Additionally, isolating muscle response data from stimulations that are contained in the
same spectra is a continuous challenge for researchers in the ES field, and particularly
challenging to create a filtering system that is able to adjust to varying artifact waveforms where
a template method would not be applicable. Previous filtering methods have significant
limitations, specifically when analyzing high frequency data. Some advantages in using EMD as
a removal process are that it is (1) fast and data-adaptive and (2) it is not template-based and so
additional inputs are not required65. EMD is more comprehensive than time, FFT, or wavelet
filtering by itself, as decomposition preserves elements in each mode, instead of separating the
artifact and EMG frequencies and then filtering them. The use of EMD to remove the stimulation
artifact has only been validated with one subject at one stimulation frequency66. Further research
must be done to determine if this technique can be applied to additional frequencies and muscles.
Therefore, this investigation evaluates the efficacy of the EMD removal technique when used
with multiple muscles and different frequencies.
Once the artifact is removed, it is possible to examine activity output from the muscle
when engaged in contractions with ES. Muscle response to different levels of ES frequency has
been examined in terms of variation in muscle thickness68 and change in muscle performance
during fatigue30,69,70. However, muscle activity generated from different frequency levels of ES

23
in a non-fatiguing protocol has never been explored. This is most likely due to the challenge of
removing the stimulus artifact from an electromyography (EMG) signal with higher frequencies.
Typically, removal of the artifact has been easiest when the muscle is activated by stimulation at
lower frequencies, so lower rates have been most commonly used with surface EMG. Higher
rates are relatively unexplored, and so a range of 10, 35, and 50Hz will be used to examine
muscle response in this study. There is evidence that fiber firing rates differ according to muscle
type, and it could be possible to target specific types at individual frequencies. An intervention
that compares muscle activity when exposed to ES at three frequencies is needed.
Finally, there is not yet a determination on the accurate mechanism of motor unit
recruitment with stimulation. By using Henneman’s model for voluntary progressive
recruitment10 and examining the relationship between the force production (% MVC) and EMG
response (% muscle recruitment), we can compare correlations for voluntary and stimulated
contractions. The trend will help to reveal the method of recruitment that is occurring and add
support to the associated mechanism theory: selective, reverse, or non-selective.
Overall, information generated with this procedure, outlined with objectives 1 through 4,
will give valuable information regarding motor unit recruitment with stimulation with a
combination of voluntary and electrically-elicited contractions.
IV. METHODOLOGY
Participants
Ten healthy participants were recruited for this study, including both males and females
(mean age: 24.4 ± 2.5 years). A homogenous population of young, active participants was
selected to control for any differences between activity level and its effect on muscle
performance. All participants recruited had no history of musculoskeletal problems,
cardiovascular problems, or orthopedic diagnoses such as arthritis, ligament injuries, meniscus

24
tears, joint instability, etc. Participants with a known allergy to Ag-AgCl surface electrodes or
adhesive were excluded. The protocol was reviewed and approved by an IRB and written
consent was obtained from all participants prior to participation.
Design
This study is a repeated measures within-participants design. Muscle response data was
recorded during voluntary and electrically-elicited contractions at three different frequencies (10,
35, 50 Hz), measuring electrical activity from both small (APB) and large (VL) muscles.
Instruments
Electrical Stimulation device
The electrical stimulation was applied using Respond Select® neuromuscular electrical
stimulation system (Empi, Inc., St. Paul, Minnesota). The Respond Select system is typically
used in clinical settings and can deliver between 0 and 100 mA of stimulation at rates between 2
and 150 Hz. Pulse width is typically set to 300us. Bipolar surface electrodes, which are the most
non-invasive option for delivering stimulation to the body, were connected to the stimulator and
placed directly over the muscles to be activated.
Electromyography (EMG)
EMG data was collected continuously with a physiological modeling system (Nexus-
10, MindMedia B.V., Netherlands). Surface electrodes were used to collect muscle response data
with the EMG. Ag-AgCl surface electrodes were placed on the muscle belly parallel to the
muscle fibers directly over the ‘motor’ points of the muscles to be activated. These locations
were determined using Surface ElectroMyoGraphy for the Non-Invasive Assessment of Muscles
(SENIAM) electrode placement guidelines.

25
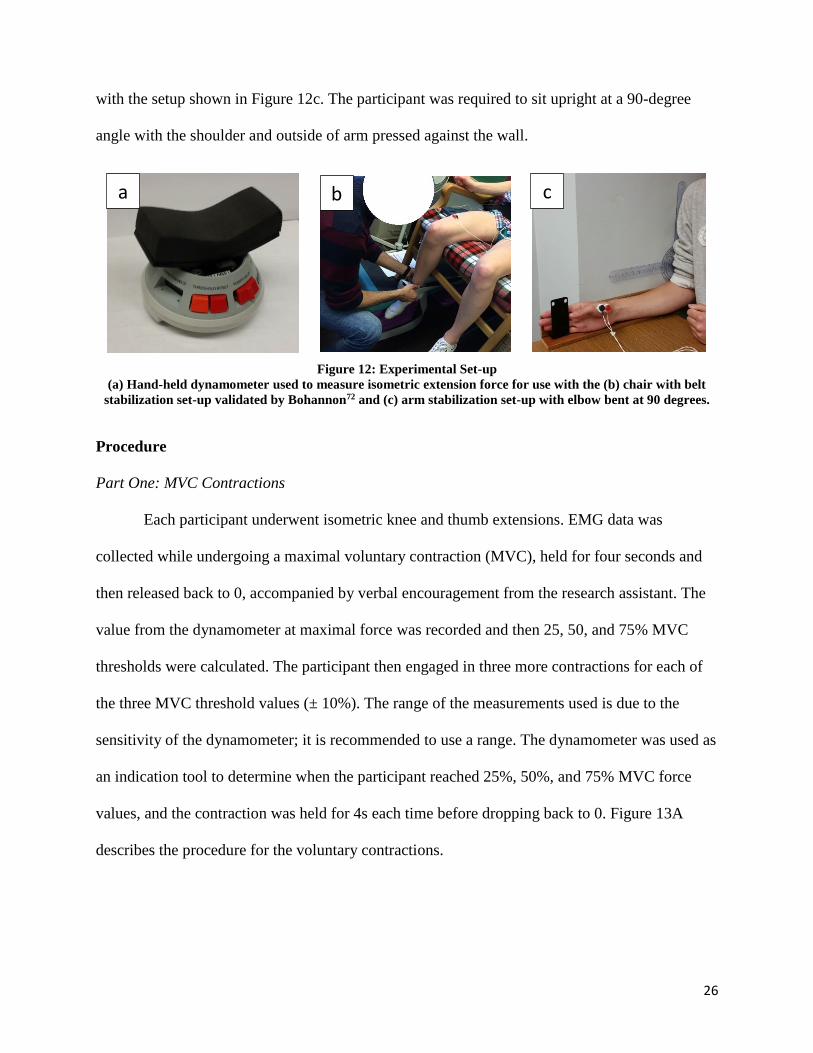
Dynamometer
Isometric force data was collected with a hand-held dynamometer (MicroFET2 HHD,
Hoggan Health Industries, USA), Figure 12a. The device and dynamometer procedure has been
validated previously71. MVC was collected with the dynamometer at maximal force and then
used to calculate 25%, 50%, and 75% of MVC force.
Experimental Set-Up
Pre-gelled silver-silver chloride (Ag-AgCl) self-adhesive surface electrodes were placed
on the skin over each muscle belly after skin preparation. Skin preparation procedure consisted
of cleaning the skin area underneath the electrodes by using alcohol rub and shaving excess hair
if needed. Stimulation electrodes were placed on the muscle’s motor points according
to SENIAM electrode placement guidelines over the muscle motor point. A reference electrode
was placed on a bony site at the distal end of the ulna. EMG electrodes were placed directly
between the active and indifferent ES electrodes to record muscle activity between the two. The
direction of the EMG electrode placement was placed longitudinally, parallel to the muscle
fibers, over the muscle belly. To avoid possible artifacts, all the electrodes and wires were fixed
on the skin by using adhesive tapes.
To test the selected quadriceps muscle, VL, all participants were seated on an upright
chair so that their feet were not touching the floor and the back of their knee joint at the edge of
the chair seat72, with their hand resting on a flat surface, as shown in Figure 12b. A belt was used
to stabilize the dynamometer during recording, increasing consistency across repeated
measurements72. The chair has straps around the waist and ankle to isolate only the quadriceps
muscle group. Similarly for the thumb muscle, all other hand and forearm muscles were isolated
26
with the setup shown in Figure 12c. The participant was required to sit upright at a 90-degree
angle with the shoulder and outside of arm pressed against the wall.
Figure 12: Experimental Set-up
(a) Hand-held dynamometer used to measure isometric extension force for use with the (b) chair with belt
stabilization set-up validated by Bohannon72 and (c) arm stabilization set-up with elbow bent at 90 degrees.
Procedure
Part One: MVC Contractions
Each participant underwent isometric knee and thumb extensions. EMG data was
collected while undergoing a maximal voluntary contraction (MVC), held for four seconds and
then released back to 0, accompanied by verbal encouragement from the research assistant. The
value from the dynamometer at maximal force was recorded and then 25, 50, and 75% MVC
thresholds were calculated. The participant then engaged in three more contractions for each of
the three MVC threshold values (± 10%). The range of the measurements used is due to the
sensitivity of the dynamometer; it is recommended to use a range. The dynamometer was used as
an indication tool to determine when the participant reached 25%, 50%, and 75% MVC force
values, and the contraction was held for 4s each time before dropping back to 0. Figure 13A
describes the procedure for the voluntary contractions.
a b c

27
Figure 13: Muscle Activation in Terms of Force Levels
(a) Voluntary and (b) ES-induced muscle activation in terms of force levels (%MVC). Each contraction is
held for 4s. Force is determined as indicated from the dynamometer.
Part Two: ES-Elicited Contractions
Randomizations between muscles (APB and VL) and frequencies (10, 35, and 50 Hz)
were done between subjects to prevent learning and cross-over effects. Electrical stimulation was
applied using Respond Select® neuromuscular electrical stimulation system (Empi, Inc., St.
Paul, Minnesota). Stimulation was delivered via a biphasic wave with a pulse width of 300us in a
range of intensities (increasing from 0 mA-80 mA (safe range) until 25% MVC is reached) and
three frequencies (10 Hz, 35 Hz and 50 Hz). Timing information and signal characteristics were
collected from the EMG recording device indicating the time when the stimulation pulse
sequence began and ended. Participants first became familiar with the device and the feeling of
the electrical stimulation. The researcher slowly increased the intensity up to 30mA for
approximately 3 seconds for assimilation. sEMG data was collected during each of the following
conditions: 25% (ES-elicited contraction only), 50% (25% ES-elicited contraction + 25%
voluntary contraction), and finally 75% (25% ES-elicited contraction + 50% voluntary
contraction), displayed in Figure 13B. Electrical stimulation was delivered starting at 0 and
increasing intensity until reaching 25% MVC (+/- 10%). Once reaching the desired force
threshold of 25% MVC, the stimulation was held at a constant intensity for 4s. After one minute
rest, ES was again ramped in intensity until reaching 25% MVC. Participants were then asked to
% MVC
100%
25%MVC
50%MVC
75%MVC
100%MVC
4s 4s 4s 4s
% MVC
100%
25% MVC(25%ES only)
50% MVC (25%ES + 25%VC)
4s 4s 4s
Ramp Ramp
75% MVC (25%ES + 50%VC)
25%ES 25%ES
Ramp
a b

28
voluntarily contract their related muscles (VL or APB) to reach 50% and then 75% of their
MVC, as shown in Figure 13B. Data was collected continuously and 50% and 75% were labeled
on EMG recordings.
Figure 14: Force Measurement During Isometric Contractions
Force measurement during isometric contractions of the (a) APB and (b) VL.
Data Analysis
Signal Processing
The recorded EMG signal was first filtered using a Butterworth filter (20-500Hz cutoff,
5th-order) using the native software of the device, BioTrace + (MindMedia B.V., Netherlands).
Data was then transferred to Matlab® for all other processing.
Voluntary Signal Processing
The last two seconds of data was removed and used for further analysis. Voluntary
signals were full-wave rectified. Surface EMG amplitudes and integrated EMG activity (iEMG)
were computed for comparisons between the two muscles and their recruitment levels based on
a b

29
preset force generation (% of MVC). Additionally, the Fast Fourier Transform (FFT) of each
signal was used to obtain the power density spectrum by using the Discrete Fourier Transform
Algorithm in Equation 1, where k=0,…,N-1. The conversion of data to the frequency domain
allows us to see the frequencies at which fibers become activated.
Equation 1: Discrete Fourier Transform
𝑋𝑘 = ∑ 𝑥𝑛𝑒−𝑖2𝜋𝑘𝑛𝑁
𝑁−1
𝑛=0
The median frequency (MDF) was then calculated using Equation 2 based on the power
spectrum for each muscle at each %MVC activation level.
Equation 2: Median Frequency
MDF = ∑ 𝑃𝑘𝑀𝑘=1
ES Signal Processing
For stimulated contractions, the entire four seconds of constant contraction was put
through a process called empirical mode decomposition (EMD), outlined in Figure 15 and 16.
EMD involves the decomposition of a signal into intrinsic mode functions (IMFs) and a
residual using sifting amplitudes65. Sifting has two functions: eliminate riding waves and smooth
asymmetrical amplitudes. To perform the sifting process, first, the cubic spline envelope of local
maxima and minima is determined, and the mean of the envelope (m1) subtracted from the
original signal to give h1, the first component. This process is shown in Figure 15.
Equation 3: Intrinsic Mode Function Step 1
𝑥(𝑡) − 𝑚1 = ℎ1

30
Figure 15: Illustration of the Sifting Process Using EMD
(a) the original signal (in terms of wind speed), (b) data in solid grey line, upper and lower envelopes in dot-
dash lines and mean in thick black line, and (c) the difference between the data and m1. This is now h165.
The new mean (m11) is subtracted from h1 to get h11, the next component. This is repeated k
times until h1k is an IMF. Each IMF represents an oscillation mode embedded into the data. The
IMF conditions have been met when the following two conditions are satisfied:
(1) The number of local maxima/minima and number of zero crossings must be either
equal or differ at most by 1.
(2) The mean value of the envelopes, one defined by the local maxima, the other by the
local minima, is 0.
a
b
c

31
Equation 4: Intrinsic Mode Function Step 2
ℎ1(𝑘−1) − 𝑚1𝑘 = ℎ1𝑘
At this point, h1k=c1, the first IMF component, which is subtracted from the original signal x(t),
and the process continues until finally a residual rn remains.
Equation 5: Intrinsic Mode Function Step 3
𝑥(𝑡) = ∑ 𝑐𝑖 + 𝑟𝑛𝑛𝑖=1
For this dataset, the first 4 IMFs were eliminated, as the stimulus artifact dominated the signal in
those levels. The signal was then reconstructed by adding the remaining IMFs (Figure 16).

32
Figure 16: Steps of Empirical Mode Decomposition
Steps of Empirical Mode Decomposition with 10 Hz, 35 Hz, and 50 Hz stimulated muscle.
Rec
on
stru
ctio
n o
f EM
G
sign
al u
sin
g EM
D a
lgo
rith
m
Dec
om
po
siti
on
into
IMFs
O
rigi
nal
sig
nal
: x(t
)

33
Post-EMD reconstruction, the data was cut to the center two seconds of the signal to
minimize any effect from neighboring features. The signal was rectified prior to analysis.
Signal Parameters
Post-EMD, filter performance tests were conducted including a comparison of signal-to-
noise (SNR) values and power reduction (PR) ratios, similar to the validation tests done by Qiu
et al.64.
SNR is the ratio of the mean energy of the control, or ‘clean’ EMG signal to the mean
energy of the noise73. In this case, electrical activity (measured in uV) from the voluntary signal
at 25% MVC, which has no stimulation artifacts, was used to compare against ES-only 25%
MVC before and after EMD-processing. In equation 6, x(t) refers to the input signal measured at
electrically-induced 25% MVC, and v(t) to the voluntary signal collected at the same level. An
increase in SNR indicates an increase in artifact removal. Percent change was calculated between
SNR generated from pre-EMD to post-EMD.
Equation 6: Signal-to-Noise Ratio
𝑆𝑁𝑅 = 10 𝑙𝑜𝑔10∑ 𝑣(𝑡)2
∑(𝑥(𝑡)−𝑣(𝑡))2
Additionally, a power reduction calculation (PR) was used as a more accurate
representation of SNR, as the voluntary signal is not a perfect, ‘clean’ signal to compare against.
The PR is an indirect measurement but indicates the extent of the removal process. To address
the limitations of the SNR, the ratio between power of the original signal z(t), and then power of
the filtered post-EMD output signal y(t) was computed, using equation 7. In this manner, pre-
and post-filtering can be compared directly.

34
Equation 7: Power Reduction Equation
𝑃𝑅 = 10 𝑙𝑜𝑔10∑ 𝑧(𝑡)2
∑𝑦(𝑡)2
Finally, a measurement of the efficiency of the removal technique proposed by Frigo et
al. 63, was calculated using data from the ‘hybrid’ activation output, at 50% MVC, using
equations 8-10 (pre- and post EMD processing)63. The efficiency index is a combination of
ratios: operative signal to noise ratio, or OSNR, (voluntary when stimulation is present) and
virtual signal to noise ratio, VSNR (voluntary when stimulation is not present). In these
equations, YSTIM refers to the mean electrical activity at 25% MVC when induced by ES-only,
YVOL is the mean activity during voluntary contraction at 25% MVC, and YSTIM+VOL is the signal
activity output at 50% MVC (which is composed of 25% MVC ES-only elicited force, and 25%
voluntary force superimposed on top).
Equation 8: Operative Signal-to-Noise Ratio
𝑂𝑆𝑁𝑅 = (𝑌𝑆𝑇𝐼𝑀+𝑉𝑂𝐿 − 𝑌𝑆𝑇𝐼𝑀)/𝑌𝑆𝑇𝐼𝑀
Equation 9: Voluntary Signal-to-Noise Ratio
𝑉𝑆𝑁𝑅 = 𝑌𝑉𝑂𝐿/𝑌𝑆𝑇𝐼𝑀
Equation 10: Efficiency Index Equation
𝐸𝐼 = 𝑂𝑆𝑁𝑅/𝑉𝑆𝑁𝑅 = (𝑌𝑆𝑇𝐼𝑀+𝑉𝑂𝐿 − 𝑌𝑆𝑇𝐼𝑀)/𝑌𝑉𝑂𝐿
EI values represent the efficiency in extracting the voluntary signal in the presence of electrical
stimulation. Values should decrease post-EMD processing and become closer to 1, as the
voluntary component becomes more pronounced and detectable. Ideally, the muscle activity
change from 25% to 50% (voluntary response once isolated from the stimulation), represented in
the numerator of the ratio, should be close to the voluntary change from 0 to 25%, displayed in

35
the denominator. Therefore, the comparison of both components should give a ratio closer to 1
after the artifact is eliminated.
Normality tests for the SNR, PR, and EI datasets revealed normally distributed data. A
repeated measures ANOVA was run to compare the differences pre and post-filtering, and
compare between muscles and stimulation frequencies.
Statistical Analysis
Voluntary Activation Pattern Comparison
Prior to statistical analysis, tests for normality for iEMG and MDF distributions were
completed. Both data sets revealed normally distributed values and model residuals. Raw force
data from the dynamometer were compared between muscles at maximal contraction using a
Student’s t-test. Linear regression analyses were performed to evaluate if the electrical signal
outputs (iEMG and MDF) can be explained by the proportional increases in MVC and the
recruitment levels. Muscle type was introduced as a potential moderator in the linear regressions
to determine if separating groups based on the interaction of muscle type and contraction level
showed a better fit with the signal output data. Finally, to evaluate specific differences between
recruitment levels and muscles, ANOVAs and Tukey post-hoc tests were conducted.
Evaluation of effectiveness of artifact removal
Tests for normality for sEMG artifact removal measurements were conducted. The data
was revealed to be normally distributed. An ANOVA test was run to detect differences in
frequency levels per muscle, as well as a comparison between muscles. Tukey post-hoc tests
were also conducted.

36
Comparison of muscle responses at different frequencies
First, an ANOVA was used to compare the effect of frequency levels (Hz) and muscle
type on intensity required to reach 25% MVC force output. An ANOVA was also used to
compare electrical activity data between muscles and contraction type (stimulated muscle at 10,
35, and 50Hz, and voluntarily contracted muscle) when muscles were engaged at 25% MVC.
Again, Tukey post-hocs were used to determine specific differences.
For hybrid activation, linear regression analyses were performed to evaluate if the
electrical signal outputs could be explained by the frequency of stimulation and contraction level
(%MVC). To determine specific differences, moderators were included in linear regression
analyses, including frequency and muscle type. ANOVA and Tukey post-hoc tests were
conducted for further comparison for all tests.
Finally, the voluntary component was isolated from 50% and 75% MVC data by
subtracting ES-only muscle response, using equation 11. Mean values from 50% and 75% MVC
are considered outputs from hybrid activation, YHybrid. Y25%ES represents the mean electrical
activity detected at 25% MVC (ES-only), and YIsolatedVR the isolated voluntary response.
Equation 11: Isolated Voluntary Response
𝑌𝐼𝑠𝑜𝑙𝑎𝑡𝑒𝑑𝑉𝑅 = 𝑌𝐻𝑦𝑏𝑟𝑖𝑑 − 𝑌25%𝐸𝑆
An ANOVA was run on isolated voluntary response from 50% and 75% MVC, followed
by Tukey post-hocs to determine if there were differences between stimulation frequencies and
muscle types.
For all tests, p-values were set at p<0.05 to determine significance and values were
reported in terms of mean ± SE. SAS V9.4 was used for all statistical analysis.

37
Calculation of effect sizes
Finally, for all outputs, effect sizes were calculated for each outcome by calculating the
standardized mean difference for each sample. The standardized mean difference, d, is the
difference between the mean of the APB muscle and the mean of the VL muscle for each
contraction level or stimulation frequency, divided by pooled standard deviation74. The
standardized mean change provides an indication of the strength of a relationship between
variables, rather than a significance level which reflects the probability of the observed change
due to chance. The effect size index, d, follows a normal distribution with a range from negative
infinity to positive infinity with zero as the null value. The magnitude of the standardized d value
can be interpreted as 0.25, 0.5, and 0.8 for small, medium, and large effects on the outcomes of
interest, according to Cohen’s classification75. Effect sizes were calculated using a custom
coding calculator created by Heudo-Medina et al.76.
V. RESULTS
Comparison of voluntary muscle responses for different muscle types
We calculated the iEMG for each participant under all four activation levels for both
muscles (25, 50, 75, and 100% MVC) and compared the means (Figure 17A). The corresponding
linear regression model explained 82% of the variance in data. Our analysis showed that
increased voluntary activation is a strong predictor for increased electrical activity emitted from
the muscles. Additionally, the results, displayed in Table 2, revealed a significant difference in
electrical activity for the different contraction levels, as well as between the two different
muscles. The electrical activity generated from APB (smaller size with more type I fibers) was

38
consistently larger than VL (larger size and more type II fibers) (p<0.001). Contraction level
moderated significantly the differences between muscles, specifically when increasing from 25
to 50% MVC.

39
Table 2: Linear Regression Results for Voluntary Signal Outputs (n=10)
iEMG (uV·s) Norm. EA (uV) MDF (Hz)
Predictor Mean (SE) β d (95%CI) R2 Mean (SE) β d (95%CI) R2 Mean (SE) β d (95%CI) R2
Contraction level 0.82 0.81 0.64
25 291.89 (66.88) § ,|| -234.79 8.36 (5.62,11.10) 28.75(2.62) ‡,§,|| -75.05¶ 0.65 (-0.25,1.55) 92.25 (4.57) -0.65 2.50 (1.33,3.67)
50 613.74 (147.22) || -170.16 12.07 (8.23,15.91) 55.23(3.94) †,§,|| -53.46¶ 1.42 (0.44,2.40) 90.62 (4.80) 0 1.82 (0.77,2.86)
75 836.76 (180.73) † -115.19 15.90 (10.90,20.91) 78.41(5.18) †,‡,|| -33.44¶ 1.66 (0.65,2.68) 85.62 (3.64) 1.45 1.02 (0.09,1.95)
100 984.60 (196.59) 15.55 (10.65,20.45) 100†,‡,§ 86.89 (4.52) 1.27 (0.30,2.26)
Muscle
APB 1187.57 (117.42) 1357.28¶ 72.26(4.92) 0.00¶ 100.45 (3.30) 19.71¶
VL 175.93 (18.00) 58.93(4.65) 77.24 (1.22)
Contraction level x Muscle
APB
25 512.61 (89.31) || -915.84¶ 32.68(4.58) ‡,§,|| 7.74 108.10 (5.03) 12.01
50 1091.67(201.361) || -401.42 65.05(6.02) †,§,|| 18.52¶ 104.20 (7.07) 7.45
75 1482.75(211.75) †,|| -65.31 91.29(7.50) †,‡ 24.73¶ 92.75 (6.19) -5.45
100 1663.25(243.20) †,‡ 100 †,‡ 96.75 (7.69)
VL
25 71.17(9.10) 24.81(2.13) ‡,§,|| 76.39 (2.63)
50 135.81(14.51) † 45.41(2.81) †,§,|| 77.04 (2.54)
75 190.77(18.31) † 65.52(4.48) †,‡,|| 78.49 (2.53)
100 305.96(41.00) † 100†,‡,§ 77.04 (2.38)
Note: iEMG – integrated EMG, Norm. EA – normalized electrical activity, MDF- median frequency. Symbols (significance at p<0.01): †-significant
difference from 25% MVC, ‡-significant difference from 50% MVC, §-significant difference from 75% MVC, ||-significant difference from 100% MVC,
¶-Linear regression model significance.

40
Assuming the maximum number of motor units are recruited at maximal force production
(100% MVC), electrical activity at maximal contraction for each participant was converted to
100% motor units recruited in order to compare the recruitment patterns of the two muscles on a
normalized scale (Figure 17B). Again, the linear regression model of the normalized electrical
activity (NEA) revealed a statistical difference between contraction levels and muscles, with a
significant moderator effect of the contraction levels on muscle type. The percentage of motor
units recruited was significantly larger in the APB than VL at 25, 50 and 75% MVC (p<0.05),
even when both muscle activity outputs were normalized to their largest value. There is a more
gradual increase in motor units recruited for VL than APB until 75% MVC, where a large
proportion of motor units are recruited in the VL in order to reach maximal contraction (100%
MVC).
Figure 17: iEMG and Normalized Electrical Activity
(a) iEMG and (b) normalized electrical activity (Norm. EA) output of muscle engaged in voluntary activation
for both APB and VL.
Expectedly, maximal force measured with the dynamometer during the contraction was
significantly larger for VL than APB (mean force output: APB = 34.91 ± 1.91 lbs, VL = 311.55
± 30.45 lbs, p<0.001).
0
500
1000
1500
2000
2500
25%MVC 50%MVC 75%MVC 100%MVC
iEM
G (
uV
-s)
iEMG of muscle engaged in voluntary
activation
APB VL
0
20
40
60
80
100
120
25%MVC 50%MVC 75%MVC 100%MVC
Mu
scle
Un
its
Rec
ruit
ed (
%)
Normalized electrical activity of muscle
engaged in MVC contractions
APB VL
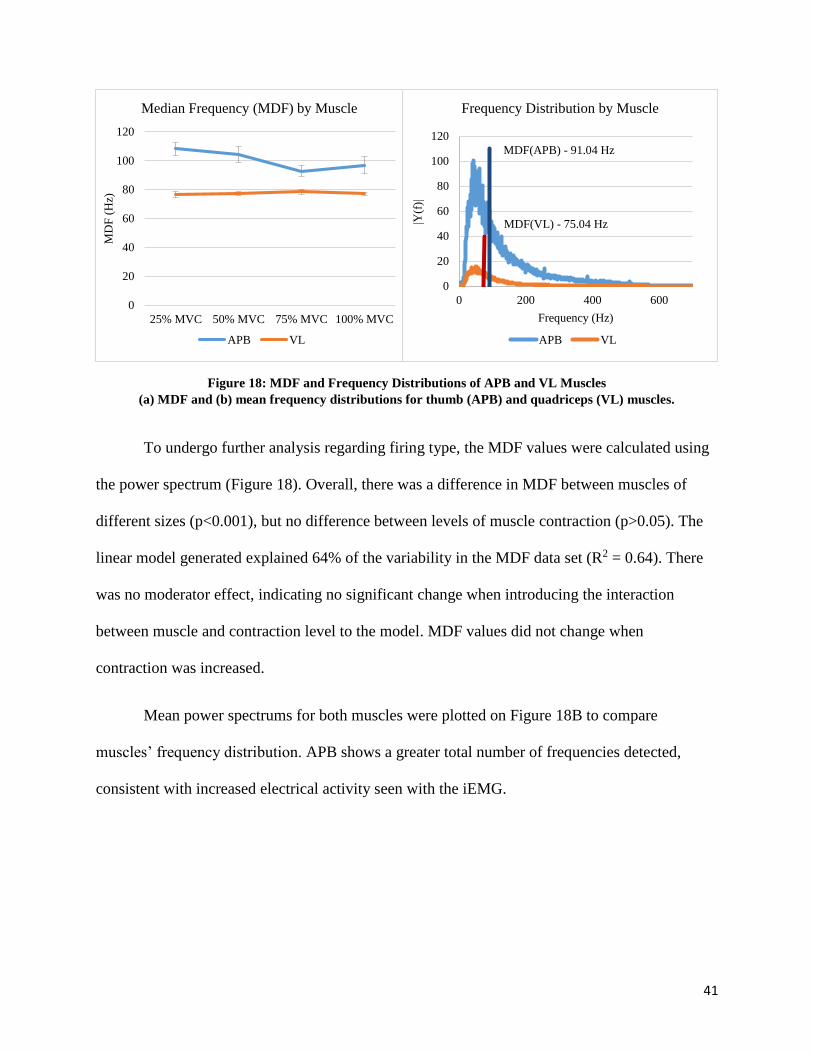
41
Figure 18: MDF and Frequency Distributions of APB and VL Muscles
(a) MDF and (b) mean frequency distributions for thumb (APB) and quadriceps (VL) muscles.
To undergo further analysis regarding firing type, the MDF values were calculated using
the power spectrum (Figure 18). Overall, there was a difference in MDF between muscles of
different sizes (p<0.001), but no difference between levels of muscle contraction (p>0.05). The
linear model generated explained 64% of the variability in the MDF data set (R2 = 0.64). There
was no moderator effect, indicating no significant change when introducing the interaction
between muscle and contraction level to the model. MDF values did not change when
contraction was increased.
Mean power spectrums for both muscles were plotted on Figure 18B to compare
muscles’ frequency distribution. APB shows a greater total number of frequencies detected,
consistent with increased electrical activity seen with the iEMG.
0
20
40
60
80
100
120
25% MVC 50% MVC 75% MVC 100% MVC
MD
F (
Hz)
Median Frequency (MDF) by Muscle
APB VL
0
20
40
60
80
100
120
0 200 400 600
|Y(f
)|
Frequency (Hz)
Frequency Distribution by Muscle
APB VL
MDF(VL) - 75.04 Hz
MDF(APB) - 91.04 Hz

42
Evaluation of effectiveness of stimulation artifact removal
Table 3: Pre and Post EMD Processing SNR, PR, and EI for 10Hz, 35 Hz, and 50Hz
APB* VL*
10Hz 35Hz 50Hz 10Hz 35Hz 50Hz
SNR (dB)
Pre-EMD -21.09±1.33 -24.59±1.79 -27.31±1.82 -38.63±1.33 -44.33±1.50 -43.09±2.18
Post-EMD 0.20±0.62 -0.76±1.40 -0.84±1.30 -6.57±2.22 -18.75±1.34 -13.57±2.14
PR
26.38±1.82 26.21±1.61 28.58±1.25 31.24±1.38 25.02±1.08 28.58±1.62
Efficiency Index
Pre-EMD 9.00±3.55 44.81±26.42 37.72±7.76 72.48±27.81 125.20±47.21 136.61±40.77
Post-EMD 0.30±0.08 0.46±0.18 0.48±0.23 1.57±0.26 4.94±1.10 5.17±1.26
Note: * Significant differences (p<0.05) were found between pre- and post processing for all
categories and all levels of stimulation.
SNR increased post-EMD for APB and VL. Original pre-filtered signals had a SNR value
of approximately -25 dB for APB and -40 dB from VL. Percent change was calculated using pre-
and post-EMD values. Post-filtering, the signals experienced an average 98% and 69% reduction
in ‘noise’, respectively. For our purposes, ‘noise’ was treated as the ‘stimulation artifact’.
Power reduction (PR), the ratio between pre-filtered and post-filtered stimulation data
(25% MVC data with ES) displayed higher values. The results in Table 3 indicate when
comparing pre- vs. post-EMD, there was a reduction in amplitude 26-31 times. This means that
by eliminating the first four IMF levels which were clearly dominated by the artifact, there was a
reduction in energy in the signal of approximately 28 times. For power reduction, there was no
difference between muscles or stimulation rates.
Finally, efficiency indices decreased with filtering closer to 1 with EMD for APB and
VL. Efficiency indices, which compare the isolated voluntary activation from 25% to 50%MVC

43
post-stimulation muscle data (numerator) to the normal voluntary activation from 0 to 25%MVC
(denominator), revealed higher levels for VL than for APB. Again, post-filtering, there was no
significance between stimulation frequencies.
Comparison of muscle responses at different frequencies
Required intensity to reach 25% MVC
Figure 19: Frequency-Intensity Response of APB and VL Muscles at 25% MVC
Frequency-Intensity response detected through sEMG activity in two muscles (APB and VL) at 25% MVC.
For VL, stimulation with 10Hz required higher intensities (p<0.05) to reach 25% MVC
than higher frequencies, although there was no difference between 35 and 50Hz (Figure 19).
Additionally, the small muscle of the hand (APB) required significantly less intensity at all
frequencies than the larger VL muscle (mean APB: 17.73±0.40mA, mean VL: 52.40±2.700mA,
d = 8.39 (5.65, 11.14), p<0.001) to reach the same contraction level (25% MVC).
0
10
20
30
40
50
60
70
10 35 50
Inte
nsi
ty (
mA
)
Frequency (Hz)
Frequency v. Intensity at 25%MVC
APB VL
*
*

44
ES-induced muscle response at 25% MVC
Figure 20: Electrical Activity (Post-Processing) Generated by Stimulating APB at 25% MVC
Figure 21: Electrical Activity (Post-Processing) Generated by Stimulating VL at 25% MVC
0
50
100
150
200
250
300
Ele
ctri
cal A
ctiv
ity
(u
V)
Electrical activity post-EMD (APB)
10Hz 35Hz 50Hz
0
50
100
150
200
250
300
Ele
ctri
cal A
ctiv
ity (
uV
)
Electrical activity post-EMD (VL)
10Hz 35Hz 50Hz
*
*

45
When both muscles were engaged in ES-induced contraction at 25%MVC, electrical
activity outputs from the muscles were compared in terms of three frequency levels (10, 35, and
50 Hz). For APB, although there was less electrical activity output from the muscle when
stimulated at 10Hz, this is not a significant difference. In fact, there was no significant difference
between the activity outputs from the muscle from any of the three frequency levels. However,
when VL was engaged in a 25%MVC contraction, there was a significant difference between
10Hz and the higher frequencies, 35 and 50Hz.
Comparison of muscle responses voluntarily and electrically-elicited
Hybrid activation muscle response at 50% and 75% MVC
Hybrid activation was modeled in Figure 22 (APB) and Figure 23 (VL), and outputs from
the linear regression analysis are contained in Table 4. Electrical activity was modeled in a linear
regression by muscle type, frequency, and contraction level (R2=0.23). There were significant
differences between all three factors (p<0.05). All possible interactions between the different
factors (muscle type, frequency, and contraction level) were not significant and were not
included in the model. Overall, significantly less electrical output was seen when adding
voluntary contraction to supplement the stimulation contractions for all stimulation frequencies
(p<0.05).
According to the results from repeated measures ANOVA and post-hoc Tukey tests, there
were significant differences in electrical activity at some stimulation levels. As seen in Figure 22,
the trend between increasing contraction levels and electrical activity output from the muscles
was positive for all stimulation frequencies (10, 35, and 50 Hz). However, significant differences
between increasing contraction levels were seen only with the lower frequency levels: 10 and 35

46
Hz (p<0.05). For VL, the trend between contraction level and muscle activity was positive for all
stimulation frequencies as well (Figure 23). However, electrical activity in terms of increasing
contraction levels was significant only when stimulation was delivered at 10 Hz (p<0.05).
Figure 22: Electrical Activity Generated During ES-Elicited APB Tests
Electrical activity generated at 25% MVC (ES only), 50% MVC (25% ES +25% Vol), and 75% MVC (25%
ES + 50% Vol) for APB post-EMD processing. *p<0.05, all contraction levels were significant to each other.
0
100
200
300
400
500
25%MVC 50%MVC 75%MVC
Ele
ctri
cal A
ctiv
ity (
uV
)
Electrical Activity post-EMD (APB)
10Hz 35Hz 50Hz
*
*
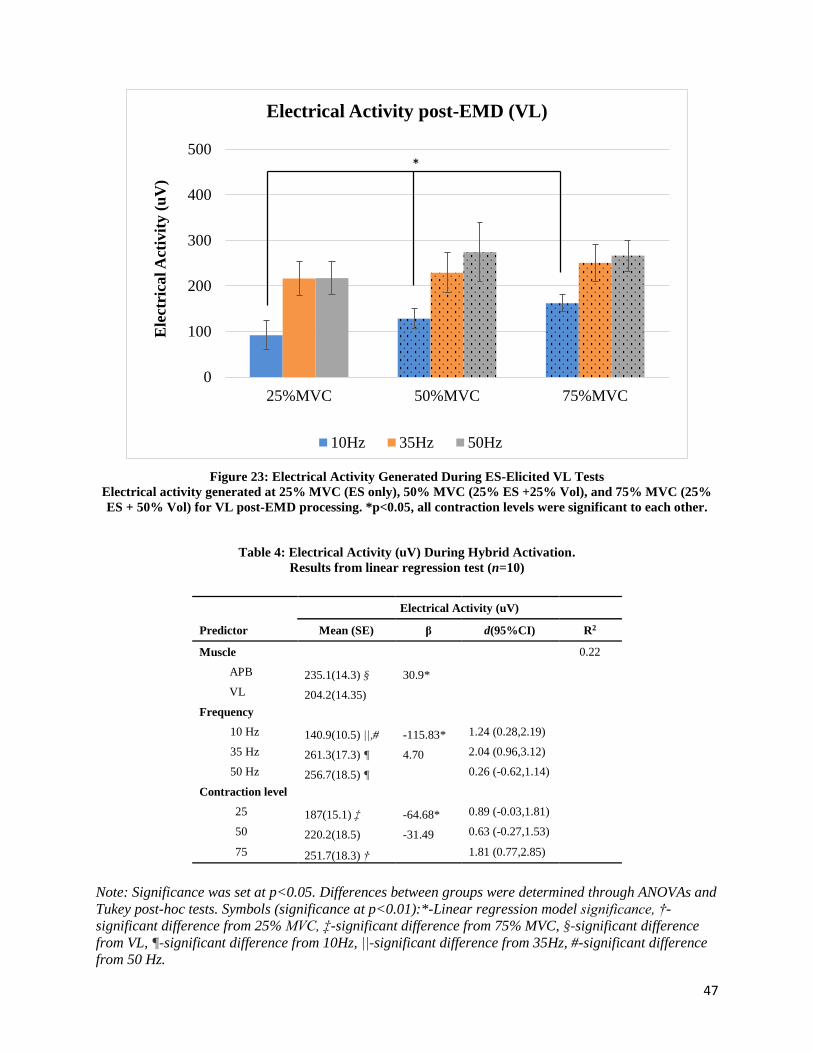
47
Figure 23: Electrical Activity Generated During ES-Elicited VL Tests
Electrical activity generated at 25% MVC (ES only), 50% MVC (25% ES +25% Vol), and 75% MVC (25%
ES + 50% Vol) for VL post-EMD processing. *p<0.05, all contraction levels were significant to each other.
Table 4: Electrical Activity (uV) During Hybrid Activation.
Results from linear regression test (n=10)
Electrical Activity (uV)
Predictor Mean (SE) β d(95%CI) R2
Muscle 0.22
APB 235.1(14.3) § 30.9*
VL 204.2(14.35)
Frequency
10 Hz 140.9(10.5) ||,# -115.83* 1.24 (0.28,2.19)
35 Hz 261.3(17.3) ¶ 4.70 2.04 (0.96,3.12)
50 Hz 256.7(18.5) ¶ 0.26 (-0.62,1.14)
Contraction level
25 187(15.1) ‡ -64.68* 0.89 (-0.03,1.81)
50 220.2(18.5) -31.49 0.63 (-0.27,1.53)
75 251.7(18.3) † 1.81 (0.77,2.85)
Note: Significance was set at p<0.05. Differences between groups were determined through ANOVAs and
Tukey post-hoc tests. Symbols (significance at p<0.01):*-Linear regression model significance, †-
significant difference from 25% MVC, ‡-significant difference from 75% MVC, §-significant difference
from VL, ¶-significant difference from 10Hz, ||-significant difference from 35Hz, #-significant difference
from 50 Hz.
0
100
200
300
400
500
25%MVC 50%MVC 75%MVC
Ele
ctri
cal A
ctiv
ity (
uV
)
Electrical Activity post-EMD (VL)
10Hz 35Hz 50Hz
*

48
Isolated voluntary muscle response at 50% and 75% MVC
Hybrid activation contains ES-induced and voluntary components, and so the voluntary
component was isolated by subtracting the output from 25% MVC (pure ES-elicited muscle
response). Values were graphed in Figure 24. The results of the ANOVA showed no significance
between the contraction levels, muscle types, or frequency. However, the effect sizes were
calculated as d =1.34 (-2.32, -0.38) between the two contraction levels, 50% and 75% MVC.
According to Cohen’s classification, this is a large effect (d > 0.8) on the electrical activity when
changing the contraction force. The effect size between muscles was calculated at d = 0.56 (-
1.44, 0.35), indicating a medium effect (d > 0.5) on the EMG electrical activity caused by
different muscles.
Overall, significantly less electrical output was seen when adding voluntary contraction
to supplement the stimulation contractions than the initial activity generated from 0-25% MVC
(pure ES-elicited response) for all frequencies (p<0.05).
Figure 24: Isolated voluntary muscle response post-ES removal
Isolated voluntary muscle response percent increase post-ES removal (after removal of 25% MVC data) for
(a) APB and (b) VL muscles.
0
50
100
150
200
50% 75%
% I
ncr
ease
fro
m 2
5%
MV
C
Isolated Voluntary muscle
response (APB)
10Hz 35Hz 50Hz
-50
0
50
100
150
200
50% 75%% I
ncr
ease
fro
m 2
5%
MV
C
Isolated Voluntary muscle
response (VL)
10Hz 35Hz 50Hz
49
VI. DISCUSSION
Comparison of voluntary muscle responses for different muscle types
For each muscle, EMG measurements portrayed the normal muscle recruitment
progression. Higher contraction levels recruited more muscle fibers and generated higher EMG
activities, a trend initially proposed by Henneman10. Our data showed that APB generated more
electrical activity, but less force output, than VL. Fling21 reported electrical output data for the
small thumb and large leg muscle as recorded with needle electrodes. Although the needle
electrodes used were able to measure more precise activity from the two muscles and therefore a
much higher electrical amplitude was detected, Fling discovered the same behavior in electrical
activity of small and large muscles as ours21. Fling proposed the electrical activity difference
between the muscles to be due to a higher number of fibers clustering in smaller muscles, and the
increased amplitude due to an increased number of action potentials recorded with the electrode.
One feature of surface EMG recordings is the electrical activity detected in the signal
reflects the size and distance of the closest muscle fibers to the recording surface electrode. If
fibers are more densely located closer to the electrode surface, more action potentials are
detected and there will be greater electrical amplitude recorded with EMG. The APB is
predominantly made up of slow Type I fibers that are generally smaller in width. In this manner,
greater numbers of fibers can be clustered into a smaller area, crucial to control the fine motor
skills that are required to operate the thumb. Knight and Kamen77 reported that superficial
muscle units are larger than deep motor units in the VL. Biologically, intramuscular
regionalization could allow for more conservation of heat, higher access to blood flow and more
efficient oxidative metabolism for fibers in deeper locations77, features consistent with Type I,
slow fibers. It might be possible that the EMG signal is detecting activity from the superficial,
larger, Type II fibers in VL, while the EMG action potential of APB is measured from a greater

50
number of smaller fibers. As VL muscle fibers are longer than APB, there is also the possibility
the electrode on the VL is not capturing all of the action potentials released21. EMG is a
measurement of the total amount of electrical signals measured from the sum of all action
potentials released at a given moment. Therefore, with a higher fiber density under the
measurement electrode, the total number of action potentials executed will be larger, and overall
electrical activity detection will be greater for a Type I muscle.
When we normalize both muscle EMG outputs to maximum units recruited, there
remains a difference in electrical output between the muscles, indicating specific biomechanical
differences. Our results show (Figure 17) that when normalized, VL exerts a greater force output
per fibers recruited. We believe this is due to differences in fiber type composition. Type II
motor units that are predominant in the VL muscle are not only thicker in diameter, but are also
faster and stronger than Type I fibers. The fiber width of the APB muscle is much smaller, and
requires a greater proportion of total fibers to perform at the same level of force.
Evident biomechanical differences are also reflected in the distribution of the signal
frequencies. Traditionally, MDF values are used when investigating muscle recruitment, as MDF
is a measurement of the frequency at which most fibers in the area become ‘activated’, or release
an action potential. The EMG frequency spectrum is not dependent on the number and firing rate
of motor units or changes in muscle force or load levels78-81, but can be changed from muscles
that have differences in fiber composition and distribution82. The range of values for MDF found
in our experiment is consistent with instantaneous MDF values for the TA, another large leg
muscle83 , and the MDF values for the index finger84, another small hand muscle. Several recent
studies have reported that MDF increases as muscle fiber length decreases. This fiber length
difference has only been studied using the same muscle, but the geometry application can be
extended to separate muscles using the same concept. According to our results, there is no

51
change in MDF with increased activation and additional motor unit recruitment, but there is a
difference between muscles with different fiber lengths. Although MDF has been examined
among muscular recruitment of the same muscle82, or group of muscles85, it has not previously
been used to quantify two muscles of different sizes and fiber distributions.
In addition to its use as an indication tool to display fiber type differences between
muscles, MDF is one of the most commonly used outputs to show fatigue in a muscle86,87.
Typically, when muscles fatigue, fibers at higher frequencies are recruited to supplement the
exhausted fibers, increasing the MDF detected in the signal88. In our results, the unchanging
MDF values per muscle regardless of the force output show there is no evidence of muscle
fatigue with this procedure, although the significant differences between muscles suggest fiber
type differences
Greater activation of muscle fibers during rehabilitation has been linked to progress
toward recovery. Progressive resistance training has been used successfully to treat shoulder
injuries, Achilles tendinopathy, and work-related neck and back pain89,90. Physical therapists
often recommend strengthening exercises that involve the coordination of multiple muscles in a
group91, such as the quadriceps muscle or rotator cuff. Therefore, it is necessary to understand
the recruitment and electrical output differences for each individual muscle.
In previous research on biofeedback applications, all muscles had been grouped together
for analysis92. According to our results, when APB and VL are both contracting with the same
proportional force (eg. 75% MVC), the APB must recruit a greater proportion of total fibers to
engage in the task. Therefore, an injured player exhibiting 75% MVC force output with the VL
does not necessarily engage the same proportion of functional motor units as an APB also
contracting at 75% MVC. Based on our results, the recruitment patterns of muscles with different

52
fiber-types should be appraised independently. In order to expand on the results of our study,
larger sample sizes testing additional muscles of varying fiber type compositions should be
explored.
Evaluation of effectiveness of stimulation artifact removal
The addition of the EMD processing increased removal of the stimulation artifact, as
demonstrated by increasing values of SNR, high values for PR, and decreased EIs. Each of these
trends were predicted with reduction of ‘noise’, or ‘artifact’. These three measurements indicate
EMD is effective in reducing the effect of the stimulus pulse in the signal, regardless of the
stimulation frequency.
The validation for the reconstruction with EMD has been conducted previously66,
showing EMD can isolate the muscle response even when the stimulus artifact and muscle output
overlap. Some advantages with EMD as a removal process are that it is data-adaptive,
computationally fast, and not template-based, and so additional inputs are not required65. EMD is
more comprehensive than time, FFT, or wavelet filtering by itself, as decomposition preserves
elements in each mode, instead of separating the artifact and EMG frequencies and then filtering
them.
As previously mentioned, Qiu et al. recently developed an adaptive matched filter based
on a genetic algorithm64. Although this method addresses the inconsistencies with artifact and M-
wave placement, the method uses fixed parameters to remove stimulus pulses via a modified
template extraction. Conversely, EMD does not need initial inputs on parameters such as artifact
durations and other signal properties. The extraction is completely driven by the data itself.
Additionally, our power reduction values were all higher than the ones reported by Qiu64 with the
genetic algorithm adaptive filtering technique and comb filter. PR is a good evaluation tool for

53
examining the efficiency of the removal process, as it is not affected by control models, or
voluntary response. For all stimulation levels, the PR values shown in Table 3 suggest EMD is
more effective in removing the artifact than the adaptive filter proposed by Qiu.
In addition to adaptive filters, other removal techniques have been compared with EMD.
EMD is more effective in reducing the power of noise when compared with wavelet analysis93,
mainly because of its adaptive nature. Wavelet techniques fit the signal outputs to a pre-
determined waveform, or ‘mother wavelet’, and attempts to process the signal linearly with
wavelet filters94. Distortion post-processing has been analyzed in frequency and time domains,
and the EMD method presents the best option in decreasing noise of the signal, but preserving
signal information93. Preserving the signal energy is important because the sEMG output is a
direct representation of muscle activity, and eliminating the least amount of non-stimulus data as
possible during processing would give the most accurate presentation of actual muscle response.
EMD can do this more effectively than filter or wavelet-based methods, two techniques that are
most commonly used currently.
However, there are known limitations with the EMD method. High frequency
components are extracted by the algorithm into the first few IMFs65. In this investigation, the
first four IMFs were dominated with stimulus artifact, when they were eliminated, some higher
frequency components were also eliminated from the analysis, potentially removing some
muscle response data.
Scale-mixing, or ‘mode-mixing’ is an additional limitation that can be present in EMD-
processed signals. During decomposition, signals are separated based on an algorithm that
combines frequency and time domains. This causes different IMF components to have
differences in intermittency, where some have widely disparate time scales and others have

54
similar time scales. Intermittency means a component comes into existence or disappears from
the signal entirely based on the particular time scale, altering the frequency of the IMF. IMFs are
combined during reconstruction, regardless of intermittencies, causing ‘mode mixing’, and
components may not add together properly, particularly in the frequency domain. Several
solutions have been proposed to this issue. These options include creating a scale limit to the
envelope of extrema which allows a component to pass through, or adding then subtracting a
masking signal95 or white noise96. However, these options are limited for cases when the
components are not well separated in frequency, or are embedded in high frequency artifact. A
standardized method for dealing with mode mixing has not been established.
Additionally, the bandwidth used for this process (Butterworth filter: 20-500Hz) is the
range typically used for muscle data analysis97 and is a native feature of the physiological
recording software and could not be changed. However, this range could cut off the stimulus
artifact. The bandwidth is not wide enough to capture data at the fast rate of the biphasic
stimulus, particularly at higher stimulus rates such as 35 and 50Hz. Based on Nyquist frequency
calculations and a pulse width of 300us, to get better reconstruction, it is advised to have an
increased sampling frequency and wider bandwidth in future studies.
Previously, muscle activity during ES has been difficult to monitor due to the
contaminating stimulus artifact. Based on our results, it appears the artifact can been reduced
using EMD, and this decomposition process is more effective in reducing the corrupting artifact
than other alternatives. To accurately compare ES-induced and voluntary muscle activity to
determine fiber recruitment progression, it is essential to examine only the activity from the
muscle. It is therefore vital to remove as much artifact from the signal as possible. EMD alone
reduced the power of the signals in this protocol 26 to 30 times (Table 3). Because of the
difference in amplitude scale between artifacts and m-waves, some stimulation remaining in the

55
signal could dramatically increase the electrical output detected with EMG, and provide
misinformation. EMD is the best way to preserve signal information while eliminating
corrupting artifacts.
Comparison of muscle responses at different frequencies
Required intensity to reach 25% MVC
First of all, the smaller muscle (APB) required significantly less intensity to reach the
25% MVC force threshold than VL. VL required greater stimulation to activate the muscle most
likely due to its size. Based on the force measured with the dynamometer in this study, there was
a greater total force output by the large muscle. According to the S-shaped relationship between
frequency and force output discovered by Binder-Macleod et al.28 (Figure 8), as stimulation
frequency increases, so does the normalized force generated by the muscle. In fact, the
progressive relationship between increasing stimulation intensity and force output of the leg
muscle has been established previously by Frigo63. Frigo engaged in a similar protocol,
increasing intensity during knee extension until 40% MVC, and then supplementing voluntary
contraction until 80% MVC was reached.
Frigo, however, did not examine differences in intensity required to activate different
muscles. We found VL force outputs were significantly higher than APB, caused by greater
current into the muscle to induce contraction. Additionally, when stimulated at 10 Hz,
participants generally required higher intensities of stimulation in order to reach the same force
level, similar to the trend found by Frigo with 16.67 and 25 Hz stimulation frequencies63. There
was no difference between 35 and 50Hz for both muscles. This difference can be attributed to
biomechanical differences in muscle fibers, discussed in the following section.

56
ES-induced muscle response at 25% MVC
According to our post-EMD processed results, there appear to be differences in electrical
activity output between low and higher frequencies of stimulation. In the VL, there are
significant differences in electrical activity measured between 10Hz and higher rates (p<0.05),
but none between the higher frequencies, 35 and 50Hz.
For VL at 10Hz, a slower pulse is delivered to the muscle and less total recruitment is
required for the muscles to generate 25% MVC. However, higher levels of intensity are required
to be delivered to reach the same force level with 10Hz than with 35 or 50Hz- activated muscle.
Overall, this indicates greater muscle activation occurs when the muscle is subject to faster
stimulation rates. Consistent with our results for both muscles, a recent study exploring the
effects of single motor unit stimulation of the human tibial nerve found that higher stimulation
frequencies recruited more units at shorter latencies than lower frequencies98. This is most likely
due to a changing contraction mechanism when an electrical pulse is delivered to the muscle at
fast rates. Motor units are recruited as their motor axons are depolarized and then relax after the
action potential has fired and the axon is repolarized99. However, if activation is delivered so
frequently it does not allow for full depolarization, tetanic, or fused contraction occurs. This
creates a cumulative effect involving multiple stimuli, causing greater muscle recruitment and
higher EMG amplitudes. Higher stimulation frequencies such as 35 and 50Hz could cause tetanic
contractions, forcing additional motor units to be recruited to complete the task. The EMG
electrical activity results reported in this study indicate 35 or 50 Hz would be better to induce
higher muscle fiber activation.
Further evidence of a changing contraction mechanism at faster stimulation rates is
shown with the non-significance between 35 and 50Hz, which indicates that muscle is activated
equally when stimulated at either frequency rate. Clinicians can use 35 and 50Hz to generate

57
tetanic contractions, although 50Hz is more common20. In fact, most clinical treatment protocols
use frequencies between 20-50Hz5,32, as higher frequencies produce stronger muscle contractions
and are helpful to increase muscular strength28. There have been debates as to what stimulation
frequency is most effective in a rehabilitation setting. 35 and 50Hz are two of the most common
rates available on stimulation treatment machines, and according to the results presented here,
both levels have a similar effect on the muscle. Therefore, clinicians can focus on the level which
is more comfortable for the patient, rather which causes the most increased activation.
Biologically, tetanic or progressive voluntary contractions can cause an increase in
muscle size and cross sectional fiber area, called ‘muscle hypertrophy’. To induce muscle
hypertrophy, progressive loading causes intermittent levels of stress to skeletal muscle, forcing
adaptation to occur by increasing the size and amount of contractile proteins in each muscle
fiber100. This leads to an increase in size in the individual muscle fibers and their resulting force
production. Previous research shows that ES can cause hypertrophy in individuals with spinal
cord injuries101,102, enhancing regeneration of injured muscle tissue. Musculoskeletal issues are
common with neuromuscular disorders like spinal cord injuries, as atrophy often occurs due to
the inability to control the muscles without operational nerve connections, although a
recommended stimulation frequency has not been determined yet.
Based on the results presented here and the evidence from additional sources, more
stimulation causes greater activation, which ultimately leads to greater recovery. However, there
is a limiting variable to this relationship, known as muscle fatigue. With regeneration of muscle
tissue, there is often a trade-off between greater muscle activation and fatigue in the muscle,
potentially hindering recovery. It has been well-established that muscle fatigue occurs faster with
ES than with voluntarily-activated muscle103. This is most likely due to a difference in muscle
fiber recruitment patterns, as discussed earlier. One study examined fatigue on progressively

58
increasing intensities43. According to the preferential selection principle of voluntary activation,
more fatigue-resistant slow fibers should be recruited at lower intensities followed by fast fibers
at higher levels. However, this study saw no differences in fatigue progression as stimulation
intensity increased, indicating a non-selective, rather than preferential recruitment order
occurred.
Furthermore, higher ES frequencies lead to greater muscle fatigue104-106 and the optimal
frequency depends on the type of muscle107. Preliminary investigations showed ES at a
frequency below 40-50 Hz excited more slow-twitch, fatigue resistant fibers, and higher
frequencies elicited fast-twitch, fatigable units108,109. Fatigue progressed with the increase in
stimulation frequency. Overall, higher intensity and higher frequency induce greater muscle
activations that can lead to recovery, but also more quick-setting muscle fatigue. 35 and 50 Hz
stimulation appear to activate muscles similarly, but clinicians should keep fatigue in mind when
developing rehabilitation protocols.
Increased muscle activation has been linked to progress toward recovery 89,90 and greater
muscle hypertrophy. Accordingly, higher frequency stimulation, such as 35 or 50 Hz, should
cause greater recruitment during a rehabilitation protocol than lower frequency activations, and
potentially greater recovery.
Comparison of muscle responses voluntarily and electrically-elicited
Hybrid activation muscle response at 50% and 75% MVC
It is important to supplement stimulated muscle with voluntary activation for several
reasons. First, the maximum tolerated intensity in human subjects is lower than that induced by
voluntary contractions, as the electrical current is more targeted and limits the spatial
arrangement of the motor units recruited59. Secondly, according to the significant differences
59
seen in ES and voluntarily activated muscle at 25% MVC, there is a difference in recruitment, as
ES appears to select fibers for recruitment non-preferentially, and more likely based on position
to the stimulating electrode. Additionally, a voluntary movement will activate synergistic and
stabilizer muscles to complete a task, an arrangement not replicated by ES60. Therefore, ES
cannot complete muscle movements with equivalent strength, as intermuscular coordination is
not employed. Finally, voluntary contractions induce less fatigue than ES contractions103. During
a long voluntary contraction, slow fatigue-resistant fibers are recruited first, and once they
fatigue, neighboring motor units are recruited to complete the task. There is evidence ES recruits
fibers non preferentially, and so the same types are recruited throughout the stimulation56,57.
Specifically for larger, faster motor units such as the VL, fatigue is more intense and selective
when electrically activated60,61,69, and can cause more damage than voluntary activated
muscle110. Therefore, supplementing stimulated contraction with voluntary should delay the
effects of fatigue111, another key advantage with hybrid stimulation.
Because of the many favorable outcomes with hybrid activation, it is crucial to first
evaluate the effectiveness of the combined therapy. We were able to successfully activate
muscles with electrical stimulation and then supplement with voluntary activation to employ
high recruitment levels up to 75% MVC. Another study examined reconstruction of the anterior
cruciate ligament (ACL) post-surgery with standard isometric training with and without
percutaneous ES during the recovery period (1 to 5 weeks) 112. The electrically-stimulated group
had better muscle function and greater oxidative enzyme activity after the intervention,
suggesting ES prevented muscle atrophy after ligament reconstruction surgery. Another study
reported quadriceps strength improved more quickly than traditional rehab when adding ES to a
rehabilitation plan after a total knee arthroplasty113. Overall, a combined treatment, including
voluntary and electrically-activated components, restores strength post-surgery, particularly in
60
the early phases of rehabilitation24,114. Petterson and Snyder-Mackler suggested that
strengthening solely through voluntary training might not be enough to overload the muscle to
increase strength so early in the recovery process, as patients are unable to contract their muscles
for several days post-surgery115. During the initial recovery periods, ES is often the only source
for muscle activity or contraction, and ES-activation alone is enough to stimulate neuromuscular
adaptations24. As the muscle recovers, supplementation of voluntary activation may expedite the
recovery process and prevent fatigue. When fibers regain more activation, treatment with ES can
be reduced, and voluntary training can be phased-in during later sessions as strength is
improved59. This treatment protocol is similar to the one done in this investigation. A similar
investigation could be conducted to determine the efficacy of ES and voluntary activation with
other difficult-to-treat areas such as the rotator cuff.
Isolated voluntary muscle response at 50% and 75% MVC
With hybrid activation, it is important to evaluate the individual contributions from both
components of the signal in terms of muscular response. By separating the signal into voluntary
and ES-induced muscle behavior, it is possible to further examine recruitment differences. For
measurements recorded at 50 and 75% MVC, voluntary muscle activity was extracted from
activity caused from ES. Due to the difficulty in effectively eliminating the artifact, no other
study has specifically examined the muscle activity output of the voluntary component during
combined activation. The effectiveness of our removal procedure and accuracy of the isolated
voluntary response data were evaluated in the same manner as normal voluntary contraction. For
isolated voluntary response post-extraction, there was an effect on the electrical activity output
when changing muscle type and varying contraction levels. Based on these calculations, isolated
voluntary muscle behavior followed the same trend as progressive normal voluntary contraction

61
behavior (K.S., unpublished data, 2015), although the relationship between electrical output and
increasing contraction was stronger with normal voluntary than isolated voluntary.
Fortunately, normal voluntary behavior has been extensively researched and Henneman’s
progressive size recruitment principle states more fibers are recruited with increased contraction,
visible through increased amplitudes with sEMG. This progressive increase was true for
voluntary responses (K.S., unpublished data, 2015) with small hand and large leg muscles,
indicating both muscle responses follow the same type of recruitment pattern. This is particularly
important for hybrid activation, as the isolated voluntary component has not been analyzed
previously, and this evidence suggests the orderly voluntary mechanism for recruitment
continues, even after ES has selected its fibers for recruitment without preference toward a
specific type.
Although the overall progressive relationship between normal voluntary and isolated
voluntary response was similar, the electrical activity magnitude between 50% and 25% MVC
was significantly larger for voluntary contraction than isolated. Figure 24 showed the isolated
voluntary response (shown in Figure 24 as ‘increase from 25% MVC’ for isolated voluntary
response). Therefore, although there is a similar pattern of recruitment between both voluntary
types of contractions, the component that is part of the hybrid activation releases less muscle
activity detected by the electrode. One possibility for this marked reduction in electrical activity
measured with the EMG could be due to fiber regionalization in the muscle. EMG surface
electrodes detect signals of the closest muscle fibers to the surface. If ES evoked the closest
muscle fibers to the stimulating electrode, the most superficial muscle units would be recruited,
resulting in large activities detected by the EMG. This high measurement is demonstrated in
Figure 22 and 23 at 25% MVC. 50 and 75% MVC contractions then required voluntary
activation, a preferential recruitment of specific types of fibers in order. However, because all the

62
fibers closest to the surface of the skin were already recruited by the ES, it is possible deeper
motor units then needed to be called upon to engage the muscle up to 50 or 75% MVC. In this
case, the preferential recruitment caused by voluntary activation would still occur with the fibers
that were available (the deeper units), but the far location from the recording electrode would
cause less electrical detection by the EMG. Only small amounts of increased activity were
measured at 50 and 75% MVC, although the muscle output two to three times the amount of
force, supporting this theory.
Furthermore, effect sizes suggested strong and medium effects from different contraction
forces and muscle types in terms of electrical output from the muscle during isolated muscle
response. The increased contraction effect displays the same trend suggested by Henneman for
voluntary activity, as 75% activity values were higher than 50% MVC. However, the increase is
not proportional, and does not fit a linear model for either muscle, highlighting again the
differences in recruitment between electrically-elicited and voluntary contractions.
Regardless if muscles were electrically stimulated or voluntarily contracted, the small
thumb muscle consistently output higher electrical activities than the large leg muscle21,83,84 (also
K.S., unpublished data, 2015). This is most likely due to the fiber differences in the muscle, as
the signal amplitude is directly related to the number of fibers clustered in one area, specifically
the area detectable by an electrode. For a predominately Type I muscle such as the APB, many
smaller fibers are distributed closer to the surface of the skin, causing greater action potentials to
be detected by the surface electrodes12.
Overall, muscle response with ES has previously been unexplored due to the
overwhelming stimulus artifact. Based on the evidence presented here, EMD is an effective
mechanism for eliminating the artifact post-data collection and should be used to analyze more

63
muscle response data. Although hybrid activations have been established as effective in
improving muscle performance and recovery, the electrical activity has never been examined in
terms of contributions from ES-induced and voluntary components. This information is
important when developing treatment regimens to regenerate muscle, create rehabilitation
protocols that will start with ES and gradually progress toward voluntary-controlled activation,
and finally aid in the development of neuroprosthetic devices.
VII. CONCLUSION AND CLINICAL IMPLICATIONS
Overall, this investigation addressed several knowledge gaps in terms of muscle response
when exposed to stimulation. Results from this study helped to reveal differences in recruitment
patterns during voluntary activation of two different muscles. Smaller, predominately Type I
muscles require a higher muscle performance target during rehabilitation as more electrical
activity can be generated during voluntary activation.
Additionally, isolating muscle response data from stimulations that are contained in the
same spectra is a continuous challenge. It appears that using decomposition can effectively
reduce the muscle response from the stimulus artifact without using templates or additional
parameter inputs, making this method of filtering non-linear and non-stationary data more
generalizable to users who are not experts in the field of signal analysis.
Using this method, we were able to compare muscle activity from three separate
frequencies and discovered stimulation at higher frequencies such as 35 and 50 Hz generated
greater electrical activity, and correspondingly greater fiber recruitment, from the muscle.
Greater muscle activation during treatment is related to greater recovery of muscle tissue, and so
the use of higher frequency stimulation during rehabilitation is expected to lead to more
functional improvement.

64
Finally, to obtain even greater muscle activation, we supplemented voluntary contractions
on top of stimulated muscle, creating ‘hybrid activation’. Hybrid-activated muscle is a good
option for clinicians to generate higher force outputs and greater muscle activity, while
minimizing the likelihood of fatigue or tissue damage. However, the mechanism of recruitment
is not the same for stimulated muscle and additional voluntary muscle supplemented on top, as
each component contributes different levels of activity to the overall electrical activity.
Overall, information generated with this procedure will give valuable knowledge
regarding motor unit recruitment with stimulation, and with a combination of voluntary and
electrically-elicited contractions.

65
VIII. REFERENCES
1. Williams HB. A clinical pilot study to assess functional return following continuous muscle stimulation
after nerve injury and repair in the upper extremity using a completely implantable electrical system.
Microsurgery. 1996;17(11):597-605.
2. Hampton S, King L. Healing an intractable wound using bio-electrical stimulation therapy. Br J Nurs.
2005;14(15):S30.
3. Taylor ED, Nair LS, Nukavarapu SP, McLaughlin S, Laurencin CT. Novel nanostructured scaffolds as
therapeutic replacement options for rotator cuff disease. The Journal of bone and joint surgery.American
volume. 2010;92 Suppl 2:170.
4. Fluck M. Functional, structural and molecular plasticity of mammalian skeletal muscle in response to
exercise stimuli. J Exp Biol. 2006;209(Pt 12):2239-2248. doi: 209/12/2239 [pii].
5. Kroon d,Joke R., Chae J, Lankhorst GJ, IJzerman MJ, Zilvold G. Relation between stimulation
characteristics and clinical outcome in studies using electrical stimulation to improve motor control of the
upper extremity in stroke. J Rehabil Med. 2005;37(2):65-74.
6. Faghri PD, Rodgers MM, Glaser RM, Bors JG, Ho C, Akuthota P. The effects of functional electrical
stimulation on shoulder subluxation, arm function recovery, and shoulder pain in hemiplegic stroke
patients. Arch Phys Med Rehabil. 1994;75(1):73-79. doi: 0003-9993(94)90341-7 [pii].
7. Yeom H, Chang Y. Autogenic EMG-controlled functional electrical stimulation for ankle dorsiflexion
control. J Neurosci Methods. 2010;193(1):118-125.
8. Knutson JS, Harley MY, Hisel TZ, Makowski NS, Chae J. Contralaterally controlled functional
electrical stimulation for recovery of elbow extension and hand opening after stroke: A pilot case series
study. American Journal of Physical Medicine & Rehabilitation. 2014;93(6):528-539.

66
9. Forsman A. Anatomy of a muscle. http://faculty.etsu.edu/forsman/histologyofmuscleforweb.htm.
Accessed 11/3, 2015.
10. Henneman E, Somjen G, Carpenter DO. Functional significance of cell size in spinal motoneurons. J
Neurophysiol. 1965;28:560.
11. Skeletal Muscle Contraction and the Motor Unit.
http://www.humanneurophysiology.com/motorunit.htm. Updated 2015. Accessed 11/3, 2015.
12. Polgar J, Johnson MA, Weightman D, Appleton D. Data on fibre size in thirty-six human muscles. J
Neurol Sci. 1973;19(3):307-318.
13. Edgerton VR, Smith J, Simpson D. Muscle fibre type populations of human leg muscles. Histochem J.
1975;7(3):259-266.
14. The intrinsic muscles of the hand: Thenar, hypothenar, interossei and lumbricals muscles.
http://www.gustrength.com/anatomy:intrinsic-hand-muscles. Updated 2015. Accessed 11/3, 2015.
15. Vastus lateralis.
https://en.wikipedia.org/wiki/Vastus_lateralis_muscle#/media/File:Vastus_lateralis2.png. Updated 2015.
Accessed 11/3, 2015.
16. De Luca CJ, Adam A, Wotiz R, Gilmore LD, Nawab SH. Decomposition of surface EMG signals. J
Neurophysiol. 2006;96(3):1646-1657. doi: 96/3/1646 [pii].
17. Henneman E. Relation between size of neurons and their susceptibility to discharge. Science.
1957;126(3287):1345-1347.
18. Milner-Brown HS, Stein RB, Yemm R. The orderly recruitment of human motor units during
voluntary isometric contractions. J Physiol (Lond ). 1973;230(2):359-370.

67
19. Jabre JF, Spellman NT. The demonstration of the size principle in humans using macro
electromyography and precision decomposition. Muscle Nerve. 1996;19(3):338-341.
20. Gregory CM, Bickel CS. Recruitment patterns in human skeletal muscle during electrical stimulation.
Phys Ther. 2005;85(4):358.
21. Fling BW, Knight CA, Kamen G. Relationships between motor unit size and recruitment threshold in
older adults: Implications for size principle. Experimental brain research. 2009;197(2):125-133.
22. Binder-Macleod SA, McDermond LR. Changes in the force-frequency relationship of the human
quadriceps femoris muscle following electrically and voluntarily induced fatigue. Phys Ther.
1992;72(2):95.
23. Rutherford OM, Jones DA, Newham DJ. Clinical and experimental application of the percutaneous
twitch superimposition technique for the study of human muscle activation. J Neurol Neurosurg
Psychiatr. 1986;49(11):1288-1291.
24. Snyder-Mackler L, Binder-Macleod SA, Williams PR. Fatigability of human quadriceps femoris
muscle following anterior cruciate ligament reconstruction. Med Sci Sports Exerc. 1993;25(7):783-789.
25. Crago PE, Peckham PH, Thrope GB. Modulation of muscle force by recruitment during intramuscular
stimulation. IEEE Trans Biomed Eng. 1980;27(12):679-684.
26. Adams GR, Harris RT, Woodard D, Dudley GA. Mapping of electrical muscle stimulation using
MRI. J Appl Physiol. 1993;74(2):532-537.
27. Bickel CS, Slade JM, Dudley GA. Long-term spinal cord injury increases susceptibility to isometric
contraction-induced muscle injury. Eur J Appl Physiol. 2004;91(2):308-313.

68
28. Binder-Macleod SA, Halden EE, Jungles KA. Effects of stimulation intensity on the physiological
responses of human motor units. Med Sci Sports Exerc. 1995;27(4):556-565.
29. Gregory CM, Dixon W, Bickel CS. Impact of varying pulse frequency and duration on muscle torque
production and fatigue. Muscle Nerve. 2007;35(4):504-509.
30. Matsunaga T, Shimada Y, Sato K. Muscle fatigue from intermittent stimulation with low and high
frequency electrical pulses. Arch Phys Med Rehabil. 1999;80(1):48-53.
31. Lepoutre F-, Garnier C, Lavet C, Dreibati B, Poumarat G, Pinti A. Muscular fatigue induced by
electrical stimulation. Comput Methods Biomech Biomed Engin. 2009;12(sup1):101-102.
32. Baker LL, Bowman BR, McNeal DR. Effects of waveform on comfort during neuromuscular
electrical stimulation. Clin Orthop. 1988(233):75-85.
33. Bellemare F, Woods JJ, Johansson R, Bigland-Ritchie B. Motor-unit discharge rates in maximal
voluntary contractions of three human muscles. J Neurophysiol. 1983;50(6):1380.
34. Rubinstein S, Kamen G. Decreases in motor unit firing rate during sustained maximal-effort
contractions in young and older adults. Journal of Electromyography and Kinesiology. 2005;15(6):536-
543.
35. Loeb GE, Ghez C. The motor unit and muscle action. Principles of neural science. 2000:674-694.
36. Gorgey AS, Mahoney E, Kendall T, Dudley GA. Effects of neuromuscular electrical stimulation
parameters on specific tension. Eur J Appl Physiol. 2006;97(6):737-744.
37. Gorgey AS, Black CD, Elder CP, Dudley GA. Effects of electrical stimulation parameters on fatigue
in skeletal muscle. J Orthop Sports Phys Ther. 2009;39(9):684.

69
38. Solomonow M. External control of the neuromuscular system. IEEE Transactions on Biomedical
Engineering. 1984;BME-31(12):752-763.
39. Blair E, Erlanger J. A comparison of the characteristics of axons through their individual electrical
responses. Am J Physiol. 1933;106:524-564.
40. Feiereisen P, Duchateau J, Hainaut K. Motor unit recruitment order during voluntary and electrically
induced contractions in the tibialis anterior. Experimental Brain Research. 1997;114(1):117-123.
41. Knaflitz M, Merletti R, C. J. De Luca. Inference of motor unit recruitment order in voluntary and
electrically elicited contractions. J Appl Physiol. 1990;68(4):1657-1667.
42. Bickel CS, Gregory CM, Dean JC. Motor unit recruitment during neuromuscular electrical
stimulation: A critical appraisal. Eur J Appl Physiol. 2011;111(10):2399-2407. doi: 10.1007/s00421-011-
2128-4 [doi].
43. Slade JM, Bickel CS, Warren GL, Dudley GA. Variable frequency trains enhance torque independent
of stimulation amplitude. Acta Physiol Scand. 2003;177(1):87-92.
44. Scott R, McLean L, Parker P. Stimulus artefact in somatosensory evoked potential measurement.
Medical and Biological Engineering and Computing. 1997;35(3):211-215.
45. O'Keeffe DT, Lyons GM, Donnelly AE, Byrne CA. Stimulus artifact removal using a software-based
two-stage peak detection algorithm. J Neurosci Methods. 2001;109(2):137-145.
46. Minzly J, Mizrahi J, Hakim N, Liberson A. Stimulus artefact suppressor for EMG recording during
FES by a constant-current stimulator. Med Biol Eng Comput. 1993;31(1):72.
47. Harding GW. A method for eliminating the stimulus artifact from digital recordings of the direct
cortical response. Computers and biomedical research. 1991;24(2):183-195.

70
48. Nagel JH. Biopotential amplifiers. In: Bronzino JD, ed. The biomedical engineering handbook. 2nd
ed. Boca Raton: CRC Press LLC; 2000.
49. Heffer LF, Fallon JB. A novel stimulus artifact removal technique for high-rate electrical stimulation.
J Neurosci Methods. 2008;170(2):277-284.
50. Freeman JA. An electronic stimulus artifact suppressor. Electroencephalogr Clin Neurophysiol.
1971;31(2):170-172.
51. Black RC, Clark GM, O'Leary SJ, Walters C. Intracochlear electrical stimulation of normal and deaf
cats investigated using brainstem response audiometry. Acta oto-laryngologica.Supplementum.
1983;399:5.
52. Knaflitz M, Merletti R. Suppression of stimulation artifacts from myoelectric-evoked potential
recordings. IEEE Transactions on Biomedical Engineering. 1988;35(9):758-763.
53. Roskar E, Roskar A. Microcomputer based electromyographic recording system with stimulus
artifact suppression. Third Medical Conference. 1983.
54. Montgomery EB, Gale JT, Huang H. Methods for isolating extracellular action potentials and
removing stimulus artifacts from microelectrode recordings of neurons requiring minimal operator
intervention. J Neurosci Methods. 2005;144(1):107-125.
55. Miller CA, Abbas PJ, Robinson BK, Rubinstein JT, Matsuoka AJ. Electrically evoked single-fiber
action potentials from cat: Responses to monopolar, monophasic stimulation. Hear Res. 1999;130(1-
2):197-218.
56. Wichmann T. A digital averaging method for removal of stimulus artifacts in neurophysiologic
experiments. J Neurosci Methods. 2000;98(1):57-62.

71
57. Lee H, Cho K, Lee W. The effects of body weight support treadmill training with power-assisted
functional electrical stimulation on functional movement and gait in stroke patients. American Journal of
Physical Medicine & Rehabilitation. 2013;92(12):1051-1059.
58. Perumal R, Wexler AS, Kesar TM, Jancosko A, Laufer Y, Binder-Macleod SA. A phenomenological
model that predicts forces generated when electrical stimulation is superimposed on submaximal
volitional contractions. J Appl Physiol. 2010;108(6):1595-1604.
59. Hainaut K, Duchateau J. Neuromuscular electrical stimulation and voluntary exercise. Sports
medicine. 1992;14(2):100-113.
60. Hamada T, Kimura T, Moritani T. Selective fatigue of fast motor units after electrically elicited
muscle contractions. Journal of Electromyography and Kinesiology. 2004;14(5):531-538.
61. Ratkevičius A, Skurvydas A, Povilonis E, Quistorff B, Lexell J. Effects of contraction duration on
low-frequency fatigue in voluntary and electrically induced exercise of quadriceps muscle in humans. Eur
J Appl Physiol Occup Physiol. 1998;77(5):462-468.
62. Sbruzzi G, Schaan BD, Pimentel GL, et al. Effects of low frequency functional electrical stimulation
with 15 and 50 hz on muscle strength in heart failure patients. Disabil Rehabil. 2011;33(5):486-493.
63. Frigo C, Ferrarin M, Frasson W, Pavan E, Thorsen R. EMG signals detection and processing for on-
line control of functional electrical stimulation. Journal of Electromyography and Kinesiology.
2000;10(5):351-360.
64. Qiu S, Feng J, Xu R, et al. A stimulus artifact removal technique for SEMG signal processing during
functional electrical stimulation. IEEE Trans Biomed Eng. 2015. doi: 10.1109/TBME.2015.2407834
[doi].
72
65. Huang NE, Shen Z, Long SR, et al. The empirical mode decomposition and the hilbert spectrum for
nonlinear and non-stationary time series analysis. 1998;454(1971):903-995.
66. Pilkar RB, Yarossi M, Forrest G. Empirical mode decomposition as a tool to remove the function
electrical stimulation artifact from surface electromyograms: Preliminary investigation. 2012:1847-1850.
67. Saitou K, Masuda T, Michipkami D, Kojima R, Okada M. Innervation zones of the upper and lower
limb muscles estimated by using multi-channel surface EMG. Journal of Human Ergology. 2000;29:35-
52.
68. Cho HK, Jung GS, Kim EH, Cho YW, Kim SW, Ahn SH. The effects of neuromuscular electrical
stimulation at different frequencies on the activations of deep abdominal stabilizing muscles. Journal of
back and musculoskeletal rehabilitation. 2015(Preprint):1-7.
69. Binder-Macleod SA, Snyder-Mackler L. Muscle fatigue: Clinical implications for fatigue assessment
and neuromuscular electrical stimulation. Phys Ther. 1993;73(12):902-910.
70. Kesar T, Binder‐Macleod S. Effect of frequency and pulse duration on human muscle fatigue during
repetitive electrical stimulation. Exp Physiol. 2006;91(6):967-976.
71. Bohannon RW, Kindig J, Sabo G, Duni AE, Cram P. Isometric knee extension force measured using a
handheld dynamometer with and without belt-stabilization. Physiotherapy theory and practice.
2012;28(7):562-568.
72. Bohannon RW, Kindig J, Sabo G, Duni AE, Cram P. Isometric knee extension force measured using a
handheld dynamometer with and without belt-stabilization. Physiotherapy Theory and Practice.
2012;28(7):562-568.
73. Mak JN, Hu Y, Luk KD. An automated ECG-artifact removal method for trunk muscle surface EMG
recordings. Med Eng Phys. 2010;32(8):840-848.
73
74. Hedges LV. Distribution theory for glass's estimator of effect size and related estimators. Journal of
Educational and Behavioral Statistics. 1981;6(2):107-128.
75. Cohen J. Statistical power analysis for the behavioral sciences (rev. Lawrence Erlbaum Associates,
Inc; 1977.
76. Huedo-Medina T, Johnson B. Estimating the standardized mean difference effect size and its variance
from different data sources: A spreadsheet. Storrs, CT, USA: Authors. 2011.
77. Knight C, Kamen G. Superficial motor units are larger than deeper motor units in human vastus
lateralis muscle. Muscle Nerve. 2005;31(4):475-480.
78. Englehart KB, Parker P. Single motor unit myoelectric signal analysis with nonstationary data.
Biomedical Engineering, IEEE Transactions on. 1994;41(2):168-180.
79. Solomonow M, Baten C, Smit J, et al. Electromyogram power spectra frequencies associated with
motor unit recruitment strategies. J Appl Physiol (1985). 1990;68(3):1177-1185.
80. Bilodeau M, Arsenault AB, Gravel D, Bourbonnais D. EMG power spectra of elbow extensors during
ramp and step isometric contractions. Eur J Appl Physiol Occup Physiol. 1991;63(1):24-28.
81. Cechetto A, Parker P, Scott R. The effects of four time-varying factors on the mean frequency of a
myoelectric signal. Journal of Electromyography and Kinesiology. 2001;11(5):347-354.
82. Farina D, Fosci M, Merletti R. Motor unit recruitment strategies investigated by surface EMG
variables. J Appl Physiol (1985). 2002;92(1):235-247.
83. Roy S, De Luca C. Evolving characteristics of the median frequency of the EMG signal. Computer-
aided electromyography and expert systems.Holland: Elsevier. 1989:115-124.

74
84. De Luca CJ, Sabbahi MA, Roy SH. Median frequency of the myoelectric signal. Eur J Appl Physiol
Occup Physiol. 1986;55(5):457-464.
85. Bilodeau M, Schindler-Ivens S, Williams D, Chandran R, Sharma S. EMG frequency content changes
with increasing force and during fatigue in the quadriceps femoris muscle of men and women. Journal of
Electromyography and Kinesiology. 2003;13(1):83-92.
86. Phinyomark A, Phukpattaranont P, Limsakul C. Feature reduction and selection for EMG signal
classification. Expert Syst Appl. 2012;39(8):7420-7431.
87. Cifrek M, Medved V, Tonković S, Ostojić S. Surface EMG based muscle fatigue evaluation in
biomechanics. Clin Biomech. 2009;24(4):327-340.
88. Al-Mulla M, Sepulveda F, Colley M. sEMG techniques to detect and predict localised muscle fatigue.
INTECH Open Access Publisher; 2012.
89. Andersen LL, Jorgensen MB, Blangsted AK, Pedersen MT, Hansen EA, Sjogaard G. A randomized
controlled intervention trial to relieve and prevent neck/shoulder pain. Med Sci Sports Exerc.
2008;40(6):983.
90. Braun S, Kokmeyer D, Millett PJ. Shoulder injuries in the throwing athlete. J Bone Joint Surg Am.
2009;91(4):966-978. doi: 10.2106/JBJS.H.01341 [doi].
91. McConnell J. Management of patellofemoral problems. Man Ther. 1996;1(2):60-66.
92. Woodford HJ, Price CI. EMG biofeedback for the recovery of motor function after stroke. The
Cochrane Library. 2007.
93. Andrade AO, Nasuto S, Kyberd P, Sweeney-Reed CM, Van Kanijn F. EMG signal filtering based on
empirical mode decomposition. Biomedical Signal Processing and Control. 2006;1(1):44-55.

75
94. Grujić T, Kuzmanić A. Denoising of surface EMG signals: A comparision of wavelet and classical
digital filtering procedures. Technology and Health Care. 2004;12(2):130-135.
95. Deering R, Kaiser JF. The use of a masking signal to improve empirical mode decomposition. .
2005;4:iv/485-iv/488 Vol. 4.
96. Wu Z, Huang NE. Ensemble empirical mode decomposition: A noise-assisted data analysis method.
Advances in adaptive data analysis. 2009;1(01):1-41.
97. Merletti R, Di Torino P. Standards for reporting EMG data. J Electromyogr Kinesiol. 1999;9(1):3-4.
98. Dean JC, Clair-Auger JM, Lagerquist O, Collins DF. Asynchronous recruitment of low-threshold
motor units during repetitive, low-current stimulation of the human tibial nerve. Frontiers in human
neuroscience. 2014;8.
99. Mortimer JT. Motor prostheses. Comprehensive Physiology. 1981.
100. Russell B, Motlagh D, Ashley WW. Form follows function: How muscle shape is regulated by work.
J Appl Physiol (1985). 2000;88(3):1127-1132.
101. Baldi JC, Jackson RD, Moraille R, Mysiw WJ. Muscle atrophy is prevented in patients with acute
spinal cord injury using functional electrical stimulation. Spinal Cord. 1998;36(7):463-469.
102. Gorgey AS, Shepherd C. Skeletal muscle hypertrophy and decreased intramuscular fat after
unilateral resistance training in spinal cord injury: Case report. J Spinal Cord Med. 2010;33(1):90-95.
103. Marsolais EB, Edwards BG. Energy costs of walking and standing with functional neuromuscular
stimulation and long leg braces. Arch Phys Med Rehabil. 1988;69(4):243-249.
104. Moreno-Aranda J, Seireg A. Electrical parameters for over-the-skin muscle stimulation. J Biomech.
1981;14(9):579-585.

76
105. Nathan R, Tavi M. The influence of stimulation pulse frequency on the generation of joint moments
in the upper limb. Biomedical Engineering, IEEE Transactions on. 1990;37(3):317-322.
106. Dreibati B, Lavet C, Pinti A, Poumarat G. Influence of electrical stimulation frequency on skeletal
muscle force and fatigue. Annals of Physical and Rehabilitation Medicine. 2010;53(4):266-277.
107. Ferry B, Poumarat G. Effects of frequency on muscular force induced by electric stimulation. Arch
Int Physiol Biochim Biophys. 1994;102(6):319-324.
108. Benton LA. Functional electrical stimulation: A practical clinical guide. Rancho Los Amigos
Rehabilitation Engineering Center, Rancho Los Amigos Hospital; 1980.
109. Jones D, Bigland-Ritchie B, Edwards R. Excitation frequency and muscle fatigue: Mechanical
responses during voluntary and stimulated contractions. Exp Neurol. 1979;64(2):401-413.
110. Moreau D, Dubots P, Boggio V, Guilland JC, Cometti G. Effects of electromyostimulation and
strength training on muscle soreness, muscle damage and sympathetic activation. J Sports Sci.
1995;13(2):95-100.
111. Paillard T. Combined application of neuromuscular electrical stimulation and voluntary muscular
contractions. Sports Medicine. 2008;38(2):161-177.
112. Eriksson E, Haggmark T. Comparison of isometric muscle training and electrical stimulation
supplementing isometric muscle training in the recovery after major knee ligament surgery. A preliminary
report. Am J Sports Med. 1979;7(3):169-171.
113. Stevens JE, Mizner RL, Snyder-Mackler L. Neuromuscular electrical stimulation for quadriceps
muscle strengthening after bilateral total knee arthroplasty: A case series. Journal of Orthopaedic &
Sports Physical Therapy. 2004;34(1):21-29.
77
114. Wigerstad-Lossing I, Grimby G, Jonsson T, Morelli B, Peterson L, Renstrom P. Effects of electrical
muscle stimulation combined with voluntary contractions after knee ligament surgery. Med Sci Sports
Exerc. 1988;20(1):93-98.
115. Eriksson E. Reconstruction of the anterior cruciate ligament. Orthop Clin North Am. 1976;7(1):167-
179.