effect of different types of mole drains composition …
TRANSCRIPT

J. Soil Sci. and Agric. Eng., Mansoura Univ., Vol. 2 (1): 109 - 120, 2011
EFFECT OF DIFFERENT TYPES OF MOLE DRAINS COMPOSITION ON SOME CLAY SOIL PROPERTIES AND WHEAT YIELD El-Adl, M. A. Agric. Eng. Dept., Faculty of Agric., Al-Mansoura University.
ABSTRACT
The effects of different types of mole drains on some clay soil properties and
wheat yield were tested in this study. The experimental studies were conducted in heavy clay soil. Moles were composed of 3 different materials; compost, sand and mixture of compost with sand (1:1). Two depths of moles (0.3 and 0.5 m) and three distances among moles (10, 15 and 20 m) were investigated in this work. The results indicated that:
- The Piezometric head increases as the distance among moles increases and vice versa. At each mole spacing, the Piezometric head decreases as the time advances after irrigations. However, the 10 m mole spacing achieved the best significant results over the 15 and 20 m spacing.
- The highest yield (2737 kg/fed) was obtained by using compost, 10 m distance among moles and 0.5 m moles' depth.
- Decreasing distance among moles, increases yield, penetration resistance (PR), hydraulic conductivity (Kh) and infiltration rate.
- Increasing mole depth, increases yield, (Kh) and infiltration rate while decreases (PR).
Keywords: Mole drains, subsurface drainage, clay soil properties, crop residues,
Wheat.
INTRODUCTION
Wheat is the first popular crop not only in Egypt but also in the world. The cultivated area of wheat in Egypt reached about 2920384 fed. during 2007/2008. This area produced about 7885036 Mg of grain yield according to "Important Indicators of The Agricultural Statistics (2009)".
Walter et al. (1979) reported that subsurface drainage improves the moisture and aeration conditions of the soil resulting in increased crop production.
For many centuries, it has been noticed that the capacity of soils to produce crops is affected by the amount of soil content of organic matter (Abdel-Gaffar, 1982). The organic matter of soil is a key attribute of its fertility. The addition of organic materials such as, crop residues play an important role in the recycling of nutrients (IAEA, 2003). Plant residues are essential for maintaining soil productivity acting as a source of nutrients (Kumar and Goh, 2000).
In Egypt, Hamdi and Alaa El-Din (1982) stated that about 11 million Mg of agricultural residues per year are produced by different crops. Most of these residues are rice, wheat straws, cotton, maize and sorghum stalks. The utilization of these residues at present is largely for burning, industry or as animal feed. Little is composted as organic manure. Also, it is beneficial to use organic materials on a large scale in agriculture especially with the recent

El-Adl, M. A.
110
rises in prices of the chemical fertilizers which have affected the agricultural production throughout the world and had a violent impact on Egypt.
The organic matter can increase soil productivity by improving soil physical and chemical properties and release nutrients to the soil mostly through plant residues decomposition (Goh et al. 2001).
Gilley and Risse (2000) reported that the farm crop residue must be grinding before adding to the soil as a fertilizer to reduce the runoff and soil erosion. Nigm, et al. (1996) found that water holding capacity tended to increase proportionally by increasing the quantity of saw-dust mixed with soil. They concluded also that saw-dust is a beneficial amendment to improve the physical properties of soils.
The main objective of this work was to study the effect of different types of mole drains composition on clay soil properties and/or wheat yield improvement.
MATERIALS AND METHODS
The experimental site: During the winter season of 2010, a field experiment of about 2.5 fed.
(10800m2) area was carried out at Al-Gemmeiza Agric. Research Station, Al-Gharbia Governorate. The soil characteristics of the experimental site are presented in Tables (1) and (2). Table (1): Soil mechanical analysis of the experimental site,
Al-Gemmeiza Agricultural Research station. Soil depth,
m
Sand, % Silt, % Clay, %
Soil texture class coarse, % fine, % total, %
0 – 0.3 2.00 9.35 11.35 36.10 52.55 Silty clay loam
0.3 – 0.6 1.29 11.82 13.11 38.62 48.27 Silty clay loam
Table (2): Physical and chemical soil properties of Al-Gemmeiza Agricultural Research station
Soil depth, m
pH, 1:2.5
(susp.)
EC, dS/cm
Organic carbon,
%
Total N, %
C/N ratio
Available N, ppm
Available P, ppm
Available K, ppm
0 –0.3 7.85 5.26 1.40 0.14 10.00 31.27 11.45 353.00
0.3–0.6 7.91 5.83 1.08 0.11 9.82 28.15 8.79 348.00
Seed bed preparation: The seed bed was prepared using the chisel plough in two
perpendicular directions at 0.20 m depth, followed by rotary plough. Then, the soil was leveled using a hydraulic land leveler. Underground moles holing:
A locally manufactured ditcher was used to hole underground moles. The ditcher was operated using a Ford-Tw 10 tractor (90 kW). Fig. (1) reveals the outlook of ditcher components.
The completed conformations of compost, sand and mixed "compost + sand 1:1" were placed into underground moles of 0.65 m width with a rate of 25 to 80 m
3/fed. as shown in Table (3) under the different moles distances
and depths.

J. Soil Sci. and Agric. Eng., Mansoura Univ., Vol. 2 (1), January, 2011
111
Fig. (1): The outlook of ditcher components.
Table (3): Amount of added materials, m3/fed.
Moles depth, m Moles distance, m
B1 = 10 B2 = 15 B3 = 20 C1 = 0.30 50 35 25 C2 = 0.50 80 60 40
Treatments: The experimental site included; Three different added materials inside underground moles: compost
(as rich materials with organic mater), sand, and mixed compost and sand "1 : 1" (A)
Three distances between moles: 10 m, 15 m and 20 m (B) Two mole depths: 0.3 m and 0.5 m (C).
Therefore, the different treatments (Ti) may be classified as follows: Treatments symbols Treatments components
T1 *A1 *B1 *C1
T2 A1 B1 C2
T3 A1 B2 C1
T4 A1 B2 C2
T5 A1 B3 C1
T6 A1 B3 C2
T7 A2 B1 C1
T8 A2 B1 C2
T9 A2 B2 C1
T10 A2 B2 C2
T11 A2 B3 C1
T12 A2 B3 C2
T13 A3 B1 C1
T14 A3 B1 C2
T15 A3 B2 C1
T16 A3 B2 C2
T17 A3 B3 C1
T18 A3 B3 C2 * A1: compost ; A2: sand ; A3: compost + sand * B1: 10 m ; B2: 15 m ; B3: 20 m * C1: 0.3 m ; C2: 0.5 m

El-Adl, M. A.
112
Experimental layout:
20.0m distance between moles
80m
15.0m distance between moles
60m
10.0m distance between moles
40m
T12
T11 T4 T3 T14 T13
T6 T5 T16 T15 T8 T7
60
.0m
T18 T17 T10 T9 T2 T1
0.50m depth
0.30m depth
0.50m depth
0.30m depth
0.50m depth
0.30m depth
Fig. (2): Experimental layout and the different treatments.
Wheat mechanical drilling:
The selected wheat seeds of Gimmeza 10 variety were mechanically drilled at a rate of 50 kg/fed. using a TYE type seed drill, which was operated using 45 kW Nasser tractor. Then, all the agricultural practices were applied according to the recommendations of the Wheat Res. Dept., Field Crops Inst., Ag. Res. Center, Ministry of Agriculture and Land Reclamation.
The basal doses of N, P, K were applied according to the recommendations of Al-Gemmeiza Res. Station. Measurements: Penetration resistance:
A Japanese cone penetrometer, model SR-2Dik 5500 was used to measure the penetration resistance. This measurement was done 4 times. The first 3 times, each one was taken 10 days after the primary three irrigations, while the latest was taken directly before harvesting. Soil bulk density:
Soil bulk density (Db, g/cm3) was determined using the core methods (Vomocil, 1986) Hydraulic conductivity:
Hydraulic conductivity (cm/h) was determined using undisturbed soil cores using a constant water head, settling percentage of the soil aggregates was determined in soil aggregates of 2-5 mm size, as the method described by Williams and Cooke (1961) and soil moisture characteristics were determined using the method outlined by Stakman (1969). Soil pH:
Soil pH in soil water suspension (1:2.5) and soil electrical conductivity (EC, dSm-1) in soil paste extract were measured. Infiltration rate:
It was measured by using cylinder method (double ring) infiltration, (Garcia, 1978).
Sand Compost Mixed
Compost Mixed Sand
Mixed Sand Compost

J. Soil Sci. and Agric. Eng., Mansoura Univ., Vol. 2 (1), January, 2011
113
Piezometric head: The Piezometric head was measured according to Israelsen and Hansen (1962) by driving a pipe of 3.81 cm inner diameter and 100 cm length in a drilled hole, to a constant horizontal level in all test points of the field. Three piezometers were installed in each treatment to observe the Piezometric head. Measurements were taken at 1, 3, 5 and 10 days after irrigations. Actual water consumptive use (CU):
Actual water consumptive use (CU) of wheat crop was determined. Gravimetric soil samples, from soil surface down to 60 cm depth, were collected after sowing, before and after each irrigation and at harvest time to determine water consumptive use values. The CU value was calculated according to Israelsen and Hansen, 1962 as follows:
)1.......(100
)(4
1
12 DCU b
i
i
Where: CU = seasonal water consumptive use (cm),
2 = soil moisture content after irrigation (on mass basis, %),
1 = soil moisture content before irrigation (on mass basis, %),
b = Soil bulk density (g/cm3), D = Depth of soil layer (15 cm each), and i = Number of soil layer.
Water Use Efficiency "WUE"
Water use efficiency (WUE) was determined according to Awady et al. (1976) and Bos (1980) using the following equation:
)2......(//
/ 3
3mkg
fedmwaterappliedofAmount
fedkgyieldAverageWUE
Statistical analysis Statistical analysis was done for the experiment according to Bisher and
El Robi (1979).
RESULTS AND DISCUSSION
Penetration resistance (PR) Table (4) shows the effect of added materials (compost, sand and mixed
material of compost and sand) on soil penetration resistance. Data indicated that the penetration resistance values varied in a small range between 2.29 and 2.46 MPa. Higher penetration resistance (PR) values were attained using the sand, where smaller values were obtained with compost treatment. For the mixed added materials the PR values were in between treatments.
Mole depth affected the PR values. Increasing mole depth decreases (PR) values. On the other hand, decreasing distance between moles decreases (PR) values for all treatments.

El-Adl, M. A.
114
Table (4): The effect of different treatments on soil penetration resistance (MPa)
Distance between moles,
m
Depth of moles, m
Added materials
Compost Sand Mixed
10 0.30 2.33 2.45 2.41
0.50 2.29 2.37 2.33
15 0.30 2.39 2.43 2.41
0.50 2.31 2.38 2.34
20 0.30 2.43 2.46 2.44
0.50 2.38 2.42 2.40
Control 3.01 MPa
In general, PR values in all treatments were less than the control
treatment (3.01 MPa).
Soil bulk density (Db) Data in Table (5) shows effect of different treatments on bulk density
values. Data indicated that, Db values varied between 1.24 and 1.37 g/cm3. The highest value obtained from treatment No. 18 but the lowest obtained from the first treatment.
Table (5): The effect of different treatments on bulk density
Distance between moles, m
Depth of moles, m Added materials
Compost Sand Mixed
10 0.30 1.24 1.32 1.26
0.50 1.26 1.35 1.30
15 0.30 1.27 1.35 1.28
0.50 1.29 1.37 1.31
20 0.30 1.29 1.36 1.30
0.50 1.31 1.37 1.33
Control 1.38 g/cm3
Generally it may be concluded that for all treatments the lowest values
of Db were obtained with compost treatments where the highest values were obtained with sand treatments. While the mixed added material (sand + compost) treatment values lied in between the compost and sand treatments.
Decreasing distance between moles decreases Db values but increasing depth of moles decreases Db values.
Also, data indicated that, Db values in all treatments were less than the control value (1.38 g/cm3). Hydraulic conductivity (Kh)
Hydraulic conductivity is affected by any factors which have effect on soil porosity such as addition of sand or compost and mole depth or distance between them.
Data in Table (6) shows the effect of different treatments on soil hydraulic conductivity.
J. Soil Sci. and Agric. Eng., Mansoura Univ., Vol. 2 (1), January, 2011
115
Table (6): The effect of different treatments on soil hydraulic conductivity (cm/hr)
Distance between moles, m
Depth of moles, m Added materials
Compost Sand Mixed
10 0.30 0.73 0.61 0.69
0.50 0.78 0.63 0.72
15 0.30 0.70 0.60 0.64
0.50 0.74 0.59 0.66
20 0.30 0.65 0.58 0.60
0.50 0.61 0.58 0.62
Control 0.58 cm/hr
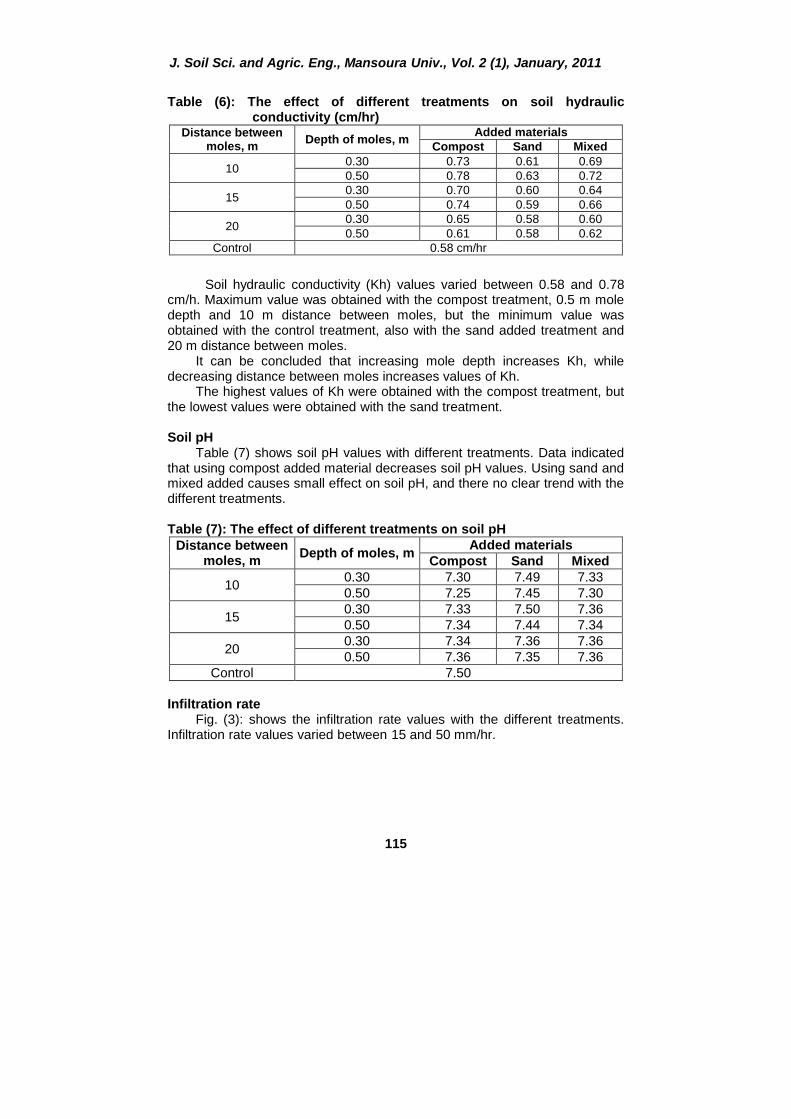
Soil hydraulic conductivity (Kh) values varied between 0.58 and 0.78
cm/h. Maximum value was obtained with the compost treatment, 0.5 m mole depth and 10 m distance between moles, but the minimum value was obtained with the control treatment, also with the sand added treatment and 20 m distance between moles.
It can be concluded that increasing mole depth increases Kh, while decreasing distance between moles increases values of Kh.
The highest values of Kh were obtained with the compost treatment, but the lowest values were obtained with the sand treatment. Soil pH
Table (7) shows soil pH values with different treatments. Data indicated that using compost added material decreases soil pH values. Using sand and mixed added causes small effect on soil pH, and there no clear trend with the different treatments.
Table (7): The effect of different treatments on soil pH
Distance between moles, m
Depth of moles, m Added materials
Compost Sand Mixed
10 0.30 7.30 7.49 7.33
0.50 7.25 7.45 7.30
15 0.30 7.33 7.50 7.36
0.50 7.34 7.44 7.34
20 0.30 7.34 7.36 7.36
0.50 7.36 7.35 7.36
Control 7.50
Infiltration rate
Fig. (3): shows the infiltration rate values with the different treatments. Infiltration rate values varied between 15 and 50 mm/hr.

El-Adl, M. A.
116
0
5
10
15
20
25
30
35
40
45
50
Co
ntr
ol
T1
T2
T3
T4
T5
T6
T7
T8
T9
T1
0
T11
T1
2
T1
3
T1
4
T1
5
T1
6
T1
7
T1
8
Infil
tra
tio
n r
ate
, m
m/h
r
Compost Sand Mixed
Fig. 3: Infiltration rate values at different treatments.
Data in Fig. 3 indicated that infiltration rate values varied between 35.0 and 44.0 mm/hr, while the control treatment was 15.0 mm/hr. Generally it can be said that, added materials, distance between moles and depth of moles had clear effect on infiltration rate values. The highest values were obtained with the sand but the lowest were obtained with Piezometric head compost while mixed added treatment was in between. Increasing mole depth increases infiltration rate values while increasing distance between moles decreases infiltration rate values.
It can be concluded that infiltration rate values were very high with all treatments compared with the control treatment. Piezometric head
The Piezometric head for the mole depths of 0.3 and 0.5 m treatments was not significantly different; while it was significantly different for the mole spacing of 10, 15 and 20 m. The added materials of sand and/or mixed treatments had also no significant effect on the Piezometric head; while the compost treatments affected significantly the Piezometric head. Fig. 4 indicates the Piezometric head for different treatments summarized over the significant results of compost treatments.
It may be concluded that the Piezometric head increases as the distance among moles increases and vice versa. At each mole spacing, the Piezometric head decreases as the time advances after irrigations. However, the 10 m mole spacing achieved the best significant results over the 15 and 20 m spacing.

J. Soil Sci. and Agric. Eng., Mansoura Univ., Vol. 2 (1), January, 2011
117
Fig.4: Average Piezometric head for the significant compost
treatments
0
10
20
30
40
50
60
70
80
90
100
Pie
zo
metr
ic h
ead
,cm
Control One day after irrigation 3 days after irrigation
5 days after irrigation 10 days after irrigation
10 m mole spacing 15 m mole spacing 20 m mole spacing
Actual water consumptive use (CU) Actual water consumptive use (CU) was about 4425 m
3 for all treatments
because there was no difference between irrigation treatments. Yield
Table (8) shows the effect of different treatments on yield. Data indicated that highest yield (2737 kg/fed) was obtained by using compost addition, 0.50m depth and 10 m distance between moles. While the lowest value (1510 kg/fed) was obtained with the control treatment. Also data indicated that, depth of moles and distance between them has significant effect on yield. Increasing distance between moles decreases yield, while increasing depth of moles increases yield. On the other hand, compost treatment achieved the highest yield, but the sand treatment yielded the lowest value while the mixed treatment was in between. Water use efficiency (WUE)
Data in table (8) shows the water use efficiency (WUE) for the different treatments. WUE values varied between 0.34 and 0.62 kg/m3. The highest value was obtained with the compost addition, 10 m distance between moles and 0.5 m depth of moles; while the lowest value was obtained with the control treatment. It has been noticed that mole depths and distance among moles had strong effect on yield and WUE. Increasing mole depth increases yield, while increasing distance between moles decreases yield. On the other hand the compost treatments produced maximum yield but the minimum values were attained with the sand treatments; while yield values were in between for the mixed addition. The same trend was obtained for the WUE. Statistical analysis
The regression analysis for the effect of addition type, distance between moles and moles depths on wheat crop yield cleared the high significant effect between the studied parameters interactions in crop yield. Also the

El-Adl, M. A.
118
analysis explain that the addition type and the distance between moles have the inversely proportion to the wheat crop yield while the mole depth has a directly proportion. From the regression analysis the distance between moles is the high effect on the wheat crop yield then the mole depth and the last effect is the addition type. Table (8): The effect of different treatments on yield and water use
efficiency (WUE)
Distance between moles, m
Depth of moles, m
Added materials
Compost Sand Mixed
Yield, k/fed
WUE, kg/m
3
Yield, k/fed
WUE, kg/m
3
Yield, k/fed
WUE, kg/m
3
10 0.30 2288 0.52 2107 0.48 2152 0.49
0.50 2737 0.62 2177 0.49 2244 0.51
15 0.30 1880 0.42 1575 0.36 1728 0.39
0.50 2032 0.46 1736 0.39 1867 0.42
20 0.30 1582 0.36 1545 0.35 1537 0.35
0.50 1802 0.41 1580 0.36 1664 0.38
Control Yield = 1510 kg/fed WUE = 0.34 kg/m3
Conclusions The following conclusion may be drawn: Soil - Increasing mole depth decreases penetration resistance (PR) while
increases infiltration rate and soil hydraulic conductivity (Kh). - Increasing mole distance decreases (Kh) and infiltration rate, while
increases (PR). - Compost has the highest effect on improving clay soil, while sand has the
lowest effect and the mixed "compost and sand" was in between. - The Piezometric head increases as the distance among moles increases
and vice versa. At each mole spacing, the Piezometric head decreases as the time advances after irrigations. However, the 10 m mole spacing achieved the best significant results over the 15 and 20 m spacing.
Yield - The highest yield (2737 kg/fed) was obtained by using compost, 0.5 m mole
depth and 10 m distance between moles. Water Use Efficiency (WUE) - Maximum value of WUE (0.62 kg/m3) was obtained with the compost, 0.5 m
mole depth and 10 m distance between moles. Statistical analysis: - Regression analysis indicated that, the distance between moles has the
highest effect on crop, then the mole depth and the added materials has the lowest effect.

J. Soil Sci. and Agric. Eng., Mansoura Univ., Vol. 2 (1), January, 2011
119
REFERENCES
Abdel-Gaffar, A.S. (1982). The significance of organic materials to Egyptian agriculture and maintenance of soil productivity. FAO, Soils Bull. 45:15-21. FAO, of U.N Rome. Italy.
Awady, M.N.; G.W. Amerhom and S.M. Zaki (1976). Trickle irrigation trial on pea in conditions of Qalubia Egypt J. Hort. 3, No. 1, pp. 99-110.
Bisher, M. A. and M. El- Robby (1979). Introduction to statistical analysis and designs of experiments. Crop Dept.,of Agric.,Alex. Univ., Egypt.23-25p.
Bos, M.G. (1980). Irrigation efficiencies at crop production level. Internal Comm. on irrigation and drain. Bul.
Garcia, I. (1978). Soil water engineering. Laboratory Manual Department of Agric. And Chemical Engineering, Colorado State Univ. Fort Collins, Colorado, USA.
Gilley,J.E. and L.M. Risse (2000). Runoff and soil loss as affected by the application of manure. Trans of the ASAE, 43 (6): 1583-1588.
Goh, K.M.; D.R. Pearson and M.J. Daly (2001). Soil physical, chemical and biological indicators of soil quality in conventional, biological and integrated apple orchard management systems. Biol. Agric. Hortic., 18:269-292.
Hamdi, Y.A. and M.N. Alaa El-Din (1982). Country Report- Egypt. FAO. Soils Bull. 45:259-262. FAO of the U.N. Rome.
IAEA (2003): Management of crop residues for sustainable crop production. IAEA-TECDOC-1354.
Important Indicators of The Agricultural Statistics (2009). Arab republic of Egypt, Ministry of Agriculture and Land Reclamation Economic affairs Sector. Summer and Nile Crops (2008).
Israelsen, O.W. and V.E. Hansen (1962). Irrigation principles and practices. 3rd Edi. John Wiley and Sons. Inc. New York.
Kumar, K. and K.M. Goh (2000). Crop residues and management practices effect on soil quality, soil nitrogen dynamics, crop yield and nitrogen recovery. Adv. Agron., 68:197-319.
Nigm, M.A.; H. EL-Zahr and R.G. Kerlous (1996). Utilization of NPK through two successive seasons from a calcareous soil amended with saw-dust and farmyard manure. Monofiya J. Agric. Res. 21 (6): 1603-1615.
Stakman, W.P. (1969). Determination of soil moisture retention curves. I. Sand-box apparatus. II. Pressure membrane apparatus. ICU, Wageningen, The Nether lands.
Vomocil, J.A. (1986). Particle-Size Analysis " in : Methods of Soil Analysis " C.F. Klute, A. (Ed.) Part 1- Agron. 9, 15:299, Am. Soc. Agron. Madison, Wisconsin, U.S.A.
Walter M. F., R. D. Black. and P. J. Zwerman (1979). Tile flow response in a layered soil, Impact of the subsurface drainage on water quality. Trans. Of ASAE., 22(1): 577-581.
Williams, R.J.B. and Cooke, G.W. (1961). Some effects of farmyard manure and of grass residues on soil structure. Soil Sci., 92:30-37.

El-Adl, M. A.
120
رأأ الأنلتا أأةلأنلة ا أأةلألأةلألفكااأأ ملأفرأأ املأنلفأأال لأ أأ تأأير الأنواأأانملأنلف ت أألأاإات ج ةلأفحراللأنلقفح
لأفحسنلأ دلأنلسلاملأنلعدللأج فعةلأنلفارااةلألأ–ك ةلأنل ان ةلألأ–قسملأنلهادسةلأنل ان ةلأ
صرف وذلك لكا الأ كر من أهم المشاكل التى تعانى منها الأراضى الطٌنٌة هى سوء عملٌة ال السلبى على خصائص التربة وبالتالى على إنتاج المحاصٌل المنزرعة فٌها.
وقد تم إختٌار موقع التجربة فى مزرعة محطة بحكو الجمٌكزك كنمكوذج لضراضكى الطٌنٌكة . كذل تم إختٌار محصول القمك صكنف 9002/9000ال قٌلة فى منطقة الدلتا خلال الموسم الشتوى
حٌ أن محصول القم ٌعتبر من أهم المحاصٌل الإستراتٌجٌة بمصر والعالم. 00جمٌزك وقد تم عمل مصارف المولز بأرض التجربة بهدف تحسكٌن خكواص التربكة ورفكع الإنتاجٌكة
المتحصل علٌها من وحدك المساحة. وقد كانت معاملات التجربة كما ٌلى: متر 03.0 – 03.0عمق مصارف المولز:
متر 9030 – 0.30 – 0030ارف المولز: المسافة بٌن مص( وذل بمعدلات 0: 0خلٌط كمبوست+رمل ) –رمل –مواد الإضافة فى مصارف المولز: كمبوست
متر مكعب/فدان 00الً .9من هذا بالإضافة إلى المعاملة الكنترول. وكان نظام الرى هو رى سطحى تقلٌكدى بمعكدل ابكت
فى المنطقة. لجمٌع المعاملات بالكمٌات المتبعةلأأهملأنلات ج:
زٌكادك عمكق مصكارف المككولز ٌكىدى إلكى خمكض مقاومككة إختكراق التربكة بٌنمكا ٌزٌككد مكن قٌمكة معككدل - الرش .
صغر المسافة بٌن مصارف المولز أدى إلى خمض مقاومة التربة للإختراق وزٌادك معدل الرش . -لم تكن هنا فروق معنوٌة لتأ ٌرات عمق مصارف المولز أو معاملات الرمل أو الخلٌط مكن الرمكل -
والكمبوست علً الضاغط البٌزومتري بٌنما فً معاملة الكمبوست ٌزداد الضاغط البٌزومتكري كلمكا زادت المسافة بٌن مصارف المولز والعكس صحٌ . عند كل معاملة من معاملات المسافات ٌتناقص
متكر بكٌن 00الضاغط البٌزومتري بزٌادك عدد الأٌام بعد عملٌكة الكري. حققكت معاملكة المسكافة علكً مصارف المولز أحسن النتائج المعنوٌة.
03.0كجم/ف وتم الحصول علٌها من المعاملة كمبوسكت + 92.2أكبر إنتاجٌة تم الحصول علٌها - .متر مسافة بٌن المولز 0030متر عمق مصارف المولز +
( تككم الحصككول علٌهككا مككن المعاملككة كمبوسككت + .كجككم/م 03.9أقصككى كمككاءك لإسككتخدام مٌككا الككرى ) - متر مسافة بٌنها. 0030متر عمق مصارف المولز + 03.0
ق ملأ تحك ملأنل حث
ج فعةلأنلفارااةلأ–ك ةلأنل ان ةلألألألأافض نلأفحفادلأه ائلأ دلأنلع أ.دلأ/لأ نل ق قج فعةلألأ–ان ةلأك ةلأنل لأ دلأنلع لأحسنفحفادلألأأ.دلأ/لأ