effect of diet composition on the - usp theses
TRANSCRIPT


EFFECT OF DIET COMPOSITION ON THE
UTILIZATION OF COPRA MEAL BY
FINISHING BROILER CHICKENS
by
Ashika Devi
A thesis submitted in fulfillment of the
requirements for the degree of
Master of Agriculture
Copyright © 2016 by Ashika Devi
School of Agriculture and Food Technology
Faculty of Business and Economics
The University of the South Pacific
September, 2016

ii
DECLARATION OF ORIGINALITY
Statement by Author
I, Ashika Devi, declare that this thesis is my own work and literature cited has been
duly acknowledged.
Signature Date:
Ashika Devi
ID No. S02002322
Statement by Supervisor(s)
I hereby confirm the declaration of originality of this work by the author, Ms. Ashika
Devi (s02002322), who worked under my direct supervision.
Signature…………………………… Date:
Dr. Siaka S. Diarra
Principal supervisor
I hereby confirm the declaration of originality of this work by the author, Ms. Ashika
Devi (s02002322), who worked under my direct supervision.
Signature…………………………… Date:
Dr. Jagdish Bhati
Co-supervisor

iii
ACKNOWLEDGEMENTS
I would like to acknowledge all those persons and institutions who contributed in one
way or the other to the successful completion of this work.
I thank my grandparents, sisters, other family members and friends for their
continued support and encouragement as well as the Research Office of University of
the South Pacific for funding the research (Grant No. 6D350-1111).
I am very grateful to my supervisors Dr. Siaka Diarra and Dr. Jagdish Bhati senior
lecturers USP Alafua campus, I say thank you so much for your continued guidance
and support throughout the duration of the program. Without your support, assistance
and guidance this thesis would not have been possible. You have been very
wonderful supervisors, full of knowledge. Your commitment and sacrifice in this
research means a lot to me. It was always a pleasure to discuss technical aspects of
poultry production with Dr. Diarra. May God bless you and grant you good health
and long life.
My special thanks to Mrs. Veronica Diarra, for providing soybean seeds used in this
research. Madam, you and your family have been always very welcoming, generous
and kind to me. I appreciate so much for all that you have done for me.
My sincere appreciations go to Professor V. Ravindran of Massey University for
analysis of protein sources at the University laboratory.
My appreciations go to my friends (Poasa Vuki, Sangita Devi Maharaj, Kabure
Tirega Taake, Takili Tairi, Jiaoti Werekoro, Akeneta Waqatasere, Shalvin Singh, and
Ramasima Tabualevu) for assisting me with one aspect or the other during the
experimental period. My appreciations go to Dr. Sanjay Anand for providing
technical assistance in my thesis. I also wish to appreciate USP IRETA livestock
farm supervisor, Mr. Uga Luaupu and his staff for their availability throughout the
experimental period. Finally, let me sincerely thank Mrs. Gavidi Tupou, the
Education Officer from professional development unit for her encouraging words
and advice as well as the Public Service Commission and the Ministry of Education
of Fiji for granting study leave.
May the Almighty God reward you all abundantly.

iv
ABSTRACT
The scarcity and high cost of traditional protein sources call for more research into
improving the utilization of alternative sources. The effect of dietary protein sources
on the utilization of copra meal by broilers was investigated. Five finisher diets (D1,
D2, D3, D4 and D5) containing 20% crude protein were formulated. The control diet
(D1) was based on three traditional protein sources (fish meal, meat and bone meal
and soybean meal). The other diets (D2, D3, D4, and D5) contained copra meal with
different combinations of these traditional protein sources. A total of 100, 21-day old
Cobb 500 broilers (777.2 ± 11.4g; 1.5 CV) were allocated to 20 floor pens. Each diet
was fed to birds in 4 pens in a completely randomized design for 3 weeks. During
week one, feed intake increased on D5 and weight gain increased on D2 and D5
(P<0.05). The best feed conversion ratio (P<0.05) occurred on D2. Birds fed D1 and
D5 gained more weight (P<0.05) during week two. Feed conversion ratio was not
affected by the diet in weeks 2 and 3. In week three, gain was maximized on diet 2
(P<0.05) and there were no dietary effects on feed intake and feed conversion ratio
(P>0.05). Dressing percentage was depressed (P<0.05) on D4. Breast yield was
reduced on D3 and D4 (P<0.05). There were no dietary effects on thigh and
drumstick yields (P>0.05). Most segments of the gut and their digesta content
weighed lighter (P<0.05) on D5. There were no dietary effects on weight of
proventriculus, gizzard, and caeca. Feed cost per kilogram carcass was reduced
(P<0.05) on D2. Digestibility of DM, CP, CF and Fat was improved (P<0.05) on diet
2. It was concluded, that animal protein-based diets improve the utilization of 15%
copra meal by finishing broilers compared to diets containing soybean meal. Further
research into higher levels of copra meal in animal protein-based diets is warranted.

v
LIST OF ACRONYMS
AAA
ALFID
Amino Acid Analysis
Australian Livestock Feed Ingredient Database
AOAC Association of Official Analytical Chemists
CYS Cystine
FAO Food and Agriculture Organization
GLM Generalized Linear Model
IFFOO International Fishmeal and Fish Oil Organization.
MET Methionine
NRC National Research Council
NSP Non Starch Polysaccharides
OECD
OM
Organization for Economic Cooperation and Development
Organic matter
RP-HPLC Reserved-phase High-performance Liquid Chromatography
SPSS Statistical Package for Social Sciences
SSF Solid State Fermentation
ST$ Samoan Tala
US$ United States Dollar

vi
TABLE OF CONTENTS
Acknowledgments iii
Abstract iv
List of Acronyms v
CHAPTER ONE: INTRODUCTION 1
1.1 Background information 1
1.2 Problem statement 3
1.3 Hypothesis 4
1.4 Objectives 4
CHAPTER TWO: LITERATURE REVIEW 5
2.1 Nutritional requirements of broiler chickens 5
2.1.1 Energy requirements 5
2.1.2 Protein and amino acid requirements 6
2.1.3 Vitamin and mineral requirement 7
2.2 Feed consumption and weight change of broiler chickens 9
2.3 Broiler carcass 11
2.4 Some traditional protein sources for poultry 11
2.4.1 Fish meal 12
2.4.2 Meat and bone meal 13
2.4.3 Soybean meal 13
2.5 Copra meal as protein sources in broiler diets 14
2.5.1 Composition of copra meal 15
2.5.2 Recommendations of copra meal in broiler diets 15
2.5.3 Factors affecting utilization of copra meal by broilers 15
2.5.4 Feed technologies for improving utilization of copra meal by broilers 16
2.5.4.1 Enzyme supplementation 16
2.5.4.2 Amino acid supplementation 16
2.5.4.3 Soaking 16
2.5.4.4 Pelleting 17
2.5.4.5 Diet dilution 17
2.5.4.6 Choice feeding 17

vii
CHAPTER THREE: MATERIALS AND METHODS 19
3.1 Site of experiment 19
3.2 Traditional protein sources and diet formulation 19
3.3 Experimental broilers and management 22
3.4 Data collection 22
3.4.1 Growth performance data 22
3.4.2 Nutrient digestibility 22
3.4.3 Carcass and organ measurements 23
3.4.4 Feed cost of meat production 23
3.5 Data analysis 24
3.5.1 Chemical analysis 24
3.5.1.1 Proximate analysis 24
3.5.1.1.1 Dry matter and ash determination 24
3.5.1.1.2 Determination of crude protein and amino acid
profile
24
3.5.1.1.3 Determination of crude fibre 25
3.5.1.1.4 Determination of ether extract or fat 26
3.5.1.1.5 Nitrogen free extract (NFE) and metabolisable
energy (ME)
27
3.5.2 Statistical analysis 27
CHAPTER FOUR: RESULTS 28
4.1 Growth performance of broiler chicken 28
4.2 Nutrient digestibility 30
4.3 Dressing out percentage and some carcass cut-up parts 30
4.4 Organ weights 31
4.5 Feed cost of broiler meat production 33
CHAPTER FIVE: DISCUSSION 34
5.1 Chemical analysis 34
5.2 Growth performance 34
5.3 Nutrient digestibility 36
5.4 Dressing percentage and some carcass cut-up parts 36
5.5 Organ weights 37
5.6 Feed cost of broiler meat production 37

viii
CHAPTER SIX: SUMMARY, CONCLUSION & RECOMMENDATIONS 38
LIMITATIONS OF THE STUDY 39
REFERENCES 40
APPENDICES 60

ix
LIST OF TABLES
Table 1 Nutrient requirements of broilers fed with diets of two feeding phases 9
Table 2 Average feed consumption and body weight change of Cobb broiler 10
Table 3 Proximate composition, ME and NSP contents of the experimental
protein source
20
Table 4 Amino acid composition of the experimental protein sources 20
Table 5 Ingredient composition and calculated analysis of broiler finisher diets 21
Table 6 Growth performance of finishing broilers fed copra meal in combination
with different protein sources
29
Table 7 Nutrient digestibility of the broiler chickens fed copra meal with
different combinations of traditional protein sources (%DM)
30
Table 8 Dressing out percentage and some carcass cut up parts of broiler
chickens fed copra meal in combination of different protein sources
31
Table 9 Organ weights of broilers fed copra meal with different combinations of
traditional protein sources
32
Table 10 Feed cost of meat production of broilers fed copra meal with different
combinations of traditional protein sources
33

x
LIST OF APPENDICES
Appendix 1 ANOVA for daily feed intake in week 1 60
Appendix 2 ANOVA for daily weight gain in week 1 60
Appendix 3 ANOVA for feed conversion ratio in week 1 61
Appendix 4 ANOVA for final body weight in week 1 61
Appendix 5 ANOVA for daily feed intake week 2 62
Appendix 6 ANOVA for daily weight gain week 2 62
Appendix 7 ANOVA for feed conversion ratio week 2 63
Appendix 8 ANOVA for final body weight week 2 63
Appendix 9 ANOVA for daily feed intake week 3 64
Appendix 10 ANOVA for daily weight gain week 3 64
Appendix 11 ANOVA for feed conversion ratio week 3 65
Appendix 12 ANOVA for final body weight week 3 65
Appendix 13 ANOVA for mean daily feed intake 66
Appendix 14 ANOVA for mean daily weight gain 66
Appendix 15 ANOVA for mean feed conversion ratio 67
Appendix 16 ANOVA for dressing percentage 67
Appendix 17 ANOVA for breast muscle weight 68
Appendix 18 ANOVA for thigh weight 68
Appendix 19 ANOVA for drumstick weight 69
Appendix 20 ANOVA for liver weight 69
Appendix 21 ANOVA for empty crop weight 70
Appendix 22 ANOVA for digesta weight in the crop 70

xi
Appendix 23 ANOVA for empty proventriculus weight 71
Appendix 24 ANOVA for weight of digesta in proventriculus 71
Appendix 25 ANOVA for weight of empty gizzard 72
Appendix 26 ANOVA for weight of digesta in gizzard 72
Appendix 27 ANOVA for weight of pancreas 73
Appendix 28 ANOVA for weight of empty small intestine 73
Appendix 29 ANOVA for weight of digesta in small intestine 74
Appendix 30 ANOVA for weight of empty caeca 74
Appendix 31 ANOVA for weight of digesta in caeca 75
Appendix 32 ANOVA for cost per kilogram live weight 75
Appendix 33 ANOVA for cost per kilogram carcass 76
Appendix 34 ANOVA for dry matter digestibility 76
Appendix 35 ANOVA for crude protein digestibility 77
Appendix 36 ANOVA for crude fat digestibility 77
1
CHAPTER ONE: INTRODUCTION
1.1 Background information
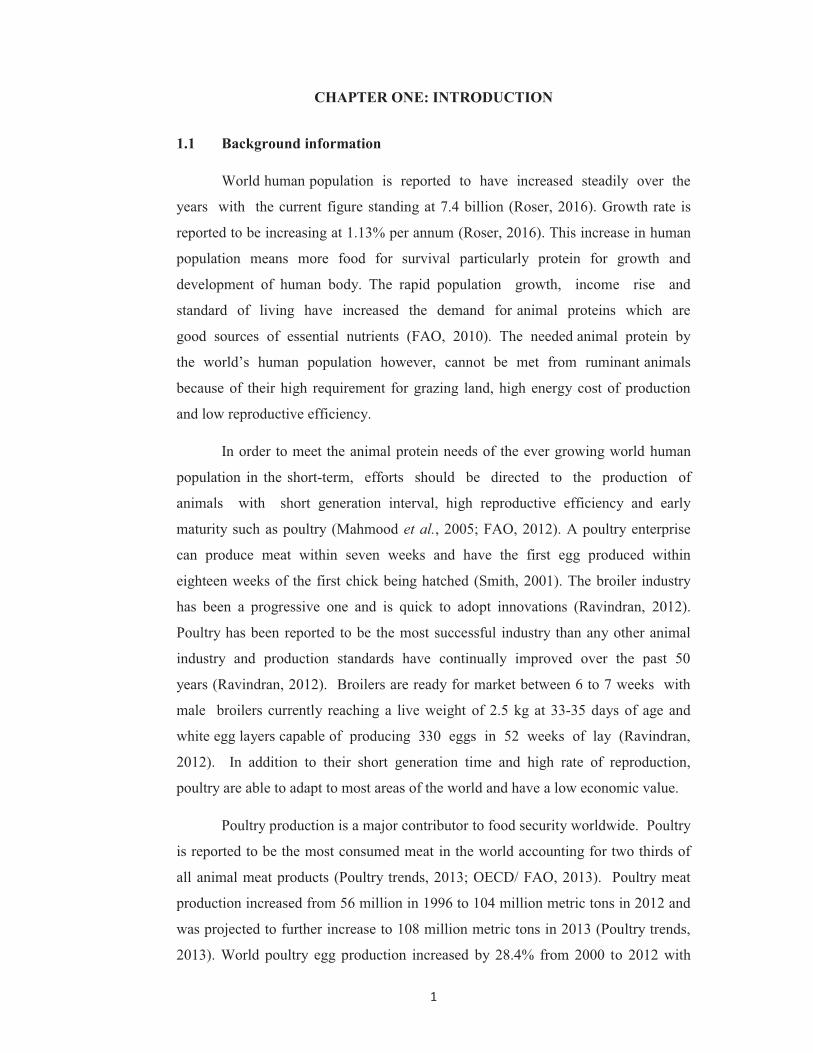
World human population is reported to have increased steadily over the
years with the current figure standing at 7.4 billion (Roser, 2016). Growth rate is
reported to be increasing at 1.13% per annum (Roser, 2016). This increase in human
population means more food for survival particularly protein for growth and
development of human body. The rapid population growth, income rise and
standard of living have increased the demand for animal proteins which are
good sources of essential nutrients (FAO, 2010). The needed animal protein by
the world’s human population however, cannot be met from ruminant animals
because of their high requirement for grazing land, high energy cost of production
and low reproductive efficiency. In order to meet the animal protein needs of the ever growing world human
population in the short-term, efforts should be directed to the production of
animals with short generation interval, high reproductive efficiency and early
maturity such as poultry (Mahmood et al., 2005; FAO, 2012). A poultry enterprise
can produce meat within seven weeks and have the first egg produced within
eighteen weeks of the first chick being hatched (Smith, 2001). The broiler industry
has been a progressive one and is quick to adopt innovations (Ravindran, 2012).
Poultry has been reported to be the most successful industry than any other animal
industry and production standards have continually improved over the past 50
years (Ravindran, 2012). Broilers are ready for market between 6 to 7 weeks with
male broilers currently reaching a live weight of 2.5 kg at 33-35 days of age and
white egg layers capable of producing 330 eggs in 52 weeks of lay (Ravindran,
2012). In addition to their short generation time and high rate of reproduction,
poultry are able to adapt to most areas of the world and have a low economic value. Poultry production is a major contributor to food security worldwide. Poultry
is reported to be the most consumed meat in the world accounting for two thirds of
all animal meat products (Poultry trends, 2013; OECD/ FAO, 2013). Poultry meat
production increased from 56 million in 1996 to 104 million metric tons in 2012 and
was projected to further increase to 108 million metric tons in 2013 (Poultry trends,
2013). World poultry egg production increased by 28.4% from 2000 to 2012 with

2
China and the United States being the largest producing countries (Poultry trends,
2013). Poultry meat accounted for 30% (FAO, 2010) and 37% (FAO Food outlook,
2013) of global meat consumption. The production and consumption trends of
poultry meat are expected to continue due to fast turnover rate, low energy and land
requirements for production, feed efficiency, cheaper products, changing life styles,
health attributes, consumer preference, and the price advantage (Vepa, 2004; Ali and
Pappa, 2015).
World per capita consumption of poultry meat increased about four times
from 3kg in 1963 to 11kg in 2003 (FAOSTAT, 2009). The greatest consumption
of poultry products is reported to occur in developing countries (Ravindran, 2012).
In these countries, meat production has increased resulting in expansion of the
industry (Hossain et al., 2015). Increased production of white meat is evident
in Asian countries while red meat markets are stagnating (Chemnitz, 2014).
Poultry play an important role in bridging the worlds’ protein consumption gap
(Ravindran 2012).
However, high feed cost is a major constraint to poultry production
increase (Glatz, 2012; Hossain et al., 2015). The growth in the poultry industry is
having a profound effect on the demand for feed and raw materials (Ravindran,
2011). Feed accounts for about 65 to 75% of the total cost involved in poultry
production depending on the diet and management system (Mahmood et al.,
2005; Daghir, 2008; Glatz, 2012; Sittiya and Yamauchi, 2014; Diarra, 2015; Hossain
et al., 2015).
In the South Pacific countries the cost of feed is still higher as the traditional
ingredients for diet formulation are not available in the region; thus expensive. The
traditional plant protein sources used for poultry feeding are not grown at all
in most countries and farmers depend on imported feed (Diarra, 2015) or where they
may be grown the cultivation is insignificant to meet the demand of the
livestock industry (FAO, 2012; Diarra, 2015). This is a major hindrance to the
expansion of the poultry industry despite the increasing demand for poultry products
in the region. Ayalew (2011) reported a 56 to 100 % increase in retail prices of
commercial pig and poultry feeds in Papua New Guinea (PNG) from 2003 to 2011.

3
Samoa does not have a broiler industry at the moment mainly on account of
the high feed cost. This results in a low domestic production of poultry meat which
has led to massive importation of poultry products. The value of meat imports in
Samoa from July 2012 to June 2013 was reported to be SAT$ 45 million
representing 87% of total cost of meat import in the country (APHD Annual report,
2014). This massive importation has caused loss of foreign exchange, income and
employment opportunities. This necessitates the need to increase research into
locally available feed materials of low economic value which can be used to reduce
feed cost in the region (Ochetim, 1988; ALFID, 2002; FAO, 2012; Diarra, 2015).
1.2 Problem statement
Copra meal, a by-product of coconut oil extraction, produced by expeller or
solvent extraction is readily available in most countries of the South Pacific region.
Pacific Oil Samoa produces an average of 800 metric tonnes of copra meal annually.
In addition, reasonable quantities of copra meal are available from small scale oil
extraction plants in the country. At the moment, copra meal has little or no industrial
use in the country making it readily available for livestock feeding. The protein
content of copra meal ranges from 15 to 25% (Thomas and Scott, 1962; Sauvant et
al., 2004; Mondal et al., 2008) but the protein has a poor essential amino acid
profile especially in respect of lysine and methionine (NRC, 2012). The residual
oil content is reported to range from 3.5 to 7% (Canapi et al., 2005; Kurian et al.,
2007). Crude fibre content of 11.3 to 33% have been reported in the meal
(Nieuwkoop, 2004; Dairo and Fasuyi, 2008; Diarra et al., 2014). The fibre of copra
meal is mainly in the form of non -starch polysaccharide (NSP) (Sundu et al., 2006;
2009). The NSP of copra meal is mostly present as pure mannan,
galactomannan, glucomannan, galactoglucomannan (Sundu et al., 2006) and
cellulose (Balasubramaniam, 1976; Saittagaroon et al., 1983; Dusterhoft et al.,
1992; Knudsen, 1997; Sundu et al., 2009). The method of oil extraction is known to
affect the nutritional quality of copra meal with solvent extracted meal being of
better quality than expeller extracted meal (Thomas and Scott, 1962). The poor
essential amino acid profile, high fibre content, and poor palatability due to rancidity
are the major factors limiting the utilization of copra meal by poultry (Creswell and
Brooks 1971; Thorne, 1992; NRC 1994; Kim et al., 2001; Siebra et al., 2008; Sundu
et al., 2009).

4
Recommendations of copra meal in broiler diets are variable (Sundu et al.,
2006; Bastos et al., 2007). Sundu et al. (2006) observed reduced performance (feed
intake, weight gain, feed conversion ratio and nutrient digestibility) of broiler
chickens fed 10% dietary copra meal. Bastos et al. (2007) observed growth
depression in young broilers fed as low as 5% copra meal in the diet. Although
exogenous enzyme supplementation is reported to allow utilization of higher dietary
levels of copra meal (Sundu et al., 2009), these enzyme products may not be
reachable by small scale poultry farmers in the South Pacific region. In addition,
there is a gradual ban on the use of synthetic amino acids in poultry diets
(USDA, 2012); thus the need to investigate into more adapted technologies for
improving utilization of copra meal in the diet. Factors such as fibre source and
composition, processing method and diet composition have all been reported to
influence the utilization of dietary fibre by monogastric animals (Low, 1993).
Currently there is little or no information on the effect of diet composition on the
utilization of copra meal by broiler chickens. Since low nutrient density is a
major factor affecting its utilization by poultry, it may be worth investigating the
feeding of copra meal with different combinations of nutrient dense traditional
protein sources in finishing broiler diets. The present study is a preliminary
investigation on the effect of feeding a higher (15%) level of copra meal with
different combinations of traditional protein sources on broiler performance. 1.3 Hypothesis
Broiler chickens would perform equally well on copra meal-based diets
containing different combinations of traditional protein sources.
1.4 Objectives
The main objective of this study was to investigate the effect of
feeding copra meal with different protein sources on the performance of finishing
broiler chickens with the specific objectives of studying the effects on:
i. Growth parameters (feed intake, weight gain, feed conversion ratio);
ii. Nutrient digestibility;
iii. Carcass measurements and organ weights; and
iv. Feed cost of broiler meat production.

5
CHAPTER TWO: LITERATURE REVIEW
2.1 Nutritional requirements of broilers
The diet of broilers under confinement should contain essential materials for
growth. These materials are grouped into energy, protein, vitamins and minerals.
Broilers maybe fed starter and finisher (Gajana, et al., 2011, Omid, et al., 2011 and
Ullah, et al., 2012) or starter, grower and finisher (Skinner, et al., 1992) diets.
2.1.1 Energy requirement
Energy from feed is needed for all metabolic processes. The energy in broiler
feed comes from carbohydrates, mainly from cereals. Corn and wheat are the
reference energy sources in broiler diets. Fats are concentrated forms of energy
which are used to boost the energy level of diets. Fats also improve the physical
consistency of diets and dispersion of micro-ingredients in feed mixtures (NRC,
1994). Supplemental fats may also increase energy utilization in adult chickens in
association with a decreased rate of food passage through the gastro-intestinal tract
(NRC, 1994). Fats are also sources of glycerol and fatty acids and serve as medium
for fat-soluble vitamins (Oluyemi and Roberts, 2000). However, young chickens do
not metabolize the oil in full-fat oil seeds as well as adult birds do (Askbrant and
Farrell, 1987).
Deficiency of energy in the diet affects productive performance of birds. A
dietary metabolizable energy (ME) concentration of 3,200kcal/kg has been
recommended for broiler chickens (NRC, 1994; Aftab et al., 2006; Klasing, 2015).
However, the age of broiler seems to be an important factor affecting its requirement.
A ME of about 2,900Kcal/Kg has been reported to support broiler growth (Farrell,
2005). Leeson et al. (1992) observed that feeding a diet containing about 1,900 Kcal
ME/kg gave satisfactory growth in broilers aged 35 days.
An absolute requirement for energy in terms of kilocalories per kilogram
(Kcal ME/Kg) of diet cannot be stated because poultry adjust their feed intake to
obtain their necessary daily requirement (NRC, 1994). Poultry tends to eat to satisfy
their energy requirements if fed ad-libitum (Oluyemi and Roberts, 2000).

6
2.1.2 Protein and amino acid requirements
The protein requirement of a bird is defined as requirement for a supply of
each essential amino acid together with a sufficient supply of suitable nitrogenous
compounds from which non-essential amino acids can be synthesized (Smith, 2001).
Proteins, formed from amino acids, are required for growth and development of
muscles, bones, feathers and organs. Both essential and non-essential amino acids are
needed by broilers for growth and development.
Kekeocha (1984) recommended 21-24% crude protein for broiler starter and
18-20% for the finishing broiler. Dietary protein concentration can affect the
requirement for individual essential amino acids (NRC, 1994). Dietary essential
amino acid concentration has been reported to affect protein requirement of broilers.
Dietary protein levels of 16.6 and 15.3% in the starter and finisher diets respectively
have been reported to maintain performance of broilers when essential and non-
essential amino acid ratio was maintained at 50: 50 (Aftab et al., 2006).
When diets are formulated on the basis of feed analysis data, the assumption
is generally made that amino acids are 80-90% available from the feed protein (NRC,
1994). However, most feed proteins are deficient in methionine (Serres, 1999).
Methionine is a primary sulphur-containing amino acid in the diet of the domestic
fowl (Yalcin et al., 1999). Methionine primarily serves as a methyl donor for
transmethylation reactions; especially in the biosynthesis of lipids and other
compounds and is involved in lipid transport in the blood (Patterson and Kung,
1988). Methionine also serves as a sulphur donor (Pesti et al., 1981). Within these
two roles, methionine is a major component in protein synthesis (Kim et al., 2006).
According to Leeson and Summers (2001) methionine serves as a methyl donor for
creatine, choline and carnitine.
The requirement of broiler chicks for methionine and total sulphur amino-
acids is well established (Schutte and Pack, 1995; Baker et al., 1996; Huyghebaert
and Pack, 1996). Huyghebaert and Pack (1996) observed that slaughter yield and
breast meat yield were clearly increased while fat deposition was decreased by
sulphur containing amino acid addition from 2 to 5 weeks of age. Leyden and
Balnave (1987) and Balnave and Oliva (1990) estimated that the methionine

7
requirement of broilers from 21 to 24 days was 0.35% or 0.26 g/MJ of ME. Damron
et al. (1977), Schutte and Pack (1995) and Esteve-Garcia and Llaurado (1997) found
an improvement in feed conversion in broilers with methionine supplementation.
Body weight and breast meat yield were also improved and abdominal fat weight
relatively reduced in a linear manner by increments in dietary methionine
concentration (Yalcin et al., 1999). Finishing broilers grown from 1.8 to 2.6 Kg
required about 0.72% of total sulphur amino acids to optimize feed conversion
efficiency, but responded favorably to concentrations close to 0.8% in terms of breast
meat deposition (Yalcin et al., 1999). Abasiekong and Tyokpat (2000) recommended
2.4% of combined supplementation of both lysine and methionine for optimum
performance in broiler chickens. The requirements of poultry for protein and amino
acids also differ among breeds and strains (NRC, 1994) and age (Baeza and
Leclercq, 1998). According to Pond et al. (1995) and Bartov (1998), chickens are
sensitive to dietary balance in amino acid in terms of weight gain and feed efficiency.
Methionine is normally supplemented only when crude protein cannot provide the
required levels of methionine as excess dietary methionine depresses growth (Kim et
al., 2006). Lysine concentrations of 1.2 and 1% have been recommended for starting
and finishing broilers respectively (NRC, 1994).
2.1.3 Vitamins and minerals requirements
Vitamins are organic compounds not synthesized by the body tissues and are
required in very small amounts in diets (Oluyemi and Roberts, 2000). Vitamins are
generally classified under two headings: fat-soluble vitamins A, D, E and K and
water soluble vitamins which include the B-complex vitamins and vitamin C. The
requirements for most vitamins are given in terms of milligrams per kilogram of diet,
with the exception of vitamins A, D and E for which the requirements are commonly
stated in international units (I.U.). According to Leeson (2009), vitamins are not
always found in sufficient quantities or available forms in the feedstuffs usually used
for poultry diets and therefore have to be supplied in the diets using vitamin and
mineral premixes. Increasing dietary vitamin E level above NRC (1994)
recommendations has been shown to improve the immune response of broilers of all
ages and the performance of broilers under heat-stress (Leeson, 2007). Castaing et al.
(2003) also observed that higher vitamin fortification results in superior growth and

8
meat yield in broilers. However, withdrawal of vitamin and mineral premix at 42
days (Skinner et al., 1992) or even at 35 days (Farrell, 2005) did not affect growth
rate or feed conversion ratio in broilers.
Minerals are required for the formation of the skeleton, as components of
various compounds with particular functions within the body, as activators of
enzymes and for the maintenance of necessary osmotic relationships within the body
of the bird (NRC, 1994). The major minerals are calcium (Ca), phosphorus (P),
sodium (Na), potassium (K), magnesium (Mg) and chlorine (Cl). Most of the Ca in
the diet of the growing bird is used for bone formation, whereas in the mature laying
fowl most dietary Ca is used for eggshell formation (NRC, 1994). The Ca
requirement of the laying hen is difficult to define. However, 3.4% (NRC, 1994), 4.0
to 4.25% (Grizzle et al., 1992) and 4.0% (Smith, 2001) are believed to represent the
mean dietary concentration for the quantities of feed likely to be consumed (110
grams per hen per day) over a considerable range of environmental temperature
(NRC, 1994). An excess of dietary Ca interferes with the availability of other
minerals such as magnesium, manganese and zinc (NRC, 1994). According to Smith
(2001), the requirements of poultry for calcium and phosphorus are influenced by the
amount of vitamin D in the diet. He however, recommended that the ratio of Ca: P be
within the range of 1:1 and 2:1 for growing birds and up to 6:1 for laying birds. In
feeding poultry, the source of Ca is also important. NRC (1994) reported that high
concentrations of calcium bicarbonate (limestone) and calcium phosphates might
make the diet unpalatable.
The trace elements needed by the fowl are iron, manganese, copper,
molybdenum, zinc and selenium (Oluyemi and Roberts, 2000). The same authors
reported that the likely deficient mineral elements in poultry diets are calcium,
phosphorus, sodium, chlorine, manganese, iodine, iron, copper and cobalt. The
requirements of chickens of different strains and ages for selected nutrients are
shown in Table 1.

9
Table 1: Nutrient requirements of broilers fed with diets of two feeding
phases
Energy Base 1
Kcal ME/kg diet
Broilers
0-3 weeks
3,200
3-6 weeks
3,200
6-8 weeks
3,200
Protein (%) 23.0 20.0 18.0
Lysine (% ) 1.20 1.00 0.85
Methionine (%) 0.50 0.38 0.32
Calcium (%) 1.00 0.90 0.80
Phosphorous (available) (%) 0.45 0.4 0.35
Potassium (%) 0.4 0.35 0.3
Sodium (%) 0.15 0.15 0.15
Chlorine (%) 0.15 0.15 0.15
Magnesium (mg) 600 600 600
Zinc (mg) 40 40 40
Iron (mg) 80 80 80
Iodine (mg) 0.35 0.35 0.35
Vitamin A (IU) 1,500 1,500 1,500
Vitamin D (IU) 200 200 200
Vitamin E (mg) 10 10 10
Vitamin K (mg) 0.5 0.5 0.5
Niacin (mg) 27 27 27
Thiamin (mg) 1.8 1.8 1.8 1 These are typical dietary energy concentrations.
Source: National Research Council (NRC, 1994).
2.2 Feed consumption and weight change in broilers
Because feed represents the highest cost of producing poultry meat and eggs
(Aduku, 1992; Perez et al., 1999) data on feed consumption together with
information on body weight and feed conversion ratio of individual flocks are
important. Many factors have been reported to affect feed intake and performance of
poultry. Smith (2001) reported that birds of broiler strains consume more feed than
birds of egg laying strain.

10
Dietary effects on feed intake have also been reported. An increase in dietary
energy concentration results in a decrease in feed intake (NRC, 1994; Smith, 2001).
If the diet is deficient in one or more essential nutrients, appetite is depressed and
this is associated with a decline in growth and reproductive performance (Smith,
2001; Cobb Management Guide, 2010). The intake of pelleted feed is greater than
that of the same feed in the form of meal (Oluyemi and Roberts, 2000; Smith, 2001).
Feed intake has been reported to decrease with increasing environmental
temperature. NRC (1994) observed that feed intake decreases by about 1.5% for each
rise of 1oC above the thermo-neutral zone in poultry. Feeding diets containing low
metabolizable energy (ME) and increased concentrations of protein and amino acids
has been reported to minimize the deleterious effect of heat on feed intake (Daghir,
1995; Balnave and Brake, 2005).
According to NRC (1994), feed consumption and body weight are higher in
the male than the female chicken. Light management program has also been reported
to affect broiler performance (Cobb Management Guide, 2010). Table 2 shows the
body weight and feed consumption of Cobb broilers as affected by age and sex of the
bird.
Table 2: Average feed consumption and body weight change of Cobb
Broilers
Age
(weeks)
Feed intake (g) Daily weight
gain (g)
Body weight (g) Feed conversion
ratio
Male Female Male Female Male Female Male Female
1 151 150 29 29 179 175 0.844 0.876
2 475 456 51 47 475 443 1.000 1.029
3 1,106 1,001 74 66 938 844 1.179 1.186
4 2,085 1,840 92 77 1,531 1,341 1.362 1.372
5 3,435 2,994 101 85 2,217 1,914 1.549 1.564
6 4,994 4,317 109 86 2,953 2,511 1.691 1.719
7 6,646 5,717 95 81 3,660 3,084 1.816 1.854
8 8,375 7,159 85 79 4,275 3,641 1.959 1.966
Adapted from Cobb Management Guide (2010)

11
2.3 Broiler carcass
There are several published data on carcass traits of meat chickens. Dressing
percentages of 65-86% (Say, 1992; Deschepper and Degroote, 1995; Iheukwumere et
al., 2001) have been reported for broiler chickens. Iheukwumere et al. (2001)
observed no sex difference in dressing percentage in broiler chicken. Mack et al.
(1999) reported a breast meat yield of 14-17% in broilers. Laseinde and Oluyemi
(1994) reported lower liver and gizzard weights in male broiler compared to female.
Breast meat yield has been found to decrease linearly with increasing ambient
temperature (Smith, 2001). Nutritional and dietary manipulations exert several
influences on the development of carcass traits, organs and setting muscles in
broilers. Fanimo et al. (2005) observed higher dressing percentage in broilers fed low
fibre diets compared to those fed high fibre diets probably due to the lower energy
content of the latter diets. Low protein diets have been reported to have adverse
effects on dressing percentage and the yield of different cut-up parts (Salami et al.,
2004). Yalcin et al. (1999) reported an increased breast meat yield and reduced
abdominal fat weight with increasing dietary methionine concentration. Parr and
Summers (1991) also reported increase carcass fat on low protein diets. Substitution
of soybean meal with Sunflower meal was reported to have no adverse effects on
growth and dressing percentage, but improved breast and thigh muscle yield in
turkeys (Laudadio et al., 2014). Iyayi et al. (2005) reported a significant reduction in
dressing percentage in broiler chickens fed mucuna bean meal above 33% as
replacement of soybean meal. Dogo (2001) observed that optimum dressing
percentage was achieved when 8% of fish meal was replaced with palm kernel cake
in broiler diets. These studies suggest that different protein sources with different
amino acid composition affect the development of carcass traits differently. Addition
of copra meal at 0.1% in the diet of broilers has been found to reduce abdominal fat
deposition and total cholesterol (Kannan et al., 2005).
2.4 Some traditional protein sources for poultry
Ingredients such as fish meal, meat and bone meal, poultry by-product meal
and soybean meal have been traditionally used as protein sources in poultry diets.
These ingredients are characterized by high protein content, good balance of
essential amino acids and high digestibility. Traditional feed proteins are grouped

12
into plant and animal sources. The use of plant protein sources in poultry diets is
increasing mainly due to the high cost of animal proteins.
Several factors including the physical nature, dietary level of inclusion and
presence of anti-nutritional factors (ANF) affect the utilization of plant protein
sources by poultry. Cancherini et al. (2004) reported that corn/soybean meal-based
diets promoted better growth than other diets. Vieira and Lima (2005) also found no
significant differences in body weight gain of broilers fed animal proteins sources
compared to vegetable protein. However, Hossain et al. (2012; 2013) observed better
growth performance of broiler chickens fed diets containing fish meal compared to
those fed vegetable protein diets. Bhuiyan et al. (2012a) reported a 10% reduction in
feed intake of broilers fed vegetable protein compared to animal protein diets.
Ojewola et al. (2005) observed growth depression in broilers fed diets without
animal protein sources. Poor performance of broilers on plant proteins maybe due to
reduced feed intake and poorer amino acid profile and digestibility compared to
animal protein sources.
2.4.1 Fish meal
Fish meal is obtained by cooking, pressing, drying and milling fresh raw fish
or fish trimmings (IFFOO, 2006). There are several types of fish meal in the market
depending on the source of fish or fishery by-products used and on the processing
technology involved. Fish meal contains between 60-70% crude protein (NRC, 1994;
Smith, 2001; Sauvant et al., 2004; Blair, 2008) and a high amino acid quality
(Médale and Kaushik, 2009).
Although known to be inorganic in a strict sense, fish meal is reported to be
approved for use in organic poultry diets (Blair, 2008). Fish meal is an excellent
feedstuff for poultry. It is also a good source of minerals especially calcium,
phosphorous and B vitamins. Fish meal is however, scarce in most developing
countries, thus expensive for use in poultry feeds (Serres, 1999; Smith 2001).
According to Smith (2001), the quality of fish meal may deteriorate in hot climates
and inclusion levels above 10% in diet causes spoilage, poor palatability and low
quality of meat and eggs. However, the use of antioxidants has been reported to
reduce spoilage and oxidation (Smith, 2001; Blair, 2008).
13
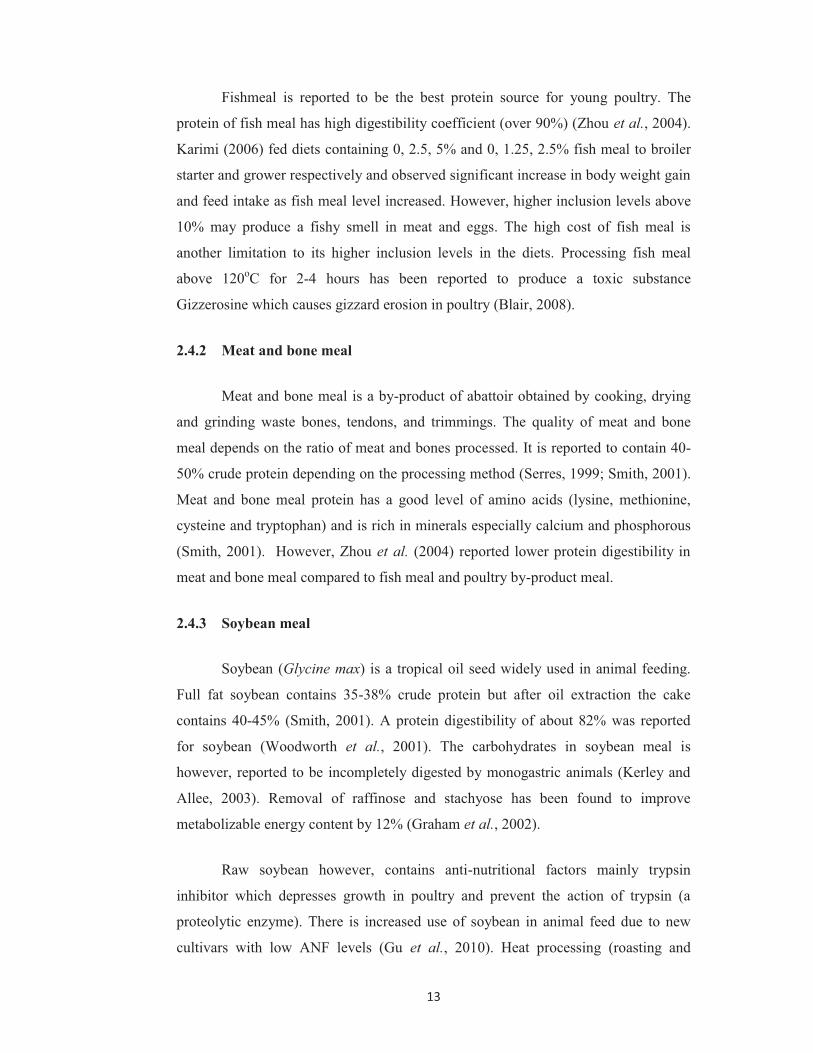
Fishmeal is reported to be the best protein source for young poultry. The
protein of fish meal has high digestibility coefficient (over 90%) (Zhou et al., 2004).
Karimi (2006) fed diets containing 0, 2.5, 5% and 0, 1.25, 2.5% fish meal to broiler
starter and grower respectively and observed significant increase in body weight gain
and feed intake as fish meal level increased. However, higher inclusion levels above
10% may produce a fishy smell in meat and eggs. The high cost of fish meal is
another limitation to its higher inclusion levels in the diets. Processing fish meal
above 120oC for 2-4 hours has been reported to produce a toxic substance
Gizzerosine which causes gizzard erosion in poultry (Blair, 2008).
2.4.2 Meat and bone meal
Meat and bone meal is a by-product of abattoir obtained by cooking, drying
and grinding waste bones, tendons, and trimmings. The quality of meat and bone
meal depends on the ratio of meat and bones processed. It is reported to contain 40-
50% crude protein depending on the processing method (Serres, 1999; Smith, 2001).
Meat and bone meal protein has a good level of amino acids (lysine, methionine,
cysteine and tryptophan) and is rich in minerals especially calcium and phosphorous
(Smith, 2001). However, Zhou et al. (2004) reported lower protein digestibility in
meat and bone meal compared to fish meal and poultry by-product meal.
2.4.3 Soybean meal
Soybean (Glycine max) is a tropical oil seed widely used in animal feeding.
Full fat soybean contains 35-38% crude protein but after oil extraction the cake
contains 40-45% (Smith, 2001). A protein digestibility of about 82% was reported
for soybean (Woodworth et al., 2001). The carbohydrates in soybean meal is
however, reported to be incompletely digested by monogastric animals (Kerley and
Allee, 2003). Removal of raffinose and stachyose has been found to improve
metabolizable energy content by 12% (Graham et al., 2002).
Raw soybean however, contains anti-nutritional factors mainly trypsin
inhibitor which depresses growth in poultry and prevent the action of trypsin (a
proteolytic enzyme). There is increased use of soybean in animal feed due to new
cultivars with low ANF levels (Gu et al., 2010). Heat processing (roasting and

14
cooking are known to inactivate trypsin inhibitors. However, higher processing
temperatures may lead to loss of amino acids especially lysine through Maillard
reaction (Sundu et al., 2009; Hurrell, 1990). Araba and Dale (1990) reported an
improved performance of monogastric animals with properly processed soybean
meal. Arends et al. (1971) and Lalshaw and Clayton (1976) however, recommended
that diets containing roasted full fat soybean meal must be balanced for
energy/amino acid ratio because birds on high energy full fat roasted soybean meal
will consume less feed. Dewan and Gleaves (1969) similarly reported that heated full
fat soybean meal significantly reduced feed intake by layers.
2.5 Copra meal (CM) as protein source in broiler diets
Copra meal is a by-product of coconut oil extraction. World copra meal
production is reported to be 2 million tonnes per year (FAO, 2002). The amount is
reported to be 480,000 tonnes of crude protein from copra meal available for animal
feed (Sundu et al., 2009). The protein content of copra meal depends on origin and
method of oil extraction. Copra meal has been reported to be poor in lysine and
sulphur amino acids (Creswell and Brooks, 1971; NRC, 1994) due to heat
damage (Butterworth and Fox, 1962). High fibre content (Knudsen, 1997; Diarra
et al., 2008; Mateos et al., 2014) is another factor affecting its feeding value.
Rancidity is also a factor affecting copra meal utilization due to the oil content it gets
transformed to peroxide which becomes unpalatable for birds. Attempts have been
made to address these problems by either carefully formulating diets to meet
requirements of poultry, particularly amino acids (Sundu et al., 2009) or by the
inclusion of enzymes (Choct, 2006; Diarra et al., 2014). Sundu et al. (2009)
observed that broilers 4 to 14 day old can tolerate up to 30% copra meal in the
diet provided the diet is supplemented with essential amino acid. Enzymes and
synthetic amino acids come at an additional cost and may not be practicable on
medium scale farms. Most synthetic amino acids have been banned in poultry
diets, especially in organic poultry production. The use of methionine (the last
synthetic amino acid) is also being restricted and may be banned in the near future
(USDA, 2012). Factors such as fibre source and composition, processing method and
composition of the diet have all been reported to influence the utilization dietary
fibre by poultry (Low, 1993).
15
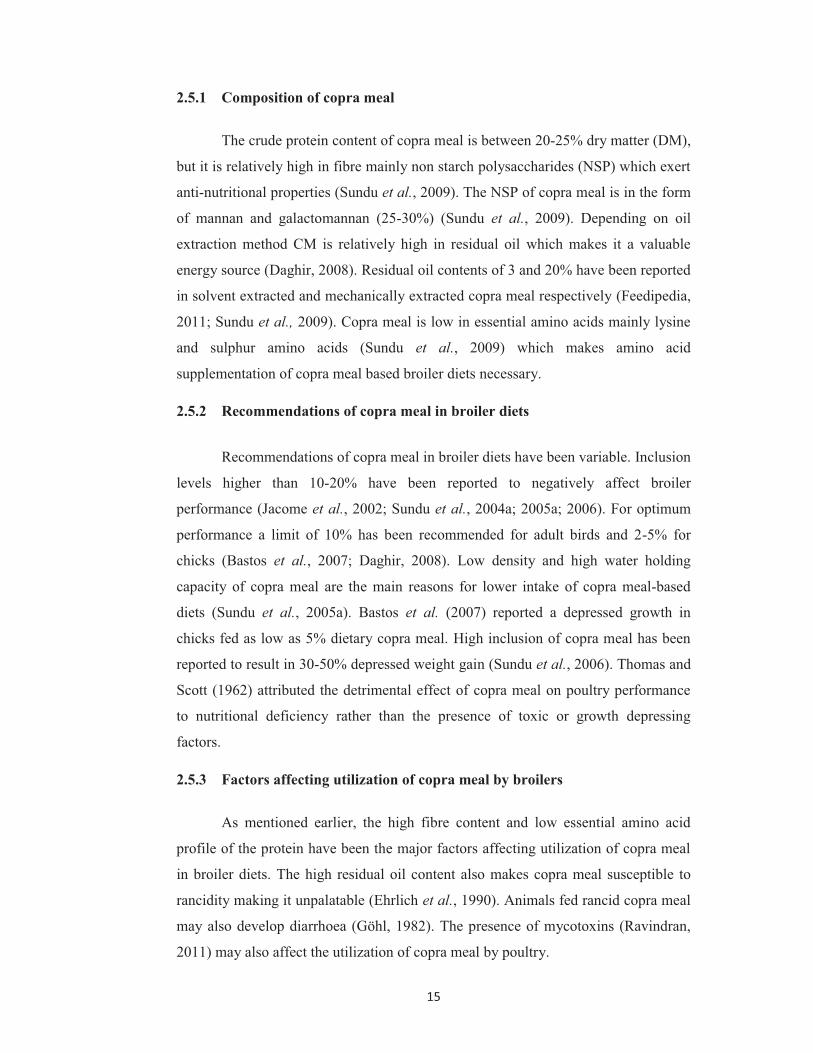
2.5.1 Composition of copra meal
The crude protein content of copra meal is between 20-25% dry matter (DM),
but it is relatively high in fibre mainly non starch polysaccharides (NSP) which exert
anti-nutritional properties (Sundu et al., 2009). The NSP of copra meal is in the form
of mannan and galactomannan (25-30%) (Sundu et al., 2009). Depending on oil
extraction method CM is relatively high in residual oil which makes it a valuable
energy source (Daghir, 2008). Residual oil contents of 3 and 20% have been reported
in solvent extracted and mechanically extracted copra meal respectively (Feedipedia,
2011; Sundu et al., 2009). Copra meal is low in essential amino acids mainly lysine
and sulphur amino acids (Sundu et al., 2009) which makes amino acid
supplementation of copra meal based broiler diets necessary. 2.5.2 Recommendations of copra meal in broiler diets
Recommendations of copra meal in broiler diets have been variable. Inclusion
levels higher than 10-20% have been reported to negatively affect broiler
performance (Jacome et al., 2002; Sundu et al., 2004a; 2005a; 2006). For optimum
performance a limit of 10% has been recommended for adult birds and 2-5% for
chicks (Bastos et al., 2007; Daghir, 2008). Low density and high water holding
capacity of copra meal are the main reasons for lower intake of copra meal-based
diets (Sundu et al., 2005a). Bastos et al. (2007) reported a depressed growth in
chicks fed as low as 5% dietary copra meal. High inclusion of copra meal has been
reported to result in 30-50% depressed weight gain (Sundu et al., 2006). Thomas and
Scott (1962) attributed the detrimental effect of copra meal on poultry performance
to nutritional deficiency rather than the presence of toxic or growth depressing
factors. 2.5.3 Factors affecting utilization of copra meal by broilers
As mentioned earlier, the high fibre content and low essential amino acid
profile of the protein have been the major factors affecting utilization of copra meal
in broiler diets. The high residual oil content also makes copra meal susceptible to
rancidity making it unpalatable (Ehrlich et al., 1990). Animals fed rancid copra meal
may also develop diarrhoea (Göhl, 1982). The presence of mycotoxins (Ravindran,
2011) may also affect the utilization of copra meal by poultry.

16
2.5.4 Feed technologies for improving utilization of copra meal by broilers
Several feed technologies have been used to improve the utilization of copra
meal in broiler diets. These include enzyme and amino acid supplementation, diet
dilution and choice feeding among others.
2.5.4.1 Enzyme supplementation
Several enzyme products have been found to improve performance of broilers
fed copra meal based diet. Sundu et al. (2006) reported improved weight gain feed
conversion ratio, feed digestibility and decreased jejunal digesta viscosity of broiler
chickens fed copra meal-based diets supplemented with enzymes (Hemicell®,
Allzyme SSF® and combination of Gamanase, Hemicell and Allzyme SSF). The use
of mannanase has also been shown to improve animal performance on copra meal-
based diet (Sundu et al., 2004a; 2009). However, enzyme supplementation has not
resulted in performance improvement equivalent to the control with no copra meal
(Sundu et al., 2006; 2008).
2.5.4.2 Amino acid supplementation
Amino acids are used as supplements to improve copra meal-based diets by
poultry. Thomas and Scott (1962) observed improved body weights in broilers fed
copra meal based diets supplemented with lysine. Panigrahi et al. (1987) observed
that up to 25% copra meal is safe for broilers maintained to 6 weeks provided diets
are supplemented with methionine and lysine. In a later study, Sundu et al. (2005b)
increased inclusion level of copra meal to 30% with lysine and methionine
supplementation and observed that performance deterioration above 25%.
Supplementation of copra meal-based diets with amino acids in chicks does not
improve feeding value due to small capacity of their digestive system (Sundu et al.,
2004b).
2.5.4.3 Soaking
Soaking the diet has been reported to improve birds’ performance (Yalda and
Forbes, 1996). Performance improvement on soaked diets has been attributed to
activation of endogenous enzymes (Forbes, 2003), increased ingredient solubilisation

17
(Yasar and Forbes, 2000) and increased bulk density (Sundu et al., 2005a). Sundu et
al. (2005a) reported a significant increase in body weight gain of broilers fed a 30%
soaked CM based diet in a ratio 1:1. The improvement in body weight gain of
broilers fed soaked CM-based diets has been mainly attributed to increased feed
intake (Forbes, 2003).
2.5.4.4 Pelleting
The beneficial effect of feeding pelleted diets is well documented (Callet,
1965; Thomas and Van der Poel, 1996; McCracken, 2002). Increased feed intake of
pelleted diets compared with a mash has been reported (Proudfoot and Hulan, 1982;
Nir et al., 1995; Sundu et al., 2005a). Sundu et al. (2005a) observed higher body
weight gain in broilers fed pelleted CM diets compared to the control corn-soybean
diets. At the moment however, pelleting is not an affordable option by small scale
farmers of the South Pacific region.
2.5.4.5 Diet dilution
Copra meal has been used to dilute expensive commercial broiler feeds in
order to reduce cost of production. Diluting a broiler finisher diet with 20-40% copra
meal resulted in similar growth as the control diet and inclusion of 60% copra meal
resulted in acceptable growth of village broilers (Pandi, 2005). The extent of dilution
that is practiced depends on the availability and cost of copra meal.
2.5.4.6 Choice feeding
Choice feeding is a feeding system where the three feed groups; protein,
carbohydrates, minerals and vitamins are provided separately every day so that the
birds can choose feed according to their requirements. Ancestors of broilers lived on
self-selected feed but modern birds are being fed single-feed under intensive system
(Hossain et al., 2015). In choice feeding, birds self-select nutrients using their innate
abilities to balance their nutritional needs for the day (Cumming, 1992a; Ciszuk, et
al., 1998; Olver and Malan 2000; Haskell et al., 2001; Dana and Ogle 2002; Henuk
and Dingle 2002; Pousga et al., 2005; Glatz 2012; Hossain et al., 2015). There is
evidence that both wild and domesticated poultry are able to adjust their nutrient
intake by selecting from a range of feedstuffs a diet that matches their physiological

18
requirements (Pousga et al., 2005). Grayson and Campbell (2004) reported that free-
choice feeding system can be used successfully for village poultry in the Solomon
Islands. Birds have an inherent capability to select feed and capacity to regulate their
separate intakes of energy, protein, minerals and vitamins to meet requirements.
However, the intake may be affected by color, smell, odor, flavor, taste and texture
(Cruz et al., 2005). If feed from the three food groups are provided in separate
containers, the birds will choose feed according to their requirements. If one of the
feed groups is eaten quickly, then more of that feed should be provided. Bhuiyan et
al. (2012a; 2012b) reported that choice fed broilers had preference for animal protein
over vegetable protein sources. Nano (2015) concluded that 50% copra meal
concentrate in a choice feeding with local feed ingredients will maintain performance
of laying hens and reduce cost of egg production.

19
CHAPTER THREE: MATERIALS AND METHODS
3.1 Site of experiment
The study was conducted at the Poultry Unit of the University of the South
Pacific’s School of Agriculture and Food Technology, Alafua Campus, Samoa.
Samoa consists of two main islands namely, Upolu and Savaii with a humid tropical
climate. There are eight smaller islands on this independent nation and a total land
area of 1,100 sq. miles (2,830 sq. km). Agriculture in Samoa is mostly village type
and community based where interdependent farming system of crop (root crops,
vegetables, fruits, coconut and cocoa), livestock (cattle, pigs, poultry with sheep
being new initiative), fisheries and forestry. Production is for home consumption and
for cash (Samoa Bureau of Statistics, 2014). Copra industry waste, copra meal is
readily available after oil extraction process from industries in Samoa.
3.2 Traditional protein sources and diet formulation
Three traditional protein sources; fish meal (FM), meat and bone meal
(MBM) and full-fat soybean meal (SBM) and test ingredient copra meal (CM) were
analyzed for proximate composition and amino acid profile. Soybean meal and CM
were also analyzed for total, insoluble and soluble non-starch polysaccharides (NSP)
(Tables 3 and 4). Five broiler finisher diets containing 20% crude protein were
formulated (Table 5). The diets consisted of a control diet based on three traditional
protein sources and four other diets containing on 15% copra meal with different
combinations of these protein sources as follows:
Diet 1(control): FM, SBM and MBM.
Diet 2: CM, FM and MBM
Diet 3: CM, FM and SBM
Diet 4: CM, FM, SBM and MBM.
Diet 5: CM, SBM and MBM.

20
Table 3: Proximate composition, and NSP contents of experimental protein sources (%DM)
Constituents (%) Protein sources
FM MBM SBM CM
Dry matter 96.9 96.8 96.9 97
Crude protein 48.1 57.6 34.5 21.1
Ether extract 12.4 11.0 18.7 11.4
Crude fibre 0.6 1.8 16.4 16.4
Ash 30.3 28.1 5.6 5.6
Total NSP - - 20.32 52.33
Insoluble NSP - - 19.08 38.65
Soluble NSP - - 1.24 13.68
FM: fish meal; MBM: meat and bone meal; SBM: soybean meal; CM: copra meal, NSP: non-starch polysaccharides
Table 4: Amino acid composition of the experimental protein sources (mg/100mgDM)
Amino acid Protein sources
MBM FM SBM CM
Aspartic acid 4.99 4.36 3.95 1.80
Threonine 2.4 2.14 1.48 0.67
Serine 2.92 1.95 1.79 0.92
Glutamic acid 7.59 5.84 5.48 3.96
Proline 4.29 2.96 1.79 0.75
Glycine 6.42 4.95 1.55 0.98
Alanine 4.0 3.48 1.55 0.92
Valine 3.26 2.58 1.77 1.20
Isoleucine 2.35 2.03 1.60 0.75
Leucine 4.20 3.33 2.58 1.39
Tyrosine 1.73 1.47 1.29 0.47
Phenylalanine 2.32 1.88 1.69 0.92
Histidine 1.14 1.1 0.94 0.44
Lysine 3.51 3.02 2.20 0.47
Arginine 4.17 3.09 2.39 2.40
Cysteine 0.86 0.36 0.70 0.26
Methionine 1.20 1.30 0.56 0.29
FM: fish meal; MBM: meat and bone meal; SBM: soybean meal; CM: copra meal, NSP: non-starch polysaccharides

21
Table 5: Ingredient composition, calculated and analysed composition of
broiler finisher diets (as fed basis)
Ingredients (%) Diets
D1 D2 D3 D4 D5
Corn 46.88 41.13 38.1 39.13 37.66
Mill mix 23.44 20.40 18.84 19.40 18.65
Soybean meal 8.01 - 11.19 6.92 11.49
Fish meal 8.01 8.88 11.19 6.92 -
Meat and bone meal 8.01 8.88 - 6.92 11.49
Copra meal - 15 15 15 15
*Fix ingredients 5.65 5.71 5.72 5.71 5.71
Calculated (%DM)
Lysine 1.14 1.13 1.13 1.14 1.14
Methionine 0.43 0.44 0.44 0.44 0.44
Methionine+cysteine 0.63 0.63 0.64 0.63 0.65
Total NSP 8.1 13.51 15.36 14.64 15.37
ME (Mj/kg) 12.46 12.52 13.02 12.66 12.76
ME/protein 151 151.5 157.22 152.69 154.54
Total NSP 8.1 13.51 15.36 14.64 15.37
Analyzed composition (%DM)
Dry matter 95.36 95.25 95.25 96.03 95.67
Crude protein 19.79 19.78 19.81 19.83 19.76
Ether extract 4.64 6.01 6.41 6.16 7.28
*Fix ingredients: coral sand and snail shell meal (4%), Vitamin-Mineral Premix from
Image Blend (0.25%), lysine HCl (D1: 0.8%, D2-D5:1%), DL methionine (D1:
0.3%, D2-D5: 0.5%), salt (0.3%). NSP: non-starch polysaccharides.
D1: Control diet with no CM, D2: CM fed with FM + MBM, D3: CM fed with FM +
SBM, D4: CM fed with FM + SBM + MBM, D5: CM fed with SBM + MBM.

22
3.3 Experimental broilers and management
A total of 100 day-old Cobb broiler chicks were brooded together for a period
of 20 days on commercial broiler starter feed. On day 21, the birds were weighed
individually (777.2 ± 11.4g; 1.5 CV) and allotted to 20 open-sided floor pens (238
cm х 109 cm) containing 5 birds each with wood shaving as litter material. The
formulated diets were fed each to birds in 4 randomly selected pens in a
completely randomized design (CRD) for a period of 22 days (from 21 to 42 days).
Feed and water were provided ad-libitum throughout the duration of the experiment.
The birds were exposed to 22 hours lighting during the experimental period.
3.4 Data collection
3.4.1 Growth performance data
Data were collected on growth parameters. A weighed quantity of feed was
fed daily and the left-over weighed the next day to account for the quantity
consumed by difference. Birds were weighed at the start of the experiment and
weekly thereafter. Weekly weight change was monitored by difference between two
consecutive weighing. Average daily live weight change was calculated by dividing
the weekly gain by 7 (number of days in the week). Feed conversion ratio (FCR) was
calculated weekly as the ratio of feed consumed by weight gained for four weeks.
3.4.2 Nutrient digestibility
At day 35, one bird was randomly selected from each pen (4 birds per
treatment) and placed in individual cages (with bamboo floor) for digestibility
studies. The birds were adapted to the cages for 3 days during which they were
fed their respective diets ad-libitum. From day 4, weighed quantities of feed
were fed and faecal samples collected from each bird for a period of 4 days.
Faecal samples collected were air-dried for 48 hours and ground. Samples from each
bird were pooled, weighed, and analyzed for proximate composition. Apparent
nutrient digestibility was calculated as:
% digestibility = × 100

23
3.4.3 Carcass and organ measurements
At the end of the experiment (day 42), all the birds were fasted
overnight, weighed early in the morning and euthanized by decapitation for carcass
and organ measurements. Slaughtered birds were scalded in hot water (about 50C),
plucked manually and eviscerated. The eviscerated chickens (carcasses) were
weighed and dressing out percentage calculated as:
% dressing =
Some carcass cut-up parts (thighs, drumstick and breast) were also removed,
weighed and expressed as percentages of the live weight of the bird. The skin in the
crease between the thigh and the body was cut from cranial to caudal to expose and
dislocate the hip joint (Articulation coxae). The tendons and ligaments around the
joint were then cut to remove the thighs. The thighs and drumsticks were separated at
the stifle joint (articulation genus). The breast muscle was gently separated from the
sternum using a scalpel blade.
Segments of the gut (crop, proventriculus, gizzard, small intestine and caeca)
and annex glands (liver, pancreas) were also removed and weighed using an
electronic scale sensitive to 0.1g. The segments of the gut were weighed full and
empty and digesta content calculated by difference between the full and empty
weights.
3.4.4 Feed cost of meat production
The cost of the kg of each diet was computed based on the market
price of the ingredients and feed cost of kg of live weight gain and kg carcass
calculated as follows:
Feed cost/kg live weight = cost of kg feed × feed conversion ratio
Feed cost/kg carcass = feed cost/kg live weight ÷ dressing percent

24
3.5 Data analysis
3.5.1 Chemical analysis
The protein sources (FM, MBM, SBM and CM), diets and faecal samples
were analyzed for proximate composition. The protein sources were analyzed for
amino acid profile. Soybean and copra meal were also analyzed for NSP at the same
laboratory. Chemical analysis was carried out at Massey University, Palmerston
North, New Zealand.
3.5.1.1 Proximate analysis
Proximate analysis was carried out according to the methods of AOAC
(1990).
3.5.1.1.1 Dry matter and ash determination
Dry matter + Ash/OM were determined according to AOAC (ID
930.15/925.10/942.05). Two grams of the sample was oven dried at 105oC until
constant weight was achieved. The weight loss was that of moisture and the dry
matter (DM) was calculated as:
% DM = 100- % moisture.
The ash or total mineral content was determined by incinerating 10 g of the
dried sample in a furnace at 600C for 3 h. The residue after incineration (ash) was
cooled in a desiccator and then weighed. The percentage ash for each sample was
calculated as:
% Ash = ×100
3.5.1.1.2 Determination of crude protein (CP) and amino acid profile
Crude protein was determined using the Kjeldahl procedure (AOAC, 1990)
(nitrogen-protein conversion = 6.25). The procedure consisted of 3 stages namely
digestion, distillation and titration. For digestion, 2.0 g of the sample was placed into
a digestion tube. Two (2) digestion tablets, which served as catalysts and 25 ml of
concentrated sulphuric acid, were added. The tube was then placed on a digestion

25
block covered with the exhaustion cap and switched on. Digestion started with a low
temperature to avoid rapid reaction, which would cause the sample to over boil.
Digestion continued for about 2 h. The digested sample was allowed to cool at room
temperature, and then diluted with distilled water to a volume of 100 ml.
Distillation was carried out in a distillation machine. Fifty (50 ml) of NaOH
was added to the digested sample which now consists of protein + H2SO4 to form
(NH4)2SO4. This ammonium sulphate reacted with NaOH to give NH4OH + Na2SO4.
The distillation machine has a provision for water that is heated to give steam. The
steam is passed through the digested sample + NaOH to carry over the NH4OH that
is condensed into a receiver flask containing boric acid + indicators (bromocresol
green + methyl red). The NH4OH in boric acid changed the initial reddish color of
boric acid to green indicating the presence of a base (NH3).
After distillation the NH3 in boric acid was then carried to a machine (burette)
for titration with 0.1 ml HCl. Nitrogen was then obtained by calculation as follows:
% N = × 100
Nitrogen-protein conversion was taken at 6.25.
The amino acid profile of the samples was determined using Standard AAA
hydrochloric acid hydrolysis followed by RP-HPLC separation using AccQ-Tag
derivatization (AOAC 994.12). CYS/MET was separated using Performic acid
oxidation method (AOAC 994.12).
3.5.1.1.3 Determination of crude fibre (CF)
Crude fibre was determined according to AOAC 962.09/978.10. A prepared
sample weighing 1g was digested in a flask on a heating mantle with a digestion
reagent consisting of trichloroacetic acid (20 g), glacial acetic acid (500 ml) and
NH3 (50 ml) all diluted to 1 litre with distilled water.
Each sample was digested with 100 ml of the digestion reagent above for 40
minutes. The digested sample was removed and allowed to cool at room temperature
and then filtered through an ash less filter paper that was weighed initially. The
filtered sample was washed 6 times with hot distilled water to remove carbohydrates

26
and proteins and once with petroleum spirit to remove fats. The paper was then
placed in an oven at 80 C overnight to remove all the moisture and then weighed.
The residue after drying (paper + fibre + ash) was ashed in a muffle furnace at 550 C
for 3 h and the ash weighed. The fibre was determined by calculation using the
formula of Van Soest and Wine (1967).
% CF =
3.5.1.1.4 Determination of ether extracts (EE) or fat
Fat extraction was done according to the method of Mojonnier (AOAC
954.02). Two (2) grams of the sample was placed in a thimble and the mouth closed
with a piece of cotton wool. The thimble was placed into an extraction chamber of
the Soxhlet system. The chamber was fixed onto an extraction flask (round bottom
flask of 500 ml) in which 200 ml of petroleum ether was placed. The two units were
fixed onto a heating mantle and a condenser placed on top of the unit.
The heating mantle was turned on at a temperature of 60C. As the ether in the
flask evaporates it follows the side arm and goes to the condenser of the Soxhlet
where it condenses and comes down into the extraction chamber. As it drips on the
sample in the thimble it extracts the fat and when the chamber is full, the siphon arm
fills up also and when it cannot go up any more, it follows the bench and pours down
in the flask. As the process is repeated (refluxing), the whole fat in the sample is
removed and received into the flask. After about 5 hours, the ether coming down is
received into a beaker leaving the flask with only extracted fat. The flask is then
oven-dried at 100 C for 1 h, cooled in a desiccator and weighed. Ether extract is then
calculated as follows:
% EE = × 100

27
3.5.1.1.5 Nitrogen-free extract (NFE) and metabolizable energy (ME)
Nitrogen free extract, which represents the soluble carbohydrate, was
calculated by difference of the other constituents from one hundred (100).
% NFE =
The metabolizable energy (ME) in Kcal/Kg was calculated according to
Fisher and Boorman (1986) as:
ME (Kcal/Kg) = 37× CP + 81× EE + 35.5 × NFE
Where:
CP = Crude Protein
NFE = Nitrogen-Free Extract
EE = Ether Extract.
3.5.2 Statistical analysis
Data collected were subjected to ANOVA (Steel and Torrie, 1980) of GLM
of SPSS (2013). Individual bird was the experimental unit for weight change, carcass
and organ measurements and nutrient digestibility whereas pen was the experimental
unit for feed intake. Treatment means were compared using the Least Significant
Difference (LSD) and significant differences were reported at 5% level of
probability.

28
CHAPTER FOUR: RESULTS
4.1. Growth performance of the broiler chickens
The growth performance results of the birds are presented in Table 6. During
the first week (21-28 days) birds fed diet 5 (CM, SBM and MBM) consumed
significantly more feed than those fed the other diets (P<0.05). Daily weight gain
was significantly (P<0.05) higher for birds on diets 2 (CM, FM and MBM) and 5.
Birds on diet 2 converted their feed into weight more efficiently (P<0.05) compared
to those fed diets 1 (SBM, FM and MBM), 3 (CM, SBM and FM) and 4 (CM, SBM,
FM and MBM). During the second week (29-35 days) daily feed intake and daily
weight gain were significantly affected by the diet (P<0.05). Feed intake was
significantly higher for birds on diet 5 and depressed for birds on diet 3 (P<0.05).
There was no significant difference (P>0.05) in daily feed intake among diets 1, 4
and 5 as well as among diets 1, 2, and 4. Birds fed diets 1 and 5 gained markedly
(P<0.05) more weight daily. Daily gain was not different (P>0.05) among diets 1, 2,
3 and 4. Feed conversion ratio was not affected by treatment (P>0.05). In the last
growth phase (day 36 to 42), daily feed intake and feed conversion ratio were not
affected by the diet (P>0.05). Daily weight gain was maximized (P<0.05) on diet 2
compared to diet 3 and diet 4. There was no marked difference (P>0.05) in daily gain
between diets 1, 2 and 5 as well as between diets 3 and 4. At the end of the
experiment (day 42) birds fed the control, diets 2 and 5 weighed significantly heavier
(P<0.05) than those on diet 3.
The mean growth performance results of the birds (21-42 days) in Table 2
showed significant differences among all parameters measured (P<0.05). Feed intake
was significantly higher for diet 5 (P<0.05) compared to diets 2 and 3 but did not
differ among diets 1, 2, 3 and 4 as well as among 1, 4 and 5. Daily weight gain was
improved on diets 1 and 5 compared to diets 3 and 4. A poorer FCR was recorded on
diet 3 compared to diet 2. Statistically, there was no difference in FCR among diets
1, 2, 4 and 5 as well as among diets 1, 3, 4 and 5. Final body weight of birds was
heavier on diets 1, 2 and 5 compared to those fed diet 3. There was no difference in
final body weight among diets 1, 2, 4 and 5 as well as between diets 3 and 4.

29
Tab
le 6
: G
row
th p
erfo
rman
ce o
f fin
ishi
ng b
roile
rs fe
d co
pra
mea
l in
diff
eren
t com
bina
tions
of t
radi
tiona
l pro
tein
sour
ces
FCR
: fe
ed c
onve
rsio
n ra
tio,
SEM
: st
anda
rd e
rror
of
mea
n, F
CR
: fe
ed c
onve
rsio
n ra
tio.
Val
ues
in t
he s
ame
colu
mn
with
the
sam
e
supe
rscr
ipt a
re n
ot s
igni
fican
tly d
iffer
ent (
P=0.
05) D
1: C
ontro
l die
t with
no
CM
, D2:
CM
fed
with
FM
+ M
BM
, D3:
CM
fed
with
FM
+
SBM
, D4:
CM
fed
with
FM
+ S
BM
+ M
BM
, D5:
CM
fed
with
SB
M +
MB
M.
Die
ts
F
eed
inta
ke (g
)
Dai
ly w
eigh
t gai
n (g
)
FC
R (f
eed:
gai
n)
Fina
l bo
dy
wei
ght (
g)
21-2
8d
29-3
5d
36-4
2d
21-4
2d
21-2
8d
29-3
5d
36-4
2d
21-4
2d
21-2
8d
29-3
5d
36-4
2d
21-4
2d
D1
102.
14b
157.
32ab
18
1.14
14
6.87
ab
34.2
9b 63
ab
81.2
5ab
59.5
1ab
3.01
a 2.
52
2.26
2.
6ab
1,86
6.25
a
D2
99.5
4b 14
7.86
b 16
3.72
13
7.04
b 42
a 60
.64b
94.7
a 65
.78a
2.27
b 2.
45
1.81
2.
17b
1,97
0.97
a
D3
95.4
3b 14
3.57
c 15
9.09
13
2.7b
28.5
7b 55
.64b
57.6
3b 47
.28b
3.4a
2.62
3.
16
3.06
a 1,
646.
95b
D4
97.8
6b 15
2.32
abc
175.
03
141.
74ab
33
.89b
59.3
9b 79
.81ab
57
.7b
2.9a
2.56
2.
21
2.56
ab
1,82
1.56
ab
D5
111.
68a
163.
75a
185.
34
153.
34a
43.7
1a 71
.36a
70.9
1ab
62a
2.58
ab
2.3
3.21
2.
7ab
1,94
3.03
a
SEM
2.
666
4.34
0 10
.015
4.
353
2.26
4 3.
139
11.0
62
4.07
0 0.
163
0.12
5 0.
498
0.17
5 65
.091

30
4.2 Nutrient digestibility
From the results of nutrient digestibility (Table 7), all nutrients studied were better
digested on diet 2 compared to diet 3 (P<0.05). Dry matter digestibility did not differ
(P>0.05) between diets 1 and 2 and among diets 1, 3, 4 and 5. The lowest value for
crude protein digestibility was recorded on diets 3 and 5. Crude fibre digestibility
was depressed (P<0.05) on diets 1, 3, 4 and 5 compared to diet 2. The digestibility of
dietary fat did not differ (P>0.05) among diets 2, 4 and 5. However, dietary fat
digestibility was significantly lower (P<0.05) on the control diet.
Table 7: Nutrient digestibility of the broiler chickens fed copra meal with
different combinations of traditional protein sources (%DM)
Nutrients Diets
D1 D2 D3 D4 D5 SEM
DM 81.43ab 84.18a 79.69b 78.83b 79.19b 1.422
CP 81.22a 84.10a 75.73b 80.99a 76.71b 1.407
CF 65.42b 80.58a 65.51b 57.37b 66.29b 3.506
Fat 78.95c 91.08a 85.11b 89.56a 90.23a 0.787
SEM: standard error of the mean
Values in the same row with the same superscript are not significantly different
(P=0.05
D1: Control diet with no CM, D2: CM fed with FM + MBM, D3: CM fed with FM +
SBM, D4: CM fed with FM + SBM + MBM, D5: CM fed with SBM + MBM.
4.3 Dressing out percentage and some carcass cut-up parts
From the results of carcass studies presented in Table 8, there were
significant dietary effects on dressing out percentage and the yield of breast muscle
(P<0.05). Dressing percentage was markedly increased (P<0.05) on diet 2 compared
to diet 4. There was no difference (P>0.05) in dressing percentage among diets 1, 2,
3 and 5 as well as among diets 1, 3, 4 and 5. Breast weight yield was depressed on
diets 3 and 4 (P<0.05). The yields of thighs and drumsticks were not affected by
dietary treatment (P>0.05).

31
Table 8: Dressing out percentage and some carcass cut-up parts (% live
weight) of broiler chickens fed copra meal in combination of
different protein sources
Parameters
Parameters (%
live weight)
Diets
D1 D2 D3 D4 D5 SEM
Dressing per cent 68.49ab 69.56a 66.90ab 66.27b 66.95ab 0.944
Breast 19.83a 20.15a 15.92b 15.55b 19.85a 1.279
Thigh 12.23 13.49 12.84 11.95 12.53 0.525
Drumstick 8.98 8.94 7.39 9.40 9.51 1.070
SEM: standard error of the mean
Values in the same row with the same superscript are not significantly different
(P=0.05)
D1: Control diet with no CM, D2: CM fed with FM + MBM, D3: CM fed with FM +
SBM, D4: CM fed with FM + SBM + MBM, D5: CM fed with SBM + MBM.
4.4 Organ weights
The weights of gut segments and their digesta content are shown in Table 9.
There was marked difference (P<0.05) in liver weights among the dietary treatments.
Birds fed diet 2 had a significantly heavier liver compared to those fed diets 3 and 4.
The weight of liver did not differ among the groups fed diets 1, 2 and 5 as well as
among diets 1, 3, 4 and 5 (P>0.05). The heaviest pancreas was recorded on diet 3
(P<0.05) compared to diets 2, 4 and 5. Pancreas weight was not different between
diets 1 and 3 and among diets 1, 2, 4 and 5. The weight of empty crop was
significantly reduced (P<0.05) on diet 2. There were no treatment effects on the
weights of empty proventriculus, gizzard, caeca, and digesta in the gizzard and caeca
(P>0.05). The digesta in the proventriculus was significantly heavier (P<0.05) in
birds fed diet 4. Empty small intestine and its digesta content weighed lighter
(P<0.05) on diet 2.

32
Table 9: Organ weights (% live weight) of broilers fed copra meal with
different combinations of traditional protein sources
Parameters
Parameters (%)
Diets
D1 D2 D3 D4 D5 SEM
Liver 2.03ab 2.31a 1.93b 1.89b 2.04ab 0.111
Pancreas 0.27ab 0.22b 0.33a 0.23b 0.22b 0.025
Empty crop 0.24a 0.11b 0.22a 0.23a 0.19a 0.025
Digesta in the crop 0.02a 0.01b 0.01ab 0.02a 0.01a 0.002
Empty
proventriculus
0.44 0.44 0.46 0.50 0.49 0.030
Digesta in the
Proventriculus
0.01b 0.04b 0.06b 0.08a 0.06b 0.018
Empty gizzard 2.34 2.42 2.49 2.57 2.26 0.153
Digesta in the
gizzard
0.52 0.38 0.52 0.48 0.57 0.065
Empty small
intestine
2.62a 1.94b 2.71a 2.72a 2.78a 0.155
Digesta in small
intestine
0.15a 0.11b 0.16a 0.16a 0.16a 0.011
Empty caeca 0.38 0.38 0.38 0.37 0.41 0.039
Digesta in the
caeca
0.24 0.18 0.23 0.19 0.21 0.045
SEM: standard error of the mean
Values in the same row with the same superscript are not significantly different
(P=0.05)
D1: Control diet with no CM, D2: CM fed with FM + MBM, D3: CM fed with FM +
SBM, D4: CM fed with FM + SBM + MBM, D5: CM fed with SBM + MBM.

33
4.5 Feed cost of broiler meat production
The results of feed cost of meat production (Table 10) showed significant dietary
effects on feed cost per kilogram (kg) live weight and carcass weight (P<0.05). Feed
cost per kg live weight was significantly reduced (P<0.05) on diet 2 compared to
diets 1, 3 and 5. There was no statistical difference in feed cost per kg live weight
among birds fed diets 1, 3, 4 and 5 as well as between diets 2 and 4. Feed cost per kg
carcass was reduced (P<0.05) on diet 2.
Table 10: Feed cost of meat production of broilers fed copra meal with
different combinations of traditional protein sources
parameters
Diets
D1 D2 D3 D4 D5 SEM
Final weight (g)
1,866.25a 1,970.97a 1,646.95b 1,821.56ab 1,943.03a 65.091
Cost of feed
(ST$/kg)
2.88
2.49
2.54
2.58
2.71
NA
Carcass (%) 68.49a 69.56a 66.90a 66.27b 66.95ab 0.944
Feed Cost per kg
live weight (ST$)
7.48a
5.41b
7.77a
6.60ab
7.31a
0.459
Feed cost per kg
carcass (ST$)
10.94a 7.78b 11.65a 9.96a 10.89a 0.694
SEM: standard error of the mean; NA: not analyzed.
Values in the same row with the same superscript are not significantly different
(P=0.05)
D1: Control diet with no CM, D2: CM fed with FM + MBM, D3: CM fed with FM +
SBM, D4: CM fed with FM + SBM + MBM, D5: CM fed with SBM + MBM.

34
CHAPTER FIVE: DISCUSSION
5.1 Chemical analysis
The crude protein content of the experimental copra meal (21.1%, Table 3) is
within the range (20 -22%) reported in literature (Sundu et al., 2006; Sulabo et al.,
2013). The NSP content of the experimental copra meal (Table 3) is also in
agreement with earlier reports. Balasubramaniam et al. (1976) and Sundu et al.
(2006) all reported the presence of both soluble and insoluble NSPs in copra meal.
The amino acid composition of the feed ingredients (Table 4) showed a lower
profile in all essential amino acids. This corroborates earlier findings that copra meal
is characterized by low essential amino acids especially lysine and methionine (Son
et al., 2012; Sulabo et al., 2013).
5.2 Growth performance
Poor palatability (Göhl, 1982) mainly due to rancidity of stored copra meal
(Ehrlich et al., 1990) is known to affect its feeding value for poultry. The similarity
in feed intake among the control and copra meal-based diets in this study suggests
that there was no palatability problem. Copra meal for this experiment was collected
fresh on the day of oil extraction and used for the formulation to minimize the risk of
oxidation. A higher ME value was recorded on diet 3 compared to the other diets on
account of the high inclusion rates of full fat soybean (18.7% fat) and fish meal
(12.4%). This higher ME and ME/protein ratio was probably the main reason for
lower feed intake on diet 3 as birds feed to meet their energy requirement. This low
feed consumption with the resultant lower intake of individual essential nutrients is
probably the main reason for the poor growth performance observed on this diet. The
traditional protein sources used in diet 2 (fish meal and meat and bone meal) are
known to have higher protein digestibility than soybean meal (Zhou et al., 2004). In
addition they had higher essential nutrient density than soybean meal (Tables 3 and
4). Higher digestibility and availability of essential nutrients may explain the lower
feed intake by birds fed diet 2 compared to diet 5. Despite this lower daily feed
intake however, birds on diet 2 achieved a daily body weight gain similar to the
value (65g) reported for 42 day-old Cobb broilers (Cobb Broiler Management Guide,

35
2012) further suggesting ready availability of nutrients on this diet based on fish and
meat and bone meals. The superiority of animal proteins over plant protein sources in
broiler diets is well-documented (Vieira and Lima, 2005; Ojewola et al., 2005;
Bhuiyan et al., 2012a; Hossain et al., 2012a; 2013a). These differences in the
utilization of animal compared to plant protein sources maybe used to explain the
improved performance of birds on diets 1, and 2. Hossain et al. (2012a; 2013a)
observed better growth performance of broiler chickens fed diets containing fish
meal compared to those fed vegetable protein diets. The poor performance of birds
fed the copra meal-based diets containing soybean meal is in agreement with earlier
report by Sundu et al. (2006) who observed reduced growth performance of broilers
fed 10% dietary copra meal in corn-soybean diets. Growth performance differences
observed in this study suggest that differences in digestibility between plant and
animal protein sources is the major factor affecting the utilization of copra meal by
the broilers. The reduced growth performance of birds fed diet 4 maybe due to the
lower inclusion level of the animal protein sources (fish meal and meat and bone
meal) and the inclusion of two plant protein sources (soybean and copra meal). The
calculated composition of the experimental diets (Table 5) showed a higher total,
insoluble and soluble NSPs in diets 3, 4 and 5 (based on copra and soybean meals).
The anti-nutritional effect of NSPs in monogastric animals is well known (Ikegami et
al., 1990; Choct, 1997; Amerah et al., 2008; Stef et al., 2010). Dietary NSP acts by
encapsulation of starch and protein in the cell wall NSP, digesta viscosity which
reduces the diffusion of digestive enzymes (Amerah et al., 2008; Angkanaporn et al.,
1994), formation of complexes with digestive enzymes and endogenous losses of
amino acids (Angkanaporn et al., 1994). Poor digestibility of soybean carbohydrates
have also been reported (Kerley and Allee, 2003) probably due to the deleterious
effect of NSPs. Addition of soluble NSP to the diet has also been reported to increase
production of volatile fatty acids (VFAs) in the ileum (Choct et al., 1996). All these
deleterious effects might have contributed to the poor performance of birds fed copra
meal in soybean-based diets due to the additive effect of NSP from the two plant
protein sources. Contrary to the observation of Thomas and Scott (1962) who
attributed poor performance of birds fed copra meal-based diets to nutrient
imbalance, it appears from these results that nutrient availability rather than
imbalance is the major factor affecting the utilization of copra meal by broilers. The
findings of this study however, corroborate the observation of Sundu et al., (2006)
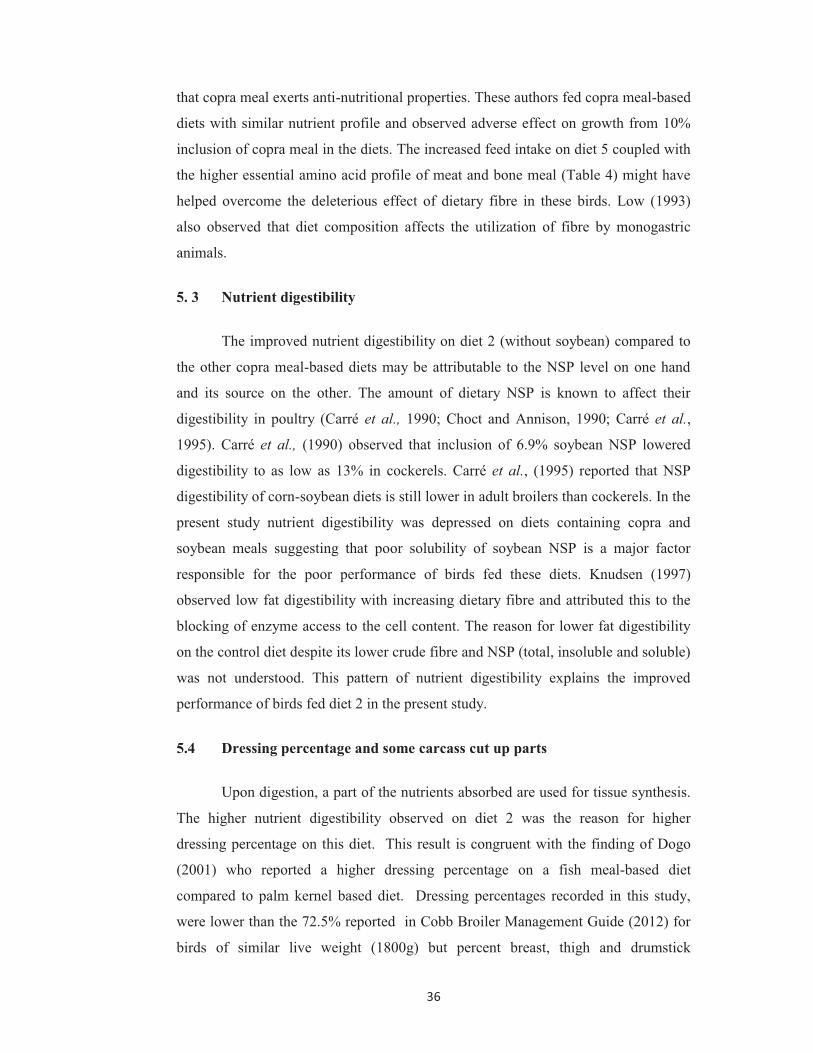
36
that copra meal exerts anti-nutritional properties. These authors fed copra meal-based
diets with similar nutrient profile and observed adverse effect on growth from 10%
inclusion of copra meal in the diets. The increased feed intake on diet 5 coupled with
the higher essential amino acid profile of meat and bone meal (Table 4) might have
helped overcome the deleterious effect of dietary fibre in these birds. Low (1993)
also observed that diet composition affects the utilization of fibre by monogastric
animals.
5. 3 Nutrient digestibility
The improved nutrient digestibility on diet 2 (without soybean) compared to
the other copra meal-based diets may be attributable to the NSP level on one hand
and its source on the other. The amount of dietary NSP is known to affect their
digestibility in poultry (Carré et al., 1990; Choct and Annison, 1990; Carré et al.,
1995). Carré et al., (1990) observed that inclusion of 6.9% soybean NSP lowered
digestibility to as low as 13% in cockerels. Carré et al., (1995) reported that NSP
digestibility of corn-soybean diets is still lower in adult broilers than cockerels. In the
present study nutrient digestibility was depressed on diets containing copra and
soybean meals suggesting that poor solubility of soybean NSP is a major factor
responsible for the poor performance of birds fed these diets. Knudsen (1997)
observed low fat digestibility with increasing dietary fibre and attributed this to the
blocking of enzyme access to the cell content. The reason for lower fat digestibility
on the control diet despite its lower crude fibre and NSP (total, insoluble and soluble)
was not understood. This pattern of nutrient digestibility explains the improved
performance of birds fed diet 2 in the present study.
5.4 Dressing percentage and some carcass cut up parts
Upon digestion, a part of the nutrients absorbed are used for tissue synthesis.
The higher nutrient digestibility observed on diet 2 was the reason for higher
dressing percentage on this diet. This result is congruent with the finding of Dogo
(2001) who reported a higher dressing percentage on a fish meal-based diet
compared to palm kernel based diet. Dressing percentages recorded in this study,
were lower than the 72.5% reported in Cobb Broiler Management Guide (2012) for
birds of similar live weight (1800g) but percent breast, thigh and drumstick

37
compared well with 21.25, 13.94 and 8.79% reported respectively for Cobb broilers
of this live weight (Cobb broiler Management Guide, 2012). Differences in diet
composition significantly affect dressing percentage in broilers. The increase gastro-
intestinal weight as a result of the high fibre content of the diets may explain the
lower dressing percentage in the present study.
5.5 Organ weights
The ready digestibility of diet 2 as suggested earlier, may be the reason for
higher liver weight of birds fed this diet as a response to increase secretion during
digestion and absorption. The pattern of the weight of gut segments and their digesta
content was not clear but probably due to the level of fibre fractions in the diet. The
effect of elevated levels of both soluble and insoluble NSP on gut morphology has
been reported. Shortening of digesta transit time as a result of feeding high levels of
insoluble NSP (Choct, 1997) and increase transit time on high levels of soluble NSP
(Choct et al., 1996) have been reported. As the emptying of the crop is dependent on
the rate of digestion in the lower segments of the gut, the lighter weight of the crop
and its digesta in birds fed diet 2 is an indication of faster breakdown of feed in these
segments of the gut. The lower digesta weight observed in most other segments of
the gut on diet 2 suggests a better utilization of this diet as earlier suggested. This
finding further confirms the superiority of animal over plant protein sources in
broiler diets.
5.6 Feed cost of broiler meat production
The cost of a kilogram diet was reduced on the experimental diets compared
to the control diet on account of the lower market price of copra meal. At the time of
the experiment a kg of copra meal sold for ST$0.7/kg against 3.80, 3.20, and 5.60 for
fish meal, meat and bone meal and soybean meal respectively. The higher market
price of soybean compared to other protein sources was the reason for reduced cost
of diet 2 which contained no soybean. The reduced feed cost coupled with the higher
final body weight and dressing percentage resulted in a reduced cost of meat
production on diet 2.

38
CHAPTER SIX: SUMMARY, CONCLUSION AND
RECOMMENDATIONS
A preliminary investigation on the effect of dietary protein source on the
utilization of 15% expeller copra meal in the diet by broiler chickens was conducted.
A control diet based on traditional protein sources (fish meal, meat and bone meal
and soybean meal) and 4 other diets containing 15% copra meal with different
combinations of these protein sources were formulated to contain 20% crude protein,
and about 1 and 0.4% lysine and methionine respectively. The diets were fed each to
4 replicates of 5 broilers in a completely randomized design for a period of 21 days.
Broiler performance was adversely reduced when copra meal was fed in combination
with soybean meal but this adverse effect was overcome when copra meal was fed
with animal protein sources (fish meal and meat and bone meal).
Based on these results it is concluded that copra meal exerts anti-nutritional
properties in broilers mainly through reduced nutrient availability. Feeding 15%
copra meal with soybean meal has deleterious effect on broiler performance but
when fed with animal proteins (fish meal and meat and bone meal), this level of
copra meal will reduce cost of meat production with no adverse effects on broiler
growth and nutrient utilization.
In the light of these findings, the following recommendations are made:
1. In order to further reduce feed cost, investigation into feeding higher levels of
copra meal with fish and meat and bone meals singly or in combination is
recommended;
2. In view of ready availability of copra meal in most countries of the region
research into its feeding value with other available animal protein sources is
warranted;
3. The variability in the composition of copra meal, calls for the need to conduct
more research into the value of copra meal from different processing methods
in the study area.

39
LIMITATIONS OF THE STUDY
The study had the following limitations:
1. Inadequate space and equipment on the research farm did not give room to
test different levels of copra meal. This could form the topic of another
research.
2. Gut morphology and histology would have given a better picture of the
pattern of the results. This was not possible due to inadequate laboratory
equipment.
3. Serum biochemistry is an important tool in nutritional investigations. This
was proposed but could not be done due to lack of laboratory/equipment in
the study area.

40
REFERENCES
Abasiekong, S. F. and Tyokpat, Y. (2000). Effect of supplementary methonine and
lysine on broiler chickens fed refermented brewers spent sorghum (Sorghum vulgare
L.) as chief dietary protein source In: Ukachukwu, S. N.; Ibeauchi, J. A., Ibe, S. N.;
Ezekwe, A. G. and Abasiekong, S. F. (eds), Animal Production in the New
Millennium: Challenges and Options, Pp. 184-187 Proceedings of the 25th Annual
Conference of Nigerian Society of Animal Production, Michael Okpara University of
Agriculture, Umudike, Nigeria, 19-23 March, 2000.
Aduku, A. O. (1992). Practical Livestock Feeds Production in the Tropics. First
edition, S. Asekome and Co. Publishers, P. O. Box 15, Samaru, Zaria.
Aftab, U., Ashraf, M. and Jiang, Z. (2006). Low protein diets for broilers. World’s
Poultry Science Journal 62: 688-701.
ALFID (2002). Australian Livestock Feed Ingredient Database. SARDI,
Roseworthy, SA, South Australia.
Ali, J. and Pappa, E. (2015). Global Meat Market Structural Changes across
Geographical Regions. South Asia Research 35, 143-157.
Amerah, A. M., Ravindran, V., Lentle, R. G. and Thomas, D. G. (2008). Influence of
particle size and xylanase supplementation on the performance, energy utilisation,
digestive tract parameters and digesta viscosity of broiler starters. British Poultry
Science 49: 455-462.
Angkanaporn, K., Choct, M., Bryden, W. L., Annison, E. F. and Annison, G. (1994).
Effects of wheat pentosans on endogenous amino acid losses in chickens. Journal of
Science Food Agriculture 66:399-404.
AOAC (1990). Association of Official Analytical Chemists. Official Methods of
Analysis 19th edition Washington DC.

41
APHD (2014). Animal Production and Health Division. Ministry of Agriculture,
Annual Report, Samoa.
Araba, M. and Dale, N. M. (1990). Evaluation of protein solubility as an indicator of
under processing soybean meal. Poultry Science 69:1749-1752.
Arends L. G., Brewer C. E. and Gehle M. H. (1971). Evaluation of heat processed
soybeans for caged layers. Poultry Science 50: 1546.
Askbrant, S. and Farrell, D. J. (1987). Utilization of oil rich seed meals determined
with chickens at different ages In: Farrell, D.J. (editor). Recent Advances in Animal
Nutrition, (Department of Biochemistry, Microbiology and Nutrition, University of
New England). Pp.182-186.
Ayalew, W. (2011). Improved use of local feed resources for mitigating the effects of
escalating food prices in PNG: a contribution for food security policy dialogue, Paper
presented at the National Research Institute Food Security Conference on High Food
Prices in PNG, September 1.
Baeza, E. and Leclercq, B. (1998). Use of industrial amino acids to allow low protein
concentrations in finishing diets for growing Muscovy ducks. British Poultry Science
39:90-96.
Baker, D. H., Fernandez, S. R., Webel, D. M. and Parsons, C.M. (1996). Sulphur
amino acid requirement and cysteine replacement value of broiler chicks during the
period 3 to 6 weeks post hatching. Poultry Science 75: 737-742.
Balasubramaniam, K. (1976). Polysaccharides of the kernel of maturing and matured
coconuts. Journal of Food Science 41:1370-1373.
Balnave, D. and Oliva, A. (1990). Responses of finishing broilers at high
temperatures to dietary methionine source and supplementation levels. Australian
Journal of Agricultural Research 41:557-564.

42
Balnave, D. and Brake, J. (2005). Nutrition and management of heat-stressed pullets
and laying hens. World Poultry Science Journal 61:399-406.
Bartov, I. (1998). Lack of inter–relationship between the effects of dietary factors
and withdrawal on carcass quality of broiler chickens. British Poultry Science 39:
426 – 433.
Bastos, S. C. ; Freire Fuentes, M. F. F. ; Freitas, E. R. ; Espíndola, G. B. ; Braga, C.
V. De P., (2007). Efeito da inclusão do farelo de coco em rações para frangos de
corte. Revista Ciencia Agronomica 38 (3): 297-303.
Bhuiyan, M. M., Clatworthy, G. and Iji, P. A. (2012a). Vegetable protein diets are
adequate but broiler chickens prefer animal protein diets. Worlds Poultry Science
Journal 68 (Supplement 1): 208-212.
Bhuiyan, M. M., Hossain, M. A. and Iji, P. A. (2012b). Preference of broiler
chickens for animal and vegetable protein diets. Australasian Medical Journal 5:
657.
Blair, R. (2008). Nutrition and feeding of organic poultry. CABI Series, CAB
International, Wallingford, UK. Pp. 209-247.
Butterworth, M. H., and Fox A. C. (1962). The effect of heat treatment on the
nutritive value of coconut meal and the prediction of the nutritive value by chemical
methods. British Journal of Nutrition 17:445-452.
Callet, C. (1965). The relative value of pellets versus mash and grain in poultry
nutrition. World's Poultry Science Journal 21: 23-52.
Canapi, E. C., Augustin, Y. T. V., Moro, E. A., Pedrosa, E. Jr. and Bendaño, M. L.,
(2005). Coconut Oil. In: Bailey's industrial oil products. 6th Edition, Volume 1 -
Edible Oil and Fat Products: Chemistry, Properties, and Health Effects. Shahidi, F.
(Eds.). WileyInterscience. http://www.mrw.interscience.wiley.com/biofp

43
Cancherini, L. C., Junqueira, O. M., Andreotti, M. O., Barbosa, M. J. B. and
Oliveira, M.C. (2004). Utilization of animal by-products in broilers diets based on
the concept on the crude and ideal protein in the period from 43 to 49 days of age.
Revista Brasileira de Zootecnia 33: 2060-2065.
Carré, B., Derouet, L. and Leclercq, B. (1990). The digestibility of cell-wall
polysaccharides from wheat (bran or whole grain), soybean meal, and white lupin
meal in cockerels, Muscovy ducks, and rats. Poultry Science 69:623-33.
Carré, B., Gomez, J. and Chagneau, A. M. (1995). Contribution of oligosaccharide
and polysaccharide digestion, and excreta losses of lactic acid and short chain fatty
acids, to dietary metabolizable energy values in broiler chickens and adult cockerels.
British Poultry Science 36:611-629.
Castaing, J., Paboeuf, F., and Skiba, F. (2003). Estimated need in apparent digestible
phosphorus finishing pigs: livestock trials of synthesis performed over the past ten
years. Days of Swine Research 35:47-54.
Chemnitz, C. (2014). Meat atlas: facts and figures about the animals we eat,
Heinrich-Böll Stiftung. Heinrich Böll Foundation, Berlin, Germany.
https://www.foeeurope.org/sites/default/files/publications/foee_hbf_meatatlas_jan20
14.pdf.
Choct, M., Hughes, R. J., Wang, J., Bedford, M. R., Morgan, A. J. and Annison, G.
(1996). Increased small intestinal fermentation is partly responsible for the anti-
nutritive activity of non-starch polysaccharides in chickens. British Poultry Science
37: 609-621.
Choct, M. (1997). Feed non-starch polysaccharides: Chemical structures and
nutritional significance. Feed Milling International, June. Pp. 13-26.
Choct, M. (2006). Enzymes for the feed industry: past present and future. World’s
Poultry Science Journal 62 (1): 5-15.

44
Choct, M., and Annison, G. (1990). Anti-nutritive activity of wheat pentosans in
broiler diets. British Poultry Science 30: 81 1-821.
Ciszuk, P., Charpentier, L. and Hult, E. (1998). Free-choice feeding for ecological
hens. Animal and Human nutrition research. FAKTA, Jordbruk. Sammanfattar
aktuell forskning vid SLU. Nr. 7.
Cobb Management Guide (2010). Cobb500 broiler performance-nutrition-
supplement. cobb-vantress.com.http://www.cobb-vantress.com/docs/default-
source/cobb-500 guides/Cobb500 Broiler _Performance _And Nutrition
_Supplement .pdf. (Accessed 30th October, 2015)
Cobb Broiler management guide (2012). Broiler management guide. Revised 2012.
http://cobb-vantress.com/docs/default-source/guides/cobb-broiler-management-
guide---english.pdf (Accessed 30th October, 2015)
Creswell, D. C. and Brooks, C. C. (1971). Compositions, apparent digestibility and
energy evaluation of coconut oil and coconut meal. Journal of Animal Science
33:366 -369.
Cruz, V. C., Pezzato, A. C., Pinheiro, D. F., Goncalves, J. C. and Sartori, J. R.
(2005). Effects of free-choice feeding on the performance and ileal digestibility of
nutrients in broilers. Brazilian Journal of Poultry Science 7: 143-150.
Cumming, R. B. (1992a). The advantages of free choice feeding for village chickens
19th World Poultry Congress. Amsterdam Proceedings. Amsterdam 3: 627-630.
Daghir, N. J. (1995). Replacement pullet and layer feeding and management in hot
climates. Poultry Production in Hot Climates (N.J. Daghir, Ed) CAB International,
Wallingford, UK. Pp.219-253.
Daghir, N. J. (2008). Poultry Production in Hot Climates. (N.J. Daghir, Ed) 2nd
Edition. CAB International, Wallingford, UK. Pp.133 –179.

45
Dairo F.A.S. and Fasuyi, A.O. (2008). Evaluation of fermented palm kernel meal and
fermented copra meal proteins as substitute for soybean meal protein in laying hens
diets. Journal of Central European Agriculture 9 (1): 35-44.
Damron, B. L. Harms, R. H. Arafa, A. S and Janky, D. M. (1977). The effect of
dietary lasolocid or monensin in the presence of raxorsone and graded methionine
levels on broiler performance and processing characteristics Poultry Science 56:
1487 – 1491.
Dana, N. and Olge, B. (2002). Effects of scavenging on diet selection and
performance of Rhode Island and Fatoumi breeds of chickens; Physiology and
Behaviour 34:743-749
Deschepper, K. and Degroote, G. (1995). Effect of dietary protein, essential and non
– essential amino acids on the performance and carcass composition of male broiler
chickens. British poultry science 36: 229 – 245.
Dewan S. and Gleaves E. W. (1969). Influence of protein volume and energy upon
feed intake regulation of laying hens. Poultry Science 48: 1806.
Diarra, S. S., Usman, B. A and Bukar-Kolo, Y. M. (2008). Some Beneficial effects
of dietary fibre in Poultry. African Journal of Medical Science 1 (1): 78-83.
Diarra, S. S., Sandakabatu, D., Perera, D., Tabuaciri, P. and Mohammed, U. (2014).
Growth performance and carcass yield of broiler chickens fed commercial
finisher and cassava copra meal-based diets. Asian Journal of Poultry Science 8 (1):
16-22.
Diarra, S. S. (2015). Utilization of cassava products-copra meal based diets
supplemented with or without Allzyme SSF by growing pullets. Malaysian
Journal of Animal Science 18 (1): 67-76.
Dogo, H. A. (2001). The effect of different levels of palm kernel cake on
performance and carcass characteristics of broiler chickens. In: Ubosi, C. O., Kibon,

46
A., Kwari, I. D. and Igwebuike, J. U. (eds) Meeting the Challenges of Animal
Production in the New Millenium Pp. 46-47. Proceedings, 6th Annual Conference of
the Animal Science Association of Nigeria, (2001). September 17-19, University of
Maiduguri Convocation Square.
Dusterhoft, E. M., Posthumus, M. A. and Voragen, A. G. J. (1992). Non-starch
polysaccharides from sunflower (helianthus annuus) meal and palm kernel (Elaeis
Guineensis) meal preparation of cell wall material and extraction of polysaccharide
fractions. Journal of the Science of Food and Agriculture 59: 151-160.
Ehrlich, W. K., Upton, P. C., Cowan, R. T., Moss, R. J. (1990). Copra meal as a
supplement for grazing dairy cows. Proceedings of the Australian Society of Animal
Production 18: 196-199.
Esteve – Garcia, E. and LIaurado, L. L. (1997). Performance, breast meat yield and
abdominal fat deposition of male broiler chickens fed diets supplemented with DL-
Methionine or DL-Methionine hydroxyl analogue free acid. British Poultry Science
38: 397–404.
Fanimo, A. O., Bamgbose, A. M., Abiola, M. O., Adediran, M. and Olaniyan, A. I.
(2005). Carcass yield and blood parameters of broiler chicken fed melon husk diets
supplements with yeast. Proceedings of 1st Nigeria International Poultry Summit, Feb
20-25, Ota, Ogun State, Nigeria. Pp. 60-63.
Farrell, D. J. (2005). Matching Poultry Production with Available Feed Resources:
Issues and Constraints. World’s Poultry Science Journal 61 (2): 298 – 307.
FAO, Food Outlook (2013). Food and Agriculture Organization, United Nations.
FAO (2002). FAOSTAT Food and Agriculture Organization: Agriculture Data.
http://appps.fao.org.
FAO (2010). Food and Agriculture Organization: Agribusiness Handbook. Poultry
meat and eggs. Rome, Italy.

47
FAO (2012). Food and Agriculture Organization: Feed Resources Information
System, Animal Health and Production Division, FAO, Rome.
http://www.fao.org/ag/AGA/AGAP/FRG/afris/default.htm
FAOSTAT (2009). Food and Agriculture Organization Statistics Division. Rome,
Italy.
Feedipedia (2011). Animal feed resources information system: copra meal and
coconut by-products. (Accessed 11th May 2015). http://www.feedipedia.org/node/46
Forbes, J. M. (2003). Wet foods for poultry. Avian and Poultry Biology Reviews 14:
175-193.
Gajana, C., TT, N., Muchenje, V. and Chimonyo, M. (2011). Effect of altering the
starter and finisher dietary phases on growth performance of broilers. African
Journal of Biotechnology 10(64): 14203-14208.
Glatz, P. C. (2012). Sustainable Small-Scale Poultry Production: Are Local
Feeds a Viable Option for the Pacific Region? (Accessed 11th May 2015)
http://knowledge.cta.int/.../Sustainable-SmallScale-Poultry-ProductionAre.
Graham, K. K., Kerley, M. S., Firman, J. D., and Allee G. L. (2002). The effect of
enzyme treatment of soybean meal on oligosaccharide disappearance and chick
growth performance. Poultry Science 81: 1014-1019.
Grayson, R. and Campbell, F. (2004). Improved Kokorako keeping. Kastom Gaden
Association and Terra Circle Association Inc., Honiara, Solomon Islands.
Göhl, B.O. (1982). Tropical Feeds 2nd edition, FAO, Rome, Italy
Grizzle, J., Iheanacho, M., Saxton, A. and Broaden, J. (1992). Nutritional and
environmental factors involved in eggshell quality of laying hens. British Poultry
Science 33: 781 – 794.

48
Gu, C., Pan, H., Sun, Z. and Qin, G. (2010). Effect of soybean variety on anti-
nutritional factors content, and growth performance and nutrients metabolism in rat.
International Journal of Molecular Science 11: 1048-1056.
Haskell, M. J., Vilarino, M., Savina, M., Atamna, J. and Picard, M. (2001). Do
broiler chicks have a cognitive representation of food quality? Appetitive,
behavioural and ingestive responses to a change in diet quality. Animal Behaviour
Science (72) 1 (2): 63-77.
Henuk, Y. L. and Dingle, J. G. (2002). Practical and economic advantages of choice
feeding systems for laying poultry. World’s Poultry Science Journal 58: 199-208
Hossain, M. A., Islam, A. F. and Iji, P. A. (2012a). Energy utilization and
performance of broiler chickens raised on diets with vegetable proteins or
conventional feeds. Asian Journal of Poultry Science 6: 117-128.
Hossain, M. A., Islam, A. F. and Iji, P. A. (2013a). Growth responses, excreta
quality, nutrient digestibility, bone development and meat yield traits of broiler
chickens fed on vegetable or animal protein diets. South African Journal of Animal
Science 43: 208-218.
Hossain, M. A., Bhuiyan, M. M. and Iji, P. A. (2015). Nutritive value of vegetable
protein diets for broiler chickens and selection of diets containing different
vegetable or animal proteins. World's Poultry Science Journal 71: 15-25.
Hurrell, R. F. (1990). Influence of the Maillard Reaction on nutritional value of
foods. In: The Maillard Reaction in foods processing, human nutrition and
physiology Pp. 245-358. Birkhauser Verlag, Basel, Switzerland.
Huyghebaert, G. and Pack, M. (1996). Effects of dietary protein content, addition of
nonessential amino acids and dietary methionine to cystine balance on responses to
dietary sulphur – containing amino acids in broilers. British Poultry Science 37: 623
– 639.

49
IFFOO. (2006). Fish meal industry overview. International Fish meal and Fish Oil
Organization. London, United Kingdom. www.iffo.org.
Iheukwumere, F. C., Inyang, O. A. and Ukpabi, U. H. (2001). Effect of age and sex
on carcass components and sensory evaluation of broiler meat In: Ubosi, C.O.;
Kibon, A.;
Kwari, I. D. and Igwebuike, J. U. (Eds). (2001). Meeting the Challenges of Animal
Production in the New Millennium. Pp. 24-26. Proceedings, 6th Annual Conference
of the Animal Science Association of Nigeria, September 17-19, 2001, University of
Maiduguri Convocation Square.
Ikegami, S., Tsuchihashi, F., Harada, H., Tsuchihashi, N., Nishide, E. and Innami, S.
(1990). Effect of viscous indigestible polysaccharides on pancreatic-biliary secretion
and digestive organs in rats. Journal of Nutrition 120: 353-360.
Iyayi, E. A., Taiwo, V. O. and Fagbohun, A. O. (2005). Performance, carcass
characteristics, haematological and histo-pathological studies of broilers fed mucuna
(Mucuna utilis) bean meal based diets. Israel Journal Veterinary Medicine 60(2): 51-
58.
http://isrvma.org/ImageToArticle/Files/Vol_%2060_2%20PERFORMANCE,%20C
ARCASS%20CHARACTERISTICS,%20HAEMATOLOGICAL.doc.
Jácome, I. M. T. D., Gomes da Silva, L. P., Guim, A., Lima, D. Q., Almeida, M. M.,
de Araújo, M. J., Oliveira, V. P., Silva, J. D. B., Martins, T. D. D. (2002). Effect of
different levels of coconut meal in broiler chicken's diets upon the carcass yield. Acta
Science Animal 24 (4): 1015-1019.
Kannan, M., Karunakaran, R., Balakrishnan, V. and Prabhakar, T. G. (2005).
Influence of prebiotics supplementation on lipid profile of broilers. International
Journal of Poultry Science 4: 994-997.
Karimi, A. (2006). The effects of varying fish meal inclusion levels (%) on
performance of broiler chicks. International Journal of Poultry Science 5: 255-258.

50
Kekeocha, C. C. (1984). Poultry Production Handbook. McMillan Ltd., London and
Basingstoke. pp. 87-89.
Kerley, M. S. and Allee, G. L. (2003). Modifications in soybean seed composition to
enhance Animal feed use and value: Moving from dietary ingredient to a functional
dietary component. AgBioForum 6 (1&2):14-17.
Kim, B. G., Lee, J. H., Jung, H. J., Han, Y. K, Park, K. M. and Han, I. K. (2001).
Effect of partial replacement of soybean meal with palm kernel meal and copra meal
on growth performance, nutrient digestibility and carcass characteristics of
finishing pigs. Asian- Australian Journal of Animal Science 14 (6): 821-830.
Kim, W. K.; Froelich, Jr.; Patterson, P. H. and Rickle, S. C. (2006). The potential to
reduce poultry nitrogen emissions with dietary methionine or methionine analogues
supplementation. World’s Poultry Science 62(2): 338-353.
Klasing, K. C. (2015). The Merck Veterinary Manual. Veterinary Professionals
Nutrition and Management: Poultry Merck Sharp and Dohme Corporation.
Kenilworth, N. J. USA.
http://www.merckvetmanual.com/mvm/poultry/nutrition_and_management_poultry/
management_of_growing_chickens.html Review May 2015.
Knudsen, K. E. B. (1997). Carbohydrate and lignin contents of plant materials used
in animal feeding. Animal Feed Science and Technology 67:319-338
Kurian, A. and Peter, K. V. (2007). Commercial crops technology: 8. Horticulture
Science Series. New India Publishing.
http://www.cabdirect.org/abstracts/20083269942.html
Lalshaw J. D. and Clayton P. C. (1976). Raw and heated full fat soybeans in laying
diets. Poultry Science 55: 1268.

51
Laseinde, E. A. C. and Oluyemi, J. A. (1994). Effect of sex separation at the finisher
stage on the comparative weight, growth performance, carcass characteristics and
breast muscle of broiler chickens. Nigerian Journal of Animal Production 21: 1-2.
Laudadio, V., Introna, M., Lastella, N. M. B. and Tufarelli V. (2014). Feeding of
low-fibre sunflower (Helianthus annus L.) meal as substitute of soybean meal in
turkey rations: effects on growth performance and meat quality. Japan Journal of
Poultry Science 51: 185-190.
Leeson, S. (2009). Nutrition and Health: Poultry. Dietary allowances for Poultry.
Department of Animal and Poultry Science, University of Guelph, Canada. Pp. 48-
49.
Leeson, S., Summers, J. D. and Caston, L. J. (1992). Response of broilers to feed
restriction or diet dilution in the finisher period. Poultry Science 71: 2056-2064.
Leeson, S. and Summers, J. D. (2001). Proteins and amino acids. In: Nutrition of the
Chicken, 4th Edition. S. Leeson and J.D. Summers Eds. University Books Guelph,
Ontario, Canada. Pp. 101-170.
Leeson, S. (2007). Vitamin requirements: is there basis for re-evaluating dietary
specifications. World’s Poultry Science Journal 63: 255-266.
Leyden, M. M. and Balnave, D. (1987). Lysine and methionine requirements of
broilers at high temperatures. Proceedings of the Nutrition Society of Australia. Pp.
112
Low, A. G. (1993). Role of dietary fibre in pig feeds. In Recent Developments in
Pig Nutrition 2. Cole, D. J. A., Haresign, W and Garnworthy, P.C. (Eds),
Nottingham, UK. Pp. 137-162.

52
Mack, S., Bercovici, D., De Groote, G., Leclercq, B., Lippens, M., Pack, M.,
Schuttle, J.B. and Van Cauwenberghe, S. (1999). Ideal amino acid profile and dietary
lysine specification for broiler chickens of 20 to 40 days of age. British Poultry
Science 40: 257-265.
Mahmood, S., Hassan, S., F. Ahmed, M. Ashraf, M. Alam and Muzaffar, A.
(2005). Influence of feed withdrawal for different durations on performance of
broilers in summer. International Journal of Agriculture and Biology 7: 975-978.
Mateos, G. G., Jimenez-Morean, E., Guzman, P., Saldana, B. and Lazaro, R. (2014).
Role of fibre in poultry diets- friend or foe? Poultry Beyond 2020. Linking research
to Practice. 5th international broiler nutritionist conference skyline Queenstown, New
Zealand. Pp. 207-222.
McCracken, K. J. (2002). Effects of physical processing on the nutritive value of
poultry diets, in: Mcnab, J. M. and Boorman, K. M. (Eds) Poultry feeds, supply,
composition and nutritive value. Pp. 301-316 (CABI publishing, New York).
Médale, F. and Kaushik, S. (2009). Protein sources in feed for farmed fish. In
Lazard, J.; Lesel, R. (Eds), Cahiers Agricultures 18 (2-3): 103-111
Mondal, G., Walli, T. K. and Patra, A. K. (2008). In vitro and in Sacco ruminal
degradability of Indian feed ingredients. Livestock Research for Rural
Development, Volume 20, Article #6. Retrieved August 30, 2014, from
http://www.lrrd.org/lrrd20/4/mond20063.htm
Nieuwkoop, D. (2004). Copra meal. Retrieved March 5, 2013, from 4 Forage
Animal Nutrition Supplies:
http://www.4forage.co.nz/aman/view.php?content=cgibin%2FviewArticleExt.cgi&ar
ticleID=46
Nir, I., Hillel, R., Ptichi, I. and Shefet, G. (1995). Effect of particle size and
performance. 3. Grinding pelleting interactions. Poultry Science 74: 771-783.

53
NRC. (1994). National Research Council: Nutrient Requirements of Poultry. 9th
edition. National Academy Press, Washington, D.C.
NRC. (2012). National Research Council. Nutrient requirements of swine. 11th
revised edition. National Academy Press., Washington, D C.
Nano, W., (2015). Performance of Australorp Layers Fed Copra Meal Protein
Concentrate and Sweet Potato Meal as Energy and Protein Sources in a Choice
Feeding System. Journal of South Pacific Agriculture 18 (2), 2015.
Ochetim, S. (1988). Effect of partial replacement of copra cake with dried brewer’s
grain on the performance of growing pigs. Alafua Agriculture Bulletin 13: 35-37.
OCED-FAO. (2013). Organization for Economic Cooperation and Development,
Food and Agriculture Organization: Agricultural Outlook. United Nations.
Ojewola, G. S., Okoye, F. C. and Ukoha O. A. (2005). Comparative utilization of
three animal protein sources by broiler chickens. International Journal of Poultry
Science 4 (7): 462-467.
Oluyemi, J. A. and Roberts, F. A. (2000). Poultry production in warm wet climates.
Macmillan Press Limited. 2nd edition. Spectrum Books Limited, Ibadan, Nigeria.
Olver, M. D. and Malan, D. D. (2000). The effect of choice feeding from 7 weeks of
age on the production characteristics of laying hens. South African Journal of Animal
Science 2: 30.
Omid, P. F., Hossein, B. and Reza, S. (2011). Efficacy of palm oil on commercial
chicks: performance traits. Research Opinions in Animal & Veterinary Science 1(12):
766-769.
Pandi, J. (2005). Dilution of broiler finisher feed with copra meal. PNG Journal of
Agriculture, Forestry and Fisheries 48 (1 & 2).

54
Panigrahi, S., Machin, D. H., Par, W. H. and Bainton, J. (1987). Responses of Broiler
chicks to dietary copra cake of high lipid content. British Poultry Science Journal 28:
589-600.
Parr, J. F. and Summers, J. D. (1991). The effect of minimizing amino-acid excesses
in broiler diets. Poultry Science 70: 1540-154.
Patterson, J. A. and Kung, J. L. (1988). Metabolism of DL-methionine and
methionine analogues by rumen microorganisms. Journal of Dairy Science 71: 3292-
3301.
Perez-Maldonado, R. A., Mannion, P. E. and Farrell, D. J. (1999). Optimum
inclusion of field peas, faba beans, chickpeas and sweet lupins in poultry diets. I.
Chemical composition and layer experiments. British Poultry Science 40: 667-673.
Pesti, G. M., Benevenga, N. J., Harper, A. E. and Sunde, M. L. (1981). The effects of
high dietary protein and nitrogen levels on the preformed methyl group requirement
and methionine-induced growth depression in chicks. Poultry Science 60: 425-432.
Pond, W. G., Church, D. C. and Pond, K. R. (1995). Basic Animal Nutrition and
Feeding 4th edition CIP, USA.
Poultry Trends, (2013). WATT Executive Guide to World Poultry. Medial Inc.
Duluth, Georgia.
Pousga, S., Boly, H. and Ogle, B. (2005). Choice feeding of poultry: a review.
Livestock Research for Rural Development 17: No.
5.http://www.lrrd.org/lrrd17/4/pous17045.htm
Proudfoot, F. G. and Hulan, H. W. (1982). Effects of reduced feeding time using all
mash or crumbled pellet dietary regiments on chicken broiler performance including
the incidence of acute death syndrome. Poultry Science 61: 750-754.

55
Ravindran V. (2011). Poultry feed availability and nutrition in developing countries -
Advances in poultry nutrition, Food and Agriculture Organization, Rome. Italy.
http://www.fao. org/docrep/013/al707e/al707e00.pdf
Ravindran, V. (2012). Advances and Future Directions in Poultry Nutrition:
An Overview. Korean Journal of Poultry Science 39 (1): 53-62.
http://dx.doi.org/10.5536/KJPS.2012.39.1.053
Roser, M. (2016). ‘World Population Growth’. Published online at
OurWorldInData.org. Retrieved from: http://ourworldindata.org/data/population-
growth-vital-statistics/world-population-growth/ (Online Resource) Retrieved 26th
March 2016.
Saittagaroon, S., Kawakishi, S. and Namiki, M. (1983). Characterization of
polysaccharides of copra meal. Journal of Science and Food and Agriculture 34:855-
860.
Salami, R. I., Longe, O. G. and Oluyemi, J. A. (2004). Effect of dietary protein levels
on the performance and carcass characteristics of cockerel finishers. Nigerian
Journal of Animal Production 31(1): 27-31.
Samoa Bureau of Statistics. (2014). In-depth Country assessment of the national
system of Agricultural and Rural Statistics in Samoa. Government of Samoa.
Sauvant, D., Perez. J. M. and Tran, G. (2004). Tables INRA-AFZ de composition
ET de valeur nutritive des matières premières destinées aux animaux d'élevage.
ISBN 2-7380 1046-62002, P.304. INRA Editions Versailles, France.
Say, R. R. (1992). Manual of Poultry Production in the Tropics, English edition,
published by CB International Pp.118.
Serres, H. (1999). Manual for pig production in the tropics. Technical Centre for
Agricultural and Rural Cooperation (CTA), CAB international, Wallingford, Oxon,
OX10 8DE, UK.

56
Schutte, J. B. and Pack, M. (1995). Effects of dietary Sulfur-containing amino acid
on performance and breast meat deposition of broiler chicks during the growing and
finishing phases. British Poultry Science 36: 747-762.
Siebra, J. E., DA, C., Ludke, M., DO, C. M. M., Ludke, J. V., Bertol, T. M., and
Dutra, W. M. J. R. (2008). Bio economic performance of growing finishing pigs fed
Diet with coconut meal. Revista Brasileira Zootecnia 37 (11): 1996-2002.
Sittaya, J and Yamauchi, K. (2014). Growth Performance and Histological Intestinal
Alterations of Sanuki Cochin Chickens fed diluted with untreated whole-grain paddy
rice.
Skinner, J. T., Waldroup, A. L. and Waldroup, P. W. (1992). Effects of removal of
vitamin and trace mineral supplements from grower and finishing diets on live
performance and carcass composition of broilers. Journal of Applied Poultry
Research 1: 208-286.
Smith, A. J. (2001). Poultry. CTA Tropical Agriculturalist Series. Technical Centre
for Agricultural and Rural Co-operation. Macmillan, London, UK and Wageningen.
The Netherlands, 242 pages.
Statistical Package for Social Sciences (2013). Statistical Package for Social Science.
Pc Version, SPSS Inc. 444 N. Michigan Avenue Chicago, United States of America.
Son, A. R., S. Y. Ji, and B. G. Kim. (2012). Digestible and metabolizable energy
concentrations in copra meal, palm kernel meal, and cassava root fed to growing
pigs. Journal of Animal Science 90:140-142.
Steel, R. G. D. and Torrie, J. H. (1980). Principles and Procedures of Statistics, A
Biometrical Approach, 2nd Edition McGraw Hills Book Co., New York, U.S.A.
57
Stef, L., Drinceanu, D., Corcionivoschi, N., Simiz, E., Stef, D., Julean, C. (2010).
Evaluating the anti-nutritive effect of non-starch polysaccharides (NSP) correlated
with the nutritional, digestive and productive performance indices in broilers.
Romanian Biotechnological Letters 15 (5): 5581-5590.
Sulabo, R. C., W. S. Ju, and H. H. Stein. (2013). Amino acid digestibility and
concentration of digestible and metabolizable energy in copra meal, palm kernel
expellers, and palm kernel meal fed to growing pigs. Journal of Animal Science
91:1391–1399.
Sundu, B., Kumar, A. and Dingle, J. (2004a). The effect of levels of copra meal and
enzymes on bird performance. Australian Poultry Science Symposium 16: 52-54.
Sundu, B., Kumar, A. and Dingle, J. (2004b). The effect of commercial enzymes on
chicks fed high copra meal and palm kernel meal diets. Proceedings Seminar
Nasional Pemanfaatan sumber Daya hayati berkelanjutan. Tadulako University
Press, Indonesia. Pp.26-31.
Sundu, B., Kumar, A. and Dingle, J. G. (2005a). Growth pattern of broilers fed a
physically or enzymatically treated copra meal diet. Australian Poultry Science
Symposium 17: 291-294.
Sundu, B., Kumar, A. and Dingle, J. G. (2005b). Comparison of feeding values of
palm kernel meal and copra meal for broilers. Recent advances in animal nutrition in
Australia 15: 28A.
Sundu, B., Kumar, A. and Dingle, J. (2006). Response of broiler chicks
fed increasing levels of copra meal and enzymes. International Journal of Poultry
Science 5 (1): 13 -18.
Sundu, B., Kumar, A. and Dingle, J. (2008). The Effect of Proportion of Crumbled
Copra Meal and Enzyme Supplementation on Broiler Growth and Gastrointestinal
Development. International Journal of Poultry Science 7 (5): 511-515.

58
Sundu, B., Kumar, A. and Dingle, J. (2009). Feeding value of copra meal for
Broilers. World Poultry Science Journal 65: 481-491.
Thomas O. A, and Scott M. L. (1962). Coconut oil meal as protein supplements in
practical poultry diets. Poultry Science. 41:477–485.
Thomas, M. and Van Der Poel, A. F. B. (1996). Physical quality of pelleted animal
feed. 1. Criteria for pellet quality. Animal Feed Science and Technology 61: 89-112.
Thorne, P. J. (1992). Alternatives to imported compound feed for growing pigs in
Solomon Islands. Tropical Agriculture 69 (2): 141-144.
Ullah, M. S., Pasha, T. N., Ali, Z., Saima, Khattak, F. M. and Hayat, Z. (2012).
Effects of Different Pre-starter diets on Broiler Performance, Gastro Intestinal Tract
Morphometry and Carcass Yield. The Journal of Animal & Plant Sciences 22(3):
570-575.
USDA (2012). National organic program; amendment to the national list of allowed
and prohibited substances (livestock). Federal Register 77:57985-57990
Van Soest, P. J. and Wine, R. H. (1967). Use of detergent in the analysis of fibrous
feeds for determination of plant ell wall constituents. Journal of Association of
Official Analytical Chemists 50: 50-55.
Vepa, S. S. (2004). Impact of globalization on the food consumption of urban
India. Globalization of food systems in developing countries: impact on food security
and nutrition 83: 215.
Vieira, S. L. and Lima, I. L. (2005). Live performance, water intake and excreta
characteristics of broiler fed all vegetable diets based on corn and soybean meal.
International Journal of Poultry Science 4: 365-368
59
Woodworth, J. C., Tokach, M. D., Goodband, R. D., Nelssen, J. L., O’Quinn, P. R.,
Knabe, D. A. and Said, N. W. (2001). Apparent ileal digestibility of amino acids and
digestible and metabolizable energy content of dry extruded-expelled soybean meal
and its effect on growth performance of pigs. Journal of Animal Science 79:1280-
1287.
Yalcin, S., Ozkan, S., Acikgoz, Z. and Ozkan, K. (1999). Effect of dietary
methionine on performance, carcass characteristics and breast meat composition of
heterozygous naked neck (Na/nat) birds under spring and summer conditions. British
Poultry Science 40:688-694.
Yalda, A. Y. and Forbes, J. M. (1996). Effects of food intake, soaking time, enzyme
and corn flour addition on the digestibility of the diet and performance of broilers
given wet food. British Poultry Science 37: 797-807.
Yasar, A. Y. and Forbes, J. M. (2000). Enzyme supplementation of dry and wet
wheat based food for broiler chickens: performance and gut responses. British
Journal of Nutrition 84: 297-307.
Zhou, Q. C., Tan, B. P., Mai, K. S. and Liu, Y. J. (2004). Apparent digestibility of
selected feed ingredients for juvenile cobia Rachycentron canadum. Aquaculture
241: 441-451.

60
APPENDICES
Appendix 1: ANOVA for Daily Feed Intake in week 1
Source
Type III Sum
of Squares df Mean Square F Sig.
Corrected
Model 631.561a 4 157.890 5.554 .006
Intercept 205349.298 1 205349.298 7223.371 .000
treat 631.561 4 157.890 5.554 .006
Error 426.427 15 28.428
Total 206407.286 20
Corrected Total 1057.988 19
a. R Squared = .597 (Adjusted R Squared = .489)
Appendix 2: ANOVA for Daily Weight Gain in week 1
Source
Type III Sum
of Squares df Mean Square F Sig.
Corrected
Model 627.282a 4 156.820 7.650 .001
Intercept 26634.051 1 26634.051 1299.236 .000
treat 627.282 4 156.820 7.650 .001
Error 307.497 15 20.500
Total 27568.830 20
Corrected Total 934.778 19
a. R Squared = .671 (Adjusted R Squared = .583)

61
Appendix 3: ANOVA for feed conversion ratio in week 1
Source
Type III Sum of
Squares df Mean Square F Sig.
Corrected
Model 2.928a 4 .732 6.924 .002
Intercept 160.291 1 160.291 1515.947 .000
treat 2.928 4 .732 6.924 .002
Error 1.586 15 .106
Total 164.806 20
Corrected
Total 4.514 19
a. R Squared = .649 (Adjusted R Squared = .555)
Appendix 4: ANOVA for final body weight in week 1
Source
Type III Sum of
Squares df Mean Square F Sig.
Corrected
Model 35706.800a 4 8926.700 7.404 .002
Intercept 21327320.450 1 21327320.450 17688.501 .000
treat 35706.800 4 8926.700 7.404 .002
Error 18085.750 15 1205.717
Total 21381113.000 20
Corrected Total 53792.550 19
a. R Squared = .664 (Adjusted R Squared = .574)

62
Appendix 5: ANOVA for Daily Feed Intake week 2
Source
Type III Sum
of Squares df Mean Square F Sig.
Corrected
Model 1000.103a 4 250.026 3.318 .039
Intercept 467962.765 1 467962.765 6209.856 .000
treat 1000.103 4 250.026 3.318 .039
Error 1130.371 15 75.358
Total 470093.239 20
Corrected
Total 2130.474 19
a. R Squared = .469 (Adjusted R Squared = .328)
Appendix 6: ANOVA for Daily weight gain week 2
Source
Type III Sum
of Squares df Mean Square F Sig.
Corrected
Model 550.541a 4 137.635 3.492 .033
Intercept 76896.121 1 76896.121 1950.744 .000
treat 550.541 4 137.635 3.492 .033
Error 591.283 15 39.419
Total 78037.945 20
Corrected
Total 1141.824 19
a. R Squared = .482 (Adjusted R Squared = .344)

63
Appendix 7: ANOVA for feed conversion ratio week 2
Source
Type III Sum
of Squares df Mean Square F Sig.
Corrected
Model .238a 4 .060 .949 .463
Intercept 124.151 1 124.151 1976.042 .000
treat .238 4 .060 .949 .463
Error .942 15 .063
Total 125.332 20
Corrected
Total 1.181 19
a. R Squared = .202 (Adjusted R Squared = -.011)
Appendix 8: ANOVA for final body weight week 2
Source
Type III Sum
of Squares df Mean Square F Sig.
Corrected
Model 250901.200a 4 62725.300 1.119 .384
Intercept 40140777.800 1 40140777.800 716.406 .000
treat 250901.200 4 62725.300 1.119 .384
Error 840461.000 15 56030.733
Total 41232140.000 20
Corrected
Total 1091362.200 19
a. R Squared = .230 (Adjusted R Squared = .025)

64
Appendix 9: ANOVA for Daily Feed Intake week 3
Source
Type III Sum
of Squares df Mean Square F Sig.
Corrected
Model 2008.509a 4 502.127 1.252 .332
Intercept 597625.421 1 597625.421 1489.618 .000
treat 2008.509 4 502.127 1.252 .332
Error 6017.908 15 401.194
Total 605651.838 20
Corrected Total 8026.417 19
a. R Squared = .250 (Adjusted R Squared = .050)
Appendix 10: ANOVA for Daily weight gain week 3
Source
Type III Sum
of Squares df Mean Square F Sig.
Corrected
Model 3006.064a 4 751.516 1.535 .242
Intercept 118144.580 1 118144.580 241.385 .000
treat 3006.064 4 751.516 1.535 .242
Error 7341.656 15 489.444
Total 128492.300 20
Corrected Total 10347.720 19
a. R Squared = .291 (Adjusted R Squared = .101)

65
Appendix 11: ANOVA for feed conversion ratio week 3
Source
Type III Sum
of Squares df Mean Square F Sig.
Corrected
Model 6.247a 4 1.562 1.576 .232
Intercept 127.866 1 127.866 129.012 .000
treat 6.247 4 1.562 1.576 .232
Error 14.867 15 .991
Total 148.980 20
Corrected Total 21.114 19
a. R Squared = .296 (Adjusted R Squared = .108)
Appendix 12: ANOVA for final body weight week 3
Source
Type III Sum of
Squares df Mean Square F Sig.
Corrected
Model 59162114.178a 4 14790528.545 .972 .452
Intercept 147411305.395 1 147411305.395 9.686 .007
treat 59162114.178 4 14790528.545 .972 .452
Error 228279534.137 15 15218635.609
Total 434852953.710 20
Corrected Total 287441648.315 19
a. R Squared = .206 (Adjusted R Squared = -.006)

66
Appendix 13: ANOVA for mean daily feed intake
Source
Type III Sum
of Squares df Mean Square F Sig.
Corrected
Model 1051.614a 4 262.903 3.468 .034
Intercept 405185.044 1 405185.044 5345.524 .000
treat 1051.614 4 262.903 3.468 .034
Error 1136.984 15 75.799
Total 407373.642 20
Corrected Total 2188.598 19
a. R Squared = .480 (Adjusted R Squared = .342)
Appendix 14: ANOVA for mean Daily weight gain
Source
Type III Sum
of Squares df Mean Square F Sig.
Corrected
Model 771.040a 4 192.760 2.909 .058
Intercept 68335.064 1 68335.064 1031.433 .000
treat 771.040 4 192.760 2.909 .058
Error 993.788 15 66.253
Total 70099.892 20
Corrected Total 1764.828 19
a. R Squared = .437 (Adjusted R Squared = .287)

67
Appendix 15: ANOVA for mean feed conversion ratio
Source
Type III Sum
of Squares df Mean Square F Sig.
Corrected
Model 1.617a 4 .404 3.293 .040
Intercept 136.974 1 136.974 1115.967 .000
treat 1.617 4 .404 3.293 .040
Error 1.841 15 .123
Total 140.432 20
Corrected Total 3.458 19
a. R Squared = .468 (Adjusted R Squared = .326)
Appendix 16: ANOVA for dressing percentage
Source
Type III Sum
of Squares df Mean Square F Sig.
Corrected
Model 29.259a 4 7.315 2.052 .138
Intercept 91487.159 1 91487.159 25665.501 .000
treat 29.259 4 7.315 2.052 .138
Error 53.469 15 3.565
Total 91569.887 20
Corrected Total 82.728 19
a. R Squared = .354 (Adjusted R Squared = .181)
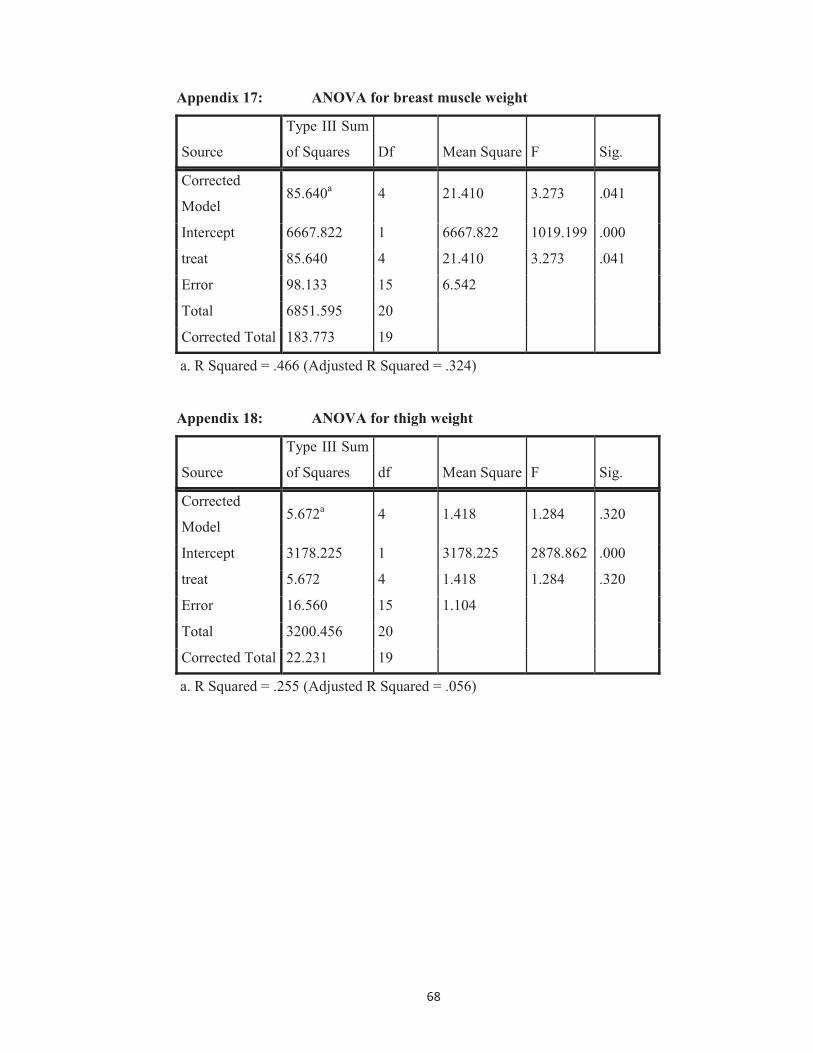
68
Appendix 17: ANOVA for breast muscle weight
Source
Type III Sum
of Squares Df Mean Square F Sig.
Corrected
Model 85.640a 4 21.410 3.273 .041
Intercept 6667.822 1 6667.822 1019.199 .000
treat 85.640 4 21.410 3.273 .041
Error 98.133 15 6.542
Total 6851.595 20
Corrected Total 183.773 19
a. R Squared = .466 (Adjusted R Squared = .324)
Appendix 18: ANOVA for thigh weight
Source
Type III Sum
of Squares df Mean Square F Sig.
Corrected
Model 5.672a 4 1.418 1.284 .320
Intercept 3178.225 1 3178.225 2878.862 .000
treat 5.672 4 1.418 1.284 .320
Error 16.560 15 1.104
Total 3200.456 20
Corrected Total 22.231 19
a. R Squared = .255 (Adjusted R Squared = .056)

69
Appendix 19: ANOVA for drumstick weight
Source
Type III Sum
of Squares df Mean Square F Sig.
Corrected
Model 11.590a 4 2.898 .633 .647
Intercept 1564.504 1 1564.504 341.616 .000
treat 11.590 4 2.898 .633 .647
Error 68.696 15 4.580
Total 1644.789 20
Corrected Total 80.286 19
a. R Squared = .144 (Adjusted R Squared = -.084)
Appendix 20: ANOVA for liver weight
Source
Type III Sum
of Squares df Mean Square F Sig.
Corrected
Model .425a 4 .106 2.137 .126
Intercept 82.987 1 82.987 1669.654 .000
treat .425 4 .106 2.137 .126
Error .746 15 .050
Total 84.158 20
Corrected Total 1.170 19
a. R Squared = .363 (Adjusted R Squared = .193)

70
Appendix 21: ANOVA for empty crop weight
Source
Type III Sum
of Squares df Mean Square F Sig.
Corrected
Model .044a 4 .011 4.306 .016
Intercept .780 1 .780 302.961 .000
treat .044 4 .011 4.306 .016
Error .039 15 .003
Total .863 20
Corrected Total .083 19
a. R Squared = .534 (Adjusted R Squared = .410)
Appendix 22: ANOVA for digesta weight in the crop
Source
Type III Sum
of Squares df Mean Square F Sig.
Corrected
Model .000a 4 4.250E-5 1.821 .177
Intercept .003 1 .003 123.429 .000
treat .000 4 4.250E-5 1.821 .177
Error .000 15 2.333E-5
Total .003 20
Corrected Total .001 19
a. R Squared = .327 (Adjusted R Squared = .147)
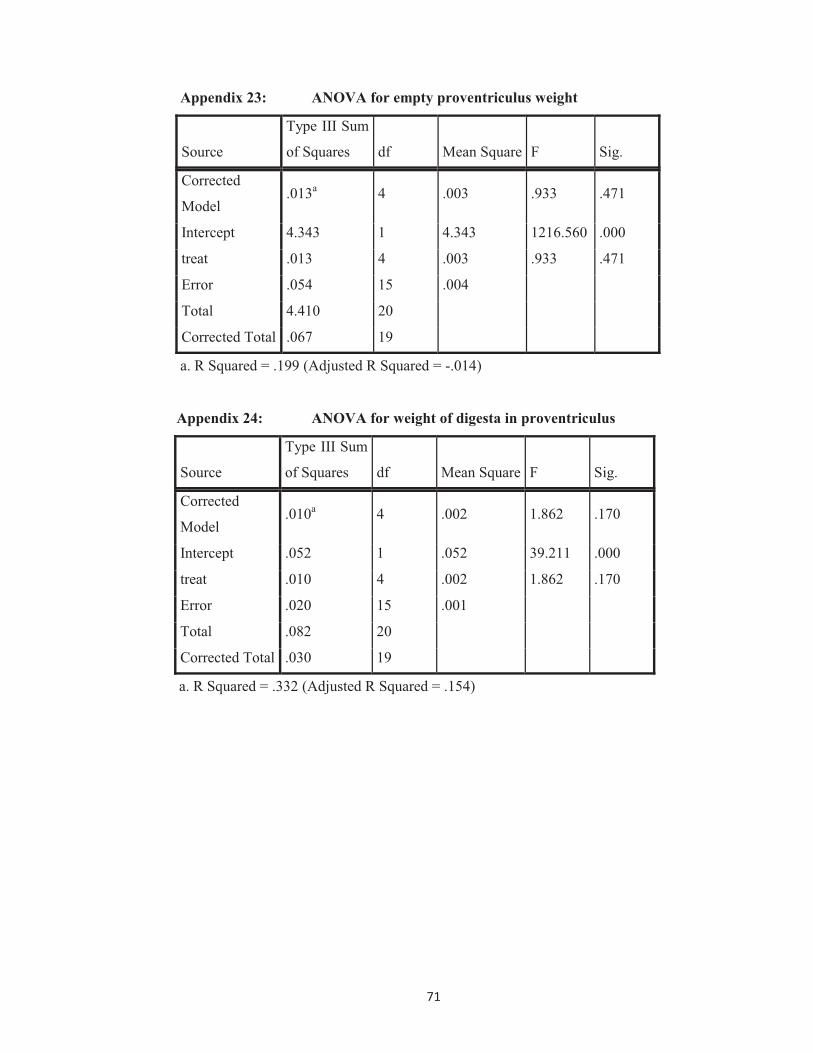
71
Appendix 23: ANOVA for empty proventriculus weight
Source
Type III Sum
of Squares df Mean Square F Sig.
Corrected
Model .013a 4 .003 .933 .471
Intercept 4.343 1 4.343 1216.560 .000
treat .013 4 .003 .933 .471
Error .054 15 .004
Total 4.410 20
Corrected Total .067 19
a. R Squared = .199 (Adjusted R Squared = -.014)
Appendix 24: ANOVA for weight of digesta in proventriculus
Source
Type III Sum
of Squares df Mean Square F Sig.
Corrected
Model .010a 4 .002 1.862 .170
Intercept .052 1 .052 39.211 .000
treat .010 4 .002 1.862 .170
Error .020 15 .001
Total .082 20
Corrected Total .030 19
a. R Squared = .332 (Adjusted R Squared = .154)

72
Appendix 25: ANOVA for weight of empty gizzard
Source
Type III Sum
of Squares df Mean Square F Sig.
Corrected
Model .240a 4 .060 .641 .641
Intercept 116.644 1 116.644 1245.005 .000
treat .240 4 .060 .641 .641
Error 1.405 15 .094
Total 118.290 20
Corrected Total 1.646 19
a. R Squared = .146 (Adjusted R Squared = -.082)
Appendix 26: ANOVA for weight of digesta in gizzard
Source
Type III Sum
of Squares df Mean Square F Sig.
Corrected
Model .082a 4 .021 1.211 .347
Intercept 4.861 1 4.861 286.727 .000
treat .082 4 .021 1.211 .347
Error .254 15 .017
Total 5.197 20
Corrected Total .336 19
a. R Squared = .244 (Adjusted R Squared = .043)

73
Appendix 27: ANOVA for weight of pancreas
Source
Type III Sum
of Squares df Mean Square F Sig.
Corrected
Model .033a 4 .008 3.350 .038
Intercept 1.285 1 1.285 515.128 .000
treat .033 4 .008 3.350 .038
Error .037 15 .002
Total 1.356 20
Corrected Total .071 19
a. R Squared = .472 (Adjusted R Squared = .331)
Appendix 28: ANOVA for weight of empty small intestine
Source
Type III Sum
of Squares df Mean Square F Sig.
Corrected
Model 1.919a 4 .480 4.993 .009
Intercept 130.356 1 130.356 1356.323 .000
treat 1.919 4 .480 4.993 .009
Error 1.442 15 .096
Total 133.717 20
Corrected Total 3.361 19
a. R Squared = .571 (Adjusted R Squared = .457)
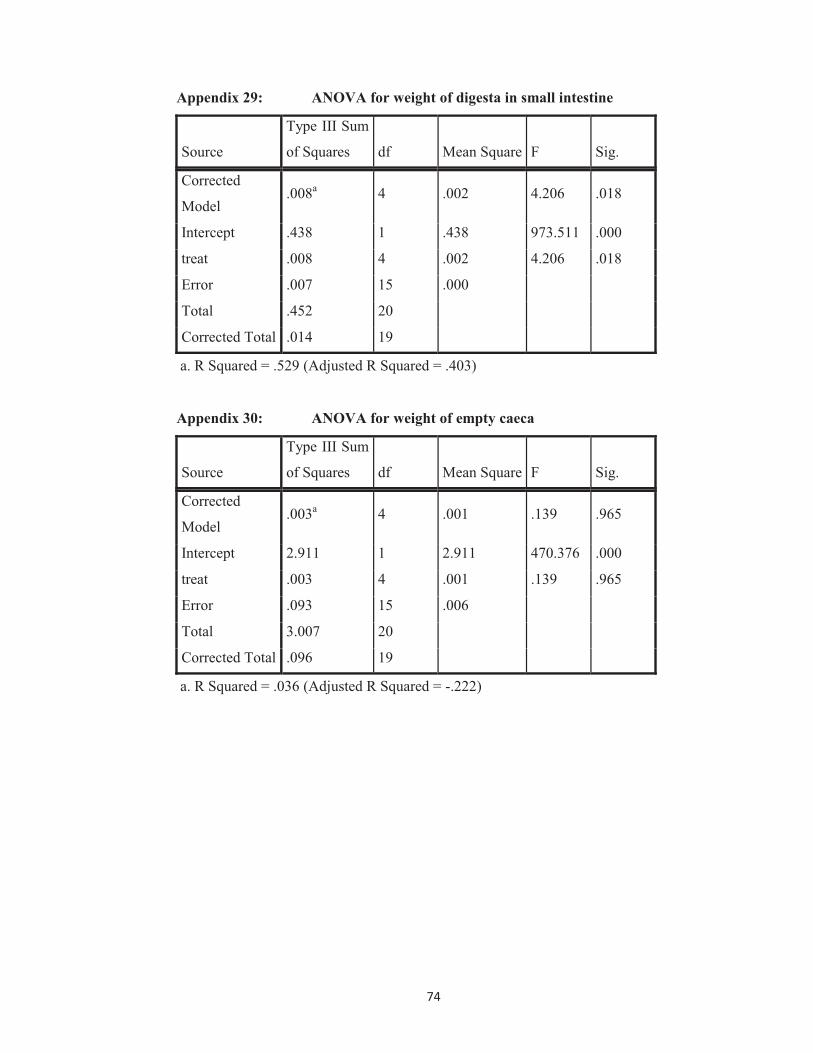
74
Appendix 29: ANOVA for weight of digesta in small intestine
Source
Type III Sum
of Squares df Mean Square F Sig.
Corrected
Model .008a 4 .002 4.206 .018
Intercept .438 1 .438 973.511 .000
treat .008 4 .002 4.206 .018
Error .007 15 .000
Total .452 20
Corrected Total .014 19
a. R Squared = .529 (Adjusted R Squared = .403)
Appendix 30: ANOVA for weight of empty caeca
Source
Type III Sum
of Squares df Mean Square F Sig.
Corrected
Model .003a 4 .001 .139 .965
Intercept 2.911 1 2.911 470.376 .000
treat .003 4 .001 .139 .965
Error .093 15 .006
Total 3.007 20
Corrected Total .096 19
a. R Squared = .036 (Adjusted R Squared = -.222)

75
Appendix 31: ANOVA for weight of digesta in caeca
Source
Type III Sum
of Squares df Mean Square F Sig.
Corrected
Model .011a 4 .003 .347 .842
Intercept .890 1 .890 111.395 .000
treat .011 4 .003 .347 .842
Error .120 15 .008
Total 1.021 20
Corrected Total .131 19
a. R Squared = .085 (Adjusted R Squared = -.160)
Appendix 32: ANOVA for cost per kilogram live weight
Source
Type III Sum
of Squares df Mean Square F Sig.
Corrected
Model 14.337a 4 3.584 4.255 .017
Intercept 956.206 1 956.206 1135.006 .000
treat 14.337 4 3.584 4.255 .017
Error 12.637 15 .842
Total 983.181 20
Corrected Total 26.974 19
a. R Squared = .532 (Adjusted R Squared = .407)

76
Appendix 33: ANOVA for cost per kilogram carcass
Source
Type III Sum
of Squares df Mean Square F Sig.
Corrected
Model 36.176a 4 9.044 4.696 .012
Intercept 2098.381 1 2098.381 1089.491 .000
treat 36.176 4 9.044 4.696 .012
Error 28.890 15 1.926
Total 2163.447 20
Corrected Total 65.066 19
a. R Squared = .556 (Adjusted R Squared = .438)
Appendix 34 ANOVA for dry matter digestibility
Source
Type III Sum
of Squares df Mean Square F Sig.
Corrected
Model 77.697a 4 19.424 2.402 .096
Intercept 130120.712 1 130120.712 16089.393 .000
treat 77.697 4 19.424 2.402 .096
Error 121.310 15 8.087
Total 130319.719 20
Corrected Total 199.007 19
a. R Squared = .390 (Adjusted R Squared = .228)

77
Appendix 35 ANOVA for crude protein digestibility
Source
Type III Sum
of Squares df
Mean
Square F Sig.
Corrected
Model 192.203a 4 48.051 6.065 .004
Intercept 127194.870 1 127194.870 16054.580 .000
treat 192.203 4 48.051 6.065 .004
Error 118.840 15 7.923
Total 127505.913 20
Corrected
Total 311.043 19
a. R Squared = .618 (Adjusted R Squared = .516)
Appendix 36 ANOVA for crude fibre digestibility
Source
Type III Sum
of Squares df Mean Square F Sig.
Corrected
Model 1129.378a 4 282.345 5.742 .005
Intercept 89863.099 1 89863.099 1827.576 .000
treat 1129.378 4 282.345 5.742 .005
Error 737.560 15 49.171
Total 91730.037 20
Corrected Total 1866.938 19
a. R Squared = .605 (Adjusted R Squared = .500)