effect of customers’ demographics on retail format …
TRANSCRIPT
[Kumar *, Vol.5 (Iss.1): January, 2017] ISSN- 2350-0530(O), ISSN- 2394-3629(P)
ICV (Index Copernicus Value) 2015: 71.21 IF: 4.321 (CosmosImpactFactor), 2.532 (I2OR)
InfoBase Index IBI Factor 3.86
Http://www.granthaalayah.com ©International Journal of Research - GRANTHAALAYAH [316]
Management
EFFECT OF CUSTOMERS’ DEMOGRAPHICS ON RETAIL FORMAT
CHOICE AND INTERACTION: A STUDY ON RETAIL SECTOR IN
INDIA
Dr. Pankaj Kumar *1
*1Assistant Professor, Department of Management Studies, Deenbandhu Chhotu Ram University
of Science & Technology, Murthal, Sonipat, Haryana, India
DOI: https://doi.org/10.29121/granthaalayah.v5.i1.2017.1906
Abstract
The purpose of the study is to examine how often customers interact with different types of retail
formats. A structured questionnaire was successfully distributed to 600 respondents, who had
made purchases from sixty retail formats operated in Delhi and Gurugram belonging to the
domain of Shopping Malls, Hypermarket, Supermarket, Department Stores, Discount stores and
Category Killers through systematic stratified sampling for the collection of data. To segment the
customer groups for each of the four retail formats (shopping mall, supermarket, department
store, and category killer) based on demographic variables (gender, age, marital status,
occupation, and income), a two-way ANOVA was used on the shopping frequency of the
respondents. The Chi-square (χ2) test was also used to test the significant differences in shopping
motives, companion during their visit, whether a planned or unplanned shopping trip, the staying
time in a retail format of the respondents based on their gender and age. The study found that
gender and age, gender and occupation, and gender and education are more or less equally
important factors, whereas gender and marital status, and gender and income were not found
important factors in affecting store visits. The study also found the behavioral aspect of retail
customers in many ways. First, their visits to the stores were primarily driven by purchase needs,
either window shopping or making actual purchases followed by eating. Second, more people
prefer to visit these stores along with their friends or family; this result contributes to that being
accompanied by others (Companion), shoppers more likely to buy food and less likely to buy
non-food products.
Keywords: Demographics; Retail Formats; Customers’ Interaction; Shopping Motives; India.
Cite This Article: Dr. Pankaj Kumar. (2017). “EFFECT OF CUSTOMERS’ DEMOGRAPHICS
ON RETAIL FORMAT CHOICE AND INTERACTION: A STUDY ON RETAIL SECTOR IN
INDIA.” International Journal of Research - Granthaalayah, 5(1),
316-331. https://doi.org/10.29121/granthaalayah.v5.i1.2017.1906.
[Kumar *, Vol.5 (Iss.1): January, 2017] ISSN- 2350-0530(O), ISSN- 2394-3629(P)
ICV (Index Copernicus Value) 2015: 71.21 IF: 4.321 (CosmosImpactFactor), 2.532 (I2OR)
InfoBase Index IBI Factor 3.86
Http://www.granthaalayah.com ©International Journal of Research - GRANTHAALAYAH [317]
1. Introduction
With an estimated population of 1.31 billion, India is the world’s second most populous country
after the People’s Republic of China and represents almost 17.31 per cent of the world’s
population, which means one out of six people on this planet lives in India. More than 50 per
cent of India’s current population is below the age of 25 and over 65 per cent below the age of 35
(India’s Population, 2016). Furthermore favourable changes in the socio-economic and
demographic arenas also increase the growth of retail sector in India, and Indians’ disposable
incomes are increasing, allowing them to spend more and try new products, brands, and
categories while spending a lower proportion on food and customers prefer to shop at organized
retail formats wherein they can get food & grocery, electronics items, apparel & footwear,
fashion accessories, entertainment and all other things they want to shop under one roof, for the
reason of saving their time, efforts and avoid expenses. Organized retailing is witnessing a wave
of players entering in the retail industry. These players are experimenting with various retail
formats ranging from beauty and health stores, supermarkets, hypermarket, self-service music
stores, to new age book stores, ordinary low price stores, computers and peripherals stores, office
equipment stores and home/building construction stores. Changes in the socio-economic and
demographic variables of customers effect massively to the growth of retail stores formats. In
order to achieve the goal of retailers, it is important to address the basic query that who are your
shopping prone customers? Understanding of this question will help to retailers to target the
appropriate customers and guide their marketing plans and strategies for target segment.
Interestingly, the question of “who are the retail store formats customers” has been a long studied
in the marketing literature, yet not answered completely and studies on shopper behaviour in
India have been limited in the context of demographic profile and their time & money spending
pattern towards a particular format of retail store (Sinha, 2003), and shopper’s decision to choose
“where to shop” varies largely across retail formats (Fox et al., 2004). This study examines the
relationship between customers’ demographics and their interaction towards different types of
store formats choice decisions in retailing in India. After the reviewing of existing literature, it is
found that most of the studies on retail sector are reported from developed countries and no
studies were identified that evaluate the effect of customers’ demographics on their interaction
with retail formats in India, so this study aims to fill in this gap and will help to understand that
“who are the repeatedly customers of retail formats and their store choices pattern in Indian
retailing context” and what are their motives of shopping towards in retail stores based on
(gender and age).
2. Review of Literature
Customers’ demographical factors such as gender, age, education, marital status, occupation,
income and family size massively influence the choice of retail format in grocery retailing
(Bellenger and Korgaonkar, 1980; Bawa and Ghosh, 1999; Fox et al., 2004; Carpenter and
Moore, 2006). Stone (1995) did the comparision of demographical profile of warehouse club
shoppers and super centres shoppers and exposed that the shoppers of warehouse club are young;
more educated and have high income level. Fox et al. (2004) investigated the effect of
demographics factors on the behaviour of retail customers’ decision towards grocery stores, mass
merchandisers, and drug stores and found the weak relationship between education, income,
family size and retail store choice moreover customers’ demographics influence his sensitivity
[Kumar *, Vol.5 (Iss.1): January, 2017] ISSN- 2350-0530(O), ISSN- 2394-3629(P)
ICV (Index Copernicus Value) 2015: 71.21 IF: 4.321 (CosmosImpactFactor), 2.532 (I2OR)
InfoBase Index IBI Factor 3.86
Http://www.granthaalayah.com ©International Journal of Research - GRANTHAALAYAH [318]
towards pricing of the products, which in turn influence his choice of store. Prasad and Aryasri
(2011) studied the effect of shoppers attributes on retail format choice behaviour for food and
grocery retailing in India and found the significant relationship between customers’
demographics and retail format choice decisions. Customers’ demographics such as gender, age,
education, occupation, income and family size except marital status significantly influence retail
format choice decisions of customers in food and grocery retailing in India, so it seems that
consumers who are younger, educated and higher incomes have greater patronages towards
modern grocery formats. Guidry and Montero (2005) resulted that over 70 per cent of customers
who visited a lifestyle centre make a specific purchase rather than to browse and window
shopping and the enjoyment of male shoppers have been influenced by the environmental
attributes of shopping centres (Lee et al., 2005). Carpenter (2008) concluded that the
involvements of female customers are more often in health and beauty products than male
customers in shopping at super centre, while the involvements of male customers are more often
in electronics products than female customers, moreover study found that the customers’
demographics (age, education, occupation, income and family size) are significant for home
furnishing, consumer electronics, and apparel. For apparel segment age and incomes showed
inverse relationship to shopping frequency of customers, whereas the size of family shows direct
relationship for selection of apparel products store. Furthermore age found significant but inverse
relationship in the segment of home furnishing shopping frequency at super centre. For consumer
electronics segment demographics factors such as age and education also showed inverse
relationship to shopping frequency at super centre. So result of the study as whole shows that the
age factor appears particularly promising and demonstrating significance in three out of the four
products segment and generally appears that younger customers take advantage of the shopping
under one roof provided by super centers.
2.1.Conceptual formation
Based on the reviewed of marketing literature on retail customers’ demographics, their shopping
frequency and store visit motives with various retail formats the conceptual framework of this
study preliminary consisted of two sections: the first section concerning with shopping frequency
of the respondents in four types of retail formats (Shopping Malls, Supermarket, Department
Stores, and Category Killers) based on their demographic variables (gender, age, marital status,
occupation, and income) and second section covered the retail customers’ shopping motives,
companions, planned or unplanned shopping trips, visiting frequency to a particular retail format,
and length of stay for shopping in a particular retail store/format related variables to segment
customer groups. For the purpose of the study of this section, a set of seven questions comprising
of general aspects including four items for ‘retail formats visited in the last three months’; six
items for ‘main reason to visit the retail format’, three items for ‘companion during visit to the
retail format’, two items for ‘planned or unplanned shopping trip’, three items for ‘retail format
visit frequency’ and three items for ‘time spent in the retail format’ have been analyzed. The
main emphasis of the present study is to examine how often customers interact with different
types of retail stores. Confirming the reviewed findings of prior researches, a set of 10 null
hypotheses was developed which is shown in table-1.

[Kumar *, Vol.5 (Iss.1): January, 2017] ISSN- 2350-0530(O), ISSN- 2394-3629(P)
ICV (Index Copernicus Value) 2015: 71.21 IF: 4.321 (CosmosImpactFactor), 2.532 (I2OR)
InfoBase Index IBI Factor 3.86
Http://www.granthaalayah.com ©International Journal of Research - GRANTHAALAYAH [319]
Table 1: Hypotheses
H1a: There is no association between shopping frequency in retail formats of customers
based on their gender and age.
H1b: There is no association between shopping frequency of customers based on their
gender and age in four types of retail formats.
H2a: There is no association between shopping frequency in retail formats of customers
based on their gender and marital status.
H2b: There is no association between shopping frequency of customers based on their
gender and marital status in four types of retail formats.
H3a: There is no association between shopping frequency in retail formats of customers
based on their gender and occupation
H3b: There is no association between shopping frequency of customers based on their
gender and occupation in four types of retail formats.
H4a: There is no association between shopping frequency in retail formats of customers
based on their gender and education.
H4b: There is no association between shopping frequency of customers based on their
gender and education in four types of retail formats.
H5a: There is no association between shopping frequency in retail formats of customers
based on their gender and income.
H5b: There is no association between shopping frequency of customers based on their
gender and income in four types of retail formats.
3. Materials and Methods
The purpose of the study is to examine how often customers interact with different types of retail
store formats. A structured questionnaire was successfully distributed to 600 respondents, who
had made purchases from sixty retail formats operated in Delhi and Gurugram belonging to the
domain of Shopping Malls, Hypermarket, Supermarket, Department Stores, Discount stores and
Category Killers through systematic stratified sampling for the collection of data, reason being
Delhi and Gurugram as the area has a high migrated and heterogeneous residents with various
dimensions such as religious, caste, traditions, social hierarchy, language, literacy, education,
occupation and income etc. Out of 600 distributed questionnaires, 461 questionnaires were filled
by respondents, 84 incomplete questionnaires were not used for analysis and 377 questionnaires
were valid ones; thus the effective recovery rate was 62.83 per cent and respondents were
personally administered. SPSS (Version17.0) was used for analysis in this study. Internal
consistency analysis was used to access the reliability of measurements. Cronbach’s α-value is
commonly used for this purpose and α-value must be higher than 0.70 (Nunnally, 1978). To
segment the consumer groups for each of the four retail formats (shopping mall, supermarket,
department store, and category killer) based on demographic variables (gender, age, marital
status, occupation, and income), a two-way ANOVA was used on the shopping frequency of the
respondents. The Chi-square (χ2) test was also used to test the significant differences in shopping
motives, companion during their visit, whether a planned or unplanned shopping trip, the staying
time in a retail format of the respondents based on their gender and age.
[Kumar *, Vol.5 (Iss.1): January, 2017] ISSN- 2350-0530(O), ISSN- 2394-3629(P)
ICV (Index Copernicus Value) 2015: 71.21 IF: 4.321 (CosmosImpactFactor), 2.532 (I2OR)
InfoBase Index IBI Factor 3.86
Http://www.granthaalayah.com ©International Journal of Research - GRANTHAALAYAH [320]
3.1.Internal Consistency Analysis
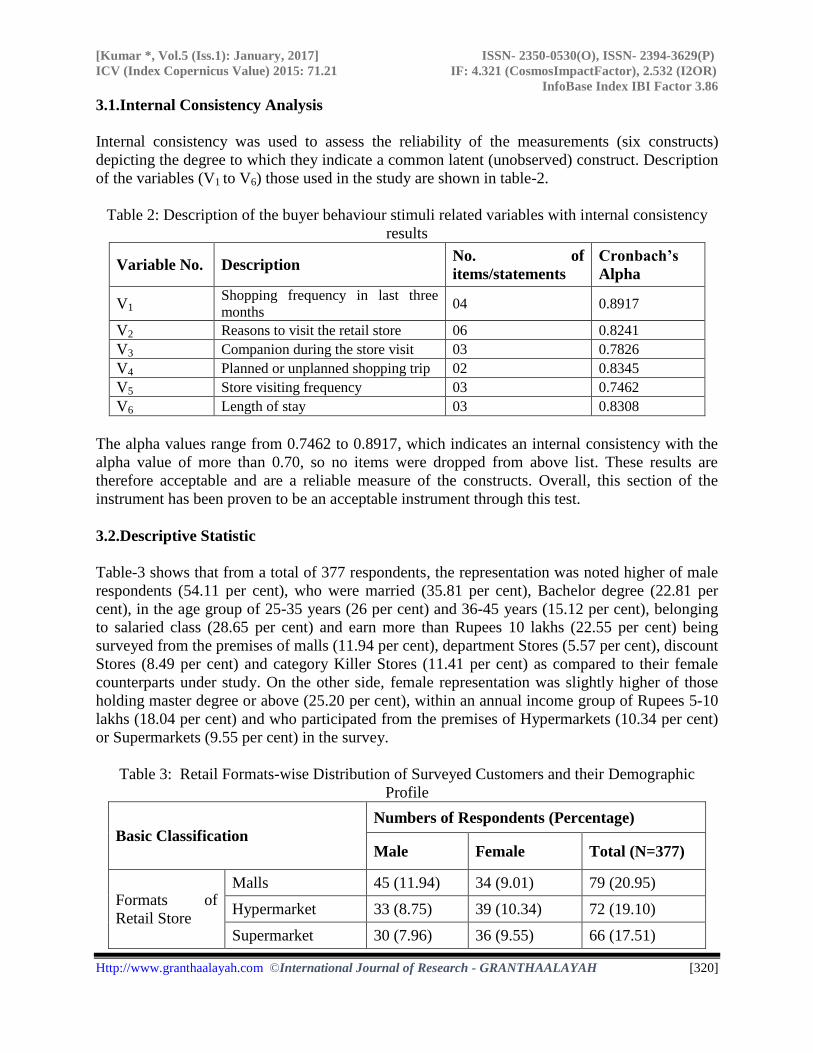
Internal consistency was used to assess the reliability of the measurements (six constructs)
depicting the degree to which they indicate a common latent (unobserved) construct. Description
of the variables (V1 to V6) those used in the study are shown in table-2.
Table 2: Description of the buyer behaviour stimuli related variables with internal consistency
results
Variable No. Description No. of
items/statements
Cronbach’s
Alpha
V1 Shopping frequency in last three
months 04 0.8917
V2 Reasons to visit the retail store 06 0.8241
V3 Companion during the store visit 03 0.7826
V4 Planned or unplanned shopping trip 02 0.8345
V5 Store visiting frequency 03 0.7462
V6 Length of stay 03 0.8308
The alpha values range from 0.7462 to 0.8917, which indicates an internal consistency with the
alpha value of more than 0.70, so no items were dropped from above list. These results are
therefore acceptable and are a reliable measure of the constructs. Overall, this section of the
instrument has been proven to be an acceptable instrument through this test.
3.2.Descriptive Statistic
Table-3 shows that from a total of 377 respondents, the representation was noted higher of male
respondents (54.11 per cent), who were married (35.81 per cent), Bachelor degree (22.81 per
cent), in the age group of 25-35 years (26 per cent) and 36-45 years (15.12 per cent), belonging
to salaried class (28.65 per cent) and earn more than Rupees 10 lakhs (22.55 per cent) being
surveyed from the premises of malls (11.94 per cent), department Stores (5.57 per cent), discount
Stores (8.49 per cent) and category Killer Stores (11.41 per cent) as compared to their female
counterparts under study. On the other side, female representation was slightly higher of those
holding master degree or above (25.20 per cent), within an annual income group of Rupees 5-10
lakhs (18.04 per cent) and who participated from the premises of Hypermarkets (10.34 per cent)
or Supermarkets (9.55 per cent) in the survey.
Table 3: Retail Formats-wise Distribution of Surveyed Customers and their Demographic
Profile
Basic Classification
Numbers of Respondents (Percentage)
Male Female Total (N=377)
Formats of
Retail Store
Malls 45 (11.94) 34 (9.01) 79 (20.95)
Hypermarket 33 (8.75) 39 (10.34) 72 (19.10)
Supermarket 30 (7.96) 36 (9.55) 66 (17.51)

[Kumar *, Vol.5 (Iss.1): January, 2017] ISSN- 2350-0530(O), ISSN- 2394-3629(P)
ICV (Index Copernicus Value) 2015: 71.21 IF: 4.321 (CosmosImpactFactor), 2.532 (I2OR)
InfoBase Index IBI Factor 3.86
Http://www.granthaalayah.com ©International Journal of Research - GRANTHAALAYAH [321]
Department Store 21 (5.57) 19 (5.04) 40 (10.61)
Discount Store 32 (8.49) 15 (3.98) 47 (12.47)
Category Killers 43 (11.41) 30 (7.96) 73 (19.36)
Age
< 25 years 21 (5.57) 23 (6.10) 44 (11.67)
25-35 Years 98 (26.00) 65 (17.24) 163 (43.24)
36-45 Years 57 (15.12) 49 (13.00) 106 (28.12)
> 45Years 28 (7.42) 36 (9.55) 64 (16.97)
Highest Level
of Education
Diploma or below 31 (8.22) 11 (2.92) 42 (11.14)
Bachelor Degree 86 (22.81) 67 (17.80) 153 (40.57)
Master Degree or
above 87 (23.08) 95 (25.20) 182 (48.28)
Marital Status Single 69 (18.30) 56 (14.85) 125 (33.16)
Married 135 (35.81) 117 (31.04) 252 (66.84)
Occupation
Student 17 (4.51) 06 (1.59) 23 (6.10)
Housewife 0 (0.0) 18 (4.77) 18 (4.77)
Salaried 108 (28.65) 101 (26.79) 209 (55.44)
Self-Business 79 (20.95) 48 (12.73) 127 (33.69)
Annual Income
(In Rupees)
< Rupees 5 lakhs 52 (13.79) 57 (15.12) 109 (28.91)
Rupees 5-10 lakhs 67 (17.77) 68 (18.04) 135 (35.81)
> Rupees 10 lakhs 85 (22.55) 48 (12.73) 133 (35.29)
Total (N= 377) 204 (54.11) 173 (45.89) 377 (100)
Furthermore, out of 377 respondents, 20.95 per cent from the premises of Shopping Malls, 19.36
per cent from Category Killers, 19.10 per cent from Hypermarkets, 17.51 per cent from
Supermarkets, 12.47 per cent from Discount Stores and 10.61 per cent from Department Stores,
were the participants in the final survey.
4. Results and Discussions
Customers’ Interaction with Different Type of Retail Formats:
To analyze how often customers interact with different type of retail stores, the study examined
the shopping frequency of the respondents in four type of retail formats (Shopping Mall,
Supermarket, Department Store, and Category Killer) based on their demographic variables
(gender, age, marital status, occupation, and income), their shopping motives, companions,
planned or unplanned shopping trips, visiting frequency to a particular retail format and length of
stay for shopping in a particular retail store/format related variables to segment consumer groups.
[Kumar *, Vol.5 (Iss.1): January, 2017] ISSN- 2350-0530(O), ISSN- 2394-3629(P)
ICV (Index Copernicus Value) 2015: 71.21 IF: 4.321 (CosmosImpactFactor), 2.532 (I2OR)
InfoBase Index IBI Factor 3.86
Http://www.granthaalayah.com ©International Journal of Research - GRANTHAALAYAH [322]
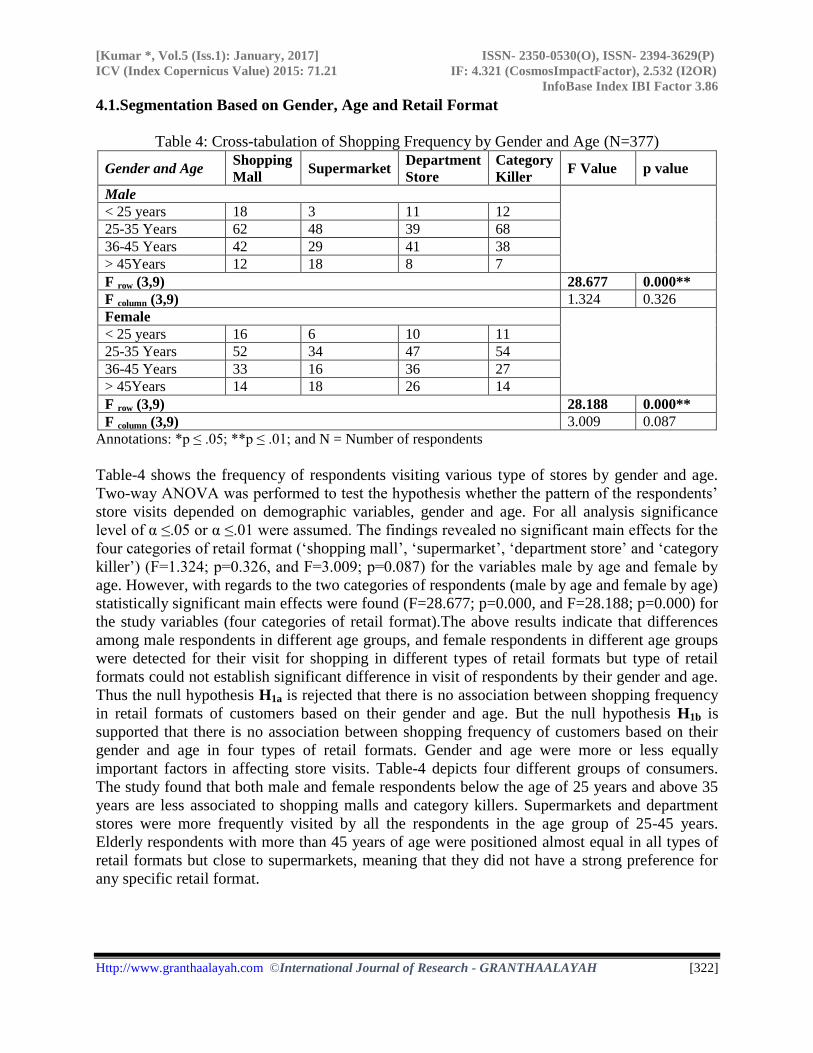
4.1.Segmentation Based on Gender, Age and Retail Format
Table 4: Cross-tabulation of Shopping Frequency by Gender and Age (N=377)
Gender and Age Shopping
Mall Supermarket
Department
Store
Category
Killer F Value p value
Male
< 25 years 18 3 11 12
25-35 Years 62 48 39 68
36-45 Years 42 29 41 38
> 45Years 12 18 8 7
F row (3,9) 28.677 0.000**
F column (3,9) 1.324 0.326
Female
< 25 years 16 6 10 11
25-35 Years 52 34 47 54
36-45 Years 33 16 36 27
> 45Years 14 18 26 14
F row (3,9) 28.188 0.000**
F column (3,9) 3.009 0.087
Annotations: *p ≤ .05; **p ≤ .01; and N = Number of respondents
Table-4 shows the frequency of respondents visiting various type of stores by gender and age.
Two-way ANOVA was performed to test the hypothesis whether the pattern of the respondents’
store visits depended on demographic variables, gender and age. For all analysis significance
level of α ≤.05 or α ≤.01 were assumed. The findings revealed no significant main effects for the
four categories of retail format (‘shopping mall’, ‘supermarket’, ‘department store’ and ‘category
killer’) (F=1.324; p=0.326, and F=3.009; p=0.087) for the variables male by age and female by
age. However, with regards to the two categories of respondents (male by age and female by age)
statistically significant main effects were found (F=28.677; p=0.000, and F=28.188; p=0.000) for
the study variables (four categories of retail format).The above results indicate that differences
among male respondents in different age groups, and female respondents in different age groups
were detected for their visit for shopping in different types of retail formats but type of retail
formats could not establish significant difference in visit of respondents by their gender and age.
Thus the null hypothesis H1a is rejected that there is no association between shopping frequency
in retail formats of customers based on their gender and age. But the null hypothesis H1b is
supported that there is no association between shopping frequency of customers based on their
gender and age in four types of retail formats. Gender and age were more or less equally
important factors in affecting store visits. Table-4 depicts four different groups of consumers.
The study found that both male and female respondents below the age of 25 years and above 35
years are less associated to shopping malls and category killers. Supermarkets and department
stores were more frequently visited by all the respondents in the age group of 25-45 years.
Elderly respondents with more than 45 years of age were positioned almost equal in all types of
retail formats but close to supermarkets, meaning that they did not have a strong preference for
any specific retail format.
[Kumar *, Vol.5 (Iss.1): January, 2017] ISSN- 2350-0530(O), ISSN- 2394-3629(P)
ICV (Index Copernicus Value) 2015: 71.21 IF: 4.321 (CosmosImpactFactor), 2.532 (I2OR)
InfoBase Index IBI Factor 3.86
Http://www.granthaalayah.com ©International Journal of Research - GRANTHAALAYAH [323]
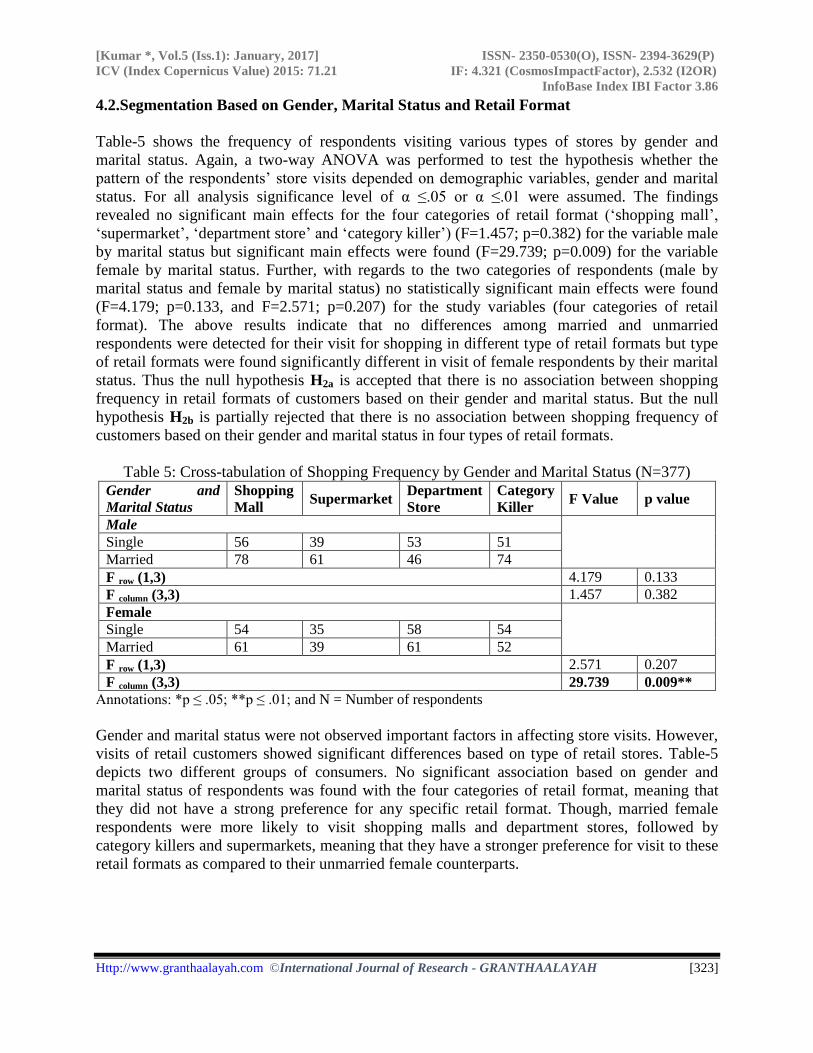
4.2.Segmentation Based on Gender, Marital Status and Retail Format
Table-5 shows the frequency of respondents visiting various types of stores by gender and
marital status. Again, a two-way ANOVA was performed to test the hypothesis whether the
pattern of the respondents’ store visits depended on demographic variables, gender and marital
status. For all analysis significance level of α ≤.05 or α ≤.01 were assumed. The findings
revealed no significant main effects for the four categories of retail format (‘shopping mall’,
‘supermarket’, ‘department store’ and ‘category killer’) (F=1.457; p=0.382) for the variable male
by marital status but significant main effects were found (F=29.739; p=0.009) for the variable
female by marital status. Further, with regards to the two categories of respondents (male by
marital status and female by marital status) no statistically significant main effects were found
(F=4.179; p=0.133, and F=2.571; p=0.207) for the study variables (four categories of retail
format). The above results indicate that no differences among married and unmarried
respondents were detected for their visit for shopping in different type of retail formats but type
of retail formats were found significantly different in visit of female respondents by their marital
status. Thus the null hypothesis H2a is accepted that there is no association between shopping
frequency in retail formats of customers based on their gender and marital status. But the null
hypothesis H2b is partially rejected that there is no association between shopping frequency of
customers based on their gender and marital status in four types of retail formats.
Table 5: Cross-tabulation of Shopping Frequency by Gender and Marital Status (N=377)
Gender and
Marital Status
Shopping
Mall Supermarket
Department
Store
Category
Killer F Value p value
Male
Single 56 39 53 51
Married 78 61 46 74
F row (1,3) 4.179 0.133
F column (3,3) 1.457 0.382
Female
Single 54 35 58 54
Married 61 39 61 52
F row (1,3) 2.571 0.207
F column (3,3) 29.739 0.009**
Annotations: *p ≤ .05; **p ≤ .01; and N = Number of respondents
Gender and marital status were not observed important factors in affecting store visits. However,
visits of retail customers showed significant differences based on type of retail stores. Table-5
depicts two different groups of consumers. No significant association based on gender and
marital status of respondents was found with the four categories of retail format, meaning that
they did not have a strong preference for any specific retail format. Though, married female
respondents were more likely to visit shopping malls and department stores, followed by
category killers and supermarkets, meaning that they have a stronger preference for visit to these
retail formats as compared to their unmarried female counterparts.
[Kumar *, Vol.5 (Iss.1): January, 2017] ISSN- 2350-0530(O), ISSN- 2394-3629(P)
ICV (Index Copernicus Value) 2015: 71.21 IF: 4.321 (CosmosImpactFactor), 2.532 (I2OR)
InfoBase Index IBI Factor 3.86
Http://www.granthaalayah.com ©International Journal of Research - GRANTHAALAYAH [324]
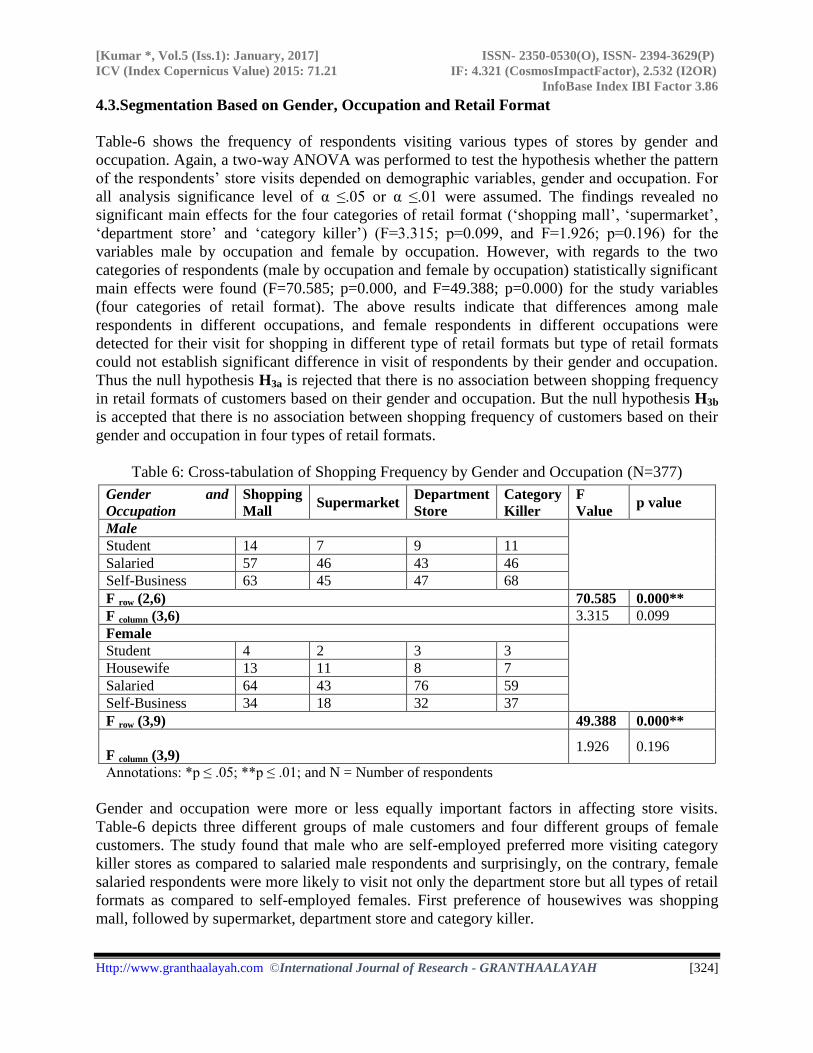
4.3.Segmentation Based on Gender, Occupation and Retail Format
Table-6 shows the frequency of respondents visiting various types of stores by gender and
occupation. Again, a two-way ANOVA was performed to test the hypothesis whether the pattern
of the respondents’ store visits depended on demographic variables, gender and occupation. For
all analysis significance level of α ≤.05 or α ≤.01 were assumed. The findings revealed no
significant main effects for the four categories of retail format (‘shopping mall’, ‘supermarket’,
‘department store’ and ‘category killer’) (F=3.315; p=0.099, and F=1.926; p=0.196) for the
variables male by occupation and female by occupation. However, with regards to the two
categories of respondents (male by occupation and female by occupation) statistically significant
main effects were found (F=70.585; p=0.000, and F=49.388; p=0.000) for the study variables
(four categories of retail format). The above results indicate that differences among male
respondents in different occupations, and female respondents in different occupations were
detected for their visit for shopping in different type of retail formats but type of retail formats
could not establish significant difference in visit of respondents by their gender and occupation.
Thus the null hypothesis H3a is rejected that there is no association between shopping frequency
in retail formats of customers based on their gender and occupation. But the null hypothesis H3b
is accepted that there is no association between shopping frequency of customers based on their
gender and occupation in four types of retail formats.
Table 6: Cross-tabulation of Shopping Frequency by Gender and Occupation (N=377)
Gender and occupation were more or less equally important factors in affecting store visits.
Table-6 depicts three different groups of male customers and four different groups of female
customers. The study found that male who are self-employed preferred more visiting category
killer stores as compared to salaried male respondents and surprisingly, on the contrary, female
salaried respondents were more likely to visit not only the department store but all types of retail
formats as compared to self-employed females. First preference of housewives was shopping
mall, followed by supermarket, department store and category killer.
Gender and
Occupation
Shopping
Mall Supermarket
Department
Store
Category
Killer
F
Value p value
Male
Student 14 7 9 11
Salaried 57 46 43 46
Self-Business 63 45 47 68
F row (2,6) 70.585 0.000**
F column (3,6) 3.315 0.099
Female
Student 4 2 3 3
Housewife 13 11 8 7
Salaried 64 43 76 59
Self-Business 34 18 32 37
F row (3,9) 49.388 0.000**
F column (3,9) 1.926 0.196
Annotations: *p ≤ .05; **p ≤ .01; and N = Number of respondents
[Kumar *, Vol.5 (Iss.1): January, 2017] ISSN- 2350-0530(O), ISSN- 2394-3629(P)
ICV (Index Copernicus Value) 2015: 71.21 IF: 4.321 (CosmosImpactFactor), 2.532 (I2OR)
InfoBase Index IBI Factor 3.86
Http://www.granthaalayah.com ©International Journal of Research - GRANTHAALAYAH [325]
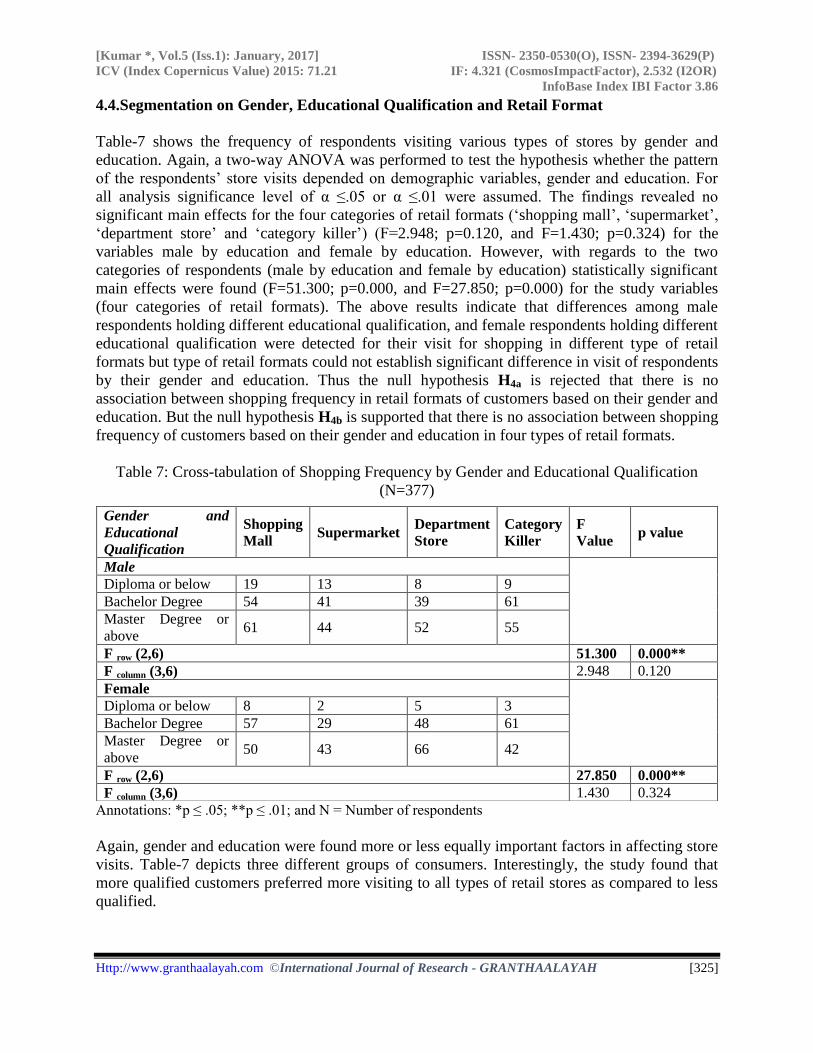
4.4.Segmentation on Gender, Educational Qualification and Retail Format
Table-7 shows the frequency of respondents visiting various types of stores by gender and
education. Again, a two-way ANOVA was performed to test the hypothesis whether the pattern
of the respondents’ store visits depended on demographic variables, gender and education. For
all analysis significance level of α ≤.05 or α ≤.01 were assumed. The findings revealed no
significant main effects for the four categories of retail formats (‘shopping mall’, ‘supermarket’,
‘department store’ and ‘category killer’) (F=2.948; p=0.120, and F=1.430; p=0.324) for the
variables male by education and female by education. However, with regards to the two
categories of respondents (male by education and female by education) statistically significant
main effects were found (F=51.300; p=0.000, and F=27.850; p=0.000) for the study variables
(four categories of retail formats). The above results indicate that differences among male
respondents holding different educational qualification, and female respondents holding different
educational qualification were detected for their visit for shopping in different type of retail
formats but type of retail formats could not establish significant difference in visit of respondents
by their gender and education. Thus the null hypothesis H4a is rejected that there is no
association between shopping frequency in retail formats of customers based on their gender and
education. But the null hypothesis H4b is supported that there is no association between shopping
frequency of customers based on their gender and education in four types of retail formats.
Table 7: Cross-tabulation of Shopping Frequency by Gender and Educational Qualification
(N=377)
Annotations: *p ≤ .05; **p ≤ .01; and N = Number of respondents
Again, gender and education were found more or less equally important factors in affecting store
visits. Table-7 depicts three different groups of consumers. Interestingly, the study found that
more qualified customers preferred more visiting to all types of retail stores as compared to less
qualified.
Gender and
Educational
Qualification
Shopping
Mall Supermarket
Department
Store
Category
Killer
F
Value p value
Male
Diploma or below 19 13 8 9
Bachelor Degree 54 41 39 61
Master Degree or
above 61 44 52 55
F row (2,6) 51.300 0.000**
F column (3,6) 2.948 0.120
Female
Diploma or below 8 2 5 3
Bachelor Degree 57 29 48 61
Master Degree or
above 50 43 66 42
F row (2,6) 27.850 0.000**
F column (3,6) 1.430 0.324

[Kumar *, Vol.5 (Iss.1): January, 2017] ISSN- 2350-0530(O), ISSN- 2394-3629(P)
ICV (Index Copernicus Value) 2015: 71.21 IF: 4.321 (CosmosImpactFactor), 2.532 (I2OR)
InfoBase Index IBI Factor 3.86
Http://www.granthaalayah.com ©International Journal of Research - GRANTHAALAYAH [326]
4.5.Segmentation Based on Gender, Income and Retail Format
Table-8 shows the frequency of respondents visiting various types of stores by gender and
income. Again, a two-way ANOVA was performed to test the hypothesis whether the pattern of
the respondents’ store visits depended on demographic variables, gender and income. For all
analysis significance level of α ≤.05 or α ≤.01 were assumed. The findings revealed no
significant main effects for the four categories of retail formats (‘shopping mall’, ‘supermarket’,
‘department store’ and ‘category killer’) (F=1.589; p=0.288, and F=2.765; p=0.134) for the
variables male by income and female by income. Also, with regards to the two categories of
respondents (male by income and female by income) no statistically significant main effects
were found (F=2.679; p=0.147, and F=2.604; p=0.153) for the study variables (four categories of
retail formats). The above results detect no significant differences among respondents by gender
and income for their visit for shopping in different type of retail formats and also the type of
retail formats could not establish significant difference in visit of respondents by their gender and
income. Thus the null hypothesis H5a is accepted that there is no association between shopping
frequency in retail formats of customers based on their gender and income. Also, the null
hypothesis H5b is accepted that there is no association between shopping frequency of customers
based on their gender and income in four types of retail formats.
Table 8: Cross-tabulation of Shopping Frequency by Gender and Annual Income (N=377)
Annotations: *p ≤ .05; **p ≤ .01; and N = Number of respondents
Gender and income were not found important factors in affecting store visits. Table-8 depicts
three different groups of consumers. Surprisingly, the study did not find any significant
association between the respondents belonging to different income groups and about their visits
to different type of retail formats, meaning that all customers irrespective of their gender and
level of income have equal preference for different retail formats.
Gender and
Income
Shopping
Mall Supermarket
Department
Store
Category
Killer F Value p value
Male
< Rupees 5 lakhs 41 33 26 21
Rupees 5-10
lakhs 49 31 34 48
> Rupees 10
lakhs 44 34 39 56
F row (2,6) 2.679 0.147
F column (3,6) 1.589 0.288
Female
< Rupees 5
lakhs 38 22 34 18
Rupees 5-10
lakhs 36 29 41 41
> Rupees 10
lakhs 41 23 44 47
F row (2,6) 2.604 0.153
F column (3,6) 2.765 0.134
[Kumar *, Vol.5 (Iss.1): January, 2017] ISSN- 2350-0530(O), ISSN- 2394-3629(P)
ICV (Index Copernicus Value) 2015: 71.21 IF: 4.321 (CosmosImpactFactor), 2.532 (I2OR)
InfoBase Index IBI Factor 3.86
Http://www.granthaalayah.com ©International Journal of Research - GRANTHAALAYAH [327]
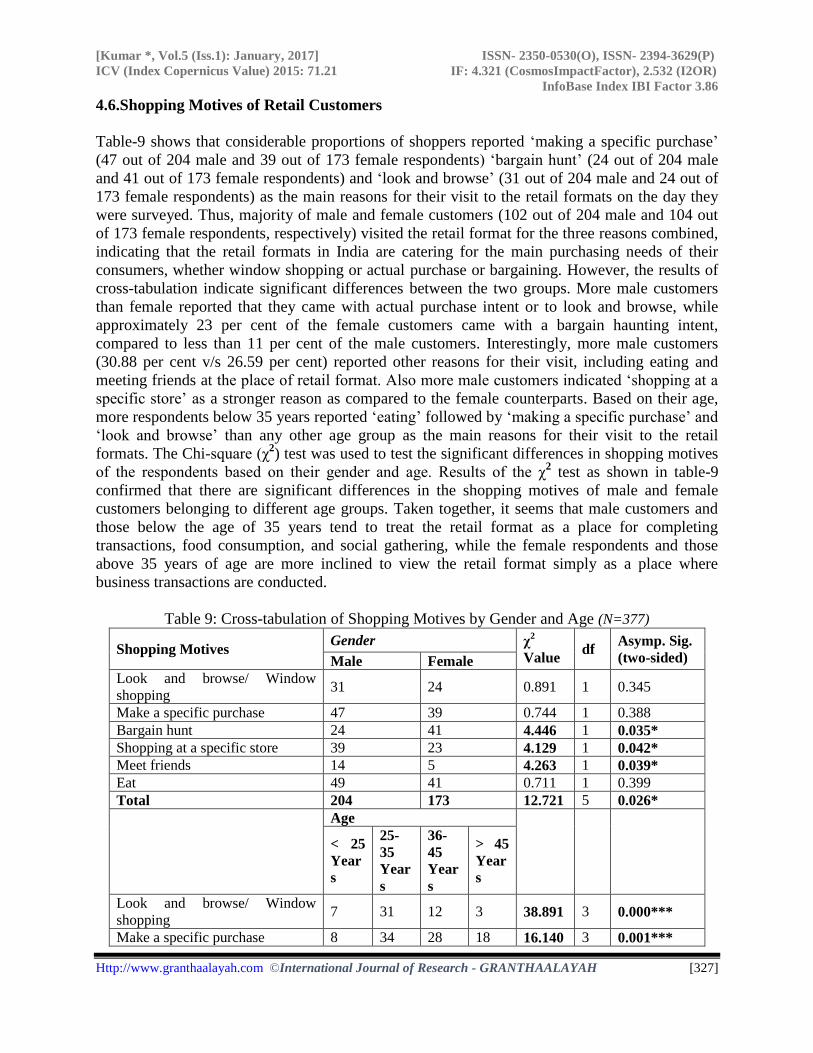
4.6.Shopping Motives of Retail Customers
Table-9 shows that considerable proportions of shoppers reported ‘making a specific purchase’
(47 out of 204 male and 39 out of 173 female respondents) ‘bargain hunt’ (24 out of 204 male
and 41 out of 173 female respondents) and ‘look and browse’ (31 out of 204 male and 24 out of
173 female respondents) as the main reasons for their visit to the retail formats on the day they
were surveyed. Thus, majority of male and female customers (102 out of 204 male and 104 out
of 173 female respondents, respectively) visited the retail format for the three reasons combined,
indicating that the retail formats in India are catering for the main purchasing needs of their
consumers, whether window shopping or actual purchase or bargaining. However, the results of
cross-tabulation indicate significant differences between the two groups. More male customers
than female reported that they came with actual purchase intent or to look and browse, while
approximately 23 per cent of the female customers came with a bargain haunting intent,
compared to less than 11 per cent of the male customers. Interestingly, more male customers
(30.88 per cent v/s 26.59 per cent) reported other reasons for their visit, including eating and
meeting friends at the place of retail format. Also more male customers indicated ‘shopping at a
specific store’ as a stronger reason as compared to the female counterparts. Based on their age,
more respondents below 35 years reported ‘eating’ followed by ‘making a specific purchase’ and
‘look and browse’ than any other age group as the main reasons for their visit to the retail
formats. The Chi-square (χ2) test was used to test the significant differences in shopping motives
of the respondents based on their gender and age. Results of the χ2 test as shown in table-9
confirmed that there are significant differences in the shopping motives of male and female
customers belonging to different age groups. Taken together, it seems that male customers and
those below the age of 35 years tend to treat the retail format as a place for completing
transactions, food consumption, and social gathering, while the female respondents and those
above 35 years of age are more inclined to view the retail format simply as a place where
business transactions are conducted.
Table 9: Cross-tabulation of Shopping Motives by Gender and Age (N=377)
Shopping Motives Gender χ
2
Value df
Asymp. Sig.
(two-sided) Male Female
Look and browse/ Window
shopping 31 24 0.891 1 0.345
Make a specific purchase 47 39 0.744 1 0.388
Bargain hunt 24 41 4.446 1 0.035*
Shopping at a specific store 39 23 4.129 1 0.042*
Meet friends 14 5 4.263 1 0.039*
Eat 49 41 0.711 1 0.399
Total 204 173 12.721 5 0.026*
Age
< 25
Year
s
25-
35
Year
s
36-
45
Year
s
> 45
Year
s
Look and browse/ Window
shopping 7 31 12 3 38.891 3 0.000***
Make a specific purchase 8 34 28 18 16.140 3 0.001***
[Kumar *, Vol.5 (Iss.1): January, 2017] ISSN- 2350-0530(O), ISSN- 2394-3629(P)
ICV (Index Copernicus Value) 2015: 71.21 IF: 4.321 (CosmosImpactFactor), 2.532 (I2OR)
InfoBase Index IBI Factor 3.86
Http://www.granthaalayah.com ©International Journal of Research - GRANTHAALAYAH [328]
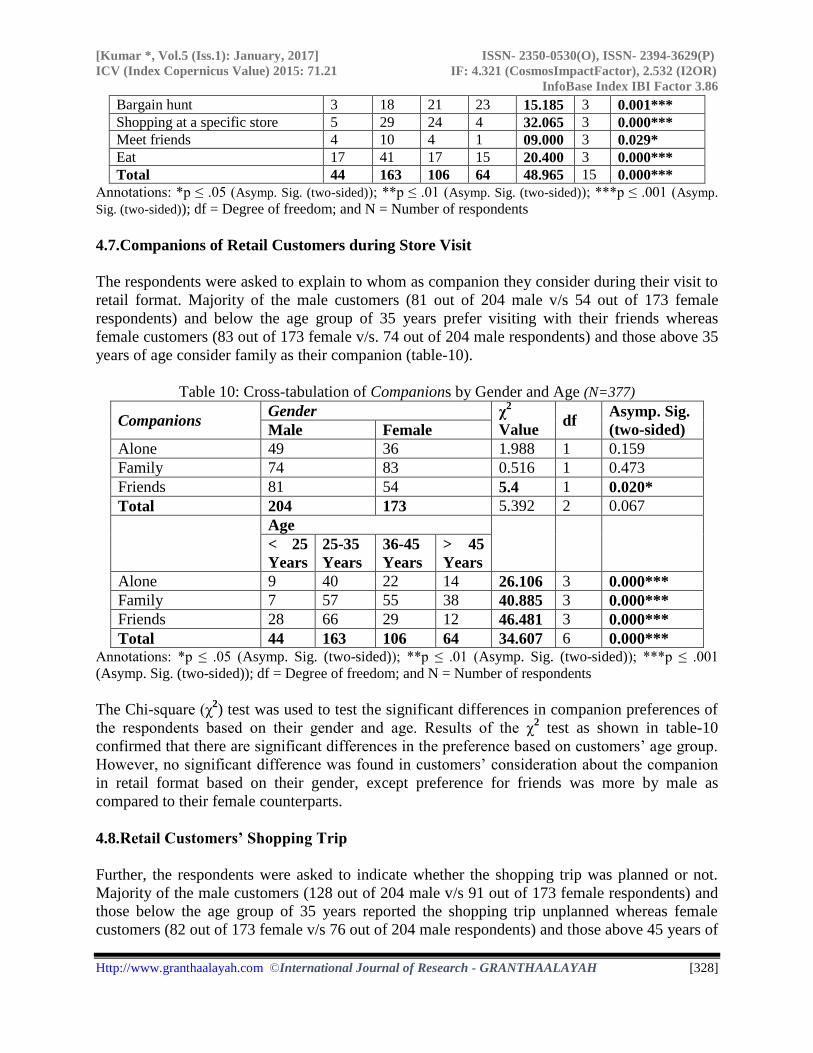
Bargain hunt 3 18 21 23 15.185 3 0.001***
Shopping at a specific store 5 29 24 4 32.065 3 0.000***
Meet friends 4 10 4 1 09.000 3 0.029*
Eat 17 41 17 15 20.400 3 0.000***
Total 44 163 106 64 48.965 15 0.000***
Annotations: *p ≤ .05 (Asymp. Sig. (two-sided)); **p ≤ .01 (Asymp. Sig. (two-sided)); ***p ≤ .001 (Asymp.
Sig. (two-sided)); df = Degree of freedom; and N = Number of respondents
4.7.Companions of Retail Customers during Store Visit
The respondents were asked to explain to whom as companion they consider during their visit to
retail format. Majority of the male customers (81 out of 204 male v/s 54 out of 173 female
respondents) and below the age group of 35 years prefer visiting with their friends whereas
female customers (83 out of 173 female v/s. 74 out of 204 male respondents) and those above 35
years of age consider family as their companion (table-10).
Table 10: Cross-tabulation of Companions by Gender and Age (N=377)
Companions Gender χ
2
Value df
Asymp. Sig.
(two-sided) Male Female
Alone 49 36 1.988 1 0.159
Family 74 83 0.516 1 0.473
Friends 81 54 5.4 1 0.020*
Total 204 173 5.392 2 0.067
Age
< 25
Years
25-35
Years
36-45
Years
> 45
Years
Alone 9 40 22 14 26.106 3 0.000***
Family 7 57 55 38 40.885 3 0.000***
Friends 28 66 29 12 46.481 3 0.000***
Total 44 163 106 64 34.607 6 0.000*** Annotations: *p ≤ .05 (Asymp. Sig. (two-sided)); **p ≤ .01 (Asymp. Sig. (two-sided)); ***p ≤ .001
(Asymp. Sig. (two-sided)); df = Degree of freedom; and N = Number of respondents
The Chi-square (χ2) test was used to test the significant differences in companion preferences of
the respondents based on their gender and age. Results of the χ2 test as shown in table-10
confirmed that there are significant differences in the preference based on customers’ age group.
However, no significant difference was found in customers’ consideration about the companion
in retail format based on their gender, except preference for friends was more by male as
compared to their female counterparts.
4.8.Retail Customers’ Shopping Trip
Further, the respondents were asked to indicate whether the shopping trip was planned or not.
Majority of the male customers (128 out of 204 male v/s 91 out of 173 female respondents) and
those below the age group of 35 years reported the shopping trip unplanned whereas female
customers (82 out of 173 female v/s 76 out of 204 male respondents) and those above 45 years of
[Kumar *, Vol.5 (Iss.1): January, 2017] ISSN- 2350-0530(O), ISSN- 2394-3629(P)
ICV (Index Copernicus Value) 2015: 71.21 IF: 4.321 (CosmosImpactFactor), 2.532 (I2OR)
InfoBase Index IBI Factor 3.86
Http://www.granthaalayah.com ©International Journal of Research - GRANTHAALAYAH [329]
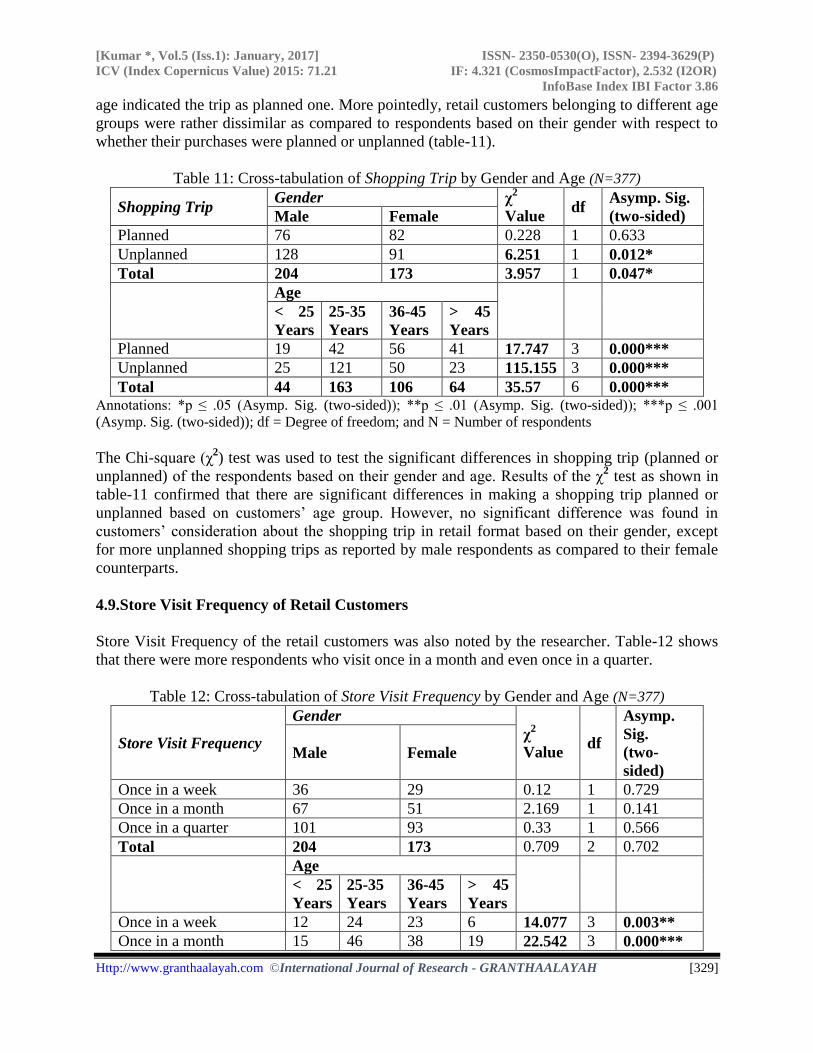
age indicated the trip as planned one. More pointedly, retail customers belonging to different age
groups were rather dissimilar as compared to respondents based on their gender with respect to
whether their purchases were planned or unplanned (table-11).
Table 11: Cross-tabulation of Shopping Trip by Gender and Age (N=377)
Shopping Trip Gender χ
2
Value df
Asymp. Sig.
(two-sided) Male Female
Planned 76 82 0.228 1 0.633
Unplanned 128 91 6.251 1 0.012*
Total 204 173 3.957 1 0.047*
Age
< 25
Years
25-35
Years
36-45
Years
> 45
Years
Planned 19 42 56 41 17.747 3 0.000***
Unplanned 25 121 50 23 115.155 3 0.000***
Total 44 163 106 64 35.57 6 0.000*** Annotations: *p ≤ .05 (Asymp. Sig. (two-sided)); **p ≤ .01 (Asymp. Sig. (two-sided)); ***p ≤ .001
(Asymp. Sig. (two-sided)); df = Degree of freedom; and N = Number of respondents
The Chi-square (χ2) test was used to test the significant differences in shopping trip (planned or
unplanned) of the respondents based on their gender and age. Results of the χ2 test as shown in
table-11 confirmed that there are significant differences in making a shopping trip planned or
unplanned based on customers’ age group. However, no significant difference was found in
customers’ consideration about the shopping trip in retail format based on their gender, except
for more unplanned shopping trips as reported by male respondents as compared to their female
counterparts.
4.9.Store Visit Frequency of Retail Customers
Store Visit Frequency of the retail customers was also noted by the researcher. Table-12 shows
that there were more respondents who visit once in a month and even once in a quarter.
Table 12: Cross-tabulation of Store Visit Frequency by Gender and Age (N=377)
Store Visit Frequency
Gender
χ2
Value df
Asymp.
Sig.
(two-
sided) Male Female
Once in a week 36 29 0.12 1 0.729
Once in a month 67 51 2.169 1 0.141
Once in a quarter 101 93 0.33 1 0.566
Total 204 173 0.709 2 0.702
Age
< 25
Years
25-35
Years
36-45
Years
> 45
Years
Once in a week 12 24 23 6 14.077 3 0.003**
Once in a month 15 46 38 19 22.542 3 0.000***

[Kumar *, Vol.5 (Iss.1): January, 2017] ISSN- 2350-0530(O), ISSN- 2394-3629(P)
ICV (Index Copernicus Value) 2015: 71.21 IF: 4.321 (CosmosImpactFactor), 2.532 (I2OR)
InfoBase Index IBI Factor 3.86
Http://www.granthaalayah.com ©International Journal of Research - GRANTHAALAYAH [330]
Once in a quarter 17 93 45 39 63.402 3 0.000***
Total 44 163 106 64 13.229 6 0.040* Annotations: *p ≤ .05 (Asymp. Sig. (two-sided)); **p ≤ .01 (Asymp. Sig. (two-sided)); ***p ≤ .001
(Asymp. Sig. (two-sided)); df = Degree of freedom; and N = Number of respondents
Again, chi-square (χ2) test was used to test the significant differences in store visit frequency of
the respondents based on their gender and age. Results of the χ2 test as shown in table-12
confirmed that there are significant differences in making a store visit on customers’ age group.
However, no significant difference was found in customers’ visit in retail format based on their
gender.
4.10. Staying Time in Retail Store
Respondents were also asked to speak how much time they spent on shopping during their visit to
retail formats. On applying χ2 test, the only significant difference based on gender was found for
those who spent less than half an hour. More male customers (41 out of 204 male v/s 22 out of
173 female respondents) were spending less than an hour for shopping in the retail store (table-
13). Chi-square (χ2) test was also used to test the significant differences in staying time of the
respondents based on their age groups. Results of the χ2 test as shown in table-13 confirmed that
there are significant differences in spending time in a store based on customers’ age groups.
Respondents below the age of 35 years were spending more than two hours whereas customers
above thirty five years were more who reported to spend 1-2 hours in the retail stores where they
visited.
Table 13: Cross-tabulation of Length of Stay by Gender and Age (N=377)
Length of Stay
Gender χ
2
Value df
Asymp.
Sig.
(two-sided) Male Female
Less than an hour 41 22 5.730 1 0.017*
1-2 Hours 72 63 0.600 1 0.439
More than 2 hours 91 88 0.050 1 0.823
Total 204 173 3.857 2 0.145
Age
< 25
years
25-35
Years
36-45
Years
> 45
Years
Less than an hour 6 20 24 13 11.984 3 0.007**
1-2 Hours 13 34 48 40 19.933 3 0.000***
More than 2 hours 25 109 34 11 129.000 3 0.000***
Total 44 163 106 64 62.33 6 0.000*** Annotations: *p ≤ .05 (Asymp. Sig. (two-sided)); **p ≤ .01 (Asymp. Sig. (two-sided)); ***p ≤ .001
(Asymp. Sig. (two-sided)); df = Degree of freedom; and N = Number of respondents
5. Conclusion
Retailers must have an accurate analysis of their market segment i.e. who are the customers and
how often they interact to different types of retail formats. Demographic determinants are
important criteria in the first stage of structuring customer markets. The analysis (two-way
[Kumar *, Vol.5 (Iss.1): January, 2017] ISSN- 2350-0530(O), ISSN- 2394-3629(P)
ICV (Index Copernicus Value) 2015: 71.21 IF: 4.321 (CosmosImpactFactor), 2.532 (I2OR)
InfoBase Index IBI Factor 3.86
Http://www.granthaalayah.com ©International Journal of Research - GRANTHAALAYAH [331]
analysis) revealed important insights into the demographic segments of each retail format based
upon gender and age, marital status, income, education and occupation of consumers as well the
retail format segments. The study concludes that gender and age, gender and occupation, and
gender and education are more or less equally important factors whereas gender and marital
status, and gender and income were not found important factors in affecting store visits. The
study also concludes that retail customers share many behavioral patterns. First, their visits to the
stores were primarily driven by purchase needs, either window shopping or making actual
purchases followed by eating. Second, more people prefer to visit these stores along with their
friends or family; this result contributes to that being accompanied by others (Companion),
shoppers more likely to buy food and less likely to buy non-food products. Third, considerably
bigger proportion of consumers visit to these stores in an unplanned way, their length of stay in
the store is more, but visit frequency is low. However, many consumers who came with the
intent to look and browse actually made purchases by the end of their trip; this result contributes
to a bigger proportion of respondents spending more time make unplanned purchases during
their shopping trips. This study investigated demographics factors only, scope of future study
may include Psychographics factors (customers’ thinking, feeling, reaction and reflection), and
geographical factors such as distance and travelling time that may influence customers’
interactions towards different type of retail formats.
References
[1] Bawa, K. and Ghosh, A. A model of household grocery shopping behaviour, Marketing Letters,
10(2), 1999, 149-60.
[2] Bellenger, D.N. and Korgaonkar, P.K. Profiling the recreational shopper, Journal of Retailing,
56(3), 1980, 77-92.
[3] Carpenter, M.J. and Moore, M. Consumer demographics, store attributes, and retail format choice
in the US grocery market, International Journal of Retail & Distribution Management, 34(6),
2006, 434-52.
[4] Carpenter, M.J. Demographics and patronage motives of super centre shoppers in the United
States, USA International Journal of Retail & Distribution Management 36(1), 2008, 5-16.
[5] Fox, E.J. Montgomery, A.L. and Lodish, L.M. Consumer shopping and spending across retail
formats, Journal of Business, 77(2), 2004, 25-60.
[6] Guidry, K. and Montero, T. Lifestyle centres: the de-malling of consumerism, Real Estate
Review, 34(1), 2005, 5-16.
[7] Lee, S., Ibrahim, M. and Hsueh-Shan, C. Shopping-centre attributes affecting male shopping
behaviour, Journal of Retail and Leisure Property, 4(4), 2005, 324-40.
[8] Nunnally, J.C. Psychometric Theory, Second Edition, McGraw Hill, New York, 1978.
[9] Prasad, C.J. and Aryasri, A.R. Effect of shopper attributes on retail format choice behaviour for
food and grocery retailing in India, International Journal of Retail & Distribution Management,
39(1), 2011, 68-86.
[10] Sinha, P.K. Shopping orientation in the evolving Indian market, Vikalpa, 28(2), 2003, 13-22.
[11] Stone, K.E. Competing with the Retail Giants: How to Survive in the New Retail Landscape,
Wiley, New York, NY, 1995.
[12] http://www.indiaonlinepages.com/population/india-current-population.html accessed on
10/07/2016.
*Corresponding author.
E-mail address: [email protected]