effect of concrete sill on the velocity · pdf filethe barrage has many weak points in its ......
TRANSCRIPT

1380
Mahgoub S. E.et al., Effect of concrete sill on the velocity distributions at the downstream of barrages,
pp. 1380 - 1395
* Corresponding author.
E-mail address: [email protected]
EFFECT OF CONCRETE SILL ON THE VELOCITY DISTRIBUTIONS AT THE DOWNSTREAM OF BARRAGES
Mahgoub S. E. *, Abdel-Fattah S. and Henafy K.
Hydraulics Research Institute, National Water Research Center, Egypt
Received 16 April 2013, accepted 23 April 2013
ABSTRACT
The effect of concrete sills on the velocity distributions so as their magnitude and the navigation path at the downstream side of barrages is investigated. The research also intended to determine the beginning of the apron and its end. A 3-D physical model was constructed with a fixed bed. Bollin Barrage which is located at about 100 km north of Cairo, Egypt was chosen to be investigated. The barrage suffers from cracks in the lock bed and stresses on the bed of the opening adjacent to the lock that might topple it. An experimental program was designed to investigate several alternatives that might solve the cracks formation. The test program was divided into 4 phases. Each phase investigates 3 scenarios. Experiments were executed and measurements were taken. Measurements were represented and analyzed. Based on the experimental results, it is concluded that the normal velocity distributions and the values of the lateral currents are attained when a concrete sill with a thickness of 1.2 m and a slope of 1:3 at both sides of the sill was implemented. This sill enhanced the height and length of the hydraulic jump. Also, operating all vents gives better results, regarding the velocity distributions.
Keyword: Concrete Sills; Velocity Distribution; Navigation Path; 3-D Physical Model.
1. Introduction
Bollin Barrage is located at km 82.30 along El-Rayah El-Beheiry Canal downstream El-Nubaria Canal Intake; Fig.1. The barrage has many weak points in its apron at the vent adjacent to the lock. This apron is subjected to tension forces which is affected the wall of the lock that might induce cracks in it.
Fig. 1. The location of Bollin Barrage along El-Rayah El-Beheiry

Mahgoub et al., Effect of Concrete Sill on The Velocity Distributions at The Downstream of Barrages,
pp. 1380 - 1395
Journal of Engineering Sciences, Assiut University, Faculty of Engineering, Vol. 41, No. 4, July,
2013, E-mail address: [email protected]
1381
A structural proposal was suggested "i.e. suggested alternative or suggested proposal". A sill with a height of 120 cm with the width of the vent was implemented, 5 m at the upstream of the gate and increases to 6 m at the middle of the pier and a length of 22.8 m with a gradual slope such that the width reaches to a width of 4 m, Figs.2, 3.
rehabilitated area in raft.
The Rehabilitated Area In Bolin Regulator.
Fig. 2. The suggested proposal in the fifth (5th) vent (phase 2)
Fig. 3. Cross section of the modified proposal (Phase 2)

1382
Mahgoub S. E.et al., Effect of concrete sill on the velocity distributions at the downstream of barrages,
pp. 1380 - 1395
Journal of Engineering Sciences, Assiut University, Faculty of Engineering, Vol. 41, No. 4, July,
2013, E-mail address: [email protected]
The structural configuration of the sill might affect the flow characteristics such as the maximum discharge and the navigation path at the downstream of the barrage. Moreover; this proposal was modified, Figs.4, 5, introducing a slope of 1:3 to the sill to attain better velocity distributions and to decrease the hydraulic losses.
A 3-D physical model is used for investigating the suggested and modified proposal.
rehabilitated area in raft.
Fig. 4. Plan of the third modified proposal (Phase 3)
Fig. 5. Sectional elevation of the second modified proposal (Phase 4)

Mahgoub et al., Effect of Concrete Sill on The Velocity Distributions at The Downstream of Barrages,
pp. 1380 - 1395
Journal of Engineering Sciences, Assiut University, Faculty of Engineering, Vol. 41, No. 4, July,
2013, E-mail address: [email protected]
1383
2. Reviewing the literature
From the literature, it was found many investigations were carried out on subjects related to the problem among of Helen and Daniel (2013) published a research about estimating the effects of magnetic sill, on average 1 km in width, on sedimentary seismic velocity and on sediments in Guaymas Basin. This research showed that sediments are structurally disrupted immediately above intruded sills and showed also an increase in bulk velocity of approximately 10% for altered sediments located above sills versus unaltered sediments from the same strata units [1].
In (2012), Office of Scientific and Technical Information (OSTI), Department of Energy's (DOE) provided a report about self-potential effects due to hydrothermal convection-velocity cross-coupling. This report showed that divergence free velocity field is used to represent the essential features of a hydrothermal convection system [2]. Also, Hašková (2008) published a research about possibilities of increasing the water level through the design of boulder elements. This research showed that for decreasing a river bed’s slope, boulder thresholds with a pool structure are useful. For increasing the depth, without increasing the discharge, single stones, as well as thresholds, are advantageous. The greatest benefit of using these elements is their natural look, economical disposal and low cost maintenance. Additionally, flow shadows, as well as scour occur [3].
Carlos and Arnoldo (2006) published a paper about effects of stratified flow over a sill on the spatial abundance using measurements of velocity profiles of an Acoustic Doppler Current Profiler (ADCP). Measurements showed intensified recirculation in the residual flow over the sill and showed that the physical mechanisms of the sill processes can influence distribution in a stratified system [4]. Also, Berndt, Skogly, and Eldholm, (2000) presented a study about high-velocity breakup-related sills at approximately 5 km depth and 7.4 km/s high in Voring Basin of Norway. This kind of sill decreases the accuracy of determined velocity fields, affecting depth conversion and gravity modeling [5]. Beichley (1978) published a report about the hydraulic design of stilling basins for channel basin. This report showed that three principal operating problems occurred at various installations which are the basin type, the discharge and channel erosion at the end of the basin [6].
Based on the above surveyed literature, a shortage in the experimental investigations of this point was evident. For that reason, the present study was initiated. It concentrated on investigating the effect of concrete sill on the velocity distributions at the downstream of head-regulators using a 3-D physical model. The present research was initiated with set objectives.
3. Objectives of the study
The main objectives of this research are: Investigating the effect of concrete sills on the velocity distributions downstream of
Bolin Barrage.
Determining the beginning of the apron and its end.
The most suitable form of the sill for minimizing losses.

1384
Mahgoub S. E.et al., Effect of concrete sill on the velocity distributions at the downstream of barrages,
pp. 1380 - 1395
Journal of Engineering Sciences, Assiut University, Faculty of Engineering, Vol. 41, No. 4, July,
2013, E-mail address: [email protected]
Investigating cross-currents downstream of navigation lock
4. The physical model
Several site visits were carried out in order to perceive a complete data picture about the study area. During these visits, observations were documented, photos were captured and measurements were undertaken. The physical model was designed to satisfy the dynamic similarity requirements.
Thus, in order to sustain the dynamic similarity between the model and prototype, the Reynolds number in the prototype should be equal to that of the model. Consequently, the velocity, discharge and time ratios could be specified, if the vertical and horizontal scales were equal.
An undistorted fixed bed physical model, of scale 1:20, was constructed in the investigation hall of the hydraulics Research Institute (HRI), Delta Barrage, Egypt. A model to Bollin Barrage together with the adjacent lock was constructed with all their details. Also, a reach of El-Rayah El-Beheiry "i.e. 400 and 385 m downstream and upstream of the barrage, was respectively modeled".
Fig. 6. The model inlet, problem zone area and model outlet
The model consisted of inlet, the problem zone area and the model outlet, Fig.6. Ultra- Sonic Flow meter: was used to measure the water discharge. It is mounted above
the pump pipe that supplies water to the model. This device was calibrated and has a velocity measurement range of 12 m/s with accuracy measurements from 1-2 % from discharge passing through pipes.
The Current meter: is used to measure the velocity. Its type is EMS. It is fabricated in the Netherlands. The device has an elliptical shape (11x33 cm) with a rod of 10 mm diameter, measuring range is 0 to 100 cm/s with accuracy: 0.13 milli volt/cm/s. The velocity is derived from the measured voltage and is calculated using a second degree equation with accuracy in velocity measurements of 0.5%.

Mahgoub et al., Effect of Concrete Sill on The Velocity Distributions at The Downstream of Barrages,
pp. 1380 - 1395
Journal of Engineering Sciences, Assiut University, Faculty of Engineering, Vol. 41, No. 4, July,
2013, E-mail address: [email protected]
1385
G.P. Photographing cameras with high resolution so as videos to capture the movements were implemented.
Wooden floats and permanganate together with stripes of paper were used to follow the lateral currents and high velocities at certain cross sections. Four devices were used to measure the water level and the water depth. They consist of a bucket with a ruler with a pointed end which is attached to a fixed rod.
Fig. 7. Implemented measuring devices
The model was calibrated in order to obtain precise results and to corporate them in resolving the problem. Real measurements, under the same hydraulic conditions in the model and the prototype, were compared "i.e. velocity distributions". Table 1. lists the measured values in the model and the prototype. The velocity measurements were achieved at two cross sections 200 m upstream (C.S. 2) and 200 m downstream (C.S. 4) the barrage respectively (see Fig. 8).
Table 1.
Velocity measurements in the model and the prototype
Section Location water level relative
to the MSL (m) discharge
(m3/s) Velocity section
Barrage Downstream 8.65 112.29 C.S.1
200m Upstream Bollin Barrage 8.93 50.92 C.S.2
Downstream Abou Diab Barrage
6.85 2.21 C.S.3
200m Downstream Bollin Barrage
7.15 48.85 C.S.4

1386
Mahgoub S. E.et al., Effect of concrete sill on the velocity distributions at the downstream of barrages,
pp. 1380 - 1395
Journal of Engineering Sciences, Assiut University, Faculty of Engineering, Vol. 41, No. 4, July,
2013, E-mail address: [email protected]
Fig. 8. Locations of velocity measurements upstream and downstream of Bollin Barrage.
Mahgoub et al., Effect of Concrete Sill on The Velocity Distributions at The Downstream of Barrages,
pp. 1380 - 1395
Journal of Engineering Sciences, Assiut University, Faculty of Engineering, Vol. 41, No. 4, July,
2013, E-mail address: [email protected]
1387
0.0
0.1
0.2
0.3
0.4
0.5
0.6
0.7
0.8
0 5 10 15 20 25 30 35 40 45 50 55 60 65
Distance from Left Bank (m)
Flo
w V
elo
cit
y (
m/s
)
prototypemodel
Calibration of Bolin Model at C.S. 200 m Upstream the Regulator
0.0
0.1
0.2
0.3
0.4
0.5
0.6
0.7
0.8
0 5 10 15 20 25 30 35 40 45 50
Distance from Left Bank (m)
Flo
w V
elo
cit
y (
m/s
)
prototypemodel
Calibration of Bolin Model at C.S. 200 Downstream the Regulator
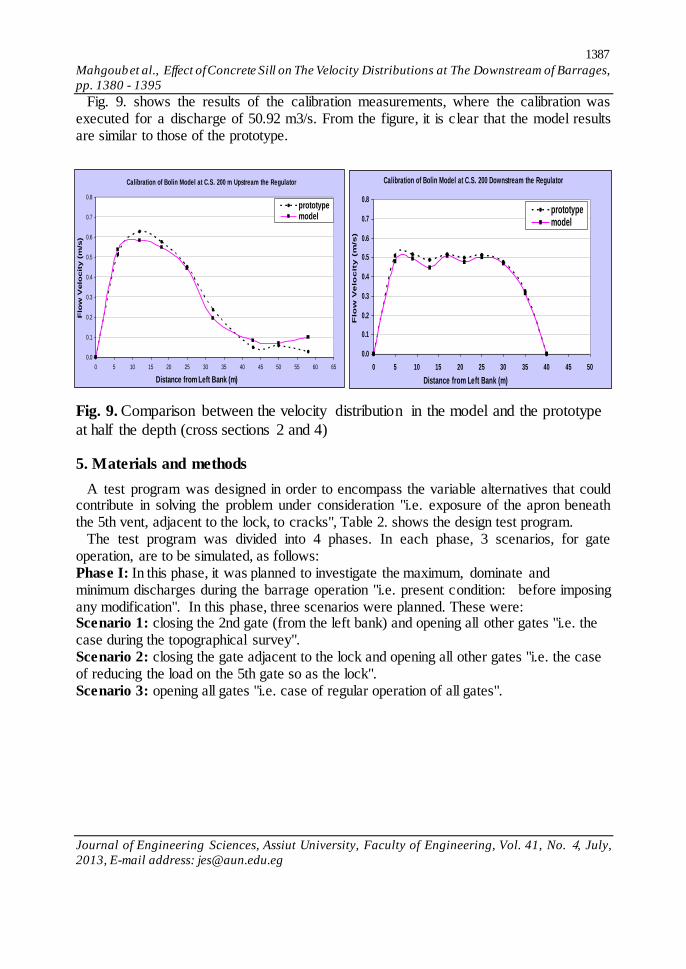
Fig. 9. shows the results of the calibration measurements, where the calibration was executed for a discharge of 50.92 m3/s. From the figure, it is clear that the model results are similar to those of the prototype.
Fig. 9. Comparison between the velocity distribution in the model and the prototype
at half the depth (cross sections 2 and 4)
5. Materials and methods
A test program was designed in order to encompass the variable alternatives that could contribute in solving the problem under consideration "i.e. exposure of the apron beneath the 5th vent, adjacent to the lock, to cracks", Table 2. shows the design test program.
The test program was divided into 4 phases. In each phase, 3 scenarios, for gate operation, are to be simulated, as follows: Phase I: In this phase, it was planned to investigate the maximum, dominate and minimum discharges during the barrage operation "i.e. present condition: before imposing any modification". In this phase, three scenarios were planned. These were: Scenario 1: closing the 2nd gate (from the left bank) and opening all other gates "i.e. the case during the topographical survey". Scenario 2: closing the gate adjacent to the lock and opening all other gates "i.e. the case of reducing the load on the 5th gate so as the lock". Scenario 3: opening all gates "i.e. case of regular operation of all gates".

1388
Mahgoub S. E.et al., Effect of concrete sill on the velocity distributions at the downstream of barrages,
pp. 1380 - 1395
Journal of Engineering Sciences, Assiut University, Faculty of Engineering, Vol. 41, No. 4, July,
2013, E-mail address: [email protected]
Table 2.
Designed model test program
Test
Discharge of Rayah
El Beheiry (m
3/s)
Discharge of
Nubaria Barrage (m
3/s)
Discharge of
Bollin Barrage
(m3/s(
Upstream water level (m(
Downstream water level )m(
Gate condition
Scenario I
(2nd
gate)
Scenario II
(5th
gate)
Scenario III
(all gates)
1 266.5 169.9 max.
Q=96.6 9.61 7.55 closed opened opened
2 140.3 109.0 min.
Q=31.3 8.60 6.66 closed opened Opened
3 199.4 139.5 domain Q=59.9
9.19 7.04 closed opened Opened
4 266.5 169.9 max.
Q=96.6 9.61 7.55 opened closed opened
5 140.3 109.0 min.
Q=31.3 8.6 6.60 opened closed Opened
6 199.4 139.5 domain Q=59.9
9.19 7.04 opened closed Opened
Note: 1. The different three scenarios tests are repeated for four stages. 2. The discharges values are obtained from the record of barrage discharges
through years (2003- 2010). Phase II: In this phase, it was planned to investigate the maximum, dominate and minimum discharges after imposing a modification "i.e. adding a 120 cm sill height with a width equal to the 5th vent opening, from the left bank adjacent to the lock". The sill interior width is 5 m that lasts till the middle of the pier, then enlarges to be 6 m and reaches 22.8 m at the pier end with a gradual horizontal slope until the sill to become 4 m only, Fig. 2 shows the suggested proposal in the fifth (5th) vent while Fig. 3 shows cross section (x-x) of the modified proposal in Fig.2. In this phase, the three previous scenarios were planned. Phase III: In this phase, it was planned to investigate the maximum, dominate and minimum discharges after imposing a modification "i.e. adding a sill with a slope in vertical direction of 3H:1V". The slope will be at the beginning of the pier at the upstream and ends at the sill at the downstream of the barrage. This slope is intended to regulate the flow in order to reduce the hydraulic losses. In this phase, the three previous scenarios were planned, Fig. 4 shows the slope in vertical direction of 3H:1V. Phase IV: In this phase, it was planned to investigate the maximum, dominate and minimum discharges after imposing a modification (traverse slope 5H:1V), Fig. 5. In this phase, the three previous scenarios were planned.

Mahgoub et al., Effect of Concrete Sill on The Velocity Distributions at The Downstream of Barrages,
pp. 1380 - 1395
Journal of Engineering Sciences, Assiut University, Faculty of Engineering, Vol. 41, No. 4, July,
2013, E-mail address: [email protected]
1389
6. Executing measurements
Five sections were considered during executing velocity measurements "i.e. at equidistance of 20, 40, 60, 80 and 100 m from the barrage axis during the minimum discharge (31.3 m3/s), dominate discharge (59.9 m3/s) and the maximum discharge ( 96.6 m3/s). Samples of velocity distributions downstream of the barrage at 20, 40, 60, 80 and 100 m during maximum discharge when all gates are opened are attached.
All sections were divided into equidistance of 4 m where velocity was measured at each point at half the depth from the free surface. Fig. 8 shows the locations of these sections while Fig. 10. shows the flow pattern using small paper stripes and permanganate to determine the flow direction. Fig. 11. shows the flow pattern and lateral current direction downstream the lock using permanganate.
Fig. 10. Observed flow and the hydraulic jump over the proposed sill structure
Fig. 11. Observed lateral currents downstream the navigable lock
7. Analyzing the results and discussions
The results were analyzed and represented, from which, the following was detected:
Figure 12 shows the values of measured velocities at the half depth of flow versus the distance from the left bank. The measurements were at section 20 m downstram the barrage. The measurements were for the studied phases, from the figure, it is seen that velocities were around 1.2 m/s and tended to be uniform downstream all gates. For

1390
Mahgoub S. E.et al., Effect of concrete sill on the velocity distributions at the downstream of barrages,
pp. 1380 - 1395
Journal of Engineering Sciences, Assiut University, Faculty of Engineering, Vol. 41, No. 4, July,
2013, E-mail address: [email protected]
Gate No. 2
phases three and four, the velocities fluctuated with minimum value of 0.7 m/s and 0.5 m/s and with maximum ones of 1.8 m/s and 2.4 m/s for phases 3 and 4 respectively.
From Figures 13- 15, it is seen that velocities were around 0.5 m/s and tended to be more uniform downstream all gates for all four phases and this velocity value is a normal value in the Nile but above the sill downstream gate (5), the maximum velocity becomes about 1.2 m/s for phases 2, 3, and 4.
Figure 16 shows velocity values at 100 m are little less than values at 60 m and 80 m also these velocity values are fluctuated with minimum values of 0.2 and 0.3 m/s and with maximum ones of 0.7 and 0.85 m/s for phases 3 and 4 respectively.
Figure 17 shows the values of measured lateral currents at the downstream, during opening all gates, were found to be 0.15 m/s during executing phase I. On the other hand, it reaches 0.25 m/s during executing phase II, Fig. 18, and reaches 0.29 during executing phase III and and IV, Fig.19. This is less than the maximum permissible range for safe navigation "i.e. 0.3 m/s".
Figures 10 and 11 show the observed hydraulic jump directly downstream downstream gate (5), adjacent to the lock, but it did not overpass the proposed sill. The minimum height and length of the jump were reached during phase III.
Fig. 12. Velocity at 20 m downstream of the barrage(during maximum discharge
and all gates are opened)

Mahgoub et al., Effect of Concrete Sill on The Velocity Distributions at The Downstream of Barrages,
pp. 1380 - 1395
Journal of Engineering Sciences, Assiut University, Faculty of Engineering, Vol. 41, No. 4, July,
2013, E-mail address: [email protected]
1391
0.0
0.5
1.0
1.5
2.0
2.5
3.0
0 5 10 15 20 25 30 35 40 45 50 55 60 65
Distance from Left Bank (m)
Flo
w V
elo
cit
y (m
/s)
قبل المقترح االنشائى
بعد المقترح االنشائى
بعد التعديل االول للمقترح االنشائى
بعد التعديل الثانى للمقترح االنشائى
Gate No. 2
Gate No. 5
Velocity Distribution at Opening all Gates at 60 m Downstream Bolin Regulator (Q=96.6m3/s )
0.0
0.5
1.0
1.5
2.0
2.5
3.0
0 5 10 15 20 25 30 35 40 45
Flo
w V
elo
cit
y
(m/s
)
Distance from Left Bank (m)
Before Structural Design
After Structural Design
After First Modification
After Second Modification
Gate No. 2
Gate No. 5
Velocity Distribution at Opening all Gates at 40 m Downstream Bolin Regulator
Fig. 13. Velocity at 40 m downstream of the barrage(during maximum discharge and all gates are opened)
Fig. 14. Velocity at 60 m downstream of the barrage(during maximum discharge and all gates are opened)

1392
Mahgoub S. E.et al., Effect of concrete sill on the velocity distributions at the downstream of barrages,
pp. 1380 - 1395
Journal of Engineering Sciences, Assiut University, Faculty of Engineering, Vol. 41, No. 4, July,
2013, E-mail address: [email protected]
0.0
0.5
1.0
1.5
2.0
2.5
3.0
0 5 10 15 20 25 30 35 40 45 50 55 60 65
Distance from Left Bank (m)
Flo
w V
elo
cit
y (m
/s)
Before Structural Design
After Structural Design
After First Modif ication
After Second Modif ication
Gate No. 5Gate No. 2
at Lock
Velocity Distribution at Opening all Gates at 100 m Downstream Bolin Regulator (Q=96.6m3/s )
0.0
0.5
1.0
1.5
2.0
2.5
3.0
0 5 10 15 20 25 30 35 40 45 50 55 60 65
Distance from Left Bank (m)
Flo
w V
elo
cit
y (m
/s)
قبل المقترح االنشائى
بعد المقترح االنشائى
بعد التعديل االول للمقترح االنشائى
بعد التعديل الثانى للمقترح االنشائى
Gate No. 2
Gate No. 5
Velocity Distribution at Opening all Gates at 80 m Downstream Bolin Regulator (Q=96.6m3/s )
Fig. 15. Velocity at 80 m downstream of the barrage(during maximum discharge and all gates are opened)
Fig. 16. Velocity at 100 m downstream of the barrage(during maximum discharge and all gates are opened)

Mahgoub et al., Effect of Concrete Sill on The Velocity Distributions at The Downstream of Barrages,
pp. 1380 - 1395
Journal of Engineering Sciences, Assiut University, Faculty of Engineering, Vol. 41, No. 4, July,
2013, E-mail address: [email protected]
1393
-0.50
-0.45
-0.40
-0.35
-0.30
-0.25
-0.20
-0.15
-0.10
-0.05
0.00
0.05
0.10
0 5 10 15 20 25 30 35 40 45 50 55 60 65
Distance from Left Bank (m)
Cro
ss C
urr
en
t F
low
(m
/s)
(-) Flow directed from L.B to R.B.
Gate No. 2
Gate No. 5 At Lock
Cross Current at Opening all gates at C.S. 80 m Downstream Bolin Regulator (Q=96.6m3/sec)
Fig. 17. Lateral currents downstream of the barrage(all gates are opened - phase I)
Fig. 18. Lateral currents downstream of the barrage(all gates are opened - phase II)

1394
Mahgoub S. E.et al., Effect of concrete sill on the velocity distributions at the downstream of barrages,
pp. 1380 - 1395
Journal of Engineering Sciences, Assiut University, Faculty of Engineering, Vol. 41, No. 4, July,
2013, E-mail address: [email protected]
-0.60
-0.55
-0.50
-0.45
-0.40
-0.35
-0.30
-0.25
-0.20
-0.15
-0.10
-0.05
0.00
0.05
0.10
0 5 10 15 20 25 30 35 40 45 50 55 60 65
Distance from Left Bank (m)
Cro
ss C
urr
en
t F
low
(m
/s)
(-) Flow directed from L.B to R.B.
Gate No. 2
Gate No. 5 At Lock
Cross Current at Opening all Gates at C.S. 80 m Downstream Bolin Regulator (Q=96.6m3/s )
Fig. 19. Lateral currents downstream of the barrage(all gates are opened- phase III and IV)
8. Conclusions and recommendations
Based on the results, the findings are:
Imposing a sill with 120 cm height (phase III) is recommended because the lateral current has optimum distribution when the maximum and minimum discharges are allowed to flow during the opening of all gates.
Phase III is also recommended since it enhances the hydraulic jump compared to other cases.
Phase I is not recommended since it is only used as a reference case and opening 5 adjacent to navigation lock must be treated and enhanced by concrete sill.
Imposing a sill with 120 cm height (phase II) is not recommended because the value of velocities is higher than phases 1 and 3 downstream all openings especially at sections 80 and 100 m.
Imposing a sill with 120 cm height (phase IV) is not recommended because its velocity values are higher than all phases 1,2, and 3 especially over the sill, also it is difficult and costly to carry out this suggestion at prototype.
The velocity was reduced at the downstream at the sections located 80 and 100 m to be similar to the velocity in the Nile River (0.5 m/s) which will not cause aggradations or degradations.
The value of the lateral current, in the vicinity of the lock in case of opening all the gates, is 0.3 m/s which is less than the maximum safe navigable condition.

Mahgoub et al., Effect of Concrete Sill on The Velocity Distributions at The Downstream of Barrages,
pp. 1380 - 1395
Journal of Engineering Sciences, Assiut University, Faculty of Engineering, Vol. 41, No. 4, July,
2013, E-mail address: [email protected]
1395
Therefore, the research investigations recommend to imposing a sill with 120 cm in height as a described in phase III which gave the best results.
9. References
[1] Helen, S. and Daniel, L., "Estimating the Effects of Sill Intrusion on Sediments in Guaymas
Basin, Gulf of California Based on Seismic Velocity" Woods Hole Oceanographic
Institution, Woods Hole, MA, USA, 2013.
[2] Office of Scientific and Technical Information (OSTI), Department of Energy's (DOE),
"Self-Potential Effects due to Hydrothermal Convection-Velocity Cross- Coupling" U.S.
Dept. of Energy, Office of Scientific and Technical Information, 2012.
[3] Hašková, L., "Possibilities of Effecting a Water Level Regime in Fish -Passes via Boulder
Elements" Faculty of Civil Engineering, Slovak University of Technology, USA, 2008.
[4] Carlos, M. and Arnoldo, V., "Effects of Sill Processes on the Distribution of Epineustonic
Competent Larvae in a Stratified System of Southern Chile" Marine Ecology Progress
Series, Inter-Research, Nordbuente 23 Oldendorf/Luhe 21385 Germany, 2006.
[5] Berndt, C., Skogly, O.P., and Eldholm, O., "High-Velocity Breakup-Related Sills in Voring
Basin of Norway", Journal of Geophysical Research, American Geophysical Union, Vol.
105, No. B12, 2000.
[6] Beichley, G.L., Division of Research, "Hydraulic Design of Stilling Basin for Pipe or
Channel Outlets Basin" ; Bureau of Reclamation designation. Department of the Interior
United States Government Printing Office, Denver, 1978.
دراســة تأثيـر العتب الخـرســانى على تـوزيــع الســرعات خلف القناطــر
العربىملخص ال
يهدف البحث إلى دراسة تأثير وجود العتب الخرسانى على توزيع ويعيا الععرعال لعا ي عالر ,عوليسة دراسعة
نهايعة الرعرا الخرسعانى ,عالخلاة ويياعاد دراسعة ال عألن ا نععب لبدايعة و المالحيتأثير هذا العتب على المعار , مععو الم عأللة معس ال احيعة الهيدروليأليعةو ولتح يععد الهعدف المرجعو مععس الدراسعة م نعا يععتلطق محا ععا م عة
03و28و ي عالر حزعط ,عوليس ت عن ع عد الأليلعومتر ال بيعةا ,عاد و ياع ثا,ت يتا معايرتا ليماثن ثالثي لبيعي
مععى الرتحععة ال ععر مععى تعععرش مععرا الم ععأللةل و,اريععةو تتم ععن علععى الريععاب البحيععرق لععا ي ععالر ترعععة ا للهعوي المالحععى حمعاد مععند ممعا يععد يععرش حععاحد الهعنوي لحععدوت معرول يمألععس ي تع دق إلععى المزعاور
, ب عا مععس التصععميميعععس الم ععور الرتحعة رمع م عععور معرا هععذ ايتععرابتعا الم ععأللةو ولحععن هعذ انهيعار و,التعالي العرضعية مما يد ي ثر على توزي العرعال وتألويس العدوامال والتيعارال متر 0283الخرسانا ,عمك
ليأ ععذ مععي ااعتبعار امععة البععداحن لوضعع ا تبععارالعلعى المعععار المالحععى لعا ال ععر و تععا تصععميا ,رنعام
ن مرحلعا ثعالت إلعى ير,ععة مراحعن لألع اا تبعارال المراد دراستها لذا تا ت ععيا ,رنعام للم أللة الم اسبةالحلود لعا العرضعية إلى ي يماعن معألن لتوزيع الععرعال مع ييعن ييمعا للتيعارال الدراسةسي اريوهالو توصلت
متعر و ميعود 83و0عتعب رسعانى ,ععمك اءنننعن , ن ت اعى والتي ةنننال ال المرحلةهو ع د ينالمالحالهوي مععييدل إلعى تحععس المرحلعة يياععاد ي هعذ الدراسعة يم عى معى ,دايعة ونهايععة العتعبو معا توصعلت 0: ريسعي 0
نتاح جيعد معس ,أ ت غين جمي البوا,ال يع ى التوصيةمدتها م و,التالي الهيدروليألية ال رط ولنود ارتراع
وحيث توزي العرعال