effect of cellular factors on the generation of...
TRANSCRIPT
Effect of cellular factors on the generation of beta-amyloid.
ANDERSON, David.
Available from Sheffield Hallam University Research Archive (SHURA) at:
http://shura.shu.ac.uk/19274/
This document is the author deposited version. You are advised to consult the publisher's version if you wish to cite from it.
Published version
ANDERSON, David. (2003). Effect of cellular factors on the generation of beta-amyloid. Doctoral, Sheffield Hallam University (United Kingdom)..
Copyright and re-use policy
See http://shura.shu.ac.uk/information.html
Sheffield Hallam University Research Archivehttp://shura.shu.ac.uk

LtAKNINti i i ;CITY CAMPUS, HOWARD STREET
SHEFFIELD SI 1W8
Fines are charged at 50p per hour
27 JUL 8 % - a ^ .
2 8 JUL 2007A u ^ r 0 1 5 ? -
2 3 AUG 200? jS>v ,

ProQuest Number: 10694154
All rights reserved
INFORMATION TO ALL USERS The quality of this reproduction is dependent upon the quality of the copy submitted.
In the unlikely event that the author did not send a com plete manuscript and there are missing pages, these will be noted. Also, if material had to be removed,
a note will indicate the deletion.
uestProQuest 10694154
Published by ProQuest LLC(2017). Copyright of the Dissertation is held by the Author.
All rights reserved.This work is protected against unauthorized copying under Title 17, United States C ode
Microform Edition © ProQuest LLC.
ProQuest LLC.789 East Eisenhower Parkway
P.O. Box 1346 Ann Arbor, Ml 4 81 06 - 1346

Effect of cellular factors on the generation of (3-amyloid
David Anderson
A thesis submitted in partial fulfilment of the requirements of Sheffield Hallam University for the degree of Doctor of Philosophy
November 2003

HALLAM

Acknowledgements
This study was performed in the Biomedical Research Centre, Sheffield Hallam University during the years 2000-2003.
I wish to thank my supervisor Professor David Parkinson for giving me the opportunity to undertake this PhD and for his co-operation, guidance and encouragement during these years.
I also wish to thank all my colleagues at the BMRC who have made my studies all the more bearable for their sense of humour.
I should like to thank both John Proctor at Sheffield University for his invaluable TEM skills and Aviva Tolkovsky at Cambridge University for her comments regarding the TEM images.
Lastly, I am indebted to my wife Mariam who has never lost faith in my abilities and who has been a constant source of encouragement to me.

And Allah has created you, and then He will cause you to die, and of you there are some who are sent back to senility, so after having much knowledge, they know nothing. Truly! Allah is All-Knowing, All-Powerful.
Sura An-Nahl (The Bee). Quran, 16:70.

Contents

Contents Page
Abstract 1
List of abbreviations 2
Chapter 1
1.0 Relevance of Alzheimer’s disease 4
1.1 Introduction to AD 4
1.2 Pathophysiological features of AD 5
(i) Neurological and transmitter alterations 5
(ii) Micro-histopathological features of AD 7
(iii) NFTs contain aggregates of hyperphosphorylated tau 7
(iv) Amyloid peptide deposits in the AD brain 9
(v) Neuritic plaques 10
(vi) Diffuse plaques 11
1.3 Biology of amyloid precursor protein
(i) Proteolytic processing of APP 12
(ii) a-secretase pathway 13
(iii) (3-secretase pathway 14
(iv) y-secretase pathway 15
(v) APP trafficking and A|3 generation within the cell compartment 15
(vi) Function of APP 19
1.4 Ap associated toxicity in AD
(i) Ap structure and toxicity 20
(ii) Oxidative stress and AD 22
(iii) Inflammatory Reactions and AD 23
1.5 Theories proposed to account for AD
(i) Amyloid cascade hypothesis 24
(ii) Amyloidosis and tauopathy 25
(iii) Competing hypotheses in AD 25
1.6 Genetics of AD 28
(i) APP mutations and FAD 30
(ii) Presenilin mutations and FAD 32
(iii) Apolipoprotein E polymorphism and AD 34
(iv) a-macroglobulin polymorphism and AD 35
(v) AD risk locus on chromosome 10 36
1.7 Biology of presenilins
(i) Presenilin structure and biochemistry 38
(ii) Presenilin and development 40

(iii) Apoptosis and presenilin in AD 42
(iv) Presenilin complex formation 43
(v) Presenilin and (3-catenin interaction 44
(vi) Active y-secretase requires several components 45
1.8 Project rationale 47
Chapter 2 Materials and Methods
2.0 Cell Culture 48
2.1 Cell fixation, antibody staining and imaging 48
2.2 Antibody staining 48
2.3 Reduction and alkylation of disulphide bonds 49
2.4 Preparation of soluble and membrane bound cell fractions for
SDS-PAGE analysis 50
2.5 SDS PAGE/Urea Bicine gel preparation 50
2.6 Immunoprecipitation of conditioned media 50
2.7 Detection of (3-amyloid peptides 51
2.8 SDS-PAGE running conditions 53
2.9 Polymerisation chain reaction conditions 53
2.10 Restriction digestion and preparation of cDNAs 54
2.11 Preparation of electrocompetent DH5a E.coli 54
2.12 Transformation of DH5a E.coli 54
2.13 Transfection of Mammalian Cells 55
2.14 Transmission electron microscopy 55
Results
Chapter 3 Characterisation of PS1-CTF and PS1-NTF fragments inCos-7 cells by immunocytochemistry
3.1 Introduction 57
3.2 Criteria for assessing reporter molecule localisation within the cell
compartment 57
3.3 1039 antibody staining of PS1 in Cos-7 cells 58
3.4 923 antibody staining of PS1 in Cos-7 cells 58
3.5 923 staining of Brefeldin-A treated Cos-7 cells is largely vesicular
and co-localises with ERGIC53 58
3.6 Western blot analysis of endogenous PS1 expressed in Cos-7
cells 61
3.7 The 923 antibody does not recognize the PS1 N-terminus 62
3.8 Chapter summary 62
Chapter 4 Construction of NTPS1-EGFP plasmid and expression bytransfected Cos-7 cells
4.1 Introduction 66
4.2 Amplification of N-terminal PS1 cDNA by PCR 67
4.3 Optimisation of conditions for PCR 67
4.4 Subcloning of N-terminal PS1 cDNA into N2-pEGFP 70
4.5 Restriction digestion analysis of putative N-terminal PS1 cDNA 71
4.6 Cos-7 cells transfected with pNTPS1-EGFP display several
phenotypes 73
4.7 Western blot analysis of NTPS1-EGFP fusion protein locates to
the cell membrane 74
4.8 The NTPS1 fusion protein localises to the ER and Golgi
compartments 76
4.9 The NTPS1 fusion protein does not co-localise with 923 staining
and returns to the ER following BFA treatment and in Cos-7 cells 80
4.10 Chapter summary 81
Chapter 5 Construction of mutant PS1 cDNA and expression in cells
5.1 Introduction 88
5.2 The phenotypes exhibited by the fusion protein are not an artefact
of the cell fixation process 88
5.3 The phenotypes displayed by the fusion protein are found within
other cell types 89
5.4 Construction of wild type and FAD mutant PS1 plasmids 92
(i) Alteration of PS1 cDNA base sequences by site
directed mutagenesis 92
(ii) Site directed mutagenesis by PCR 93
(iii) Optimisation of PCR conditions 94
(iv) Restriction analysis of PCR products 98
5.5 Expression of NTMPS1-EGFP by Cos-7 cells 98
5.6 Expression of Full length PS1-EGFP and Full length mutant PS1
by Cos-7 cells 99
5.7 Endoproteolysis of the full-length fusion protein generates separate
pools of NTF and CTF in a proportion of cells expressing the transgene 99
5.8 BFA treatment of Cos-7 cells expressing the full-length fusion protein 100
5.9 Western analysis of Cos-7 cells expressing FLPS1-EGFP, FLMPS1
-EGFP and NTMPS1-EGFP fusion proteins 104
5.10 Chapter summary 105
Chapter 6 Biological properties of the fusion protein
6.0 Introduction. 111
6.1 Reduction in antibody staining of the ER resident proteins Colligin
and PDI. 111
6.2 Reduction in antibody staining of Golgi-associated proteins
Mannosidase II and GalNac. 112
6.3 p-Catenin does not associate with NTMPS1-EGFP in Cos-7 and
HEK293 cells. 112
6.4 The fusion protein shows limited localisation with the anti-APP
antibodies 874, 993 and DE2. 113
6.5 Detection and separation of synthetic A(340 /A(342 by bicine SDS PAGE. 118
6.6 Immunoprecipitation of APP770 from conditioned and complete.
Media. 119
6.7 Selection of HEK293 cells stably expressing full length and truncated
PS1-EGFP. 127
6.8 Western analysis of stable HEK293 cells expressing the fusion
Proteins. 128
6.9 Mannosidase staining in control cells 133
6.10 The NTMPS1-EGFP sensitizes Cos-7 cells to staurosporine-
induced apoptosis. 134
6.11 Staurosporine induced apoptosis in NTMPS1-EGFP NRK cells show
increased Grasp65 cleavage compared to untransfected cells. 135
6.12 Chapter summary. 137
Chapter 7 Functional and morphological characteristics of the blob phenotype
7.0 Introduction. 144
7.1 Introduction of an in-frame STOP codon between PS1 and EGFP cDNA 144
7.2 Removal of the EFGP moiety does not alter the phenotypes displayed by
cells expressing truncated or full-length PS1. 146
7.3 Western analysis of soluble and membrane fractions prepared from cells
expressing full-length and truncated PS1-STOP proteins. 146
7.4 Analysis of the cell compartment in which the fusion protein resides. 147

7.5 The blob phenotype does not co-localise with antibodies to the ER,
Golgi or the ERGIC compartment. 152
7.6 Altered COP II staining in Cos-7 cells exhibiting the blob phenotype. 152
7.7 The blob-like aggregates do not associate with the Lysosomal
compartment. 153
7.8 Proteasome 20S antibody staining of the fusion protein. 153
7.9 The blob-like aggregates show ubiquitination. 161
7.10 The NTMPS-EGFP fusion protein accumulates as a distinct perinuclear
structure following inhibition of the proteasome. 162
7.11 Higher weight fusion protein aggregates show increased ubiquitin
immunoreactivity in cells treated with proteasome inhibitors. 163
7.12 MG132 concentrations in the nanomolar range are sufficient to cause the
collapse of vimentin around the aggresome. 164
7.13 MTOC staining is altered in Cos-7 cells expressing high levels of the
fusion protein. 164
7.14 Formation of the blob-like phenotypes do not require intact microtubules. 165
7.15 The PS1 fusion protein phenotypes do not alter over time. 177
7.16 TEM examination of the cells expressing the fusion protein reveals
laminar structures and phagosomes. 178
7.17 Chapter summary. 179
Chapter 8 Discussion
8.0 The putative PS1NTF 923 antibody staining is distinct from 1039 PS1CTF
antibody staining 186
8.1 Construction and expression of N-terminal truncated PS1-EGFP 187
8.2 Immunoanalysis of the NTF fusion protein 189
8.3 Expression of mutant full-length and truncated PS1 fusion proteins 190
8.4 Endoproteolysis of the full-length PS1 191
8.5 Expression and sub cellular distribution of EGFP-tagged presenilin
in this and previous studies 193
8.6 Functional aspects of PS fusion proteins 196
8.7 Detection of (3-Amyloid 197
8.8 Alterations in the ER and Golgi compartments 198
8.9 The N-terminal fusion protein sensitises cells to apoptosis 200
8.10 Identity of the blob-like aggregates 203
8.11 The fusion protein, aggresomes and the ubiquitin-proteasome
system 205

8.12 TEM analysis of Cos-7 cells expressing the fusion protein 208
8.13 Autophagosomes and multilaminar bodies in transfected cells 209
8.14 Consequence of fusion protein over expression 212
8.15 Impairment of the ubiquitin-proteasome system 213
8.16 Formation of the blob-like aggregate phenotype 215
8.17 Blobs- insoluble aggregates, inclusion bodies or membrane bound
compartments? 217
8.18 Apoptosis and autophagy 219
8.19 Summary of main findings 221
8.20 Concluding remarks 223
References 225
Table of Figures Page
1.0 Simplified time line of AD research from first discovery in 1906 topresent day. 6
1.1 P-Amyloid plaque surrounded by dystrophic neurites. 81.2 Secretase cleavage of APP splice forms. 161.3 Primary and secondary structure of Ap42. 211.4 Amyloid cascade hypothesis. 271.5 Bioflocculant hypothesis of AD. 291.6 AD as a disorder of brain self-organisation and dysmorphoregulation. 301.7 Topological representation of PS1 showing the eight transmembrane
model. 402.0 Dimensions used for Bis-acrylamide gel. 523.1 Endogenous staining of PS1 in Cos-7 cells. 593.2 PS1, Colligin and Golgin antibody staining of Cos-7 cells. 603.3 BFA treatment of Cos-7 cells. 633.4 923 and ERGIC53 antibody staining of BFA treated Cos-7 cells. 643.5 923 and 1039 antibody staining of Cos-7 whole cell lysate. 654.0 Generation of N-terminal PS1 fusion protein by PCR and subcloning. 684.1 Amplification of N-terminal PS1 fragment by PCR. 694.2 Restriction digest of cDNA recovered from transformed DH5a E.coli. 724.3 Restriction digest of pNTPS1-EGFP recovered from transformed DH5a
E.coli. 754.4 Transfection of Cos-7 cells with the N-terminal PS1 fusion construct
generates distinct phenotypes. 774.5 Phenotypes expressed by Cos-7 cells transfected with the fusion
construct. 784.6 Western analysis of Cos-7 cells expressing the fusion protein 794.7 Anti-EGFP antibody staining of Cos-7 cells expressing the NTPS1
fusion protein. 824.8 ER antibody staining of Cos-7 cells expressing the NTPS1 fusion
protein. 834.9 The fusion protein overlaps to varying degrees with markers to the
Golgi.84
4.10 923 antibody staining and BFA treatment of transfected Cos-7 cells. 854.11 ERGIC 53 antibody staining of BFA-treated Cos-7 cells expressing the
NTPS1 fusion protein. 864.12 1039 antibody staining of Cos-7 expressing the NTPS1 fusion protein. 875.0 Cell fixation method. 905.1 Transfection of different cell types with pNTPS1-EGFP. 915.2 Schematic representation of the PCR required to generate PS1 cDNAs. 955.3 Amino acid sequence of PS1. 965.4 Amplification by PCR of pCLneoPSl 975.5 Analysis of PCR product. 975.6 Restriction digestion of putative FLMPS1 and NTMPS1 cDNAs. 1015.7 Single restriction digest of pEGFP, and putative pEGFP-containing
FLMPS1 and NTMPS1 plasmids. 1025.8 NTMPS1 and NTPS1 exhibit identical phenotypes. 1035.9 Phenotypes displayed by full-length proteins. 1075.10 Transfection of Cos-7 cells with the full-length fusion constructs. 1085.11 NT7 staining of the blob-like aggregate phenotype. 1095.12 Western analysis of NTMPS1, FLPS1, and FLMPS1 fusion proteins. 110

Table of Figures Page
6.0 Altered ER antibody staining. 1146.1 Altered Golgi antibody staining. 1156.2 P-Catenin antibody staining. 1166.3 APP 993-antibody staining. 1206.4 APP 874-antibody staining. 1216.5 APP DE2-antibody staining. 1226.6 Detection and separation of synthetic Ap40 and Ap42 peptides 1256.7 Immunoprecipitation of Ap40/Ap42 126
6.8 Modifications to immunoprecipitation protocol. 1276.9 HEK293 cells stably expressing FLPS1-EGFP or NTMPS1-EGFP
fusion proteins. 1306.10 Western analysis of stable NTMPS1-EGFP HEK 293 cells. 1316.11 Western analysis of stable full-length-EGFP HEK 293 cells. 1326.12 Effect of varying stauroporine concentrations on Cos-7 morphology
over time. 1386.13 Staurosporine treatment of Cos-7 cells expressing the truncated fusion
6.14protein over time. 139GRASP65 staining of pNTMPS1-EGFP transfected NRK cells treatedfor 4 hours with 1 pM staurosporine. 140
6.15 Quantitation of Grasp65 staining of pNTMPS1-EGFP transfected anduntransfected NRK cells treated with 1jiM staurosporine over 4 hours. 141
6.16 Polyclonal Grasp65 immunoblotting of whole cell lysate taken from NRK cells expressing the NTMPS1-EGFP fusion protein following
7.0treatment with 1 iM staurosporine over 4 hours. 142Oligo linker sequence. 145
7.1 NT7 and 1039 staining of Cos-7 cells transfected with PS1-STOP-EGFP constructs. 148
7.2 Western analysis of full-length and truncated PS1-STOP proteins. 1507.3 Colligin and Mannosidase II antibody staining of Cos-7 and HEK293
cells. 1547.4 ERGIC53 antibody staining of Cos-7 and HEK293 cells expressing the
NTMPS1-EGFP fusion protein. 1557.5 Membrin antibody staining of Cos-7 and HEK293 cells displaying the
blob phenotype. 1567.6 P-COP staining of Cos-7 and HeK293 cells expressing NTMPS1-
EGFP. 1577.7 COP II staining in HEK 293 cells displays a peri-nuclear and punctate
phenotype. 1587.8 COP II staining of Cos-7 cells expressing moderate levels of the fusion
protein exhibits a peri-nuclear phenotype. 1597.9 LAMP-1 staining of Cos-7 expressing the NTPS1-EGFP fusion protein. 1607.10 Ubiquitin antibody staining of cells expressing the NTMPS1-EGFP
fusion protein. 1667.11 Aggresome formation causes a redistribution of the IF vimentin
following proteosome inhibition. 1677.12 Vimentin staining of Cos-7 cells treated for 12 hours with the
proteosomal inhibitors MG132 and Lactacystin. 1687.13 Vimentin staining of HEK293 cells treated for 12 hours with the
proteosomal inhibitors MG132 and Lactacystin. 1697.14 Proteasome inhibition of NTMPS1 HEK 293 cells. 1707.15 Overnight treatment of NTMPS1 HEK 293 cells with MG132. 1717.16 Effect of varying MG132 concentration on the distribution of vimentin in
HEK 293 NTMPS1 cells. 172

Table of Figures Page
7.17 MTOC and Mitochondria antibody staining in HEK293 and Cos-7 cells. 1737.18 Cos-7 cells were treated for 12 hrs with MG132 alone or in
combination with the microtubule disrupting agent nocodazole. 1747.19 Analysis of transfected cells over time. 1757.20 Origin of the blob phenotype. 1767.21 Transmission electron microscopy of Cos-7 cells expressing the fusion
protein (A). 1817.21 TEM images (B & C). 1827.21 TEM images (D, E, F & G). 1837.21 TEM images (H, I, J & K). 1847.21 TEM images (L, M, N & 0). 1858.0 Schematic outline of events proposed to account for the presence of
the blob phenotype 224
List of tables Page
1.0 Genetic factors predisposing to AD. 311.1 Examples of missense mutations in human PS1 and age of FAD onset. 331.2 Genetic loci associated with AD. 371.2 Oxidative stress and inflammation in AD. 161.3 Primer sequences used to amplify by PCR truncated (NTPS1) and full 211.4 length (FLPS1) PS1 mutant and wild-type cDNAs from pCLneoPSI. 302.0 Antibodies used within this study. 492.1 Composition and stock solutions used for Bicine gels 522.2 Final gel volumes. 524.0 Primer sequences used for the amplification by PCR truncated and full
length PS1 mutant and wild-type cDNAs from pCLneoPSI. 704.1 Predicted versus observed fragment sizes generated following
restriction enzyme digestion of plasmid DNA. 755.0 Fragment sizes of PCR products following single site restriction digest 1015.1 Comparison of fragment sizes. 1026.0 Data for staurosporine treatment of NTMPS1-EGFP transfected Cos-7
cells. 1346.1 Summary of data for Grasp65 staining of pNTMPS1-EGFP transfected
NRK cells treated with 1pM staurosporine. 141

Abstract
There is considerable interest in the role of aggregated protein in the underlying
pathology of human neurodegenerative conditions including Alzheimer’s disease
(AD), light chain amyloidosis, spongiform encephalopathies, Huntingdon’s disease,
Parkinson’s disease, etc. AD is a progressive neurodegenerative condition
responsible for dementia in the elderly. An early onset, familial genetic basis
(FAD) for the disease has been established in kindreds, where mutations in the
amyloid precursor protein (APP) and the presenilin proteins (PS) cause cerebral
deposition and aggregation of the p-amyloid (Ap) peptide responsible for the
clinical and pathological features of the disease.
In order to investigate the cell biology of presenilinl and the effect of AD-
causing mutations on intracellular dynamics, constructs of enhanced green
fluorescent protein fused to wild type or mutant N-terminal fragment and full-length
PS1 were prepared. Immunocytochemical analysis reveals that the fusion proteins
display four distinct phenotypes: ER, Golgi, vesicular and ‘blob-like aggregates’.
Furthermore, removal of the EGFP moiety had no effect on the phenotype. The
‘blob-like aggregates’, are high copy number, ubiquitinated structures that originate
from the nuclear/ER interface, and are not dependent on microtubules for their
formation nor are they contained by the intermediate filament vimentin, indicating
that they are neither aggresomes nor inclusion bodies.
Moderate to high levels of the fusion protein disrupt the endoplasmic
reticulum and Golgi compartments, suggesting that the normal trafficking of
materials within the cell may be disturbed. Additionally, the N-terminal construct
sensitises cells to staurosporine-induced apoptosis. TEM images from cells
expressing the fusion protein reveals numerous phagosomes and mutilaminar
bodies that fit the profile seen for the blob-like aggregates in terms of dimension,
number and general morphology. These data suggest that the blob-like
aggregates might be novel membrane-bound structures. These fusion proteins
provide a convenient means for studying the consequences of protein aggregation
on the ubiquitin-proteasome system (UPS), apoptosis and phagocytosis within the
cell.
1

List of abbreviations
A2M a-2 macroglobulinAP Beta AmyloidAD Alzheimer’s DiseaseADAM ‘a disintegrin and metalloprotease’AICD APP intracellular domainALS AmyloAph-1 Anterior pharynx defective-1APS Ammonium PeroxydisulphateAP Alkaline PhosphataseApoE Apolipoprotein EAPP Amyloid Precursor ProteinBACE Beta-site APP-cleaving enzymeBCIP 5-Bromo-4-chloro-3-lndoyl phosphateBFA Brefeldin-ACAT Choline acetyltransferaseCAPS Cyclohexylamino-1 -propanesulfonic acidCFTR Cystic fibrosis transmembrane
conductance regulatorCHO Chinese Hamster OvaryCOP Coatomer proteinsCPP Common Population PolymorphismCSF Cerebrospinal fluidCTF C-terminal fragmentDAPI DiaminobezamideDMEM Dulbecco’s modified Eagles mediumDNA Deoxyribonucleic acidDTT DitheothreitolDS Down SyndromeECS Extracellular spaceEGFP Enhanced Green Fluorescent ProteinERGIC ER intermediate compartmentER Endoplasmic ReticulumFAD Familial Alzheimer’s DiseaseFALS Familial amyotrophic lateral sclerosisFNDI Familial Neurohypophyseal Diabetes
InsipidusFLCPS1 Full length conserved (wild type) presenilinFLMPS1 Full length mutant presenilingadd45 Growth arrest and DNA damage-inducible geneGalNac N-acetylgalactosaminyltransferaseHEK Human Embryonic KidneyHRP Horse Radish PeroxidaseIC - Intermediate compartmentICD Intracellular domainIDS Insulin degrading enzyme
2
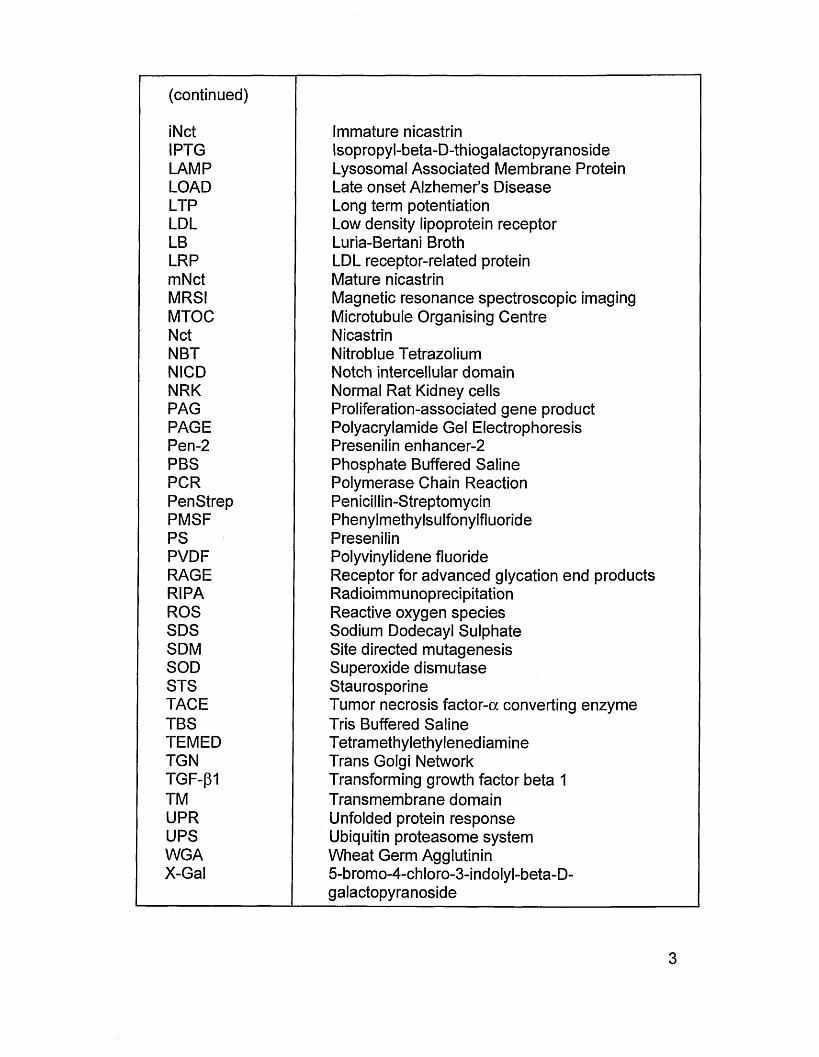
(continued)
iNct Immature nicastrinIPTG Isopropyl-beta-D-thiogalactopyranosideLAMP Lysosomal Associated Membrane ProteinLOAD Late onset Alzhemer’s DiseaseLTP Long term potentiationLDL Low density lipoprotein receptorLB Luria-Bertani BrothLRP LDL receptor-related proteinmNct Mature nicastrinMRSI Magnetic resonance spectroscopic imagingMTOC Microtubule Organising CentreNet NicastrinNBT Nitroblue TetrazoliumNICD Notch intercellular domainNRK Normal Rat Kidney cellsPAG Proliferation-associated gene productPAGE Polyacrylamide Gel ElectrophoresisPen-2 Presenilin enhancer-2PBS Phosphate Buffered SalinePCR Polymerase Chain ReactionPenStrep Penicillin-StreptomycinPMSF PhenylmethylsulfonylfluoridePS PresenilinPVDF Polyvinylidene fluorideRAGE Receptor for advanced glycation end productsRIPA RadioimmunoprecipitationROS Reactive oxygen speciesSDS Sodium Dodecayl SulphateSDM Site directed mutagenesisSOD Superoxide dismutaseSTS StaurosporineTACE Tumor necrosis factor-a converting enzymeTBS Tris Buffered SalineTEMED TetramethylethylenediamineTGN Trans Golgi NetworkTGF-P1 Transforming growth factor beta 1TM Transmembrane domainUPR Unfolded protein responseUPS Ubiquitin proteasome systemWGA Wheat Germ AgglutininX-Gal 5-bromo-4-chloro-3-indolyl-beta-D-
galactopyranoside
3
Chapter 1
1.0 Relevance of Alzheimer’s disease
For the majority of individuals living in the West, the advent of modern medicine,
particularly the development of antibiotics in the previous century, has effectively
extended the average life expectancy. Mortality commonly associated with
microbial infection has now been supplanted by maladies arising as a
consequence of the normal ageing process. As the population ages the health
cost associated with increased longevity threatens to undermine Western health
care systems. Of increasing concern is the rise in the number of cases of
dementia, particularly Alzheimer’s disease (AD) now thought to affect 15 million
individuals world-wide. Beside the emotional burden placed on patients, their
families and carers, society will have to reckon with the long-term economic costs
of a population affected by AD. The annual economic costs of AD to the USA alone
were estimated at US$ 80-100 billion (National Institute on Aging). Thus efforts to
find an effective therapy to this most debilitating disease are crucial if a future
social healthcare crisis is to be avoided.
1.1 Introduction to Alzheimer’s Disease
In 1906 at a scientific meeting in Munich a Bavarian psychiatrist, Alois Alzheimer
(1864-1915) described the neuropathology of a 51-year-old Frankfurt woman
referred to as Auguste D, who had died following a period of progressive dementia.
Using recently developed silver staining techniques, Alzheimer described a host of
pathological abnormalities including amyloid plaques and neurofibrillarly tangles,
now considered the major hallmarks of the disease. AD is the commonest form of
dementia accounting for 50-70% of typical late onset cases, and is characterised
by progressive loss of memory and orientation. It is an age-related condition
affecting approximately 11% of the population over 65 years of age and 50% over
85 years of age (Hof et al, 1995). Globally, AD is thought to affect 1 in 20 people.
Though the aetiology of the disease process is currently unknown, AD can
manifest itself in two ways. Firstly, a familial basis for AD (FAD) has been

established whereby specific gene mutations cause the early onset of the disease.
Secondly, whereas FAD accounts for less than 1% of all AD cases, the majority of
patients who exhibit AD characteristics do so sporadically. This late-onset AD
(LOAD) is likely due to genetic as well as epigenetic (environmental) factors. In
general terms, AD can be thought of as a multifactorial syndrome resulting from
impaired processing of proteins, oxidative stress and inflammation events rather
than as a disease attributable to a single cause (Selkoe, 1999). Much of the earlier
research in AD consisted of anatomical investigations of the brain coupled with
improved silver staining protocols. The development of biochemical and
immunological techniques since the 1970s have provided a wealth of data on AD
pathology, that when taken together with current molecular and genetic
technologies has brought the prospect of an effective therapeutic treatment ever
closer. A simplified schema outlining the history of AD research from its initial
descriptions back in 1906 to the present day is shown in figure 1.0.
1.2 Pathophysiological features of AD
(i) Neurological and transmitter alterations
In the early stages of the disease, neurodegeneration occurs primarily within
cholinergic regions such as the hippocampus, entorhinal cortex and amygdala,
suggesting early-stage AD to be a corticolimbic neurodegenerative disorder
(Pearson and Powell, 1989; Schneider et al, 1999). Even in mild cases of AD
there is already a 50% loss of neurons in the entorhinal cortex, a neural bridge that
connects the hippocampus with the neocortex.
Initially, an AD patients motor, sensory, and linguistic abilities are preserved,
however eventually the disease evolves into a global impairment affecting multiple
cognitive domains, leading to dementia and ultimately death. Behaviourally,
affected individuals are no longer able to perform learned perceptuo-motor tasks
such as dressing, washing, eating etc, and invariably patients show impaired social
skills and are given over to bouts of jealously, and in some instances, violent rage.
In advanced stages of the disease affected individuals show significant memory
5

2001 onwards
Decade of familial AD
2000Tau mutations 1998
Presenilin mutations 1995A PP mutations 1991
- 1990
1970
Elucidation of sporadic AD etiology?Prevention and therapy of sporadic and familial AD?
Molecular and cellular biological and reverse genetic studies
Pathological chronology Pathobiochemistry Transmitter studies
Clinical and pathological studies
1906 Initial scientific description of AD
Figure 1.0. Simplified time line of AD research from first discovery in 1906 to present day. Modified from Saido, (2003).
loss, aphasia (loss of language), apraxia (impairment of purposeful movement) and
agnosia (inability to recognise objects) (Strange, 1992).
Many of these behavioural changes can be explained by the loss of various
neurotransmitters and their associated markers. These include losses of
noradrenergic neurones in the locus ceruleus (structures associated with an
individual’s level of attention and vigilance) and decreases in the serotonergic
system responsible for overall cortical activity. Most striking is the loss of markers
from cholinergic neurons in the basal forebrain and ventral striatum (Perry et al,
1973).
6

The loss of cortical choline acetyl transferase (CAT) and decline in acetylcholine
synthesis in biopsy specimens has been found to correlate strongly with cognitive
impairment (Felician and Sandson, 1999; Vickers et al, 2000; Law et al, 2001). In
terms of therapeutics, the selected loss in cholinergic neurotransmission as a
consequence of AD has been addressed through the use of drugs that either
sustain the action of acetylcholine within the synaptic cleft or mimic its action at
cholinergic receptors. Overall though, cholinergic enhancement provides at best
only mild symptomatic relief for patients with AD, thus current research into new
therapies is focused on non-cholinergic aspects of AD metabolism.
(ii) Micro-histopathological features of AD
As well as gross anatomical changes in the AD brain such as gyral atrophy typified
by sulci widening, ventricular dilation and frontal, parietal and temporal lobe
shrinkage, post mortem microscopic examination reveals the presence of two
distinct micro-pathological lesions. The first of these lesions, originally noted by
Alzheimer himself, consist of interneuronal, aggregated fibrils referred to as
neurofibrillarly tangles (NFTs). The second type of lesion consists of aggregated
P-amyloid (Ap) peptides that form extracellular inclusions referred to as senile
plaques.
(iii) NFTs contain aggregates of hyperphosphorylated tau
In AD brains tau deposits occur as abnormally phosphorylated intracellular threads
within neurites (dendrites and axonal terminals that have degenerated), or as NFTs
composed of pairs of ~10 nm filaments wound into paired helical filaments (PHF)
located within the neuronal cell body (figure 1.1). The normally soluble tau present
in tangles resists the actions of most detergents such as SDS or guanidine
hydrochrolride but can be partially solubilized by boiling in SDS. In fact, long after
neurons have undergone apoptosis NFTs remains as so-called ‘tombstone’
markers (Selkoe et al, 1982). Tau is one of several microtubule-associated proteins
(MAPs) that function to stabilise microtubules responsible for maintaining cell
polarity, intracellular transport and the development of cellular processes.
7

Figure 1.1. p-Amyloid plaque ‘A’ present within amygdala of a 69 year old AD male (plaque diameter ~75(liM). Pyramidal neurons show neurofibrillary tangles (darkly staining bodies). Arrowheads indicate dystrophic neurites containing PHF. Specimen shows Bielchowsky silver staining (Selkoe, 1991).
The spatial-temporal development of AD and the attendant clinical manifestations
of the disease correlate well with tau pathology and synaptic loss. Tau deposits
spread from the transentorhinal region to the hippocampus and the neocortex in a
series of observable stages, six in all, the first two being pre-clinical (Braak and
Braak, 1991). The majority of AD cases are sporadic, i.e. there is no underlying,
overt genetic cause, and thus tau PHFs have been proposed as the best correlate
for clinical progression/pathological indicator of AD. Tau proteins undergo
phosphorylation at multiple sites as a means of regulating its microtubule binding
properties. Learning and memory formation requires that neurons and their
synapses be labile so as to allow new memories to be hard wired into new or pre
existing neural networks. This requires flexibility of the underlying cytoskeletal
architecture, thus de novo microtubule assembly and stabilisation requires the
presence of proteins such as tau and other MAPs at axonal locations and synaptic
junctions (Arendt, 2001).
8

Tau has multiple phoshorylation sites accessible to a variety of different kinases
such as glycogen synthase kinase-3 (GSK-3), MAP kinase, cyclin dependent
kinase 5, microtubule affinity-regulating kinase (MARK), etc (Mandelkow and
Mandelkow, 1998). It is the combined actions of kinases and phosphatases that
are responsible for the constant remodelling of the cell interior, for example during
mitosis. In the AD brain tau undergoes aberrant phosphorylation at sites only seen
during foetal development. Following hyperphosphorylation the ability to bind to
microtubules is lost leaving tau free to associate with sulphated
glycosaminoglycans or nucleic acids, leading to the formation of PHF within
neurons (Goedert, 1996; Hasegawa et al, 1997), which consequently disturb
axonal transport, ultimately affecting neurite outgrowth. Destabilization may
decrease axoplasmic flow, so generating dystrophic neurites that contribute to
synaptic loss.
Several questions concerning the formation of tangles remains unanswered,
in particular the nature of the trigger and the identity of the kinase responsible for
the hyperphosphorylation of tau. Whist PHF can be generated in vitro, attempts at
generating them in cell models has so far failed. Moreover, over expression of
human tau isoforms in transgenic mice has not resulted in an AD-like pathology
(Mandelkow and Mandelkow, 1998). Ultimately NFTs within neurites of the AD
brain may be seen to be the pathological consequence of Ap amyloidosis rather
than as a first cause.
(iv) Amyloid peptide deposits in the AD brain
The second pathological lesion found in the AD brain is the presence of
extracellular plaques that fall broadly into two morphologically distinct types, so
called neuritic and diffuse plaques. Following purification and sequencing in the
1980s plaques were found to contain aggregated fibrils of Ap peptide (Glenner and
Wong, 1984; Masters et al, 1985). Under normal metabolic conditions Ap is
proteolytically derived from its amyloid precursor protein (APP) by the sequential
action of two secretases, referred to as P- and y-secretase, to yield a 4 kDa peptide
composed of 39-43 amino acids (Kang et al, 1987). In the case of y-secretase,
cleavage is mediated either directly by a group of transmembrane proteins referred
9

to as the presenilins (PS1 and PS2), or else the presenilins are a crucial cofactor
intimately involved in the y-cleavage of APP (Selkoe, 1999).
(v) Neuritic plaques
Neuritic plaques are spheroid structures 10 to 120 jum diameter found in large
numbers in the limbic and association cortices that vary in the degree of
compaction of the amyloid core (Dickson, 1997). Analysis of the core reveals Ap
fibrils (7-10 nm) intermixed with non-fibrillar forms, surrounded by activated
microglia, fibrillary astrocytes and dystrophic neurites from many neurotransmitter
classes, both within the amyloid deposit and imm ediately surrounding it.
Ultrastructural analysis of the neurites reveals the presence of PHF as well as
abnormally enlarged lysosomes and numerous mitochondria (Selkoe, 1996).
Activated microglial cells expressing CD45 markers are often found within and
adjacent to the central core of the plaque whereas astrocytes tend to form a ring
around the plaque body (Selkoe, 2001).
The time scale in which these changes take place is currently unknown but
likely involves many months or years. The deposition of Ap appears to be the
earliest morphological change in the formation of neuritic plaques (Mann and Esiri,
1989). The C-terminus of Ap affects the solubility of the peptide such that the Ap4o
variety is extremely soluble compared to Ap42, which readily forms highly insoluble
fibrils in vitro (Jarret et al, 1993). In fact the latter isoform makes up the bulk of AP
within neuritic plaques along with Ap40 even though it is produced in very small
amounts. Overall Ap40 makes up 90% of secreted amyloid, whilst Ap42 is produced
in fractional amounts, however, co-incubation of Ap42/43 with Ap40 readily forms
aggregates suggesting that the longer amyloid isoform may act a seeding agent in
the formation of plaques (Tomita et al, 2001).
10

(vi) Diffuse plaques
Diffuse plaques are composed of amorphous A(3 and are found throughout the
brain particularly within the cerebral vasculature and without the surrounding
neuritic degeneration. At the time the presence of the soluble nonfibrillary peptide
and the absence of neurites had been interpreted as representing an early stage in
the development of senile plaques (Bugiani et al, 1995). However, with the
development of specific Ap antibodies it became clear that the Ap42 constituted the
major component of diffuse plaques with no, or little Ap4o immunoreactivity in
contrast to the heterogeneity of mixed neuritic plaques (Dickson, 1997; Selkoe,
2001). This would suggest that specific alterations in Ap underlie the variations in
Ap deposition, arguing against diffuse to neuritic plaque staging (Vickers et al,
2001). However, evidence supporting a temporal staging of plaque development
comes from observations that in normal aged, non-AD brains diffuse plaques are
often found within the limbic and association cortices without any cognitive
behavioural impairment. Additionally, immunohistochemical analysis of the
teenage Down Syndrome (DS) brain in which APP is over expressed, reveal the
presence of diffuse plaques composed solely of Ap42, yet NFT and neuritic
degeneration is not observed until the third decade, when Ap40 deposits begin to
associate with plaques, along with microgliosis, astrocytosis (Lemere, 1996).
The aggregation and deposition of Ap in both diffuse deposits and within
amyloid cores is seen as the defining lesion of AD, yet in some kindreds there exist
large plaques lacking the classical core of amyloid fibrils (Crook et al, 1998;
Yanker, 1998). Those regions of the brain not associated with the clinical aspects
of the disease, such as the thalamus and cerebellum, as well as the brains of equal
aged matched individuals still show the presence of Ap, albeit in very diffuse
deposits not associated with plaques or tangles.
Diagnosis during disease onset has proven problematic in the past, however
the level of Ap42 may be informative as a diagnostic marker in some early onset AD
families bearing missense mutations (De Jonghe et al, 1999a). Differences in the
levels of insoluble Ap found in AD, normal and pathologic ageing brains suggest
that pathologic ageing is a transition state between normal ageing and AD (Wang
11
et al, 1999). Current attempts at diagnosing the early stages of AD in living brains
has been attempted using advances in magnetic resonance imaging techniques
(Fox and Rossor, 2000). Ultimately, it is the presence of plaques and tangles
representing classical end-stage lesions that allow a definitive diagnosis of AD to
be made post mortem.
1.3 Biology of the amyloid precursor protein
(i) Proteolytic processing of APP
APP is a glycosylated, single pass type I transmembrane protein (110-140 kDa)
constitutively expressed in many different cell types and has many alternate
transcripts produced from one gene, giving rise to many different APP isoforms
(Selkoe, 1998). APP belongs to the APP-family, which contains the APP-like
proteins 1 and 2 (APLP1 and APLP2). Three main APP species have been
recognised: a 751 and a 770 amino acid protein commonly found in both neurons
and non-neuronal cells; and a 695 amino acid protein found almost exclusively in
neurons (Goldgaber et al, 1987; Kang et al, 1987). APP6 95 is expressed both
intracellularly and at the cell surface, and can be converted at both these sites to
different secreted forms (Kang et al, 1999). The metabolic fate of APP (half-life of
~45-60 mins) is thought to be regulated by many factors including first messengers
such as cholinergic agonists, and second messengers such as phospholipase-C
and protein kinase-C, which appear to enhance a-secretase activity. This in part
may be down to alteration in the phosphorylation status of the secretase or
enhanced trafficking of Golgi-derived APP-containing vesicles to the cell surface
(Selkoe, 1996).
Like many other proteins passing through the secretory pathway, APP
undergoes post-translational modifications including N- and O-linked glycosylation,
phosphorylation and sulphation. APP is co-translationally translocated into the
endoplasmic reticulum (ER) via its signal peptide and then undergoes maturation
as it passes through the Golgi (Cook et al, 1997; Hartmann et al, 1997). A
hydrophobic stretch of amino acids situated at the carboxy terminal of APP helps
anchor the molecule within the cell membrane compartment. Three main
12

secretase enzymes responsible for the cleavage of APP have been identified; the
a-, p- and y-secretases.
(ii) a-secretase pathway
The a-secretase has not been identified as any single proteinase, but two
members of the ADAM (a disintegrin and metalloprotease) metalloprotease family,
ADAM-10 or Kuzbanian and ADAM-17 are candidate a a-secretases. ADAM family
proteases typically possess several domains including an endothelial growth
factor-like domain, a transmembrane domain, a cytoplasmic domain and an
autoinhibitory domain that must be removed for activity. Additionally, these
proteases are characterised by the presence of a disintegrin domain able to bind
integrins or other receptors and a metalloproteinase domain that contains a
consensus active-site sequence for a zinc-dependent metalloprotease (Primkoff
and Myles, 2000).
ADAM 10 activity releases a soluble form of Delta, a ligand for the cell
surface receptor molecule Notch responsible for cell fate during development and
neurogenesis. Cells carrying mutant forms of the KUZ (ADAM10 gene) do not
receive inhibitory signals from neighbouring cells leading to an excessive neuronal
cell proliferation (Primkoff and Myles, 2000). The role of ADAM 10 a-secretase
activity in basal and stimulated ectodomain shedding of APP has been
demonstrated by studies investigating ADAM 10 overexpression in cells that lead
to a severalfold increase of aAPPs and the p10 fragment that is further cleaved by
the y-secretase to yield soluble p3 (Lammich et al, 1999).
ADAM 17 or tumor necrosis factor-a converting enzyme (TACE) is thought
to be a membrane-anchored enzyme that shows poor sequence specificity when
cutting single-pass proteins and is responsible for the release of a 17 kDa tumor
necrosis factor (a-TNF) fragment involved in inflammation. In the cleavage of APP,
the a-secretase cuts at a specific distance from the outer membrane surface
(Sisodia et al, 1992). APP proteolysis occurs between lysine 687 and leucine 688
(residues 16 &17 of AP) to release a large soluble ectodomain molecule reffered to
as a-APP, whereas a-secretase activity in combination with y-secretase releases a
13

p3 fragm ent containing part of the Ap sequence and a larger C-terminal
membrane-bound fragment called C83 (figure 1.2). Thus the a-secretase pathway
is non-amyloidogenic and from the perspective of AD, any shift towards increased
a-secretase activity might conceivably have beneficial effects. In most cell cultures,
10-30% of all APP undergoes a-cleavage thus alteration in TACE activity in the
aged brain may contribute to amyloid formation. TACE is thought to be involved in
regulated a-secretion since disruption of the TACE gene abolishes regulated a -
cleavage in cultured cells, whereas APPS is unaffected in cells derived from
knockout mice (Bauxbaum et al, 1998).
(iii) P-secretase pathway
A second enzyme termed p-secretase (beta-site APP-cleaving enzyme, BACE) is a
type 1 transmembrane protein that exists as a preproenzyme of 501 amino acids
that displays several features including a 21-residue signal peptide, a prosegment
of about 39 residues, a catalytic unit with active site aspartyl residues at positions
93 and 289, a 27-residue transmembrane region, and a 21-residue C-terminal
domain (W alter et al, 2001). Studies examining the overexpression of BACE
reveal the presence of the enzyme within the ER-interm ediate compartment
(ERGIC), Golgi vesicles and lysosome/endosome compartment of neurons (Vassar
et al, 1999). The majority of Ap appears to be generated within the trans Golgi
network (TG N), presumably the same location as P- and y-secretase activity,
whereas radioiodination experiments and cell surface biotinylation (Lammich et al,
1999) show a-secretase cleavage of APP at the plasma membrane. BACE is
highly expressed in brain and other tissues as demonstrated by the production of
Ap.
Evidence for the role of BACE in APP processing comes from the use of
antisense oligonucleotides that block BACE expression greatly diminishing the
production of Ap, whereas, overexpression of BACE in a number of cell lines leads
to enhances Ap production. Significantly, BACE knock-out mice show no adverse
phenotype but have dramatically reduced levels of Ap demonstrating that
14

elimination does not pose serious consequences for the animal, a factor of great
importance in targeting BACE for inhibition in AD therapy (Walter et al, 2001).
BACE is a novel transmembrane aspartyl protease that initiates A(3 generation by
cleaving APP after met 671, producing a ~12 kDa C-terminal fragment some 99
amino acids in length (Vassar et al, 1999). The C-terminal is retained within the
membrane whilst the N-terminal is the first amino acid (Asp) of the Ap peptide
(figure 1.2). The released fragment is referred to as PAPP (Seubert et al, 1992).
The C99 peptide serves as the substrate for the generation of Ap by the y-
secretase and therefore constitutes the amyloidogenic pathway responsible for the
accumulation of Ap. Uniquely APP appears to be the only protein substrate that is
cleaved by BACE.
(iv) y-secretase pathway
The third protease involved in the proteolysis of APP termed y-secretase, acts on
both APP transcripts within the hydrophobic transmembrane domain, y-secretase
is equated as being presenilin, or at the least, intimately associated with y-
secretase activity (Selkoe, 1999; Wolfe et al, 1999b). In the case of the a-APP C-
terminal fragment, y-secretase generates a peptide fragment called p3, whilst its
action on the pAPP C-terminal fragment generates Ap proper. Ap 40 is the
predominant isoform produced during normal metabolism of pAPP (Haass et al,
1992; Jarett and Lansbury, 1993) and is detected in the CSF and plasma of normal
healthy individuals throughout life, y-secretase cleavage of APP at valine 711
generates Ap4o or the toxic Ap42 species following cleavage at isoleucine 713
(figure 1.2). A more detailed appraisal of y-secretase is discussed in the section
dealing with the biology of presenilin in AD.
(v) APP trafficking and Ap generation within the cell compartment
The majority of aAPP is derived by the action a-secretase processing APP at the
plasma membrane (Sisodia et al, 1992) or during secretory intracellular trafficking
of the peptide, whereas BACE activity occurs during the late secretory trafficking of
15

APP (Haass et al, 1993). The generation of the A(342 peptide appears to occur
within the ERGIC, while the production of the A(340 is thought to occur more distally
within the secretory pathway, predominantly within the TGN/endosomal-lysosomal
systems (Golde et al 1992; Haass et al, 1994). Those APP peptides untouched by
enzymic action at the plasma membrane are endocytosed by clathrin coated
vesicles and trafficked to late endosomal compartments for recycling or lysosomal
degradation (Walter et al, 2001).
Single transmembrane spanning region
1 18 289
■ ii ii i
NH2
Signal peptide region
18
KPIAP
a-secretase
aA PP
770
C O O H
l 1 y-secretase
v 711 or 687 713
IC83
P3
P-secretase
18 671
PAPP
Ap
Y-secretase
£ r ~ 7 11 or 713
C99
Figure 1.2. Secretase cleavage of APP splice forms. The largest form (770 amino acids) incorporates a Kunitz-type serine protease inhibitor domain of 56 amino acids at residue 289. The arrows indicate the site at which the peptide undergoes constitutive proteolytic cleavage by a-, P-, and y-secretase. This generates the soluble APP fractions aAPP and pAPP, and C-terminal fragments C83 and C99, which are retained by the membrane. The action of y-secretase generates p3 and Ap peptides from aAPP and PAPP, respectively. The C99 fragment may be processed by y- secretase at positions 711 or 713 to yield AP40 or Ap42.
Investigations into the subcellular compartments from which amyloid variants are
generated and secreted, have demonstrated that A(340 and A(3x.4o (x being a NH2-
terminal truncated 'ragged' form) are generated exclusively within the TGN where
they are packaged into secretory vesicles (Cook et al, 1997; Hartmann et al, 1997;
16

Greenfield et al, 1999). These peptides formed in the TGN consist of two pools, a
soluble population extractable with detergents and a detergent-insoluble form
(Greenfield et al, 1999). The majority of Ap is destined for secretion into the CSF
and the blood plasma, however, Ap generated from APP whilst still within the
ERGIC, may not be destined for secretion but may instead be retained and
catabolised inside cells, where it could confer pathogenic properties distinct from
those mediated by extracellular plaque formation (Cook et al, 1997).
Much of the data on the location of APP and Ap is complex and difficult to
interpret. In particular there appears to be a discrepancy between the site at which
Ap42 is generated and the ER/IC location of the P-and y-secretases needed to
generate it, a finding referred to as the so-called spatial paradox (De Strooper et al,
1997; Annaert et al, 1999). Brefeldin-A (BFA) treatment of NTera 2 cells prevents
Ap secretion, in particular Ap4 o whereas BFA-treatment of cells has little effect on
Ap42 secretion suggesting that the toxic species is generated in the ERGIC (Cook
et al, 1997; Chen et al, 2000). Additionally, cleavage of p-APP by BACE takes
place predominantly within acidic compartments i.e. within the TGN and
endosomes (Haass et al, 1993). Similarly, pulse chase experiments show that the
majority of the C83 and C99 fragments derived from APP are glycosylated, i.e.
their cleavage by y-secretase must occur post-Golgi. Whether other intracellular
sites beyond the ERGIC contribute to the generation of secreted AP42 remains to
be determined. Biochemical and immunocytochemical experiments have detected
PAPP in the ER and post-Golgi secretory vesicles; Ap42 in the ER; and Ap in
glycolipid membranes (Selkoe, 1999), indicating that Ap can be generated and/or
accumulate at various points along the secretory pathway.
Other studies indicate that intracellular Ap42 also forms insoluble aggregates
within lysosomes that resist degradation. The addition of AP4 2 to cultured cells
likewise, leads to the accumulation of newly synthesized Ap, particularly the
ragged forms, indicating that intracellular Ap may derive from a 'solid phase',
cellular pathway. This pathway, which preferentially generates ragged AP4 2 ,
contrasts to the pathway that primarily produces secreted Ap (Yang et al, 1999).
Other findings imply that the progressive shift of AP40/AP4 2 , from soluble to
insoluble pools, plays a mechanistic role in the onset and/or progression of AD
17

(Wang et al, 1999). Although the majority of studies indicate that the secretion of
AP42 into the extracellular space is the likely route by which it forms insoluble fibrils,
other studies suggest that a portion may enter through the blood brain barrier, via a
receptor-mediated transport system similar to the uptake of insulin (Poduslo et al,
1999). Furthermore, the majority of peripheral as well as centrally located cells
such as astrocytes, microglia, endothelial and smooth muscle cells all produce
APP and generate Ap in variable amounts, possibly contributing to the secreted
pool of Ap from within the brain or via the blood brain barrier (Selkoe, 2001).
Previous studies indicate that APP is rapidly transported anterogradely
within neurons along axons out to axon terminals where they are present within
vesicles (Koo et al, 1990). Similarly, retrograde transport of APP from the
terminals back to the cell body has also been observed. Here, some APP may be
translocated to the somatodendritic surface or may recycle via the endosome
system, possibly generating Ap in the presence of p- and y-secretase (Yamazaki et
al, 1995). More recently, APP has been demonstrated to bind to Kinesin-1, a
microtubule motor protein, where it functions as a kinesin- 1 receptor and assists in
the transport of vesicles containing BACE and PS1 along the axons of peripheral
neurones (Kamal et al, 2001). Analysis of the compartment in which these proteins
reside shows APP is cleaved by y-secretase, generating Ap and an APP-C-
terminal fragment (CTF) and liberates kinesin-1 from the membrane. The
significance for AD is that cleavage of APP due to axonal damage or blockage
could lead to AP deposition. If substantial, this may interfere with other transport
processes or neurotrophic signalling, leading to possible neuronal death.
Damage to neurones in AD as evidenced by dystrophic neurites indicate
axonal reaction to trauma. In preclinical AD these changes are typified by
abnormal phosphorylation and accumulation of neurofilaments. Morphologically
such regions are identical to distal and proximal segments of physically damaged
axons. A simple view of the disease process states that Ap accumulated within the
extracellular space inflicts physical and mechanical stress onto nearby axons
through constriction, triggering a neurological reaction to injury. Over a number of
years the maturation of plaques only serve to exacerbates matters (Vickers et al,
2000).
18

(vi) Function of APP
Little is known about the precise physiological role played by APP, though it
appears to be closely involved in synaptic plasticity and the morphoregulation of
neurite outgrowth. Functions proposed for pAPP include a role as a mediator of
cell-cell and cell-substrate interactions, and as a trophic or neuroprotective
molecule (Arendt, 2001). Localisation studies show that APP is heavily involved in
synaptic formation and cell adhesion where it co-localises at the cell surface of
neurons with cell-cell adhesion molecules such as P-1 integrin. In mammals,
transmembrane APP is associated with elongating axons, whereas secreted APP
is implicated in synaptogenesis. The expression of APP appears to be
developmentally regulated and is released during long-term potentiation (LTP)
where it increases memory retention in rats. Removal of APP either in transgenic
knockouts or following anti-APP antibody treatment results in decreased LTP and
impaired cognitive perform ance (Arendt, 2001). The alternate proteolytic
processing of APP suggests that it may have several functions apart from
development, since APP knockout mice show neither early mortality nor significant
morbidity in vivo. Possibly the APP-like proteins lacking the Ap sequence function
in a similar fashion to APP (Selkoe, 1999).
The PAPP molecule is known to bring about mitosis in cultured cells by
stimulating a mitogen-activated protein kinase. The Kunitz serine protease inhibitor
sequence within the longer APP isoforms inhibits a serine protease called Factor
X Ia of the coagulation cascade in human platelets (Smith et al, 1990).
Additionally, during conditions normally associated with neuronal injury such as
inflammation, ischemia, excitotoxicity etc, KPI-APP expression in astrocytes is
stimulated whereas expression of the shorter 695 isoform, which lacks the
inhibitory domain, is decreased (Robinson and Bishop, 2002).
More recently, a cytoplasmic fragment of P-APP, the APP intracellular domain
(AICD), has been implicated in signal transduction and is generated in an
analogous fashion to Notch cleavage following the action of p- and y-secretase
activity. The AICD is thought to form a transcriptionally active complex along with
other known proteins such as Fe65 and Tip60 a histone acetyltransferase (Cao
19

and Sudhof, 2001) and is potentially important in the pathogenesis of AD since due
to aberrant processing of APP may severely curtail the decrease levels of AICD.
1.4 Ap associated toxicity in AD
(i) P-Amyloid structure and toxicity
A central question concerning the role of Ap in AD is the extent to which this
peptide is toxic in vivo. Chemically, the additional of the two hydrophobic residues
on the Ap42 peptide are responsible for its aggregation into insoluble fibrils. The
secondary structure of Ap42 as predicted by the Chou-Fasman algorithm shows two
a-helices and one p-sheet (figure 1.3). The N-terminal a-helix is able to adopt an
alternate P-sheet configuration that markedly increases aggregation in solution
(Saido, 2003). The adoption of the P-sheet conformation following a nucleation-
mediated process has also been demonstrated following the release of Ap into the
cytoplasm (Jarrett and Lansbury, 1993). More recently, using sensitive
immunoprecipitation and SDS PAGE analysis, Ap oligomers from conditioned
media, in the absence of monomers and amyloid fibrils, disrupted synaptic
plasticity and inhibited LTP in vivo at physiological concentrations found inside the
human brain (Walsh et al, 2002). Additionally, pre-treatment of the complete
media with insulin degrading enzyme (IDE), which degrades monomeric but not
oligomeric Ap, had no affect on LTP indicating that the synaptotoxicity is
associated specifically with oligomeric form of Ap.
Long before Ap42 containing plaques (diffuse) form, structural changes in the
synapse as well as electrophysiological alterations have been observed in mutant
APP transgenic mice (Hsia et al, 1999). Moreover, cultured cortical and
hippocampal neurons treated with high concentrations of neurotoxic fibrillar Ap
(Loo et al, 1993) exhibit changes characteristic of apoptosis, including nuclear
chromatin condensation, plasma membrane blebbing, and internucleosomal DNA
fragmentation. Though these and other data showing toxic effects of synthetic Ap
in neuronal cultures, the role of Ap42 oligomers in initiating cellular dysfunction in
AD remains unproven (Selkoe, 2001). Moreover, data from experiments in which
20

fibrillar Ap is injected directly into the brain of rodents and monkeys are
inconclusive, since Ap can be neuroprotective in the brains of young animals but
toxic to older brains (Robinson and Bishop, 2002). In general the concentration of
Ap used in toxicity studies is often much greater than physiological concentrations.
Prim ary structure:
D A E F R H D S G Y E V H H Q K L V F F A E D V G S N K G A IIG L M V G G W IA
S eco n d ary structure:
a -h e lix conform ational ch an g e to p -sh ee t
n M M L aaaaa/v
Ovwwwv VAVWVNAAP -sh eet
Ap42 aggregation\ 7
The N-term inus a-helix can adopt a p- sheet conformation, making the molecule more hydrophobic and apt to aggregate
F ig u re 1 .3 . P rim a ry and s e c o n d a ry s tru c tu re o f A p 42. A n e a s ily in d u c e d
co n form ation a l ch an g e in th e seco n d ary structure in c reases th e a g g re g a tio n o f th e A p 42 in solution.
Another difficulty with Ap concerns its acute toxicity. AD pathology typically
develops over several decades whereas the biochemical action of Ap can be
measured rapidly, in the case of LTP, effects can be seen within 1 hour of adding
21

Ap to hippocampal neurons. Though in this case, it has been pointed out that Ap
may contribute to mild cognitive impairment in early AD via a novel mechanism
independent of neuronal death (Klein et al, 2001). Additionally, whereas aged
human neurons may be unduly susceptible to the effects of Ap because of years of
various insults, neurons used for in vitro studies are obtained from embryonic or
postnatal animals, thus making a direct comparison of Ap toxicity between the two
cell populations difficult to interpret (Vickers et al, 2000).
(ii) Oxidative stress and AD
Ap toxicity may be mediated via binding to the RAGE receptor (receptor for
advanced glycation end products) a member of the immunoglobulin superfamily of
cell surface receptors (Yan et al, 1996). This receptor is highly expressed by
cortical neurons, especially in the hippocampus and cerebellum during rat brain
development, and in a variety of other cell types, including endothelial cells and
phagocytes. RAGE activation is believed to trigger cellular oxidative reactions and
has been shown to mediate the interaction of Ap with glial cells, leading to the first
steps in the inflammatory cascade as seen by glial cell activation, cytokine
production, chemotaxis, and haptotaxis. However, antioxidants appear not to
protect neurons from Ap in toxicity assays, nor is their any evidence showing
oxidative damage of genomic DNA specific to AD or DS (Vickers et al, 2000).
Oxidative stress is believed to be a critical factor in normal aging brain and
in other neurodegenerative diseases besides AD, such as Parkinson's disease and
amyotrophic lateral sclerosis (ALS). Comparisons of AD brains with age matched
controls show an increase in oxidative damage, whilst plaques and tangles display
immunoreactivity to antioxidant enzymes (Pappolla et al, 1992). The presence of
reactive oxygen species (ROS) within the brain results in lipid peroxidation of the
cell membranes impairing the function of various membrane proteins involved in
ion homeostasis, such as N-methyl-D-aspartate receptor channels or ion-motive
adenosine triphosphatases. Consequently, the increased intracellular calcium and
ROS levels leads to protein, DNA, and lipid damage that may be the trigger for
apoptosis. Additionally, the exposure of PC12 cells to AP25 -35 and AP1 .4 0 has been
22

shown to induce a concentration-dependent accumulation of ROS that impair
energy metabolism, so leading to a reduction in ATP levels that compromise
cellular viability (Pereira et al, 1999). Other studies suggest that Ap exerts its toxic
effect via the activation and inhibition of several transcription factors (Santiard-
Baron et al, 1999). Exposure of Ntera 2 cells, for example, to AP25 -35 induces the
expression of several genes including the 'growth arrest and DNA damage-
inducible gene' (gadd45) implicated in the DNA excision/repair process, whereas
Ap represses, amongst others, a gene encoding a 'hinge protein' subunit of the
mitochondrial cytochrome-c reductase enzyme. The up-regulation of gadd45 in
response to DNA strand breaks in cells exposed to Ap may therefore be a critical
event in AD pathology. Additionally, increased intracellular calcium may also alter
calcium-dependent enzyme activity such as the implication of protein kinase-C in
amyloid protein metabolism and the phosphorylation of tau. The apoptotic pattern
of cellular death seen in oxidative stress is similar to that produced by Ap exposure
(Felician and Sandson, 1999).
(iii) Inflammatory Reactions and AD
The inflammatory and immune aspect of AD is becoming increasingly important for
researchers. A typical hallmark associated with inflammation in AD is the presence
of reactive microglia densely embedded within the senile plaques (Selkoe, 2001).
Increased cytokines levels are seen in the serum, plaques and neurons of patients
with AD compared with aged-matched controls. Furthermore, the anti-inflammatory
cytokine-transforming growth factor betal (T G F -p i) is able to promote or
accelerates the deposition of Ap (Wyss-Coray et al, 1997). Classical complement
pathway fragments are also found in the brains of AD patients, and Ap may directly
activate the classical complement pathway in an antibody-independent manner
perhaps by interacting with some aspect of the immune system.
Whether these markers are a consequence of the disease or a cause remains to
be seen. Brain specimens from elderly patients with arthritis treated with non
steroidal anti-inflammatory drugs have similar numbers of senile plaques, as do
control brains. However, less microglial activation is seen in the arthritis patients'
23
brains, suggesting that anti-inflammatory agents may delay or prevent clinical
symptoms of AD by limiting the associated inflammation (Felician and Sandson,
1999).
As well as the increase in RAGE expression in neurons, vasculature, and microglia
in affected regions of AD brains in response to Ap (Yan et al, 1996), AP fibrils also
bind to an unrelated ‘class A scavenger receptor’ expressed by large numbers of
microglial associated with senile plaques (El Khoury et al, 1996). This receptor as
well as RAGE may therefore represent novel pharmacological targets for reducing
the inflammatory and oxidative reactions associated with AD.
1.5 Theories proposed to account for AD
(i) The amyloid cascade hypothesis
A controversial issue in the pathogenesis of AD is the relationship between amyloid
deposition and NFT formation. A substantial body of evidence supports the idea
that the aggregation of insoluble Ap fibrils is behind the pathology of AD. The
fibrillar form of Ap has also shown to alter the phosphorylation status of the tau
protein. It appears that aggregated but not monomeric Ap peptides in vitro can
induce toxicity on cells by presumably related processes such as oxidative stress,
disruption of calcium homeostasis and cytoskeletal reorganisation. However, It
remains to be demonstrated whether the absence of pAPP function in AD patients,
even those harbouring PAPP missense mutations is responsible for the effects
observed in the disease state (De Jonghe et al, 1998). The opposite may in fact be
true that APP mutations work by a gain-of-function i.e. increased Ap production.
The identification of several point mutations within the APP gene in some patients
with early-onset FAD and the development of transgenic mice exhibiting cognitive
changes and neuritic plaques also incriminate Ap in AD. Additional evidence
comes from data supporting the role of presenilins in Ap metabolism as well as
findings of abnormal production of Ap protein in mutant PS1 FAD kindreds (Selkoe,
1996).
The above data and others have been formulated as the ‘amyloid cascade
24

hypothesis’, which places the aberrant processing of APP and the subsequent
deposition of Ap as central events in AD pathology (Hardy and Selkoe, 2002). A
hypothetical scheme to explain the temporal unfolding of dementia in FAD begins
with FAD mutations that lead to Ap isoform accumulation that then triggers
inflammatory responses in glial and astrocytes. Downstream consequences
involve perturbed homeostasis, oxidative injury, and PHF formation. Eventually
these pathologies result in cortical then global dysfunction best characterised as
dementia (Selkoe, 2001). Figures 1.4 outline the main features of the amyloid
cascade hypothesis.
(ii) Amyloidosis and Taupathy
The amyloid hypothesis is not uniformly accepted especially since dementia
severity correlates better with the number of neocortical NFTs than with neuritic
plaques. The normal function of tau is to stabilise neuronal microtubules. Apos3
may protect tau against hyperphosphorylation by bindings to those sites on tau
involved in the assembly of PHFs (Felician and Sandson, 1999). The
hyperphosphorylation of tau disrupts the Golgi apparatus by destabilization of the
microtubular system, leading to abnormal protein processing and increased Ap
production (Terry, 1996).
Another difficulty with the amyloid hypothesis is the lack of evidence
showing nerve cell body degeneration in the vicinity immediately surrounding the
plaque. In fact cortical nerve cell bodies have been demonstrated within the
plaque core. Similarly, nerve cell degeneration has not been demonstrated in
transgenic mice that develop Ap plaques, nor do Ap deposits that occur throughout
the AD brain, such as in the cerebellum, show signs of surrounding degeneration
(Vickers et al, 2000).
(iii) Competing hypotheses in AD
The evidence provided by studies examining Ap used for justifying the amyloid
hypothesis has similarly been re-interpreted to support the notion of Ap as a
25

bioflocculant. W hereas the amyloid hypothesis implicates Ap as the neurotoxic
substrate in AD, the bioflocculant hypothesis concludes the opposite; that Ap is
neuroprotective (Robinson and Bishop, 2002). In this proposal Ap generated from
APP functions by binding neurotoxic solutes, such as metal ions, which could
otherwise mediate cell damage.
According to the bioflocculant hypothesis, plaque formation is a
consequence of Ap binding toxic agents resulting in the precipitation of the Ap
complex within the extracellular space (ECS). The precipitate either affects
neurons directly or physically displaces neurites or impairs the traffic of metabolites
in the extracellular space. Ordinarily, macrophages stimulated by a local
inflammatory response clear the AP-toxin complex. In AD the bioflocculant
hypothesis explains this event as a neuroprotective response that is compromised
when Ap clearance is outstripped by deposition and the capacity of macrophages
to phagocytose these deposits is exceeded. This hypothesis maintains that
increases in Ap deposition in LOAD are particularly damaging within the ECS. The
trigger for this is believed to be previous trauma such as stroke/ischaemia, head
injuries, etc. Data investigating the effect these traumas have on narrowing the
ECS following inflammatory reactions, shows that the passage of large
macromolecules through the ECS are hampered, leading to their deposition with
bound Ap (Robinson and Bishop, 2002).
An obvious difficulty with this hypothesis is the role Ap plays in FAD. Both
plaques and Ap aggregates are thought to occur in FAD brains over a period of
decades. If Ap acts as a bioflocculant it is reasonable to assume that there would
be sufficient time for the clearance of Ap-toxic complexes, barring a precipitous
event occurring over a short space of time. Moreover, it is difficult to reconcile Ap
as a neuroprotective agent when clearly individuals with APP or PS mutations
develop AD. If anything it would be expected that such individuals would be
protected from developing AD by the misprocessing of APP. The role of Ap as a
bioflocculant is outlined in figure 1.5.
26

M issense m u tations in A P P , P S 1 /2 g enes4*
A ltered proteolysis4
In creased production of A(342>1'
P rogressive accum ulation and aggregatio n o f A(342 in brain interstitial fluid
iD eposition of A(342 as diffuse p laques (in association with
proteoglycans and o th er am yloid -prom oting substrates)4
A gg reg ation of A(340 onto diffuse A(342 p laques
A ccrual o f certain p laq u e-asso c ia ted proteins (co m p lem en t c1q ,etc)i
In flam m atory response:• M icroglial activation and cytokine re lease• A strocytosis and acu| e p hase protein re lease
P rogressive neuritic injury within am yloid p laques and e lsew h erein the neuropil
4- <— Disruption o f neuronal m etabo lic and ionic hom eostasis;
O xid a tive injuryi
A ltered k inase and p h o sp h atase activities _ hyperphosphorylated tau - > P H F form ation
iW id esp read n euron al/ neuritic dysfunction and death in
► hippocam pus and cerebral cortex with progressive n eurotransm itter deficits
4D E M E N T IA
Figure 1 .4 . A m yloid cascad e hypothesis. H ypothetical seq u en ce o f even ts lead ing to d em en tia as a co n seq u en ce o f F A D m utations (S e lko e , 2 0 0 1 ).
Yet another hypothesis characterises AD as a developmental disease that
recapitulates early developm ent resulting in morphoregulatory dysfunction
associated primarily with the synapse (Arendt, 2001). The main thrust of this
argument states that in AD it is the ability of the brain to modify it own structural
organization and functioning, as an adaptive response to functional demands that
is impaired, as opposed to the brain reacting to some unspecified, age-related
disorder. Much of the evidence presented in favour of this hypothesis includes data
from studies demonstrating aberrant neuroplasticity at the synapse. In this
27

hypothesis AD is an unavoidable consequence of the ageing process. Cumulative
damage over a lifetime caused by ‘wear and tear’ in the brain is exacerbated in
vulnerable regions, such as the hippocampus whose role in memory demands
significant neuroplastic remodeling. The vulnerability of these regions in
combination with the individual’s polymorphic genotype, as well as other epigenetic
pressures is postulated to be the cause of AD. Ap accumulation in this context has
been shown to disrupt cell adhesion mechanisms in vivo leading to impaired
synaptogeneisis, reduction in LTP, cytoskeletal changes, disturbances in axonal
transport, impaired neurotransmitter release, etc (Arendt, 2001). Figure 1. 6
illustrates the main features of this hypothesis.
1.6 Genetics of AD
Many epidemiological studies investigating AD show a clear association between
dementia and age. The prevalence rates for dementia and AD double
approximately every 5 years from rates of 2% -3% (65 to 74 years) in the case of
dementia, to over 30% in subjects 85 years and over. The prevalence of AD,
initially 1% -2% in 65 to 74 year olds increases to 25-50% in subjects aged 85
years or older. This relationship with age is seen even in studies reporting different
prevalence rates (Hendrie, 1999).
To date five genetic loci have been identified with respect to AD. These
include three fully penetrant, autosomal dominant mutations in genes for PS1,
PS2, and APP as well as two at-risk common-population-polymorphisms (CPP)
associated with LOAD, such as the ApoE4 and a-macroglobulin-2 (A2M-2)
polymorphisms. Differences in the onset of the disease range from the early
thirties in Down’s Syndrome patients (DS), the mid-thirties to fifties in early onset
FAD and individuals greater than 50 years of age in LOAD. Table 1.0 summarises
some of the main genetic factors associated with AD and the phenotypic
consequences of the gene defect.
28

Soluble Ap in Toxins (e.g.extracellular fluid metal ions) in
extracellular fluid
Binding of AP to extracellular
toxins
Increased release of KPI-
APP
Precipitates as a Ap-toxin complex
(plaque)
A
Activates Injures adjacentinflammatory < = neurons
cascade in glia
vRelease of
cytokines that bind to Ap v
Resolubilisation Macrophages Neuronal recoveryof AP remove toxin ! = > and sprouting of
from plaque neurites
F ig u re 1 .5 . B io floccu lan t h ypothesis o f A D . U n like th e am ylo id c a s c a d e h yp o th es is w h ich im p lica tes A p as th e to x ic su b stra te , th e b io flo ccu lan t h yp o th es is m a in ta in s th a t A P is a
neuropro tective ag en t w h o se function is co m prom ised in A D (R obinson and B ishop, 2 0 0 2 ).
29

Epigenetic Influence
Normal brain ^ Alzheimer’s brain
/ \Morphoregulation )► Morpho-dysregulation
I 1
Synaptic stabilisation Synaptic destabilisationSynaptogenesis Abberant growthDestabilisation of synapses De-differentiation /
cell-cycle activation Degeneration Cell death
Figure 1.6. AD as a disorder of brain self-organisation and dysmorphoregulation. This hypothesis proposes AD as a synaptic disorder associated with aberrant sprouting at both the pre- and post- synaptic junction. The spatial and temporal progression of AD recapitulates earlier developm ent proceses and involves morphoregulatory molecules including adhesion, cytoskeletal synaptic proteins, etc. The reactivation of old developmental programmes are considered incompatible with a mature, differentiated cellular background (Arendt, 2001).
(i) APP mutations and FAD
The first AD causing gene to be identified was the APP gene on chromosome 21
(Goate et al, 1991), bearing 'missense' mutations that account for less than 0.1%
of all AD cases. To date, nine APP missense mutations associated with FAD are
clustered around secretase cleavage sites either flanking or within the Ap
30

sequence of APP. In all cases each mutation increase Ap production, though by
slightly different mechanisms. One such mutation at position E693Q of the Ap
sequence within APP results in Ap deposition within the cerebral vasculature,
leading to the diseased state in some cases, and cerebral haemorrhage and
angiopathy in others (Levy et al, 1990). The adjacent mutation at position A692G,
again within the AP sequence of APP, is associated with plaque and tangle
formation and results in dementia and severe microvascular P-amyloidosis with
occasional cerebral haemorrhages (Hendriks et al, 1992).
Table 1.0. Genetic factors predisposing to Alzheimer’s disease (modified after Hardy,
1997)
Genotype Biochemical result Phenotype
Down’s Syndrome more APP production more A fW Ap40
APP 670/671 (Swedish) potentiation of P-secretase moreAp42/ Ap40
APP692 (Flemish) inhibition of site of a-secretase more Ap42
APP716 (Florida) alteration of site of y-secretase cut more Ap42
APP717 (London) alteration of site of y-secretase cut more Ap42
PS1/PS2 mutations subtle alteration of APP processing more Ap42
ApoE4 unclear increase plaque density and vascular deposits.
a-macroglobulin-2 unclear increase Ap deposits
Families harbouring APP mutations have onsets before 65 years, often in their 50s.
In DS the situation is quite different. Though the pathology parallels that of AD
(neuritic plaques and NFT), here trisomy caused by non-disjunction of the 21st
chromosome leads to an extra APP gene. The gene dosage effect results in over
expression of APP and therefore the build up of Ap40 and Ap42 peptides from birth
(Takuda et al, 1997). Diffuse plaques containing Ap42 have been detected in the
brain of DS patients as young as 12 years old, but neuritic plaques containing Ap40
are not detected until the third decade (Lemere et al., 1996). Dementia onset in
31

DS appears to be influenced by the ApoE allele and occurs between 40 and 70
years of age.
The observation that the majority of APP mutations increase AP42 production
has led to the conclusion that Ap precipitates AD. However, APP has several
functions in the developing and adult brain quite distinct from Ap generation, such
as neuroprotection, synaptogenesis, and memory formation and consolidation.
This has led to the notion that APP dysfunction as a result of mutations in AD
brains may produce more APP to correct the deficit and as a by-product excess Ap
is produced which then aggregates (Robinson and Bishop, 2002).
(ii) Presenilin mutations and FAD
Three loci have been associated with early onset aetiology; the APP gene on
chromosome 21 (Goate et al, 1991); the PS1 gene on chromosome 14
(Sherrington et al, 1995); and the PS2 gene on chromosome 1 (Levy-Lahad et al,
1995; Rogaev et al, 1995). The most common cause of FAD are mutations found
within the presenilin genes, which account for 40 percent of all early onset FAD
cases and roughly one to two percent of all AD case (Tanzi et al, 1998). How
these mutations cause the form of AD with the earliest age of onset is as yet
unknown. To date ~130 mutations in PS1 alone are have been reported and are
the primary cause of AD with onset below the age of 55 (table 1.1). Studies
utilising cell cultures and transgenic mice have shown that these mutations alter
APP processing so favouring the production of the highly amyloidogenic AP42
species, as opposed to Ap4o (Younkin et al, 1994; Selkoe, 1999). Mutations in PS2
have been described in two families that exhibit a more variable onset ranging
between 40 and 80 years (Rogaev et al, 1995) as compared to the PS1 mutations,
which vary between 25 to 55 years.
All presenilin mutations are missense mutations, with the exception of a
splice acceptor site mutation, that results in the deletion of exon 9 (A-exon 9).
Under physiological conditions PS are cleaved into NH2 -terminal (NTF) and
COOH-terminal fragments (CTF). The PS1 A-exon 9 transcript lack a series of
32

charged residues present on the loop domain leading to an increase in uncleaved
holoprotein.
Table 1.1. Examples of missense mutations found in human PS1 and the approximate age of onset in FAD patients (Czech et al, 2000).
Codon Mutation Age of onset (years)
82 Val_Leu 55
96 Tyr_His 37
115 Glu_Asp 48
139 Met_Thr 49
143 lle_Thr 35
146 Met_Val 38
163 His_Arg 50
171 Leu_Pro 40
231 Ala_Thr 52
233 Met_Thr 35
235 Leu_Pro 32
246 Ala_Glu 55
263 Cys_Arg 47
267 Pro_Ser 35
280 Glu_Ala 47
280 Glu_Gly 42
286 Leu_Val 50
384 Gly_Ala 35
392 Leu_Val 25-40
410 Cys_Tyr 48
A second splice mutation arises from the deletion of a guanine residue from a
splice donor site leading to the production of three unique transcripts (De Jonghe
et al, 1999b). The majority of mutations are primarily localised to highly conserved
transmembrane domains and the large hydrophilic loop domain and are found in
both PS1 and PS2 (figure 1.7). The sensitivity of the protein to mutations suggests
that a specific topology is required to bring about the normal physiological
processing of APP.
33

(iii) Apolipoprotein E polymorphisms and AD
A gene encoding Apolipoprotein E (ApoE), a serum lipoprotein involved in
tryglyceride and cholesterol metabolism during neurodevelopment as well as after
neural injury, has been linked to late-onset familial and sporadic AD. ApoE is
produced by hepatocytes and is found within the general circulation, whereas
astrocytes are thought to contribute to ApoE within cerebrospinal fluid (CSF).
Three common isoforms are encoded by alleles e2, s3, and s4 on chromosome 19
(Mahley, 1988: Roses, 1994). Each isoform show differences in amino acids at
two positions thus: s4 112Arg/158 Arg; e3 112Cys/158Arg; s2 112cys/158cyS.
Earlier research demonstrated an association between the s4 allele of
APOE and AD (Strittmatter et al, 1993), that is both age and gender related. This
association has been reported for the most common forms of LOAD, both sporadic
and familial (Felician et al, 1999). Statistically, individuals homozygous for s4 have
a 15% greater risk of developing the disease before the age of 70 than
heterozygous individuals (Blacker et al, 1997). Case-control studies indicate that
the e4 allele association and AD may account for 30% -40% or more of all cases of
AD (Lorenzo et al, 1994). Several studies have suggested that the s2 allele may, in
some cases have a protective effect.
One difficulty with ApoE as a risk factor is that many s4 carriers never
develop AD. Furthermore, many patients with AD do not possess the s4 allele,
therefore its presence cannot be used for the diagnosis of AD. Instead possession
of the s4 allele predisposes an individual towards developing the disease.
Reported frequencies of e4 vary widely among populations, ranging from 5% or
less in the Amish community of North America to over 40% in some aboriginal
populations in Australia, though it is not clear yet what effect these population-
frequency variations have on the association between s4 and AD. What is clear is
that the number and density of cerebral and cerebrovascular Ap deposits is
statistically higher in AD cases bearing the Apo s4 phenotype. The Apo s4 alleles
may differentially affect the generation, secretion or clearance of Ap from the
extracellular fluid (Rebeck et al, 1995). The e4 allele may enhance aggregation of
Ap or alternatively, it may lack a biological function performed by the other alleles,
34

such as supporting neurite outgrowth or stabilising tau protein on microtubules
(Strittmatter et al, 1993).
Apo s4 is produced centrally by astrocytes though neurones may contain it either
because they internalise it or express it. Apo e4 can be internalised via certain
receptors, including the low-density lipoprotein receptor (LDL) for the LDL receptor-
related protein (LRP) (Rebeck et al, 1995). In this instance Apo e4 may influence
(3APP processing or Ap secretion or re-uptake either via a receptor-mediated
mechanism or a receptor-independent mechanism such as a direct interaction with
a-secretase at the cell surface or with an extracellular protease that normally
degrades Ap (Biere et al, 1995). Investigation into Apo s4 effects on p A P P
processing in neural and non-neural cell lines do not show increased processing of
PAPP in contrast to findings in AD linked to APP and PS1 mutations (Biere et al,
1995).
Biochemical experiments have shown that ApoE can bind to tau and MAP2,
particularly the e2 and e3, whereas the s4 isoform performs poorly in comparison
(Strittmatter et al, 1994). This has led to the suggestion that the former isoforms
are therefore neuroprotective by reducing the ability of tau to bind to microtubules,
become hyperphophorylated, and form PHF (St George-Hyslop, 2000). ApoE also
appears to be involved in synaptic plasticity during regeneration and repair and that
the s4 allele is less efficient in this role. Mice deficient in ApoE exhibit a loss in
MAP2 immunoreactivity in dendrites and synaptophysin in nerve terminals (Arendt,
2001).
(iv) a-macroglobulin polymorphism and AD
Another AD risk locus has been identified on chromosome 12 and involves
polymorphic variants of a-2 macroglobulin (A2M) (Blacker et al, 1998). A2M plays
an important role in the brain during development and following neuronal injury by
regulating the activity of several proteases. Immunoanalysis reveals that A2M
binds the neurotoxic A(342 peptide with high affinity and antibodies to A2M stain
senile plaques in AD brains. In case control studies a CPP at amino acid position
1000 (V/l) of A 2 M was found to be associated with AD as well as increased Ap
35

deposition (Liao et al, 1998). Moreover, database searches have revealed that one
polymorphic variant of the A2M gene had five fewer bases than the standard
version, and that this variant is carried by 30% of the population (Tanzi, 1999). In
terms of risk, individuals harbouring a single polymorphism (A2M-2) are three times
more likely to develop AD compared to the standard polymorphism. In comparison
a single copy of A2M-2 has the same risk as a homozygous Apo s4 carriers,
suggesting that A2M-2 may be an even more powerful LOAD risk factor than Apo
e4.
A2M functions by inhibiting all classes of proteases by a steric trapping
mechanism following a conformational change. A2M first binds a serine protease
then A(3 to form a complex that then binds to the LRP receptor, which it shares with
Apo E and APP. Thus A2M potentially impacts both APP and Apo E metabolism in
the brain via a single biochemical cascade (St George Hyslop, 2000). Data suggest
that a serine protease-A2M complex can degrade A(3 and that trypsin-activated
A2M can efficiently degrade Ap, preventing fibril formation of the peptide in
cultured human cortical neurons thus reducing toxicity (Zhang et al, 1996). Tanzi
(1999) has been proposed that the ability of A2M-2 to clear Ap is reduced leading
to the extracellular accumulation of Ap, leading to plaque formation. Apo E may
hasten the disease process by competing with A2M-2 for LRP and Ap.
(v) AD risk locus on chromosome 10
Most AD cases have ages of onset above 65 years and exhibit no clear pattern of
inheritance. The APO E4 allele is the only known genetic risk factor for LOAD.
However, 50% of LOAD patients do not carry an APO E4 allele suggesting
additional risk factors. For instance using genetic linkage analysis a susceptibility
locus has been mapped to a region on chromosome 10 in families with LOAD
(Myers et al, 2000). Furthermore, plasma Ap has been used as a quantitative trait
for identifying novel LOAD loci. In this study evidence links a region of
chromosome 10 to high levels of the Ap42 peptide in LOAD families (Ertekin-Taner
et al, 2000). Moreover, recent data suggest an important role for the insulin-
degrading enzyme (IDE) in the degradation and clearance of soluble Ap secreted
36

by neurones and glial cells. Using linkage analysis an additional putative LOAD
associated loci has been mapped to the long arm of chromosome 10q, within 195
kilobases of the IDE gene (Bertram et al, 2000).
Other forms of LOAD have been linked to chromosome 12 and to possible
mutations on maternally transmitted mitochondrial cytochrome-C oxidase genes
(Felician et al, 1999), and a gene encoding for the major histocompatibility
complex, located on chromosome 6. More recently a CPP has been found in the
interleukin-1 (IL-1) genes IL-1A and IL-1B. Homozygosity for both IL-1 alleles
confers a tenfold risk of AD (Chapman et al, 2001). Doubtlessly more at-risk loci
associated with AD will emerge as research continues. Known genetic loci linked
with AD are summarized in table 1.2.
Table 1.2. Genetic loci associated with AD. Data collated from information available at www.ncbi.nlm.nih.gov/entrez/dispomim.cgi?id=104300
Gene product Chromosome locus OMIM entry numberAPP 21 q21 104760
PS1 14q24.3 104311
PS2 1q31-q32 600759
ApoE 19q13.2 107741
A2M-2 12p13.3-p12.3 103950
Transcription factor CP2 (TCFP2) 12p11.23-q13.12 189889
Unknown-maps close to insulin degrading enzyme gene (IDE) 10q24 605526
Unknown 10p13 606187
Unknown-maps close to Cystatin C protease inhibitor
gene20p 607116
Originally thought to be cytochrome C oxidase.
Possible mitochondrion-specific polypeptide involved in
respiration
Mitochondrial DNA 502500
37

1.7 Biology of Presenilins
(i) Presenilin structure and biochemistry
Central to the processing of APP is the role-played by the presenilin proteins,
particularly in those families harbouring PS1 FAD mutations that lead to the early
onset disease phenotype. PS proteins are widely expressed in most cell types both
human and murine, embryonically and centrally (Kovacs et al, 1996; Lee et al
1996). High concentrations of PS are found within the hippocampal formation and
entorhinal cortex, whereas low levels are detectable within white matter glial cells.
In situ hybridisation studies have shown that the expression patterns of PS1 and
PS2 in the brain are very similar, if not identical (Rogaev et al, 1995). Moreover,
PS1 and PS2 share substantial amino acid and structural similarities with each
other suggesting that they may be functionally related. PS1 and PS2 also exhibit
strong homology with sel-12 found in the nematode Caenorhabditis elegans, and is
involved in the intracellular trafficking and recycling of proteins (Levitan &
Greenwald, 1995).
The PS genes code for transmembrane spanning proteins approximately
-4 4 kDa in size and in its longest form is 467 (PS1) and 448 (PS2) amino acids
long. Structurally the presenilins are putative eight helical transmembrane proteins
(figure 1.5) located principally within the ER, Golgi apparatus, and nuclear
membrane. In FAD PS1 mutations lie predominantly within the helical TM domains
and the cytoplasmic loop suggesting that the disruption of the alignment of these
domains is responsible for the disease state (Hardy and Crook, 2001). Once
correctly folded, PS undergoes constitutive endoproteolysis. In PS1
endoproteolysis occurs within the exon 9 region of the cytostolic loop between TM6
(Thr 291) and TM7 (Ala 299) via autocatalytic aspartate residues at positions 257
and 385 to generate a 17 - kDa CTF and a -2 8 kDa NTF, which are maintained in
a 1:1 stoichiometry (Podlisney et al, 1997; Li & Greenwald, 1998; Wolfe et al,
1999b). Uncleaved full-length presenilin (holoprotein) remains within the ER
whereas the NTF and CTF traffic to the Golgi where they are re-incorporated as a
heterodimer along with other factors, such as P-catenin into a functional complex
(Yu et al, 1998; Zhang et al, 1998).
38
Restricted incorporation of the NTF and CTF along with other co-factors into a
multimeric complex in the ER and Golgi apparatus may provide an explanation for
the regulated accumulation of the NTF and CTF (Yu et al, 1998). PS1 within cells
is quickly turned over (T1/2~60 min), in part to the two major fragments (Podlisny
et al, 1997). Steady state levels of the PS fragments appear to be tightly regulated
since transgene overexpression does not increase the overall level of fragments
(Thinakaran et al, 1997). The AD-associated Aexon9 splice error mutation results
in the accumulation of the uncleaved full-length protein. The pathological activity of
PS1 Aexon9 is independent of its inability to undergo proteolytic processing, but is
due instead to a point mutation (S290C) occurring at the aberrant exon 8/10 splice
junction (Steiner et al, 1999).
Two hypotheses have been advanced to explain the role of PS1 in APP
cleavage. Either PS1 regulates the transport of y-secretase to APP without any
physical interaction with the latter (Thinakaren et al, 1998), or PS1 is the y-
secretase/or is physically involved in the cleavage of APP, as indicated by
PS1/APP co-immunoprecitpitation from whole cell lysates, ER and Golgi vesicles
(Xia et al, 1997b; Selkoe, 1999; Chen et al, 2000). Strong support for the latter
hypothesis comes from data showing residues 1 to 87 of PS2 to interact with the
last 45 amino acids of APP. The close homology of PS1 and PS2 would indicate
that they share similar determinants of binding to APP (Pradier et al, 1999). Other
evidence supporting a direct involvement of presenilin in the cleavage of APP by y-
secretase is seen in PS1 knockout mice and cell lines. Levels of the y-secretase
C83 and C99 substrate increase substantially whilst Ap levels decreases. What
little processing does occur is likely to be carried out by PS2 (De Strooper et al,
1998). The alternate hypothesis holds that PS1 plays a crucial role as a facilitator
of y-secretase function by bringing together, through membrane trafficking, the
various co-factors needed to bring about APP cleavage (Thinakaren et al, 1998).
More recently, evidence for PS1 as the putative y-secretase has been
provided by studies utilizing peptidomimetic transition state analogs to inhibit y-
secretase. These drugs contain the AP4 0 -4 5 region and their action results in a
decrease in the levels of C83 and C99 (Wolfe et al, 1999a). Furthermore, selective
mutation of the aspartate residues on TM6 and TM7 (figure 1.7) prevents the
39

cytoplasm
lumen
F ig u re 1 .7 . T o p o lo g ic a l re p re s e n ta tio n o f P S1 sh ow in g th e e ig h t tra n s m e m b ra n e m o d e l. S h o w n a re tra n s m e m b ra n e d o m a in s 7 an d 10 , w h ich a s s o c ia te w ith th e c y to p la s m ic fa c e o f th e m e m b ra n e (L i an d G re e n w a ld , 1 9 9 8 ) . A lte rn a t iv e ly , tra n s m e m b ra n e 7 align w ith in the lipid b ilayer. PS1 m utations a re prim arily localised to th e tra n s m e m b ra n e d o m ain s and th e la rg e h ydroph ilic loop. T h e a rro w in d ica tes th e site a t w h ich th e m o le c u le is c le a v e d into N - and C -te rm in a l fra g m e n ts . T h e tw o evo lu tionary co nserved a s p arta te res idu es (D 2 5 7 /D 3 8 5 ) a re thought to be au to cata ly tic (W o lfe et al, 1 999 ).
endoproteolysis within the cytostolic loop of the holoprotein (Wolfe et al, 1999b)
leading to its accumulation, as well as increasing the C83 and C99 APP fragments
whilst markedly reducing AP40/AP42 levels (De strooper et al, 1998). Disruption to
the aspartate residues (D385A) similarly prevents the maturation of PS1 into a
complex containing p-catenin (Yu et al, 1998; Nishimura et al, 1999a). In other
studies also using transition state analogues, y-secretase inhibitors were observed
binding covalently to the aspartate residues in both PS fragments, but not the
holoprotein, suggesting uncleaved PS to be novel aspartyl protease zymogen (Li et
al, 2000).
(ii) Presenilin and development
The presenilins appear to function as unique aspartyl proteases that cleave a
series of type 1 transmembrane proteins including APP, the APLP, Notch and Ire
1, a ‘stress sensor’ involved in the unfolded protein response (Selkoe, 2001). In
addition to their location within the ER/Golgi cell compartment, the PS are localised
to the synapse and at cell-cell contact sites where they form adhesion complexes
40

with cadherins, a family of cell surface single-pass transmembrane proteins
(Arendt 2001). Additionally, PS1 forms complexes in vivo with the actin binding
protein filament at the cell surface in lymphocytes. This binding protein is known to
form bridges between cell surface receptors and the cytoskeleton and to mediate
cell adhesion and cell motility (Schwarzman et al, 1999). Furthermore, the CTFs of
PS1 accumulate along with PHF tau, suggesting a close relationship between PS1
and the cytoskeletal abnormalities seen in AD brains (Tomidokoro, et al, 1999).
Another important function of PS is their role in developmental signalling in
the Notch/Delta pathway (Levitan and Greenwald, 1995). Notch and Delta are
single pass cell surface receptors located within the developing embryo that are
regulated by presenilins. It has been proposed that signal transduction involves
cleavage and transport of the Notch intracellular domain (NICD) to the nucleus.
Here, the NICD interacts with a DNA-bound protein and activates transcription of a
number of genes that regulate a number of cellular decisions during development
and in the adult brain (Kopan, 2002). Experiments involving Drosophila and
mammalian cells support this idea, indicating that cleavage occurs in or near the
transmembrane domain. The absence of PS or null mutations generated within
Drosophila presenilin prevents this signaling, suggesting that PS may process
Notch in an analogous fashion to the processing of PAPP (Struhl & Greenwald,
1999). The PS-notch interaction in development is exemplified in mice, Drosophila
and C. elegans harbouring PS loss of function mutations that result in notch-like
phenotypes.
Although FAD mutations of PS1 rescue PS1 knockout mice, mutation of the
transmembrane aspartates destroys the ability of PS1 to rescue C.elegans carrying
the sel-12 mutation, and therefore establishes the functional homology between
PS1 and sel-12. The importance of presenilins in development is seen in
experiments where targeted disruption of the PS1 gene in mice results in severe
developmental abnormalities due to defects in somite differentiation and
segmentation. PS1 knockout mice display impaired neurogenesis deformation of
the axial skeleton and massive neuronal loss, which culminate in premature death
shortly after birth (Shen et al, 1997). In vitro, the FAD M146V PS1 mutation
prevents the differentiation of retinoic acid treated NTera 2 cells into neurons
41

(Tokuhiro et al, 1998), as does antisense-oriented PS1 constructs transfected into
stable Ntera 2 cells (Hong et al, 1999).
(iii) Apoptosis and presenilin in AD
The extent to which programmed cell death or apoptosis is involved in AD is
unknown. If not causative, apoptosis is at least associated with the late stage of
AD neuropathology (Alves da Costa et al, 2002). Involvement of both PS in
apoptosis was first suggested from data showing increased sensitivity to different
apoptotic stimuli, including Ap4 2 , in cells overexpressing PS2 and reduced
sensitivity in the presence of anti-sense PS2 construct (Vito et al, 1996; Wolozin et
al, 1998). The data on presenilins show PS2 to be pro-apoptotic, in particular the
N-terminus bearing the N114I mutation. Mutant PS however, predispose the cells
of individuals with FAD to apoptosis, suggesting that PS may be anti-apoptotic,
since p53 and p21-induced-apotosis quickly switches off PS1 gene expression
(Roperch et al, 1998; Alves da Costa et al, 2002).
By contrast, PS2 and mutant PS2N141I drastically increase p53 expression
and transcriptional activity in various cell systems (Alves da Costa et al, 2002),
whereas the C-terminal 103 amino acids of mouse PS2, referred to as ALG3, was
able to rescue a T-cell hybridoma from Fas-induced apoptosis (Vito et al, 1997).
One of the final steps taken before a cell is committed to die by apoptosis is the
cleavage of PS by caspase-3. Recently it has been demonstrated that
overexpression of CTF-PS2 increases caspase-3 activity and immunoreactivity in
staurosporine (STS) treated cells, and PS knockout cells. The latter observation
demonstrates that CTF-PS2 may function independently of the N-terminal, y-
secretase-derived counterpart (Alves da Costa et al, 2003).
Using the yeast two-hybrid system to identify proteins interacting with PS1,
the 'armadillo' protein p0071 has been demonstrated to bind specifically to the
hydrophilic loop of presenilin-1 (Stahl et al, 1999), whilst Bcl-XL, an anti-apoptotic
member of the Bcl-2 family, interacts with CTFs of both PS1 and PS2. The over
expression of Bcl-2 in antisense-PS1 cell clones reduces cell death by apoptosis
and allows the recovery of neuronal differentiation whereas, stable NTera 2 cells
transfected with antisense-oriented PS1 constructs fail to differentiate. Conversely,
42

antisense-oriented PS2 does not interfere with cell differentiation suggesting
different roles for PS1 and PS2 (Hong et al, 1999). Both PS2 and its naturally
occurring carboxyl-terminal products, PS2short and PS2Ccas, associate with Bcl-
XL in vivo, whereas the caspase-3-generated amino-terminal PS2Ncas fragment
does not (Passer et al, 1999). Moreover, the phosphorylation of serine residues
adjacent to the caspase site in PS2, prevents cleavage and by doing so enhances
its anti-apoptotic properties. Such alterations in the phosphorylation status of PS2
may increase the susceptibility of neurons to apoptotic stimuli (Tomidokoro et al,
1999).
Precisely how PS cause apoptosis is unknown, though recently a
proliferation-associated gene product (PAG) belonging to the thioredoxin
peroxidase family has been described that appears to mediate apoptosis in
sympathetic neurons by interacting with PS1. Overexpression of PAG alone
sensitises cells to apoptosis following trophic factor withdrawal, however co
injection of PAG with wild type but not mutant PS1 cDNA prevented apoptosis
(Zhou et al, 2002). PS mutations found in FAD appear to sensitise neurons to
apoptosis by disrupting calcium homeostasis. A pro-apoptotic calcium binding
protein called calsenilin interacts with both presenilins in vitro by binding to the C-
terminus ALG3 sequence (Buxbaum et al, 1998). Overexpression of calsenilin in
neuroglioma cells somehow alters the processing of PS2, similar to that observed
after caspase activation during apoptosis. Caspase-3 specifically cleaves PS2
rendering it inoperable during apoptosis by generating an amino-terminal PS2Ncas
fragment (Tanzi et al, 1998). Recently it has been shown that calsenilin-mediated
apoptosis is reduced in PS1 knockout mouse fibroblasts and neuronal cells,
whereas cells expressing FAD gain of function mutants increased calsenilin-
induced apoptosis (Jo et al, 2003).
(iv) Presenilin complex formation
Presenilins do not undergo glycosilation sulphation, acylation or
glycosaminoglycan addition (De Strooper et al, 1997), however, they do show
phosphorylation on serine residues, though what physiological role this plays
ordinarily or in the disease state is unknown. Curiously, the majority of newly
43

synthesised presenilins are rapidly degraded and only small amounts of the
holoprotein are detected in cells or transfected cells (Thinakaren et al, 1996;
Podlisney et al, 1997). Processing of the presenilins is tightly regulated by
competition for limiting factors that presumably are rate limiting in the maturation of
PS into a functional complex. Over expression of transgene PS do not increase
CTF or NTF but instead displace endogenous PS levels. Functional PS is thought
to consist of several sub units that constitute a mature complex ~150 to ~2000
kDa.
(v) Presenilin and p-catenin interactions
Proteins known to interact with the PS heterodimeric complex include members of
the armadillo family such as neuron specific 8-catenin, and p-catenin. The latter
protein plays a key role in the 'Wingless pathway1 (Wnt) in Drosophila and is
responsible for the regulation of cell-cell adhesion between the cytoskeleton and
adheren junctions (Czech et al, 2000). p-catenin is regulated by GSK-3p, which
phosphorylates its N-terminal and by doing so targets the molecule for degradation
via the ubiquitin-proteosome pathway. GSK-3P appears to associate with p-catenin
via 'axin', which is suspected of negatively regulating the phosphorylation of p-
catenin (Kang et al, 1999). Activation of the Wnt pathway inhibits GSK-3P activity
resulting in an increase in cytoplasmic P-catenin, which is then free to bind to
transcription factors, following transportation to the nucleus. The interaction of PS1
with p-catenin is thought to modulate the Wnt pathway. Both wild type or mutant
full length and CTFs have been shown to bind to P-catenin in transgenic mice and
transfected cell lines.
Overexpression of PS1, but not mutant forms (AX9, M146IL), increase the
association of GSK-3P and promotes the turnover of P-catenin. The association of
p-catenin with PS1 occurs at the CTF of PS1, whilst GSK-3P interacts with the NTF
of PS1 (Takashima et al, 1998; Kang et al, 1999). The finding that mutant PS1
exert a dominant-negative activity on p-catenin turnover, perhaps by delaying
phosphorylation by GSK-3p may underscore some aspect of the pathology of AD
(Kang et al, 1999). Signalling errors due to faulty P-catenin/PS1 interaction might
44

explain why PS1 knockout mice embryos fail to develop in utero. Additionally, PS1
FAD mutations alter the trafficking of P-catenin arising from a dominant ‘gain of
aberrant function’. Lithium induced Wnt activation in FAD human fibroblasts
decreases the nuclear trafficking of P-catenin compared to wild type fibroblasts
(Nishimura et al, 1999a). Besides regulating the distribution of p-catenin, GSK-3P
is thought to be the kinase responsible for the hyperphosphorylation of tau. PS1
binds directly both tau and GSK-3p and mutations in PS1 increase this interaction
(Takashima et al, 1998). The ability of PS1 to bring tau and GSK-3P into close
proximity suggests that PS1 may participate in the regulation of tau
phosphorylation thereby contributing to tau aggregation and the development of
PHF and NFTs (Czech et al, 2000).
(vi) Active y-secretase requires several components
Currently evidence suggests that PS1 is involved in transmitting extracellular
signals to the cell interior via the intramemembrane cleavage of type 1
transmembrane proteins. This ‘regulated intramembrane proteolysis’ (RIP) is a
generic function of PS, which so far is responsible for the cleavage of nine known
substrates including APP, Notch, LRP, ErbB4, E-cadherin, CD44, Ire la , APLP-1
and Nectin-1a, all thought to be involved to some extent in regulating
transcriptional activity (Kim et al, 2002; Medina and Dotti, 2003). All of these
substrates share similar y-secretase consensus motifs and reside at or near the
cell surface, where ectodomain shedding prior to y-secretase-like cleavage
releases the intracellular domain (ICD).
According to recent studies core y-secretase activity requires three
additional transmembrane proteins besides PS: Nicastrin (Net), APH-1 and PEN2.
Together with PS these subunits constitute the active y-secretase complex known
as a ‘secretosome’, which when expressed in yeast constitutes y-secretase activity
(Marlow et al, 2003). Nicastrin, a 709 amino acid-long, type 1 transmembrane
protein was the first member of the secretosome to be discovered (Yu et al, 2000).
Nascent unglycosylated Net (~80 kD) undergoes glycosylation to form immature
Net (iNCT ~110 kD) and mature Net (mNct ~150 kD) after entering the Golgi. The
45

latter Net species associates with active y-secretase and requires PS for its
maturation. Removal of Net from C.elegans generates an embryonic lethal
phenotype similar to that when PS and Notch gene activity is reduced.
Furthermore, Net binds to the y-secretase substrates C99 (aC TF) and C83 (|3CTF)
derived from APP (Yu et al, 2000). Subsequent studies revealed the presence of
Net in Drosophila and in MDCK cells where nicastrin and PS1 co-localise within the
ER and Golgi (Yu et al, 2003).
Genetic screening of C.elegans led to the detection of two novel genes,
Aph-1 (anterior pharynx defective), known to interact with the notch signalling
pathway, and pen-2 (presenilin enhancer) (Francis et al, 2002). Aph-1 has seven
transmembrane domains and is found as two highly homologous forms in mammal
cells (aph-1 a and aph-1 b), and both are functionally equivalent in C.elegans rescue
experiments. Using small interfering RNA experiments in human cell lines leads to
the accumulation of aC TF and PCTF, and a decrease in Ap as well as the inhibiting
NICD production, thereby implicating itself directly in the function of the y-secretase
complex (Lee et al, 2002). Pen-2 codes for a small protein of 101 amino acids that
contains two predicted transmembrane domains. Human Pen-2 is an essential co
factor in the y-secretase complex as demonstrated by data showing co-
immunoprecipitation of Pen-2 with both the uncleaved PS holoprotein and Net
(Steiner et al, 2002).
More recently Aph-1 has been shown to bind preferentially within the ER to
iNct in the early stages of y-secretase assembly (Steiner et al, 2002), whereas
cleaved PS and Pen-2 bind preferentially to the mNct species (La Voie et al, 2003).
The formation of a stable intermediate complex of Aph-1 with iNct appears to be
independent of PS, Pen-2 and PS endoproteolysis. The glycosylation status of the
Aph-1-iNct complex and its additional glycosylation to the mature sub-complex
appears to regulate its interaction with PS and Pen-2. Stabilisation of the PS
holoprotein is thought to occur through interaction with the Aph-1-iNct complex to
form a trimeric intermediate complex that then binds to Pen-2, allowing for PS
endoproteolysis and the final glycosylation of Net (Takasugi et al, 2003; La Voie et
al, 2003).
46

1.8 Project rationale
The work undertaken herein aims to extend the previous research carried out by
this laboratory, specifically the characterisation of PS1 within the cell compartment
using fluorescent anti-PS1 antibody staining and immunoblotting techniques. To
achieve these aims, a functional approach was adopted whereby a PS1-EGFP
transgene was constructed for the purpose of confirming the previous antibody
staining data, but also to investigate what effect introducing FAD mutations into the
PS1 construct would have on the location PS1 within the cell. Additionally, a
functional PS1-EGFP fusion protein would provide a convenient means for
studying the biochemistry of APP and Ap generation (see chapter 3).
47
Chapter 2
Materials and Methods

Chap ter 2 Materials and m ethods
2.0 Cell Culture
CHO, Cos-7, HEK 293, HeLa, NRK and PS1 mouse knock-out cells used within
this project w ere cultured in DM EM with G lutam ax and 4 .5 g/l glucose
supplemented with 10% foetal calf serum and PenStrep (100 p/ml and 0.1 mg/ml)
(Life Technologies). Cells were cultured at 37°C in the presence of 5% CO 2 . Cells
were passaged 1:10 using trypsin (Life technologies) once cells had become sub
confluent.
2.1 Cell fixation
Cells grown on 13 mm glass coverslips were fixed in -20°C methanol for 10
minutes, followed by three 5 minute washes in TBS. Alternatively, cells were fixed
for 10 minutes in 3-4% paraform aldehyde (A ldrich-S igm a), followed by
neutralization with 1xTBS. Paraformaldehyde was prepared by heating a 4%
solution for 20 min at 65°C. 2M NaOH was added drop wise to dissolve the
resultant pellet. The final solution was kept in 1xPBS at 4°C for one week. Para
formaldehyde treated cells were permeabilised with Triton X -100 (Sigma) for 5
minutes at room temperature. Cell nuclei were stained for 5 minutes with 1pg/ml
DAPI and affixed to slides with Fluoromount-G (Southern Biotechnology
Associates, Inc, Al, USA). Images were captured using a JVC 3-CC D digital
camera mounted on an Olympus BX80 microscope. Images were optimised (level
equalization) using Corel Photo-Paint 8.
2.2 Antibody staining
A list of antibodies used for immunoanalysis is shown in table 2.0 below.
Antibodies to PS1 (NT7, 1039, 923), Ubiquitin, anti-EGFP, the APP antibody AB10
and GRASP65 were used for both immunofluorescence microscopy and Western
blotting. All other antibodies were used solely for im m unofluorescence
microscopy.
48

Table 2. Antibodies used within present study
Primary Antibodies Source Antigen or Catalogue H-(where relevant)
rabbit o A P P /A IW (AB10)mouse Colliginmouse P-Cateninmouse P-COPrabbit A PP (D E2)mouse E R G IC 53mouse GalNac-T2rabbit Golgin 245mouse Grasp65rabbit EG FPmouse LAMP1mouse a-Mitochondriarabbit Mannosidase IImouse Membrinmouse M TO C (EG 3)rabbit NT7 N-terminal PS1rabbit PDImouse a20S Proteasomerabbit Y-Tubulinrabbit Ubiquitinmouse Vimentinrabbit 923 N-terminal PS1rabbit A PP KPI (993)
rabbit A PP (1151)rabbit D P23 0 X 2 domain of APPrabbit CO PII
This laboratory Stressgen Sigma SigmaThis laboratory H.P. Hauri H. Clausen M. Feiszler M. Lowe Clontech SigmaThis laboratory This laboratory Stressgen This laboratory This laboratory T. Wileman Zymed Sigma Sigma SigmaThis laboratory This laboratory This laboratory
This laboratory This laboratory T. Wileman
DAEFRHDSGYEVHHQK SPA -470 C -2206 G 2206DAEFRHDSGYEVHHQKG I/93UH4
8367-1H4A3unknownPGTQNISEINLSPMEISTFRIQLRV A M -P T046unknownMTELPAPLSYFQNAQMSEDNHLSNT
20973498T -3559U -5379V -6630FQ N A Q M S ED N H LS N TV R S Q N R EV C S E Q A E TG P C R A M IS R W Y FD PS1 2 9 8 -367 fused to C-term inus of maltose binding protein PVTIQ N W C K R G R K Q C K TH PH SQ SLLK TTQ EPLA RD
Secondary antibodies Source Catalogue N~
rabbit Alexxa 594 rabbit A lexxa 488 mouse Alexxa 594 mouse Alexxa 488 rabbit Alkaline Phosphatase rabbit HRP
Molecular Probes Molecular Probes Molecular Probes Molecular Probes Cell Signaling Cell Signaling
A 11012A 11008A 11005A1100170547074
2.3 Reduction and alkylation of disulphide bonds
To facilitate antibody detection of APP, Cos-7 cells expressing the fusion protein
were fixed and reduced for 3 hours at room temperature by 10 mM DTT in 0.5 mis
of 0.1 M Tris HCI (pH 8) and 1 mM EDTA treatment. Following three 5 minute TBS
washes, each well was alkylated for 1 hour in 25ptl 250mg/ml (0.06 fiM) sodium
lodoacetate, and then washed twice for 5 minutes in TBS.
49

2.4 Preparation of soluble and membrane bound cell fractions for SDS-PAGE
analysis
Where cell fractions were required for Western analysis, either control, non
transfected or Cos-7 cells transiently transfected (24 hours) with the fusion constructs
were scraped using a Falcon cell scraper from 6 well plates (27 sq cm) and
homogenised in 10 mM phenylmethylsulfonylfluoride (PMSF) (Sigma) and 1 ml ice-
cold 10 mM Tris HCI pH 8. Samples were prepared in a Dounce homogeniser (1 ml
capacity) following 30 strokes of the piston. Samples were centrifuged at 13,000 rpm
for 30 minutes. The resultant supernatant was kept and constituted the soluble
fraction. Pellets were washed in 10 mM Tris HCI pH 8 and centrifuged at 13,000 rpm
for a further 30 minutes. The supernatant was discarded and resultant pellet
constituted the membrane fraction. Samples were heated at 50°C for 10 minutes in
the presence of equal volumes of 2 X DTT. Samples were stored at -20°C until time
of use.
2.5 SDS PAGE/Urea Bicine gel preparation
Synthetic peptides corresponding to Ap1-40 and Ap1-42 were obtained from Sigma.
Bicine and BisTris were obtained from Lancaster synthesis. Urea, SDS, APS,
TEMED, Glycine and CAPS used for electrotransfer were purchased from Sigma
chemicals. Bis-acrylamide was obtained from Biorad. Immobilon-P PVDF membrane
was purchased from Millipore and Nitrocellulose membrane from Amersham Life
Sciences. SDS-PAGE molecular weight standards 7 Blue and 1 Blue (Sigma) or
Benchmark protein ladder (Invitrogen) were used to assess protein size. SDS-PAGE
was carried out using the Bio-Rad Mini protean II Electrophoresis gel system. For
separation of Presenilin fusion proteins, 10% Urea gels were used in an attempt to
resolve higher molecular weight species.
2.6 Immunoprecipitation of conditioned media
Conditioned cell culture media was removed after 24 hours incubation and analysed
by immunoprecipitation for Ap peptides. Immunoprecipitation was carried out using
50

either 50 mM TR IS .H C I pH 7.4, or radioimmunoprecipitation buffer (RIPA) (0.5%
Nonidet P-40 (BDH), 0.25% sodium deoxycholate, 0.05% SDS, 150 mM NaCI, 50 mM
HEPES, and 1 tablet of protease inhibitor mixture Complete Mini (Roche Molecular
B io c h e m ic a ls ) per 2 ml of 5X RIPA, pH adjusted to 7 .4 with NaOH). For
immunoprecipitation I.O ml of conditioned media was added to 250 pi anti-Ap AB10
(mouse monoclonal supernatant), 50pl 50% slurry Anti-Mouse IgG (Sigma) and
1 0 0 pil TR IS .H CI pH 7.4. Samples were rocked for 2 hours at room temperature.
Where RIPA buffer was used 1.0 ml of conditioned media was added to 250 pi AB10
plus 50 pi 50% Protein-A beads (Pierce, Rockford, III, USA). Samples were rotated
overnight at 4°C. Samples were centrifuged briefly at 2000 rpm for 2 minutes,
washed with TBS, and repeated for a second time. W here RIPA buffer was used,
beads were washed four times in PB S/0.1% BSA and once in 10 mM Tris.HCI, pH
7.4. To elute the beads incubated in Tris buffer, samples were aspirated followed by
addition of 10OpI 1xDTT/urea and heating at 60°C for 10 minutes. Samples
incubated with RIPA buffer were eluted by heating the samples to 95°C for 5 minutes
with 25 pi sample buffer.
2.7 Detection of P-amyloid peptides
The urea version of the Bicine/Tris SDS-PAGE system was used for the detection of
the (3-Amyloid 40 and 42 peptides (Wiltfang, et al 1998). This gel system utilises
three phases; a comb, stack and resolving gel components. The approximate
dimensions are shown in figure 2.0 below. Cell pellets were resuspended in 25 ml of
sample buffer (0.72 M bistris 0.32 M bicine, 2% SDS, 30% (w/v) sucrose, 5% 2-
mercaptoethanol, 0.008% (w/v) bromophenol blue, heated to 95°C for 10 minutes and
separated by bicine/Tris/urea S D S -P A G E . Table 2.1 below shows the buffer
composition and stock solutions used for Bicine/Tris SDS-PAGE. Table 2.2 lists the
final comb, stacking and resolving gel volumes needed for Bicine/Tris SDS-PAGE.
For Coomassie staining, gels were fixed in 10% acetic acid and 50% methanol for 10
minutes, followed by overnight staining with 0.05% w/v CBB R-250 in 10% acetic
acid. Gels were de-stained overnight with rocking in 2% acetic acid.
51

H j i j t j t j t Jj
} Comb gel length 12-15 mm
rjJr Stack 5 mmkL
Resolving gel 54 mm
\ r
Figure 2.0. Dimensions used for Bis-acrylamide gel (0.75 mm thickness)
Table 2.1 Composition and stock solutions used for Bicine gels
Composition
Resolving buffer Stacking buffer Comb buffer Cathode buffer Anode buffer
1.6 M Tris, 0.4 M H2S 0 4 0.8 M BisTris, 0.2 M H2S 0 4.0.72 M BisTris, 0.32 M Bicine.0.2 M Bicine, 0.1 M NaOH, 0.25 M w/v SDS. 0.2 M Tris, 0.05 M H2S 0 4.
Table 2.2. Final gel volumes
Comb Gel (9%T /5% C)
1.5 mis comb gel buffer900 pi Acrylamide/Bis (30% T/ 5% C)30 pi 10% w/v SDS514 pi dH2036pl APS (5%)20pl TEMED
Stacking gel (6% V 5%C)
1.0 ml Stacking gel buffer400 pi Acrylamide/Bis (30% T/ 5% C)20 pi 10% w/v SDS540 pi dH2020 pi APS (5%)20pl TEMED
Resolving Gel (10% T/5% C/ 8M Urea)
2.5 mis resolving gel buffer 3.34 mis Acrylamide/Bis 4.8 g Urea 100 pi 10% SDS.40 pi APS (5%)5 pi TEMED
2.8 SDS-PAGE running conditions
The SDS-PAGE urea gels were run at room temperature at 100 V for 30 min followed
by 150 V for 1 hour. The Bicine/Tris SDS-PAGE urea gels were run at room
temperature at 60 V for 15 min followed by 100 V for 1 hour. PVDF membranes were
wetted in methanol prior to transfer in Towbin buffer (0.025 M Tris, 0.192 M Glycine,
20% Methanol), whereas nitrocellulose membranes were transferred in CAPS buffer
(10 mM CAPS, 10% methanol, pH 11.0). Both membranes were transferred at 200
amps for 1 hour.
For immunostaining, Immobilon-P PVDF membranes were boiled for 3 minutes in
PBS. Membranes were blocked in 2.5% nonfat dry milk in TBS-T for 1 hour (0.05%
v/v Tween-20, 5% w/v nonfat dried milk). Following primary antibody incubation for
90 minutes, membranes were washed three times for 10 minutes in TBS-T, followed
by secondary incubation with alkaline phosphatase (AP) (1:1000) or horseradish
peroxidase (HRP-linked) (1:2000) secondary antibody (Cell Signalling Technologies)
for 45 minutes at room temperature.
Membranes were washed twice for 10 minutes in TBS-T, and then once for 5 minutes
in TBS. AP membranes were developed in 4 mis AP-buffer (100mM TRIS.HCI,
100mM NaCI, 5 mM MgChpH 9.5) containing 40pil bromo-chloro-indolyl phosphate
(BCIP, 15mg/mlin DMSO/MeOH) and 40pil nitroblue tetrazolium (NBT, 30mg/ml in
MeOH) (Sigma). Membranes exposed to HRP were developed using Biowest ECL
detection kit according to the manufacturers instruction and imaged on an Epi Chemi
II Darkroom (UVP Biolmaging Systems).
2.9 Polymeraisation chain reaction conditions
Following the optimization of reaction conditions, PCRs were performed using 1 unit
of Taq polymerase (NE biolabs), 0.2 mM dNTPs (Bioline) and 2.0 mM Mg2+.
Reactions were carried out on a Primus PCR machine (MWG-Biotech) programmed
to heat the PCR mixtures to 95°C for 10 minutes, followed by 30 cycles of denaturing
at 95°C for 1 minute, annealing at 65°C for 1 minute and extension at 72°C for 1
minute. Finally, samples were heated to 72°C for 10 minutes.
53
2.10 Restriction digestion and preparation of cDNAs
Double and single restriction digestion of pGEMT (Promega), pN2-EGFP (Clontech)
and amplified cDNA was carried out with 0.1 units of enzyme/|Lig DNA at 37°C for 2
hours. Ligation of inserts into linearised plasmid was carried out using T4 DNA
ligase/ligation buffer (1.0 Weiss unit/pg DNA - NE biolabs) at 4°C overnight. DNA
samples containing loading buffer were analysed by gel electrophoresis on a 1% TAE
agarose gel stained with ethidium bromide. All cDNAs used for restriction digest and
ligation reactions were purified using a Qiagen QIAquick Gel extraction kit according
to the manufacturers instructions. The DNA band size was estimated by comparison
with a 1 kb ladder (NE Biolabs) and by performing linear regression analysis. DNA
concentration was measured using a Cecil CE9500 spectrophotometer.
2.11 Preparation of electrocompetent DH 5a E.coli
Electrocompetent bacteria were prepared by diluting 5-10mls of an overnight culture
to 100 mis in LB broth in a sterile 250 ml flask. Cells were shaken at 37 °C for 2-3
hours until the O D 6oo read 0.5. The culture was decanted into pre-cooled 50 ml
Falcon tubes and left on ice for 30 minutes, followed by centrifugation at 4000 rpm for
15 minutes at 4°C. The pellet was re-suspended in 50 ml of sterile water. This
procedure was repeated a second time. The pellet was then re-suspended in 25 mis
of sterile water, and centrifuged at 4000 rpm for 15 minutes at 4°C. This procedure
was repeated a second time. The pellet was re-suspended in 4 mis 10% glycerol and
centrifuged at 8000 rpm for 15 minutes at 4°C. The final pellet was re-suspended in
0.4 ml 10% glycerol and divided into 40pl aliquots. Cells were stored at -70°C until
needed.
2.12 Transformation of DFI5a E.coli
Electrocompetent D H 5a E.coli (40pil) were prepared and transformed using the
Invitrogen electroporator II, according to the Invitrogen Electroporator II Instruction
Manual. Briefly, 1 -5pil volumes of 1 mg/ml pGEM -T or pEGFP containing PS1 cDNAs
54

were incubated along with the electrocompetent bacteria and electroporated using the
following input values: Input voltage 1500 volts; capacitance V max 1800; load
resistance 15 amps. Transformants were incubated for 1 hour with shaking in the
presence of 1ml Luria-Bertani broth (LB) containing 0.1 mM MgCI and 0.4 mg/ml
glucose. 150pil of the suspension was plated-out onto LB agar containing an
appropriate selection antibiotic - 100 jLtg/ml ampicillin or 30 (Lig/ml kanamycin (Gibco).
pGEM-T containing cDNAs were plated-out in the presence of 80 pg/ml 5-bromo-4-
chloro-3-indolyl-beta-D-galactopyranoside (X-gal) and 0.5 mM Isopropyl-beta-D-
thiogalactopyranoside (IP T G ). Plates w ere incubated at 37°C overnight.
Transform ant colonies were picked and cultured overnight with shaking in
LB/antibiotic broth at 37°C. Plasmid preparations were prepared by the alkaline-lysis
method (Sambrook et al, 1989).
2.13 Transfection of Mammalian Cells
Cells used for immunomicroscopy were grown on 13 mm coverslips and transfected
at 50-80% confluency. Cells were transfected with pEGFP or pEGFP containing PS1
cDNAs, in the ratio 0.7-0.8 pg DNA/ 1.75 pi Lipofectamine or 0.8 pg DNA/ 2.0 pi
Lipofectamine-2000, per well of a 24 well plate, as per the manufacturers instructions
(Gibco). For larger transfections in 6 well plates (27 cm2) materials were scaled-up
10 fold.
2.14 Transmission electron microscopy
Cos-7 cells expressing the NTM PS1-EG FP fusion protein were grown on 25 mm
coverslips in a six well plate. Twenty four hours post transfection, cells were fixed in
Karnovsky’s fixative (2% paraformaldehyde, 2.5% glutaraldehyde in 0.1M phosphate
buffer) for 3 hours at 4°C. Fixed specimens were then handed over to John Proctor
at Sheffield University for further fixation and imaging by TEM. Cells were post-fixed
in osmium tetroxide for 1 hour at room temp. Specimens were dehydrated by a
series of 15 min graded ethanol washes (75, 95, and 100%) at room temp and dried
over anhydrous copper sulphate for 15 min. Specimens were then placed in
propylene oxide for two changes of 15 min duration.
55

Specimens were infiltrated using a 50/50 mixture of propylene oxide/Araldite resin
and left overnight at room temp. Specimens were left in full-strength Araldite resin for
6-8 hours at room temp after which time they were embedded in fresh Araldite resin
for 48 hours at 60°C. Ultrathin 70-90 nm sections were cut on a Reichert Ultracut E
ultramicrotome and stained for 15 min with 3% uranyl acetate in 50% ethanol followed
by Reynold’s lead citrate staining for 2 min.
Sections were examined using a Philips CM10 mono transmission electron
microscope at an accelerating voltage of 80 Kv. Electron micrographs were recorded
on Kodak 4489 electron microscope film.
56
Chapter 3 Characterisation of PS1-CTF and PS1-NTF fragments in Cos-7 cells by immunocytochemistry
3.1 Introduction
Functional PS1 is thought to result from the endoproteolysis of the immature
holoprotein within the ER compartment to yield stable NH2- and COOH-terminal
fragments (NTF and CTF, respectively), (Thinakaren et al, 1996; Yu et al, 1998), which
are subsequently transported to the Golgi (Zhang et al, 1998), where they re-associate
(Thinakaran et al, 1998; Capell et al, 1998) within a functional complex containing
other proteins such as P-catenin, nicastrin, etc. Whether PS1 NTFs and CTFs have
different functions either separately, or within a functional complex, and where within
the cell compartment these fragments have their biological effect is currently unclear.
However, in addition to the PS1 localisation to the ER, ERGIC and Golgi (Cook et al,
1996; Kovacs et al, 1996), PS1 has been reported at the cell surface of T-cells
(Schwarzman et al, 1999), NT2N and DAMI cells (Dewji & Singer, 1997), and the cell
cell contacts in Cos-7 cells (Takashima et al, 1996).
To investigate the biology of PS1 fragments, rabbit polyclonal antisera raised
against the C-terminus loop domain (296-367) and N-terminus of human PS1 (10-24)
designated 1039 and 923 respectively, were used to stain endogenously expressed
wild-type PS1 in Cos-7 cells and imaged by immunofluorescence microscopy.
3.2 Criteria for assessing reporter molecule localisation within the cell compartment
Where antibodies/proteins are said to co-localise within the same compartment, this
should be taken to mean that the merged yellow image is more or less identical to the
two separate images shown in the red and green figures. A more strict definition of co
localisation would be when two separate reporters, say antibodies recognizing different
epitopes on the same molecule appear merged. A good example would be an anti-
EGFP antibody staining EGFP (see figure 4.7). Where staining is said to be co
incident, co-ditributed or overlapping, this means that although the merged image
appears to show co-localisation, this is only coincidental since in the separate
channels the reporter molecules occupy very different compartments. A good example
of overlapping staining is shown in figure 3.2 d below.
57

3.3 1039 antibody staining of PS1 in Cos-7 cells
Endogenous staining of PS1 in Cos-7 cells with the C-terminal PS1 antibody 1039,
results in a predominantly reticular staining pattern throughout the cell and around the
nucleus (figure 3.1, upper panel and figure 3.2, panel a). The distribution observed for
the 1039 antibody is consistent with the reticular network characteristic for the ER. A
comparison of 1039 staining with endogenous staining of the ER specific marker
Colligin (Hsp 47) show the same general morphological features (figure 3.2, panel a
and d).
3.4 923 antibody staining of PS1 in Cos-7 cells
Whereas staining with the anti-C-terminus PS1 antibody 1039 is ER-like, antibody
staining of Cos-7 cells with the anti-N-terminal PS1 antibody 923 is predominantly
perinuclear with some tubulo-vesicular staining (figure 3.1, lower panel and figure 3.2,
panel b). Similarly, staining of Cos-7 cells with the trans Golgi marker antibody Golgin
245 is distinctly peri-nuclear and not unlike that of 923 staining pattern (figure 3.2,
panel c). Similarly, double staining of Cos-7 cells with the ER marker Colligin and the
923 antibody reveals that the N-terminus PS1 fragment does not localise with Colligin
(figure 3.2, lower panels). Challenge with the peptide immunogen used to generate
923 completely or significantly reduces 923 antibody staining (D.Parkinson
unpublished observations).
3.5 923 staining of Brefeldin-A treated Cos-7 cells is largely vesicular and co-
localises with ERGIC53
To further characterise the cell compartments in which endogenous PS1 resides, Cos-
7 cells were treated with the fungal metabolite Brefeldin-A (BFA) which reversibly
blocks protein transport from the ER to the Golgi apparatus by preventing membrane
recruitment of COPI proteins, resulting in distinct morphological changes, including
collapse of the Golgi stacks (Klausner, 1992). Pharmacologically, BFA prevents the
retrograde transport of proteins normally resident in the Golgi into the ER, though in
the case of the trans Golgi network (TGN), BFA causes it to reassemble into extensive
tubular processes without redistributing into the ER (Wood et al, 1991). Antibody
staining of BFA-treated Cos-7 cells should reveal if any of the PS1 fragments resides
within the cis, medial, trans Golgi, or the TGN. BFA treatment of Cos-7 cells resulted in
differential staining patterns for the 923 and 1039 PS1 antibodies (figure 3.3). Both
Colligin and 1039 antibody staining is largely unaffected by BFA treatment since both58

PS1 antibodies stain separate compartments in Cos-7 cells
T h e C T P S 1 antibody 1 0 3 9 d isplays a reticular staining pattern
T h e N T P S 1 antibody 9 2 3 displays a perinuc lear staining pattern
F ig u re 3 .1 . E n d o g en o u s staining of PS1 in C o s -7 cells. M e th an o l tre a te d C o s -7 cells affixed to coverslips w e re sta ined with the PS1 C -te rm in a l an tib o d y 1 0 3 9 (u p p e r p an e l) and the PS1 N -term inal antibody 9 2 3 (low er panel). D A P I stain in blue. Bar, 2 0 pm .
59

PS1 N-terminus 923 antibody and PS1 C-terminus antibody differentially stain PS1 in Cos-7 cells
60
Figure 3.2. PS1, Colligin and Golgin antibody staining of Cos-7 cells. Cos-7 cells fixed in methanol were stained with antibodies to both PS1 and the cell compartment. The anti NTPS1 antibody 923 displays a distinctly peri-nuclear distribution within Cos-7 cells (b) similar to that of the Golgi marker Golgin 245 (c). In contrast the CTPS1 antibody 1039 displays a reticular pattern of staining (a) similar to that seen for the ER marker Colligin (d). DAPI stain in blue. Bars, 20 |im.

maintain a uniform reticular distribution pattern throughout the cell cytoplasm and
around the nucleus (figure 3.3, panels a and c, respectively), as was the case for the
control, non-BFA treated cells shown in figure 3.2, panels a and d. Following BFA
treatment of Cos-7 cells the distinct perinuclear-staining pattern displayed by Golgin-
245 (figure 3.1) is lost and instead redistributes to the ER forming a reticular pattern
(figure 3.3, panel a). Interestingly, 923 antibody staining of BFA treated cells shifts
from a Golgi-like distribution pattern to one that is predominantly vesicular, possibly
indicative of the ER-intermediate compartment (ERGIC) (fig 3.2, upper middle panel).
To investigate this possibility, BFA treated Cos-7 cells were double stained with the
923 antibody and the ERGIC specific marker antibody ERGIC53. Figure 3.4 shows
that the 923 staining strongly co-localises with the ERGIC53 marker, initially within the
Golgi compartment (top row) and then within the ERGIC following BFA treatment
(bottom row). In conclusion, the above results show that immunostaining of
endogenous PS1 in Cos-7 cells displays differential localization of the CTF and NTF
PS1 fragments. Furthermore, upon BFA treatment of Cos-7 cells endogenous
PS1NTF 923 staining locates to the ERGIC unlike that of the CTFPS1, which returns
to the ER.
3.6 Western blot analysis of endogenous PS1 expressed in Cos-7 cells
Cos-7 cells were lysed in DTT/Urea to give whole cell lysate and analysed by SDS
PAGE and immunoblotting with 1039 and 923 antibodies (figure 3.5). The anti-
CTFPS1 antibody stains immunoreactive bands at approximately 22 kD (lane 2)
consistent with previous reports, whereas the 923 anti-NTFPS1 antibody unexpectedly
shows very poor staining (lane 4). The 1039 doublet suggests alternate CTFPS1
transcripts, whereas the higher band at -6 0 kD may represent the uncleaved
holoprotein (Dewji and Singer, 1997). In addition to this band, 1039 stains a double
immunoreactive band at -9 0 kD that may represent PS1 dimerisation and/or
aggregation. Caution is advised in interpreting PS1 immunoblot data since crude
preparation for a range of different tissues and cells leads to proteolytic events that
result in PS1 artifacts (Dewji et al, 1997).
The absence of 923 immunoblot staining of PS1 may be explained by
proposing that the antibody only recognises specific epitope conformers, such that
denaturation and linearisation of the protein, as a prerequisite to immunoblotting,
effectively abolishes 923 antibody recognition of PS1. Indirect evidence for this is
provided by the immunocytochemistry results where the 923 antibody recognizes the61

putative PS1 epitope. Alternatively, cleavage of the N-terminus amino acid sequence
of PS1 to which the 923 antibody was directed against could likewise explain its failure
to immunoblot. However, it has been demonstrated by peptide competition studies that
923 staining is significantly reduced. Furthermore, the 923 antibody failed to
immunoprecipitate PS1 from Cos-7 cells, arguing against an N-terminus cleavage
event (D. Parkinson - unpublished observations). Similarly, the immediate addition of
DTT directly to cultured Cos-7 cells during the preparation of whole cell lysate is
sufficient to prevent major proteolytic activity and as such is unlikely to account for the
absence of 923 immunoblot staining of PS1. In any event, had proteolysis of the
whole cell lysate occurred, it might be expected that immunoblotting of the sample
would show protein laddering, however 1039 staining (figure 3.5) suggests that this
was not the case.
3.7 The 923 antibody does not recognize the PS1 N-terminus
To validate the 923 antibody data a PS1 N-terminus EGFP chimera was constructed
(chapter 4), and a second antibody, NT7, that recognizes the N-terminus of PS1 was
utilised since this both western blots and immunostains transgene and endogenous
PS1 (see chapter 5.5 and figures 5.8 lower panels, and figures 7.1 and 7.2a).
Subsequently data from these investigations (chapters 4 and 5) show that the 923
antibody does not recognize either endogenous or transgene PS1 (see chapter 4.9
and figure 4.10). Consequently the data showing a difference in the PS1 CTF and NTF
distributions, as measured by 923 and 1039 antibody staining, is only valid for the
PS1-CTF but not for the 923 antibody, which appears to recognize an unknown
epitope distinct from PS1.
3.8 Chapter summary
In summary, the above results are consistent with the PS1 holoprotein undergoing
proteolysis as part of the maturation process that gives rise to functional PS1.
However, the novel observation that the two PS1 fragments appear to reside in
separate compartments suggest, if correct, that C- and N -terminal PS1 fragments may
function separately to that of the mature PS1 complex and/or that the two fragments
may be degraded by separate pathways. Later analysis of the 923 antibody data
suggests that it does not in fact recognize N-terminal PS1.
62

923 antibody staining of BFA-treated Cos-7 cells is distinctly vesicular
63
| Colligin sta in ing_______________Figure 3.3. BFA treatm ent of Cos-7 cells. The anti-N-term inus PS1 antibody 923 shows a distinctly peri-nuclear pattern of staining (see figure 3.1). Following 10pg BFA treatm ent for 20 min this staining becomes largely vesicular (panel b) whereas Golgin and 103 9
staining is reticular (panels a and c, resp ective ly ). Following BFA treatm ent 923 staining remains distinct from that seen for th e
Colligin antibody (lower panels). DAPI stain in blue. Bars, 2 0 |im .

923 antibody staining co-localises with ERGIC53 in Cos-7 cells
64
Figure 3.4. 923 and Ergic53 antibody staining of BFA treated Cos7 cells. Top row: control non-BFA-treated cells. Ergic53 staining (red ) localises with 923 antibody staining (green), which is maintained following 5 pg/m l BFA treatm ent for 30 minutes (bottom row). D API stain
in blue. Bars, 20 pm .

a.
81645037
26
20
88 kD
60
22
Lanes: 1 Ladder2 CTPS1 1039 staining3 I blue marker4 NTPS1 923 staining
b.
Calibration Curve
2.00 n
1.90y = -0.0215x + 2.0239
1.70p 1.60
0 1.401 1 -30 - ° 1.20
1.101.00
5 15 25 35
D is ta n c e (m m )
Linear regression analysis of immunoreactive bands
Molecular weights for PS1 fragments (kDa):
Holoprotein -5 5 kDaC-terminal PS1 -1 4 -2 9 kDaN-terminal PS1 -3 0 kDa
Figure 3.5. a. 923 and 1039 antibody staining of Cos-7 whole cell lysate. (Lane 2) Immunoblotting of CTPS1 by 1039 detected bands at approximately 88 kD, 60 kD and 22 kD. (Lane 4) The NTPS1 antibody 293 failed to immunoblot endogenous PS1. Samples analysed by 10% Urea SDS PAGE. b. The size of the immunoreactive bands was calculated using linear regression.
65

Chapter 4 Construction of NTPS1-EGFP plasmid and expression in transfected
cells
4.1 Introduction
The observation that the NTFPS1 923 antibody does not react in Western blot
analysis raises doubts about the identity and utility of this antibody in characterising
the biology of PS1 for this project. In order to clarify this issue and effectively
extend the previous findings that PS1-NTF and PS1-CTFs reside within different
cellular compartments, and that upon BFA treatment these fragments follow
different retrograde pathways, a course of action was taken to construct a
PS1NTF-EGFP (Enhanced Green Fluorescent Protein) fusion protein. This
scheme has the advantage over immunostaining in that living cells transfected with
the fusion construct can be imaged without relying on antibody detection as the
primary reporter molecule.
The expression of fusion proteins tagged with EGFP is routinely used to
study the function and localisation of proteins in a wide variety of cells. EGFP is an
optimised variant of the GFP expressed by the jellyfish Aequorea Victoria (Chalfie
et al, 1994;Cubitt et al, 1995), that allows detection by fluorescence microscopy of
living or fixed cells, or by Western blot analysis with EGFP antibodies. Within the
jellyfish, light is produced when energy is transferred from the Ca2+-activated
photoprotein, aequorin to GFP. When expressed in cells and illuminated by either
UV or blue light (absorbance at 395 nm), GFP generates a bright green
fluorescence emission at 509 nm independent of co-factors or substrates. The
GFP chromophore consists of a cyclic tripeptide derived from Ser-Tyr-Gly in the
primary protein sequence and is only fluorescent when embedded within the
complete GFP protein. Nascent GFP is not fluorescent and requires that the
chromophore undergo cyliclisation and oxidation in the presence of oxygen. Thus
cells expressing the protein will only fluoresce within an aerobic environment.
GFP fusion proteins have been shown to maintain their fluorescence in living cells
as well as retaining the normal biological function of the fusion partner. Such
tagged proteins provided increased sensitivity and resolution when compared to
conventional antibody staining techniques (Wang & Hazelrigg, 1994). The use of
66

the fluorescent tag does not require fixation or permeabilisation steps thus making
this reporter system suitable for kinetic studies concerned with protein localisation
and trafficking.
To construct the N TPS1-EG FP plasmid involved the use of molecular
biology techniques such as PCR and the sub-cloning of the NTPS1 cDNA into the
target vector. Briefly, suitable primers incorporating restriction sites were designed
to anneal with the N-terminus region of PS1 cDNA during PCR. The amplified
product was double digested and ligated into the target EGFP vector. The steps
taken in the construction of the NTPS1-EGFP fusion plasmid are summarised in
figure 4.0. By subcloning the PS1 NTF cDNA into the EGFP vector upstream from
the EGFP tag, translation of the mRNA and the subsequent protein synthesis
should generate a fusion protein consisting of the first half of human PS1 with the
EGFP moiety attached at the C-terminus.
4.2 Amplification of N-terminal PS1 cDNA by PCR
The primer design incorporated both an Xho I and an EcoR1 restriction site to help
facilitate subcloning of the cDNAs into the target vectors. Using appropriate
primers the N-terminal region transmembrane domains 1-6 (codon 1 - codon 282)
were amplified by PCR from the pCIneo plasmid containing full-length human PS1.
To facilitate subsequent sub-cloning steps, forward and reverse primers were
designed to incorporate Xho I and an EcoR1 restriction sites, respectively. Table
4.0 below shows the primer sequences used to generate truncated and full-length
wild type and FAD PS1 constructs (see later).
4.3 Optimisation of conditions for PCR
An initial approach taken towards PCR is to first optimise the reaction conditions
that yield sufficient cDNA of the required size whilst minimising the generation of
non-specific bands. To this end PCR was carried out in the presence of five
varying magnesium concentrations and three annealing temperatures. Figure 4.1
shows the effect of magnesium concentration on the yield of PCR product. As
67

Gen
erat
ion
of N
-term
inal
PS1
fu
sion
pr
otei
n by
PCR
and
subc
loni
ng OLLLoLLIQ,
QCoCL> n
_QCO05015cE0
Q.E<
A I
Qoif)0.
0oo4—'c4-<o3
>0coo
•1—Io0<4—0ccov_1—
» 8 ® §>
* - oC +30 o
0
0
® i■O s“ 0 0
8 |5 oc 73 0 o>0 -e
•O — c co
ou_CD
o co
0 °C LL
E Zo 0
T 3 JC
2 Q--g E E co
E 20 -O c 0) co 0 J= =>
0CO coQ- 0M_ 0O .t i
0 0 _0 o0 Pc O o 'c: o to
.E 205
o ES- PCL CO
s—c o o Q . 0 o
•2 g £ 'eh 0
E
0 .E E 0-t—»05 O
Ll . CL
Oos—0cooco'03n—
~o0■*—’ coO)
0szI-
o0>
005i_CO-*-*0
o
E-O0cooJD 0 0 0 —
< 1
S J0 <5 -c E
. ECL JS LL E O 0
? s03 CL4 - ° -o co ^ cT 3 CO
2 O° \ E
"OO 0 CL tS0 ^
-C 0-+-■ c i t - COo 4=
68

a.
1 2 3 4 5 6 7 8
3000 -2000 1500 -
1000 - 838 bp
Lanes 1 2 3 4 5 6 7 81Kb
LadderNo DNA No Mg 2.0 mM 2.5 mM 3.0 mM 3.5 mM 4.0 mM
b.
Log 1 kbladderfragments
y = -0.4125x + 4.6639
2.61.4 1.9 3.90.9 2.4 2.9 3.4
Distance moved by fragments (cm)
Figure 4.1. Amplification of N-terminal PS1 fragment by PCR. a. Incubation of 1pl pCIneoPSI (1 mg/ml) with Taq polymerase in the presence of varying MgCI2 concentrations (mM) (annealing temperature 55°C). 1.5% TAE agarose gelstained with ethidium bromide, b. Log plot of 1kb ladder fragments. Estimate of PCR product size (bp) using linear regression analysis.
69

expected, the absence of pCIneoPSI (lane 2) and Mg (lane 3) within the reaction
mixture did not generate any PCR product.
Table 4.0. Primer sequences used to amplify by PCR truncated (NTPS1) and full length (FLPS1) PS1 mutant and wild-type cDNAs from pCLneoPSI
NTPS1 conserved constructForward. Code: 0-05 Reverse. Code: 0-06
5’- G A A TTTTG G G A A TC C TC C TTTG A G C TTC C G G G T-3’ 5 ’-GAGCGAAAAAAATT C A A G C G TTT C ATTT C T-3
FLPS1 conserved construct
Forward 712-748. Code: 0-10 Reverse 1404-1427. Code: 0-12
5 ’T TA G TG C C C TC A TG G C C C TG G TG TTTA TC A A G TA C C T 3 ’ 5 ’GAG CG AATTCG A ATA AA ATTG A TG G AA TG CTA A 3’
NTPS1/FLPS1 FAD (L235P)
Forward 712-748. Code: 0-11
Reverse 712-748. Code: 0-09
L->P5 ’ TT AGT GCC CTC A TG G CC C CG G TG T TT ATC AAG TAC CT 3 ’
L->P5 ’AG GTA C TT GAT AAA CAC C G G G G C CAT GAG GGC ACT AA 3 ’
Varying the magnesium concentration had no obvious effect on the amount of PCR
product generated even under reaction conditions using annealing temperatures of
45°C, 50°C (data not shown) and 55°C. In view of these results, future PCR
experiments were carried out in the presence of 2.0 mM Mg and an annealing
temperature of 55°C. The lower bands shown in figure 4.1 represent unused
excess primer.
By plotting the Log of the 1 kb ladder fragments against the distance traveled
by the marker DNA allows the size of the PCR product to be estimated. Using the
equation for the line of best fit an observed value of 838 bp is obtained, close to the
predicted size of the PCR product of 846 bp (Figure 4.1).
4.4 Subcloning of N-terminal PS1 cDNA into N2-pEGFP
The amplified PCR fragments were excised from the agarose gel and recovered
using a Qiagen gel extraction kit. Following EcoR1/Xho1 restriction enzyme,
double digestion of the NTFPS1 PCR product and the pEGFP vector, several
attempts were made at ligating the insert into the target vector, however none of
70

these attempts was successful. It was therefore decided to adopt an alternate
strategy using a TA cloning kit (Promega) whereby the insert was first sub-cloned
into the pG EM -T vector. The Taq polymerase (Biolines) used for the PCR
generates single 3 ’-5 ’ adenine overhangs in the PCR product. The linearised
pG EM -T vector incorporates single 3 ’-5 ’ thymidine overhangs designed to
complement that of the PCR product and so facilitate the ligation of PCR products
into pGEM -T vector. Following ligation of the insert into the vector, DH 5a E.coli
was transformed and plated-out on LB agar containing IPTG and X-Gal. The
following day putative recombinant white colonies were picked and grown
overnight in LB broth containing ampicillin. DNA samples were prepared from the
overnight cultures and double digested to screen for the insert. Lanes 5 and 12
(figure 4.2 a) show inserts of the expected size (-8 0 0 bp) and linearised plasmid at
-3 0 0 0 bp. A scaled-up double digestion was then carried out to provide sufficient
DNA for subcloning into the EGFP vector. Double digested EGFP and the insert
were ligated together and the resulting mixture used to transform D H 5a E.coli.
Selected colonies were incubated in LB overnight and minipreped the following
day. Double digestion of the putative pN TPS1-EG FP samples generated insert
close to the expected size (figure 4.2 b, lane 7).
4.5 Restriction digestion analysis of putative N-terminal PS1 cDNA
To confirm that the identity of the insert was that of N TFPS 1, a series of diagnostic
restriction enzyme assays were carried out with the restriction enzymes BspH 1,
Sty 1 and Xho 1. Digestion of the construct with these enzymes revealed a unique
banding pattern distinct from pEGFP digestion alone (figure 4.3). Linear regression
analysis was used to compare the actual band sizes obtained experimentally with
those predicted from a restriction map of the plasmid containing the insert (table
4.1).
Finally, sequence confirmation of the pNTPS1-EGFP cDNA was carried out
by Lark Technologies. The sequence obtained matched that of the wild type N-
terminus fragment, however an error appears to have been introduced at position
49, N-terminus from the start methionine of the wild type PS1 cDNA. Because of
71

Colony screening for pNTPSI
Figure 4.2. Restriction digest of cDNA recovered from transformed DH5a E.coli.
Individual clones were double digested with EcoR1/Xho1 (0.1 units/pg DNA). a. pGEM-
T restriction digestion shows putative inserts of the correct size (~800 bp) in lanes 5
and 12. b. Following double digestion of the NTPS1-GEM-T plasmid, the recovered
insert was ligated into double digested pEGFP. DH5a E.coli was transformed, cultured
overnight and plasmid DNA prepared for restriction digestion. Restriction digestion of
the putative NTPS1-EGFP in lane 7 yields an insert of the expected size. Lane 1
shows a 1 kb ladder. Samples were analysed on a 1% TAE agarose gel stained with
ethidium bromide. Insert sizes estimated using linear regression analysis.
72

the copying error at this position translation of the open reading frame would
generate an arginine residue instead of the amino acid glycine. However,
according to the Presenilin Mutation Directory at www.alzforum.org there is no
known FAD PS1 mutation located at this position, nevertheless, this does not rule
out the possibility of a pathogenic effect associated with this mutation. Though not
ideal, it was decided as a matter of economy and convenience to continue with the
next stage of the project, that of transfecting the construct into Cos-7 cells.
4.6 Cos-7 cells transfected with pNTPS1-EGFP display several phenotypes
Cos-7 cells grown to varying densities on glass coverslips were transfected with
differing cDNA concentrations to Lipofectamine ratios to achieve the best
transfection rate. Cells were transfected with either the fusion construct or pEGFP
alone as a control. Cells were left for 24 hours post transfection before being
prepared for fluorescent microscopy. The number of transfectants was assessed
by counting the total number of cells viewed under the microscope using the x 400-
objective and comparing them with those expressing the fusion protein. This
procedure was repeated three times per slide. The x and y stage adjusters on the
microscope were moved blindly to obtain a random sample for counting. Given that
the EGFP fluorescence faded rapidly following exposure to the light source no
transfected cell could be mistakenly counted a second time. In general transfection
rates ranged from 5% to 10%, depending on the cell type and the construct being
transfected (see later).
Four distribution phenotypes w ere consistently observed following
transfection of the N-terminal fusion construct into Cos-7 cells: reticular,
perinuclear, vesicular and circumnuclear ‘blob-like’ aggregates (figure 4.4). These
phenotypes contrast sharply with those observed in Cos-7 cells expressing EGFP,
which displays a diffuse, cytoplasmic distribution (figure 4 .4 b). Taken as an
average of several transfection experiments, the proportion of cells displaying a
particular phenotype remained roughly constant: 28% of transfected Cos-7 cells
displayed an reticular-like phenotype, 13% displayed a peri-nuclear like phenotype,
27% displayed a vesicular phenotype and 30% displayed blob-like aggregates. On
the whole, cells expressing the fusion protein displayed a mixture of phenotypes
73

within the sam e cell, e.g. an ER-like reticular distribution of the fusion protein
typically might have vesicles and blobs dispersed throughout the cell (figure 4.5).
Expression levels of the fusion protein varied significantly between low levels that
could be discerned under the microscope but were too weak to be recorded by the
CCD camera, to runaway levels of expression that appear as a single fluorescent
mass that obscured any obvious phenotype.
4.7 Western blot analysis of N TPS1-EG FP fusion protein locates to the cell
membrane
The presenilins are multipass membrane proteins with several transmembrane
domains (Thinakaren et al, 1996; Tomita et al, 1997). The N-terminal region, the
loop domain between TM 6 and 7 and the C-terminus region are all orientated
towards the cell cytoplasm (Li and Greenwald, 1996; Doan et al, 1996; De Strooper
et al, 1997). It would be expected that a crude preparation of Cos-7 cells
expressing the fusion protein would, when divided into soluble and insoluble
fractions, immunoblot for the membrane fraction only. However, the observation
that some transfected cells display an aggregate-like phenotype, possibly as an
artefact of overexpression of the fusion protein, suggests a soluble cytoplasmic
component. To address this question soluble and membrane fractions taken from
control, non-transfected cells, pEGFP transfected cells, and cells transfected with
the N TPS1-EG FP construct, were immunoblotted with the anti-EGFP antibody
(figure 4.6).
As expected immunoreactive bands were absent from non-transfected Cos-
7 control samples (lanes 1 and 2). Cells transfected with pEG FP show an
immunoreactive band at -2 9 kD within the cell soluble fraction corresponding to the
EGFP protein (lane 3). Western analysis of transfected Cos-7 cells expressing the
fusion protein show immunoblotting of the membrane fraction at -61 kD and -1 2 0
kD. Whilst the smaller band was expected corresponding to the sum of the
individual sizes of both the EGFP moiety and the N-terminus of PS1, the band at
-1 2 0 kD was not expected and may therefore represent dimerisation or
aggregation of the fusion protein (lane 6). In an attempt to resolve the larger
protein species into one band, the experiment was repeated a second time with the
74

Restriction digest of pNTPS1-EGFP
1 2 3 4 5 6 7 8
a.
2500 bp
Lanes 1 2 3 4 5 6 7 81kb pEGFP pEGFP PNTPS1- pEGFP pNTPSI- pEGFP pNTPSI-
Ladder EGFP EGFP EGFPEnzyme Sty1 Sty1 BspH1 BspH 1 Xho1 Xhol
b.Calibration curve
y = -0.3228x+4.0118S3
3.6-<ZQcno_j
2.60.1 1.1 2.1 3.1 4.1
Distance (cm)
Figure 4.3. a. Restriction digest of pNTPS1-EGFP recovered from transformed DH5a E.coli. 1% TAE agarose gel stained with ethidium bromide. NB the bands at ~2500 bp (*) represents incomplete digestion of the plasmid, b. Log plot of 1kb ladder fragments. PCR product size (bp) was estimated by linear regression. Plasmid samples digested with BspH 1, Sty 1 and Xho1 (0.1 units/pig DNA).
Table 4.1 Predicted versus observed fragment sizes generated following restriction enzyme digestion of plasmid DNA.
Fraqment sizes (bo) obtained following BsdH1. Xho1 and Sty 1 restriction diqest of dNTPS1-EGFPdEGFP DNTPS1-EGFP dEGFP DNTPS1-EGFP
Bs dH1 Stt 1 BsdH1 Sty I Xho1 Xho1Predicted Observed Predicted Observed Predicted Observed Predicted Observed Predicted Observed Predicted Observed
2966 3000 1809 1832 1941 2110 1809 1832 4737 4886 5610 55861776 1887 1499 1499 1839 1887 1499 1499
610 592 1776 610 620
75

addition of urea to the gel; however, the result was identical to that shown in figure
4.6. That the addition of urea made no difference to the band at 120 kD may be
more indicative of insoluble fusion protein aggregates rather than dimerisation of
the protein. The Coomassie stain in figure 4.6 b shows approximately equal
loading of protein samples into each of the gel lanes.
Since the phenotypes exhibited by transfected cells are distinct from that of
EGFP, and that no immunoreactive bands corresponding to EG FP alone was
found within the soluble fraction of cells, it can concluded that the EGFP moiety is
not cleaved from the C-terminus of PS1NTF and that the fusion protein resides
within the membranous compartment of the cell. Similarly, the anti-EGFP antibody
co-localises with the fusion protein for all phenotypes displayed by transfected
Cos-7 cells (figure 4.7).
4.8 The NTPS1 fusion protein localises to the ER and Golgi compartments
To investigate the identity of the membranous compartment in which the fusion
protein resided, several antibodies specific to cell marker proteins were used for
immunolocalisation experiments. The NTPS1 fusion protein localises to varying
degrees with markers for the ER (Colligin and PDI), the medial Golgi (Mannosidase
II), the trans Golgi (GalNac) and the Trans Golgi Network (Golgin 245) (figure 4.8
& 4.9). Colligin, a 47 kDa stress protein that resides within the ER is thought to
participate in intracellular processing, folding, assem bly and secretion of
procollagens (Nagata & Yamada, 1986). Similarly, PDI is thought to interact with
nascent proteins during their folding and assembly within the ER as part of the ER
quality control mechanism (Bottomly et al, 2001). Colligin and PDI display a
reticular distribution in both transfected and non-transfected cells and show partial
overlap with the fusion protein. Flowever, where the fusion protein displays a
perinuclear and vesicular distribution there is no localisation with these ER markers
(figure 4.8, merged panel). Unexpectedly, PDI staining is increased in some cells
expressing high levels of the fusion protein compared to neighbouring non-
transfected cells (Figure 4,8, bottom row).
Antibody staining by markers to the Golgi apparatus is distinctly peri-nuclear
in both transfected and non-transfected cells. Mannosidase II and Golgin 245
76

Distribution of N -term inal PS1 fusion protein in transfected Cos-7 cells shows four distinct phen o typ es
77
Figure 4 .4 . Transfection of Cos-7 cells with the N -term inal PS1 fusion construct generates four distinct phenotypes i.e reticular (c), p erinuclear (d), vesicular (e) and c ircum -n uc lear blob-like aggregates (f). Mock transfection (a) does not generate f lu o re s c e n c e . Transfection with EGFP (b) resulted in diffuse cytoplasmic phenotype distinct from that of the fusion protein. D API stain in blue. Bars, 15 jam.

Cos-7 cells expressing the fusion protein display a range of phenotypes
78 Figure 4 .5 . Phenotypes expressed by Cos-7 cells transfected with the fusion construct. Typically , transfection resulted in a reticular, vesicular and blob-like aggregate phenotype, all within the same cell. Nuclei omitted for clarity. Bar, 20 jim .

Cos-7 cells expressing the fusion protein show immunoreactivity within themembrane fraction only
a. 1 2 3 4 5 6 7 b. 1 2 3 4 5 6 7
: ’ F " T ' - M .......kD ■ ■■ }«-v ■ '.a''.* . • L r - ’
-» „„ „•120 -
— 116 kD ■ I :
“ 84Tfy/, ■
i
61 -- 4 8
■ i
■ (.-$*
f
29 - —26-
Lanes:
1. Control non transfected - soluble fraction2. Control non transfected membrane fraction3. pEGFP transfection - soluble fraction4. pEGFP transfection - membrane fraction5. pNTPSI-EGFP transfection - soluble fraction6. pNTPS1-EGFP transfection - membrane fraction7. 7 Blue marker
Predicted molecular weights
N-terminal PS 1 fragment 35 kDEGFP 27 kDNTPS1-EGFP 62 kD
Figure 4.6. Western analysis of Cos-7 cells expressing the fusion protein, a. Cell soluble and membrane bound fractions prepared from control and transfected Cos-7 cells (pEGFP or pNTPSI-EGFP) stained with the anti-EGFP antibody. Using linear regression analysis EGFP alone resolves as a band at ~29 kD (lane 4). Two bands represent the membrane-bound fusion protein in lane 7 at 61 kD and 120 kD. The higher molecular weight species may represent dimerisation of the fusion protein. Samples analysed by 10% SDS Urea PAGE. b. Corresponding comassie stain shows approximately equal sample loading per lane.
79

antibody staining show significant overlap with the perinuclear phenotype of the
fusion protein. W hereas the majority of untransfected cells stained for GalNac
display a Golgi stack phenotype, staining in transfected cells is both reduced and in
patches, scattered throughout the cell showing only partial overlap with the fusion
protein (middle row figure 4.9). Interestingly, neither the vesicular phenotype nor
the blob-like phenotype co-localise with the above cell compartment markers,
possibly indicating that these two structures have similar origins.
4.9 The NTPS1 fusion protein does not co-localise with 923 staining and returns
to the ER following BFA treatment in Cos-7 cells
Confident that the NTPS1-EG FP fusion protein had been successfully generated,
the earlier experiment in which 923 antibody staining of endogenous PS1 was
shown to be predominantly vesicular following BFA treatment (figure 3.3), was
repeated, this time with Cos-7 cells expressing the fusion protein. From the top
row in figure 4.10, the fusion protein shows a reticular and aggregated blob
phenotype, whereas 923 antibody staining displays an Ergic/Golgi-like phenotype.
Close examination reveals very little overlap between the fusion protein and the
923 antibody. Following BFA treatment, cells expressing the fusion protein were
stained with antibodies to Colligin (figure 4.10, bottom row) and Ergic53 (figure
4.11). In the case of Colligin staining there was little change in the phenotype
before and after BFA treatment (figure 4.11, bottom row). Similarly, following BFA
treatment, the fusion protein locates to the ER, whilst Ergic53 staining remains
largely vesicular (figure 4.11, bottom row).
Although raised against the N-terminus of PS1 (amino acids 10-24), staining
with the 923 antibody of transfected cells failed to show co-localisation with the
fusion protein. Similarly, when the BFA experiment was repeated and the cells
were stained with the 923 antibody, there was very little co-localisation between it
and the fusion protein (figure 4.10, upper panels). Additionally, PS1 transgene
expression has been reported to displace endogenous PS1 expression. In the
case of 923 staining, this appears to be unaffected by expression of the fusion
protein, raising doubts as to the ability of the 923 antibody to recognise PS1. As
expected the 1039 antibody does not co-localise with N-terminal fusion protein nor
80

does the latter displace endogenous C-terminal PS1 staining, which is similar in
both transfected and non-transfected neighbouring cells, suggesting that full-length
exogenous PS1 but not exogenous N-terminal fusion protein alone, is required to
displace endogenous levels of the holoprotein (figure 4.12).
4.10 Chapter summary
In summary, the distinctive phenotypes displayed by the fusion protein within the
cell compartment of transfected Cos-7 cells and its immunoreactivity within the
membrane-only fraction, would indicate correct folding of the NTPS1 fusion protein
and its maturation from the ER/IC to the Golgi, consistent with previously published
reports (Yu et al, 1998; Capell et al, 1998). The distribution of the fusion protein
within the cell compartment shows some overlap with markers to the ER and Golgi.
In the case of PDI staining, this is increased in some cells expressing relatively
high amounts of the fusion protein compared to non-transfected cells. Conversely,
GalNac staining is reduced in some cells expressing the fusion protein. The
absence of co-localisation of the fusion protein with the putative PS1NTF 923
antibody, and the discrepancy between their phenotypes following BFA treatment,
indicates that the 923 antibody does not recognise either transgene NTPS1-EGFP
nor endogenous P S 1.
81

The anti EGFP antibody co-localises with NTPS1 fusion protein
82
Figure 4.7. Anti-EGFP antibody staining of Cos-7 cells expressing the NTPS1 fusion protein. The high degree of overlap b e tw een the fusion protein and the anti-EGFP antibody suggest cleavage of the EGFP moiety does not occur. DAPI stain in blue. Bars, 20
p,m.

The NTPS1 fusion protein shows partial co-localisation with the ER markers Colligin and P D I
83
Figure 4 .8 . ER antibody staining of Cos-7 cells expressing the NTPS1 fusion protein. Top row: Colligin staining (red) shows a reticu lar distribution. Bottom row: PDI staining (red) shows partial overlap with the reticular fusion protein phenotype but does not localise with perinuclear or vesicular phenotype. PDI and colligin staining is marginally brighter in transfected cells compared to neighbouring cells. DAPI stain in blue. Bars, 20p.m.

The NTPS1 fusion protein partially overlaps with markers to the Golgi apparatus
84

The 923 antibody does not recognise the N-terminal PS1 fusion protein
Figure 4 .10 . 923 antibody staining and BFA treatm ent of transfected Cos-7 cells. Top row: The putative PS1 antibody 923 does not co- localise with the fusion protein in Cos-7 cells. Lower row: BFA treatm ent of Cos7 cells expressing the fusion protein. Following B F A treatm ent the fusion protein maintains a reticular distribution that localises closely with the ER marker Colligin (compare with 9 2 3 staining of BFA treated cells shown in figure 3.3). DAPI stain in blue. Bars, (top row) 10 pm, (bottom row) 20 pm .

The NTPS1 fusion protein does not localise with ERGIC53 staining following BFA treatment of transfected Cos-7 cells
86
Figure 4 .11 . Ergic53 antibody staining of BFA-treated Cos-7 cells expressing the NTPS1 fusion protein. Upper panels: The fusion protein and Ergic53 staining display a predominantly perinuclear phenotype. Lower panel: Following B FA -treatm ent the fusion protein locates to the E R , whilst ERGIC53 staining is distinctly vesicular. DAPI stain in blue. Bars, 20 pm .

The 1039 antibody neither co-localises with the PS1 N-terminal fusion protein nor displaces endogenous PS1
87 Figure 4 .12 . 1039 antibody staining of Cos-7 cells expressing the NTPS1 fusion protein. The 1039 anti-PS1C TF antibody displays a reticu lar phenotype as does a proportion of the fusion protein, however this staining is coincident since the 1039 antibody does not stain for the o th er
fusion protein phenotypes. Note that the fusion protein does not displace endogenous PS1 staining. DAPI stain in blue. Bars, 20 |am.

Chapter 5 Construction of mutant PS1 cDNA and expression in cells
5.1 Introduction
The observation that the 923 antibody did not recognise the fusion protein as
expressed in transfected Cos-7 cells raised doubts as to whether or not this was
infact an anti-PS1 antibody. The simplest conclusion to be drawn at this stage was
that the 923 antibody recognised some other protein other than PS1. Consequently
any further investigation with the 923 antibody in the characterisation of the fusion
protein was abandoned. Instead it was decided to exam ine more closely the
phenotypes displayed by the fusion protein and any biological effect they might
have within the cell. To address the issue as to whether the phenotypes observed
for the fusion protein were specific to this NTPS1 construct, a full-length wild type
fusion protein (FLCPS1) was constructed and compared in Cos-7 cells with the
phenotypes exhibited by the presence of the NTPS1 fusion protein. Additionally,
full-length (FLM P S 1) and an N-terminal PS1 (N T M P S 1) fusion constructs
harbouring a known FAD mutation were generated for the purpose of investigating
what effect, if any, these mutations have on the trafficking of the fusion protein
within the cell and any associated affects these mutation might have on the
cleavage of APP.
5.2 The phenotypes exhibited by the fusion protein are not an artefact of the cell
fixation process
Methanol fixation of cells in preparation for microscopic examination was chosen
because of the lower toxicity associated with its handling and its ease of use.
However, issues arose as to whether the phenotypes observed were in fact
artefacts generated as a consequence of the fixation process. To address this
concern, Cos-7 cells expressing the fusion protein were treated with an alternate
fixative, paraformaldhyde. Transfected Cos-7 cells expressing the fusion protein
were fixed separately in methanol or paraform aldehyde and exam ined for
differences in the phenotypic distribution of the fusion protein. Figure 5.0 shows
that there are no marked differences between the two fixation methods since each
treatment results in the same ER/Golgi, vesicular/blob phenotypes. Similarly, live
88

cells affixed to coverslips were imaged. In this instance a diffuse-ER and blob
phenotype could be discerned within the same cell not dissimilar to that observed
in fixed cells (data not shown), though it could be argued that the removal of the
cells from a constant CCVtemperature environment to the microscope, regardless
of how rapid the transfer was, may have contributed to the phenotypes observed.
Had the phenotypes been an artefact of the fixation procedure, it is reasonable to
expect that all transfected cells would similarly be affected and therefore exhibit the
same phenotypes, as opposed to the actual ones observed. Since the phenotypes
are independent of the fixation method, methanol was used throughout the
remainder of the project given its ease of use and reduced toxicity compared to
paraformaldehyde.
5.3 The phenotypes displayed by the fusion protein are found within other cell
types
As a corollary to the above experiment, the construct was transfected into several
additional mammalian cells with a view to establishing whether the fusion protein
phenotypes were unique to Cos-7 cells. The fusion construct was therefore
transfected into HEK 293, CHO, Hela, NRK and mouse P S T /_ knockout cells. The
images shown in figure 5.1 shows no difference between the phenotypes displayed
by Human HeLa/HEK 293 cells and rodent NRK cells and those displayed by
monkey Cos-7 cells (figure 5.1). To rule out the possibility that the observed
phenotypes were not the result of the transgene protein interacting with
endogenous PS1, mouse P S T 7' cells were transfected with the fusion construct.
As with the other transfected mammalian cells there was no difference in the
phenotypes expressed by this cell line (figure 5.1, bottom panel). To ascertain
whether the EGFP moiety and the fusion protein remained intact when expressed
by other cells, the cells were stained with the anti-EGFP antibody (HEK 293 cells,
middle panel). No diffuse staining, indicative of soluble, cleaved EG FP was
observed, instead both the ER and blob phenotypes co-localised strongly with the
antibody.
Since there are no discernable differences in the phenotypes displayed by Cos-7
cells and those displayed by other transfected mammalian cell types, including
89

The N-terminal PS1 fusion protein displays the same phenotype regardless of the fixation method
90
Figure 5.0. Cell fixation m ethod. Transfected Cos-7 cells expressing the fusion protein were fixed in form aldehyde (upper row) or m ethanol (lower row). No appreciable difference in phenotypes is observed between the two fixation m ethods. DAPI stain in b lue. Bars, 20 jim .

The
fusi
on
prot
ein
phen
otyp
es
disp
laye
d by
vario
us
mam
mal
ian
cells
are
id
entic
alC -C
■ 1 1
uo
0
00o.>.
^ COI 05o CNJ
a . ^ O LU
I - I• -a Q_ cI I co
O *w a:
.1 ^ i-L o
cocoCL I—Z ®CL I
CDECOa)a)_c
>TOCL0
0
0TDX3
0d)CL
-I—'ocCD
■aoJOcCO
^ 0-OLUi-i—'cCO
CD_cI-
0 ■0 0_c 0 -C-t—' 0
00
H
.c s—-4—' CL
y_0
iA0
c
0O
0 0 CO0 O)0 o!_ CM
"co CLo c LUo o X
o 03 >>o M— JO
0.c
CL01—0>o
00s _CO0■a
.<2 co -Q
0 _oCO _Q
/ i \
E 5
-o oa) 4- 02 Q)0 g E 0
0
Eo
oCO
0 0 0-C -C
0 sd cd a ) 0 oCD
8 2
£ | 0>+- a)
o
co "o
SQ- n.>. i o wP oQ) O
€ .E
- 0 c0 jx. ■”— — ci JO 002 o •4—»
0O _Q ___O CL
■0 <•a C Qc 0ra 0
1— 0DC 0 -4—*
0LU 0
o020i_
'(/) 020 0 02_: > 0
EzLOCNJ0CO
0
91

PS1 knockout cells, it is reasonable to assume that the above results reflect a
general cellular response to the presence of the fusion protein.
5.4 Construction of wild type and FAD mutant PS1 plasmids
In all reported cases of FAD there is an increase in the production of the
amyloidogenic Ap42 species by proteolytic processing of APP (Scheuner et al,
1996). To examine what affect FAD mutations had on the generation of Ap a
course of action was taken to generate both wild type and mutant full-length PS1
fusion proteins and a mutant N-terminal PS1 protein. Additionally, the introduction
of a FAD mutation into the construct will be of use for examining the passage of the
fusion protein through the cell compartment.
(i) Alteration of PS1 cDNA base sequences by site directed mutagenesis
A novel approach used to alter the amino acid sequence of a protein involves the
use of site directed mutagenesis (SDM ). Here, selected bases within a DNA
molecule can be altered and the effects on protein function studied (Deng, 1992).
At the molecular level mutations may be in the form of insertion, point or deletion
mutations. In site-directed mutagenesis mutations are directed specifically to a
target region of a protein. This achieved by introducing a mutation inot a cloned
segment of DNA corresponding to this region.
A general feature of SDM is that the oligonucleotide encoding the desired
mutation is annealed to one strand of the DNA of interest and serves as a primer
for initiation of DNA synthesis. This way the mutagenic oligonucleotide is
incorporated into the newly synthesized strand. M utagenic oligonucleotides
incorporate at least one base change but can be designed to generate multiple
substitutions, insertions or deletions. The synthetic oligonucleotide is
complementary to the target template except for a region of mismatch near the
center. This mismatched region contains the desired mutation. Following
hybridization, the oligonucleotide is extended with DNA polymerase to create a
double-stranded structure. The nick is then sealed with DNA ligase and the duplex
structure is transformed into a suitable host cell.
92
If no selection method is employed, the theoretical yield of mutants using this
procedure is 50% (due to the semi-conservative mode of DNA replication). In
practice, however, the mutant yield in the absence of selection may be much lower,
often only a few percent or less. This is assumed to be due to such factors as
incomplete in vitro polymerization, primer displacement by the DNA polymerase
used in the fill-in reaction and in vivo host-directed mismatch repair mechanisms
that favour repair of the unmethylated newly synthesized DNA strand. Off the shelf
kits like the ‘GeneEditor in vitro Site-Directed Mutagenesis System’ uses antibiotic
resistance to select only for plasmid derived from the mutant strand, resulting in a
greatly increased frequency of mutations. According to the manufacturer’s claims,
80-90% recovery is possible.
(ii) Site directed mutagenesis by PCR
Originally the PS1 FAD mutation was to be introduced using a site directed
mutagenesis kit, however, given the success of the previous PCR it was decided to
explore the possibility that the desired mutation could be introduced into PS1 using
mutant primers in a PCR involving two stages. The first stage used two mutant
primer pairs to generate the complete, but fragmented product in two separate
PCR reactions. The second stage exploited the complementary overlap region of
the fragmented products in a third PCR reaction. In this reaction polymerase
effectively fills-in the gaps using flanking (conserved) primers to generate the
complete molecule incorporating the FAD mutation (figure 5.2). In terms of
economy, it was estimated that this two-stage method of introducing a mutation is
both quicker, involving fewer steps and less expensive when compared to the SDM
kit method.
A general rule when attempting PCR is to limit the size of the read
performed by the polymerase since the longer the DNA sequence to be copied the
greater the likelihood that an error will be introduced. Bearing this in mind the
simplest approach to introducing a mutation into the transgene was to design
mutant primers that only generate a portion of the target cDNA during the PCR
(table 4.0). For reasons of practicality the L235P mutation (AD onset 32 years)
located within TM 5 of PS1 (Campion et al, 1997) was chosen since PCR of the
93

PS1 cDNA would generate PCR products of approximately 700 bp, half the size of
the full-length molecule. Figure 5.3 shows the amino acid sequence of PS1 and
the location of the L235P FAD mutation within TM 5 of the molecule. By selectively
amplifying the cDNA in two stages, the reaction products can then be incubated
together in a final PCR to generate PS1 containing the FAD mutation.
To generate the full length PS1 mutant for example, required two separate
PCR reactions, the first with the primer pair 0-05/0-09, and the second reaction
with the primer pair 0-11/0-12 (table 4.0). In stage 2 the resultant PCR products
were separated on an agarose gel, excised and purified. Equal molar quantities of
the two PCR products were incubated together along with dNTPs/M g, Taq
polymerase and the necessary flanking primers in a third PCR reaction (figure 5.2).
(iii) Optimisation of PCR conditions
The PCR conditions were optimised as before to give the best product yield with
the least non-specific binding (NSB) component (figure 5.4), however after several
attempts it became clear that the NSB could be reduced, but not entirely eliminated
altogether. The results from this PCR show bright bands of the expected size of
approximately 700 bp and 150 bp. The assumption was made that these were the
required PS1 cDNAs and were therefore excised from the gel and purified for the
second PCR (figure 5.5 a).
To generate the full-length mutant PS1 molecule, the PCR products from
lanes 5 and 6 (figure 5.4) were mixed in equal molar amounts. Similarly, to
generate the mutant NTMPS1 molecule the products from lanes 5 and 7 were
incubated together. Further optimisation of the reaction conditions yielded both
NTMPS1 and FLMPS1 products of the correct size (figure 5.5 b, lanes 2 to 5, and
lanes 6 to 9, respectively). From figure 5.5 it is clear that the reactions did not
precede to completeness and that the yield of NTMPS1 DNA was greater than that
for FLMPS1. However, the results were encouraging enough that the experiment
was scaled-up and the resultant products were separated on an agarose gel,
excised and purified for restriction enzyme analysis.
94

Site directed mutagenesis of PS1 cDNA by two step PCR using primers incorporating FAD mutation L235P
Step 1Full length PS1 (-1 4 0 0 bp)
0-05...
0-10/0-11
J Jj^ \ ------- \
0-08/0-09 0-06 0 - 1 2
w
NTM-PS1
FL-PS1w
Step 2—
m u
- 1
M u tan t F L M P S 1 L235p
C o m p le m e n ta ry re g io n s o v e r la p a llo w in g d o u b le s tra n d fo rm atio n . P o ly m e ra s e fills in g aps b e tw e e n flank ing p rim ers (b lue).
F igure 5 .2 . S c h e m a tic rep resen ta tio n o f the P C R used to g en e ra te PS1 c D N A s . S te p 1: T o g e n e ra te th e fu ll-length PS1 m u tan t m o lecu le requ ired tw o P C R reactions, th e first w ith the p rim er p a ir 0 -0 5 /0 -0 9 , and the second reactio n with th e p rim er p air 0 -1 1 /0 -1 2 . S te p 2 : T h e resu ltant reaction products a re then m ixed to g e th e r to g e n e ra te the fu ll-length constru ct in a third P C R using the flanking prim ers 0 -0 5 and 0 -1 2 . T h e a d v a n ta g e to th is s c h e m e is th a t the tw o in te rm ed ia te P C R products o verlap at co m p le m e n ta ry s e q u e n c e s to form a d o u b le strand ed region with flanking single s trand ed arm s, w h ich th e p o lym erase fills-in during the final P C R . T h e red b ar re p re s e n ts th e s ite a t w h ich th e m u ta te d p rim ers (h ig h lig h te d ) introduce the F A D L 2 3 5 P m utant.
95

H<1
CL <
I □
C/D —
I— LL (D
—l>
LL
>-L
JL
<tl—
Q
>-
—1
>
«n
<C
I I
I
I I— —
lO
jO
1 —
<
> LL O
<
^
^ _
l-----------1<
> —
C0
>>
-Q
_l
><
>_
lO
CL
CM CL
-I >- * -
9t A
1 >
- <
O O
_I
><
>□
>-
— I—
><
—i
—i —
^Z
ll
(D
>>
C9
^_
>-
—
LL CO(n (/)
i :> x <
_ >
>A
I Z <
< —
—
(/)>
— >
>2
Ef
—______
I _
I >
> _
I In
inCM
96
Figure 5.3. Amino acid sequence of PS1 transmembrane domains showing selected mutations (highlights). The location within PS1 and ages of onset for these mutations are:TM 1/2 loop aa 115 T to H onset 37 years T M 2 a a 1 4 6 M t o V onset 38 years TM 6/7 loop aa 267 P to S onset 35 yearsTM 1/2 loop aa117 P to L onset 28 years TM5 aa 233 MtoT onset 35 yearsTM2 aa 143 I to T onset 35 years TM5 aa 235 L to P onset 32 years

a. 1 2 3 4 5 6 7 b.
1 5 0 0 -
1000-
wHf iHflr 700 bp
Calibration curve
-0.3789X + 4.153
<zoao_i
2.6
0.7 1.7 2.7 3.7
D istance (cm )
Lanes 1 2 3 4 5 6 71Kb
ladderPrimerpairs
05/012 05/08 010 /012 05 /09 011 /012 011 /06
Approximate size of PCR product (bp)
1400 700 690 700 690 150
Figure 5.4 Amplification by PCR of pCLneoPSI. a. Mutated and conserved primers (table 4.0) were used to generate truncated PS1 cDNAs by PCR. 1.5% TAE agarose gel stained with ethidium bromide, b. Log plot of 1kb ladder fragments. Estimate of PCR product size (bp) using linear regression analysis.
a. 1 2 3 4 b. 1 2 3 4 5 6 7 8 9
1400 (FLCPS1)
800 (NTMPS1) 700
Truncated PS1 1kb 40 45 55 60 40 45 55 60(annealing temp °C)
Figure 5.5. Analysis of PCR product, (a) The PCR products shown in figure 5.4 were excised and recovered (lanes 2 to 4) to eliminate the NSB component, (b) The increased PCR cycle time from 2 min to 10 mins generated FLMPS1 (lanes 2 to 5) and NTMPS1 DNAs (lanes 6 to 9) approximating in size to those for FLMPS1 (1447 bp) and NTMPS1 (856 bp). Different annealing temperatures did not improve the yield of the PS1 cDNAs. Each lane shows 1pl of product taken from a total reaction volume of 25 pi. Samples analysed on a 1.5% TAE agarose gel stained with ethidium bromide.
97

(iv) Restriction analysis of PCR products
To confirm that the identity of NTMPS1 and FLMPS1 a series of diagnostic
restriction digestion assays were performed (Figure 5.6). The fragments generated
by restriction digestion are close in size to the values calculated from a restriction
map of PS1 (table 5.0). The mutant PS1 cDNAs were subcloned, firstly into the
pGEM -T vector as before then secondly into the pEGFP vector. Once subcloning
of the cDNAs was completed the putative FLM /N TM P S 1-E G FP vectors were
analysed by a second series of restriction digestion reactions (Figure 5.7). The
resultant fragment were close in size with the predicted values calculated from a
restriction map of pEGFP (table 5.1). Finally, the DNA sequences of the new
constructs were confirmed for that of the wild type and mutant full-length PS1 and
N-terminal PS1 molecules (Lark Technologies).
5.5 Expression of NTM PS1-EGFP by Cos-7 cells
Transfection of the NTMPS1 construct into Cos-7 and FIEK 293 resulted in
phenotypes identical to those displayed by the NTPS1 fusion protein i.e. ER, Golgi-
like, vesicular and blob-like aggregates. Transfection rates for both truncated
constructs were comparable as was the percentage of cells displaying the various
phenotypes. This is most readily seen by comparing figures 4.5 with those images
in figure 5.8 showing anti-EGFP staining of the NTMPS1 fusion protein (top row).
Similarly, Colligin and Golgin antibody staining localises with the NTMPS1 fusion
protein reticular and perinuclear phenotypes (data not shown).
The earlier attempt at characterising the NTF with the 923 antibody failed to
show co-localisation with the fusion protein. The availability of a second putative
anti-N-terminal PS1 rabbit polyclonal antibody (NT7) produced by this laboratory,
which both Western blots and recognises PS1 in fixed cells, was used to stain for
both endogenous PS1 and exogenous NTM PS1. NT7 staining of endogenous
PS1 displays an ER-reticular and Golgi-like perinuclear pattern consistant with the
reported distribution of PS1. Challenge with the peptide immunogen used in the
production of NT7 in a competition assay significantly reduces staining to a
diffused speckled pattern (figure 5.8, bottom row). Unlike the putative anti N-
98

terminus PS1 antibody 923, NT7 readily stains both NTPS1 fusion proteins
showing a high degree of co-localisation (figure 5.8, middle row).
5.6 Expression of Full length PS1-EGFP and Full length mutant PS1-EGFP by
Cos-7 cells
Interestingly, there were significant differences in the transfection rates between
full-length PS1 and the truncated PS1 constructs. Cells expressing the full-length
fusion proteins consistently display transfection rates <1%, compared to the 5-10%
transfection rate found for both N-terminal PS1 plasmids. In addition, the overall
fluorescence of the full-length fusion protein was much fainter compared to the
truncated proteins. Although visible under the microscope, cells expressing the
full-length fusion proteins were barely detectable by the CCD camera. To capture
these images by camera required a maximum gain typically +18 and a shutter
setting >40 frames. This compares starkly with the NTPS1-EG FP images, which
typically required a gain of +0 and a shutter <10 frames. This presented difficulties
when capturing ‘clean’ images due to the high noise to signal ratio, however this
was minimised by utilising the ‘dust and scratch’ facility found in Adobe Photoshop
without significantly altering the information content of the image. W here visible,
phenotypes displayed by the full-length fusion proteins were chiefly reticular and
blob-like/vesicular (figure 5.9), yet no clear perinuclear distribution was observed.
The absence to date of a Golgi-like phenotype for the full-length fusion proteins
may be of significance for the distribution of the CTF, however caution is required
in ruling out a perinuclear phenotype given the consistently low transfection rates
associated with these constructs.
5.7 Endoproteolysis of the full-length fusion protein generates separate pools of
NTF and CTF in a proportion of cells expressing the transgene
To characterise the location of the full-length fusion protein within the cellular
compartment, cells were stained with the anti-NTFPS1 antibody NT7 and the anti-
CTFPS1 antibody 1039 and imaged for fluorescence. Unlike the NTPS1 fusion
protein, which does not stain for the anti-PS1 C-terminal antibody 1039 (figure
99

4.12), full length PS1, as expected, co-localises with the 1039 antibody i.e. the PS1
C-terminus fused to the EGFP moiety shows co-localisation with 1039 staining
(figure 5.10). Of more immediate interest is the staining pattern observed for the
NT7 antibody in transfected cells expressing the full-length fusion proteins, since it
appears that there are two separate CTF and NTF pools; one for the NTF as
detected with the NT7 antibody, and one pool for the CTF-EG FP protein, indicating
that the full-length transgene product undergoes endoproteolysis to generate both
fragments. In figure 5.11 (upper row) NT7 stains the blob-like aggregates (as does
1039), however, in a proportion of cells exhibiting this phenotype, NT7 staining is
distinct from the green fluorescence generated by the C-terminus EGFP moiety, of
which the latter shows a predominantly reticular pattern of distribution (figure 5.11,
lower row).
Close examination of the middle panel of the bottom row shows that the
lower of the two transfected cells is weakly fluorescent. In comparison NT7
staining shown in the adjacent panel is considerably stronger, indicating possible
differences in the lifespan between NTF and CTF-EG FP molecules. Similarly, the
earlier 923 antibody staining showed a distinct phenotype from that of the PS1CTF
1039 antibody, however, in this instance the NT7 phenotype is clearly blob-like and
not perinuclear, unlike the 923 phenotype.
5.8 BFA treatment of Cos-7 cells expressing the full-length fusion protein
Previously it was shown that following BFA treatment of transfected cells, the
NTPS1 fusion protein returned to the ER as opposed to the ER G IC -like
compartment seen for BFA treated cells stained with the 923 antibody (figures 3.4).
In light of the above finding that the full-length protein forms two separate pools in
some cells expressing the protein, it was necessary to investigate whether this held
true following BFA treatment i.e. do the PS1 fragments derived from the full-length
fusion protein return to different cellular compartments in the presence of BFA? To
answer this question, cells were treated with BFA as indicated previously (figure
5.9 row d). No vesicular/ERGIC-like staining was observed; rather the fusion
protein remained distinctly ER-like, as per the earlier experim ent when cells
expressing the NTPS1 fusion protein were treated with BFA (see figure 4.10). This
100

1 2 3 4 5 6 7
Calibra tion curve
-0.3712x + 4.5655
NTMPS1 F _MPS1Lanes 1 2 3 4 5 6 7
1 kb Hae II Sty I Taq I Hae II Sty I Taq I
Figure 5.6. Restriction digestion of putative FLMPS1 and NTMPS1 cDNAs. To confirm
that the identity of NTMPS1 and FLMPS1 a series of diagnostic restriction digestion
assays were performed. The fragments generated by restriction digestion are close in size
to the values calculated from a restriction map of PS1 (table 5.0 below). Recovered
samples digested with Hae II, Sty I and Taq I (0.1 units/pg DNA). 1.5% TAE agarose gel
stained with ethidium bromide. The size of the cDNAs were estimated by linear regression
analysis.
Table 5.0. Fragment sizes of PCR products following single site restriction digest (bp)
Restriction site Full length PS1/Full length mutated PS1
N-terminal PS1
Predicted Observed Predicted Observed
Hae II 258, 1153 225, 1235 258, 598 217, 539Sty I 155, 1256 164, 1440 155, 701 161, 835Taq I 683, 728 597, 708 173, 683 196, 607
101

bp6000
3000
2000
Lanes 1 2/8 3/9 4/10 5 6 7 11 12
1 kb Ladder
pEGFP pEGFP-FLMPS1
pEGFP-NTMPS1
pEGFP-NTMPS1
pEGFP-NTMPS1
1 kb Ladder
pEGFP-FLMPS1
pEGFP-FLMPS1
Restrictionenzyme
Xho I Xho I Xho I Hae II Sty I Hae II Sty 1
Figure 5.7 Single restriction digest of pEGFP, and putative pEGFP-containing FLMPS1 and NTMPS1 plasmids. Plasmids digested with Hae II, Sty I and Xho I (0.1 unit/0.1 mg/ml) for 1 hour at 37°C. Samples analysed on a 1.5% TAE agarose gel stained with ethidium bromide.
Table 5.1 Comparison of fragment sizes (bp) generated by Hae II, Sty I and Xho I single restriction digestion of putative pEGFP-NTMPS1 and pEGFP-FLMPS1. Calculated values obtained from a restriction map of pEGFP.
pEGFP- NTMPS1 pEGFP-FLMPS1
Hae II St)t 1
Hae II Sty 1
Calculated Observed Calculated Observed Calculated Observed Calculated Observed
2014 2138 1809 1869 2423 2475 1809 1907
1675 1724 1499 1487 1675 1771 1499 1527
896 820 770 655 896 861 1334 1300
728 686 610 504 728 663 610 531
Fragment sizes (bp) following Xho I restriction digest
pEGFP pEGFP- MTMPS1 pEGFP- FLMPS1Calculated Observed Calculated Observed Calculated Observed
4737 4895 5610 5576 6200 6267
186914871300
102

The NTMPS1 fusion protein phenotypes are identical to those of NTPS1
103

result shows that transfected cells expressing the fusion protein do not display
differences in N- or C-terminal PS1 distribution following BFA treatment. Taken
together these data suggest that the two separate PS1 pools form following
cleavage of the full-length molecule within the ER, and that these pools have
different turnover rates.
5.9 Western analysis of Cos-7 cells expressing FLPS1-EGFP, FLM PS1-EGFP
and NTM PS1-EG FP fusion proteins
Cos-7 cells were transfected with pEGFP and the full-length and N-terminus PS1
constructs. Twenty-four hours post transfection cells were separated into soluble
and membrane fractions and analysed by SDS PAGE. From figure 5.12, non
transfected control cell fractions did not stain with the anti-EGFP antibody (lanes 2
and 3), nor the membrane fraction prepared from cells transfected with pEGFP
(lane 5). Anti-EGFP antibody staining of the soluble fraction (lane 4) resolves a
single immunoreactive band of approximately 26 kDa, close to that predicted for
EGFP (27 kDa). The absence from lanes 6-11 of a single band corresponding to
EGFP would indicate that the EGFP moiety remains attached to the fusion
constructs and does not undergo cleavage. As with the earlier Western blot for
NTPS1-EGFP (figure 4.6), immunoreactive bands are absent from soluble fractions
prepared from cells expressing the three new fusion proteins. In lane 11 the
N T M P S 1-E G F P m em brane fraction shows several bands, two of which
approximate to 57 kDa and 127 kDa, very close in size to those bands seen for the
NTPS1 fusion protein (figure 4.6) which correspond to the sum of the individual
sizes of both the EGFP moiety and the N-terminus of PS1 (62 kDa). As before, the
band at -1 2 7 kD may represent aggregation of the fusion protein (figure 5.12, lane
11).
The blotting profiles obtained for both full-length fusion proteins are
identical. Immunoreactive bands corresponding to the sum of the individual sizes
of both the EG FP moiety (27 kDa) and full-length PS1 (55 kDa) resolve at
approximately 83 kDa, very close to the predicted size of the full-length PS1 fusion
protein (lanes 7 and 9). The strongly staining nature of these bands suggests that
the fusion holoprotein is the predominant species. From figure 5.11 the C-terminus
104
PS1-EG FP moiety remains distinct from NT7 antibody staining in a proportion of
cells expressing the full-length fusion constructs. Close examination of figure 5.12,
lanes 7 and 9 at -4 7 kDa reveal faint bands approximate in size to those expected
if the full-length fusion proteins undergo endoproteolysis to yield C-terminus PS1-
EGFP. Smaller bands for all three constructs at -3 0 kDa or less may represent
proteolytic fragments generated as the result of physiological specific cleavage
events e.g. caspase activity, or could be artefacts produced due to the manner in
which the tissue was prepared (Dewji et al, 1997).
As with the N-terminal fusion proteins, the full-length proteins show
additional higher molecular weight bands, in this case at approximately 132 and
155 kDa, again possibly representing aggregation of the fusion proteins. Whereas
consistently low transfection rates were observed for the full-length constructs,
membrane fractions blot with a comparable intensity to that of NTMPS1 (compare
lanes 7 & 9 with lane 11) adding weight to the notion that the holoprotein or CTF
has a more rapid turnover.
5.10 Chapter summary
In summary, PCR was used to construct mutant PS1 cDNA by a two-stage
process. The phenotypes displayed by the fusion proteins in a variety of cells are
identical as is their immunoblotting profiles when comparing like with like, and the
various phenotypes displayed are not a product of the fixation process. In all four
constructs EG FP immunoreactivity occurs within the membrane-only fraction
indicating correct folding of the fusion proteins consistent with their maturation from
the ER to the Golgi, though the presence of the full-length fusion protein within the
Golgi compartment is yet to be established. One of the stated intentions within this
chapter was to assess what effect the L235P FAD mutation would have on the
trafficking of the fusion proteins. The introduction of the mutation within the fusion
protein and its expression by several mammalian cell lines appears to have no
effect on its distribution as evidenced by the identical phenotypes for all four
constructs, ie FLPS1-EG FP vs FLM PS1-EGFP, and NTPS1-EG FP vs NTM PS1-
EGFP. Additionally, the difference in C-and N-terminal PS1 fragment distribution
indicates that the full-length molecules undergo endoproteolysis, and that CTF-
105

EGFP turnover exceeds that of the NTF, which appears to aggregate more readily
as seen for NTPS1-EGFP and NTPS1 derived from the full-length fusion proteins.
The fluorophore intensity and transfection rate of NTPS1-EGFP exceeds that
observed for the full-length molecules suggesting a greater stability for this
fragment.
106

Full-length PS1-EGFP displays reticular, vesicular and blob-like aggregate phenotypes
FLMPS1-EGFP FLPS1-EGFP FLPS1-EGFP
Anti-EGFP staining FLMPS1-EGFP Merge
Anti-EGFP staining FLPS1-EGFP Merge
Anti-EGFP. BFA treatment FLPS1-EGFP MergeFigure 5 .9 . P h en o typ es d isp layed by fu ll-length proteins, (a ) C o s -7 cells exp ress in g th e F L P S 1 or F L M P S 1 fusion proteins show no d iffe ren ce in distribution w h en co m p ared w ith e a c h o th er or with N T P S 1 , with th e exception of the p eri-n u c lear p henotype, w hich to date , has not b een o bserved for th e fu ll-length m o lecu les , (b) and (c) T h e a n ti-E G F P an tibody stains all p h e n o ty p e s exh ib ited by th e fusion proteins. T h e distinct staining pattern d isp layed by th e a n ti-E G F P antib o d y in d icates th at th e E G F P m o iety is not c leaved from th e fusion pro te in , (d) B F A tre a tm e n t o f tra n s fe c te d cells results in a re ticu lar distribution of th e fusion as with the N T P S 1 m o lecu les (c o m p a re w ith figu res 3 .4 & 4 .1 0 ). D A P I stain in blue. Bars, 20 p,m.
107

1039 staining co-localises with the full-length PS1 fusion proteins
108
fusion protein. Although visible through the m icroscope, staining of endogenous PS1 in neighbouring non-transfected cells could not be captured in the same frame as the 1039 antibody staining due to differences in fluorescent intensity. Bottom row: 1039 staining co-localises with the blob-like aggregate phenotype displayed by F L P S 1 -E G F P . D API stain in blue. Bars, 10p m .
NT7 staining of the blob-like aggregate phenotype is distinct from that of the C-terminus PS1-EGFP moiety
109
length fusion protein. Bottom row: NT7 antibody staining is reticular in adjacent non-transfected cells. Close examination of the m erged image reveal NT7 staining of blobs remains distinct from the fusion protein. DAPI stain in blue. Bar 2 0 p m .

Western analysis of NTMPS1, FLPS1, and FLMPS1 fusion proteins
1 2 3 4 5 6 7 8 9 10 11 12
155 — 3 k ^132 —
127 — * * * * * * ;•— 116 kD
**• «r
83 — ------ — holoprotein
* - — 58
57— 48 CTFPS1
30 — __ 36
26 —— 26
LANES:1 . 1 blue2 . Control soluble fraction3. Control membrane fraction4. EGFP soluble5. EGFP membrane6 . FLPS1-EGFP soluble7. FLPS1-EGFP membrane8 . FLMPS1-EGFP soluble9. FLMPS1-EGFP membrane
10. NTMPS1-EG FP soluble1 1 . NTM PS1-EGFP membrane1 2 . 7 blue
Predicted mol wt for fusion proteins (approx):
EGFP 27 kDaC-terminal PS1 -EGFP 47 kDaFLPS1-EGFP 82 kDaNTPS1-EGFP 62 kDa
Figure 5.12 Cos-7 transfected with pEGFP and PS 1-EGFP fusion constructs were separated into soluble and membrane fractions. Samples analysed by 10%SDS/urea PAGE gel stained with anti-EGFP antibody.
110

Chapter 6 Biological properties of the fusion protein
6.0 Introduction
Having successfully generated the additional constructs the biological
properties and functional relevance of the fusion proteins was investigated.
Cells expressing the fusion protein were stained with antibodies to the cell
compartment, anti-p-catenin and anti-APP. Additionally, functional aspects of
the fusion protein were considered, in particular, their ability to cleave APP.
Thus to measure Ap generation in stable APP770-CHO cells transfected with the
fusion protein, a bicine SDS PAGE gel was prepared since this can discriminate
between the Ap4o and AP42 peptides.
6.1 Reduction in antibody staining of the ER resident proteins Colligin
(Hsp47) and PDI
To investigate the identity of the compartment in which the fusion protein
resided, several antibodies specific to cell marker proteins were used in
immunolocalisation experiments. All three fusion proteins exhibited localisation
to varying degrees with the ER markers Colligin and PDI (data not shown).
Only the NTM PS1-EG FP fusion protein localised with the anti-Golgi antibodies
Mannosidase II, GalNac and Golgin 245. The lack of a perinuclear phenotype
in cells expressing the full-length proteins cannot be ruled-out since the
transfection rate for these constructs was significantly less when compared to
NTMPS1-EGFP.
Unexpectedly, in a proportion of cells expressing both full-length and
truncated fusion proteins and in particular cells exhibiting the blob-like
aggregates, markers for both the ER and Golgi compartments were either
significantly reduced and/or dispersed to such a degree as to suggest that these
compartments have fragmented. Colligin and PDI antibody staining was
reduced in cells over-expressing both full length and truncated fusion proteins
(figure 6.0). Antibody staining was either considerably weaker in transfected
cells compared to neighbouring, non-transfected cells or else antibody staining
exhibited a vesicular distribution pattern. Colligin staining was most affected
compared to the loss in PDI staining, though both show vesicle-like structures
111

scattered throughout the cytoplasm, possibly indicating fragmentation of the ER
(rows a-c).
6.2 Reduction in antibody staining of Golgi-associated proteins Mannosidase
II and GalNac.
As with the ER markers, there were visible differences in antibody staining of
the medial Golgi protein Mannosidase II, and the trans Golgi protein GalNac in
Cos-7 cells expressing both full-length and truncated PS1 fusion proteins (figure
6.1). Both antibodies show reduced staining compared to neighbouring cells
which typically display a peri-nuclear phenotype. Mannosidase II staining is
barely detectable in cells exhibiting the blob-like phenotype or those cells where
the fusion protein has occupied the majority of the cell cytoplasm. GalNac
staining appears to localise with the juxta-nuclear blob-like aggregate. The
fragmented appearance of the G alNac antibody staining contrasts to the
classic, stack morphology displayed by non-transfected neighbouring cells.
Additionally, some cells expressing moderate levels of the fusion protein also
showed a reduction in G alNac staining compared to neighbouring non-
transfected cells (see figure 4.9, middle row).
The alterations in the structure of the ER and Golgi compartments
indicate that moderate to high levels of the fusion protein may disturb
intracellular trafficking or exhibit toxicity in some cells.
6.3 p-Catenin does not associate with NTM PS1-EG FP in Cos-7 and HEK293
cells
PS1 has been detected as a high molecular weight complex in vivo (Seegar et
al, 1997; Capell et al, 1998), associated with several co-factors such as
Nicastrin, APH, PEN2 and p-catenin. The latter has been implicated in cell-cell
interaction and signalling in the Wnt pathway. PS1 interaction with p-catenin
regulates levels of the protein by its association with GSK-3p that targets p-
catenin for proteosomal destruction via its phosphorylation motif. PS1 FAD
mutations alter the trafficking of p-catenin arising from a dominant ‘gain of
aberrant function’. Lithium induced Wnt activation in FAD human fibroblasts
112

decreases the nuclear trafficking of p-catenin compared to wild type fibroblasts
(Nishimura et al, 1999a).
To investigate what effect the fusion protein had on p-catenin levels and
whether both proteins formed a complex within the cell, Cos-7 and HEK293
cells expressing the truncated fusion proteins were stained with an anti-p-
catenin antibody and imaged by fluorescent microscopy (figure 6.2). p-catenin
antibody staining is present at the cell membrane/cell-cell contacts and within
the cytoplasmic of HEK293 and Cos-7 cells. Additionally, P-catenin staining is
just discernable in the nuclei of both cell types regardless of whether the fusion
protein is being expressed, and that this expression does not appear to
influence the level of antibody staining. As shown in figure 6.2, P-catenin does
not localise with the NTM PS1-EG FP fusion protein, nor does it seem that the
fusion protein alters this phenotype compared to untransfected/low level
expressers in adjacent cells. In this experiment there is no evidence that
mutant NTM PS1-EG FP affects p-catenin trafficking. The lack of NTF-p-catenin
interaction is consistent with previous studies showing that the CTFPS1 or full-
length PS1 but not NTF, contain the p-catenin binding domain (Murayama et al,
1998; Yu et al, 1998; Kang et al, 1999; Singh et al, 2001).
6.4 The fusion protein shows limited localisation with the anti-APP antibodies
874, 993 and DE2
One of the major pathological hallmarks of Alzheimer’s disease is the deposition
of APP-derived p-amyloid within the senile plaque of AD brains. APP
proteolysis is dependent on a-, p- and PS1 associated y-secretase activity to
generate several proteolytic fragments. Three main APP species have been
recognised: a 751 and a 770 amino acid protein commonly found in both
neurons and non-neuronal cells, and a 695 amino acid protein found exclusively
in neurons. Data from studies examining the proteolysis of APP reveal the
presence of different peptide fragments at various points along the secretory
pathway, i.e. ER, ERGIC, Golgi compartments, lysosomes/endosomes and the
plasma membrane (many authors). However, a discrepancy exists between the
ER location of the secretases responsible for the cleavage of APP, and the site
of Ap generation. PS1, for instance, is localised to the ER/Golgi yet generation
113

Colligin and PDI antibody staining is reduced in some cells over expressingthe fusion proteins
Colligin staining NTPS1-EGFP Merged image
Colligin staining NTPS1-EGFP Merged image
Colligin staining NTPS1-EGFP Merged image
PDI staining NTMPS1-EGFP Merged image
Figure 6 .0 . A lte red E R antibody staining. A proportion of C o s -7 cells o ver-exp ress in g both full lengt and trun cated fusion proteins show reduced Colligin (row s a -c ) and P D I an tib o d y stain ing (row s d . f). A ntibody staining w as e ith er co nsiderab ly w e a k e r in transfected cells co m p ared to neighbouring n on-transfected cells or e lse the antibody staining w as frag m en ted . D A P I stain in blue. B ars 20|um.
114

Golgi antibody staining is reduced in some cells over-expressing the fusion protein
M an n o s id ase II staining N T P S 1 -E G F P M erg e d im ag e9M an n o s id ase II staining N T P S 1 -E G F P M erg e d im ag e
M an n o s id ase II staining F L P S 1 -E G F P M erg e d im ag e■ B DG al N ac staining N T M P S 1 -E G F P M erg e d im ag e
F ig u re 6 .1 . A lte red G olgi an tib o d y s ta in ing. A proportion o f C o s -7 cells o v e r-e x p re s s in g both full length and tru n cated fusion proteins show red u ced M a n n o s id a s e II and G a l N a c an tib o d y stain ing. A ntibody staining w as reduced in transfected cells co m p ared to neighbouring , n o n -tran s fec ted cells. G a lN a c stain ing is fra g m e n te d co m p ared to neig h bo u ring cells, w hich typ ica lly sh o w rib b o n /s ta c k m orphology. D A P I stain in blue. Bars 20|um.
115

p-Catenin does not localise with the NTMPS1-EGFP fusion protein
116 Figure 6.2. p-Catenin antibody staining of HEK293 (top row) and Cos-7 cells (bottom row) expressing N T M P S 1 -E G F P . P-Catenin is confined
to the cytoplasm and cell-cell contacts and does not associate with the fusion protein. DAPI stain in blue. Bars, 20 j i m .

of the toxic Ap4 2 peptide occurs within the ER/ERGIC, whilst the production of
the Ap4o is thought to occur more distally within the secretory pathway (Selkoe,
1999).
To investigate whether the fusion protein localises with APP within the
cell compartment, transfected Cos-7 cells were stained with three polyclonal
anti-APP antibodies referred to as 993, 874 and DE2. The 993 antibody
recognises the 770 and 751 isomers of APP containing the KPI domain.
Staining with the 993 antibody, which has been described previously, requires
reduction and alkylation (Campbell et al, 1999). Staining with 993 reveals an
unusual network of fibrils, which do not localise with any of the phenotypes
displayed by the fusion protein (figure 6.3). The top row shows that the blob
like aggregates are intimately associated with the nucleus. This circumnuclear
phenotype appears to disrupt the 993 pattern of staining in the immediate
vicinity of the nucleus (figure 6.3, all rows).
The 874 antibody recognises the C99 stub derived from the action of p-
secretase on APP. 874 staining of Cos-7 cells display a reticular, peri-nuclear
and vesicular phenotype. Staining of cells expressing the fusion protein
appears to partially overlap with the peri-nuclear phenotype, but not with the
numerous vesicles scattered about the cell (figure 6.4). However, closer
examination of the peri-nuclear phenotype exhibited by the fusion protein
suggests that localisation with the 874 antibody is coincident since this
phenotype appears to be composed of much larger vesicles compared to those
stained by the 874 antibody, which are considerably smaller in diameter (figure
6.5, top row). This is seen more clearly by the vesicular phenotype, which does
not localise with the 874 antibody (figure 6.4, middle row). The blob-like
phenotype similarly does not localise with the 874 antibody and effectively
excludes staining in the region occupied by the fusion protein (left panel, bottom
row).
The DE2 antibody only recognises the ‘free-end’ C-terminus epitope of
the P-secretase generated C99 stub and the a-secretase generated stub, thus
uncleaved full-length APP is not recognised by the DE2 antibody. DE2 staining
displays a largely reticular/ punctate and peri-nuclear phenotype (figure 6.5).
Close inspection of the latter phenotype of neighbouring non-transfected cells
reveals a cluster of vesicles reminiscent of the ERGIC. In cells expressing the
fusion protein DE2 staining partially overlaps with the peri-nuclear and blob-like
117

aggregate phenotype but not the reticular or vesicular phenotype (figure 6.5).
As with the 874 antibody, DE2 staining of the peri-nuclear located fusion protein
may be coincident. Similarly, staining of the blob-like aggregate may also be
coincident since the antibody staining is arranged as small vesicles, whereas
the fusion protein appears opaque (figure 6.5, bottom row).
6.5 Detection and separation of synthetic Ap40 and Ap42 by bicine SDS PAGE
The aim of this next study was to investigate what affect wild type and mutant
fusion proteins had on the generation of Ap40 and Ap42 peptides in a stable
CHO-APP770 expressing cell line transfected with the pN TM P S1-EG FP and
pFL /FLM PS 1-EG FP cDNAs. To date, attempts by other researchers at
resolving Ap4o and Ap42 by conventional reverse-phase liquid chromatography,
capillary zone electrophoresis, acid-urea-PAGE or SDS PAGE has not been
successful. Previously, separation has proven difficult because of solubility
problems and interaction of Ap with the separation matrix. To measure the
metabolic fate of A PP 770 a bicine SDS PAGE gel employed because of its ability
to discriminate between the different Ap peptide species (Wiltfang et al, 1997).
To detect Ap production synthetic Ap40 and Ap42 was first used as a
control to gauge the effectiveness of this gel system in discriminating between
the two peptides. Various nanogram quantities of Ap40 and Ap42 were loaded
onto the gel and immunoblotted using a polyclonal antibody AB10, that
recognises both APP and Ap. In the first experiment 10 ng and 50 ng of
synthetic Ap42 were separated on gel and analysed by AB10 (figure 6.6, a).
Immunoreactivity was greatest with an antibody dilution of 1:3 (50 ng Ap42), and
least reactive at 1:30 dilution (50 ng). 10 ng of the peptide did generate any
immunoreactivity.
Next, using the 1:3 antibody dilution, 1ng to 50 ng Ap40 was analysed by
immunoblotting (figure 6.6, b). AB10 immunoreactivity detected Ap40 in the IQ-
50 ng range (lanes 4-6). Ap42 (lane 7) migrates at just over 4 kD, above Ap40,
demonstrating size separation of the two peptides. To establish the limit of
detection and test whether this system could resolve a mixture of the two
peptides, varying peptide amounts were loaded and immunoblotted using a
range of antibody dilutions (figure 6.6 c). AB10 was able to detect 5 ng of the
peptide mixture at 1:50, and 25 ng at 1:400. 50 ng of the peptide mixture
showed immunoreactivity with AB10 at 1:800. For comparison purposes, 50 ng
118

of peptide mixture was detected using ECL. AB10 antibody immunoreactivity
was seen in the 1:200 -1 :3200 dilution range for 50 ng Ap40 and Ap42 (fig. 6.6 d).
6.6 Immunoprecipitation of APP 770 from conditioned and complete media
To effectively measure the generation of Ap peptides in cell cultures expressing
the fusion protein requires immunoprecipitation of the conditioned media into
which the A p 4o and AP42 peptides are secreted. From the previous
immunoblotting experim ents it was established that the best antibody
dilution/peptide quantity that gave a consistently clear signal was 1:100/50ng.
Stable CHO-APP 770 expressing cell lines were transfected with the p N T M P S I-
EGFP and pFL/FLM PS1-EGFP cDNAs. Transfection of C H O -APP 770 cells was
confirmed by fluorescent microscopy. Condition media was removed following a
24 hour incubation period. As a control to test recovery, 50 ng of each peptide
were added to a known volume of complete media. Immunoprecipitation of the
samples was performed using the AB10 antibody at a 1:100 dilution (figure 6.7
a). APP immunoreactivity was detected at —113 kD in complete media (lanes 2-
4) and in conditioned media from transfected cells (lanes 6-8). Ap
immunoreactivity was detected in lane 5 (control), w hereas recovered or
secreted Ap4o/Ap42 peptides were not detected in any of the control lanes or
transfected samples. That the synthetic Ap peptides were not recovered from
complete media suggests that the AB10 antibody, whilst recognising the peptide
by immunoblotting, cannot immunoprecipitate either Ap4o or Ap42 from solution.
The above result might be due to insufficient AB10 antibody at the
immunoprecipitation stage. However, repeat experiments this time with higher
concentrations of AB10 yielded the same result (data not shown). Given that
the antibody recognises the same epitope in both APP and Ap, the relative
abundance of both the peptides within the culture medium might lead to
competition for the AB10 binding site. Thus, excessive amounts of APP
compared to Ap might effectively out-compete Ap antibody binding thereby
explaining the APP immunoreactivity only.
To test this hypothesis, a second antibody that recognises APP but not
Ap, DP23/2, was used to twice-immunoprecipitate complete media containing
119

993 antibody staining does not localise with the fusion protein
M erg ed im age9 9 3 staining
9 9 3 stainingR eticu lar/p eri
nuc lear/ves icu larM erg ed im ag e
R eticu lar/ves icu lar9 9 3 staining M erg ed im ag e
F ig u re 6 .3 . A P P 9 9 3 -a n tib o d y stain ing. C o s -7 cells tran s fec ted w ith p N T P S 1 -E G F P s ta in ed w ith reduced and a lky lated « A P P 9 9 3 antibody. 9 9 3 recognises th e 7 7 0 and 751 K PI conta in ing isom ers
of A P P . T h e fusion protein d isp lays a reticular, p e ri-n u c lea r and ves icu lar p h en o typ e th a t d o es not loca lise with th e 9 9 3 an tibody. T h e 9 9 3 an tib o d y d isp lays a fibril pattern o f s ta in in g . N o tice th e overa ll lack o f ves icu la r 9 9 3 staining and d isruption aro u nd th e im m e d ia te v icin ity o f th e nucleus. D A P I stain in blue. Bars, top and m iddle rows 2 0 pm , bottom row 10 pm .
120

874 antibody staining partially overlaps with the fusion protein
R eticu la r/p eri-n u c lear/ves icu la r M erg e d im age8 7 4 staining
V es icu lar M erg ed im ag e8 7 4 staining
M erg ed im age8 7 4 staining
Figure 6 .4 . A P P 874 -a n tib o d y staining of C o s -7 cells exp ress in g N T M P S 1 -E G F P . 8 7 4 stain ing d isp lay a re ticu la r, p e ri-n u c le a r and v e s ic u la r p h e n o ty p e . In tra n s fe c te d ce lls 8 7 4 s ta in in g partially o verlap s with th e p e ri-n u c lea r p h en o typ e d isp layed by th e fusion protein (top row ) but not w ith th e v e s ic u la r p h e n o ty p e (m id d le row ). T h e b lo b -like p h e n o ty p e lik e w is e d o e s not localise with 8 7 4 antibody staining and e ffective ly exc lu d es 8 7 4 from the reg ion occup ied by th e
blob (low er row). D A P I stain in blue. Bars, 20 ju.m.
121

DE2 antibody staining partially overlaps with the fusion protein
M e rg e
D E 2 staining R eticu la r/p eri-n u c lear
D E 2 staining R eticu lar/p erinuc lear/ves icu lar
__________D E 2 staining__________________Blob-like ag g reg a tes________F ig u re 6 .5 . D E 2 stain ing of C o s -7 cells exp ress in g th e N T M P S 1 fusion pro te in . D E 2 p artia lly o verlap s with th e p eri-n u c lear and b lob-like ag g re g a te p hen o typ e but not th e re ticu lar or v es icu la r
phenotype. D A P I stain blue. Bars, 20 jim . 1 2 2
D E 2 staining R eticu lar/ves icu lar

50 ng each of the Ap peptides. To ensure sufficient recovery of APP, three
different volumes of DP23/2 were used. The resulting supernatant was then
immunoprecipitated for a third time with the AB10 antibody in order to recover
the A(3 peptides (figure 6.8 b).
Samples were immunoblotted with DP23/2 (lanes 2-5) and AB10 (lanes
7-9). Strong immunoreactivity was seen in lanes 2-4, but whether this smear
represents APP is unclear. Presumably AB10 and D P 23/2 APP staining
intensities should be approxim ately equal. APP staining in lanes 7-9
representing the third immunoprecipitation is less intense compared to figure
6 .7 a , indicating that som e A P P had been rem oved by serial
immunoprecipitation. As expected DP23/2 does not stain A p 40/A p 42 (lane 5),
unlike the AB10 antibody (lane 10). No synthetic A(34o/Ap42 was detected by
AB10 in those sam ples thrice imm unoprecipitated even though APP
immunoreactivity had decreased.
In the current investigation Tris buffer and anti-mouse beads had been
used to immunoprecipitate APP, whereas RIPA buffer and protein-A beads had
been specified in the protocol developed by Wiltfang et al, who previously
described immunoprecipitation of APP derived Ap (Klafki et al, 1996; Wiltfang et
al, 1997). The current protocol was therefore modified to take account of the
original conditions in which Ap was immunoprecipitated. In addition to the above
protocol modifications, the complete media containing Ap peptides was reduced
and alkylated since the DP23/2 antibody displays greater immunoreactivity for
reduced/alkylated APP.
Following modifications to the immunoprecipitation protocol, complete
media containing 50 ng Ap peptides was immunoprecipitated with protein-
A /D P 2 3 /2 or IgG b ead s/A B 10 in R IP A or Tris buffer following
reduction/alkylation. Samples were immunoblotted with the AB10 antibody.
Overall, the modified protocol had little effect on the am ount of APP
im m unoprecip itated. Sim ilarly, under the changed conditions Ap
immunoreactivity was not detected (figure 6.8).
The earlie r encounter with the 923 antibody whilst useful for
imm unofluorescence imaging defied attempts at W estern blotting and
immunoprecipitation. Similarly the AB10 antibody whilst able to detect both
APP and the Ap peptides would not immunoprecipitate Ap. In conclusion, the
123

D e tection of synthetic A p peptides by bicine S D S /P A G E
a. b.AB10 antibody dilution AB10 (1:3)
1:1 1:3 1:10 1:30 1 2 3 4 5 6 7M H H H I
/— 4.0
! • . V ' ■■ S> ' ...
•
4 .0—kD
jS jS |
10 50n g 10 50n g 10 50n g 10 50n g 1blue 1ng 5 10 2 5 5 0 50n g
Q u an tiy of peptide (ng)
1 :10 1 :25A B 1 0 antibody dilution
1:50 1:75 1:50K
v \
2 5 50n g 2 5 50n g 2 5 50n g 50 2 5 10 5ng 5 0 2 5 10 5ng
1 :200 1 :400 1 :50 1 :100 1 :2 0 0 1 :4 0 0 1 :800
5 0 2 5 10 5ng 50 2 5 10 5ng 5 0 ng m ixture
Q uantity o f peptide m ixture (ng)
d. AB10 antibody dilution
1:200 1 :400 1 :800 1 :1 6 0 0 1 :3 2 0 0
5 0 ng peptide m ixture
F ig u re 6 .6 . D etection and sep ara tio n o f synth etic A(340 and A(342 p ep tid es by b icine S D S /P A G E . a . D etection of A p 40 (1 0 and 5 0 n g ) by im m unoblotting w ith A B 1 0 (1 :3 0 ). b. D e tec tio n o f A(3 p ep tid e (1 -
5 0 ng) by im m unoblo tting w ith A B 1 0 (1 :3 ). c. R eso lu tio n o f vary ing a m o u n ts o f p e p tid e m ix tu re im m u no b lo tted with A B 1 0 (1 :1 0 -1 :8 0 0 ). d. D e tec tio n o f 50 ng p ep tid e m ixture by E C L . P e p tid e s reso lved by S D S 10% U re a B icine gel. S a m p le s im m u nob lo tted with p rim ary an tib o d y A B 1 0 and d etected by a lka lin e p ho sp h atase (a -c ) o r H R P (E C L ) seco nd ary antibody (d).
124

Im m unoblotting o f conditioned media detects secreted A P P 7 7 0 but not synthetic orsecreted A(3 peptides
a.
Lanes:
113
kD
4 —
- APP
)> igGlight/heavy chains
— A p 4 o /A p 4 2
M a rk e r proteinC o m p le te m ed ia - no trea tm en tC onditioned, co m p le te m ed iaControl, co m p le te m ed ia + 50n g synthetic A(34o/A(342
Control, 50n g synthetic A f W A ^S u p e rn a ta n t from C H O -A P P 770 transfected with p N T M P S 1 -E G F P S u p e rn a ta n t from C H O -A P P 770 transfected with p F L P S 1 -E G F P S u p ern a tan t from C H O -A P P 770 transfected with p F L M P S 1 -E G F P 1 b lue m arker
b.
A P P -- A P P
A P 4 2 /
A P 4 0
Lanes: 1 . M a rk e r protein 6 . M a rk e r protein2 . 3 pi D P 2 3 /2 7. 3 pi D P 2 3 /23. 6 pi D P 2 3 /2 8 . 6 pi D P 2 3 /24. 12 pi D P 2 3 /2 9. 12pl D P 2 3 /25. 50 ng A P40/A P 42 1 0 . 5 0 ng A P40/A P 42
Figure 6 .7 . a. Im m unoprecip itation o f A p 4o/Ap42 from stab le C H O /A P P cell su p e rn a ta n t using
a n ti-A P P antibody A B 1 0 . S a m p le s im m unoblo tted w ith A B 1 0 (1 :1 0 0 ). T ran s fec tio n o f C H O - A P P 770 cells w a s confirm ed by fluo rescen t m icroscopy, b. Im m unoblotting o f co m p le te m ed ia contain ing 5 0 ng A(3 p eptides. S a m p le s tw ice im m u no prec ip ita ted w ith D P 2 3 /2 , fo llo w ed by
a third im m uno p rec ip ita tio n w ith A B 1 0 . T h re e d iffe ren t D P 2 3 /2 vo lu m es w e re used fo r the first tw o im m u no p rec ip ita tio ns . S a m p le s im m u no b lo tted w ith D P 2 3 /2 (1 :1 0 0 0 ) la n e s 2 -5 o r A B 1 0 (1 :1 0 0 ) lan es 7 -1 0 . N ote , as exp ected both D P 2 3 /2 and A B 1 0 stain A P P 7 7 0 , w h e re a s D P 2 3 /2 does not recognise A p 4o/Ap42. S am p les reso lved by S D S 10% U rea B icine gel.
125

Ap immunoreactivity absent following modifications to immunoprecipitation protocol
a.
R edu ced /A lky la tedB uffer
+Tris
P ro te in -A + -
R IP A Tris R IP A
— A P P
— 4 k D
D P 2 3 /2
R ed u ced /A lky la tedB uffer
+Tris
IqG b eads
Tris R IP A
- A P P
— 4 kD
AB10
Fig u re 6 .8 . C o m p le te m ed ia conta in ing 50 ng A |340/A(342 w a s im m u n o p re c ip ita te d u n d er
vary ing cond itions. S a m p le s im m u n o p re c ip ta te d by D P 2 3 /2 (a ) and A B 1 0 (b ). S a m p le s resolved by S D S 10% U rea Bicine gel and im m unoblotted with A B 10 .
126

bicine SDS PAGE gel system is able to resolve an admixture of Ap4o and A(342
peptides detectable in nanogram quantities by the anti-APP/Ap antibody AB10
using AP or HRP secondary antibodies. The inability of the AB10 to
immunoprecoipitate Ap from solution or conditioned media would suggest that
this antibody is epitope conformation specific.
6.7 Selection of HEK293 cells stably expressing full length and truncated
PS1-EGFP
Several attempts at cloning a stable Cos-7 cell line expressing the truncated
fusion protein failed. This lack of success was considered to be due technical
difficulties, however in light of the earlier observation that ER and Golgi markers
are severely reduced in transfected Cos-7 cells, it is feasible that cells may be
unduly stressed by the presence of the fusion protein. As a consequence, over
expression of the fusion protein may be associated with toxic events that trigger
a variety of cellular responses, such as apoptosis, thereby reducing the
chances of selection. The extent to which a cell is affected by stress varies
depending on the cell type and the cellular response elicited by the stressor. For
instance, HEK293 and Neuro2a cells have been characterised as ‘robust’ and
less susceptible to ER stress compared to other cell types such as Cos-7 cells
(Imaizumi et al, 2001). The selection procedure was therefore repeated with
the more robust HEK 293 cell line on account of their availability and their ease
of transfection as evidenced by earlier transfection experiments.
HEK293 cells were transfected with FLPS1-EG FP and N TM PS1-EG FP
cDNAs as described previously. Transfectants were treated with G 418 and
resistant colonies were trypsinised and diluted into a 96 well plate to yield
individual clones. Confluent wells were split onto coverslips and analysed by
fluorescent microscopy. Several stable cell lines expressing varying levels of
the fusion proteins were obtained. The phenotypes displayed by the full length
and truncated fusion proteins were typically reticular-like with dispersed
circumnuclear, blob-like aggregates and vesicles (figure 6.9). Noticable was the
absence of a phenotype typical of the Golgi apparatus in any of the cells
imaged. Whilst the absence of a Golgi phenotype had been previously
observed in cells transiently expressing the full-length proteins, the absence of
this phenotype in NTM PS1-EG FP clones was unexpected. However, unlike
127

Cos-7 cells, which have a flattened, fried-egg-like appearance and are therefore
ideally suited for microscopy, HEK293 cells due to their rounded-up morphology
are more difficult to image, therefore the presence of a Golgi phenotype cannot
be entirely ruled out.
The overall fluorophore intensity of all the stable expressers was
considerably weaker compared to transient transfected Cos-7 or HEK293 cells.
On average a gain of +12/+18 was required to capture a given field of cells by
the CCD camera. The fusion proteins in the N TM P S1-EG FP cells shown in
figure 6.9 (top panel) have uniform fluorophore intensity, unlike some clones,
which varied considerably such that neighbouring cells appear not to express
the fusion protein (see figure 6.9, middle and lower panels). A simple
explanation for the heterogeneity in protein levels is that these cells are in fact
not clones, more than likely due to technical limitations. Less likely, levels of
the fusion protein may vary significantly depending on the degree of cell-cycle
synchronization amongst the cell population.
HEK293 cells stably expressing the fusion protein display the same
phenotypes as encountered previously in transiently transfected cells, however
the overall flourophore intensity of these proteins was considerably less
compared to the transients suggesting that too high a level of the proteins may
be toxic even to HEK293 cells.
6.8 Western analysis of stable HEK293 cells expressing the fusion proteins
Western analysis of the clonal cell lines expressing the fusion protein varied in
their immunoreactivity. Immunoblotting with the anti-EGFP antibody of the
N T M P S 1-E G FP expressing cell lines (figure 6.10) shows immunoreactive
bands at ~57 kD and ~122 kD close in size with those already seen in Cos-7
cells transfected with the truncated PS1 construct (figure 4.6). The clones 1/27
and 2/23 that produce the blob-like phenotype also show immunoreactive bands
at ~150 kD (figure 6.10, lanes 11 and 13). These data suggests that HEK293
cells can tolerate the presence of the blob phenotype since clearly these cells
are able to divide. However, that these cells cannot be captured by the low
gain-settings used to capture transient transfected Cos-7 cells, would indicate
that there is a limit to the amount of fusion protein that can be tolerated by
stable HEK293 cells.
128

Immunoblotting of the FLPS1-EG FP expressing cell lines with the anti-EGFP
antibody is considerably weaker in intensity compared to the HEK293 NTPS1-
EGFP cell lines (figure 6.11, panel a, compare lane 2 with lanes 3-7). Anti-
EGFP immunoreactive bands were present at -8 8 , 55, 48, 32, and 28 kD.
Bands were close in size with those already seen in Cos-7 cells transiently
transfected with the full-length PS1 construct (figure 5 .12) however, the
immunoreactive band of -1 3 0 kD analysed from transients is absent indicating
that over expression of the full length fusion protein may not tolerated by the
cell. The immunoreactive bands at -8 8 kD is close to the calculated size
predicted for the holoprotein plus EGFP ( -8 2 kD), and indicates that a fraction
of the fusion protein does not undergo proteolysis. The fraction that does
undergo proteolysis is represented by the immunoreactive band at -4 8 kD
corresponding to CTFPS1-EG FP. The remaining bands at -2 8 and -3 2 kD
may represent caspase cleavage of the full-length fusion protein known to occur
under conditions of apoptosis.
Immunoblotting with the anti-CTPS1 antibody 1039 showed multiple
immunoreactive bands in the size range -10 -150 kD (figure 6.11, panel b). The
doublet at - 2 0 kD is typical of the 1039 antibody and corresponds to
endogenous CTF. The addition of the EGFP moiety to the CTF increases the
band size to -4 5 kD, close in size to the calculated value of 47 kD for CTFPS1-
EGFP. No immunoreactive bands of this size are present in control cells and
N TM PS1-EG FP HEK293 cells (lanes 1 and 2 respectively). Present in all
samples is an immunoreactive band at -5 5 kD possibly corresponding to the
holoprotein. This is unusual since levels of the holoprotein (uncleaved FLPS1)
are normally very low or undetectable. Similarly, uncleaved FLPS1-EG FP is
present at -9 0 kD close in size to the calculated value of 82 kD. As with
CTFPS1-EGFP, the full-length fusion protein is absent from lanes 1 and 2.The
immunoreactive bands shown in lane 2 were similar in intensity to the bands
from the control in lane 1, suggesting that NTM PS1-EG FP does not displace
endogenous CTF. The higher immunorective bands at -1 5 0 kD may represent
the blob-like aggregates. The doublet bands at -1 2 kD may represent
proteolytic fragments generated as the result of physiological specific cleavage
events e.g. caspase activity (Kim et al, 1997; Kovacs et al, 1999; Van de Craen
et al, 1999), since the lower of these bands are more reactive when compared
to the control lane. Alternatively, Dewji, et al (1997) has reported that such
129

HEK293 cells stably expressing the PS1 fusion proteins
N T M P S 1 -E G F P (c lone 2 /2 3 ) expression is largely uniform in intensity b etw een cells. C ells display a m ixture of phenotypes. Bar
10|Lim.
N T M P S 1 -E G F P(clone 1 /27 ). In this clonal cell line the fusion protein is reticular but the ves icu lar/ b loblike phen o typ e predom inates. B ar 5p.m.
F u l l - le n g th P S 1 - E G F P (c lo n e 1/10). F lo u ro ph o re in tensity d iffe red b e tw e e n ce lls such th a t a lth o u g h v i s i b l e t h r o u g h t h e m i c r o s c o p e , c e l l s e x p re s s in g low le v e ls of th e fu s io n p ro te in co u ld not b e c a p tu re d by th e C C D c a m e r a . A m a x im u m G a i n o f + 1 8 w a s re q u ire d to c a p tu re this im age. B ar 10p m .
F igure 6 .9 . H E K 2 9 3 cells stably expressing F L P S 1 -E G F P or N T M P S 1 -E G F P fusion proteins. D A P I stain in blue.
130

1 2 3 4 5 6 7 8 9 10 11 12 13 14
122 -
— 116 kD — 84
— 58
Key to lanes:1. 1 blue2. Control soluble fraction3. C ontrol m em b ran e fraction4. C lo n e 1 /1 0 N T P S 1 -E G F P soluble5. C lo n e 1 /1 0 N T P S 1 -E G F P m em b ran e6 . C lo n e 2 /4 7 N T P S 1 -E G F P soluble7. C lo n e 2 /4 7 N T P S 1 -E G F P m em b ran e8. C lo n e 1 /1 4 N T M P S 1 -E G F P soluble9. C lo n e 1 /1 4 N T M P S 1 -E G F P m em b ran e10. C lo n e 1 /2 7 N T M P S 1 -E G F P soluble11. C lo n e 1 /2 7 N T M P S 1 -E G F P m em b ran e12. C lo n e 2 /2 3 N T M P S 1 -E G F P soluble13. C lo n e 2 /2 3 N T M P S 1 -E G F P m em b ran e14. 7 blue
Predicted mol w t for fusion constructs:
E G F P 2 7 kD aH oloprotein 55 kD aC -term in a l PS1 20 kD aN -term in a l PS1 35 kD aF L P S 1 -E G F P 82 kD aN T P S 1 -E G F P 62 kD a
F ig u re 6 .1 0 . W e s te rn an a lys is o f H E K 2 9 3 cells stab ly exp ress in g N -te rm in a l P S 1 - E G F P fusion p ro te in s . M e m b ra n e s im m u n o b lo tted w ith th e a n ti-E G F P an tib o d y. S o lu b le an d m e m b ra n e fractio n s a n a ly s e d by 10% S D S tr ic e n e /u re a gel. A c tu a l va lu es o bta in ed by lin ear regression an a lys is . D isc rep an c ies b e tw een ac tu a l v a lu e s and calcu lated valu es differ due to the error associated with a line o f b est fit.
131

a. 1 2 3 4 5 6 7 8
135_
5548
3228
150
90
45
22 —
12 — •
Key to lanes:
(PP116 kD
A n ti-E G F P
116 kD
mm
C a s p a s e c le a v a g e frag m en ts
1.2 .
3.4.5.6 .
7.8 .
A n ti-C T P S 1 103 9
Control m em b ran e fraction C lo n e 1 /2 7 N T M P S 1 -E G F P m em b ran e C lo n e F A C F L C -E G F P m em b ran e C lo n e 1/10 F L C -E G F P m em b ran e C lo n e J /1 1 F L C -E G F P m em b ran e C lo n e K /9 F L C -E G F P m em b ran e C lo n e T /11 F L C -E G F P m em b ran e 7 blue m arker
Predicted mol wt for fusion constructs (approx):
E G F PH oloproteinC -term in a l PS1N -term inal PS1F L P S 1 -E G F PC T P S 1 -E G F PN T P S 1 -E G F P
2 7 kD a 55 kD a 2 0 kD a 3 5 kD a 82 kD a 4 7 kD a 62 kD a
F ig u re 6 .11 W e s te rn a n a lyses o f H E K 2 9 3 cells s tab ly exp ress in g full length P S 1 -E G F P fusion protein . S a m p le s im m u no b lo tted w ith (a ) a n ti-E G F P antib o d y and (b ) a n ti-C T P S 1 an tib o d y 1 0 3 9 . B an d s c o rresp o n d in g to c a s p a s e fra g m e n ts m a y in d ic a te a p o p to tic activity. M e m b ra n e fractions an a lysed by 10% S D S tr icen e /u rea gel. o o

banding patterns are a common artifact due to the manner in which the cells are
prepared for PS1 immunoanalysis, however, extensive laddering was not
observed for samples blotted with the anti-EGFP antibody. Both the anti-EGFP
and the anti-CTF PS1 1039 antibodies show membrane-only immunoreactive
bands approximate in size with the calculated values of the NTF- and CTF-
fusion proteins.
6.9 Mannosidase staining in control cells
The previous data from transfected Cos-7 cells and stable HEK293 cells
expressing the fusion protein suggest that high levels of the fusion proteins may
be toxic/have a pro-apoptotic effect. The latter is suggested by the caspase
cleavage shown in figure 6.11, b. Previous research has implicated PS
associated apoptosis in AD and suggests that the proteolytic fragments may
have differential actions being pro or anti-apoptotic (Vito et al, 1996; Roperch et
al, 1998; Wolozin et al, 1998; Alves da Costa et al, 2002). To investigate what
effect if any, the truncated fusion protein had on apoptosis, Cos-7 cell
morphology was assessed following STS treatment of transfected and non-
transfected cells. STS is a wide spectrum kinase inhibitor that induces
apoptosis by mediating a sustained increase in intracellular calcium ion
concentration associated with mitochondrial disturbance and later to caspase
activation (Kruman & Mattson, 1999).
The general features of apoptosis are characterised by changes to the
cell morphology including nuclear fragmentation, chromatin condensation, cell
body shrinkage, and membrane blebbing (Kerr et al, 1972). By assessing cell
morphology and nuclear fragmentation as an end point of apoptosis, transfected
and non-transfected Cos-7 cells were exposed to varying concentrations of STS
over time. A series of control experiments were carried out to first gauge the
effect STS would have on Cos-7 cells (figure 6.12). Golgi morphology was
assessed as an indicator of cell structural integrity by examining mannosidase II
staining. Mannosidase staining is control cells was classically peri-nuclear and
tubular in appearance, whereas staining in STS treated cells is condensed and
indistinct (indicated by arrows, lower panels). At higher STS concentrations cell
body and nuclear shrinkage is widespread indicating that all cells have entered
apoptosis.
133

6.10 The NTM PS1-EG FP sensitizes Cos-7 cells to STS-induced apoptosis
Using the above criteria for assessing apoptosis the previous experiment was
repeated this time with Cos-7 cells transfected with the N TM P S1-EG FP
construct. The number of transfected cells showing apoptosis was expressed as
a percentage of the total number of cells exposed to STS (figure 6.12 and table
6.0). Staurosporine-induced apoptosis was appreciably greater in transfected
cells expressing NTM PS1-EG FP compared to control (no treatment) and non
transfected STS-treated cells for all concentrations, with the maximum effect
seen after 280 min (figure 6.13, 2pM STS). The number of apoptotic cells
increased in a time dependent manner for both cell populations in response to
treatment with 2pM STS, though the increase in transfected cells was greater at
all time points compared to the non-transfected, STS-treated cells.
T a b le 6 .0 . D a ta for s taurosporine trea tm en t of N T M P S 1 -E G F P tran s fec ted C o s -7 cells. T h e n u m b er o f tran s fec ted cells show ing apoptosis w a s exp re s s e d as a p e rc e n ta g e of the total n u m b er of cells exp osed to S T S . S e e text for criteria used to assess apoptosis in S T S -tre a te d cells.
Control non STS-treated, non-transfected Cos-7 cells
No. of cells No. apoptotic % apoptotic
347 29 8
0.5 uM STS
Exposure to
STS (min) Total no. of cells No. apoptotic cells % apoptotic No. of transfectants No. apoptotic % apoptotic
70 min 233 35 15 47 28 60
140 min 248 37 15 46 29 63
280 min 241 42 17 74 48 65
1.0 uM STS
Total no. of cells No. apoptotic cells % apoptotic No. of transfectants No. apoptotic % apoptotic
70 min 629 77 12 61 36 59
140 min 681 75 11 71 41 58
280 min 402 58 14 75 48 64
2.0 uM STS
Total no. of cells No. apoptotic cells % apoptotic No. of transfectants No. apoptotic % apoptotic
70 min 302 73 24 70 35 50
140 min 389 117 30 65 40 61
280 min 172 73 42 44 33 75
134
6.11 Staurosporine induced apoptosis in N TM P S1-EG FP expressing NRK
cells show increased Grasp65 cleavage compared to untransfected cells
Although the above experiment represented an n=1, the results suggest that the
PS1 fusion protein sensitizes the cells to STS-induced apoptosis above that
observed for STS-treated, non-transfected cells. One criticism, however,
concerning the design of this experiment is that changes in cell morphology
were measured as an end point of apoptosis. A more definitive experiment
would be one in which the early events of apoptosis could be measured in cells
transfected with the fusion protein. One such early event in the execution stage
of apoptosis is the caspase-3 mediated cleavage of the cis-Golgi stacking
protein G RASP65 (Golgi reassembly and stacking protein of 65 kD). During
mitosis and apoptosis G R A SP65 cleavage results in the Golgi ribbon
fragmenting into tubulo-vesicular membranes (Barr et al, 1997; Lane et al,
2002).
To investigate what affect the fusion protein had on the early events of
apoptosis in transfected cells was measured using a monoclonal anti-GRASP65
antibody (gifted by M. Lowe). The GRASP65 antibody was used to assess
GRASP65 staining in transfected and untransfected NRK cells following STS
treatment. Cells affixed to coverslips were treated over 4 hours with 1 p,M STS
at 37°C, and prepared for immunofluorescent microscopy. Figure 6.14 shows
GRASP65 staining as a peri-nuclear ribbon in transfected and untransfected
cells. Two transfected cells show a reduction in G RASP65 staining similar to
the decrease seen for the other compartment markers. The bar chart in figure
6.15 show the number of STS-treated transfected G RASP65-negative cells
expressed as a percentage of the total number of non-transfected STS-treated
cells. Figure 6.15 shows a dose-dependent relationship between staurosporine
exposure and Grasp65 staining in both transfected and untransfected NRK
cells. This loss in staining is more statistically significant in cells expressing the
fusion protein compared to control cells treated with or without staurosporine
(figure 6.15 and table 6.1). Though not statistically significant, apoptosis was
nonetheless greater in control-transfected cells compared to non-transfected
control cells indicating that the fusion protein may have a small pro-apoptotic
effect.
135
For W estern analysis, STS treated NRK whole cell lysate was
immunoblotted with a G RASP65 polyclonal antibody (figure 6.16). Whilst
Grasp65 cleavage is clearly evident in STS treated NRK cells processed for
immunoflourescent microscopy (figure 6.14), G R A SP65 cleavage was not
detected by imm unoblotting in S TS -treated NRK cells. Instead an
immunoreactive band was identified at ~66 kD corresponding to uncleaved full-
length G RASP65. Lane et al, (2002) have previously shown that the anti-
Grasp65 antibody stains immunoreactive bands at approximately 50, 45 and 40
kD corresponding to caspase-3 cleavage fragments. Although G RASP65
cleavage was not detected, the overall immunoreactivity was nevertheless
weaker in control (no STS) transfected and STS-treated-transfected cells (figure
6.16, lanes 5-8), compared to STS-treated non-transfected cells (lanes 2-4),
consistent with the previous observation that the fusion protein reduces
antibody staining to some cell compartment markers, in this case, cis-Golgi
GRASP65 staining is affected.
The failure to demonstrate GRASP65 cleavage by immunoblotting may,
in part, be due to different experimental techniques. In this experiment crude
cell lysate was prepared from NRK cells exposed to 1 jum STS for 4 hours. The
concentration of STS and the length of exposure were determined by the
immunofluorescence microscopy data, which showed reduced G RASP65
staining after 4 hours in the presence of 1 jiM STS. G RASP65 cleavage has
previously been demonstrated in a cell-free system where apoptotic Hela cell
lysate was prepared by treatment with cytochrome c, a potent apoptotic inducer
(Lane et al, 2002). Here, apoptotic cytosol was incubated with purified rat liver
Golgi membranes for various times at 37°C. Immunoblotting of these samples
showed major proteolytic fragments one hour after incubation. In the current
experimental set-up, G RASP65 would have been cleaved following STS
treatment, however, the caspase-generated fragments would have been
exposed to the action of several additional cellular proteases during apoptosis,
hence full length membrane-bound GRASP65 was detected by immunoblotting,
but not its proteolytic fragments.
136

6.12 Chapter summary
In summary, co-localisation experiments with antibodies to APP and p-catenin
show little or no co-localisation with the NTF fusion protein consistent with the
notion that the full-length molecule, as an entity is necessary to bind with p-
catenin and APP. In a sub set of cells expressing the fusion protein there was
an appreciable reduction or absence of antibody staining directed at some
markers for the ER and Golgi indicating fragmentation of these compartments.
Furthermore, Western analysis of PS HEK293 clone cell lines indicates the
presence PS caspase cleavage fragments suggesting toxicity or an apoptotic
event associated with the fusion protein. Moreover, the truncated fusion protein
significantly sensitises Cos-7 and NRK cells to apoptotic stimuli, in this case
following STS treatment.
137

Cell shrinkage and altered Golgi morphology occurs following staurosporine treatment of Cos-7 cells
138
Figure 6 .12 . Effect of varying stauroporine concentrations on Cos-7 morphology over time. Golgi morphology was assessed as an indicator of cell structural integrity by examining Mannosidase II staining (red). Mannosidase staining in control cells is distinctly p erinuclear and tubular in a p p e a ra n c e , whereas staining in STS treated cells is dense and indistinct (a rro w s). At higher S T S concentrations cell body and nuclear shrinkage is w id espread. D API stain in blue. Bars, 20p m .

Cell shrinkage and altered Golgi morphology occurs following staurosporine treatment of Cos-7 cells
138
Figure 6 .12 . Effect of varying stauroporine concentrations on Cos-7 morphology over time. Golgi morphology was assessed as an indicator of cell structural integrity by examining Mannosidase II staining (red). Mannosidase staining in control cells is distinctly p erinuclear and tubular in a p p e a ra n c e , whereas staining in STS treated cells is dense and indistinct (a rro w s). At higher S T S concentrations cell body and nuclear shrinkage is w idespread. DAPI stain in blue. Bars, 20p m .

The NTMPS1-EGFP fusion protein sensitizes Cos-7 cells to staurosporine-inducedapoptosis
0.5 UM STS
80o8 60 Q.OQ.CO 4 0CO
20 -
0 -L
□ Non transfectants
m Transfectants
□control 70 min 140 min 280 min
Time
70 j
60 -oo 50 -Q_o 40CDm 30 8 20
° 10
0
1.0 MM STS
□ Non transfectants
H Transfectants
Elcontrol 70 min 140 min 280 min
Time
80 j70 -
■| 60
f 50 w 40 - I 30 -
5 20 100
2.0 MM STS
□□ Non transfectants
m Transfectants
control 70min 140 min 280 min
Time
F ig u re 6 .1 3 . S ta u ro s p o rin e (S T S ) tre a tm e n t (0 .5 p M , 1 .0 p M , 2 .0 p M ) o f C o s -7 ce lls expressing the tru n cated fusion protein o v e r tim e. T h e n u m b er of d ysm o rp h ic ce lls show ing cell body sh rin kag e and n u c lea r frag m en ta tio n as an end point o f ap o p to s is w a s g re a te r in tra n s fe c te d ce lls co m p ared to control n o n -tra n s fe c te d cells. S e e te x t fo r c rite ria used to assess apoptosis.
139

STS treatment reduces GRASP65 staining in transfected and non-transfected NRK cells
140
Figure 6 .1 4 . G R A SP65 staining of p N T M P S 1 -E G F P transfected NRK cells treated for 4 hours with 1 |iM stau ro sp orin e . G R A S P 6 5
staining does not localise with the fusion protein. Notice that in two cells expressing the fusion protein G R A SP65 staining is red u ced
(arrows) or fragmented in control cells. DAPI stain in blue. Bar, 10 |a,M.

The fusion protein sensitises NRK cells to STS induced apoptosis
CDO)0c
LOCOCLC/3CDi_ow
90 i
80
■■S 70
6 0 -j
50
4 0
= 30
20
10Mmm
control
□ N on transfectan ts
N T M P S 1 -E G F Ptransfectan ts
1 2
Exposure to STS (hours)
F ig u re 6 .1 5 . Q u an tita tio n o f G ra s p 6 5 stain ing o f p N T M P S 1 -E G F P tra n s fe c te d an d u n tra n s fe c te d N R K ce lls tre a te d w ith 1 p M s ta u ro s p o rin e o v e r 4 h o u rs . B ars
re p re s e n t th e m ean ± S E M (n = 3 -4 fo r each tim e point). U sing the s tu d en ts t-tes t th ere w a s a s ignificant d ifferen ce in th e n u m b er o f apop to tic S T S -tre a te d , tran sfec ted cells c o m p ared to S T S -tre a te d , n o n -tran s fec ted cells . * P < 0 .0 5 and * * P < 0 .0 0 6 5 vs. non -transfected , G R A S P 6 5 n egative cells within the s am e tim e point.
T a b le 6 .1 . S u m m a ry o f d a ta fo r G ra s p 6 5 sta in ing o f p N T M P S 1 -E G F P tra n s fe c te d (tfx) N R K cells tre a te d w ith 1p M stau ro sp orin e . D a ta rep resen ts G ra s p 6 5 n eg a tiv e
cells (% ).
Expt No.Control 1 H our 2 Hours 4 H ours
N on T fx Tfx Non Tfx Tfx N on T fx T fx N on T fx T fx
1 10 13 2 2 51 2 6 51 3 6 782 23 2 7 3 5 43 2 5 58 21 6 73 8 30 14 6 3 - - 5 7 924 7 14 2 2 42 38 81 56 81
M e a n 12 .0 2 1 .0 2 3 .3 4 9 .8 2 9 .7 6 3 .3 4 2 .5 7 9 .5
S T D E V 7 .4 4 8 .7 6 8 .6 9 9 .71 7 .2 3 1 5 .7 0 1 7 .2 9 1 0 .2 8
141

Grasp65 cleavage is not detected in staurosporine treated NRK cells expressingthe NTM PS1-EG FP fusion protein
a.1 2 3 4 5 6 7 8 9
kD
66 _
- 84
58
kD
Lanes: 1. Control non transfected, no STS2. 1|llM STS for 1 hour3. 1pM STS for 2hour4. 1|llM STS for 4hour5. Control transfected no STS6. Transfected 1pM STS for 1hour7. Transfected 1 jllM STS for2hour8. Transfected 1pM STS for 4hour9. 7 blue marker
Figure 6.16. a. Polyclonal Grasp65 immunoblotting of whole cell lysate taken from NRK cells expressing the N TM P S 1-E G FP fusion protein following treatm ent with 1pM staurosporine (STS) over 4 hours. Unusually, transfected cells (lanes 5-9) show less GRASP65 immunoreactivity compared to control, non-transfected cells (lanes 1-4). This is in keeping with the earlier observation that overexpression of the fusion protein reduces some ER and Golgi markers. 8% SDS PAGE gel. b. Corresponding coomasie gel showing approximate equal sample loading per lane.
142

Chap ter 7 Functional and morphological characteristics of the blob phenotype
7.0 Introduction
In the previous chapter it was demonstrated that transfected cells show altered
antibody staining within the ER and Golgi compartments and increased
susceptibility to apoptosis. In this section, concerns that the phenotypes
exhibited by the fusion proteins were in fact a direct result of the EGFP moiety
were addressed. Lastly, because of their unusual morphology the nature of the
blob-like aggregates was further investigated by im m unofluorescent
microscopy, immunoblotting, and electron microscopy.
7.1 Introduction of an in-frame STOP codon between PS1 and EGFP cDNA
Before investigating further the properties of the fusion proteins, the role of the
EGFP moiety in generating the fusion protein phenotypes was first investigated.
Although there is little evidence to suggest that the EG FP tag affected the
distribution of the fusion protein, it was necessary to consider whether or not the
phenotypes were an artefact induced by the EGFP moiety. Because of the
similarity of the phenotypes generated by all four constructs, mutant and non
mutant NTPS1 and CTPS1 proteins minus the EGFP moiety were constructed.
To achieve this, an oligo-linker sequence containing a STOP codon (TGA) was
ligated into the open reading frame between position 1427 for full-length PS1
and position 827 of NTPS1, and the start of the EGFP cDNA sequence (figure
7.0). Transcription of these constructs should therefore terminate after the
STOP codon thus generating full-length and truncated proteins devoid of the
EGFP moiety. To aid in the selection of putative clones, a Pst1 restriction site
not found within the existing constructs was introduced into the oligo-linker
sequence. PS1 cDNAs from putative clones transformed by the PS1-STO P
constructs were screened by restriction digestion analysis (data not shown).
The purified plasmids were then used for the transfection of Cos-7 cells. To
analyse PS1 expression in Cos-7 cells, the NTF antibody NT7 and the CTF
antibody 1039 were used for immunofluorescence and immunoblotting.
144

LDmLT)cn
llco LU
£ o
LL
LL
XQ.
cn ° Q_C —o CO T3 C Q cCD fH-
<D CN "V h~ ^ CO
LDLT) ro
C 73 CO CD
S E.E £CD ~
O WQ- I2 < 0 O•2 b j= c£ o
-oCO O c o w nCO U-p o 0.1- X(nCDmTdo>»
XT3CD
CO05CCOoX
w O>> o ro cX CO 73
CD O C CD O CT
-rr CD O CO
0a .
X !OX J
0
1_0
_c—r o05
OcCD
>,0 0o XE
CLLL
■O0S—
5 0 CO•2>u0 LU CO0 P> 0 OC X E -*-* Q)n H - =5 P o c r r~ 0■ 2 W 0 °
O o < c 0 z 0 0 O =3 0 aS ' q - 11-0 Li.W 0 a
LU
"c ^ '" a.E -Q c O -a ro05 S ^
— CO X n >- Q . ^ CD
C CD ^ 0 x0 5 ~
(h- C
§ 1 1 .!?-£ 0 LL CO X
0
b= -O CO
I s E_ 0 13
CO o O•- -S *2o ro o
W m"o co S3 0 ^ E05 0 00 ” 7 -E0
■o c 0 .2 0 o 05
c
. 0 h: < 0 o Z oo ^ 2O C £ ro
CL O 3 LL O oo wLU ^^ IZ 0 0 *!“
£ EM— CO O CD
0CO-*-< -b-l >0
® 3 o+= c o
o -*-*c 0 COCO 0
W e> ? CL LU ~0 n (0
■B O c Hr I— E ° W <"Oc00
W ^ CL 73
0
> == CO 0 0 +± "O® X C
0 o _X X 05 0 C c O o ■= =J
■° m O m Pc 0
o 0 oX
oto
CO "T0
0E .E 04= !2 c ro
•“ o c h- co05C C _• - 0 j= CO 05 0O 2 0 a ± :
o c T_Oo CO
— V) Clco -g 0 c coE 0 to" 0 t-H a co
145
inst
ruct
ions
. B
rief
ly,
19.2
nm
oles
pr
imer
P
stpO
l (4
7.5
pi)
and
25.4
nm
oles
pr
imer
Ps
tp02
(4
7.5p
il)
wer
e in
cuba
ted
toge
ther
wi
th
10p.
l 10
X
anne
alin
g bu
ffer
(0.5
M
Tris
H
cl
(pH
7.5)
, 2.0
M
NaC
I, 0.
25
M E
DT
A)
at
65°C
fo
r 10
min
utes
, th
en
for
a fu
rthe
r 2
hour
s at
ro
om
tem
per
atu
re.
The
anne
aled
do
uble
st
rand
ed
linke
rs
wer
e lig
ated
int
o the
do
uble
di
gest
ed
fusi
on
cons
truc
ts
usin
g T4
lig
ase.
C
on
firm
atio
n
of
the
linke
r in
sert
ion
was
esta
blis
hed
follo
win
g re
stric
tion
enzy
me
anal
ysis
of
the
co
nstr
ucts
.
7.2 Removal of the EFGP moiety does not alter the phenotypes displayed by
cells expressing truncated or full-length PS1
Cos-7 cells transfected with the pNTPS1-STO P, pN TM PS1-STO P, p F L P S I-
STOP or pFLM PS1-STO P constructs displayed identical phenotypes to those
exhibited by the fusion protein i.e. reticular, peri-nuclear, vesicular and blob-like
aggregates (figure 7.1). Similarly, the transfection rates for the new constructs
were approximately the same as those observed for the fusion proteins. The
overall fluorescent intensity of the full-length constructs was less compared to
those cells expressing the NT-STOP constructs. As was the case for the full-
length PS1-EG FP fusion proteins, it was necessary to maximise the camera
gain in order to capture images of the cells expressing full length-STOP-PS1.
Moreover, staining of the full-length-STOP proteins with the anti-PS1 antibodies
did not reveal an obvious peri-nuclear phenotype, consistent with that already
observed in cells expressing the full-length fusion proteins. Endogenous
staining with NT7, however, reveals a punctate and a peri-nuclear phenotype
(figure 7.1, first panel).
As expected, cells expressing the PS1-STO P proteins did not exhibit
EGFP fluorescence or stain with the anti-EGFP antibody (data not shown).
Also, the anti-CTF antibody 1039 similarly failed to stain the N TFPS1-STO P
fusion proteins (data not shown). Noticeably, cells expressing the full-length
PS1 STOP constructs, whether stained with the NT7 or 1039 antibodies, all
show similar phenotypes (figure 7.1). W hether this indicates that the two
fragments form blobs separately or represent full-length (uncleaved) PS1 is
unclear. Ideally, this issue could be resolved by double immunolabelling using
an anti-mouse PS1CTF monoclonal antibody and the NT7 rabbit polyclonal
antibody.
7.3 Western analysis of soluble and membrane fractions prepared from cells
expressing full-length and truncated PS1-STOP proteins
Membrane and soluble fractions prepared from cells transfected with the four
PS1-STO P constructs were immunoblotted with the NT7 and 1039 antibodies
(figure 7 .2). As expected, the soluble cell fraction did not show any
immunoreactivity to the NT7 antibody. Membrane fractions taken from cells
146

transfected with the four PS1-STOP constructs show similar immunoreactivity
profiles following NT7 staining (figure 7.2, a). Bands common to all four
samples are shown at approximately 31, 33, 57, 73 and 83 kDa. The latter two
bands may represent dimerised or aggregated protein. The bands at -5 7 kDa
are close in size to the holoprotein, whilst all samples show a doublet at -3 2
kDa, close in size to the NTF fragment. Significantly, the bands at -2 8 and 66
kDa are absent from the FL-STOP samples. The higher weight bands suggest
that the NTFs are more susceptible to aggregation compared to the full-length-
derived NTF, possibly indicating that a disturbance in the 1:1 (CTF:NTF)
stoichiometry results in aggregation of the NTF fragment. The smaller bands at
-2 8 kDa could be the result of caspase cleavage of the NTF or due to the
manner in which the cells were prepared for immunoanalysis (lanes 6 and 8).
Overall, the immunoreactivity of the full-length samples in lanes 2 and 4 were
generally weaker compared with the NT-STOP samples.
Membrane fractions taken from cells transfected with the four PS1-STOP
constructs also show similar immunoreactivity profiles following 1039 staining
(figure 7.2, b). Bands common to all four samples plus the control membrane
fraction range in size from approximately 11 to 134 kDa. The bands at -2 0 /2 2
kDa and -5 2 kDa are close in size to the CTF and holoprotein, respectively.
Overall, immunoreactivity in cells expressing the transgene is higher when
compared to endogenous levels of the protein (lane 1). This observation is in
keeping with previous studies that show that over expression of transgene PS1
results in a modest increase in steady state levels of PS1 (Thinakaran et al,
1996). As before, bands corresponding in size to the caspase fragments
appear at approximately 11 and 13 kD in control as well as transfected cells,
however, the immunoreactivity is significantly greater in fractions taken from
transfected cells. This is data is consistent with the CTF undergoing alternative
cleavage by caspase-3 (Kim et al, 1997; Podlisny et al, 1997; Kovacs et al,
1999).
7.4 Analysis of the cell compartment in which the fusion protein resides
Transfection of the fusion protein constructs both full-length and truncated
consistently display the same overall phenotype in several different cell lines. In
particular, the blob-like aggregate phenotype appears to dominate, forming
numerous pleimorphic bodies varying in both size and number. Western147

The
fusi
on
prot
ein
phen
otyp
es
are
not
an
arte
fact
du
e to
the
pres
ence
of
th
e EG
FP
mo
iety
• 0 CO <D CL O
a i>. ®
-Q Q -
TD 0 0 _ CO £=3. *
Q)"co
0 t)CD £
oc CO CD-C wCL CO
CDO > 0(D
2 ^ 0) ^
0 -O -C 0
co jS
0
CO“ o
00o>toE
0-t—> CIo - =3 E■is 10 c «8 ^
Q_ O
o 03 LU O
O LU I—CO 0 cCOCL o-C Q .
» § ® Io l- O 0) 0 -Cc
-O
. Q_0 oo I—
0 £E 05 o cV 0
I- _z 30
E £ 0 oSC. 0 Q - O
0 o0 !_
= 0 0 "Oo o
c
c'0O)0s—0E0o0
.c 0 — ’0 0 0) w
0
0 0
T ££O CD
O
03 -*->
■ I s0 —rz, 0 0 o
g 0
Eo 0 o 0c- 0 £ O03 0 C C 0) 03 —L 03 5M—CD ”£ 0 M— .EO 0)
20 Q.1 s£=
- 0"Oc0
0c'0oi_Q .
0
o CD0 LU
O CL =5 O .03 (-
LL CO
I - CO . CL
0 c Q- £ > , 03
8 1 0 _L-E 3
00s_0>o-O0Z3
148
with
A
lexx
a 59
4 (r
ed)
or
Ale
xxa
495
(gre
en)
seco
ndar
y an
tib
od
ies.
D
AP
I st
ain
in bl
ue.
Bar
s,
20
pm
.

149

Western analysis of PS1-STOP proteins
a.4 5 6 7 8
kDa- 9 0
- 7 3 - 6 6
— 57
_ 3 3 I 31 — 28
NT7 antibodystaining
Lanes:1. sol. fraction F L -S T O P2. m em b. fraction F L -S T O P3. sol. fraction F L M -S T O P4. m em b. fraction F L M -S T O P5. sol. fraction N T -S T O P6 . m em b. fraction N T -S T O P7. sol. fraction N T M -S T O P8 . m em b. fraction N T M -S T O P
b.2 3 4
— 134 kDa
— 95
— 52
_2220
— 13 caspase — 11 fragments
1 0 3 9 antibody staining
Lanes:1. C ontrol n o n -tran sfected2. F L -S T O P3. F L M -S T O P4. N T -S T O P5. N T M -S T O P
Predicted mol w t for fusion proteins (approx):
PS1 holoprotein 55 kD aN -term in a l PS1 frag m en t 35 kD aC -te rm in a l PS1 fragm ent 2 0 kD a
F ig u re 7 .2 . W e s te rn an a ly s is o f fu ll-len g th and tru n c a te d P S 1 -S T O P p ro te in s , a . N T 7 im m u n o sta in in g o f so lu b le and m e m b ra n e cell fraction s , b. 1 0 3 9 im m u n o sta in in g o f cell m e m b ra n e fra c tio n s . S a m p le s a n a ly s e d by 1 0 % S D S /u re a P A G E g e l. B a n d s iz e s estim ated by lin ear regression.
150
analysis of transfected cells demonstrates that these blobs are associated with
the insoluble/membrane fraction. Given their general morphology, the blobs
are either insoluble aggregates or membrane-sheathed structures derived
from the cell compartment. An intuitive guess regarding their genesis might
consider the fusion protein accumulating over time eventually resulting in
‘swellings’ of the ER or Golgi, or some other membrane derived organelle.
Alternatively, the blobs may be the result of vesicles undergoing successive
fusion events with one another, assuming membrane kinetics allow for such a
process. A parsimonious explanation is that the blobs are cytoplasmic
aggregates.
In order to justify the next investigation and address the origins of the
fusion protein blobs, it is helpful to first consider the fate of proteins trafficking
through the cell. The dogma surrounding the passage of membrane proteins (in
this instance PS1) through the cell compartment can be stated thus: (1) the
protein is first co-translationally inserted within the ER membrane. (2) Correct
folding is followed by selected packaging of PS1 into COP II coated transport
vesicles at ER transitional elements (TE- ER exit sites) either central or
peripheral. (3) Vesicles containing the cargo protein bud off from the TE. (4)
Transport vesicles lose their COPII coats and vesicles fuse together to form
vesicular tubular clusters (VTCs/ERGIC compartment) at the cis-Golgi interface.
At peripheral TE, vesicles form sm aller VTCs that constitute transport
complexes (TC) of tubulovesicles that are transported to the cis-Golgi via
microtubules. (5) Finally, especially at VTCs but also from the distal TGN,
COPI-coated vesicles are formed. COP-I vesicles return proteins by retrograde
transport thereby concentrating proteins in the VTCs (Klumperman, 2000;
Gorelick and Shugrue, 2001). Ultimately, functional PS1 is then trafficked to its
final destination, be it the synapse/plasma membrane, endosome, etc.
If the blobs arise from fragmented ER or the Golgi apparatus or are in
fact the result of fused vesicles, it is reasonable to assume that resident
proteins from these compartments may still be present. To test this hypothesis
and therefore better understand the identity of the blob-like aggregates, cells
expressing the fusion protein were stained with a variety of antibodies to the
ER, ERGIC and Golgi compartments.
151

7.5 The blob phenotype does not co-localise with antibodies to the ER, Golgi
or the ERGIC compartment.
Cos-7 and HEK293 cells expressing the N TM PS1-EG FP fusion protein were
stained with Colligin, Mannosidase II (figure 7.3) and ERG IC53 (figure 7.4, top
and middle rows) antibodies. No co-localisation with the blob phenotype was
observed. From earlier experiments it was demonstrated that BFA treatment of
cells expressing moderate levels of the fusion protein co-localise with the ER
marker Colligin but not with the ERGIC53 marker. Assuming that the blobs
were derivatives of the cis or trans Golgi complex, BFA treatment should result
in either an ERGIC or ER phenotype for the fusion protein. To investigate this
possibility HEK293 cells displaying the blob phenotype were treated with BFA
and stained with the ERGIC53 antibody as demonstrated previously (figure 7.4,
lower row). Treatment with BFA does not disperse the blob-like aggregates nor
affect their size, morphology or cellular distribution. Following BFA treatment,
moderate levels of the fusion protein redistribute to the ER, whereas ERGIC53
staining is distinctly vesicular.
An additional test as to whether the blobs originated from VTCs following
the fusion of transport vesicles was investigated by staining with the anti-
membrin antibody. Membrin is a 27 kDa integral membrane protein that serves
as a t-SNARE in ER-to-Golgi transport. T-SNAREs facilitate the fusion of ER
derived membrane vesicles with their cognate v-SNARE partner (Lowe et al,
1997). Again, no co-localisation of the membrin antibody with the blob
phenotype was observed (figure 7.5) indicating that the blob phenotype is not a
post-ER/pre-Golgi derived structure.
7.6 Altered COP II antibody staining in Cos-7 cells exhibiting the blob
phenotype
To examine whether the blobs associated with vesicles derived from the TE or
distal Golgi compartment, cells were stained with antibodies markers for COP-II
and COP-I coat proteins. p-Cop is the major component of the COP-I complex,
which is critical for vesicular traffic between the ER and Golgi and useful as a
marker for the VTCs found at the cis face of the Golgi stack, as well as the cis
Golgi itself (Oprins et al, 1993). p -CO P antibody-staining exhibits a
152

reticular/vesicular phenotype in both cell lines (figure 7.6). The difference in
size between the p-COP vesicles and the fusion protein and the absence of any
co-localisation shows that the blob phenotype neither associates with nor
affects COP-I trafficking.
COP II staining of HEK293 cells exhibits a punctate and peri-nuclear
phenotype. The CO P II antibody overlaps with the peri-nuclear phenotype
displayed by the fusion protein (figure 7.7, top row), but not with the blob
phenotype (middle and bottom row). The presence of the fusion protein
appears not to affect COP II staining in HEK293 cells, however the blob
phenotype either reduces or alters COP II staining from a peri-nuclear ribbon, to
a fragmented or diffuse/cytoplasmic phenotype in Cos-7 cells (figure 7.8).
Because of the rounded-up appearance of HEK293 cells making visual analysis
difficult, altered COP II antibody staining cannot be ruled-out entirely.
7.7 The blob-like aggregates do not associate with the Lysosomal
compartment.
Within the cell, the lysosomal and proteasomal systems are the two major
intracellular pathways responsible for the degradation of damaged or unwanted
proteins. Lysosomes are membrane-bound, acid hydrolase-containing vesicles
derived from the TGN/endosome that deal primarily with extracellular proteins,
such as plasma proteins that are endocytosed by the cell, or cell-surface
membrane proteins used in receptor-mediated endocytosis. In trying to identify
whether the blob-like aggregates were membrane-bound structures associated
with the lysosome, Cos-7 cells expressing the NTM PS1-EG FP fusion protein
were stained with the anti-lysosomal antibody LAMP-1 (lysosomal associated
m em brane protein), which stains a 10.5 kDa m em brane protein in a
characteristic ring pattern (Chen et al, 1985). LAMP-1 displays a discrete
vesicular phenotype that does not co-localise with any of the phenotypes
displayed by the fusion protein. Similarly, the blob phenotype remains distinct
from LAMP-1 antibody staining (figure 7.9), which exhibits a distinctive ring-like
vesicular phenotype (figure 7.9, insert).
153

The blob-like aggregates do not co-localise with markers to the ER or Golgi co m p artm ents
154
Figure 7.3. Colligin and Mannosidase II antibody staining of Cos-7 and HEK293 cells. Antibodies to the ER (top row) and Golgi (bottom row) do not stain the blob-like aggregate phenotype in either cell line, indicating that the blobs do not contain these marker proteins and by extension are not ER or Golgi fragm ents. DAPI stain in blue. Bars, 20 pm .

IERGIC53 does not localise with the blob-like aggregates
155
Figure 7.4. ERGIC53 antibody staining of Cos-7 and HEK293 cells expressing the NTMPS1-EGFP fusion protein. The blob-like aggregates do not stain for ERGIC53 (top and middle rows), indicating that this phenotype does not arise from the ERGIC/ vesicular tubular clusters. BFA treatment does not disperse the blob phenotype into the ER (bottom row). DAPI stain in blue. Bars, 20 |im.
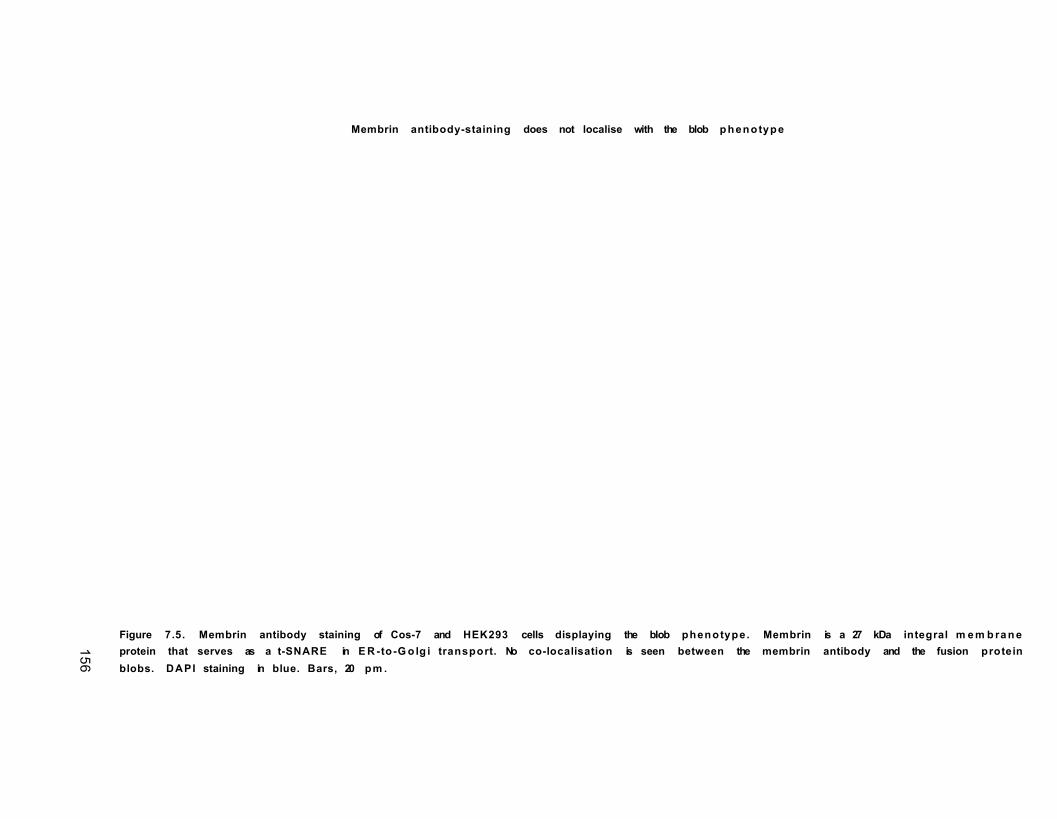
Membrin antibody-staining does not localise with the blob p henotype
156
Figure 7.5. Membrin antibody staining of Cos-7 and HEK293 cells displaying the blob phenotype. Membrin is a 27 kDa integral m e m b ra n e protein that serves as a t-SNARE in E R -to -G o lg i transport. No co-localisation is seen between the membrin antibody and the fusion protein blobs. DAPI staining in blue. Bars, 20 pm .

Blob-like aggregates do not co-localise with p-COP antibody staining
157
Figure 7.6 . P-COP staining of Cos-7 and HeK293 cells expressing N T M P S 1 -E G F P . p-COP antibody-staining exhibits a re tic u la r/v e s ic u la r
phenotype in both cell lines. The difference in size between the p-COP vesicles and the fusion protein and the absence of any co -lo ca lisatio n
shows that the blob phenotype is not associated with C O P -I trafficking. DAPI stain in blue. Bars, 10 p m .
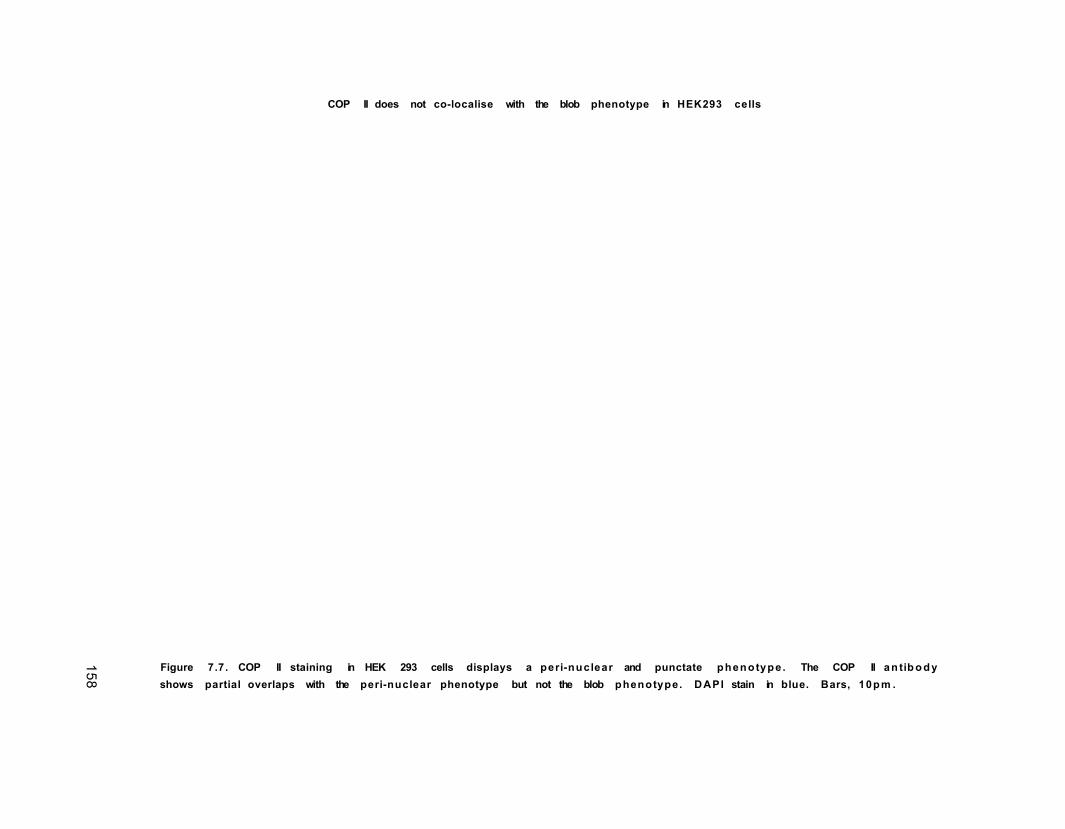
COP II does not co-localise with the blob phenotype in HEK293 cells
158
Figure 7.7. COP II staining in HEK 293 cells displays a peri-nuclear and punctate phenotype . The COP II an tib o d y shows partial overlaps with the peri-nuclear phenotype but not the blob phenotype. DAPI stain in blue. Bars, 10p m .


Cos-7 cells over-expressing NTM PS1 fusion protein show altered Anti-COP IIantibody staining
C O P II staining N T M P S 1 -E G F P M e rg e
C O P II staining N T M P S 1 -E G F P M e rg e
C O P II staining N T M P S 1 -E G F P M e rg e
C O P II staining N T M P S 1 -E G F P M e rg e
F ig u re 7 .8 .C O P II s ta in in g o f C o s -7 cells exp re s s in g m o d e ra te le v e ls o f th e fu s io n pro te in exh ib its a p e r i-n u c le a r p h e n o ty p e . C O P II s ta in in g d o e s not lo c a lis e w ith th e b lo b -lik e ag g re g a te s . In cells exp ress in g high leve ls o f th e fusion protein th e G o lg i rib b o n -like stain ing pattern is ab sent or in a state of fragm entation . D A P I stain in blue. Bars, 2 0 pm .
159

The blob phenotype does not associate with the lysosome marker LAMP-1
LA M P1 staining N T M P S 1 -E G F P M erg ed
LA M P1 staining N T M P S 1 -E G F P M erg ed
LA M P1 staining N T M P S 1 -E G F P M erg e d
F igure 7 .9 . L A M P -1 staining o f C o s -7 exp ress in g th e N T P S 1 -E G F P fus ion pro te in . L A M P -1 d isp lays a d is c re te v e s ic u la r p h e n o ty p e (red) th at d o es not co -lo ca lise with an y of th e p hen o typ es d isp layed by th e fusion protein (g re e n ). T h e L A M P -1 an tib o d y reco g n ises a lysosom al m e m b ra n e protein that p roduces a d istinctive ring pattern quite s e p a ra te from th e blob p h en o typ e (insert right). D A P I stain in
blue. Bars, 2 0 pm .Enlarged view
160

7.8 Proteasome 20S antibody staining of the fusion protein
The second intracellular proteolytic pathway involves the proteasome, a 26S
(200 kD) complex, which in mammalian cells contains a 20S (673 kD) multi
domain catalytic protein responsible for the degradation of a wide variety of
polyubiquitinated proteins, including PS (Kim et al, 1997; Steiner et al, 1998).
Excess holoprotein and non-incorporated fragments are degraded by the 26S
proteasom e. Using an interaction trap /tw o-hybrid assay and by
immunoprecipitation, a direct physical interaction between PS1 and the 20S
catalytic core of the 26S proteasome has been established (Van Gassen et al,
1999). To investigate whether the fusion protein similarly interacts with the
proteasome, Cos-7 cells and P S T /_ (mouse) cells exhibiting the blob phenotype
were stained with a monoclonal anti-20S antibody. The results however were
ambiguous since the 20S antibody showed poor staining in both cell lines. The
fluorescence intensity of the 20S antibody in these cells was equivalent to
primary-only antibody incubation in the absence of the alexxa 594 secondary. In
the case that the fixation method affected antibody binding, the experiment was
repeated with cells fixed in paraformaldehyde, however only non-specific
binding was observed (data not shown).
7.9 The blob-like aggregates show ubiquitination
Whilst the interaction of the fusion protein with the proteasome could not be
demonstrated definitively, involvement with the ubiquitin-proteasome system
(UPS) can be inferred by examining the ubiquitin status of the fusion protein.
Cells were stained with the anti-ubiquitin antibody and prepared for
immunofluorescent microscopy. The anti-ubiquitin antibody co-localises with
the blob-like aggregate phenotype, but not the reticular phenotype in HEK293
and Cos-7 cells expressing the fusion protein (figure 7.10, rows a and b). As a
control, the extent of bleed-through by the fusion protein into the red channel
was assessed. Bleed-through from the green channel was not detected in cells
stained with the secondary antibody only, indicating that the fusion protein is
infact ubiquitinated (figure 7.10, panel d). Additionally, HEK 293 cells were
analysed by immunoblotting using the anti-EGFP and anti-Ubiquitin antibodies.
Only those higher weight bands from the m em brane fraction show weak
161

immunoreactivity to the anti-ubiquitin antibody (figure 7.10, panel d). These
data show that only the blob-like aggregates are ubiquitinated and provide
evidence that the higher weight immunoreactive bands seen in previous
immunoblots may correspond to the blob-like phenotype.
The usage of the term ‘blob-like aggregate’ within the context of thesis
was meant purely as a general description for this phenotype. However, recent
work by Johnston et al (1998) have characterised the existence of a single,
stable, juxtanuclear aggregate referred to as an aggresome. Aggresomes are a
general response by the cell to protein over-expression and can be generated
artificially by inhibiting the proteasome. Once the degradative capacity of the
proteasome is exceeded, polyubiquitinated protein aggregate at the microtubule
organising centre (MTOC), and is accompanied by the rearrangement of the
intermediate filament protein (IF) vimentin, which forms a containiment cage
around the aggregated protein core (Johnston et al, 1998). Previous reports
show that PS2 is targeted for degradation by the proteasome (Kim et al, 1997)
and that PS1 readily form aggresom es following proteasom e inhibition
(Johnston et al, 1998). To evaluate whether the NTM PS1-EG FP fusion protein
similarly forms aggresomes, cells expressing the fusion protein were treated
with the proteasome inhibitors lactacystin and MG 132. Cells were then stained
with several antibodies diagnostic for the presence of aggresomes.
7.10 The NTM PS-EG FP fusion protein accumulates as a distinct perinuclear
structure following inhibition of the proteasome
To evaluate the effects of proteasome inhibition on Cos-7 cells, cells were
treated for 12 hours with 25 j u M M G132 or 10 jllM lactacystin and stained with
the anti-IF vimentin antibody (figure 7.11). Staining of untreated cells with the
anti-vimentin antibody produces a fine thread-like pattern that ramifies
throughout the cell (figure 7.11, panel a). This contrasts sharply with vimentin
staining in cells treated with lactacystin and M G132. Here, cells display a
characteristic collapsed halo phenotype that impinges on the nuclear membrane
causing a significant deformation of the nucleus (figure 7.11, panels b and c).
Next, cells expressing the fusion protein were stained for vimentin following
proteasome inhibition and prepared for fluorescent microscopy (figures 7.12
and 7.13). Three general observations were made, namely: (1) Vimentin forms
162

a cage around the fusion protein in lactacystin and MG132-treated cells (figures
7.12, rows c, d, and figure 7.13, rows b, c, d). (2) Vimentin antibody staining in
the absence of proteasome inhibition does not form a cage around the fusion
protein blobs in Cos-7 or HEK293 cells (figures 7.12, rows a, b, and 7.13, row
a). (3) The blob phenotype persists in cells treated with the proteasome
inhibitors and forms a distinctive ring of blobs around the aggresome. This
latter observation was more readily observable in HEK293 cells (figure 7.13,
rows b, c, d).
7.11 Higher weight fusion protein aggregates show increased ubiquitin immunoreactivity in cells treated with proteasome inhibitors
Overall EGFP fluorescence was greater in cells treated with the proteasome
inhibitors when compared to control cells. Similarly, western analysis of cells
with the anti-EGFP and anti-ubiquitin antibodies show greater immunoreactivity
in drug treated cells compared to control cells expressing the fusion protein
(figure 7.14, panel a and b). As expected, EGFP immunoreactivity was absent
from the cell soluble fraction in all the samples analysed (panel b, lanes 2-4). In
the m em brane fractions prepared from drug treated cells, EG FP
immunoreactivity is greater in lactacystin treated cells when compared to
MG132 treated cells, which in turn shows greater immunoreactivity compared to
untreated control cell samples (panel b, lanes 6-8). Soluble fractions
immunoblotted with the anti-ubiquitin antibody like w ise show greater
immunoreactivity following proteasome inhibition compared to control cells
expressing the fusion protein (panel a, lanes 2-4).
Interestingly, the membrane derived cell fraction show a decrease in
ubiquitin immunoreactivity for the 56 kD species following drug treatment.
Conversely, the higher weight bands at approximately 120 kD show increased
immunoreactivity following lactacystin treatment, compared to immunoreactivity
in MG132 treated cells, which in turn is greater than the band intensity seen in
control cells (panel a, lanes 6-8). This higher ubiquitin-staining band
demonstrates that only a fraction of the fusion protein corresponding to the
aggregated protein at 120 kD is targeted for proteasome degradation. Similarly,
immunofluorescent microscopic examination of cells expressing the fusion
protein shows co-localisation with the anti-ubiquitin antibody following
lactacystin or MG132 treatment in some but not all cells (figure 7.14, panel c).
163

7.12 M G132 concentrations in the nanomolar range are sufficient to cause the
collapse of vimentin around the aggresome
Whilst the above data demonstrate a clear physiological response by the cell to
the presence of the proteasom e inhibitors, a chief concern was the
concentration of lactacystin and M G132 needed to obtain these results. For
instance, M G132 is a potent, reversible proteasome inhibitor that has a Ki of 4
nM (Calbiochem data sheet), yet under the current experimental conditions cells
were treated with 25 jliM MG132, presumably well in excess of that needed to
inhibit the proteasome. Although such high concentrations of proteasomal
inhibitors have been used by other laboratories investigating aggresome
formation (Johnston et al, 1998; Garcia-Mata et al, 1999), the possibility exists
that any observations made may be the result of other, unrelated systems being
affected by too high a drug dose. To address this issue, cells were treated with
a series of M G 132 concentrations in the nanomolar range. To assess the
degree of aggresome formation cells were stained for vimentin (figure 7.15).
The number of cells displaying a peri-nuclear vimentin phenotype were then
counted and expressed as a percentage of the total number of cells showing
antibody staining (figure 7.16, a). Although the concentration series used here
are not typical of a pharmacological range of concentrations, there is
nonetheless a clear dose response affect (figure 7.16, b). Sub maximal
concentrations of M G 132 (5 nm to 50 nM) were sufficient to collapse the
vimentin cage around the aggresome. Subsequent experiments using M G132
were therefore carried out with 50 nM to lessen any possible artefacts induced
by too high a concentration.
7.13 M TOC staining is altered in Cos-7 cells expressing high levels of the
fusion protein
Previous work has shown that the aggresome localises to the M TOC region of
the cell in the immediate vicinity of the Golgi (Johnston et al, 1998) and is able
to recruit mitochondria from the cell periphery to the region immediately
surrounding the aggresome. To verify the presence of the aggresome in the
present study, cells expressing the fusion protein were treated with 50 nm MG
164

132 for 12 hours and stained with antibodies for the M TOC or mitochondria.
Staining in untreated cells reveals co-localisation of the fusion protein with the
MTOC antibody, but only in those cells expressing high levels of the fusion
protein (7.17, row a). Furthermore, MTOC staining appears to be altered in
these cells. M TOC staining in untransfected neighbouring cells is widespread
and ramifies throughout the entire cell. In transfected cells M TOC staining is
limited to a much smaller region of cell radiating out from the edge of the
nuclear region. Following proteasome inhibition, MTOC antibody staining and
the fusion protein form as a perinuclear body that displays partial co-localisation
(figure 7.17, row b).
Cells stained with the mitochondria antibody show an even distribution
throughout Cos-7 and HEK293 cells in untreated, transfected and untransfected
cells (Figure 7.17 rows c and d), though in Cos-7 cells exhibiting the blob
phenotype, the mitochondria are effectively excluded from the immediate region
of the cell occupied by the blobs (row c). Similarly, row c also shows the
exclusion of mitochondria from a perinuclear site in an untransfected cell that
exhibits a deformed nucleus, typical of the aggresome. In this instance,
aggresome formation is observed in the absence of proteasome inhibition. The
addition of MG 132 however, causes a dramatic shift in the location of
mitochondria from a scattered distribution throughout the cell, to a juxtanuclear
position, where the fusion protein and the mitochondria partially overlap (figure
7.17, row d). Overall, the presence of the fusion protein had no affect on the
number of mitochondria in transfected or untransfected cells.
7.14 Formation of the blob-like phenotype does not require intact microtubules
Previous studies have shown that aggresome formation at the M TOC requires
an intact cytoskeleton (Johnston et al, 1998) and that disruption of the
microtubule dynein/dynactin transport complex inhibits aggresome formation
(Garcia-Mata et al, 1999). To test whether the aggresomes generated from the
fusion protein require an intact microtubule system for their formation, cells
expressing the fusion protein were treated with MG132 alone or in combination
with the microtubule disrupting agent nocodazole and stained for the
centrosome (MTOC) marker y-tubulin or vimentin (figure 7.18). M G 132and
165

The blob-like aggregates are ubiquitinated
Ubiquitin staining H E K 2 9 3 N T M P S 1 -E G F P M erg ed
Ubiquitin staining C o s -7 N T M P S 1 -E G F P M erg ed
S eco n d ary antibody only H E K 2 9 3 N T M P S 1 -E G F P N o b leed -th ro u g h
F ig u re 7 .1 0 . U b iq u itin a n tib o d y s ta in in g o f ce lls
e x p re s s in g th e N T M P S 1 -E G F P fus io n p ro te in . T h e
blob p h en o typ e stains fo r ubiquitin in (a ) H E K 2 9 3 and
(b ) C o s -7 ce lls , (c) S e c o n d a ry an tib o d y s ta in in g
show s th a t th e fusion protein d o es not b leed -th ro u g h
into th e red c h an n e l (g a in + 9 ). D A P I sta in in b lue.
Bars, 2 0 pirn, (d) W e s te rn an a lys is o f H E K 2 9 3 cells
s ta ined with a n ti-E G F P and an ti-U b iq u itin an tib o d ies .
T h e h ig h er w e ig h t bands from th e m e m b ra n e fraction
s h o w w e a k im m u n o re a c tiv ity to th e a n ti-u b iq u itin
a n tib o d y . S a m p le s a n a ly s e d by 7 .5 % S D S U re a
P A G E .
ladder soluble membrane membraneA nti-ub iqu itin A n ti-E G F P
166

V

The IF vimentin collapses at a perinuclear position in response to proteosome inhibition
167

The fusion protein forms aggresomes following proteasome inhibition in Cos-7 cellsMUS■ ■
V im en tin staining (no lactacystin)
N T M P S 1 -E G F P M erg e
V im entin staining (no treatm en t)
N T M P S 1 -E G F P M erg e
DV im entin staining
(Lactacystin trea tm en t)N T M P S 1 -E G F P M e rg e
DC I V
V im entin staining (M G 13 2 treatm en t)
N T M P S 1 -E G F P M e rg e
F igure 7 .1 2 . V im en tin staining of C o s -7 cells trea ted for 12 hours with th e p ro teo so m al inhibitors M G 1 3 2 ( 2 5 j l iM ) and Lactacystin (1 O jliM ). V im en tin d o es not form a c a g e a ro u n d th e b lobs in
u n trea ted cells (row s a and b). Follow ing th e inhibition o f th e p ro teaso m e, th e fusion protein form s as a p erin u c lear a g g reso m e surrounded by a v im entin c ag e (row s c and d). D A P I stain in blue. Bars, (a ) and (b) 2 0 ju m , (c) 5 ^m , (d) 10 | im .

The fusion protein forms aggresomes following proteasome inhibition in HEK293 cells
BBV im en tin staining
(no treatm en t)N T M P S 1 -E G F P M e rg e
BV im en tin staining
(M G 132 trea tm en t)N T M P S 1 -E G F P M e rg en
V im entin staining (M G 132 treatm en t)
N T M P S 1 -E G F P M e rg eBV im entin staining
(Lactacystin treatm en t)N T M P S 1 -E G F P M e rg e
igure 7 .1 3 . V im e n tin sta in ing o f H E K 2 9 3 cells tre a te d fo r 12 h ours w ith th e p ro te o s o m a l inhibitors M G 1 3 2 (25|uM ) and Lactacystin (1 OjliM). V im en tin d o es not form a c a g e a ro u n d th e
blobs in untreated cells (row a). Follow ing the inhibition o f the p ro teaso m e, th e fusion protein form s as a p erin u c lear ag g reso m e (row s b-d), how ever, th e v im entin c a g e a p p e a rs to e x c lu d e the blobs, w hich a re p resent as a ring surrounding th e ag g reso m e. D A P I stain in b lue. B ars, (a) 2 0 jim , (b) and (c) 2 .5 p,m, (d) 10 jim .
169

EGFP fluorescence increases following proteasome inhibition
0 2 -o ~■O £03
,9
CH—'C/3
CM>
.O03
!_CO
0T—
JXLCD
O03_
l
i_0E0zL
D
IDO
_oCM
T—T—
CMCO5
Ct) >
o
ro o 03
O
LO
O
CM =1 =L O
CM
00 LO
CD
Is- 00
□OCM
CD
v-
LO
00
CDCOCM
OCM
QCDLO
CDLU_l_’•Mc<
00CDLOCOCM
DC*!o=)
(0170
and m em brane fractions were im munoblotted with (a) anti-Ubiquitin (b) and anti-EGFP an tib o d ies . Lactacystin treated cells show g re a te r im m unoreactivity when compared to MG132 treated cells, which in turn show greater im m unoreactivity compared to the untreated control cell fraction, (c) O verall, EGFP fluorescence is greater in cells exposed to the proteasome inhibitors. Samples analysed by 10% Urea SDS P A G E . DAPI stain in blue. Bar, 20p.m.

Proteasome inhibition of NTMPS1-EGFP HEK 293 cells with MG132 occurs in thenanomole rangejjflfl
V im en tin N T M P S 1 -E G F PHV im en tin N T M P S 1 -E G F PHBV im entin N T M P S 1 -E G F P
V im entin N T M P S 1 -E G F PH WV im entin N T M P S 1 -E G F P
5 nM M erg e
*
9
10 nM M erg e
I ■ £
25 nM M e rg e
5 0 nM M e rg e
10 0 nM M e rg e
F ig u re 7 .1 5 . O vern ig h t (1 2 hr) tre a tm e n t o f N T M P S 1 H E K 2 9 3 cells w ith 5 n M -2 5 0 nM M G 1 3 2 . C ells stained for V im en tin (red). D A P I stain in blue. Bars, 2 0 ^im.
171

V im en tin N T M P S 1 -E G F P
N T M P S 1 -E G F PV im entin 2 0 0 nM M e rg e
V im entin N T M P S 1 -E G F P 2 5 0 nM M e rg e
F igure 7 .1 5 (continued)
a. b.
[M G 1 3 2 ] nMN u m b er of cells displaying peri
n uclear V im entin
staining (% )5 2 9
10 61
2 5 60
50 78
100 81
150 93
2 0 0 100
2 5 0 100
Percentage cells treated for 12 hours with varying [MG132] displaying
perinulear Vimentin staining100
= >
8» =0) Q.
0 50 100 150 250200MG132 cone (nM)
Fig u re 7 .1 6 . E ffect of varying M G 1 3 2 co n cen tra tio n on th e d istribution o f v im entin in H E K 2 9 3 N T M P S 1
cells, (a ) T h e n u m b e r o f cells in figu re 7 .2 5 d isp laying a p e ri-n u c le a r v im entin p h en o typ e w e re counted and exp ressed as a p e rcen tag e o f th e total n u m b er o f cells show ing vim entin an tib o d y stain ing. (b) D a ta from (a ) g e n e ra te s a d ose resp o n se cu rve fo llow ing M G 1 3 2 trea tm en t of cells expressing the fusion protein.
172

MTOC staining is altered in cells over expressing the fusion protein
♦ -8#
Control M TO C stainin N TM PS1-EG FP Merge
M TO C staining. 50 nM M G 132 N TM PS 1-E G FP Merc
Control mitochondria stainin Cos-7 N TM PS1-EG FP
Control mitochondria staining HEK293 N TM PS 1-E G FP Men
Mitochondria staining. 50 nM MG132 HEK 293 N TM PS 1-E G FP Merge
Figure 7.17. M TO C and Mitochondria antibody staining in H EK293 and Cos-7 cells, (a and b) M TO C staining is altered in cells over expressing the fusion protein. Following M G 132 treatment, M TO C staining partially overlaps with the fusion protein at a juxtanuclear location, (c and d) Mitochondria staining in untreated Cos-7 and HEK 293 cells is distributed throughout the cell, (e) Treatm ent with M G 132 results in a juxtanuclear phenotype containing mitochondria and the fusion protein. DAPI stain in blue. Bars, 20 pm.
I i o
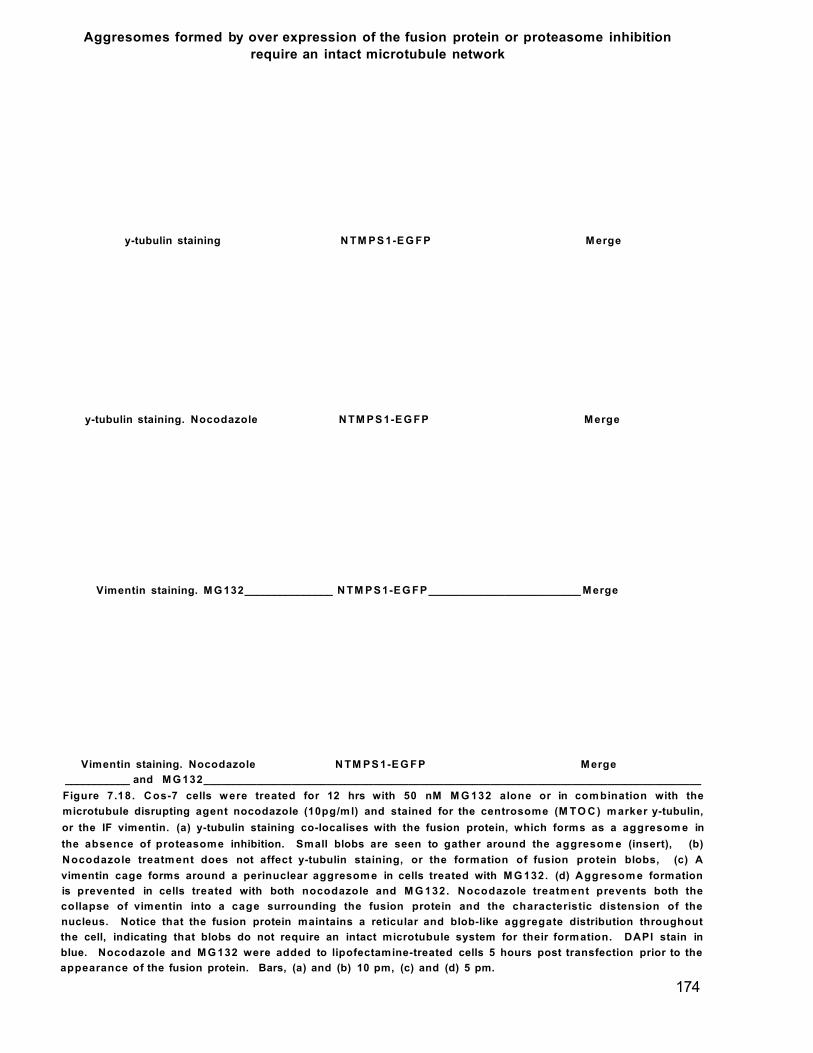
Aggresomes formed by over expression of the fusion protein or proteasome inhibitionrequire an intact microtubule network
y-tubulin staining N TM PS 1-E G FP Merge
y-tubulin staining. Nocodazole N TM PS 1-E G FP Merge
Vimentin staining. M G 132_______________ N TM PS 1-E G FP__________________________ Merge
Vimentin staining. Nocodazole N TM PS 1-E G FP Merge___________ and M G 132_____________________________________________________________________________________Figure 7.18. Cos-7 cells w ere treated for 12 hrs with 50 nM M G 132 alone or in combination with the microtubule disrupting agent nocodazole (10pg/ml) and stained for the centrosome (M TO C ) m arker y-tubulin, or the IF vimentin. (a) y-tubulin staining co-localises with the fusion protein, which forms as a aggresom e in the absence of proteasome inhibition. Small blobs are seen to gather around the aggresom e (insert), (b) Nocodazole treatm ent does not affect y-tubulin staining, or the formation of fusion protein blobs, (c) A vimentin cage forms around a perinuclear aggresome in cells treated with M G 132. (d) Aggresom e formation is prevented in cells treated with both nocodazole and M G 132. Nocodazole treatm ent prevents both the collapse of vimentin into a cage surrounding the fusion protein and the characteristic distension of the nucleus. Notice that the fusion protein maintains a reticular and blob-like aggregate distribution throughout the cell, indicating that blobs do not require an intact microtubule system for their formation. DAPI stain in blue. Nocodazole and M G 132 were added to lipofectamine-treated cells 5 hours post transfection prior to the appearance of the fusion protein. Bars, (a) and (b) 10 pm, (c) and (d) 5 pm.
174

The reticular phenotype appears prior to the blob phenotype
175
6 hours________________________________________________________Figure 7 .19 . Analysis of transfected cells over tim e. The fusion protein appeared three hours after first transfection as a re ticu la r phenotype. By four hours the first signs of the blob phenotype appear as ‘s w e llin g s ’ intimately associate with the re tic u la r-n u c le a r interface (arrow s). The first signs of a peri-nuclear phenotype appear after 4 to 5 hours. By 6 hours cells exhibit the full range of phenotypes. Cells transfected using lipofectamine 2000 . Cells fixed in m ethanol at times indicated. DAPI stain in blue. Bars, 10^im.

The
blob
phen
otyp
e ar
ises
as
‘sw
ellin
gs’ a
t the
re
ticul
ar-n
ucle
ar
inte
rfac
e
0 CDCD 05
C/5 C/50 O
Q_ CD0 0
CD 0O C/5
0 0
0 C/5C/5 00
CJ 0
CJ .CD 0
0 CN
05 0 -C0 TO
0 C/5 CD
W £0 C/5 (A 0
C/5 c/5
Q. 0 r; 0 0
CN 0^ 0
0 O C/50 0 0
0 0
/
176

nocodazole were added 5 hours post transfection to Lipofectamine-treated cells
prior to the appearance of the fusion protein. Staining of cells for y-tubulin
reveals a perinuclear phenotype that localises with fusion protein (row a), which
appears as small blobs surrounding the aggresome (insert, row a). Moreover,
high levels of the fusion protein results in the distension of nuclear envelope,
indicating that fusion protein can spontaneously form aggresomes in the
absence of proteasome inhibition (Johnston et al, 1998).
Importantly, unlike aggresomes, treatment of cells with nocodazole has
no affect on the development of the blob-like aggregates, which maintain a
scattered appearance throughout the cell indicating that intact microtubules are
not required for their formation (row b). In cells treated with MG132, a vimentin
cage forms around a perinuclear aggresome (row c). Conversely, aggresome
formation is prevented in cells expressing the fusion protein following MG 132
and nocodazole treatment, even after 12 hours incubation (figure 7.18, row d).
In addition, vimentin staining exhibits a network of fibres, whereas the fusion
protein maintains an ER and a blob-like aggregate distribution throughout the
cell. Furthermore, distension of the nucleus, characteristic of the aggresome, is
absent from drug treated cells.
7.15 The PS1 fusion protein phenotypes do not alter over time
Having established that the fusion protein forms aggresomes in response to its
over expression and following proteasome inhibition, the identity of the blob
phenotypes was further pursued. In particular, the cell compartment from which
the blobs are derived and whether they are membrane-bounded structures or
cytoplasmic aggregates remains unknown. The question arose as to whether
the number of cells displaying the blob phenotype would increase over time.
This would be a reasonable assumption to make if the phenotypes arose
following maturation: ER/Golgi>Vesicles>Blobs.
To address this issue, the phenotypes of cells transfected with all four
constructs were examined over a 6-hour period by fluorescent microscopy.
Cells were transfected with lipofectamine and examined at 1-hour intervals over
a 6-hour period. No EGFP fluorescence was detected over this time period. It
was assumed that the absence of complete media was responsible for lack of
expression of the fusion protein by the cells. This problem was overcome by
177

the use of lipofectamine 2000, a transfection agent which complexes with the
cDNA even in the presence of complete media. As expected the number of
cells expressing the fusion protein increased over time. The first signs of
fluorescence appeared after 3 hours as a reticular phenotype (figure 7.19 &
7.20). By four hours post transfection, the first signs of the blob phenotype
appear as circumnuclear ‘swellings’ intimately associate with the reticular-
nuclear interface. Measurement of the blobs show that they range in size from
-2 5 0 nm up to -3 .7 5 pm (long axis). The first signs of a peri-nuclear phenotype
appear after 4 to 5 hours. By 6 hours cells exhibited the full range of
phenotypes (figure 7.20, a-d).
In a follow-up experiment the time intervals following transfection were
extended. Cells expressing the fusion protein were examined after 10, 24, 36
and 58 hours. Overall there was no change in number of cells displaying the
blob phenotype between each time point 10 hours after first transfection (data
not shown).
7.16 TEM examination of the cells expressing the fusion protein reveals
laminar structures and phagosomes
To examine the ultrastructure of the blobs, Cos-7 cells expressing the fusion
protein were examined by transmission electron microscopy (TEM). Cells show
a variety of structures such as mitochondria with visible cristae, lysosomes
showing the tell-tale double unit membrane and phagosomes responsible for
the degradation of certain cell components (Dunn, 1990), as well as the
unexpected presence of unusual laminar bodies (figure 7.21). Structures
resembling the blob phenotype in terms of their dimensions, distribution and
numbers are seen in some, but not all cells. Approximately 1 in 3 cells display
these structures, consistent with the transfection rate seen for control cells
exhibiting fluorescence in samples fixed for conventional microscopy (data not
shown).
Several regions throughout the cell show dark patches compared to the
neighbouring regions, which on closer inspection are composed of compressed
tubules (figure 7.21, A). Whole regions of the cytoplasm were occupied with
multilaminar bodies, some of which consist of concentric, myelin-like whorls
(figure 7.21, B & C). One of the multilaminar structures appears to be folding
178

back on itself possibly indicating how they form. A magnified view reveals that a
unit membrane delimits part of this structure. Additionally, some regions of the
cell containing the laminar bodies appear to be loosely bounded by the ER.
These bodies associate to varying degrees with the phagosomes, the contents
of which vary in appearance (figure 7.21, D-G). Also, patches of the nuclear
membrane in the region of the laminar body are discontinuous or absent
altogether (D-G).
Interestingly, associated with the laminar bodies is the complete absence
of any well-defined cytoplasmic structure (figure 7.21, H-K), suggesting that the
contents have been engulfed by the phagosome and subsequently disposed off.
The laminar bodies appear to occupy one side of the vacuole, whilst the lumen
contains various remnants suggesting that the specimens exhibit various stages
of clearance. The presence of mitochondria showing intact cristae indicates
that the laminar bodies/vacuoles in these cells are not responsible for
apoptosis, leastways; type 1 caspase-associated cell death (Clarke et al, 1990).
Closer examination of the vacuoles reveals ragged margins in some places yet
well-defined margins in others (figure 7.21, l-O). In these specimens the
vacuole encloses the entirety of the laminar bodies, which appear continuous
with one another, however both structures remain separate when viewed at a
higher magnification (figure 7.21, O). Interestingly, where the blob-like
aggregates/multilaminar bodies predominate, the ER is barely present whilst
there is little suggestion of the Golgi compartment.
7.17 Chapter summary
To summarise, the presence of the EGFP moiety is not a contributing factor in
the phenotypes displayed by cells expressing the fusion protein. The blob
phenotype does not appear to be ER or Golgi fragments since antibody staining
with cell compartment markers such as Colligin, Ergic53, membrin, etc, do not
show co-localisation. Furthermore, altered antibody staining for CO PII and
MTOC is seen in some cells expressing the fusion protein. Additionally,
ubiquitin antibody staining is restricted to the blob phenotype. Proteosomal
inhibition of cells expressing the fusion proteins generates juxtanuclear
aggresomes in a microtubule dependent manner, resulting in the collapse of
vimentin around the fusion protein. The blob phenotype appears to originate
179

from the nuclear membrane/ER interface where formation is microtubule-
independent. TEM reveals the presence of phagosomes and numerous,
structured bodies that are composed of concentric myelin-like whorls associated
with large vacuoles devoid of any kind of structure.
180

Figure 7.21. Transmission electron microscopy of Cos-7 cells expressing the fusion protein. A. Cos-7 cells affixed to coverslips were transfected with pNTMPS1-EGFP. Fixed Specimens were scraped off and prepared for EM as described under Methods and Materials. Cells show a nucleus (n) and numerous mitochondria (m) present throughout the cytoplasm. Close examination reveals the presence of cristae within the mitochondria. Numerous vacuoles are scattered throughout the cell (v). A few autophagosomal structures (arrows) were seen at various phases of maturation. The inset (left) from the top right of the picture shows the expulsion of an autophagososome vacuole from the cell plasma membrane (pm). Noticeable was the presence of several darker regions (*), which on close examination are revealed to be composed of compressed tubules. Interestingly there is little sign of the ER or Golgi compartments. Bar, 2.5 jim, inset 1 im.
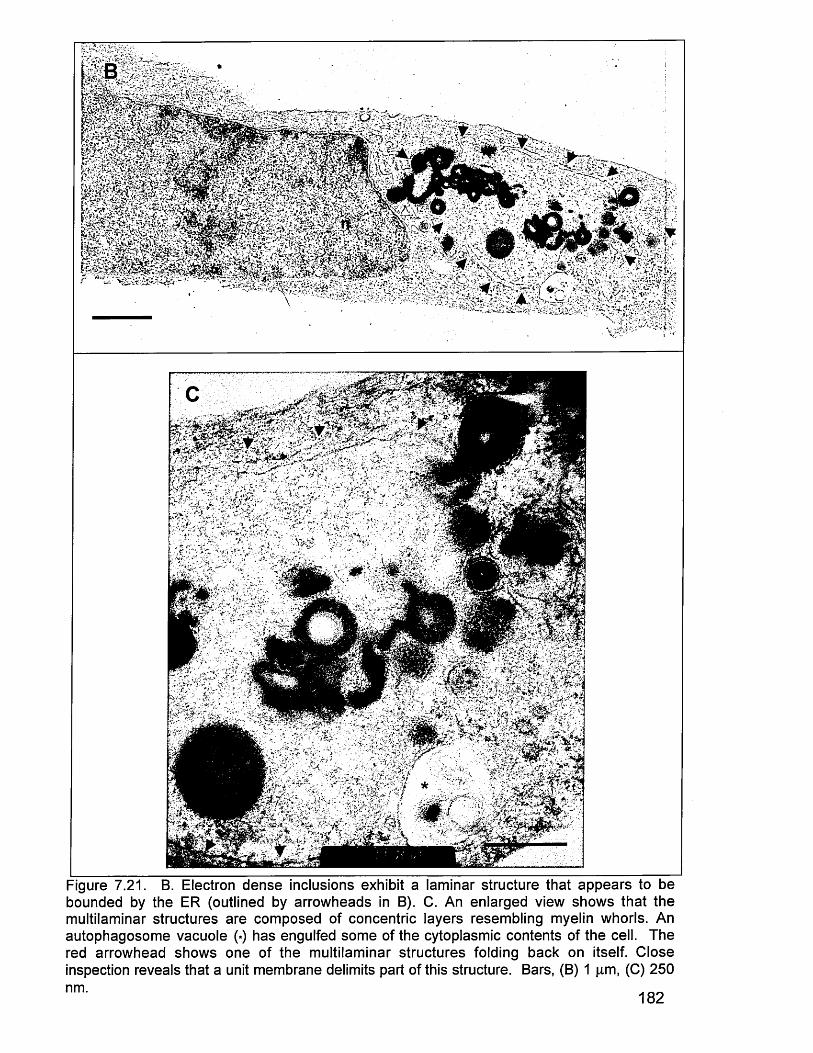
Figure 7.21. B. Electron dense inclusions exhibit a laminar structure that appears to be bounded by the ER (outlined by arrowheads in B). C. An enlarged view shows that the multilaminar structures are composed of concentric layers resembling myelin whorls. An autophagosome vacuole (*) has engulfed some of the cytoplasmic contents of the cell. The red arrowhead shows one of the multilaminar structures folding back on itself. Close inspection reveals that a unit membrane delimits part of this structure. Bars, (B) 1 pm, (C) 250

Figure 7.21. D-G. The phagosomes engulf the laminar bodies along with other unidentified components of the cell. Abbreviations: (er) endoplasmic reticulum, (I) lysosome, (n) nucleus, (p) phagosome, (*) laminar bodies associated with the nuclear membrane. In places, the nuclear membrane appears discontinuous (arrows). Bars, (D, E, F) 250 nm, (G) 500 nm.
183

;<ir
Figure 7.21, H-K. The cytoplasmic region adjacent to the laminar bodies is devoid of any ordered structure suggesting that the phagosomes engulf the entire cytoplasmic contents (H) leaving behind a vacuole containing scattered fragments. (I) Enlarged view of (H) shows electron dense granular remnants surrounded by vacuole (*). (J, K) The presence of intact mitiochondria (m) showing cristae indicate that caspase associated apoptosis (type 1 cell death) is not linked to the laminar bodies/vacuoles. Bars, (H) 1 pm, (I) 250 nm, (J, K) 500 nm. 184
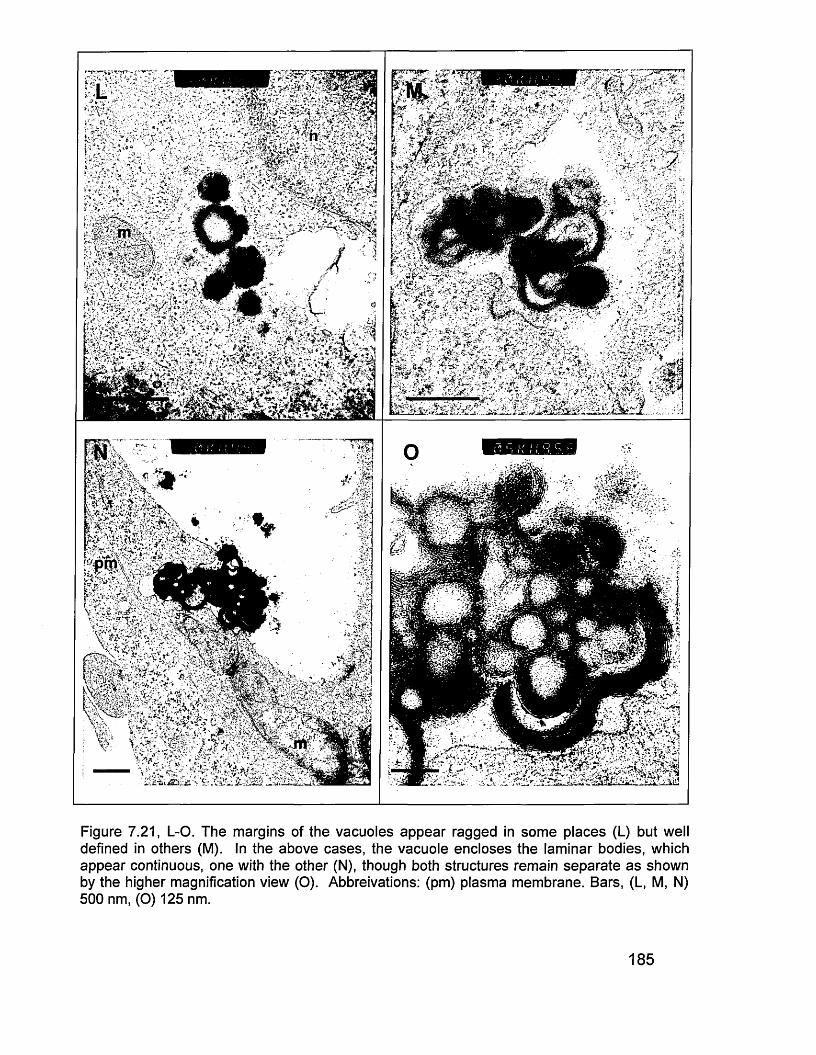
Figure 7.21, L-0. The margins of the vacuoles appear ragged in some places (L) but well defined in others (M). In the above cases, the vacuole encloses the laminar bodies, which appear continuous, one with the other (N), though both structures remain separate as shown by the higher magnification view (O). Abbreivations: (pm) plasma membrane. Bars, (L, M, N) 500 nm, (O) 125 nm.
185

Chap ter 8 Discussion
8.0 The putative PS1NTF 923 antibody staining is distinct from 1039
PS1CTF antibody staining
Initial investigations into the distribution of endogenous PS1 were carried out
using the putative NTFPS1 antibody 923, and the CTFPS1 antibody 1039. The
results shown in chapter 3 were consistent with the PS1 holoprotein undergoing
proteolysis as part of the maturation process that gives rise to functional PS1.
However, the novel observation that the two PS1 fragments appear to reside in
separate compartments (figure 3.1) argued that the CTF and NTF may function
separately to that of the mature PS1 complex and/or that the two fragments
may be degraded by separate pathways. The current view holds that the PS1
holoprotein undergoes endoproteolysis within the ER to yield CTF and NTFs,
which then re-associate within the Golgi compartment, along with additional
factors to form the functional PS1 complex associated with y-secretase activity
(Kovacs, et al 1996). Moreover, the observation that the NTF displays a
vesicular staining pattern following BFA treatment suggests that it may exit from
the ER at a site different to that of the CTF.
Previous studies indicate that proteins exiting the ER pass via the ERGIC
compartment en route to the Golgi or may pass directly to the Golgi within
transport complexes originating from transitional ER sites (Scales et al, 1997).
In this study 923 antibody staining co-localises very strongly with the Ergic53
antibody and that this co-localisation is not affected by BFA treatment indicating
that the putative NTF originates from this compartment prior to its transport to
the Golgi. A second compartment that also remains distinct from the ER
following BFA treatment are structures referred to as ‘Golgi remnants’ that
appear to house Golgi-matrix proteins (Nakakmura et al, 1995; Seemann et al,
2000). However, it is unlikely that the PS1NTF are Golgi remnants given the
intimacy of the Ergic53 and 923 antibody co-localisation.
One interpretation of the above data is that following endoproteolysis of PS1,
the NTF and CTF traffic as two separate pools to the Golgi and that this
separation may underlie different functions. Why this should be is unclear,
although it has been speculated that PS1 may function in the transport of APP
186

in addition to its role as the putative y-secretase (Kaether et al, 2002). However,
other researchers have failed to demonstrate any interaction between PS1 and
APP (Thinakaran et al, 1998). In this regard, a simple test would be to
investigate whether the 923 antibody would co-immunoprecipitate PS1NTF
along with APP and whether or not they co-localised within the same cellular
compartment. It is worth noting that BFA-treatment of NTera 2 cells prevents Ap
secretion, in particular A(340 whereas BFA-treatment of cells has little effect on
A(342 secretion suggesting that the toxic species is generated within the ERGIC
compartment (Cook et al, 1997; Chen et al, 2000).
In light of the present data it is therefore possible that following
endoproteolysis of the holoprotein, the PS1 fragments follow two separate
routes from the ER before re-associating within the Golgi compartment and that
within the ERGIC compartment the NTF associates with APP. However, given
that the 1039 antibody does not stain for the ERGIC compartment (figures 3.1
and 3.2), it is difficult to envisage APP cleavage taking place in the absence of
the CTF given the necessity for both fragments within the functional y-secretase
complex (Yu et al, 1998). Furthermore, the notion that PS1 undergoes
endoproteolysis within the ER to generate NTF and CTF that then follow
different routes to the Golgi, is in opposition to previous studies showing that
PS1 fragments are maintained in a strict 1:1 stoichiometry and that the resultant
heterodimer is not mixed but consists of a homogenously derived pool (Kovacs,
et al 1996; Podlisny et al, 1997; Yu et al, 1998; Tomita et al, 1999).
8.1 Construction and expression of N-terminal truncated PS1-EG FP
Unfortunately, to test whether the 923 antibody co-localises with APP or indeed
immunoprecipitates APP along with PS1, could not be investigated, since the
923 antibody, unlike 1039, failed to W estern blot (figure 3.5, lane 4).
Furthermore, repeated attempts at immunoprecipitating PS1 have been
unsuccessful raising concerns about the utility of the 923 antibody in fully
characterizing the biology of PS1. In order to clarify this issue and effectively
extend the previous observations, an N T FP S 1-E G F P fusion protein was
constructed with the aim of substituting for the 923 antibody in vitro. The use of
187
such a scheme scores over traditional antibody staining techniques in that
fusion proteins have the advantage of not requiring fixation or permeabilisation
steps thus making this reporter system suitable for kinetic studies concerned
with protein localisation and trafficking within cells (Chalfie et al, 1994; Cubitt et
al, 1995). Additionally, fusion proteins have been shown to maintain their
fluorescence in living cells as well as retaining the normal biological function of
the fusion partner. Such tagged proteins provide increased sensitivity and
resolution when compared to antibody staining (Wang & Hazelrigg, 1994).
Expression of the PS1NTF fusion protein in Cos-7 cells generated four
distinct phenotypes, two of which localised to varying degrees with antibodies to
the ER and the Golgi compartments (figures 4.8 and 4.9). Unexpected was the
presence of the blob-like aggregates and the much smaller vesicles within the
cell, both of which do not co-localise with markers to the cell compartment,
possibly indicating that these two structures have similar origins. Following
Western blotting, a crude preparation of cells separated into soluble and
membrane components should immunoblot for the membrane fraction only,
given that PS are transmembrane proteins (Thinakaren et al, 1996; Tomita et al,
1997). Indeed, immunoreactivities for the m em brane-only fraction were
observed at ~61 kD corresponding to the sum of the individual sizes of both the
EGFP moiety and the N-terminus of PS1 (figure 4.6, lane 6). As expected cells
expressing EGFP showed immunoreactivity to the anti-EGFP antibody at ~29
kD within the soluble fraction only (lane 2). The absence of EG FP
immunoreactivity within the soluble fraction prepared from transfected cells
suggests no cleavage of the EGFP moiety from the PS1NTF (lane 5). This
conclusion is further supported by the co-localisation of the anti-EGFP antibody
with the fusion protein for all phenotypes (figure 4.7). Together these data
indicate correct folding of the PS1NTF fusion protein and its maturation from the
ER/IC to the Golgi, consistent with previously published reports (Yu et al, 1998;
Capell et al, 1998).
Having successfully generated the PS 1N TF-E G FP fusion protein, the
earlier experiments investigating the novel distribution of the 923 antibody within
the cell compartment was re-examined. Very little overlap between the fusion
protein and the 923 antibody was observed (figure 4.10). Moreover, following
BFA treatment the fusion protein displays a reticular phenotype distinct from
188

Ergic53 antibody staining, which is chiefly vesicular (figure 4.11). In conclusion
these data and those from the previous experiments argue against 923 being a
bonafide anti-PS1 antibody able to recognise either endogenous or exogenous
PS1. Consequently, further characterisation of PS1 with the 923 antibody was
abandoned. As to the identity of the 923 antibody, confocal microscopy reveals
that 923 staining co-localises intimately with the Ergic53 antibody with the
suggestion that, in terms of appearance, the one folds over the other (D.
Parkinson).
8.2 Immunoanalysis of the NTF fusion protein
The initial aim of this study was to investigate the novel distribution of PS
fragments within the cell compartment as revealed by specific PS antisera.
Certain limitations in the properties of the 923 antibody were addressed by
recourse to the construction of a PS1NTF-EGFP chimera. The results from this
investigation demonstrated that the 923 antibody staining was not specific for
PS1, consequently the present line of enquiry was concluded. However, in the
course of this investigation fluorescent microscopy of transfected cells
expressing the fusion protein revealed the unexpected presence of unusual
intracellular bodies, the blob-like aggregates.
Also unexpected was the higher weight immunoreactivite band at ~120
kD initially thought to represent dimerisation of the fusion protein since this is
approximately twice the size of the lower immunoreactive band (figure 4.6 lane
6). Furthermore, attempts at resolving this species into one band using a
denaturing SD S-urea gel were unsuccessful indicating a urea-insensitive,
insoluble aggregate rather than dimerisation of the protein. Whilst the lower
immunoreactive band of the expected size may represent correctly folded and
membrane-located PS1 protein, drawing the same conclusion for the higher
band may be premature. Conceivably, over expression of the fusion protein
produces aggregates within the cytoplasm that show up in the membrane
fraction, though how the hydrophobic transmembrane fusion protein could
achieve this is not clear. One clue however is provided by the circumnuclear
blob-like aggregates. These structures may in fact be represented by the
higher band immunoreactivities seen in figure 4.6. Therefore the simplest
189

explanation to account for the existence of these aggregates is that they
represent an artefact induced by the overexpression of the fusion protein. The
difficulty with this interpretation is that all cells transiently expressing the fusion
protein should contain aggregates since the same promoter drives expression
of the transgene. Clearly they do not. Furthermore if the blobs were merely an
amorphous mass of protein clumped together within the cytoplasm, then the
difference in the size of the blobs should be reflected by a smear of protein
following immunobloting, rather than the single distinct band observed.
8.3 Expression of mutant full-length and truncated PS1 fusion proteins
Initial concerns about the fusion protein phenotypes arising as an artifact
induced by the fixation method proved to be unfounded since all four
phenotypes occur in cells fixed with either methanol or paraformaldehyde.
Moreover, these same phenotypes are present in other mammalian cell types
indicating a general cellular response to the presence of the fusion protein.
For the purpose of examining the effect selected FAD mutations have on
the biochemistry of APP and the distribution of both full-length and truncated
PS1-EGFP, cDNAs were successfully generated in a two-stage process using
PCR. The transfection rate and the overall fluorophore intensity for the
N TM PS1-EG FP fusion protein was identical to that seen for NTPS1-EG FP,
whereas the converse was true for the full-length proteins, which consistently
demonstrate low transfection rates and weak fluorescence. The availability of
the N-terminal PS1 specific antibody NT7 unexpectedly revealed the presence
of two separate CTF and NTF pools in some cells, indicating that the full-length
fusion protein undergoes endoproteolysis consistent with previous reports
(figure 5 .11; Thinakaran et al, 1996). Additional evidence for the
endoproteolysis of the full-length fusion protein is also provided by the Western
immunoblot data (figure 5.12).
8.4 Endoproteolysis of the full-length PS1
190

Under normal physiological conditions PS1 is constitutively cleaved and quickly
turned over (T 1 /2 -6 0 min), in part to the two major fragments (Podlisny et al,
1997) that form a 1:1 heterodimer thought to be the biologically active form of
PS1 (Thinakaren et al, 1996; Mercken et al, 1996; Podlisny et al, 1997;
Ratovitski et al, 1997; Steiner et al, 1998).At first glance, staining with the NT7
antibody would support the earlier 923 antibody data showing two separate PS1
fragment pools. However, in this instance the NTF pool was distinctly Golgi-like
(figure 3 .1) w hereas NT7 staining is typically blob-like in appearance.
Moreover, BFA treatment of cells expressing the full-length fusion protein
display the same reticular phenotype seen in earlier experiments examining the
effects of BFA on the distribution of the N TPS1-EG FP protein (figure 5.9 d).
These data therefore indicate a disturbance in the stoichiometry between the
two endoproteolytically-derived fragments. As a consequence, C-terminal PS1-
EGFP levels may be more tightly regulated over and above that of the NTF.
Alternatively, both fragments may be equally susceptible to degradation but that
the NTF may be more prone to aggregation and thereby thwarts attempts by the
cell to regulate its numbers. Either way, this data indicate that both PS1
fragments are not regulated in the predicted 1:1 stoichiometry as previously
reported (Thinakaren et al, 1996), leastways, under experimental conditions
where Cos-7 cells express the full-length fusion protein. Previous reports
indicate that steady state levels of the PS fragments are tightly regulated since
transgene over expression does not increase the overall level of fragments
within cells (Thinakaran et al, 1997).
The restricted incorporation of the PS1 fragments into a functional
complex along with other cellular factors has been proposed as an explanation
for their regulated accumulation (Yu et al, 1998), therefore excessive levels of
the fusion protein both truncated and full-length, above that needed to complex
with other unknown limiting factors may lead to the development of the blob-like
phenotype. However, the tightly regulated accumulation of PS1 heterodimers
as a means of regulating PS1 levels has been criticised as too simplistic.
Additional influences appear to be at work in preventing aberrant accumulation
of PS fragments and holoprotein such as proteosome, caspase, and leupeptin-
sensitive cystein proteinase activities. Inhibition of the proteosome, for
191

exam ple, leads to the accumulation of NTF, CTF and polyubiquitinated
holoprotein (Kim et al, 1997; Steiner et al, 1998; Honda et al, 1999; Marambaud
et al, 1998). Other activities known to affect the fate of PS1 include GSK-3p
phosphorylation of C-terminal hydrophilic loop, which results in its degradation
without affecting NTF levels (Kirschenbaum et al, 2001). Similarly,
phosphorylation of the PS1 Ser397 residue is responsible for eliminating excess
CTF prior to the appearance of a stable CTF in the long-lived heterodimer.
Lithium chloride has been reported to have several biological effects including
the specific inhibition of GSK-3(3 in the millimolar range. Lithium treatment of
HEK293 cells transfected with wild type PS1 results in a selective 3-fold
increase in the CTF, whereas NTF levels remain unaffected (Kirschenbaum et
al, 2001). Other reports demonstrate that the NTF residues 250-298 interact
with GSK-3P (Takashima et al, 1998: Khang et al, 1999) raising the possibility
that in cells over expressing the full-length fusion protein, increased GSK-3P
activity is responsible for the low numbers of transfectants observed.
Previous studies show that over expression of PS1 results in modest
increases in the steady state levels (Thinakaren et al, 1996; Kim, et al, 1999)
and that the holoprotein (wild type as well as PS1_exon9) is rapidly degraded if
not incorporated within the mature PS1 complex (Ratovitski et al, 1997; Steiner
et al, 1998). The low levels of the full-length fusion proteins certainly fit in with
these observations; however, levels of the truncated proteins are by
comparison, consistently high. Earlier it was demonstrated that 1039 antibody
staining does not co-localise with cells expressing the NTPS1 fusion proteins
suggesting that exogenous NTF do not form a heterodimeric complex with
endogenous CTF. Similarly, recombinant NTF298 has been detected by short
pulse labelling but not by steady state metabolic labelling (Citron et al, 1998),
and that over expressed NTFs not incorporated into the complex are degraded
by the proteosome (Steiner et al, 1998). The fluorescence and transfection rate
of NTPS1-EGFP exceeds that observed for the full-length molecules suggesting
a far greater stability. However, this observation conflicts with previous findings
that demonstrate ectopically expressed NTFs from both PS1 and PS2 are not
stabilised (Citron et al, 1998; Tomita et al, 1997; Steiner et al 1998), though
whether this relates to stability within a complex or ‘naked’ NTF is unclear.
192

Given that the PS fragments are tightly regulated following endoproteolysis, and
that holoprotein levels are consistently low, it can be concluded that the
absence of the N- and CTF pair within a heterodimer upsets the stoichiometric
regulation of PS leading to high levels of the truncated fusion protein.
A further explanation for the prevalence of NTFPS1-EG FP above that of
C T F P S 1-E G F P in transfected cells may well lie with the number of
transmembrane domains. The former has 6 TM domains compared to the
latter, which has 2 TM domains and is presumably less hydrophobic. In this
scenario, over expression of the transgene leads to the accumulation of the
hydrophobic NTF since limiting co-factors such as Aph-1 and Nicastrin needed
for PS endoproteolysis, only associate with the holoprotein (Takasugi et al,
2003; La Voie et al, 2003). Stabilisation of the PS holoprotein is thought to
occur through interaction with the Aph-1-Nicastrin complex to form a trimeric
intermediate complex that then binds to Pen-2, allowing for PS endoproteolysis.
Arguably excessive levels of ‘naked’ NTF are not recognised by these co
factors, leading the way clear for the hydrophobic truncated fusion protein to
form stable, long lived aggregates.
8.5 Expression and sub cellular distribution of EGFP-tagged presenilin in this
and previous studies
Studies in transfected cells as well as tissues show a wide distribution for PS
depending on the cell type. At the sub cellular level, presenilins co-localise with
markers for the ER and Golgi apparatus (Cook et al, 1996; Kovacs et al, 1996;
Takashima et al, 1996; Zhang et al, 1998) and have been identified in a host of
other cell compartments including the ERGIC compartment (Culvenor et al,
1997), at the plasma membrane (Takashima et al, 1996; Dewji and Singer,
1997; Kaether et al, 2002), in the nucleus and cytoplasm of the mouse embryo
(Jeong et al, 2000), at interphase kinetochores and centrosomes (Li et al, 1997),
within the inner membrane of rat mitochondria (Ankarcrona & Flultenby, 2002),
and within growth cones of neurons (Singh et al, 2001).
In this study the PS fusion proteins have been identified within the ER and Golgi
apparatus, though the full-length fusion is yet to be found in the latter
compartment. Similarly antibody staining with 1039 and NT7 show endogenous
193

and exogenous PS within the ER and Golgi compartments. Additionally, mutant
and non-mutant fusion proteins exhibit vesicular and blob-like aggregate
phenotypes and that FAD mutations do not affect the intracellular distribution of
the fusion proteins. This finding is in keeping with previous studies that similarly
show that FAD mutations do not affect the trafficking of PS, although Kim et al,
(2000) have found that four independent FAD-linked PS1 redistribute to the
intermediate region of an lodixanol gradient corresponding to the ER.
The use of GFP or EGFP as a tag to visualize PS within the cell is not
unique to this study, since other researchers have previously reported the
cloning of PS1 fusion proteins or their close homologues (Levitan & Greenwald,
1998; Singh et al, 2001; Kaether et al, 2002). In all these cases however, the
position of the fluorescent tag within PS1 is not the same nor are the results. In
one study the C.e legans PS holmologue SEL-12 was tagged after TM 6 within
the large intracellular loop (Levitan & G reenw ald, 1998). Assuming
endoproteolysis of this fusion protein the GFP signal would be associated with
the CTF of SEL-12. In functional studies this molecule was able to rescue a
egg-laying defect of a sel- 12 reduction-of-function mutant. Additionally, this
particular fusion protein locates to the ER/Golgi but not the plasma membrane
consistent with a role for SEL-12 in the constitutive cleavage of Notch and the
APP homologue LIN-12 (Levitan & Greenwald, 1998).
In another study investigating the role of PS in intercellular adhesion in
human epithelial cells and mouse neurons, PS was tagged with GFP at the N-
terminus region adjacent to TM1 using an ecdysone-inducible expression
system (Singh et al, 2001). Localisation studies revealed the presence of this
particular fusion protein within the cytoplasm and at cell-cell contacts of the
plasma membrane where it complexes with P-catenin, but not within the ER or
Golgi compartments. A truncated version of this molecule lacking the p-catenin
binding region neither immunoprecipitates with P-catenin nor localises to the
plasma membrane. Furthermore, L cells that do not form tight intercellular
contacts, formed clusters of adhered cells after stable transfection with the full-
length fusion construct (Singh et al, 2001). One obvious difficulty not addressed
by the authors concerns the membrane localisation of their fusion protein. The
accepted dogma for the insertion of a transmembrane protein asserts that the
194

N-terminus of the protein is first inserted within the lipid bilayer of the ER. How
the N-terminal, soluble EGFP moiety is incorporated along with PS1 is a
mystery. The cytoplasmic distribution of the fusion protein argues that the
protein is not integrated within the membrane. Furthermore, in this study
Western analysis was carried out using whole cell lysate but not the soluble or
membrane fractions.
Lastly, a PS1 fusion protein has been used to examine the trafficking of
nicastrin in transfected HEK293 cells, where a biologically active PS1-nicastrin
complex is targeted to the cell surface (Kaether et al, 2002). In this study EGFP
cDNA was inserted in-frame within the PS1 cytoplasmic loop, adjacent to TM6,
downstream from the endoproteolytic cleavage site, thus generating an N-
terminally located EGFP-CTF. In HEK 293 cells the fusion protein localised to
the ER, vesicular structures, the nuclear envelope and to the cell-cell borders.
Functionally, cells expressing the fusion protein generated Ap at amounts
comparable to those in cells expressing endogenous PS1. Additionally, this
fusion protein promotes AP40/42 ratio of ~9:1 in keeping with other reports
(Selkoe, 1999). The majority of PS in this study localises to the ER, however a
minority was detected at the plasma membrane. Kaether et al (2002) maintain
that this latter finding contributes towards resolving the spatial paradox that
exists between the site at which Ap42 is generated and the ER/IC location of the
P-and y-secretases (De Strooper et al, 1997; Annaert et al, 1999).
Discrepancies in the distribution of the various PS fusion proteins more
than likely reflect the position at which the tag is located, the cell type in which
the fusion protein is expressed, and the overall level of expression. Moreover,
the presence of the GFP tag itself may partially influence the distribution of PS1
in all the above studies making a direct comparison difficult. Interestingly none
of these studies reported the appearance of blob aggregates, though Singh et al
(2001) discarded PS1 over-expressing cell lines in favour of mild or moderate
expression in response to work by Johnston and colleagues who showed that
high levels of PS1 are associated with intracellular “aggresomes” (Johnston et
al, 1998). Furthermore, Singh et al (2001) argue that the presence of their
fusion protein at the plasma membrane is a reflection of the normal distribution
of PS1 in polarized cells and neurons, and that an initial ER/Golgi localisation is
195

transient. Thus these authors conclude that the localisation of PS1 in early
compartments in non-polarised cells such as HEK 293 or Cos-7 cells is due to
the absence of late compartment trafficking signals.
8.6 Functional aspects of PS fusion proteins
In the preceeding section the functional consequences of PS1-EG FP chimeras
from previous studies were discussed. In the present study the functional
relationship between the fusion protein and both APP and p-catenin was
investigated by antibody staining. Furthermore, to investigate the biochemical
properties of the fusion proteins, both mutant and non-mutant, in generating Ap,
a bicine gel capable of separating AP40 and AP42 was utilised.
Data from studies examining the proteolysis of APP reveal the presence
of different peptide fragments at various points along the secretory pathway, i.e.
ER, ERG IC , Golgi compartments, lysosomes/endosomes and the plasma
membrane (many authors). However, a spatial paradox exists between the ER
location of the secretases responsible for the cleavage of APP, and the site of
Ap generation (De Strooper et al, 1997; Annaert et al, 1999). PS1, for instance,
is localised to the ER/Golgi yet generation of the toxic Ap4 2 peptide occurs
within the ER/ERGIC (Cook et al, 1997; Chen et al, 2000), whilst the production
of the Ap4 o is thought to occur more distally within the secretory pathway
(Selkoe, 1999).
APP proteolysis is dependent on a-, p- and PS1 associated y-secretase
activity to generate several proteolytic fragments. To investigate the sub-
cellular distribution of the APP and the NTPS1-EG FP fusion protein, cells were
stained with APP antibodies specific to full length KPI-APP (993), the C99
fragment (874), and both the C99 and C83 stubs but not full-length, uncleaved
APP (DE2). Staining with DE2 and 874 antibodies in transfected Cos-7 cells
resulted in a reticular and peri-nuclear phenotype and showed only partial
localisation with the fusion protein (figures 6.4 and 6.5). 993-antibody staining
exhibited a distinctive microtubule-like staining pattern, which does not localise
with any of the phenotypes exhibited by the fusion protein (figure 6.3). Recently
APP was identified as a possible membrane receptor for the kinesin light chain,
196

a component of kinesin-1, a microtubule motor protein. Furthermore, a
compartment has been identified containing kinesin-1 and APP, together with
presenilin and P-secretase that are able to generate Ap (Kamal et al, 2001).
993 antibody staining may therefore provide additional evidence for the
structural relationship between kinesin-1, APP and microtubules.
In light of recent data showing the necessity of full-length PS1 to
associate with co-factors such as nicastrin, Aph-1 and PEN-2 prior to mature y-
secretase complex formation, it is not surprising that the truncated fusion
protein did not localise with any of the APP antibodies. Previously, an APP
binding domain has been mapped to the NTF of PS1, which interacts with the
immature, N-glycosylated form of APP, consistent with the localisation of both
immature APP and PS within the ER (Pradier et al, 1999). Full-length PS is
therefore required to bind APP. For comparative purposes, the APP antibody
experiment would be worth repeating in cells expressing both the mutated and
non-mutated full-length fusions proteins.
Antibody staining of p-catenin in cells expressing the NTPS1 fusion
proteins was restricted to the cytoplasm and the cell-cell contact (figure 6.2). No
co-localisation of p-catenin with the truncated fusion proteins was observed, nor
does it seem that the fusion protein alters this phenotype compared to
untransfected/low level expression in adjacent cells. In addition, there is no
evidence that mutant NTM PS1-EG FP affects p-catenin trafficking. However,
lack of NTF-p-catenin interaction is consistent with previous studies showing
that the CTFPS1 or full-length PS1 but not NTF, contain the p-catenin binding
domain (Murayama et al, 1998; Yu et al, 1998; Kang et al, 1999; Singh et al,
2001). In this context it would be interesting to note what effect mutated and
wild type full-length fusion proteins have on the p-catenin phenotype.
8.7 Detection of P-Amyloid
As a corollary to the section examining APP antibody staining, a bicine SDS
PAGE gel capable of resolving Ap40 from Ap4 2 (Wiltfang et al, 1997) was
prepared in anticipation that Ap levels would be assessed in transfected CHO
cells stably expressing APP 770. However, although this gel system successfully
197

discriminated between synthetic Ap peptides, and that AB10 immunoblotted
both APP from conditioned media and synthetic Ap, the peptide could not be
immunoprecipitated from conditioned media or complete media to which
synthetic Ap had been added, though APP immunoprecipitated freely.
Furthermore, serial immunoprecipitation and alterations to the protocol was
unable to resolve matters. One of the pathological features of Ap42 is its
increased aggregation potential compared to A p 4o. Under the present
experimental conditions it is conceivable that Ap42 may undergo a structural
change (figure 1.3) therefore limiting the binding epitope and consequently
AB10 immunoreactivity. However, if this were the case Ap40 immunoreactivity
should have been detectable since this peptide is not prone to aggregation.
The experimental conditions used herein closely matched those of Wiltfang et
al, who originally developed this gel system, except for the antibody used at the
immunoprecipitation stage (Wiltfang et al, 1997). An alternate method for the
detection of Ap is by the enzyme-linked immunoabsorbant assay (ELISA)
method (Suzuki et al, 1994), however due to time constraints this method was
not pursued. In conclusion, AB10 whilst able to detect APP and synthetic Ap, is
unable to immunoprecipitate the shorter peptides.
Had Ap been detected within the conditioned media from cells
expressing the mutant full-length fusion protein and APP 770 , it is likely that there
would have been an increase in Ap42 relative to Ap40 since ~100 PS1 mutations
have been identified to date all of which apparently increase the production of
A p42 (Selkoe, 1999). Expression of the NTPS1 fusion protein would not be
expected to generate Ap in transfected cells since previous research has shown
that NTF over expression does not increase Ap42 (Citron et al, 1998) nor is it
able to rescue mutant sel-12 in C.elegans.
8.8 Alterations in the ER and Golgi compartments
The decrease or absence of antibody staining of some markers for the cell
compartment as illustrated by figures 6.0 and 6.1 was unexpected and may
partially reflect toxicity induced by the presence of the fusion protein. It is
important to note that reduced antibody staining of the ER and Golgi marker
198

proteins was not observed in control cells or cells expressing low levels of the
fusion proteins, indicating that the fusion protein can be tolerated by the cell,
leastways, at low concentrations. The decrease in Colligin staining was most
obvious in cells expressing high levels of the fusion proteins where staining was
either reduced completely (figure 6.0, row a) or fragmented into vesicle-like
structures scattered about the cell (row b). In the latter case these vesicles do
not localise with the blob-like aggregate phenotype. Colligin functions as a
resident stress protein within the ER thought to participate in the intra cellular
processing, folding, assembly and secretion of procollagens (Nagata &
Yamada, 1986). Previously it has been demonstrated that Colligin expression is
reduced in human fibroblasts under conditions of serum deprivation (Sauk et al,
1990), and in chick embryo fibroblasts transformed by the Rous sarcoma virus
(Nagata & Yamata, 1986). In these instances cells are unduly ‘stressed’ due to
either trophic factor withdrawal or infection.
In the case of Cos-7 cells, stress induced by the accumulation of the
fusion protein may trigger alterations in the ER so compromising ER integrity as
measured by the decrease in Colligin levels. The accumulation of protein within
the ER occurs in response to cellular stress events including trophic factor
withdrawal, impaired calcium regulation, the inhibition of protein glycosylation,
and the reduction of disulphide bonds. Such stresses initiate a series of events
referred to as the unfolded protein response (UPR) (Imaizumi et al, 2001)
characterised by increased transcription of genes encoding ER-resident
chaperones such as GRP78/BiP, G RP94 and PDI. Impairment of the UPR is
ultimately linked to apoptosis and therefore cell death.
Another cellular event that may account for the reduction in Golgi
antibody staining occurs during cell division. Prior to mitosis cells undergo a
series of morphological changes including controlled ER and Golgi
fragmentation and vesicle formation so that organelles can be more evenly
distributed when the cell divides. Vesicles derived from the Golgi associate with
microtubules of the mitotic spindle ensuring an even distribution between the
two daughter cells (Lucocuq and Warren, 1987; Warren, 1989; Shima et al,
1998). Golgi fragmentation has also been previously observed as a late step in
apoptosis in odontoclasts treated with bisphosphonate (W atanabe et al, 2000).
Other studies have shown that Cos-7 cells transfected with mutant growth
199
hormone results in the accumulation of the hormone within the ER that
ultimately leads to Golgi fragm entation (G raves et al, 2001). As a
consequence, immunoreactivity for the Golgi markers p-COP, membrin and 58k
is completely dispersed or absent altogether. Additionally, the UPR in this study
was weakly induced as measured by a two-fold increase in GRP78/Bip mRNA
(Graves et al, 2001).
Taken together, these data suggest that the fusion proteins perturb the
cellular environment to the extent that some marker proteins to ER and Golgi
are severely reduced or dispersed possibly indicating fragmentation of the cell
compartment. The knock-on effects of these alterations may then be
responsible for induction of the UPR, though a definitive test would be to
examine any increase in the levels of Bip mRNA in cells expressing the fusion
protein.
8.9 The N-terminal fusion protein sensitizes cells to apoptosis
From the preceding section it is clear that a number of potential factors could be
cited to explain the reduced or absent immunoreactivity observed for the ER-
Golgi markers in cells expressing the fusion protein. In keeping with other
studies, immunoblot data indicate the presence PS caspase cleavage
fragments suggesting an apoptotic event associated with the presence of fusion
protein (figure 6.11 & 7.2; Kim et al, 1997; Podlisny et al, 1997; Kovacs et al,
1999). Moreover, in a follow-up experiment the truncated fusion protein was
found to statistically (P<0.05) increase the sensitivity of cells to STS-induced
apoptosis (figure 6.15). To gauge whether the truncated fusion protein was
associated with apoptosis, changes in Cos-7 cell morphology were assessed as
an end point of apoptosis. Specifically, changes in Golgi morphology were used
as an indicator of cell structural integrity by examining mannosidase II antibody
staining (figure 6.12). The number of apoptotic cells increased in a time
dependent manner following STS treatment and that this increase was greater
in transfected cells at all time points compared to the non-transfected, STS-
treated cells (figure 6.13).
In the context of AD, PS1 mutations have been demonstrated to increase
cellular susceptibility to apoptosis induced by trophic factor withdrawal and
200

exposure to Ap (Zhang et al, 1996; Walsh et al, 2002). Further studies show
that the presenilins are involved in the regulation of apoptosis, and that cells
expressing PS1 or PS2 FAD mutations die faster than cells expressing wild-
type presenilins (many authors). Chronic cellular stress culminates in apoptosis
involving nuclear fragmentation, chromatin condensation and shrinkage of cell
bodies, however, the images shown in figures 6.0 & 6.1 display intact, albeit,
misshapen nuclei in some cells, with no clear sign of nuclear fragmentation.
Additionally, not all cells exhibiting the blob-like phenotype show an equal
reduction in ER and Golgi antibody staining, suggesting that transfectants may
only be vulnerable to high levels of the fusion protein depending on the stage of
the cell cycle. In this regard, Janicki et al, demonstrate that over expression of
PS1 or PS2 FAD mutants potentiate cell cycle arrest in the G1 phase of the cell
cycle in exponentially growing cultures compared to wild type presenilin (Janicki
et al, 2000).
A more accurate determination of apoptosis was carried out by
assessing the degree of cleavage of the Golgi stacking protein Grasp65 as an
early event in apoptosis. Statistically significant differences were observed
between the number of STS-treated, Grasp65 negative, transfected NRK cells
expressing the fusion protein and the number of STS-treated control cells
(figure 6 .15). Crucially, there was no statistically significant difference in
apoptosis between control-transfected cells and non-transfected control cells
indicating that apoptosis was not spontaneously induced due to over expression
of the fusion protein (Guo et al, 1997; Kovacs et al, 1999). Whilst
immunofluorescent microscopy of NRK cells clearly show Grasp65 cleavage
(figure 6.14), immunoblotting (figure 6.16) failed to show the expected Grasp65
cleavage fragments (Lane et al, 2002). In all probability this discrepancy is due
to the different experimental approaches (see chapter 6.10).
The earlier observation that certain markers to the ER and Golgi
compartments are affected in transfected cells appears to extend to Grasp65.
Cells exhibiting the blob phenotype show reduced immunoreactivity or
fragmentation of the Golgi (figure 6.14), and decreased immunoblotting of
Grasp65 in transfected cells compared to non-transfected cells (figure 6.15). It
may therefore follow that less substrate will result in more effective cleavage in
response to a given apoptotic stimulus. How this effect is mediated within cells
201

expressing the fusion protein is unknown, though the blobs may impede
trafficking of proteins from the ER to the Golgi or they may physically disrupt
cellular organelles, perhaps by arresting cell division once organelles have been
disassembled prior to entering mitosis. If true, the cellular effect of the blob
phenotype will be independent of PS1 and may therefore represent a more
general phenomenon associated with the blob-like aggregates.
Whilst the above explanation that the blob phenotype may account for
some of the G RASP65 data, it is does not explain the reduction in GRASP65
antibody staining above that seen for control cells. For instance, from 77 non-
STS-treated control NRK cells expressing the transgene, 88% exhibited the
vesicular/blob phenotype. Only 7% of these cells were in fact, Grasp65
negative. Had the blob phenotype alone been responsible for apoptosis a far
greater number of cells should have been affected. However, as demonstrated
by immunofluorescence and immunoblotting data, there was an overall
reduction in G RASP65 staining within transfected cells compared to non-
transfected cells. It should also be noted that HEK293 cells stably expressing
the N-terminal and full-length PS1 fusion proteins both display the blob
phenotype, suggesting that transgene product numbers are tightly regulated
within the cell. If the blob phenotype occurrence is insufficient to account for all
cases of apoptosis, then the NTFPS1 fusion protein must be implicated in
apoptosis, either by directly affecting caspase activation/GRASP65 cleavage or
indirectly by interacting with some other aspect of apoptosis.
The involvement of presenilins in apoptosis was first suggested by
studies showing an increased sensitivity in cells to different apoptotic stimuli
following PS2 over expression, and reduced sensitivity in the presence of an
anti-sense PS2 construct (Vito et al, 1996; Wolozin et al, 1998). Additionally,
the presence of apoptotic stimuli induces caspase cleavage of the presenilins
proteins. The data on presenilins show PS2 to be pro-apoptotic, in particular
the N-terminus bearing the N114I mutation, and PS1 to be anti-apoptotic. In
both phenotypes presenilins have been linked to the tumor suppressor p53
activity, which appears to delay apoptosis by down-regulating PS1 expression
(Roperch et al, 1998). By contrast, PS2 and N141I-PS2 drastically increases
p53 expression and transcriptional activity in various cell systems (Alves da
Costa et al, 2002), whereas the C-terminal 103 amino acids of mouse PS2,
202

referred to as ALG3, rescues a T-cell hybridoma from Fas-induced apoptosis
(Vito et al, 1997). Recently it has been demonstrated that C TF-PS2 over
expression increases caspase-3 activity and immunoreactivity in STS-treated
cells, and PS"7' cells. The latter observation suggests that C TF-PS2 may
function independently of the N-terminal, y-secretase-derived counterpart (Alves
da Costa et al, 2003). The data presented herein suggest that the PS1
truncated fusion protein is proapoptotic, though whether this is a direct effect of
over expression, the presence of the blob-like aggregates or a PS1N TF-
mediated effect is unclear. That the PS1NTF fusion protein does sensitise cells
to apoptotic stimuli may be a novel affect since previous reports do not implicate
PS1NTF, unlike PS2NTF. Given the absence of data showing a pro-apoptotic
PS1NTF effect, it is tempting to associate over expression of the fusion protein
as being responsible for apoptosis in the present study.
8.10 Identity of the blob-like aggregates
The presence of the fusion protein results in four clear phenotypes that are
independent of the fixation method or the cell line in which they are expressed.
Immunoblotting reveals the presence of high weight bands that may correspond
to the blob-like aggregate phenotype. To address concerns that the EG FP
moiety may contribute to the phenotypes displayed by the fusion protein, a stop-
codon was inserted between the end of the PS1 cDNA and the beginning of the
EGFP cDNA sequences. The results show that all four stop-constructs when
expressed by the cell show near identical phenotypes to those seen in cells
expressing the fusion proteins (figure 7.1). In conclusion, the presence of the
EGFP tag has no effect on the phenotypes displayed by cells expressing the
various fusion proteins. Western analysis of cells expressing the stop-PS1
proteins show a similar immunoblot profile to endogenous staining of PS1
control cells (figure 7.2 b), with the exception that alternative CTF cleavage
typical of caspase activity is more prominent in cells transfected with PS1
cDNAs (Kim et al, 1997; Kovacs et al, 1999). However, that the
immunoreactivity is approximately equal for all constructs (figure 7.2b, lanes 2-
5) and is not just limited to the full-length cDNAs, suggest that over expression
of the transgene has a pro-apoptotic effect.
203

To aid in the identification of the compartment associated with the blob
phenotype cells expressing the truncated fusion protein were stained with an
array of antibodies to the cell compartment. No clear co-localisation with this
phenotype was observed following staining with Colligin, PDI, Ergic53, membrin
SNARE, Golgin245, Mannosidase II, (3-COP and COPII antibodies. Assuming
that the fusion protein is membrane-bound, these data suggest that the blobs
accumulate within a unique subcompartment. In a previous study examining the
localisation of PS, Kim et al, (2000) have reported the existence of a membrane
pool containing PS fragments that similarly do not contain markers of the ER,
Golgi, Ergic, CO PII vesicles, caveolar membranes, or endocytic vesicles.
However, though electron microscopy shows the presence of PS1
im m unoreactive com partm ents, these structures displayed a uniform
morphology and were considerably smaller than the blob phenotypes found
within the present study (Kim et al, 2000).
As with the earlier observations that the fusion protein affects the
distribution of some markers specific to the cell compartment, so the fusion
protein alters COP II staining from a peri-nuclear location to a fragmented or
diffuse/cytoplasmic distribution (figure 7.8), implying that anterograde vesicular
trafficking within the secretory pathway may be disturbed. The alteration in COP
II staining from a peri-nuclear to a cytoplasmic phenotype has previously been
reported during mitosis. Prior to cell division, protein transport is blocked at ER
exit sites as COP II and its binding partner Sec13 shifts from the ER to the
cytosol (Gorelick & Shugrue, 2001). Similarly, proteins exiting from th eE R in
COPII vesicles that cannot achieve their normal configuration accumulate
blocking the ER exit sites (Raposo et al, 1995). Whether this observation holds
true for the fusion protein or that altered COP II staining in Cos-7 cells is the
result of mitotic events is unclear, though in the latter case PS1 over expression
potentiates cell cycle arrest in the G1 phase of the cell cycle (Janicki et al,
2000).
An initial consideration in the genesis of the blob phenotype was that
they arise as the result of the fusion protein-containing compartment undergoing
successive rounds of fusion with each other to generate the blob phenotype.
Ordinarily, transmembrane proteins are concentrated at ER exits sites by the
presence of COPII. This is further assisted by the presence of di-acidic (DXE)
204

concentration signals in the cargo protein (Nishimura et al, 1999). A search of
the amino acid sequence of PS1 revealed the presence of 5 DXE signals
suggesting that PS1 may be concentrated at ER exit sites. The presence of the
coat proteins and transmembrane adapters/receptors of the COPII coat is also
believed to prevent the fusion of cargo vesicles with each other and with other
membrane compartments (Gorelick and Shugrue, 2001). This raises the
possibility that the reduced COPII levels (figure 7.8) affects the insulation
properties of the coat so allowing the cargo vesicles carrying the fusion protein
to fuse together, thereby forming the blob phenotype.
8.11 The fusion protein, aggresomes and the ubiquitin-proteasome system
The lack of co-localisation with markers to the cell compartment prompted an
investigation into what mechanism might be responsible for the removal of the
blob-like aggregates. The two major pathways for the degradation of damaged
or unwanted proteins are carried out by the lysosome and the proteasome. The
lysosomes are membrane-bound, acid hydrolase-containing vesicles that deal
primarily with extracellular proteins, that are endocytosed by the cell, or cell-
surface membrane proteins used in receptor-mediated endocytosis. Antibody
staining of lysosomes with LAMP-1 produces a distinctive halo (Chen et al,
1985) quite separate from the blobs suggesting that the lysosomes are not
responsible for the degradation of the fusion protein (figure 7.9).
The alternate proteolytic pathway involving the proteasome is known to
operate in the removal of PS1 (Kim et al, 1997). Staining with a newly
purchased antibody to the 20S subunit failed to resolve any detail within the
cell, therefore an anti-ubiquitin antibody that recognises proteins tagged for
proteasome destruction was used to stain cells displaying the blob phenotype
(figure 7.10). Furthermore, immunoanalysis shows that only those higher
weight bands from the membrane fraction show ubiquitin immunoreactivity
(figure 7.10, panel d), suggesting that these bands correspond to the blob-like
phenotype. The co-localisation of the ubiquitin antibody with the blob-like
aggregates indirectly shows that the fusion protein may be targeted for
proteasome destruction.
205

Allied to the breakdown of proteins by the proteasome is the role-played
by a novel structure responsible for the containment of excess misfolded
protein. Within the present study the description of the blob phenotype as an
aggregate was meant purely in the generic sense of the word, however, work
carried out by Kopito and colleagues have characterised the existence of a
single, stable, juxtanuclear aggregate referred to as an aggresome (Johnston et
al, 1998). These structures are a general response by the cell to protein over
expression and can be generated artificially by inhibiting the proteasome. Once
the degradative capacity of the proteasome is exceeded, polyubiquitinated
protein aggregate at the microtubule organising centre (M TO C ), and is
accompanied by the rearrangement of the intermediate filament protein (IF)
vimentin, which forms a containment cage around the aggregated protein core
(Johnston et al, 1998).
In the present study, given their high number, the presence of numerous
fusion protein blobs and their location within the cell militate against them being
aggresomes, since the latter are found as single structures. Nevertheless,
previous reports show that PS2 is targeted for degradation by the proteasome
(Kim et al, 1997) and that PS1 readily form aggresomes following proteasome
inhibition (Johnston et al, 1998). To evaluate whether the N TM P S1-EG FP
fusion protein similarly forms aggresomes, cells expressing the fusion protein
were treated with the proteasome inhibitors lactacystin or M G132. Aggresome
formation was seen in both HEK293 and Cos-7 cells following proteasome
inhibition and that these structures were contained by the IF vimentin (figures
7.11, 7 .12 & 7 .13). Furthermore, proteasome inhibition increased the
fluorophore signal in transfected cells and was accompanied by increased
ubiquitin immunoreactivity of the high weight aggregates (figure 7 .14).
Additional antibody staining diagnostic for the presence of aggresomes was
also investigated. Antibodies to y-tubulin, mitochondria and MTOC co-localised
with the fusion protein in drug treated cells (figure 7.17).
Although the fusion protein readily forms into an aggresome in response
to proteasome inhibition, the blob phenotype persists as a distinctive ring
around the aggresome that appears to lie outside the margins of the vimentin
cage (figure 7.13). This latter observation suggests that while moderate levels
of the fusion protein can be effectively contained within the aggresome, the
206

blobs remain excluded, perhaps as a reflection of their structure or insolubility.
The formation of the aggresomes are dependent on an intact microtubule
network as seen following experiments with the microtubule-disruption agent
nocodazole (Johnston et al, 1998) and by disruption of the dynactin-dynactin
complex by over expression of p50/dynmatin (G arcia-M ata et al, 1999;
Johnston et al, 2002). Nocodazole treatment of cells expressing the fusion
protein whilst preventing aggresome formation had no effect on the blob
phenotype (figure 7.18), which remains dispersed throughout the cell. However,
the presence of the blob as a ring surrounding the aggresome indicates the
requirement for intact microtubules for transport to this location, but not for their
formation.
The lack of antibody staining of the blob phenotype provided no clear
indication as to the cellular location/compartment from which the blobs
originated. Although antibody staining data suggest otherwise, the assumption
was made that blobs may nonetheless develop according to the scheme:
ER/Golgi>Vesicles>Blobs. To address this issue cells were transfected with the
truncated cDNA and imaged by fluorescent microscopy over a 6 hour period
(figure 7.19). Initially, the fusion protein is limited to the ER after a 3 hour
period, however, this quickly changes and by four hours post-transfection, the
first signs of the blob phenotype appear as circumnuclear ‘swellings’ intimately
associated with the reticular-nuclear interface. Measurement of the blobs show
that they range in size from -2 5 0 nm up to -3 .7 5 pm (long axis). The first signs
of a peri-nuclear phenotype appear after 4 to 5 hours, and by 6 hours cells
exhibit the full range of phenotypes.
One possible explanation to account for the genesis of the blob
phenotype may involve blobs arising firstly as ‘swellings’ at the reticular-nuclear
interface. Secondly these ‘swellings’ attain a particular size after which time
‘mature’ blobs may detach from the nuclear-reticular interface, and scatter as
cytoplasmic inclusions (figure 7.20, a-d). Ideally this sequence of events could
be verified by recourse to time-lapse fluorescence microscopy using live cells.
In a follow-up experiment, the time intervals post transfection were
extended to 58 hours. However, there was no change in number of cells
displaying the blob phenotype between each time point, 10 hours after first
transfection (data not shown). The proposed sequence of events leading up to
207

the formation of the blobs i.e. ER/Golgi>vesicles>blobs, does not seem to hold
true since the phenotype and their numbers do not change over time. In
summary, these data suggest that over expression of the transgene determines
the appearance the blob phenotype. The blob phenotype may therefore reflect a
controlled attempt by the cell to contain over expression of the fusion protein. In
this view the blobs may even be seen as a protective mechanism insulating the
cell form high levels of the fusion protein.
8.12 TEM analysis of Cos-7 cells expressing the fusion protein
The data from the preceding section suggest that the blobs arise from the
nuclear membrane/ER interface, however, this data falls short of answering the
question as to whether or not the blobs are cytoplasmic aggregates or
membrane-bounded structures. Close inspection of figure 7.13 (row c, middle
panel) as viewed on a high definition cathode-ray screen, reveals the presence
of a margin that contrasts sharply with the interior of the blobs, suggesting a
membrane-bound structure. This observation was followed-up by analysing the
ultrastructure of transfected Cos-7 cells using TEM (figure 7.21, A-O).
TEM revealed the presence of familiar organelles such as numerous
mitochondria (A,J,K), lysosomes (A), vacuoles (A) as well as several
unexpected features including unusual laminar bodies resembling myelin-like
whorls (B -F ,L -0 ), electron dense regions scattered throughout the cell
resembling compressed tubules (A), phagosomes (D,F,G), autolysosomes (C)
and whole swaths of cytoplasm devoid of any discernable detail (Fl-M). The
latter observation is clearly depicted in L-O, whilst image H shows dense
granular remnants surrounded by a vacuole that may show an early event in the
removal of the surrounding cytoplasmic contents. Close inspection of the
lamininar bodies reveals the presence of concentric, electron-dense lines that
appear to be enveloped by multiple layers (O). Many of these bodies have a
empty inner core which ultimately becomes electron dense. Figures B and C
show an unusual arrangement of the ER, which appears to surround the entire
region occupied by the laminar bodies. Additionally, patches of the nuclear
membrane in the region of the laminar body appear discontinuous or absent
altogether (D-G). Interestingly, no clear ER or Golgi structures are visible, which
208

may explain the earlier data showing a reduction in some cell compartment
markers.
8.13 Autophagosomes and multilaminar bodies in transfected cells
In previous TEM studies the aggresome presents as a fine network of closely
packed filamentous material that surrounds the centriole (Johnston et al, 1998;
G arcia-M ata et al, 1999). However, TEM in the present study show no
analogous structures to the aggresome. A prominent feature of transfected
cells is the presence of autophagosomes and numerous other structures
associated with them, such as lysosomes and myelin-like whorls (figure 7.21).
Autophagy is an evolutionary conserved process present within plants, animals
and fungi, and is the primary mechanism by which long-lived stable proteins are
degraded and is the only mechanism by which entire organelles such as
mitochondria and peroxisomes are recycled. Ultimately, autophagosomes by
breaking down protein provide amino acids necessary during starvation (Dunn,
1990). The autophagic response is a highly regulated event influenced by
several factors including second messengers, purines, growth factors, and
adrenergic agonists and kinase/phosphatase activities. One outstanding issue
concerning autophagy is the mechanism by which cells sense the starvation
signal. Recent studies in yeast suggest that a dedicated signal transduction
mechanism may stimulate autophagy directly (Abeliovich et al, 2000)
Autophagy involves dynamic rearrangement of cellular membranes. The
sequestering membrane is thought to derive from the ER to form an enwrapping
vesicle capable of engulfing proteins, organelles and lipids. Initially bounded by
a single membrane, the autophagosome fuses with a primary lysosome (also a
single m em brane bound com partm ent) to form a double m em brane
autophagolysosome (Dunn, 1990; Klionsky & Emr, 2000). The presence of
autophagosomes and autophagolysosomes constitute autophagic vacuoles.
The inner membrane disintegrates and the vacuole contents are digested and
recycled to yield amino acids. Control has been partially resolved in yeast
where autophagy is under the influence of apg genes and mam m alian
homologues to the apg proteins beclin and LC3 have been discovered (Larsen
and Suiza, 2002). In yeast many genes have been discovered that appear
209

necessary for autophagy. In some cases the mammalian homologues have
been identified. The process of autophagy has five broadly defined phases with
each phases being reflected by several genes: Induction- this involves several
kinases such as Tor2, a rapamycin-sensitive protein kinase. Conjugation- this
operates in a similar fashion to the mammalian ubquitination conjugation
system. Apg7, for instance, codes for an E1 -like ubiquitin activating enzyme.
Size regulation- Aut2 activity is up-regulated during starvation periods and is
responsible for regulating the size of the autophagosome. Docking and fusion-
Vam3 in yeast and Syntaxin7 in m ammals are exam ples of SN AR E
components necessary for the trafficking of vacuoles during autophagy. As with
cargo transport in mammalian cells, Rab GTPase activity is required to mediate
docking and fusion events. Breakdown- several genes encode a series of
degradative lipases and proteases and components responsible for acidifying
the vacuolar to maintain optimum enzymic activity (Klionsky & Emr, 2000).
The presence of myelin-like whorls (figures 7.21 B-G, L-O) has been previously
described in many organisms under a variety of conditions. In the
macrophages of rabbit alveolar the number of myelin bodies within a single
inclusion varies considerably; many small circular profiles or a single large,
membrane whorl may occupy the entire inclusion (Nichols, 1976). Such
heterogeneity may be explained by representing different stages of digestion.
The presences of so much myelin suggest macrophages ingest large quantities
of lipids (Nichols, 1976). Higgins et al, (2001) examining canine tumours of the
CNS reported intense ubiquitin staining and autophagosomes containing
membrane-bound granules with a dense core and outer halo, empty vesicles
comprised of autophagic vacuoles and myelin-like whorls. These single
membrane-bound intralysosomal structures are separated by large empty
spaces, not unlike those shown on figure 7.21 (L-O). Similarly, the blob-like
aggregates are also ubiquitinated and appear to have a dense core and an
outer halo.
Membrane whorls can also be induced experimentally following drug
treatment. Inhibiting sterol biosynthesis in the parasite Leishmania amazonensis
induces the formation of inclusion vesicles identified as acidocalcisomes
210
(Vannier-Santos et al, 1999). Here the ER cisternae form membrane whorls,
which enclose large portions of the cytoplasm and some acidocalcisomes.
Calcium within these structures may be involved in the stacking of parasite
membranes, since it can promote a rapid interaction between multilamellar
phosopholipid vesicles that resemble myelin whorls. The authors conclude that
the enhanced membrane content of the autophagic vaculoles present indicate
an altered phosopholipid turnover rate in response to sterol biosynthesis
inhibition (Vannier-Santos et al, 1999). Just as the ER surrounds the
acidocalcisomes, so perhaps the ER encloses the multilaminar bodies as
suggested in figure 7.21 (B, C, H). In these images the elongated double unit
membrane tubule extends to form a border around the autophagic body, but
does not appear to encircle it completely.
Membrane whorls can also form following methamphetamine treatment
of neuronal cultures as well as causing neurodegeneration, which typically
results in the disappearance of neurites but not cell bodies due to autophagic
activity (Larsen & Sulzer, 2002). Xue et al (1999) have also demonstrated the
presence of membrane whorls associated with phagosome activity in normal,
non-drug-treated sympathetic neurons.
In the present study TEM of Cos-7 cells expressing the fusion protein
reveals the presence of numerous autophagic bodies in varying stages of
maturity that are also associated with numerous laminar bodies showing
similarly heterogeneity. Given these features, it seem likely that the NTFPS1-
EGFP fusion protein is able to stimulate autophagy, though whether this is
related to over expression or a NTFPS1 mediated effect is unknown. Because
autophagy operates under condition of nutrient starvation, it is tempting to
believe that some aspect of the fusion protein may some how mimic the
starvation conditions within the cell that trigger autophagic response.
8.14 Consequence of fusion protein over expression
The absence of fusion protein blobs from cells expressing moderate levels of
the fusion protein suggests that over expression of the transgene is the primary
cause of the blob-like aggregates. It may be that a certain level of expression
can be tolerated by the proteasome. Any increase above this level of
expression or inhibition of the proteasome leads to the formation of aggresomes
211

(Johnston et al, 1999). In the case of the PS1 fusion protein, the presence of a
highly hydrophobic molecule without a stabilizing influence that assists in
burying the exposed transmembrane domains i.e. the CTF partner or co-factors
such as nicastrin, is more likely to aggregate and conceivably present problems
for the cell in how to dispose of it, especially under conditions of over
expression. The constant drive of the transgene, which inevitably increases
levels of the protein, may overload the proteasome leading to aggresome
formation. In all the transfected cells surveyed only a handful show the
presence of aggresomes, however, Kopito (2000) warns that a Golgi-like
phenotype can easily be mistaken for the presence of an aggresome.
The question arises as to the limiting factors behind aggresome
formation. Are they limited to a particular size, perhaps dictated by levels of the
fusion protein or IF available to contain them? In the present study the blob-like
aggregates are clearly distinct from the aggresome in terms of structure,
number and location. Moreover, following proteasome inhibition the blob-like
aggregates circle around the aggresome, suggesting that they might be
resistant to proteasomal degradation. If correct, then the proteasome is not
solely responsible for the breakdown of presenilin aggregates within the cell. In
this instance the role of the phagosome may be important. In this context,
Gelman et al, (2002) used a cystic fibrosis transm em brane conductance
regulator GFP fusion protein (CFTR-G FP), to investigate previous reports that
proteasome inhibition is insufficient to account for all instances of CFTR
degradation suggesting the action of an ATP-independent proteolytic pathway.
However, inhibition of the autophagy had no m easurable effect on the
breakdown of CFTR-G FP even after proteosomal inhibition indicating that the
UPS degradation is the dominant pathway for the disposal of misfolded CFTR-
GFP (Gelman et al, 2002). If this observation applies to all transmembrane
proteins then presumably PS is similarly affected, however, the presence of
phagosome activity in cells expressing the fusion protein argues that this
assertion may not hold true, leastways, within the present study.
212

8.15 Impairment of the ubiquitin proteasome system
One explanation for the presence of the blob-like aggregates may lie in
considering the effects this phenotype has on the UPS. The degradation of
proteins by the ER relies on the UPS, which relies on ATP hydrolysis for
activation of ubiquitin and substrate unfolding. Any disturbance in this system is
of crucial importance in the management of protein levels by the cell. The notion
that the fusion protein may interfere with the UPS is not without its precedent.
Recently the presence of a novel presenilin binding protein (PBP) expressed
specifically in the brain has been documented, which in its soluble form, is
reduced in AD brains compared to controls. Over expression of PBP or
proteasome inhibition generates aggresome formation in Cos-7 cells and
neurons (Nam ekata et al, 2002). From these observations and other reports,
that proteasome activity is significantly suppressed in the hippocampus of AD
patients, and that mutant ubiquitin in AD can suppress degradation by the
proteasome, suggest that impaired proteasome function may be crucial in the
pathogenesis of AD (Namekata et al, 2002). This conclusion is based on the
association of PBP with NFTs in AD brain, where it modifies the activity of GSK-
3(3, one of protein kinases that phosphorylate tau (Takashim a et al, 1998).
Based on these observations the authors believe that PBP, which may regulate
the activity of tau phosphorylation under normal conditions, may accelerate the
formation of NFTs once it is sequestered into an aggresome due to impairment
of the UPS.
Davies and Murphy, (2002) report the derangement of ER in rat neurons
expressing mutant transgene found in Familial Neurohypophyseal Diabetes
Insipidus (FNDI). Immunocytochemistry reveals the presence of mutant protein
as aggregates within the ER, which are targeted for lyosomal degradation by
autophagy. In trying to explain the loss of wild type vasopressin activity in cells
expressing the defective FNDI allele, the authors propose that mutant protein
accumulating within the ER by thiol retention is likely to be targeted to the UPS,
whilst wild type vassopressin traffics normally through the secretory pathway.
However, the build up of mutant protein within the ER traps normal protein
within aggregates. Under these conditions the UPS is incapable of dealing with
the aggregates therefore a rescue attempt is launched by the more general
213

degradation system of autophagy. In the process the deranged ER is removed
and along with it, normal vasopressin thus leading to the disease phenotype (Si-
Hoe et al, 2000; Davies & Murphy, 2002). This may also hold true for the fusion
proteins. As they accumulate so perhaps the UPS is similarly effected resulting
in autophagy as a means of rescuing the ‘deranged’ ER, hence the decrease or
absence of some markers for the ER.
Other data show an increased propensity of mutant rhodopsin to self
associate into toxic high-weight aggregates that impart a robust gain of function
directly linked to pathogenesis caused by impairment of the UPS (llling et al,
2002). Furthermore, expression of mutant CFTR and a CAG repeat-huntingtin
fragment likewise caused the near complete inhibition of the UPS (Bence et al,
2001). Also, McNaught et al, (2002) show the presence of numerous discrete
ubiquitin protein aggregates in the neurone bodies in Parkinson’s disease and
‘dementia with Lewy bodies’ (DLB). These aggregates are transported to the
MTOC where they are sequestered to form Lewy bodies in neurons. They
propose that Lewy body formation in PD and DLB is an aggresome-related
attempt at protecting neurons from increased levels of potentially toxic proteins.
An inability to curb levels of these proteins through regulated degradation could
potentially cause the failure of the UPS and aggresome culminating in the
aggregation of proteins into Lewy bodies. Again, a compromised UPS may
similarly lead to the formation of the blob phenotype. This latter observation
then provokes the question as to the role of Lewy bodies. Are they
neuroprotective structures induced to shield cells from potential toxicity
imparted by rising protein levels in response to a compromised UPS? Could
the blobs likewise be an adaptive response to excessive levels of the fusion
protein?
Lastly, Harada et al, (2003) show inhibition of the proteasome in cultured
cells induces the formation of autophagic vacuoles and lysosomes and
ubiquitin-IF inclusions that disrupt the Golgi apparatus. Similarly, Golgi
fragmentation has been reported in the neurons of patients with familial
amyotrophic lateral sclerosis (FALS) and its animal model. The inhibition of the
proteasome induces IF inclusion, accompanied by a loss in the IF network
which has the knock-on effect on Golgi organisation, and presumably the
passage of materials through the secretory pathway (Harada et al, 2003). From
214

the above reports in is tempting to speculate that the blobs may indeed disrupt
the UPS and that this impairment stimulates the alternate autophagic pathway
responsible for the ER and Golgi alterations.
8.16 Formation of the blob-like aggregate phenotype
A possible scenario to account for the blob phenotype may be one in which
moderates levels of the fusion protein are initially tolerated by the cell and
degraded by the proteasome. However, increases in the level of the fusion
protein may then saturate the proteasome leading to the formation of
aggresomes. Once the capacity of the aggresome to sequester excessive
levels of the fusion protein is reached, perhaps due to size constraints,
membrane enwrapping of the ER begins at the nuclear/ER-interface (figure
7.20), leading to the formation of the fusion protein blobs, which ultimately
stimulate autophagy. One difficulty with this scenario is that it assumes that the
blobs form once the proteasome-aggresome capacity has been exceeded. As
mentioned earlier, very few cells appear to show the presence of aggresomes,
however, it is possible that their presence may be mistaken for the Golgi
apparatus (Kopito, 2000). Furthermore, in stable HEK293 cells expressing the
blob phenotype there is no evidence of aggresome formation. In fact data
suggest that the blobs are stable, long-lived structures whose presence may be
tolerated by the cell (figure 6.9, middle panel), indicating that the cell must be
able to deal with these blobs prior to entering mitosis.
A outstanding issue concerning the blobs is the mechanism underlying
their formation. Could the fusion protein saturate the membranes of the nuclear
/ER-interface until they eventually ‘pinch off’ as suggested by figure 7.20, or do
the blobs form as insoluble protein aggregates giving the appearance of
membrane-bound structures? Could the blobs be examples of inclusion bodies
or aggregates? Kopito (2000) maintains the necessity to distinguish between
aggregates (non-native protein oligomers) and inclusion bodies, which are
microscopically distinct cellular regions into which aggregated proteins are
sequestered. In FALS, which is characterised by the presence of inclusion
bodies, cellular pathology is paralleled by the presence of mutant superoxide
dismutase (SOD) aggregates long before such SOD inclusion bodies appear.
215

This suggests that the toxicity associated with this disease is related to the non
native configuration adopted by SOD and may hold true for other diseases
(llling et al, 2002). The immunoblotting data in the present study are unhelpful
in resolving aggregates from inclusion bodies since both outcomes can be
represented by the membrane fraction. However, inclusion bodies are usually
present in low copy numbers, often only one per cell, whereas the blobs number
in the tens.
As the blobs arise from the nuclear/ER interface, it may be that the
membrane system at these points becomes saturated as successive levels of
the fusion protein build up. If unchecked, such high levels may eventually
cause ER enwrapping, resulting in the formation of the multilaminar bodies, and
in the process a substantial body of lipid membrane may be lost. Certainly this
would explain the decrease in markers for both the ER and Golgi
compartments. Presumably smooth ER sites overloaded with the fusion protein
may effectively exclude other membrane resident proteins, since the decrease
in ER antibody staining is seen only in cells expressing high levels of the fusion
protein. The role of the phagosome may be crucial in this respect, since
attempts at engulfing the laminar bodies may, in the process, consume healthy
ER leaving behind the almost empty vacuole (figure 7.21 L-O). In fact this may
explain the small amount of ER and the lack of a discernable Golgi
compartment observed following TEM.
A similar mechanism to account for the loss of ER markers has been
proposed by Si-Hoe et al, (2000). In this scheme misfolded vasopressin
aggregates ‘derange’ the ER activating the lysosomal-linked autophagic
pathway. During autophagocytosis deranged ER is removed and along with it,
normal vasopressin, thus leading to the disease phenotype (Si-Hoe et al, 2000).
Moreover, studies examining the affect of mutant growth hormone in Cos-7 cells
have suggested that misfolded proteins might exert their toxicity by disturbing
the ER-to-Golgi trafficking of secretory proteins (Graves et al, 2001).
216

8.17 Blobs-insoluble aggregates, inclusion bodies or membrane-bound
compartments?
One concern regarding transfection experim ents is that the transiently
expressed membrane proteins tend to overload the secretary pathway, leading
to aberrant trafficking and metabolism of the exogenous polypeptide and in
many instances, endogenous membrane proteins. Moreover, it has been
suggested that PS1 and PS2 are inherently ‘sticky’ proteins with a propensity to
form aggregates (Kovacs et al, 1996; Kim et al, 1997; Thinakaran et al, 1997;
Citron et al, 1997). This propensity to aggregate could easily explain the blobs
as insoluble cytoplasmic aggregates and may well represent aggresome-related
structures, albeit unusual ones in which a vimentin cage is absent (figure 7.12 a
& b), though this does not rule out an alternative cage protein. To account for
this scheme, the fusion protein must be removed from the membrane to
facilitate aggregation within the cytoplasm. Kopito (2000) argues the case for
CFTR, which may enter straight into the cytostolic pool, possibly due to failure
of, or inefficient translocation. It is well established that the 26S proteasome is
able to extract ER-transmembrane proteins from the lipid bilayer (Mayer et al,
1998). One such example is the processing of CFTR within the endoplasmic
reticulum by the proteasome.
One other consideration regarding the blobs is that they are examples of
inclusion bodies. Kopito (2000) proposes two models to explain inclusion body
formation. In the first model protein monomers are directly deposited into a
single inclusion body that grows steadily in size as more and more protein
aggregate, whilst in the second model, proteins form into small aggregates at
the cell periphery, possibly by a nucleation process, before being delivered to a
far larger, nascent inclusion body. Certainly the nucleation aspect of the latter
model is supported by the present study. Furthermore, a more precise model
envisages the requirement of these aggregates to travel along microtubules
towards the aggresome, a finding previously demonstrated by Garcia-Mata et
al, (1999). A similar observation was made in the present study: In NTFPS1-
EGFP expressing cells treated with both nocodazole and the proteasome
inhibitor M G132, the blobs remained dispersed throughout the cell, however,
MG132 treatment alone results in the blobs encircling the aggresome (figure
217

7.13 c & d). This result shows that the blobs do not require an intact microtubule
system for their formation; however, proteasome inhibition shows a requirement
for microtubules to transport the blobs to the MTOC.
In proposing that the blobs are inclusion bodies and not membrane-
bound, the fusion protein following ‘dislocation’ through the ER membrane, must
be targeted directly for destruction by the proteasome or else aggregate (Kopito
& Sitia, 2000). In both fates the fusion protein will be polyubiquitinated and
indeed this is the case for blobs (figure 7.14). A remarkable feature regarding
the EG FP moiety, besides its reporter activity, is its ability to maintain
fluorescence after being dislocated though the ER membrane. After all, if the
blobs are inclusion bodies, how can they fluoresce given that they would
ordinarily be ‘unwound’ (linearised), ‘N-terminal’ first, before being introduced
back into the cytoplasm where they would then, presumably, aggregate due to
exposure of the hydrophobic TM stretches. The EGFP moiety requires folding in
order to generate fluorescence, so is it conceivable that the fusion protein
unfolds all except the EGFP moiety, which remains intact and functional, or that
within the aqueous, reducing environment of the cytoplasm EGFP re-assumes
its native conformation and the unfolded hydrophobic PS stretches aggregate?
Are the blobs therefore composed of partially unfolded PS1 but intact EGFP?
Furthermore, could polyubiquitinated EG FP adopt a native conformation
following covalent modification by ubiquitin? A parsimonious explanation is that
EGFP can tolerate such treatment and that this only goes to show how
remarkably robust EGFP is, hence its utility in many cell-based assays.
8.18 Apoptosis and autophagy
W hether the fusion protein blobs are membrane-bound, multilaminar bodies
resembling myelin-like whorls, or inclusion bodies formed from aggregates is
currently unclear. The evidence suggests that the blobs may stimulate both
autophagy and sensitise transfected cells to apoptosis. Autophagy figures
prominently in apoptosis and is also responsible for degrading proteins involved
in cellular remodeling found during metamorphosis, aging and differentiation. It
has been suggested that autophagic (type 2) death is distinct from apoptotic
(type 1) death (Clarke, 1990). Morphologically, apoptosis involves nuclear
218

condensation, DNA fragmentation, organelle swelling, cytoplasmic vacuolization
and nuclear envelope disruption, w hereas autophagy correlates with
autophagosomes, autolysosomes, electron-dense membranous autophagic
vacuoles, myelin whorls, multivesicular bodies, as well as engulfment of entire
organelles. The latter observations are suggested by the TEM data shown by
figure 7.21, however, there is little sign of the morphological changes that
accompany type 1 apoptosis. For instance, the TEM data show intact
mitochondria (figure 7.21, J, K).
Apoptosis in AD is well established and cleavage of PS1 and PS2 by
caspase-3 generates anti-apoptotic CTF (Vito et al, 1997), however,
Stadelmann et al, have noted that the frequency of DNA fragmentation is too
high to account for the continuous neuronal loss in AD extending over many
years. Staining for caspase-3 in AD brain revealed the presence of the
activated enzym e within autophagic bodies, referred to as granules of
Granulovacuolar Degeneration (GVD) (Stadelmann et al, 1999). The authors
conclude that the containment of activated caspase-3 within GVD-autophagic
vacuoles serves to counteract apoptosis within the AD brain. Similarly,
Tolkovsky and colleagues have dem onstrated autophagy can precede
apoptosis suggesting that it may have a protective role in programmed cell
death (Xue et al, 1999). In section 8.9 the role of the fusion protein was
discussed without mention as to whether this was type 1 or type 2 apoptosis. In
light of the TEM data showing the absence of classical morphological changes
typical of type 1 apoptosis, and the presence of numerous autophagic bodies, it
is possible that type 2 apoptosis is responsible for the increased caspase
activity seen in control and non-transfected cells (figure 6.11 & 7.2b). Within the
present study, the fusion protein sensitizes cells to apoptosis following STS
treatment, however, in the absence of proapoptotic stimuli, autophagic activity
may be responsible for type 2 apoptosis. This does not mean that autophagic
activity is not present under STS conditions. These data suggest that caspase
cleavage of PS1 may be associated with type 2 apoptosis and autophagy.
To restate the earlier contention, proteasome action and aggresome
formation may be insufficient to deal with excessive levels of the fusion protein
leading to the activation of the alternate phagosomal pathway. A difficulty with
219

this interpretation is the absence of LAMP1 co-localisation with the blob
phenotype (figure 7.9), indicating that the lysosomal pathway is insufficient to
explain the presence of the blobs. However, if the multilaminar bodies are
composed of the fusion protein, then according to the TEM data they may be
resistant to lysosomal degradation since a consistent feature observed is the
absence of any surrounding detail except for the presence of a residual laminar
body eccentrically located within the autophagic vacuole. This is readily seen in
figures 7.21 (J, K, N). Barring proteasome degradation of the blob-like
aggregates and resistance to lysosomal degradation, how then are the laminar
bodies dealt with? One clue may come from figure 7.21 A (inset), which shows
the expulsion of an autophagic vaculole, and presumably with it the multilaminar
bodies. This raises the possibility that the fusion protein may be detectable
within the extracellular medium. In fact, one such study has recently
dem onstrated such a phenomenon. Benussi et al, (2001 ) show by
immunoblotting the presence of PS CTF and weak membrane NTF in the
conditioned media taken from rat neurons and HEK293 cells. Furthermore, this
release of PS fragments proposed as ‘membrane shedding’ increases under
apoptotic conditions following STS treatment. Interestingly, caspase inhibition
had no affect on the release of CTF, suggesting that the CTFPS1 pool destined
for secretion maybe generated by a caspase-independent pathway (Benussi et
al, 2001). This membrane shedding may therefore be related to the autophagic
pathway.
In the case of HEK293 cells stably expressing the fusion proteins, the
presence of the blobs appear to be tolerated by the cells. W hether the
proteasome is responsible for their clearance or if they are ejected from the cell
by phagocytic activity is unknown. The high number and overall dimensions and
morphology argue against the blobs being aggresomes, Lewy bodies or Russell
bodies (Kopito & Sitia, 2000), however this does not rule out the possibility that
they are in some way related to these structures. Recently, Lelouard et al,
(2002) demonstrated the presence of high number, ubiquitinated protein
aggregates transiently expressed in dendritic cells. Furthermore, these
structures resemble the fusion protein blobs in terms of their gross morphology
and biological properties, since they neither induce vimentin cage formation or
220

localise with the M TO C, nor are they destabilised following nocodazole
treatment. The presence of these structures, referred to as dendritic cell
aggresome-like induced structures (DALIS) are transient and require continuous
protein synthesis. The proteasome degradation of DALIS provides material for
MHC class I presentation (Lelouard et al, 2002). Although both DALIS and the
fusion protein blobs have clearly different origins, the fact that the proteasome
can handle high copy numbers of DALIS may be mirrored to some extent in
stable PS1 HEK293 cells exhibiting numerous blobs.
8.19 Summary of main findings
• The putative P S 1-N TF 923 antibody does not co-localise with
endogenous or exogenous PS1
• PS1-EG FP fusion proteins generated four distinct phenotypes in different
cell lines (ER, Golgi, vesicular and blob-like aggregates) that localise to
varying degrees with antibodies to the cell compartment
• Immunoblotting of the fusion protein is within the membrane only fraction
• The removal of the EGFP moiety has no effect on the phenotype
distribution
• Over expression of the fusion proteins alters or reduces antibody staining
of some cell compartment markers
• The N-truncated fusion protein sensitises cells to STS-induced apoptosis
• Caspase cleavage of PS1 may be associated with type 2 apoptosis and
autophagy in control and transfected cells
• The fusion protein blob-like phenotype co-localises strongly with ubiquitin
• The blob phenotype does not induce vimentin cage formation, or localise
with the MTOC
• The fusion proteins forms aggresom es following inhibition of the
proteasome
• In cells over expressing the full-length fusion proteins antibody staining
suggest differential regulation of PS NTF and CTF fragments
• The blobs appear to originate from the nuclear-ER interface but do not
stain for antibodies to the cell compartment
221

• The blob phenotype is not destabilised with nocodazole indicating that
they do not require microtubules for their formation
• TEM reveals numerous phagosomes and mutilaminar bodies that fit the
profile seen for the blob-like aggregates in terms of dimension, number
and general morphology
Overall, the size and general morphology of the multilaminar bodies as revealed
by TEM fit the profile seen for the blob-like aggregates in terms of dimension,
number and general morphology. A definitive test for identifying the laminar
bodies/vacuoles as the PS1 blobs could ideally be accomplished by
immunogold antibody labelling of the EGFP moiety and by cell fractionation
experiments aimed at isolating the blobs. The blobs may therefore be
membrane-associated structures (multilaminar bodies) that rely on autophagy
for their clearance once aggregation of the over-expressed fusion protein has
taken place. Kopito (2000) proposes that the aggresome might function as a
center for the capture of aggregated protein by the autophagic pathway. Whilst
this may hold true under conditions where the proteasome is inhibited, in the
present study there was little sign of aggresome formation. Furthermore, the
TEM data do not indicate the presence of an aggresome within cells displaying
phagosomes (figure 7.21, A). Data presented herein indicate that the blobs
form independently of the aggresome and may impair the UPS. A hypothetical
scheme to account for the above observation is outlined in figure 8 .0 .
Unlike aggresom es and inclusion bodies, which are single copy
organelles, the numerous blobs may represent novel structures whose function
it is to contain excessive protein levels, possibly in response to a comprised
UPS, and that their presence stimulates autophagy and/or apoptosis.
Alternatively, the blobs are not the multilaminar bodies as seen by TEM, but
may instead be a means of safely containing too high a level of expression
within the cell, and that they present the fusion protein as manageable packets
to the proteasome for degradation. The alteration in the ER and Golgi
compartments and the inducement of autophagy would then be considered
unrelated phenomena, possibly generated by the over production of the fusion
protein that may impact on the UPS.
8.20 Concluding remarks
222
Increasingly important is the role played by aggregated proteins in the
underlying pathology of a human degenerative conditions including Alzheimer’s
disease, light chain amyloidosis, spongiform encephalopathies, Huntingdon’s
disease, Parkinson’s disease, etc. Recent genetic and biochemical data
indicate that impairment of the UPS in these very different disorders may
contribute further to the pathogenic mechanism specific to these diseases.
Taken as a whole, much of the evidence presented within this study
concerned the effect moderate to high levels of the PS1 fusion proteins had on
the general morphology of the cell. Im m unofluorescence microscopy,
immunoblotting and TEM data show that the blob-like aggregates alter the
appearance of the ER and Golgi compartment, which may effect the normal
trafficking of materials within the cell. The fusion proteins therefore provide a
convenient means for studying the consequence that high levels of protein have
on the UPS-aggresome response, apoptosis and phagocytosis within the cell.
223

phagosome
lysosome
Nucleus 1
residual body expelled
ER
Fig u re 8 .0 . S c h e m a tic outline o f even ts propo sed to acco u n t fo r th e p re s e n c e o f th e b lob p h e n o ty p e . 1. T h e fu s io n p ro te in is syn th e s is e d a t th e N u c le a r -E R in te rfa c e , w h e re it a c c u m u la te s as m u ltila m in a r b o d ies (2 ), th a t im p a c t on th e a m o u n t o f lipid a v a ila b le fo r norm al tra ffick in g , h e n c e th e a lte ra tio n in an tib o d y staining o f the E R and G olgi. 3 . P h a g o s o m e s s e q u e s te r th e b lobs a lo n g w ith E R c o n te n ts . 4 . T h e ly s o s o m e fu s e s w ith th e p h a g o s o m e an d d ig e s ts co n ten ts , possibly leaving behind residual body. 5 .T h e und igested residual body is exp e lled from the cell.
224
REFERENCES
Alves da Costa, C., M. Mattson, K. Ancolio, and F. Checler. 2003. The C-terminal fragment of presenilin 2 triggers p53 mediated staurosporine-induced apoptosis, a function independent of the presenilinase-derived N-term inal counterpart. J.Biol. Chem.
Alves da Costa, C., E. Paitel, M.P. Mattson, R. Amson, A. Telerman, K. Ancolio, and F. Checler. 2002. Wild-type and mutated presenilins 2 trigger p53-dependent apoptosis and down-regulate presenilin 1 expression in HEK293 human cells and in murine neurons. Proc. Natl. Acad. Sci. USA. 99:4043-4048.
Amson, R., J. Lassalle, H. Hailey, S. Prieur, F. Lethrosne, J. Roperch, D. Israeli, M. Gendron, C. Duyckaerts, F. Checler, J. Dausset, D. Cohen, M. Oren, and A. Telerman. 2000. Behavioral alterations associated with apoptosis and down- regulation of presenilin 1 in the brains of p53-deficient mice. Proc. Natl. Acad. Sci. USA. 97:5346-5350.
Ankarcrona, M., and K. Flultenby. 2002. Presenilin-1 is located in rat mitochondria. Biochem. Biophys. Res. Comm. 295:766-770.
Arendt, T. 2001. Alzheimer's disease as a disorder of mechanisms underlying structural brain self-organisation. Neuroscience. 102:723-765.
Buxbaum, J., K. Liu, Y. Luo, J. Slack, K. Stocking, J. Peschon, R. Johnson, B. Castner, D. Ceretti, and R. Black. 1998. Evidence that tumour necrosis factor a converting enzyme is involved in regulated a-secretase cleavage of the Alzhemer amyloid protein precursor. J. Biol.Chem. 273:27765-27767.
Bence, N.F., Sampat, R.M., Kopito, R.R. 2001. Impairment of the ubiquitin- proteasome system by protein aggregation. Science. 292:1552-5
Benjannet, S., A. Elagoz, L. Wickham, M. Mamarbachi, J.S. Munzer, A. Basak, C. Lazure, J.A. Cromlish, S. Sisodia, F. Checler, M. Chretien, and N. Seidah. 2001. Post-translational Processing of beta -Secretase (P-Amyloid-converting Enzyme) and Its Ectodomain Shedding. The pro- and transmembrane/cytosolic domains affect its cellular activity amyloid-P production. J. Biol. Chem. 276:10879-10887.
Benussi, L., A. Alberici, M. Mayhaus, U. Langer, R. Ghidoni, F. Mazzoli, F. Nicosia, L. Barbiero, G. Frisoni, and O. Zanetti. 2001. Detection of the Presenilin 1 CO O H- Terminal Fragment in the Extracellular Compartment: A Release Enhanced by Apoptosis. Exp. Cell Res. 269:256-265.
Bertram, L., D. Blacker, K. Mullin, D. Keeney, J. Jones, S. Basu, S. Yhu, M. Mclnnis, R. Go, K. Vekrllis, D. Selkoe, A. Saunders, and R. Tanzi. 2000. Evidence
225

for genetic linkage of Alzheimer's Disease to chromosome 10q. Science. 290:2302- 2303.
Biere, A.L., Ostaszewski, B. Zhao, H. Gillespie, S. Younkin, S G. Selkoe, DJ.1995. Co-expression of (3-amyloid precursor protein (|3APP) and apoliprotein E in cell culture: analysis of (3APP processing. Neurobiol. Dis. 2:177-187.
Blacker, D., M. Wilcox, M. Laird, L. Rodes, S. Horvath, R. Go, B. Perry, B.J. Watson, S. Basset, M. Mclnnis, M. Albert, B. Hyman, and R. Tanzi. 1998. Alpha-2 macroglobulin is genetically associated with Alzheimer's Disease. Nature Genetics. 19:357-360.
Blacker, W ., D. Haines, and J. Rodes. 1997. ApoE-4 and age at onset of Alzheimer's disease: the NIMH genetics initiative. Neurology. 48:139-147.
Bottomley, M., M. Batten, R. Lumb, and N. Bulleid. 2001. Quality control in the endoplasmic reticulum: PDI mediates the ER retention of unassembled procollagen C-propeptides. Current Biology. 11.
Braak, H., and E. Braak. 1991. Neuropathological staging of Alzheimer related changes. Acta. Neuropath. 82:239-259.
Bugiani, O., F. Tagliavini, G. Giaccone. 1995. Diffuse senile plaques: amorphus or fibrous. Am. J. Pathol. 146:777-778.
Campbell, E. Pearson, R.C.A., Parkinson, D. (1999). Methods to uncover an antibody epitope in the KPI domain of Alzheimer's amyloid precursor protein for immunohistochemistry in human brain. J. Neurosci. methods. 93: 133-38.
Campion, D. Brice, A. Dumanchin, C. Puel, M. Baulac, M. De la Sayette, V. Hannequin, D. Duyckaerts, C. Michon, A. Martin, C. Moreau, V. Penet, C. Martinez, M. Clerget-Darpoux, F. Agid, Y. Frebourg. 1996. A novel presenilin 1 mutation resulting in familial Alzheimer's disease with an onset age of 29 years. NeuroReport. 7(10): 1582-1584.
Capell, A., J. Grunberg, B. Pesold, A. Diehlmann, M. Citron, R. Nixon, K. Beyreuther, D. Selkoe, and C. Haass. 1998. The proteolytic fragments of the Alzheimer's disease-associated presenilin-1 form heterodimers and occur as a 100-150-kDa molecular mass complex. J. Biol. Chem. 273:3205-3211.
Carlson, G., D. Borchelt, A. Dake, S. Turner, V. Danielson, J. Coffin, C. Eckman, J. Meiners, S. Nilsen, S. Younkin, and K. Hsiao. 1997. Genetic modification of the phenotypes produced by amyloid precursor protein overexpression in transgenic mice. Human Molecular Genetics. 6:1951-1959.
226

Chalfie, M., Y. Tu, G. Euskirchen, W. Ward, and D. Pasher. 1994. Green fluorescent protein as a marker for gene expression. Science. 263:802-805.
Chan, S., C. Culmsee, N. Haughey, W. Klapper, and M. Mattson. 2002. Presenilin- 1 Mutations Sensitize Neurons to DNA Damage-Induced Death by a Mechanism Involving Perturbed Calcium Homeostasis and Activation of Calpains and Caspase-12. Neurobiology of Disease. 11:2-19.
Chapmen, P., M. Agnieszka, S. Knevett, and M. Ramsay. 2001. Genes, models and Alzheimer's disease. Trend in Genetics. 17:254-261.
Chen, F., D. Yang, S. Petanceska, A. Yang, A. Tandon, G. Yu, R. Rozmahel, J. Ghiso, M. Nishimura, D. Zhang, T. Kawarai, G. Levesque, J. Mills, L. Levesque, Y. Song, E. Rogaeva, D. Westaway, H. Mount, S. Gandy, P. St George-Hyslop, and P. E. Fraser. 2000. Carboxyl-terminal Fragments of Alzheimer P-Amyloid Precursor Protein Accumulate in Restricted and Unpredicted Intracellular Compartments in Presenilin 1-deficient Cells. J. Biol.Chem. 275:36794-36802.
Chen, J., T. Murphy, M. Willingham, I. Pastan, and J. August. 1985. Identification of two lysosomal membrane glycoproteins. J. Cell Biol. 101:85-95.
Citron, M. Diehl, T S. Capell, A. Haass, C. Teplow, D B; Selkoe, D J. 1996a. Inhibition of p-amyloid protein production in neural cells by the serine protease inhibitor AEBSF. Neuron. 17:171-179.
Citron, M. W estaway, D. Xia, W. Carlson, G. Diehl, T. Levesque, G. Johnson- Wood, K. Lee, M. Seubert, P. Davis et al. 1997. Mutant presenilins of Alzheimer's disease increase production of 42-residue amyloid beta-protein in both transfected cells and transgenic mice. Nature Medicine. 3:67-72.
Citron, M., T. Diehl, G. Gordon, A. Biere, P. Seubert, and D. Selkoe. 1996b. Evidence that Ap42 and AP40 are generated from the P-amyloid precursor protein by different protease activities. Proc. Natl. Acad. Sci. USA. 93:13170-13175.
Citron, M., C. Eckman, T. Diehl, C. Corcoran, B.L. Ostaszewski, W. Xia, G. Levesque, P. Hyslop, S. Younkin, and D. Selkoe. 1998. Additive effects of PS1 and APP mutations on secretion of the 42- residue amyloid beta-protein. Neurobiology of Disease. 5:107-116.
Cook, D., Sung JC, Golde TE, Felsenstein KM, W ojczyk BS, Tanzi RE, Trojanowski JQ, Lee VM, Dorns RW .1996. Expression and analysis of presenilins 1 in human neuronal system: Localisation in cell bodies and dendrites. Proc. Natl. Acad. Sci. USA. 93:9223-9228.
227

Cook, D. Forman MS. Sung JC. Leight S. Kolson DL. Iwatsubo T. Lee VM. Doms RW . 1997. A lzheim er's A (3 (1 -4 2 ) is generated in the endoplasm ic reticulum/intermediate compartment of NT2N cells. Nature Medicine. 3:1021-1023.
Crook, R., Verkkoniemi A., Perez-Tur J., Mehta N., Baker M., Houlden H., Farrer M, Hutton M, Lincoln S., Hardy J., Gwinn K., Somer M., Paetau A., Kalimo H., Ylikoski R., Poyhonen M., Kucera S., Haltia M .1998. A variant of Alzheimer's disease with spastic paraparesis and 'cotton wool' plaques due to deletion of exon 9 of presenilin 1. Nature Medicine. 4:452-455.
Cubitt, A., R. Heim, S. Adams, A. Boyd, L. Gross, and R. Tsien. 1995. Understanding, improving and using green fluorescent proteins. Trends in Biochemical Sciences. 20:448-455.
Culvenor JG, Maher F, Evin G, Malchiodi-Albedi F, Cappai R, Underwood JR, Davis JB, Karran EH, Roberts GW, Beyreuther K, Masters CL. 1997.Alzheimer's disease-associated presenilin 1 in neuronal cells: evidence for localization to the endoplasmic reticulum-Golgi intermediate compartment. J. Neurosci. Res. 49(6):719-31.
Czech, C., Tremp, G., Pradier, L. 2000. Presenilins and Alzheimer's disease: biological function and pathogenic mechanisms. 60:363-384.
Davies, J., and D. Murphy. 2002. Autophagy in hypothalamic neurons of rats expressing a familial neurohypophyseal diabetes insipidus transgene. J. o f Neuroendocrinology. 14:1-14.
De Jonghe C, Cras P, Vanderstichele H, Cruts M, Vanderhoeven I, Smouts I, Vanmechelen E, Martin JJ, Hendriks L, Van Broeckhoven C. 1999a. Evidence that A(342 Plasma levels in Presenilin-1 Mutation carriers do not allow for prediction of their clinical phenotype. Neurobiology o f Disease. 6:280-287.
De Jonghe C, Zehr C, Yager D, Prada CM, Younkin S, Hendriks L, Van Broeckhoven C, Eckman CB. 1998. Flemish and Dutch Mutations in Amyloid p Precursor Protein Have different effects on Amyloid p Secretion. Neurobiol. of Disease. 5:281-286.
De Jonghe, C., M. Cruts, E. Rogaeva, C. Tysoe, A. Singleton, H. Vanderstichele, W. Meschino, B. Dermaut, I. Vanderhoven, H. Backhovens, E. Vanmechelen, C. Morris, J. Hardy, D. Rubensztein, P. St George Hyslop, and C. van Broeckhoven. 1999b. Aberrant splicing in the presenilin-1 intron 4 mutation causes presenile Alzheimer's disease by increased Abeta42 secretion. Hum. Mol. Genetics. 8:1529- 1540.
228

De Strooper B, Saftig P, Craessaerts K, Vanderstichele H, Guhde G, Annaert W, Von Figura K, Van Leuven F. 1998. Deficiency of presenilin-1 inhibits the normal cleavage of amyloid precursor protein. Nature. 391:387-390.
De Strooper, B., M. Buellens, B. Contreras, L. Levesque, K. Craesaerts, B. Cordell, D. Moechars, M. Bollen, P. Fraser, P. St George Hyslop, and F. Van Leuvan. 1997. Phosphorylation, subcellular localisation, and membrane orientation of Alzheimer's disease-associated presenilins. J. Biol. Chem. 272:3590-3598.
Dewji, N., D, Chou. S, Singer. 1997. On the spurious endoproteolytic processing of the presenilin proteins in cultured cells and tissues. Proc. Natl. Acad. Sci. USA. 94:9926-9931.
Dewji, N., and S. Singer. 1997. Cell surface expression of Alzheimer disease- related presenilin proteins. Proc. Natl. Acad. Sci. USA. 94:14031-14036.
Dickson, D. 1997. The pathogenesis of senile plaques. J. Neuropathol. Exp. Neurol. 56:321-339.
Doan, A., G. Thinakaran, D. Borchelt, H. Slunt, T. Ratovitsky, M. Podlisney, D. Selkoe, M. Seegar, S. Gandy, D. Price, and S. & Sisodia. 1996. Protein topology of presenilin 1. Neuron. 17:1023-1030.
El Khoury, J., S. Hickman, C. Thomas, and e. al. 1996. Scavenger receptor- mediated adhesion of microglia to beta-amyloid fibrils. Nature. 382:716-719.
Ertekin-Taner, N., N. Graff-Radford, L. Younkin, C. Eckmann, M. Baker, J. Adamson, J. Ronald, J. Blangero, M. Hutton, and S. Younkin. 2000. Linkage of Plasma AJ342 to a Quantitative Locus on Chromosome 10 in Late-Onset Alheimer's Disease Pedigrees. Science. 290:2303-2304.
Felician, O., and T. Sandson. 1999. The neurobiology and pharmacotherapy of Alzheimer's Disease. J. Neuropsychiatry Clin. NeurosciA 1(1): 19-31.
Fox, N., and M. Rossor. 2000. Seeing what A lzheim er saw-with magnetic resonance. Nature Medicine. 6:20-21.
Francis, R., G. McGrath, J. Zhang, D. Ruddy, M. Sym, M. Apfield, and e. al. 2002. aph-1 and pen-2 are required for Notch pathway signalling, y-secretase cleavage of p-APP, and presenilin protein accumulation. Dev. Cell. 3:85-97.
Gangmin, D., C. Pike, and C. Cotman. 1996. Alzheimer-associated presenilin-2 confers increased sensitivity to apoptosis in PC12 cells. FEBS Letters. 397:50-54.
229

Garcia-Mata, R., Z. Bebok, E. Sorcher, and E. Sztul. 1999. Characterisation and dynamics of aggresome formation by a cytosolic GFP-chimera. J. of Cell Biol. 146:1239-1254.
Gelman, M., E. Kannegaard, and R. Kopito. 2002. A principal role for the proteasome in endoplasm ic reticulum-associated degradation of misfolded intracellular cystic fibrosis transmembrane conductance regulator. J. Biol.Chem. 277:11709-11714.
Georgakopoulos, A., P. Marambaud, S. Efthimiopoulos, J. Shio, W. Cui, H. Li, M. Schutte, R. Gordon, G.R. Holstein, G. Martinelli, P. Mehta, V.J. Friedrich, and Robakis NK.1999. Presenilin-1 forms complexes with the cadherin/catenin cell-cell adhesion system and is recruited to intercellular and synaptic contacts. Mol. Cell. 4:1-20.
Glenner, G.A., and C. Wong. 1984. Alzheimer's disease and Down's syndrome: sharing of unique cerebrovascular amyloid fibril protein. Biochem. Biophys. Res. Commun. 122:1131-1135.
Goate, A., H. Chartier, M. Mullan, J. Brown, F. Crawford, L. Fidani, L. Giuffra, A. Haynes , N. Irving, L. James, et. al. 1991. Segregation of a missense mutation in the amyloid precursor protein gene with familial Alzheimer's disease. Nature. 349:704-706.
Goedert, M. 1996. Tau protein and the neuropathology of Alzheimer's disease. Ann. N.Y. Acad. Sci.: 121-131.
Golde, T., S. Estus, L. Younkin, D. Selkoe, and S. Younkin. 1992. Processing of the amyloid precursor protein to potentially amylodogenic derivitives. Science. 255:728-730.
Goldgaber, D., M. Lerman, O. McBride, U. Saffiotti, and D. Gadjusek. 1987. Characterisation and chromosomal location of a cDNA encoding brain amyloid of Alzheimer's disease. Science. 235:877-880.
Gorelick, F.S. and Shugrue, C. 2001. Exiting the endoplasmic reticulum. Mol. and Cell. Endo. 177:13-18.
Graves, T., S. Patel, P. Dannies, and P. Hinkle. 2001. Misfolded growth hormone causes fragmentation of the Golgi apparatus and disrupts endoplasmic reticulum- to-Golgi traffic. J. of Cell Sci. 114:3685-3694.
Greenfield, J., J. Tsai, G. Gouras, B. Hai, G. Thinakaran, F. Checler, S. Sisodia, P. Greengard, and H. Xu. 1999. Endoplasmic reticulum and trans-Golgi network generate distinct populations of Alzheim er pamyloid peptides. Neurobiology. 96:742-747.
230

Haass C, Hung AY, Selkoe DJ, Teplow DB.1994. Mutations associated with a locus for familial Alzheimer's disease result in alternative processing of amyloid 13- protein precursor. J. Biol. Chem. 269:17741-17748.
Haass, C., E. Koo , A. Mellon , A. Hung, and D. Selkoe. 1992. Targeting of cell- surface beta-amyloid precursor protein to lysosomes: Alternative processing into amyloid-bearing fragments. Nature. 357:500-503.
Haniu, M., P. Denis, Y. Young, E. Mendiaz, J. Fuller, J. Hui, B. Bennett, S. Kahn, S. Ross, T. Burgess, V. Katta, G. Rogers, R. Vassar, and M. Citron. 2000. Characterization of Alzheimer's beta -Secretase Protein BACE. A pepsin family with unusual properties. J. Biol. Chem. 275:21099-10887.
Harada, M., H. Kumemura, M. Omary, T. Kawaguchi, N. Maeyama, S. Hanada, E. Taniguchi, H. Koga, T. Suganuma, T. Ueno, and M. Sata. 2003. Proteasome inhibition induces inclusion bodies associated with intermediate filaments and fragmentation of the Golgi apparatus. 288(1 ):60-9 Exp. Cell Res.
Harald, S., R. Helmut, G. Melissa, P. Uwe, P. Brigitte, C. Martin, B. Ralf, and H. Christian. 1999. The Biological and Pathological Function of the Presenilin-1 AExon9 Mutation Is Independent of Its Defect to Undergo Proteolytic Processing. J. Biol. Chem. 274:7615-7618.
Hardy, J. 1997. Amyloid, the presenilins and Alzheimer's. Trends in Neuroscience. 20:154-159.
Hardy, J., and R. Crook. 2001. Presenilin mutations line up along transmembrane a-helices. Neurosci. Letters. 306:203-205.
Hardy, J., and D. Selkoe. 2002. The amyloid hypothesis of Alzheimer's disease: Progress and problems on the road to therapeutics. Science. 297:353-356.
Hartmann, T., S. Bieger, B. Bruhl, P. Tienari, N. Ida, D. Allsop, G. Roberts , C. Masters, C. Dotti, K. Unsicker , and K. Beyreuther. 1997. Distinct sites of intracellular production for Alzheimer's disease A p40/42 amyloid peptides. Nature Medicine. 3:1016-1020.
Hasegawa, M., R. Crowther, R. Jakes, and M. Goedert. 1997. Alzheim er like changes in m icrotubule-associated protein Tau induced by sulfated glycosam inoglycans. Inhibition of m icrotubule binding, stim ulation of phosphorylation, and filament assembly depends on the degree of suphation. J. Biol. Cf7em.272(52):33118-33124.
Hendrie, H.C. 1999. Epidemeology of Demetia and Alzheimer's Disease. Am. J. of Ger. Psych. 6:3-18.
231

Hendriks, L., C. van Duijn, P. Cras, M. Cruts, W. van Hul, F. van Harksamp, M. Mclnnis, S. Antonarakis, J. Martin, A. Hofman, and C. van Broeckhoven. 1992. Presenile dementia and cerebral haemorrhage linked to mutation at codon 692 of the P-amyloid precursor gene. Nature Genetics. 1:218-221.
Higgins, R., R. LeCouteur, K. Vernau, B. Sturges, J. Obradovich, and A. Bollen.2001. Granular cell tumour of the canine central nervous system: Two cases. Veterinary Pathology. 38:620-627.
Ho, L., K. Fukuchi, and S. Younkin. 1996. The alternatively spliced Kunitz protease inhibitor domain alters amyloid beta protein precursor processing and amyloid beta protein production in cultured cells. J. of Biol.Chem. 271:30929-30934.
Hof, P., P. Giannakopoulous, J. Vickers, C. Bouras, and J. Morrison. 1995. The morphologic and neurochemical basis of dementia: aging, hierarchial pattern of lesion distribution and vulnerable neuronal phenotype. Rev. Neurosci. 6:97-124.
Hong CS, Caromile L, Nomata Y, Mori H, Bredesen DE, Koo EH. 1999. Contrasting role of Presenilin-1 and Presenilin-2 in Neuronal Differentiation In vitro. J. of Neurosci. 19:637-643.
Hsia, A., E. Masliah, L. McConlogue, G. Yu, G. Tatsuno, K. Hu, D. Kholodenko, R. Malenka, R. Nicoll, and L. Mucke. 1999. Plaque independent disruption of neural circuits in Alzheimer's disease mouse models. Proc. Natl. Acad. Sci. USA. 96:3228-3233.
Huse, J., D. Pijak, G. Leslie, V. Lee, and R. Dorns. 2000. Maturation and Endosomal Targeting of beta -Site Amyloid Precursor Protein-cleaving Enzyme. The Alzheimer's disease P-secretase. J. Biol. Chem. 275:33729-10887.
Hussain, I., D. Powell, D. Howlett, D. Tew, T. Meek, C. Chapman, I. Gloger, K. Murphy, C. D, C. Southan, D. M., D. Ryan, T. Smith, D. Simmons, F. Walsh, C. Dingwall, and G. Christie. 1999b. Identification of a Novel Aspartic Protease (Asp 2) as P-Secretase. Mol. Cell Neuro. 14:419-427.
Illing, M., R. Rajan, N. Bence, and R. Kopito. 2002. A rhodopsin mutant linked to autosomal dominant retinitis pimentosa is prone to aggregate and interacts with the ubiquitin proteasome system. J. of Biol.Chem. 277:34150-34160.
Imaizumi, K., K. Miyoshi, T. Katayama, T. Yoneda, M. Taniguchi, T. Kudo, and M. Tohyam a. 2001. The unfolded protein response and Alzheim er's disease. Biochem.et Biophys. Acta. 1536:85-96.
232

Janicki, S., S. Stabler, and M. Monteiro. 2000. Familial Alzheimer's disease presenilin-1 mutants potentiate cell cycle arrest. Neurobiology of Aging. 21:829- 836.
Jarret, J., E. Berger, and P. Lansbury. 1993a. The carboxy terminus of the beta amyloid protien is critical for the seeding of amyloid formation: implications for the pathogenesis of Alzheimer's disease. Biochemistry. 32:4693-4697.
Jarret, J., and P.J. lansbury. 1993b. Seeding 'one-dimensional crystalisation' of amyloid: a pathogenic mechanism in Alzheimer's disease and scapie? Cell. 73:1055-1058.
Jo, D., J. Chang, H. Hong, I. Mook-Jung, and Y. Jung. 2003. Contribution of presenilin/[gamma]-secretase to calsenilin-mediated apoptosis. Biochem. and Biophys.Res.Comm. 305:62-66.
Johnson-Wood, K., M. Lee, R. Motter, K. Hu, G. Gordon, R. Barbour, K. Khan, M. Gordon, H. Tan, D. Gam es, I. Lieberburg, D. Schenk, P. Seubert, and L. McConlogue. 1997. Amyloid precursor protein processing and A P 42 deposition in a transgenic mouse model of Alzheimer’s disease. Proc. Natl. Acad. Sci. USA. 94:1550-1555.
Johnston, J., M. Illing, and R. Kopito. 2002. Cytoplasmic dynein/dynactin mediates the assembly of aggresomes. Cell Motil. Cytoskeleton. 53:26-28.
Johnston, J., C. Ward, and R. Kopito. 1998. Aggresomes: A cellular response to misfolded proteins. J. of Cell Biol. 143:1883-1898.
Kaether, C., S. Lammich, D. Edbauer, M. Ertl, J. Rietdorf, A. Capell, H. Steiner, and C. Haass. 2002. Presenilin-1 affects trafficking and processing of PAPP and is targeted in a complex with nicastrin to the plasma membrane. J. Cell Biol. 158:551- 561.
Kamal, A., Almenar-QA, J. LeBlanc, E. Roberts, and L. Goldstein. 2001. Kinesin- mediated axonal transport of a membrane compartment containing p-secretase and presenilin-1 requires APP. Nature. 414:643-648.
Kang, D., S. Soriano, M. Frosch, C. T, S. Naruse, S. SS, G. Leibowitz, L. F, and E. Koo. 1999. Presenilin 1 facilitates the constitutive turnover of beta-catenin: Differential activity of Alzheimer’s disease-linked PS1 mutants in the beta-catenin- signaling pathway. J. Neurosci. 19:4229-4237.
Kang, J., H. Lemaire, A. Unterbeck, J. Salbaum, C. Masters, K. Grzeschik, G. Multhaup, K. Beyreuther, and B. Muller-Hill. 1987. The precursor of Alzheim er’s disease amyloid A4 protein resembles a cell-surface receptor. N a t u r e . 325:733-736.
233

Kerr, J., A. Wyllie, and A, Currie. 1972. Apoptosis: a basic biological phenomenon with wide-ranging implications in tissue kinetics. Br. J. Cancer. 26:239-257.
Kim TW , Pettingell W H, Hallmark OG, Moir RD, W asco W, Tanzi RE. 1997. Endoproteolytic cleavage and proteasomal degradation of presenilin 2 in transfected cells. J. Biol. Chem. 272(17): 11006-10.
Kim, SH. Lah, JJ. Thinakaran, G. Levey, A. Sisodia, SS. (2000). Subcellular localisation of presenilins: Association with a unique membrane pool in cultured cells. Neurobiology of Disease. 7:99-117.
Kim, D., L.M. Ingano, and D. Kovacs. 2002. Nectin-1 alpha , an Immunoglobulin-like Receptor Involved in the Formation of Synapses, Is a Substrate for Presenilin/gamma -Secretase-like Cleavage. J. Biol. Chem. 277:49976-49981.
Kirschenbaum F, Hsu SC, Cordell B, McCarthy JV. 2001. Glycogen synthase k in a s e -3 b e ta reg u la tes presen ilin 1 C -te rm in a l fra g m e n t levels . J. Biol. Chem. 276(33):30701-7
Klausner, R., J. Donaldson, and J. Lippincott-Schwartz. 1992. Brefeldin A: insights into the control of membrane traffic and organelle structure. J. Cell Biol. 116:1071 - 1080.
Klein, W., Krafft, and C. Finch. 2001. Targeting small Ap oligomers: the solution to an Alzheimer's disease conundrum? Trend in Neurosciences. 24:219-224.
Knops J, Suomensaari S, Lee M, McConlogue L, Seubert P, Sinha S. 1995. Cell- type and amyloid precursor protein-type specific inhibition of Ap release by Bafilomycin A1, a selective inhibitor of vacuolar ATPases. J. Biol. Chem. 270:2419- 2422.
Koo, E., S. Sisodia, D. Archer, L. Martin, A. Weidemann, K. Beyreuther, C. Maters, P. Fischer, and D. Price. 1990. Precursor of amyloid protein in Alzheimer's diease undergoes fast anterograde axonal transport. Proc. Acad. Natl. Sci. 87:1561-1565.
Kopan, R. 2002. Notch: a membrane-bound transcription factor. J. of Cell Sci. 115:1095-1097.
Kopito, R.R. 2000. Aggresomes, inclusion bodies and protein aggregation. Trends in Cell Biology. 10:524-530.
Kopito, R., and R. Sitia. 2000. Aggresomes and Russell bodies. J.Euro. Mol. Bio. Org. 1:225-231.
234
Kovacs, D., H. Fausett, K. Page, T. Kim, R. Moir, D. Merriam, R. Hollister, O. Hallmark, R. Mancini, K. Felsenstein, B. Hyman, R. Tanzi, and W. Wasco. 1996. Alzheimer-associated presenilins 1 and 2: neuronal expression in brain and localisation to intracellular membranes in mammalian cells. Nature Medicine. 2:224-229.
Kovacs, D., R. Mancini, J. Henderson, S. Na, S. Schmidt, T. Kim, and R. Tanzi.1999. Staurosporine-lnduced Activation of Caspase-3 Is Potentiated by Presenilin 1 Familial Alzheim er's Disease Mutations in Human Neuroglioma Cells. J. Neurochem. 73:2278-2285.
Kruman, I., and M. Mattson. 1999. Pivotal Role of Mitochondrial Calcium Uptake in Neural Cell Apoptosis and Necrosis. J. Neurochem. 72:529-540.
La Voie, M., P. Fraering, B. Ostaszewski, W. Ye, W. Kimberly, M. Wolfe, and D. Selkoe. 2003. Assembly of the y-secretase complex involves early formation of an intermediate sub-complex of Aph-1 and Nicastrin. J. Biol. Chem. 278(39):37213- 22 .
Lammich, S., E. Kojro, R. Postina, S. Gilbert, R. Pfeiffer, M. Jasionowski, C. Haass, and F. Faherenholz. 1999. Constitutive and regulated a-secretase cleavage of Alzhemer's amyloid precursor protein by a disintegrin metalloprotease. Proc. Natl, Acad. Sci. USA. 96:3922-3927.
Lane, JD., Lucocq, J. Pryde, J. Barr, F.A. Woodman, P.G. Allan, V.J. Lowe, M.2002. Caspase-mediated cleavage of the stacking protein GRASP65 is required for Golgi fragmentation during apoptosis. J. Cell. Biol. 156, 3:495-509
Larsen, K., and D. Sulzer. 2002. Autophagy in neurons: a review. Histology and Histopathology. 17:1-12.
Law, A., S. Gauthier, and R. Quirion. 2001. Say NO to Alzheimer's disease; the putative links between nitric oxide and dementia of the Alzheimer's type. Brain Research reviews. 35:73-96.
Lee, M., H. Slunt, M. LJ, G. Thinakaran, G. Kim, S. Gandy, M. Seeger, E. Koo, D. Price, and S. Sisodia. 1996. Expression of presenilin 1 and 2 (PS1 and PS2) in human and murine tissues. J. of Neurosci. 16.
Lee, S., S. Shah, H. Li, C. Yu, W. Han, and G. Yu. 2002. Mammalian APH-1 interacts with presenilin and Nicastrin, and is required for intramembrane proteolysis of APP and Notch. J. Biol. Chem. 277:45013-45019.
Lelouard, H., E. Gatti, F. Capello, O. Gresser, V. Camosseto, and P. Pierre. 2002. Transient aggregation of ubiquitinated prteins during dendritic cell maturation. Nature. 417:177-182.
235

Lemere CA, Blusztajn JK, Yamaguchi H, Wisniewski T, Saido TC, Selkoe DJ. 1996. Sequence of deposition of heterogenous amyloid b-peptides and Apo-E in Down's syndrome:implications for initial events in amyloid plaque formation. Neurobiology, of Disease. 3:16-32.
Levitan, D., and I. Greenwald. 1995. Facilitation of lin-12-mediated signalling by sel-12, a Caenorhabditis elegans S182 Alzheimer's disease gene. Nature. 377:351- 354.
Levy, E., M. Carman, I. Fernadez-Madrid, M. Power, I. Lieberberg, S. van Duinen, A. Botsgt, W. Luyenddijk, and B. Frangione. 1990. Mutation of the Alzheimer's disease amyloid gene in heriditary cerebral haemorrhage, Dutch type. Science. 248:1124-1126.
Li, X., and I. Greenwald. 1996. Membrane topology of the C.elegans SEL-12 presenilin. Neuron. 17:1015-1021.
Li, X., and I. Greenwald. 1998. Additional evidence for an eight transmembrane domain topology for Caenorhabaditis elegans human presenilins 1. Proc. Natl. Acad. Sci. 95:7109-7114.
Li, Y., M. Xu, M. Lai, Q. Huang, J. Castro, J. DiMuzio-Mower, T. Harrison, C. Lellis, A. Nadin, J. Neduvelil, R. Register, M. Sardana, M. Shearman, A. Smith, X. Shi, K. Yin, J. Shafer, and S. Gardell. 2000. Photoactivated y-secretase inhibitors directed to the active site covalently label presenilin 1. Nature. 405:689-693.
Liao, A., R. Nitsch, S. Greenberg, U. Finckh, D. Blacker, M. Albert, D. Redbeck, T. Gomez-lsla, A. Clatworthy, G. Binetti, C. Hock, T. Mueller-Thomsen, U. Mann, K. Zuchowski, U. Beisiegel, H. Staehelin, J. Growdon, R. Tanzi, and B. Hymen. 1998. Genetic association of an a2-macroglobulin (VaHOOOIIe) polymorphism and Alzheimer's disease. Human Mol. Genetics. 7:1953-1956.
Loetscher, H., U. Deuschle, M. Brockhaus, D. Reinhardt, P. Nelboeck, J. Mous, J. Grunberg, C. Haass, and H. and Jacobsen. 1997. Presenilins are processed by caspase-type proteases. J.Biol. Chem. 272:20655-20659.
Loo DT, Copani A, Pike CJ, Whittemore ER, Walencewicz AJ, Cotman CW. 1993. Apoptosis is induced by beta-amyloid in cultured central nervous system neurons. Proc. Natl. Acad. Sci. USA. 90:7951-7955.
Lorenzo, A., and B. Yanker. 1994. Beta-amyloid neurotoxicity requires fibril formation and is inhibited by Congo red. Proc. Natl. Acad. Sci. USA. 91:12243- 12247.
236

Lowe, S.L., F. Peter, V .N . Subramaniam, S.H. Wong, and W. Hong. 1997. A SNARE involved in protein transport through the Golgi apparatus. Nature. 389:881- 884.
Lucocuq, J., and G. Warren. 1987. Fragmentation and partitioning of the Golgi apparatus during mitosis in HeLa cells. J. Euro. Mol. Bio. Org. 6:3239-3246.
Mah, A., G. Perry, M.A. Smith, M.J. Monteiro, D. Cribbs, L.S. Chen, S.M. Bende, and F.M. LaFerla. 2000. Identification of ubiquilin, a novel presenilin interactor that increases presenilin protein accumulation. 151:847-862.
Mahley, R. 1988. Apolipoprotein E: Cholesterol transport protein with expanding role in cell biology. Science. 240:622-630.
Mandelkow, E., and E. Mandelkow. 1998. Tau in Alzheimer's disease. Trends in Cell Biology. 8:425-427.
Mann, D., and M. Esiri. 1989. The pattern of aquisition of plaques and tangles in the brain of patients under 50 years of age with Down's syndrome. J. Neurol. Sci. 89:167-179.
Marlow, L., R. canet, S. Haugabook, J. Hardy, D. Lahiri, and K. Sambamurti. 2003. APH1, PEN2, and Nicastrin increase Ap levels and y-secretase activity. Biochem. Biophy. Res. Comm. 305:502-509.
Masters, C., G. Simms, N. W einmann, G. Multhaup, B. McDonald, and K. Beyreuther. 1985. Amyloid plaque core protein in Alzheimer disease and Down syndrome. Proc. Natl. Acad. Sci. USA. 82:4245-4249.
McNaught, K.S.P., P. Shashidharan, D. Perl, P. Jenner, and C. Olanow. 2002. Aggresome-related biogenesis of Lewy bodies. Euro. J. o f Neurosci. 16:2136- 2148.
Medina, M and Dotti, CG. 2003. RIPped out by presenilin-dependent y-secretase. Cellular Signalling.15:829-841.
Mercken, M., H. Takahashi, T. Honda, K. Sato, M. Murayama, Y. Nakazato, K. Noguchi, K. Imahori, and A. & Takashima. 1996. Characterization of human presenilin 1 using N-terminal specific monoclonal antibodies: Evidence that Alzheimer mutations affect proteolytic processing. FEBS. 389(3):297-303.
Miguel, M. Dotti, C.G. 2003. RIPped out by presenilin-dependent y-secretase. Cellular Signalling. 15:829-841.
Myers, A., P. Holmans, H. Marshall, J. Kwon, D. Meyer, D. Ramie, S. Shears, J. Booth, F. DeVrieze, R. Crook, M. Hamshere, R. Abraham, T. N, F. Rice, S. Cartey,
237

S. Lillystone, P. Kehoe, V. Rudrasingham, J. Williams, M. Owen, J. Hardy, and A. Goate. 2000. Suceptability locus for Alzhemer's Disease on Chromosome 10. Science. 290:2304-2305.
Nagata, K., and K. Yamada. 1986. Phosphorylation and transformation sensitivity of a major collagen-binding protein of fibroblasts. J. Biol. Chem. 261:7531-7536.
Nakakmura, N., C. Rabouille, R. Watson, T. Nilsson, N. Hui, P. Slusarewicz, T.E. Kreis, and G. and Warren. 1995. Characterisation of a cis-Golgi matrix protein, GM130. J. Cell Biol. 155:543-556.
Namekata, K., N. Nishimura, and H. Kimura. 2002. Presenilin-binding protein form aggresomes in monkey kidney Cos-7 cells. J. o f Neurochem. 82:819-827.
Nichols, B. 1976. Normal rabbit alveolar macrophages. J. of Exp. Med. 144:906- 919.
Nishimura, M., G. Yu, G. Levesque, D.M. Zhang, L. Ruel, F. Chen, P. Milman, E. Holmes, Y. Liang, T. Kawarai, E. Jo, A. Supala, E. Rogaeva, D.M. Xu, C. Janus, L. Levesque, Q. Bi, M. Duthie, R. Rozmahel, K. Mattila, L. Lannfelt, D. Westaway,H.T. Mount, J. Woodgett, and P. St George-Hyslop. 1999a. Presenilin mutations associated with Alzheimer disease cause defective intracellular trafficking of beta- catenin, a component of the presenilin protein complex. Nature Med. 5:164-169.
Nishimura, N., S. Bannykh, S. Slabough, J. Matteson, Y. Altschuler, K. Hahn, and W. Balch. 1999b. A di-acidic (DXE) code directs concentration of cargo during export from the endoplasmic reticulum. J. Biol. Chem. 274:15937-15946.
Oprins, A., R. Duden, T.E. Kreis, H.J. Geuze, and J.W. Slot. 1993. Beta-COP localizes mainly to the cis-Golgi side in exocrine pancreas. J. Cell Biol. 121:49-59.
Pappolla, M., O. RA, and K. KS. 1992. Immunohistochemical evidence of oxidative stress in Alzheimer's disease. Am. J. Pathol. 140:621-628.
Parkin ET, Hussain I, Karran EH, Turner AJ, Hooper NM. 1999. Characterization of detergent-insoluble complexes containing the familial Alzheim er's disease- associated presenilins. J. Neurochem. 72:1534-1543.
Passer, B.J., L. Pellegrini, P. Vito, J. Ganjei, and L. D'Adamio. 1999. Interaction of Alzheimer's Presenilin-1 and Presenilin-2 with Bcl-XL. A potential role in modulating the threashold of cell death. J. Biol. Chem. 274:24007-24013.
Pearson, R., and T. Powell. 1989. The neuroanatomy of Alzheimer's Disease. Rev. Neurosci. 2:101-122.
238

Pereira, C., M. Santos, and C. Oliveira. 1999. Involvement of Oxidative Stress on the Impairment of Energy Metabolism Induced by Ap Peptides on PC12 Cells: Protection by Antioxidants. Neurobiology of Disease. 6:209-219.
Perry EK, Tomlinson BE, Blessed G, Bergmann K, Gibson PH, Perry RH. 1978. Correlation of abnormallities with senile plaques and mental test scores in senile dementia. J. of Br. Med. 2:1457-1459.
Podlisny, M., M. Citron, P. Amarante, R. Sherrington, W. Xia, J. Zhang, T. Diehl, G. Levesque, P. Fraser, C. Haass, E. Koo, M. Seubert, P. St George-Hyslop, D. Teplow, and D. Selkoe. 1997. Presenilin Proteins Undergo Heterogeneous Endoproteolysis between Thr 291 and Ala 299 and Occur as Stable N- and C- Terminal Fragments in Normal and Alzheim er Brain Tissue. Neurobiology of Disease. 3:325-337 (313).
Podlisny, M., D. Tolan, and D. Selkoe. 1991. Homology of the amyloid b-protein precursor in monkey and human supports a primate model for P-amyloidosis in Alzheimer's disease. Am. J. Pathol. 138:1423-1435.
Poduslo, J.F., G. Curran, B. Sanyal, and D. Selkoe. 1999. Receptor-Mediated Transport of Human Amyloid-p Protein 1-40 and 1-42 at the Blood-Brain Barrier. Neurobiology of Disease. 6:190-199.
Pradier L, Carpentier N, Delalonde L, Clavel N, Bock MD, Buee L, Mercken L, Tocque B, Czech C. 1999. Mapping the APP/presenilin (PS) Binding domains:The hydrophilic N-terminus of PS2 is sufficient for interaction with APP and can displace APP/PS1 interaction. Neurobiology of Disease. 6:43-55.
Primkoff, P., and D. Myles. 2000. The ADAM gene family, surface proteins with adhesion and protease activity. Trends in Genetics. 16:83-87.
Raposo, G., H. van Santen, R. Leijendekker, H. Geuze, and H. Ploegh. 1995. Misfolded major histocompatibility complex class I molecules accumulate in an expanded ER-Golgi intermediate compartment. J. Cell Biol. 131:1403-1419.
Rebeck, G., S. Harr, D. Strickland, and B. Hyman. 1995. Multiple, diverse senile plaque-associated proteins are ligands of an apolipoprotein E receptor, the alpha- macroglobulin receptor/low-density lipoprotein receptor-related protein. Ann. Neurol. 37:21-217.
Robinson, S., and G. Bishop. 2002. A(3 as a bioflocculent: implications for the amyloid hypothesis of Alzheimer's disease. Neurobiology of Aging. 23:1051-1072.
Rogaev, E., R. Sherrington, E. Rogaeva, G. Levesque, M. Ikeda, Y. Liang, H. Chi,C. Lin, K. Holman, T. Tsuda, and e. al. 1995. Familial Alzheimer's disease in
239

kindreds with missense mutations in a gene on chromosome 1 related to the Alzheimer's disease type 3 gene. Nature. 376:775-778.
Roperch, J., V. Alvaro, S. Prieur, M. Tuynder, M. Nemani, F. Lethrosne, L. Piouffre, M. Gendron, D. Israeli, and J. Dausset. 1998. Inhibition of presenilin 1 expression is promoted by p53 and p21WAF-1 and results in apoptosis and tumor supression. Nature Medicine. 4:835-838.
Roses, A. 1994. Apolipoprotein E affects the rate of Alzhiem er's Disease expression: p amyloid burden is a secondary consequence dependent on ApoE4 genotype and duration of disease. J. Neuropath. Exp. Neurol. 53:429-437.
Sabbagh, M., D. Galasko, and L. Thai. 1997. P-Amyloid and Treatm ent Opportunities for Alzheimer’s Disease. Alzheimer's Disease Review. 2:69-87.
Saido, T. 2003. Chapter 1.0verview-Ap Metabolism: From Alzheimer's Research to brain Aging Control. In Ap Metabolism and Alzheimer's Disease. Eurekah.com Austin, Texas, USA. Lands Bioscience.
Sambrook, J., E.F. Fritch, and T. Maniatis. 1989. Molecular Cloning. A laboratory Manual. Cold Spring Harbour Laboratory Press.
Santiard-Baron D, Gosset P, Nicole A, Sinet PM, Christen Y, Ceballos-Picot1.1999. Identification of P-Amyloid-Responsive Genes by RNA Differential Display: Early Induction of a DNA Damage-lnducible Gene, gadd45. Exp. Neurol. 158:206- 213.
Sauk, J., K. Norris, J. Moehring, R. Foster , and S. MJ. 1990. The expression of colligin/hsp47 after stress in human peridonatal fibroblasts in vitro. Arch. Oral. Biol. 35:645-651.
Scales, S., R. Pepperkok, and T. Kreis. 1997. Visualization of ER-to-Golgi transport in living cells reveals a sequential mode of action for COPII and COPI. Cell. 90:1137-1148.
Schneider, L. 1999. Cholinergic Deficiency in Alzheimer's Disease. Am. J. of Ger. Psych. 6:49-55.
Schwarzman, A., N. Singh, M. Tsiper, L. Gregori, A. Dranovsky, M. Vitek, C. Glabe, P. St. George-Hyslop, and G. D. 1999. Cell Biology Endogenous presenilin 1 redistributes to the surface of lamellipodia upon adhesion of Jurkat cells to a collagen matrix. Proc. Natl. Acad. Sci. U S A . 96:7932-7937.
Seemann, J., E. Jokitalo, M. Pypaert, and G. Warren. 2000. Matrix proteins can generate the higher order architecture of the Golgi apparatus. Nature. 407:1022- 1026.
240

Selkoe, D., Y. Ihara, and F. Salazar. 1982. Alzheimer's disease: insolubility of partially purified helical filaments in sodium dodecyl sulphate and urea. Science. 215:1243-1245.
Selkoe, D., Selkoe DJ, Podlisny MB, Joachim CL, Vickers EA, Lee G, Fritz LC, Oltersdorf T. 1988. (3-amyloid precursor protein of Alzheimer's disease occurs as 110-135 kilodalton membrane-associated proteins in neural and nonneural tissues. Proc. Natl. Acad. Sci. USA. 85:7341-7345.
Selkoe, D. 1996. Amyloid (3-Protein and the Genetics of Alzheimer's Disease. J. of Biol.Chem. 271:18295-18298.
Selkoe, D. 1998. The cell biology of the (3-amyloid precursor protein and presenilin in Alzheimer's disease. Trend in Cell Biology. 8:447-453.
Selkoe, D. 1999. Translating cell biology into therapeutic advances in Alzheimer's disease. Nature. 399:A23-A31.
Selkoe, D. (2000).
Seubert P, V igo-Pelfrey C, Esch F, Lee M, Dovey H, Davis D, Sinha S, Schlossm acher M, W haley J, Swindlehurst C, et a l.1992 . Isolation and quantification of soluble Alzheimer's (3-peptide from biological fluids. Nature. 359:325-327.
Shen, J., R. Bronson, D. Chen, W. Xia, D. Selkoe, and S. Tonegawa. 1997. Skeletal and CNS defects in presenilin-1 deficient mice. Cell. 89:629-639.
Sherrington R, Rogaev El, Liang Y, Rogaeva EA, Levesque G, Ikeda M, Chi H, Lin C, Li G, Holman K, et al. 1995. Cloning of a novel gene bearing missense mutations in early onset familial Alzheimer's disease. Nature. 375:754-760.
Shima, D., N. Cabrera-Poch, R. Pepperkok, and G. Warren. 1998. An Ordered Inheritance Strategy for the Golgi Apparatus:Visualisation of Mitotic Disssembly Reveals a Role for the Mitotic spindle. J. of Cell Biol. 141:955-966.
Si-Hoe, S., F. De Bree, M. Nijenhuis, J. Davies, L. Howell, H. Tinley, S. Waller, Q. Zeng, R. Zalm, M. Sonnemans, F. Van Leeuwen, J. Burbach, and D. Murphy.2000. Endoplasmic reticulum derangement in hypothalamic neurons of rats expressing a familial neurohypophyseal diabetes insipidus mutant vasopressin transgene. The FASEB Journal. 14:1680-1684.
Siman, R., D. Flood, G. Thinakaran, and R. Neumar. 2001. Endoplasmic Reticulum Stress-induced Cysteine Protease Activation in Cortical Neurons. Effect of an
241
Alzheim er's disease linked presenilin-1 knock-in mutation. J. Biol. Chem. 276:44736-44743.
Sisodia, S. 1992. p-amyloid precursor protein cleavage by a membrane-bound protease. Proc. Natl Acad. Sci. USA. 89:6075-6070.
Smith, R., D. Higuchi, and G.J. Broze. 1990. Platelet coagulation factor Xla- inhibitor, a form of Alzheimer amyloid precursor protein. Science. 248:1126-1128.
St George Hyslop, P. 2000. Molecular genetics of Alzheimer's Disease. Soc. of Biol. Psych. 47:183-196.
Stahl, B., A. Diehlmann, and T. Sodhof. 1999. Direct Interaction of Alzheimer's Disease-related Presenilin-1 with Armadillo Protein p0071. J. Biol. Chem. 274:9141-9148.
Steiner, H. Capell, A. Pesold, B. Citron, M. Kloetzel, PM. Selkoe, DJ, Romig, H. Mendla, K. Haass, C. 1998. Expression of Alzheimer's disease-associated presenilin-1 is controlled by proteolytic degradation and complex formation. J. Biol. Chem. 273(48) 32322-32331.
Steiner, H., E. Winkler, D. Edbauer, S. Prokop, G. Basset, A. Yamasaki, M. Kostka, and C. Haass. 2002. PEN-2 is an integral component of the y-secretase complex required for coordinated expression of presenilin and nicastrin. J. Biol. Chem. 277:39062-39065.
Steiner, H., E. W inkler, M. Shearm an, R. Prywes, and C. Haass. 2001. Endoproteolysis of the ER Stress Transducer ATF6 in the Presence of Functionally Inactive Presenilins. Neurobiol. of Disease. 8:717-722.
Strange, P. 1992. Brain biochemistry and Brain Disorders. Oxford University Press. 201-225 pp.
Strittmatter, W ., A. Saunders, D. Schmechel, M. Pericak-Vance, J. Enghild, G. Salvensen, and A. Roses. 1993. Apolipoprotein E: high-avidity binding to B- amyloid and increased frequency of type 4 allele in late-onset familial Alzheimer's disease. Proc.Natl. Acad.Sci.USA. 90:1977-1981.
Struhl, G., and I. Greenwald. 1999. Presenilin is required for activity and nuclear access of Notch in Drosophila. Nature. 398(6727):522-5.
Suzuki N, Cheung TT, Cai XD, Odaka A, Otvos L Jr, Eckman C, Golde TE, Younkin SG. 1994. An increased Percentage of Long Amyloid p Protein secreted by Familial Amyloid p Protein Precursor (p APP 7 1 7 ) Mutants. Science. 264:1336- 1340.
242

Takashima, A., M. Murayama, O. Murayama, T. Kohno, T. Honda, K. Yasutake, N. Nihomatsu, M. Mercken, H. Yamagguci, S. Sugihara, and B. Wolozin. 1998. Presenilin 1 associates with glycogen synthase kinase 3-p and its substrate tau. Proc. Natl. Acad. Sci. USA. 95:9637-9641.
Takashima, A., M. Sato, M. Mercken, S. Tanaka, S. Kondo, T. Honda, K. Sato, M. Murayama, K. Noguchi, Y. Nakazato, and H. Takahashi. 1996. Localization of Alzheimer-Associated Presenilin 1 in Transfected CO S-7 Cells. Biochem. and Biophys. Res. Comm. 227:423-426.
Takasugi, N., T. Tomita, I. Hayashi, M. Tsuruoka, M. Niimura, Y. Takahashi, G. Thinakaran, and T. Iwatsubo. 2003. The role of presenilin cofactors in the y- secretase complex. Nature. 422:438-441.
Takuda, T., T. Fukushima, S. Ikeda, Y. Sekijima, S. Shoji, N. Yanagisawa, and A. Tamoaka. 1997. Plasma levels of amyloid beta proteins Ap1-40 and Ap1-42 (43) are elevated in Down's Syndrome. Ann. Neurol. 41:271-273.
Tanzi, R. 1999. A genetic dichotomy model for the inheritance of Alzheimer's disease and common age-related disorders. The J. of Clin. Invest. 104:1175-1179.
Tanzi, R.E. 1998. Of calcium, caspases, and cognitive decline. Nature Medicine. 4:1127-1128.
Terry, R. 1996. The pathogenesis of Alzheimer's disease: an alternative to the amyloid hypothesis. J. Neuropath. Exp Neurol. 55:1023-1025.
Thinakaren, G., D.R. Borchelt, M.K. Lee, H.H. Slunt, L. Spitzer, G. Kim, T. Ratovitsky, F. Davenport, C. Nordstedt, M. Seeger, J. Hardy, A.I. Levey, S.E. Gandy, N.A. Jenkins, N.G. Copeland, D.L. Price, and S.S. Sisodia. 1996. Endoproteolysis of Presenilin 1 and accumulation of processed derivitives in vivo. Neuron. 17:181-190.
Thinakaran G, Regard JB, Bouton CM, Harris CL, Price DL, Borchelt DR, Sisodia SS. 1998. Stable association of presenilin derivatives and absence of presenilin interactions with APP. Neurobiology of Disease. 4:438-453.
Tokuhiro, K., T. Tomita, H. Iwata, T. Kosaka, T. Saido, K. Maruyama, and T. Iwatsubo. 1998. The Presenilin Mutation (M 146V) Linked to Familial Alzheimer's Disease Attentuates the Differentiation of NTera 2 cells. Biochem. and Biophys. Res. Comm. 244:751-755.
Tomidokoro, Y., I. Koji, I. Yukifusa, M. Etsuro, K. Mitsuyasu, S. Masami, K. Takeshi, H. Yasuo, K. Shinobu, I. Kunio, I. Masaki, P. St George-Hyslop, H. Shunsaku, O. Koichi, and S. Mikio. 1999. Carboxyl-Term inal Fragments of
243

Presenilin-1 Are Closely Related to Cytoskeletal Abnormalities in Alzheimer's Brains. Biochem. and Biophys. Res.Comm. 256:512-518.
Van de Craen, M., C. De Jonghe, I. Van den Brande, W. Declercq, G. Van Gassen, W. Van Criekinge, I. Vanderhoeven, W. Fiers, C. Van Broeckhoven, L. Hendriks, and P. & Vandenabeele. 1999. Identification of caspases that cleave presenilin-1 and presenilin-2. Five presenilin-1 (PS1) mutations do not alter the sensitivity of PS1 to caspases. FEBS. 445:149-154.
Van Gassen, G., C. De Jonghe, S. Pype, W. Van Criekinge, A. Julliams, I. Vanderhoeven, S. W oodrow, R. Beyaert, D. Huylebroeck, and C. Van Broeckhoven. 1999. Alzheimer’s Disease Associated Presenilin 1 Interacts with HC5 and ZETA, Subunits of the Catalytic 20S Proteasome. Neurobiology of Disease. 6:376-391.
Vannier-Santos, M., A. Martiny, U. Lins, J. Urbino, V. Borges, and W. de Souza. 1999. Impairm ent of sterol biosysthesis leads to phosphorus and calcium accumulation in Leishmania acidocalcisomes. Microbiology. 145:3213-3220.
Vassar, R., B. Bennett , S. Babu-Khan , S. Kahn, E. Mendiaz, P. Denis , et. al. 1999. Beta-secretase cleavage of Alzheimer’s amyloid precursor protein by the transmembrane aspartic protease BACE. Science:735-741.
Vickers, J., T. Dickson, P. Adlard, H. Saunders, C. King, and G. McCormack. 2000. The cause of neuronal degenration in Alzheimer's disease. Prog, in Neurobio.: 60(2): 139-65.
Vito, P., T. Ghayur, and L. D'Adamio. 1997. Generation of Anti-apoptotic Presenilin-2 Polypeptides by Alternative Transcription, Proteolysis, and Caspase-3 Cleavage. J. Biol. Chem. 272:28315-28320.
Walsh, D., I. Klyubin, J. Fadeeva, W. Cullen, R. Anwyl, M. Wolfe, M. Rowan, and D. Selkoe. 2002. Naturally secreted oligomers of amyloid p protein potently inhibit hippocampal long-term potentiation in vivo. Nature Medicine. 416:535-539.
Walter, J., C. Kaether, H. Steiner, and C. Haass. 2001. The cell biology of Alzheimer's disease: uncovering the secrets of secretases. Curr. Opin. Neurobiol. 11:585-590.
Wang, J., D. Dickson, J. Trojanowski, and V. Lee. 1999. The levels of soluble versus Insoluble Brain AB Distinguishes Alzheimer's Disease from normal and Pathologic aging. Exp. Neurol. 158:328-337.
Ward, R., J. Davis, C. Gray, A. Barton, L. Bresciani, M. Caivano, V. Murphy, K. Duff, M. Hutton, J. Hardy, G. Roberts, and E. Karran. 1996. Presenilin-1 is
244

processed into two m ajor cleavage products in neuronal cell lines. Neurodegeneration. 5 :293-298.
Warren, G. 1989. Mitosis and Membranes. Nature. 342:857-858.
W atanabe, J., N. Amizuka, T. Noda, and H. Ozawa. 2000. Cytochemical and ultrastructural examination of apoptotic odontoclasts induced by bisphosphonate administration. Cell. Tissue Res. 301:375-387.
Wiltfang, J. Smirnov, A. Schneirstein, B. Kelemen, G. Matthies, U. Wolfgang-Klafki, H. Huther, G. Ruther, E. Kornhuber, J. 1997. Improved electrophoretic seperation and immunoblotting of beta-am yloid (Ap) peptides 1-40, 1-42, and 1-43. Electrophoresis. 18:527-532.
Wiltfang, J., H. Esselmann, P. Cupers, M. Neum ann, H. Kretzschmar, M. Beyermann, D. Schleuder, H. Jahn, E. Ruther, J. Kornhuber, W. Annaert, B. De Strooper, and P. Saftig. 2001. Elevation of beta -Amyloid Peptide 2-42 in Sporadic and Familial Alzheimer's Disease and Its Generation in PS1 Knockout Cells. J. Biol. Chem. 276:42645-42657.
Wolfe, M., W. Xia, C. Moore, D. Leatherwood, B. Ostasezewski, T. Rahmati, I. Donker, and D. Selkoe. 1999a. Petidomimetic probes and molecular modeling Alzheim er's y-secretase is an intram em brane-cleaving aspartyl protease. Biochemistry. 38:4720-4727.
Wolfe, M., B. Ostasezewski, T. Diehl, W. Kimberly, and D. Selkoe. 1999b. Two transmembrane aspartates in presenilin-1 required for presenilin endoproteolysis and y-secretase activity. Nature. 398:513-517.
Wolozin, P., P. Alexander, and J. Palacino. 1998. Regulation of apoptosis by Presenilin 1. Neurobiol. of Aging. 19:S23-S27.
Wood, S.A., J.E. Park, and W.J. Brown. 1991. Brefeldin a Causes a Microtubule- mediated Fusion of the trans-Golgi Network and Early Endosomes. Cell. 67(3):591- 600.
Wyss-Coray T, Masliah E, Mallory M, McConlogue L, Johnson-Wood K, Lin C, Mucke L. 1997. Amyloidogenic role of cytokine TGF-p1 in transgenic mice and in Alzheimer's disease. Nature. 389:603-606.
Xia, W., J. Zhang, D. Kholodenko, M. Citron, M. Podlisny, D. Teplow, C. Flaass, P. Seubert, E. Koo, and D. Selkoe. 1997a. Enhanced production and oligomerization of the 42-residue amyloid beta-protein by Chinese hamster ovary cells stably expressing mutant presenilins. J. of Biol.Chem. 272:7977- 7982.
245

Xia, W., J. Zhang, R. Perez, E. Koo, and D. Selkoe. 1997b. Interaction between amyloid precursor protein and presenilins in mammalians cells: implications for the pathogenesis of Alzheimer's disease. Proc. Natl. Acad. Sci. USA. 94:8208-8213.
Xue, L., G. Fletcher, and A. Tolkovsky. 1999. Autophagy is activated by apoptotic signalling in sympathetic neurons: An alternative mechanism of death execution. Mol. and Cellular Neurosci. 14:180-198.
Yamazaki, T., D. Selkoe, and E. Koo. 1995. Trafficking of cell surface p-Amyloid precursor protein: retrograde and transcytotic transport in cultured neurons. J. Cell Biol. 129:431-442.
Yan SD, Chen X, Fu J, Chen M, Zhu H, Roher A, Slattery T, Zhao L, Nagashima M, Morser J, Migheli A, Nawroth P, Stern D, Schmidt AM. 1996. RAGE and amyloid-beta peptide neurotoxicity in Alzheimer's disease. Nature. 382:685-691.
Yang, J., D. Chandswangbhuvana, T. Theo Shu, A. Henschen, and C. Glabe. 1999. Intracellular Accumulation of Insoluble, Newly Synthesized Apn-42 in Amyloid Precursor Protein-transfected Cells That Have Been Treated with A p i-42 . J. Biol. Chem. 274:20650-20656.
Yanker, B. 1998. Monster plaques: what they tell us ablout Alzheimer's disease. Nature Medicine. 4:394-395.
Yasuda, Y., T. Kudo, T. Katayama, K. Imaizumi, M. Yatera, M. Okochi, H. Yamamori, N. Matsumoto, T. Kida, and A. Fukumori. 2002. FAD-linked presenilin-1 mutants impede translation regulation under ER stress. Biochem. and Biophys. Res. Comm. 296:313-318.
Younkin, S. 1995. Evidence That AP-42 Is the Real Culprit in Alzheimers-Disease. Annals, of Neurol. 37:287-288.
Younkin, S.G. 1994. The Amyloid-Beta Protein-Precursor Mutations Linked to Familial Alzheim ers-Disease Alter Processing in a W ay That Posters Amyloid Deposition. J. of Exp. Med. 174:217-223.
Yu, G., F. Chen, G. Levesque, M. Nishimura, D. Zhang, L. Levesque, E. Rogaeva,D. Xu, Y. Liang, M. Duthie, P. St George-Hyslop, and P. Fraser. 1998. The Presenilin 1 Protein Is a Component of a High Molecular Weight Intracellular Complex That Contains P-Catenin. J. Biol. Chem. 273:16470-16475.
Yu, G., M. Nishimura, S. Arawaka, D. Levitan, L. Zhang, A. Tandon, Y. Song, E. Rogaeva, F. Chen, T. Kawarai, and et. al. 2000. Nicastrin modulates presenilin- mediated notch/glp-1 signal transduction and pAPP processing. Nature. 407:48-54.
246

Zhang, Z., G. Drzeweicki, P. May, R. Rydel, S. Paul, and P. Hyslop. 1996. Inhibition of alpha-macroglobulin/proteinase-mediated degradation of amyloid beta peptide by apolipoprotein E and alpha 1-antichymotrypsin. Int. J. Exp. Clin. Invest. 3:156-161.
Zhang, Z., D. Kang, W. Xia, M. Okochi, H. Mori, D. Selkoe, and E. Koo. 1998. Subcellular Distribution and Turnover of Presenilins in Transfected Cells. J. Biol. Chem. 273:12436-12442.
Zhou, Y., W. Zhang, R. Easton, J. Ray, P. Lampe, Z. Jiang, A. Brunkan, A. Goate, and E. Johnson. 2002. Presenilin-1 Protects against Neuronal Apoptosis Caused by Its Interacting Protein PAG. Neurobiology of Disease. 9:126-138.
247