effect of capital structure on firm profitability (an … of capital structure on firm profitability...
TRANSCRIPT

© 2016. Assad Naim Nasimi. This is a research/review paper, distributed under the terms of the Creative Commons Attribution-Noncommercial 3.0 Unported License http://creativecommons.org/licenses/by-nc/3.0/), permitting all non-commercial use, distribution, and reproduction in any medium, provided the original work is properly cited.
Global Journal of Management and Business Research: C Finance Volume 16 Issue 4 Version 1.0 Year 2016 Type: Double Blind Peer Reviewed International Research Journal Publisher: Global Journals Inc. (USA)
Online ISSN: 2249-4588 & Print ISSN: 0975-5853
Effect of Capital Structure on Firm Profitability (An Empirical Evidence from London, UK)
By Assad Naim Nasimi The University of Lahore, Pakistan
Abstract- This paper intends to explore the effect of capital structure on firm profitability. For the purpose of empirically investigating the effect of capital structure, a sample of 30 firms have been selected from FTSE-100 index of the London Stock Exchange. The data period for the study was 2005 to 2014. The study used multiple regression analysis method to explore the impact of capital structure on firm performance. The results revealed that Interest Coverage has positive significant impact on ROA, ROE and ROIC where DE has positive significant impact on ROE but negative significant impact on ROA and ROIC. The study concluded that an optimal level of capital structure, effective utilization and allocation of resources shall be employed to achieve the targeted level of efficiency in business.
Keywords: debt to equity (DE), interest coverage (IC), return on asset (ROA), return on equity (ROE), return on invested capital (ROIC).
GJMBR - C Classification : JEL Code : D21
EffectofCapitalStructureonFirmProfitabilityAnEmpiricalEvidencefromLondonUK
Strictly as per the compliance and regulations of:

Effect of Capital Structure on Firm Profitability (An Empirical Evidence from London, UK)
Assad Naim Nasimi Abstract- This paper intends to explore the effect of capital structure on firm profitability. For the purpose of empirically investigating the effect of capital structure, a sample of 30 firms have been selected from FTSE-100 index of the London Stock Exchange. The data period for the study was 2005 to 2014. The study used multiple regression analysis method to explore the impact of capital structure on firm performance. The results revealed that Interest Coverage has positive significant impact on ROA, ROE and ROIC where DE has positive significant impact on ROE but negative significant impact on ROA and ROIC. The study concluded that an optimal level of capital structure, effective utilization and allocation of resources shall be employed to achieve the targeted level of efficiency in business. Keywords: debt to equity (DE), interest coverage (IC), return on asset (ROA), return on equity (ROE), return on invested capital (ROIC).
I. Introduction
a) Introduction n an era of globalization of economic policies and financial markets, investment opportunities and financing options have increased, causing a
significant increase on the dependence of capital markets. A new business requires capital and further capital is needed if the firm is to expand. The required funds can come from various sources, which can be categorized into two major proportions comprising of debt and equity capital. The relative proportion of these two major sources in the total capital of a firm is a measure of capital structure. One of the most important reference theories in companies financing policy is the theory of capital structure.
Capital structure is the combination of debt and equity capital that composite a firm’s financing its assets. Financing is referred to as a process of generating cash which can be used for acquisition of assets, current operations or any expected growth. Firms can use either debt or equity capital to finance their assets. Therefore, capital structure can be written as the sum of net worth plus preferred stock plus long-term debts. Besides these sources of finance, enterprises may issue hybrid securities such as income bonds. These hybrid securities possess the features of both equity and debt securities.
The capital structure decision is an important decision as it influences the investors’ return on their investment. It is therefore obligatory on the management of company to make appropriate capital structure so to maintain the interest of its investors.
b) Objectives of the Study The study is intended to undertake the following
objectives:
• To identify the nature of relationship between capital structure and firm performance.
•
To explore the impact of capital structure on firm performance.
Considering the dependent variables (return on equity, return on assets and return on invested capital) and independent variables (debt to equity and interest coverage), the objective of the study has been divided into models as under:
Model 1: UK firms and Return on Asset (ROA):
To investigate the effect of independent variables on return on asset.
Model 2: UK firms and Return on Equity (ROE):
To investigate the effect of independent variables on return on equity.
Model 3: UK firms and Return on Invested Capital (ROIC):
To investigate the effect of independent variables on return on invested capital.
c)
Significance of the study
The relationship between capital structure and profitability cannot be ignored because the long-term survivability of firm
depends upon the improvement in the profitability of the firm. The interest paid on debt is tax deductible payments, so the addition of debt in the capital structure will improve the profitability of the firm. It is important to know the relationship between capital structure and the profitability of the firm in order to make sound decision on capital structure.
Findings of the study are useful for the investors as well as companies who wants to invest in FTSE-100 index. Findings are also useful for the Government sectors for collecting more taxes and boost that particular sectors.
I
© 20 16 Global Journals Inc. (US)
9
Globa
l Jo
urna
l of M
anag
emen
t an
d Bu
siness Resea
rch
Volum
e XVI Issu
e IV
Ver
sion
IYe
ar
()
2016
C
Author: Lahore School of Accountancy & Finance, the University of Lahore Islamabad, Pakistan. e-mail: [email protected]

II. Literature Review
a) Literature View
Based on literature review there is a plenty of research which intends to enlighten the relationship between capital structure and performance of listed firms.
Determining the ideal capital structure and value of firms can be traced back to Modigliani and Miller (1958) who in their research concluded that the value of the firm is self-determining of capital structure and that the value of an unlevered firm is equal to that of a levered firm. The research was based on the assumption of absence of taxes. This assumption was considered unrealistic and in their subsequent research Modigliani and Miller (1963) took tax into consideration and concluded that because of tax shield on debt as a factor, the value of a levered firm was more than the value of an unlevered firm and that this value was equal to the value of the tax shield. Modigliani and Miller (1977)
later modified their earlier research of 1963 and
incorporated the effect of personal taxes. Personal taxes were classified into two categories, tax on income from holdings shares and tax on income from debt securities. In this research (1977), Modigliani and Miller identified certain special cases where gain from leverage became zero, giving the original (1958) result. Thus their results signify the existence of an optimal capital structure at the macro level but not at the micro level.
Deesomsak et al. (2004) examining the effect of
capital structure’s effect on firm performance, reported a negative relationship between capital structure and firms performance measured by gross profit margin in the Malaysian firms. The study indicated that in Singapore, Taiwan and Australian the relation of leverage with firm’s performance is negative but statistically insignificant. Moreover, the effect of firm size on leverage
is
significant and positive for all the countries except Singapore, because in Singapore firms have government support and are less exposed to financial distress costs.
Nimalathasan & Brabete (2010)
examined methodically the relationship between capital structure and financial performance of firms listed on Columbia Stock Exchange, Sri Lanka. The study guides the entrepreneurs and policy planners to formulate better policy decisions regarding the mix of debt and equity capital to control over capital structure planning.
Abor (2005) investigate the relationship between
capital structure and profitability of listed firms on Ghana Stock Exchange. He reveals a positive relationship between short term debt to total assets and return on equity due to low interest rates. Further, he suggests that in Ghanaian firm’s short term financing shows 85 percent of total debt and is considered a main element of financing for them. Moreover, a negative relationship
find between long term financing and equity returns, and a positive relation exists between total debt and profitability. He also suggests that debt is considered as a major source of financing for high profitable firms.
b) Hypothesis of the Study Based on above literature review, the
researcher formulates the following hypothesis.
Model 1
H0: There is no significant impact of Independent Variables1
The
hypothesis for each model has been described in
on Return on Asset.
H1: There is significant impact of Independent Variables on Return on Asset.
Model 2
H0: There is no significant impact of Independent
Variables on Return on Equity.
H1: There is
significant impact of Independent Variables
on Return on Equity.
Model 3
H0:
There is no significant impact of Independent Variables on Return on Invested Capital.
H1: There is significant impact of Independent Variables
on Return on Invested Capital.
Table 1 as shown in appendix.
III.
Research Methodology
a)
Population and Sample Set of the study
The population for this study is all top 100 companies listed in FTSE-100 index. The researcher has selected the sample for the research from this population to check the effect of capital structure on firm performance.
In this study, a sample of 30 firms has been selected from the FTSE-100 index of London Stock Exchange for the
purpose of investigating the effect of
capital structure on firm performance. This panel data has been collected for the period of 10 years i.e. from 2005 to 2014 from the financial statements of the firms in order to empirically investigate the relationship between capital structure and firm performance.
b)
Theoretical Framework/ Conceptual Framework
The study uses following variables to investigate the effect of capital structure on firm performance.
1 Independent Variables include Debt to Equity and Interest Coverage
10
Globa
l Jo
urna
l of M
anag
emen
t an
d Bu
siness Resea
rch
Volum
e XVI Issu
e IV
Ver
sion
IYe
ar
()
2016
© 2016 Global Journals Inc. (US)1
Effect of Capital Structure on Firm Profitability (An Empirical Evidence from London, UK)C
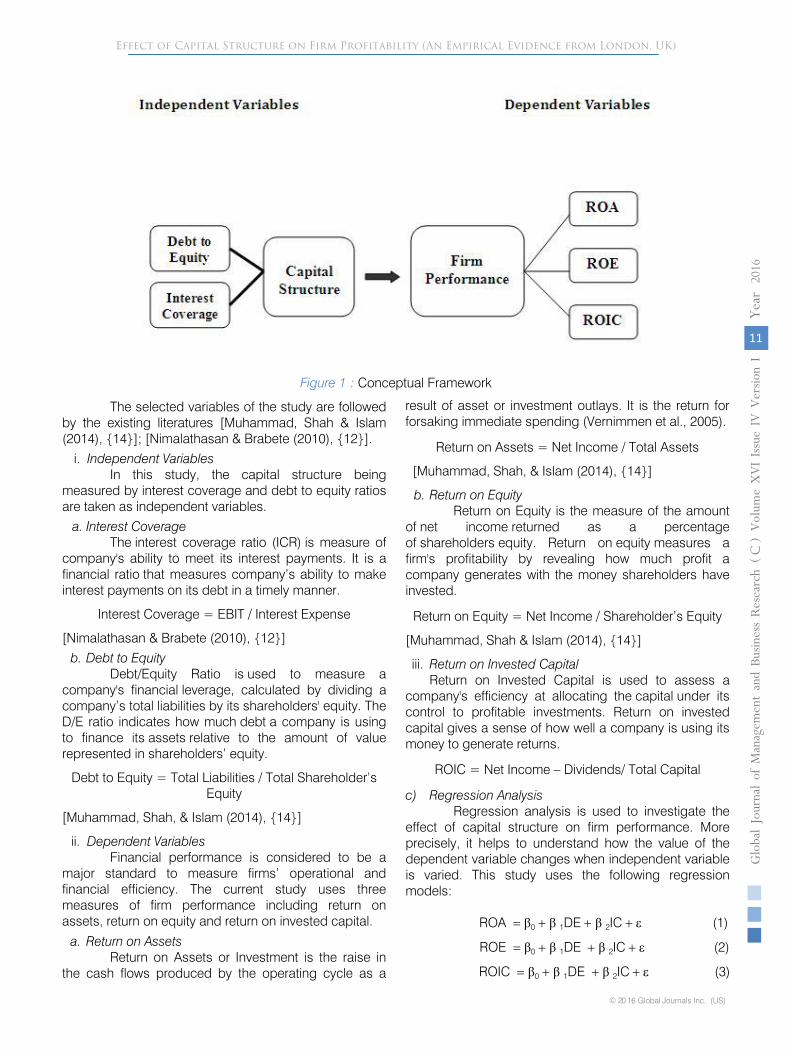
The selected variables of the study are followed by the existing literatures [Muhammad, Shah & Islam (2014), {14}]; [Nimalathasan & Brabete (2010), {12}].
i. Independent Variables In this study, the capital structure being
measured by interest coverage and debt to equity ratios are taken as independent variables.
a. Interest Coverage The interest coverage ratio (ICR) is measure of
company's ability to meet its interest payments. It is a financial ratio that measures company’s ability to make interest payments on its debt in a timely manner.
Interest Coverage = EBIT / Interest Expense
[Nimalathasan & Brabete (2010), {12}] b. Debt to Equity
Debt/Equity Ratio is used to measure a company's financial leverage, calculated by dividing a company’s total liabilities by its shareholders' equity. The D/E ratio indicates how much debt a company is using to finance its assets relative to the amount of value represented in shareholders’ equity.
Debt to Equity = Total Liabilities / Total Shareholder’s Equity
[Muhammad, Shah, & Islam (2014), {14}]
ii. Dependent Variables Financial performance is considered to be a
major standard to measure firms’ operational and financial efficiency. The current study uses three measures of firm performance including return on assets, return on equity and return on invested capital.
a.
Return on Assets
Return on Assets or Investment is the raise in the cash flows produced by the operating cycle as a
result of asset or investment outlays. It is the return for forsaking immediate spending
(Vernimmen et al., 2005).
Return on Assets = Net Income / Total Assets
[Muhammad, Shah, & Islam (2014), {14}]
b.
Return on Equity
Return on Equity is the measure of the amount of
net income
returned as a percentage of
shareholders
equity. Return on
equity
measures a firm's profitability by revealing how much profit a company generates with the money shareholders have invested.
Return on Equity = Net Income / Shareholder’s Equity
[Muhammad, Shah & Islam (2014), {14}]
iii.
Return on Invested Capital
Return on Invested Capital is used to assess a company's efficiency at allocating the
capital
under its control to profitable investments. Return on invested capital
gives a sense of how well a company is using its money to generate returns.
ROIC = Net Income – Dividends/ Total Capital
c)
Regression Analysis
Regression analysis is used to investigate the effect of capital structure on firm performance.
More precisely, it helps to understand how the value of the dependent variable changes when independent variable is varied. This study uses the following regression models:
© 20 16 Global Journals Inc. (US)
11
Globa
l Jo
urna
l of M
anag
emen
t an
d Bu
siness Resea
rch
Volum
e XVI Issu
e IV
Ver
sion
IYe
ar
()
2016
Effect of Capital Structure on Firm Profitability (An Empirical Evidence from London, UK)
C
ROA = β0 + β 1DE + β 2IC + ε (1)
ROE = β0 + β 1DE + β 2IC + ε (2)
ROIC = β0 + β 1DE + β 2IC + ε (3)
Figure 1 : Conceptual Framework

The highest value of mean is 18.15027 of IC,
where ROA has the lowest mean of 0.075340. IC has the highest value of standard deviation being 41.02593 and the lowest value is 0.089427 relating to ROA. In respect of Kurtosis, IC has the highest value of kurtosis where ROIC has the lowest value 17.97986.
b) Correlation Analysis Correlation means the relationship between two
variables. The correlation shows two things, first it shows
the direction between two variables and secondly it shows the strength of associations between two variables. The below Table 3
shows the correlation
between dependent (ROA, ROE and ROIC) and independent (DE and IC) variables.
Sample: 2005 2014
Table 3 : Correlation Analysis
DE
IC
ROA
ROE
ROIC
DE
1.000000
IC
-0.192475
1.000000
ROA
-0.016145
0.307764
1.000000 ROE 0.404273
0.081229
0.494161
1.000000
ROIC
0.047440
0.334291
0.937808
0.573084
1.000000
12
Globa
l Jo
urna
l of M
anag
emen
t an
d Bu
siness Resea
rch
Volum
e XVI Issu
e IV
Ver
sion
IYe
ar
()
2016
© 2016 Global Journals Inc. (US)1
Effect of Capital Structure on Firm Profitability (An Empirical Evidence from London, UK)C
Where:β0= Coefficient of Interceptβ1 – β2 = Slope of InterceptDE = Debt to EquityIC = Interest CoverageROA = Return on assetsROE = Return on EquityROIC = Return on invested Capitalε = error term.
IV. Results and Discussions
a) Descriptive StatisticsThe descriptive statistics is used as a measure
for the analysis of mean, median, maximum, minimum, standard deviation, skewness and kurtosis of the study sample in order to explore the data variation in the firm’s listed on the FTSE – 100. The below
Table 2 : Shows the descriptive statistics of variables of the current study
Sample: 2005 2014Table 2 – Descriptive Statistics
DE IC ROA ROE ROIC
Mean 0.846667 18.15027 0.075340 0.311095 0.148971Median 0.605000 8.030000 0.067000 0.200250 0.126550Maximum 5.970000 423.0000 0.671100 9.850200 1.215300Minimum 0.010000 -39.54000 -0.535400 -2.623200 -0.965800Std. Dev. 0.855844 41.02593 0.089427 0.774534 0.161158Skewness 2.531492 6.420749 0.010960 8.065354 0.494186Kurtosis 11.01491 55.10743 19.98988 91.87858 17.97986
Jarque-Bera 1123.408 36001.11 3608.207 101995.0 2817.163Probability 0.000000 0.000000 0.000000 0.000000 0.000000
Sum 254.0000 5445.080 22.60200 93.32850 44.69140Sum Sq. Dev. 219.0085 503254.9 2.391137 179.3709 7.765562
Observations 300 300 300 300 300

The results revealed that DE is positively correlated with ROE and ROIC while negatively correlated with ROA, whereas IC is positively correlated with ROA, ROE and ROIC. DE is negatively correlated with IC. A positive correlation is revealed among all dependent variables.
c) Regression Analysis Panel regression consists of Common Effect,
Fixed Effect and Random Effect in order to test the
hypothesis of the study. Likelihood and Hausman tests have been considered for the appropriate selection of panel regression.
i. Model 1 – UK firms and ROA The result of Hausman Test (cross section
random with Prob. 0.0103) shows that Fixed Effect is the appropriate test.
Correlated Random Effects - Hausman Test Test Summary
Chi-Sq. Statistic
Chi-Sq. d.f.
Prob.
Cross-section random
9.151944
2 0.0103
Table
4
in the appendix shows the results of regression analysis for model 1. The results shows all the 30 firms have a common co-efficient of 0.083955.
The coefficient value of interest coverage is 0.000532, which means that 0.0532 percent variation of return on
asset has been explain by the variation of interest coverage. The t-statistics of interest coverage is 4.012955
with a p- value is < 0.05 shows that interest coverage has got significant positive impact on return on asset. If one unit increases in interest coverage then return on asset will increase at 0.000532 units. The coefficient value of debt to equity is -0.021581, which means that 2.1581 percent negative variation of return on asset has been explain by the variation of debt to equity. The t-statistics of debt to equity is -2.475469
with a p- value is < 0.05 shows that debt to equity has got significant negative impact on return on asset. If one unit increases in debt to equity then return on asset will decrease at 0.021581units.
The values of determination of coefficient R2
is 0.347279,
which means that 34.7279
percent variation of return on asset has been explain by the variations of independent variables, which are debt to equity and interest coverage.
The value of AdjR2
is 0.271778,
shows that if the
researcher incorporate more relevant variables than it will adjust R2
at the rate of 27.1778
percent.
Model is found statistically significant (F = 4.599651, p < 0.01); the value of F-statistics is 4.599651
and p-value is <0.05 shows that the model is good fit for the study.
ii. Model 2 – UK firms and ROE
The result of Hausman test (cross section random with Prob. 0.0876) shows that Random Effect is the appropriate test for the study.
Correlated Random Effects - Hausman
Test
Test Summary
Chi-Sq. Statistic
Chi-Sq. d.f.
Prob.
Cross-section random
4.869432
2 0.0876
Table
5
in the appendix shows the results of regression analysis for model 2. The result shows that all 30 firms have a common coefficient of 0.040741.
The coefficient value of interest coverage is
0.001930,
which means that 0.1930
percent variation of return on
equity has been explain by the variation of interest coverage. The t-statistics of interest coverage is 2.051486
with a p- value is < 0.05 shows that interest coverage has got significant positive impact on return on equity. If one unit increases in interest coverage then return on equity will increase at 0.001930
units. The coefficient value of debt to equity is 0.277936,
which means that 27.7936 percent variation of return on equity has been explain by the variation of debt to equity. The t-statistics of debt to equity is 4.893138
with a p- value is < 0.05 shows that debt to equity has got significant
positive impact on return on equity. If one unit increases in debt to equity then return on equity will increase at 0.277936
units.
The values of determination of coefficient R2
is 0.079153,
which means that 7.9153
percent variation of return on equity has been explain by the variations of independent variables, which are debt to equity and interest coverage.
© 20 16 Global Journals Inc. (US)
13
Globa
l Jo
urna
l of M
anag
emen
t an
d Bu
siness Resea
rch
Volum
e XVI Issu
e IV
Ver
sion
IYe
ar
()
2016
Effect of Capital Structure on Firm Profitability (An Empirical Evidence from London, UK)
The value of AdjR2 is 0.072952, shows that if the researcher incorporate more relevant variables than it will adjust R2 at the rate of 7.2952 percent.
Model is found statistically significant (F = 12.76463, p < 0.01); the value of F-statistics is 12.76463and p-value is <0.05 shows that the model is good fit for the study.
C

iii. Model 3 – UK firms and ROIC The result of Hausman test (cross section
random with Prob.0.0038) shows that Fixed Effect is the appropriate test for the study.
Correlated Random Effects - Hausman Test
Test Summary
Chi-Sq. Statistic
Chi-Sq. d.f.
Prob.
Cross-section random
11.147838
2 0.0038
Table 6
in the appendix shows the results of regression analysis for model 3. The results revealed that all 30 firms have a common coefficient of 0.15742.
The coefficient value of interest coverage is 0.001028,
which means that 0.1028
percent variation of return on invested capital has been explain by the variation of interest coverage. The t-statistics of interest coverage is 4.651186
with a p- value is < 0.05 shows that interest coverage has got significant positive impact on return on invested capital. If one unit increases in interest coverage then return on invested capital will increase at 0.001028
units. The coefficient value of debt to equity is -0.032028,
which means that 3.2028
percent negative variation of return on invested capital has been explain by the variation of debt to equity. The t-statistics of debt to equity is -2.203081 with a p- value is < 0.05 shows that debt to equity has got significant negative impact on return on invested capital. If one unit increases in debt to equity then return on invested capital will decrease at 0.032028 units.
The values of determination of coefficient R2
is 0.441113,
which means that 44.1113 percent variation of return on invested capital has been explain by the variations of independent variables, which are debt to equity and interest coverage.
The value of AdjR2
is 0.376466,
shows that if the researcher incorporate more relevant variables than it will adjust R2
at the rate of 37.6466
percent.
Model is found statistically significant (F = 6.823382,
p < 0.01); the value of F-statistics is 6.823382
and p-value is <0.05 shows that the model is good fit for the study.
V.
Conclusion and Recommendation
a)
Conclusion
The main objective of the study is to empirically investigate the effect of capital structure on firm performance of 30 companies listed on FTSE-100, London Stock Exchange, United Kingdom. For the purpose of exploring the effect, the study consists of three models including two independent variables and three dependents.
Based on the correlation analysis of the study, DE is positively correlated with ROE and ROIC while negatively correlated with ROA, whereas IC is positively
correlated with ROA, ROE and ROIC. There is negative correlation between DE an IC. A positive correlation is revealed among all independent variables.
Besides, the regression results of first model reveals that DE and IC have p-value of 0.0139 and 0.0001 respectively showing significant impact on Return on Asset and the value of R-squared is 0.347279 which denotes that 34.7279% of variation in ROA is due to debt to equity and interest coverage. This shows that IC has positive significant impact on return on asset while DE has negative significant impact on return on asset.
The regression result of the second model reveals that variables DE and IC have p-value of 0.0000 and 0.0411 respectively showing significant impact on Return on Equity. The value of R-squared is 0.079153 which denotes that 7.9153% of variation in ROE is due to independent variables debt to equity and interest coverage. This shows that DE and IC have positive significant impact on return on equity.
The regression result of third model reveals that DE and IC shows p-value of 0.0284 and 0.0000 respectively meaning that independent variables have significant impact on Return on Invested Capital Both independent variables (DE and IC) showing significant value 0.0284 and 0.0000 respectively showing significant impact on return on invested capital. The value of R-squared is 0.441113 which denotes that 44.1113% of variation in ROIC is due to independent variables debt to equity and interest coverage. This shows that IC has positive significant impact on return on invested capital where DE has negative significant impact.
Based on the empirical finds the study concludes that there is significant effect of capital structure on firm performance.
14
Globa
l Jo
urna
l of M
anag
emen
t an
d Bu
siness Resea
rch
Volum
e XVI Issu
e IV
Ver
sion
IYe
ar
()
2016
© 2016 Global Journals Inc. (US)1
Effect of Capital Structure on Firm Profitability (An Empirical Evidence from London, UK)
The study concludes that there is significant effect of capital structure on firm performance. The results of the study determines that the higher the value of debt, higher will be the tax benefits (tax shield) received by firms. Therefore, the firms’ executives and managers shall maintain optimum level of capital structure in order to achieve the targeted level of efficiency in business.
C

b)
Recommendation
The researcher has conducted the research on effect of capital structure on firm performance evidence from FTSE-100 index over the period of 2005-2014 by using two independent and three dependent
variables. If anyone else wants to conduct the research on the same topic:
The researcher must incorporate more independent variables
The period of the study should be more than 20 years for better results
The researcher must collect the data more the 50 companies for better results
References Références Referencias
1.
Abor, J. (2005).
The effect of capital structure on profitability: an empirical analysis of listed firms in Ghana. Journal of Risk Finance, 6, 438-447.
2.
Azhagaiah, R., & Gavoury, C. (2011). The
Impact of Capital Structure on Profitability with Special Reference to IT Industry in India. Managing Global Transitions, volume 9, 2011.
3.
Ahmad, T. (2014). Impact of Capital Structure on Firm Profitability: An Empirical Analysis of Cement Sector of Pakistan.
Research Journal of Finance and Accounting, volume 5 No.17, 2014. ISSN 2222-1697 (Paper) ISSN 2222-2847 (Online).
4.
Ajlouni, A., & Shawer, M. (2013). The Effect of Capital Structure on Profitability: Evidence from the petrochemical companies in the kingdom of Saudi Arabia. International Journal of Research in Commerce, IT and Management, volume 3 (2013), Issue No.11 (November), ISSN: 2231-5756
5.
Chisti, K., Ali, K. & Sangmi, M. (2013). Impact of Capital Structure on Profitability of Listed Companies (Evidence from India).
The USV Annals of Economics and Public Administration, volume 13, Issue 1(17), 2013.
6.
Deesomsak, R., Paudyal, K., & Pescetto, G. (2004). The determinants of capital structure: evidence from the Asia Pacific region. Journal of multinational financial management, 14(4), 387-405.
7.
Ebaid, I. E. (2009). The impact of capital-structure choice on firm performance: empirical evidence from Egypt.
The Journal of Risk Finance, 10(5), 477-487. Doi: 10.1108/15265940911001385.
8.
Gill, A., Biger, N., & Mathur,
N. (2011). The Effect of Capital Structure on Profitability: Evidence from United States. International Journal of Management, vol. 28, No. 4 Part 1 Dec 2011.
9.
Handoo, A., & Sharma, K. (2014). A study on determinants of capital structure in India. IIMB Management Review (2014) 26, 170 – 182.
10.
Modigliani, F. & Miller, H. (1958). The Cost of Capital, Corporate Finance and The Theory of
Investment.
The American Economic Review, volume XLVIII, June 1958 Number Three.
11.
Modigliani, F. & Miller, H. (1963). Corporate Income Taxes and Cost of Capital: A correction. The American Review, Vol. 53, No. 3 (June 1963), pp 433 – 443.
12.
Modigliani, F. & Miller, H. (1977). Debt and Taxes. The Journal of Finance, Vol. 32, No.2, Papers and Proceedings of the Thirty-fifth Annual Meeting of the American Finance Association, Atlantic City, New Jersey, September 16-18, 1976 (May, 1977), pp. 261 – 275.
13.
Muhammad, H., Shah, B. & Islam, Z. (2014). The Impact of Capital Structure on Firm Profitability: Evidence from Pakistan. Journal of Industrial Distribution and Business, 5 – 2 (2014) 13 – 20, ISSN: 2233-4165/ Online ISSN: 2233-5383.
14.
Nimalathasan, B., & Brabete, V. (2010). Capital Structure and its impact on Profitability: A study of Listed Manufacturing Companies in Sri Lanka.
Revista Tinerilor Economist (The Young Economists Journal), volume 1, Issue 15(November).
15.
Opoku, E., Kwame, J. & Anarfi, B. (2014). The Impact of Capital Structure and Profitability of Listed Banks on the Ghana Stock Exchange. Social and Basic Sciences Research Review, volume 1, Issue 2. ISSN: 2313-6758.
16.
Riaz, S. (2015). Impact of Capital Structure on Firm’s Financial Performance: An Analysis of Chemical Sector of Pakistan. Journal of Poverty, Investment and Development, vol. 12, 2015. ISSN 2422-846X.
17.
Shubita, F.
& Aslawalhah, J. (2012). The relationship between Capital Structure and Profitability.
International Journal of Business and Social Science, vol. 3 No. 16 [Special Issue – August 2012]. The special issue on Contemporary Research in Art and Social Sciences, Centre for promoting Ideas, USA.
18.
Salawu, R. & Awolowo, O. (2009). The Effect of Capital Structure on Firm Profitability: An Empirical Analysis of Listed Firms in Nigeria. The International Journal of Business and Finance Research, volume 3 No.2 – 2009.
19.
Sheik, N., & Wang, Z. (2013).
The Impact of Capital Structure on Performance. International Journal of Commerce and Management, Volume 23, Iss 4 pp. 354 – 368.
© 20 16 Global Journals Inc. (US)
15
Globa
l Jo
urna
l of M
anag
emen
t an
d Bu
siness Resea
rch
Volum
e XVI Issu
e IV
Ver
sion
IYe
ar
()
2016
Effect of Capital Structure on Firm Profitability (An Empirical Evidence from London, UK)
20. Vijaykumar, A. & Karunaiathal, A. (2014). The Effect of Capital Structure on Profitability – An Empirical Analysis of Indian Paper Industry. International Research Journal of Business Management – IRJBM, volume No. VII, December 2014, Issue-13. ISSN 2322-083X.
21. Vitor, D., & Badu, J. (2012). Capital Structure and Performance of Listed Banks in Ghana. Global
C

Journal of Human Social Science, volume 12, Issue 5, Version 1.0 March 2012. ISSN: 2249-460X & Print: 0975-587X.
22.
Yegon, C., Cheruiyot, J., Sang, J. & Cheruiyot, P. (2014). The Effect of Capital Structure on Firm’s
Profitability: Evidence from Kenya’s Banking Sector. Research Journal of Accounting and Finance, vol. 5, No.9 2014. ISSN 2222-1697 (Paper), ISSN 2222-2847 (Online).
Appendices
Table 1:
Hypothesis
Model 1
H0 11 :
There is no significant impact of Debt to Equity ratio on Return on Asset.
H1 11 :
There is significant impact of Debt to Equity on Return on Asset.
H0 12 : There is no significant impact of Interest Coverage on Return on Asset.
H1 12 :
There is significant impact of Interest Coverage on Return on Asset
Model 2
H0 21 :
There is no significant impact of Debt to Equity ratio on Return on Equity.
H1 21 :
There is significant impact of Debt to Equity on Return on Equity.
H0 22 :
There is no significant impact of Interest Coverage on Return on Equity.
H1 22 : There is significant impact of Interest Coverage on Return on Equity.
Model 3
H0 31 :
There is no significant impact of Debt to Equity ratio on Return on Invested Capital.
H1 31 :
There is significant impact of Debt to Equity on Return on Invested Capital.
H0 32 :
There is no significant impact of Interest Coverage on Return on Invested Capital.
H1 32 :
There is significant impact of Interest Coverage on Return on Invested Capital.
Table 4 :
Regression Result for Model 1 – UK firms and ROA
Fixed Effects
Variable
Coefficient
Std. Error
t-Statistic
Prob.
C 0.083955
0.009182
9.143380
0.0000
DE_?
-0.021581
0.008718
-2.475469
0.0139
IC_?
0.000532
0.000133
4.012955
0.0001
Fixed Effects (Cross)
AAL--C -0.019375
ABDNF--C -0.066916
ANFGY--C 0.008207
ARGKF--C 0.044487
ASBFY--C -0.029815
AZN--C 0.051874
BAESY--C -0.031637
BRGYY--C -0.005128
BTI--C 0.047545
BTLCY--C -0.032653
BZLFY--C -0.001997
CMPGY--C -0.007974
COIHY--C 0.019579
CPYYY--C -0.023621
EVRZF--C -0.009078
16
Globa
l Jo
urna
l of M
anag
emen
t an
d Bu
siness Resea
rch
Volum
e XVI Issu
e IV
Ver
sion
IYe
ar
()
2016
© 2016 Global Journals Inc. (US)1
Effect of Capital Structure on Firm Profitability (An Empirical Evidence from London, UK)
GKN--C -0.034399HMSNF--C -0.038829
C

ITYBY--C 0.024969
MGGT--C -0.026288
NXT--C 0.201381
PFC--C -0.009925
REL--C 0.024137 REXMY--C -0.029355 RYCEY--C -0.031547 SECCY--C -0.072257 SGPYY--C -0.009866 SMGKF--C 0.049948 TUWOY--C -0.044454 UUGRY--C 0.012527
WG--C 0.040460 Effects Specification
Cross-section fixed (dummy variables) R-squared 0.347279 Mean dependent var 0.075340
Adjusted R-squared 0.271778 S.D. dependent var 0.089427 S.E. of regression 0.076313 Akaike info criterion -2.207409 Sum squared resid 1.560744 Schwarz criterion -1.812339 Log likelihood 363.1114 Hannan-Quinn criter. -2.049302 F-statistic 4.599651 Durbin-Watson stat 1.812590 Prob(F-statistic) 0.000000
Table 5 : Regression Result for Model 2 – UK firms and ROE
Random Effects
Variable
Coefficient
Std. Error
t-Statistic
Prob.
C 0.040741
0.098586
0.413255
0.6797
DE_?
0.277936
0.056801
4.893138
0.0000
IC_?
0.001930
0.000941
2.051486
0.0411
Random Effects (Cross)
AAL--C -0.029177 ABDNF--C -0.047389 ANFGY--C -0.045634 ARGKF--C 0.058032 ASBFY--C -0.001291 AZN--C 0.133399
BAESY--C -0.043541
BRGYY--C -0.019481 BTI--C -0.003306 BTLCY--C -0.133704 BZLFY--C -0.082136 CMPGY--C -0.043696 COIHY--C -0.056627
CPYYY--C -0.135063
EVRZF--C -0.228111
GKN--C -0.061691
HMSNF--C -0.143834
ITYBY--C -0.109032
© 20 16 Global Journals Inc. (US)
17
Globa
l Jo
urna
l of M
anag
emen
t an
d Bu
siness Resea
rch
Volum
e XVI Issu
e IV
Ver
sion
IYe
ar
()
2016
Effect of Capital Structure on Firm Profitability (An Empirical Evidence from London, UK)
C

MGGT--C -0.083286
NXT--C 1.992695
PFC--C 0.138318
REL--C -0.186068
REXMY--C -0.133018
RYCEY--C 0.024978
SECCY--C -0.337284
SGPYY--C -0.024445
SMGKF--C 0.083380
TUWOY--C -0.095970
UUGRY--C -0.498114
WG--C 0.111097 Effects Specification S.D. Rho Cross-section random 0.418185 0.3577 Idiosyncratic random 0.560326 0.6423 Weighted Statistics R-squared 0.079153 Mean dependent var 0.121370
Adjusted R-squared 0.072952 S.D. dependent var 0.584760 S.E. of regression 0.563026 Sum squared resid 94.14844
F-statistic 12.76463 Durbin-Watson stat 1.419889 Prob(F-statistic) 0.000005
Unweighted Statistics R-squared
0.172241
Mean dependent var
0.311095
Sum squared resid
148.4759
Durbin-Watson stat
0.900350
Table 6 : Regression Result for Model 3 – UK firms and ROIC
Fixed Effects
Variable
Coefficient
Std. Error
t-Statistic
Prob.
C 0.157423
0.015312
10.28129
0.0000
DE_?
-0.032028
0.014538
-2.203081
0.0284
IC_?
0.001028
0.000221
4.651186
0.0000
Fixed Effects (Cross)
AAL--C -0.060364 ABDNF--C -0.081484 ANFGY--C -0.057580 ARGKF--C 0.028649 ASBFY--C -0.076158 AZN--C 0.087408 BAESY--C -0.013653 BRGYY--C -0.046143
BTI--C 0.044175 BTLCY--C -0.082528 BZLFY--C -0.006245 CMPGY--C -0.011159 COIHY--C 0.032534 CPYYY--C -0.022619 EVRZF--C -0.023171
GKN--C -0.030655
HMSNF--C -0.087763
18
Globa
l Jo
urna
l of M
anag
emen
t an
d Bu
siness Resea
rch
Volum
e XVI Issu
e IV
Ver
sion
IYe
ar
()
2016
© 2016 Global Journals Inc. (US)1
Effect of Capital Structure on Firm Profitability (An Empirical Evidence from London, UK)C

ITYBY--C
0.044140
MGGT--C -0.062851
NXT--C 0.441973
PFC--C 0.121937
REL--C 0.048011
REXMY--C -0.056897
RYCEY--C -0.011594
SECCY--C -0.129125
SGPYY--C -0.048259
SMGKF--C 0.075485
TUWOY--C -0.085777
UUGRY--C 0.002941
WG--C 0.066772
Effects Specification
Cross-section fixed (dummy variables)
R-squared
0.441113
Mean dependent var
0.148971
Adjusted R-squared
0.376466
S.D. dependent var
0.161158
S.E. of regression
0.127257
Akaike info criterion
-1.184682
Sum squared resid
4.340068
Schwarz criterion
-0.789612
Log likelihood
209.7023
Hannan-Quinn criter.
-1.026574
F-statistic
6.823382
Durbin-Watson stat
1.941166
Prob(F-statistic)
0.000000
© 20 16 Global Journals Inc. (US)
19
Globa
l Jo
urna
l of M
anag
emen
t an
d Bu
siness Resea
rch
Volum
e XVI Issu
e IV
Ver
sion
IYe
ar
()
2016
Effect of Capital Structure on Firm Profitability (An Empirical Evidence from London, UK)
C

This page is intentionally left blank
3
20
Globa
l Jo
urna
l of M
anag
emen
t an
d Bu
siness Resea
rch
Volum
e XVI Issu
e IV
Ver
sion
IYe
ar
()
2016
© 2016 Global Journals Inc. (US)1
Effect of Capital Structure on Firm Profitability (An Empirical Evidence from London, UK)C