effect of alkali-silica reaction …etd.lib.metu.edu.tr/upload/12616369/index.pdfeffect of...
TRANSCRIPT

EFFECT OF ALKALI-SILICA REACTION EXPANSION ON MECHANICAL
PROPERTIES OF CONCRETE
A THESIS SUBMITTED TO
THE GRADUATE SCHOOL OF NATURAL AND APPLIED SCIENCE
OF
MIDDLE EAST TECHNICAL UNIVERSITY
BY
ALKAN HAFÇI
IN PARTIAL FULFILLMENT OF THE REQUIREMENTS
FOR
THE DEGREE OF MASTER OF SCIENCE
IN
CIVIL ENGINEERING
SEPTEMBER 2013

Approval of the thesis:
EFFECT OF ALKALI-SILICA REACTION EXPANSION ON MECHANICAL
PROPERTIES OF CONCRETE
submitted by ALKAN HAFÇI in partial fulfillment of the requirements for the degree of
Master of Science in Civil Engineering Department, Middle East Technical University
by,
Prof. Dr. Canan Özgen _____________________
Dean, Graduate School of Natural and Applied Sciences
Prof. Dr. Ahmet Cevdet Yalçıner
Head of Department, Civil Engineering _____________________
Assoc. Prof. Dr. Lutfullah Turanlı _____________________
Supervisor, Civil Engineering Dept., METU
Examining Committee Members:
Assoc. Prof. Dr. Afşin Sarıtaş _____________________
Civil Engineering Dept., METU
Assoc. Prof. Dr. Lutfullah Turanlı _____________________
Civil Engineering Dept., METU
Assoc. Prof. Dr. Sinan Turhan Erdoğan _____________________
Civil Engineering Dept., METU
Dr. Okan Cengiz _____________________
Expert, TUBITAK
İsmail Raci Bayer, M.Sc. _____________________ Director, Ministry of Environment and Urbanization
Date: 04.09.2013

iv
I hereby declare that all information in this document has been obtained and presented
in accordance with academic rules and ethical conduct. I also declare that, as required
by these rules and conduct, I have fully cited and referenced all material and results
that are not original to this work.
Name, Last Name: ALKAN HAFÇI
Signature:
v
ABSTRACT
EFFECT OF ALKALI-SILICA REACTION EXPANSION ON MECHANICAL
PROPERTIES OF CONCRETE
Hafçı, Alkan
M.Sc., Department of Civil Engineering
Supervisor : Assoc. Prof. Dr. Lutfullah Turanlı
September 2013, 98 pages
Alkali-silica reaction (ASR) is a chemical deterioration process which arises in concrete due
to reactive aggregate from its constituent, sufficient alkalis from cement or external
resources and humidity about 85%. ASR gel, formed by the reaction, absorbs water and
expands so that it causes expansion and cracking in concrete. ASR has detrimental effects on
mechanical properties of concrete. Therefore, ASR which is a long and a constantly
progressive reaction may become a threat to the safety of concrete structures.
This experimental study focuses on two main subjects. The first one is the effect of ASR on
mechanical properties of concrete, which are compressive strength, flexural strength,
splitting tensile strength, modulus of elasticity and pullout strength at expansion of over
0.04 % and the second one is the impact of the type of specimen on ASR expansion, which
differs as prism, cube, and cylinder. Concrete specimens in different types for tests include
not only fine river sand, a reactive aggregate, but also coarse limestone, a non-reactive
aggregate. As known, some standards like ASTM C1293 and Canadian CSA–A23.2-14A,
describe aggregates causing expansion more than 0.04% in concrete within 1 year as
potentially deleteriously reactive. Firstly, immediately after the expansion of the specimens,
exposed to ASR exceeded 0.04%, the mechanical tests were performed on both them and
the control specimens. Secondly, the specimens, exposed to ASR for longer time, were tested
at expansion of over 0.10% to investigate ASR effect on mechanical properties.
The investigation results confirm that expansion of over 0.04% in concrete from ASR caused
losses in mechanical properties of concrete at different rates. With higher expansion, losses
increase significantly especially in flexural strength and pullout strength of concrete.
Moreover, higher rate of expansion in prisms than cubes at any time and cylinders proves
that the type of specimen has an important role on rate of ASR expansion according to
results.
Keywords: Alkali Silica Reaction, Expansion, Mechanical properties, Flexural strength,
Prisms

vi
ÖZ
ALKALİ SİLİKA REAKSİYON GENLEŞMESİNİN BETONUN MEKANİK
ÖZELLİKLERİNE ETKİSİ
Hafçı, Alkan
Yüksek Lisans, İnşaat Mühendisliği Bölümü
Tez Yöneticisi: Doç. Dr. Lutfullah Turanlı
Eylül 2013, 98 sayfa
Alkali-silika reaksiyonu betonun içeriğindeki reaktif agreganın, çimentodan veya dış
kaynaklardan gelen alkalilerin ve % 85‟ten fazla nemin yol açtığı kimyasal bir bozunma
sürecidir. Reaksiyon sonucu oluşan jel su emer ve büyüyerek betonda genleşmeye ve
çatlamalara yol açar. Alkali-silika reaksiyonun betonun mekanik özellikleri üzerinde
olumsuz etkileri vardır. Bu nedenle, uzun dönemli ve sürekli ilerleyen alkali-silika
reaksiyonu beton yapılarının güvenliği için bir tehdit unsuru olabilir.
Bu çalışma iki temel konu üzerinde yapıldı. İlk olarak alkali-silika reaksiyonun % 0.04‟ten
fazla genleşmeye neden olduğu zaman, betonun basınç dayanımı, eğilme dayanımı, yarmada
çekme dayanımı, elastisite modülü ve sıyrılma dayanımı gibi mekanik özelliklere etkisi ve
ikinci olarak prizma, küp ve silindir olarak değişen numune tiplerinin genleşme üzerindeki
etkisi üzerinedir. Farklı tiplerde, hem ince nehir kumu hem de iri kireç taşı içeren numuneler
teste tabi tutulmuştur. Bilindiği üzere, ASTM C1293 ve CSA-A23.2-14A başta olmak üzere
bazı standartlar, betonda bir yıl içinde %0.04 oranından fazla genleşmeye neden agregaları
potansiyel olarak zararlı olabilecek kadar reaktif olarak tanımlar. ASR‟ ye maruz bırakılan
numunelerin genleşme miktarı %0.04 oranını aştığı zaman, mekanik testler bu numuneler ve
kontrol numuneleri üzerinde yapılmıştır. Daha uzun süreli olarak ASR‟ ye bırakılan ve %
0.10‟luk genleşme oranı aşan numuneler, mekanik özellikler üzerindeki ASR etkisini
incelemek için teste tabi tutulmuştur.
Araştırma sonuçları betonda %0.04 oranını aşan ASR kaynaklı genleşmenin farklı oranlarda
betonun mekanik özelliklerinde kayıplara neden olduğunu doğrulamaktadır. Artan
genleşmeyle birlikte, başta eğilme ve sıyrılma dayanımı olmak üzere, kayıplar önemli oranda
artmıştır. Ayrıca, her aşamada prizmalarda küplerden ve silindirlerden fazla olan genleşme,
numune tipinin ASR genleşmesi üzerinde önemli bir rolü olduğunu kanıtlamıştır.
Anahtar Kelimeler: Alkali Silika Reaksiyon, Genleşme, Mekanik özellikler, Eğilme
Dayanımı, Prizmalar
vii
To My Wife,
Havva Özer Hafçı

viii
ACKNOWLEDGMENTS
I would like to express sincere thanks to my supervisor Assoc. Prof. Dr. Lutfullah Turanlı for
his continuous supervision, suggestions, and guidance to the achievement of this study.
I am especially grateful to Dr. Fatih Bektaş for his encouragement to study the subject,
suggestions, comments and valuable discussions.
I am also thankful to Cuma Yıldırım and Hasan Metin for technical support.
Thanks are extended to Mustafa Bilal, Savaş Akyüz and Erdem Kırdı who are my
colleagues, for their help during the experiments and the enthusiastic support throughout the
development of this thesis.
Of course, I would like to thank my parents Mercan Hafçı and Nedim Hafçı, and my brother
Gürkan Hafçı for their endless support, and being my motivation to work.
Finally, my sincere appreciation is for my wife Havva Özer Hafçı for her everlasting love
and encouragement. She always believes in me more than I do.

ix
TABLE OF CONTENTS
ABSTRACT ............................................................................................................................. v
ÖZ ........................................................................................................................................... vi
ACKNOWLEDGMENTS .................................................................................................... viii
TABLE OF CONTENTS ........................................................................................................ ix
LIST OF TABLES ................................................................................................................ xiii
LIST OF FIGURES ............................................................................................................... xv
CHAPTERS
1. INTRODUCTION ............................................................................................................... 1
1.1 General........................................................................................................................... 1
1.2 Objectives and Scope of the Investigation ..................................................................... 2
2. THEORY OF ALKALI – AGGREGATE REACTION ...................................................... 5
2.1 General........................................................................................................................... 5
2.2 Types of Alkali-Aggregate Reaction ............................................................................. 5
2.2.1 Alkali – Carbonate Reaction .................................................................................. 5
2.2.2 Alkali – Silicate Reaction ....................................................................................... 6
2.2.3 Alkali – Silica Reaction.......................................................................................... 7
2.3 Mechanism of Alkali-Silica Reaction ............................................................................ 7
2.4 The Factors Affecting Alkali-Silica Reaction Expansion .............................................. 9
2.4.1 Nature of Reactive Silica ........................................................................................ 9
2.4.2 Amount of Reactive Material ............................................................................... 10
2.4.3 Particle Size of Reactive Material ........................................................................ 11
2.4.4 Alkali Content ...................................................................................................... 12
x
2.4.5 Moisture Effect ..................................................................................................... 14
2.4.6 Temperature Effect ............................................................................................... 14
2.5 Harmful Effects of Alkali – Silica Reaction on Concrete Properties ........................... 15
2.6 Test Methods for Determination of Alkali-Silica Reactivity ....................................... 15
2.6.1 Petrographic Examination of Aggregates ............................................................. 15
2.6.2 Chemical Methods Applied to Aggregates ........................................................... 16
2.6.3 Mortar Bar Methods ............................................................................................. 16
2.6.4. Autoclave Methods .............................................................................................. 17
2.6.5. Concrete Prism Methods...................................................................................... 18
2.7 Prevention of Alkali-Silica Reaction Effects ............................................................... 22
2.7.1 Avoidance of Reactive Aggregate ........................................................................ 22
2.7.2 Avoidance of Cement Consisting of High Alkali ................................................. 23
2.7.3 Avoidance of Usable Moisture ............................................................................. 23
2.7.4 Addition of Mineral Admixture to Concrete ........................................................ 23
2.7.5 Addition of Chemical Additive to Concrete ......................................................... 24
3. REVIEW OF RESEARCH ON EFFECT OF ALKALI-SILICA REACTION
EXPANSION ON MECHANICAL PROPERTIES OF CONCRETE .................................. 25
3.1 General ......................................................................................................................... 25
3.2 Effect of Alkali-Silica Reaction Expansion on Compressive Strength of Concrete .... 25
3.3 Effect of Alkali-Silica Reaction Expansion on Tensile Strength of Concrete ............. 31
3.3.1 Flexural Strength (i.e. Modulus of Rupture) ........................................................ 31
3.3.1 Tensile Splitting Strength ..................................................................................... 36
3.3.3 Direct Tensile Strength ......................................................................................... 38
3.4 Effect of Alkali-Silica Reaction Expansion on Modulus Elasticity of Concrete ......... 40

xi
3.5 Effect of Alkali-Silica Reaction Expansion on Water Absorption of Concrete .......... 45
3.6 Effect of Alkali-Silica Reaction Expansion on Young‟s Modulus of Concrete .......... 48
3.7 Effect of Alkali-Silica Reaction Expansion on Slow Dynamic Behaviour of Concrete
........................................................................................................................................... 48
3.8 Effect of Alkali-Silica Reaction Expansion on Reinforced Concrete Beams .............. 49
3.9 Monitoring of Ultrasonic Pulse Velocity (UPV) and Surface Expansion on ASR-
affected Concrete ............................................................................................................... 49
3.10 Expansion Varying with Different Type of Specimens ............................................. 53
4. EXPERIMENTAL STUDY ............................................................................................... 55
4.1 Experimental Study ..................................................................................................... 55
4.2 Main Apparatus Used .................................................................................................. 58
4.2.1 Sieves ................................................................................................................... 58
4.2.2 Moulds .................................................................................................................. 58
4.2.3 Boiling Containers................................................................................................ 58
4.2.4 Air Conditioning Cabin ........................................................................................ 58
4.2.5 Digital Length Comparator .................................................................................. 59
4.2.6 Weighing Balance ................................................................................................ 60
4.2.7 Digital Calliper ..................................................................................................... 60
4.2.8 Testing Devices .................................................................................................... 60
4.3 Materials ...................................................................................................................... 61
4.3.1 Cement ................................................................................................................. 61
4.3.2 Aggregates ............................................................................................................ 62
4.3.3 Water .................................................................................................................... 63
4.3.4 Sodium Hydroxide ............................................................................................... 63
xii
4.4 Investigation Method ................................................................................................... 64
4.4.1 Determination of Expansion from Alkali-Silica Reaction .................................... 64
4.4.2 Determination of the Effect of Alkali-Silica Reaction Expansion on the
Mechanical Properties of Concrete ................................................................................ 66
5. RESULTS AND DISCUSSION ........................................................................................ 69
5.1 General ......................................................................................................................... 69
5.2 Effect of ASR Expansion on Compressive Strength of Concrete ................................ 69
5.3 Effect of ASR Expansion on Flexural Strength of Concrete ....................................... 74
5.4 Effect of ASR Expansion on Splitting Tensile Strength of Concrete .......................... 78
5.5 Effect of ASR Expansion on Modulus of Elasticity of Concrete ................................. 79
5.6 Effect of ASR Expansion on Pullout Strength of Concrete ......................................... 81
5.7 Cracking from ASR ..................................................................................................... 84
5.8 Impact of Type of Specimen on ASR Expansion ........................................................ 85
6. CONCLUSIONS ................................................................................................................ 89
7. RECOMMENDATIONS ................................................................................................... 91
REFERENCES ....................................................................................................................... 93
xiii
LIST OF TABLES
TABLES
Table 2.1 Alkali-reactive silica types [Mehta&Monteiro, 1999; Mindess&Young, 1981] ... 10
Table 2.2 Available standard tests for evaluating ASR [FHWA, 2003]. .............................. 19
Table 3.1 Effect of ASR expansion on compressive strength of concrete [Ahmed et al.,
2003]. ..................................................................................................................................... 26
Table 3.2 Effects of ASR expansion on compressive strength of concrete [Swamy&Al-
Asali, 1988]. ........................................................................................................................... 27
Table 3.3 Loss of compressive strength of ASR-affected concrete with time [Swamy & Al-
Asali, 1988] ............................................................................................................................ 29
Table 3.4 Difference in compressive strength between low-alkali concrete and high-alkali
concrete [Smaoui et al., 2005] ............................................................................................... 30
Table 3.5 Tensile/compressive ratio and percentage loss in the mechanical properties of
ASR-affected concrete [Ahmed et al., 2003]. ........................................................................ 32
Table 3.6 Effects of ASR expansion on tensile strength (flexural and splitting ) of concretes
[Swamy & Al-Asali, 1988]. ................................................................................................... 33
Table 3.7 Loss percentage in tensile strength (flexural and splitting) of ASR-affected
concrete [Swamy & Al-Asali, 1988]...................................................................................... 34
Table 3.8 Mixture proportions (kg/m3) and properties of fresh concrete [Giaccio et al,2008].
............................................................................................................................................... 35
Table 3.9 Effects of ASR expansion on flexural strength of concretes [Giaccio et al,2008].35
Table 3.10 Difference in splitting tensile strength between low-alkali concrete and high-
alkali Concrete [Smaoui et al., 2005] ..................................................................................... 37
Table 3.11 Effects of ASR expansion on static modulus of elasticity (SME) [Ahmed et al.,
2003]. ..................................................................................................................................... 41
Table 3.12 Difference of modulus of elasticity between low-alkali concrete and high-alkali
Concrete [Smaoui et al., 2005]............................................................................................... 42
Table 3.13 Effect of ASR expansion on dynamic modulus of concretes [Swamy & Al-Asali,
1988]. ..................................................................................................................................... 44
Table 3.14 Percentage loss in dynamic modulus of ASR- affected concretes [Swamy & Al-
Asali, 1988]. ........................................................................................................................... 45
xiv
Table 3.15 Effect of ASR expansion on water absorption [Ahmed et al., 2003]. ................. 46
Table 3.16 Effect of ASR expansion on ultrasonic pulse velocity [Ahmed et. al., 2003]. .... 50
Table 3.17 Loss percentage in UPV of ASR-affected concretes [Swamy & Al-Asali, 1988].
................................................................................................................................................ 53
Table 3.18 Expansion of ASR-affected and control concretes [Ahmet et al., 2003]. ........... 54
Table 4.1 Chemical compositions and physical properties of the cement [Baştaş Çimento,
2012]....................................................................................................................................... 62
Table 4.2 The physical properties of natural river sand and crushed limestone.................... 63
Table 4.3 Common mix design of 1 m3 concrete .................................................................. 65
Table 4.4 Size distribution of aggregates .............................................................................. 65
Table 5.1 Expansion and compressive strength of all concretes for cube specimens ........... 72
Table 5.2 Expansion and compressive strength of all concretes for cylindrical specimens .. 73
Table 5.3 Loss in compressive strength of ASR-affected concrete comparing with control
concrete .................................................................................................................................. 74
Table 5.4 Loss in compressive strength of ASR-affected concrete with expansion ............. 77
Table 5.5 Splitting tensile strength of concretes with expansion .......................................... 78
Table 5.6 Modulus of elasticity of concretes with expansion ............................................... 81
Table 5.7 Pullout strength of concretes with expansion ........................................................ 82
Table 5.8 Loss percentages in mechanical properties of concrete ........................................ 83
Table 5.9 Expansion of G-B concretes for all types of specimens with time ........................ 87
xv
LIST OF FIGURES
FIGURES
Figure 2.1 Thin-section cut of ASR-damaged concrete, showing ASR gel and typical crack
pattern (through aggregate and into surrounding matrix) [Page & Page, 2007]. ..................... 7
Figure 2.2 ASR Cracks on Concrete Step Barrier [FHWA, 2010]. ........................................ 8
Figure 2.3 Effect of rock types on ASR expansion [Blanks & Kennedy, 1955] ..................... 9
Figure 2.4 Opal percentages in aggregate with expansion [Woods, 1968]. .......................... 11
Figure 2.5 Effect of the size of reactive material on ASR expansion [Woods, 1968]. .......... 12
Figure 2.6 Effect of alkali content on expansion of concrete using ASTM C 1293
[FHWA, 2003]. ...................................................................................................................... 13
Figure 2.7 Effect of relative humidity on expansion using ASTM C 1293 [Pedneault, 1996].
............................................................................................................................................... 14
Figure 2.8 Change of percent of alkalis reacted in different temperatures [Swamy, 1992] .. 15
Figure 2.9 Expansion-age graph of the concrete samples including reactive aggregates
[Page & Page, 2007] .............................................................................................................. 19
Figure 2.10 Essential components for ASR-induced damage in concrete [FHWA, 2003]. .. 22
Figure 2.11 Expansion graphs obtained by ASTM C1260 that consist of different amount of
silica fume [Musaoğlu, 2012]. ............................................................................................... 24
Figure 3.1 Change in compressive strength of ASR-affected concrete vs. time [Ahmed et al.,
2003]. ..................................................................................................................................... 27
Figure 3.2 Expansion of control and ASR-affected concrete at 20 0C and 96% RH for 1 year.
[Swamy & Al-Asali, 1988]. ................................................................................................... 28
Figure 3.3 Compressive strength with ASR expansion [Swamy & Al-Asali, 1988]. ........... 29
Figure 3.4 Results of mechanical testing for compressive strength as a function of time
[Smaoui et al., 2005] .............................................................................................................. 30
Figure 3.5 Variation in flexural strength (i.e. modulus of rupture) of control and ASR-
affected concrete with time [Ahmed et al, 2003]. .................................................................. 32
Figure 3.6 Loss in tensile strength (flexural and splitting tensile) of ASR-affected concrete
[Swamy & Al-Asali, 1988]. ................................................................................................... 34

xvi
Figure 3.7 Splitting tensile strength of ASR-affected and control concretes with time
[Ahmed et al, 2003]. ............................................................................................................... 37
Figure 3.8 Results of mechanical testing for splitting tensile strength as a function of time
[Smaoui et. al., 2005] ............................................................................................................. 38
Figure 3.9 Direct tensile strength of control and ASR-affected concrete with time [Ahmed et
al., 2003]. ................................................................................................................................ 39
Figure 3.10 Variation in static modulus of elasticity (SME) with time [Ahmed et al., 2003].
................................................................................................................................................ 41
Figure 3.11 Variation in static modulus of elasticity (SME) with expansion [Ahmed et al.,
2003]....................................................................................................................................... 42
Figure 3.12 Variation in static modulus of elasticity (SME) with time [Smaoui et al., 2005]
................................................................................................................................................ 43
Figure 3.13 Variation in dynamic modulus of elasticity and pulse velocity with expansion
[Swamy & Al-Asali, 1988]. ................................................................................................... 44
Figure 3.14 Variation in water absorption with expansion [Ahmed et al.,2003]. ................. 46
Figure 3.15 Variation in water absorption with time [Swamy & Al-Asali, 1988]. ............... 47
Figure 3.16 Variation in water absorption with expansion [Swamy & Al-Asali, 1988]. ...... 48
Figure 3.17 Variation in UPV of prism and cylinder with time [Ahmed et al., 2003]. ......... 51
Figure 3.18 Variation in UPV of prism and cylinder with expansion [Ahmed et al., 2003]. 52
Figure 3.19 Variation in dynamic modulus of elasticity and pulse velocity with time
[Swamy & Al-Asali, 1988]. ................................................................................................... 52
Figure 3.20 Longitudinal expansion of prism and cylinder with time [Ahmet et al., 2003]. 54
Figure 4.1 Trial samples used to find the most appropriate material .................................... 55
Figure 4.2 Specimens for flexural strength test ..................................................................... 56
Figure 4.3 Specimens for splitting tensile test ....................................................................... 57
Figure 4.4 Specimens for pullout strength test ...................................................................... 57
Figure 4.5 Boiling containers with their outside and inside views ........................................ 58
Figure 4.6 Air conditioning cabin ......................................................................................... 59
Figure 4.7 Digital length comparator .................................................................................... 59
Figure 4.8 Flexural testing device ......................................................................................... 60

xvii
Figure 4.9 Modulus of elasticity test device ......................................................................... 61
Figure 4.10 Setup for pullout strength test ............................................................................ 61
Figure 5.1 Expansion of G-A concrete for cube and cylindrical specimens with time ......... 70
Figure 5.2 Expansion of G-B concrete for cube and cylindrical specimens with time ......... 70
Figure 5.3 Expansion of G-A concrete for prismatic specimens with time .......................... 75
Figure 5.4 Expansion of G-B concrete for prismatic specimens with time .......................... 75
Figure 5.5 Prismatic specimens of G-C, G-A, and G-B concretes respectively ................... 76
Figure 5.6 Cylindrical specimens for tensile splitting strength of G-C, G-A, and G-B
concretes, respectively ........................................................................................................... 79
Figure 5.7 Cylindrical specimens for modulus of elasticity of G-A, G-C, and G-B concretes,
respectively ............................................................................................................................ 81
Figure 5.8 Cube specimens for pullout strength of G-A, G-C, and G-B concretes,
respectively ............................................................................................................................ 82
Figure 5.9 Sections from prismatic specimens of G-A and G-B concretes, respectively ..... 84
Figure 5.10 Sections from cylindrical specimens of G-A and G-B concretes, respectively . 85
Figure 5.11 Expansion of G-A concretes for all types of specimens with time .................... 86
Figure 5.12 Expansion of G-B concretes for all types of specimens with time .................... 86

xviii
LIST OF ABBREVIATIONS
AAR : Alkali - Aggregate Reaction
ASR : Alkali - Silica Reaction
ACR : Alkali - Carbonate Reaction
RH : Relative Humidity
G-A concrete : A concrete group containing specimens expanded over 0.04 percent due to
ASR
G-B concrete : A concrete group containing specimens expanded over 0.10 percent due to
ASR
G-C concrete : A concrete group containing specimens used as control concrete
UPV : Ultrasonic Pulse Velocity
SME : Static Modulus Of Elasticity

1
CHAPTER 1
1. INTRODUCTION
1.1 General
Concrete has been used since ancient Romans times as one of the oldest and most important
structural materials. The use of concrete is still quite widespread today, even we can say that
it is the most widespread structural material. The reason why concrete is widely used is that
it is the most suitable material for construction. It has resistance to compression forces, it is
workable and durable material, it can be formed into variety of shapes and sizes, and also it
is somehow cheap material. In addition to these, concrete has more resistance to water and
fire than wood and ordinary steel.
With concrete, we can make architectural structures, foundations, brick/block walls,
urbanization, water and sewage treatment system, pavements, bridges/overpasses,
motorways/roads, runways, parking structures, dams, pools/reservoirs, pipes, footings for
gates, fences and poles and even boats. The meaning of concrete is “to grow together” which
has Latin origin [Mindess, 1981; Skalny, 1989].
The reasons for deterioration of concrete structures are freezing and thawing, wetting and
drying, temperature changes, wear and abrasion, leaching and efflorescence, sulphate attack,
alkali-aggregate reaction, acids and alkalis attack, or any other process of deterioration.
Durability of concrete is defined as resistance of concrete against these processes of
deterioration [Bektaş, 2002; Neville & Brooks 1987; Mindess & Young, 1981]. In December
1962, ACI 2 Committee 201 defined durability of a material as “Its resistance to
deteriorating influences which may through inadvertence or ignorance reside in the concrete
itself, or which are inherent in the environment to which it is exposed” [Woods, 1968].
Durability of concrete has very important role on aesthetic aspect, quality and serviceability
of concrete structures.
Alkali Aggregate Reaction (AAR) is an important deterioration process seen on concrete
structures. Alkali-silica reaction (ASR), alkali-carbonate reaction (ACR), and alkali-silicate
are main types of AAR [Swamy, 1992]. ASR is a chemical reaction occurring in concrete
with reactive aggregates in the condition of those sufficient alkalis (K2O, Na2O) and
humidity (higher than 85 %) [Neville, 1990]. Temperature is a main factor affecting progress
and initiation time of the reaction [Giaccio et al., 2008]. If there are reactive aggregate,
sufficient, and sufficient moisture are kept, ASR occurs and causes a gel formation. This gel
absorbs water, grows and causes internal pressure triggering micro cracks in concrete
structure [Marzouk & Langdon 1992]. Because of these cracks, it can be said that ASR has
serious effects on the mechanical properties of concrete such as compressive, flexural
2
strength, splitting tension, pullout resistance, and modulus of elasticity in addition to
durability of concrete.
In some long term test method for detecting of ASR (e.g. ASTM C1293 and Canadian CSA-
A23.2-14A), expansion of over 0.04 percent in concrete prism reflects that the aggregate
used in concrete is agreeable as reactive. Some research on how ASR affects mechanical
properties of concrete structure has been made so far. However, there is still no research on
whether 0.04 percent expansion has harmful effect on mechanical properties of concrete
structure.
1.2 Objectives and Scope of the Investigation
That ASR has harmful effects on mechanical properties of concrete structure is an apparent
issue after many investigations. ASTM C1293 and Canadian CSA-A23.2-14A describe
aggregate causing expansion of more than 0.04 percent in concrete as potentially deleterious
reactive. Therefore, investigating how expansion of more than 0.04 percent from ASR
affects mechanical properties of concrete was the principal aim of this study. In order to
reach minimum expansion of 0.04 percent in the long term, four different aggregates
combinations such as fine perlite & coarse limestone, fine perlite & coarse perlite, fine river
sand & coarse limestone, fine limestone & coarse perlite were tried out by using concrete
prisms, 285x80x80 mm in size. The concrete prism, cast with the combination consisting of
natural river sand and limestone, expanded to 0.04 percent in nearly 5-6 weeks so that fine
river sand and coarse limestone was selected for using in test specimens.
In this experimental study, RILEM TC 219-ACS was applied for preparation of specimens.
In addition to prism mould defined in this standard, cylinder and cube moulds were cast with
the same concrete content. Concrete for the experimental study consisted of CEM I 42,5 R
Portland cement, sand as fine and reactive aggregate, limestone as coarse aggregate and non
reactive and tap water. 5 mechanical properties of concrete affected by ASR were
investigated by preparing specimens in specified dimension as follows:
1) 9 concrete prisms, 285x80x80 mm in size, with reference steel stud for
flexural strength test
2) 9 concrete cubes, 150x150x150 mm in size, with reference steel stud for
compressive strength test
3) 9 concrete cylinders, 200x100 mm in size, with reference steel stud for both
compressive strength test and modulus of elasticity
4) 9 concrete cylinders, 200x100 mm in size, without reference steel stud for
splitting tensile strength
5) 9 concrete cubes, 200x100 mm in size, with 10-mm ribbed steel for both
compressive strength test and modulus of elasticity.
3
All samples were divided into 3 groups including 3 specimens. The first, second, third
groups were called group A concrete (G-A concrete), group B concrete (G-B concrete),
group C concrete (G-C concrete), respectively.
G-A concrete was exposed to 60 0C and 100% RH for formation of ASR until its expansion
exceeded 0.04 percent. Like in the G-A concrete, G-B concrete was exposed to 60 0C and
100% RH and also NaOH solution at 60 0C in order to provide expansion of more than 0.10
percent. Unlike in the others, G-C concrete was cured in water at 20 0C until G-A concrete
expanded more than 0.04 percent and so used as the control concrete.
At expansion of more than 0.10 percent, investigating the effect of ASR on mechanical
properties was another important aim of this study. In addition to two main purposes, the
impact of type of specimen on ASR expansion was examined on prisms, cubes, and
cylinders. In order to observe crack development, the samples were photographed over and
over again as taking measurement
Chapter 1 of the thesis includes introduction part, the theoretical considerations of alkali-
aggregate reaction takes part in Chapter 2. While Chapter 3, includes review of research on
the effects of alkali reactivity on mechanical properties of concrete, Chapter 4 consist of
experimental study, As for Chapter 5 and Chapter 6 contains results and discussion and
conclusions respectively. Lastly, there is recommendations part of the thesis in Chapter 7.

4
5
CHAPTER 2
2. THEORY OF ALKALI – AGGREGATE REACTION
2.1 General
Alkali – aggregate reaction in concrete (AAR) has many effects on concrete structures in the
world. In spite of all right process during the construction at making concrete materials and
compliance with standards required, deteriorations at different shapes were appeared on
concrete structure in a few years after building finished. Deteriorations on concrete
structures‟ surface were observed as generally excessive expansion, map cracking or pattern
cracking and surface pop outs and spalling [Mindess & Young 1981; Swamy, 1992].
The mechanism of AAR was first researched by Thomas Stanton of the California State
Division of Highways in 1940 and Stanton explained the AAR as a chemical reaction
between high alkali cement and opaline aggregates. After that, many detailed studies
investigated mechanism of AAR, controlling the expansion from AAR and its effects on
concrete. These studies explained remarkable unknown subjects related to AAR. As an
example, Blanks and Meissner (1941) found that the expansive forces from alkali-silica
reaction were the main factor causing the cracks on concrete structure [Mindess & Young
1981; Swamy, 1992; Swamy & Al-Asali 1988].
2.2 Types of Alkali-Aggregate Reaction
In general, AAR is classified as three main types which are alkali-carbonate reaction (ACR),
alkali-silicate reaction, alkali-silica reaction (ASR). In general opinion, these reactions occur
between the hydroxyl ions (associated with Na and K alkalis) from usually cement and
reactive constituents of some aggregates used in concrete. However, the three main AAR
reactions are separated from each other in views of reactive component in aggregate
[Marzouk & Langdon, 2003; Bektaş, 2002].
2.2.1 Alkali – Carbonate Reaction
Swenson (1957) was the first scientist who discovered alkali-carbonate reaction. In order to
explain this reaction, he investigated on concrete pavements in Kingston, Ontario. In this
investigation, he observed excessive expansion on concrete pavements sections which are
closed the joints and also deeply cracked slabs in 6 months period after placing due to the
reaction between alkalis and carbonate rocks [Swamy, 1992].
ACR is still not able to be explained as the full of extent today, but Gillott clarified the most
mechanism of ACR. While it forms in ASR, a gel does not form in alkali- carbonate

6
reaction. The main suspected process for degradation of concrete containing dolomite
aggregate is the alkali-carbonate reaction. In ACR, alkali from cement may react with
dolomite crystals in the aggregate consists of the output of brucite, (MgOH)2, and calcite
(CaCO3). Due to dedolomitization of dolomite, channels are uncovered and so moisture
absorption starts that causes increasing moisture content, swelling and naturally expansion
and cracks. The mechanism of ACR can be explained in Reaction 2.1 and Formula 2.1 as
below [Swenson & Gitlott 1964; Blight & Alexander, 2011].
Alkali + Dolomite Calcite + Brucite + Alkali carbonate (Reaction 2.1)
CaMg(CO3)2 + 2 NaOH CaCO3 + Na2CO3 + Mg(OH)2 (Formula 2.1)
Alkali-carbonate reaction is not as widespread as alkali-silica reaction and it can be observed
in very limited region in worldwide. Therefore, many studies on ACR and preventing
measures for it have not been carried out until now. Not using of reactive materials in
concrete is only acceptable measure for preventing ACR‟s harmful effects [Blight &
Alexander, 2011].
2.2.2 Alkali – Silicate Reaction
As another group of alkali-aggregate reaction, alkali-silicate reaction is secondly considered.
It was identified in Nova Scotia, in Eastern Canada. Gillott and Duncan delivered firstly an
opinion about the results of alkali-silicate reactions in 1973 [Popovics, 1992].
There is no sufficient information about harmful effects of alkali-silicate reactions. It appears
in alkali-rich concrete if it contains the rock types consisting of plenty of silicate minerals
such as greywacked, argillites, phyllite, and siltstones. The reaction between alkalis and
silicate minerals advances slowly but it can be complex. Alkali silicate reaction causes the
scale of silicate minerals and so expansion of silicate mineral leading to „dry‟ aluminosilicate
surfaces in the microcrystalline portions of the rock aggregates. Dry aluminosilicate surfaces
absorb water and trigger internal stress in the aggregate and naturally expansion. The
expansion derived from the internal stress causes deterioration of concrete structure. The
amount of microcrystalline material and the porosity are the 2 main factors affecting
expansion ratio of concrete [Mindess & Young, 1981; Swamy, 1992; Blight & Alexander,
2011].
It is argumentive issue to clarify alkali-silicate reaction in concrete since alkali silica reaction
may arise due to finely divided silica in rocks at the same time the alkali silicate reaction
occurs [Blight & Alexander, 2011].
7
2.2.3 Alkali – Silica Reaction
Alkali-silica reaction is the most widespread reaction occurring between alkalis usually from
cement and reactive aggregate constituents as considering alkali-aggregate reactions.
Moreover, ASR is the most deleterious reaction and so it has severe harmful effects on
concrete properties. This phenomenon was firstly explained by Stanton. Other aggregate-
reactions proceeds slowly, invariably ASR does. Observation of deleterious effects on
concrete structures may take years. As an example, Chambon Dam in the Romanche River is
demonstrable because it was constructed in 1935 but cracks from ASR were firstly able to be
observed 15 years later. Even in 1985, the expansions in the dam were still going on
[Marzouk & Langdon, 2003; Swamy, 1992].
2.3 Mechanism of Alkali-Silica Reaction
Alkali-silica reaction (ASR) is a chemical reaction occurring in the long term in concrete in
case of that the mixing of concrete consists of highly alkaline cement (alkali may be from
not only the cement but also an external source,) and aggregate having reactive amorphous
silica [Ahmed et al., 2003; Winter, 2007]. For example, volcanic glasses, cristobalite, opal,
and tridymite consist of reactive siliceous components biased to react with alkalis [Blight &
Alexander, 2011]. The reaction between the alkaline components from usually cements and
reactive siliceous constituents from aggregates causes a gel formation named as ASR gel.
When ASR gel absorbs water, it starts to expand and causes internal pressure triggering
deterioration of concrete structure in various forms like as micro-cracks, fragmentation on
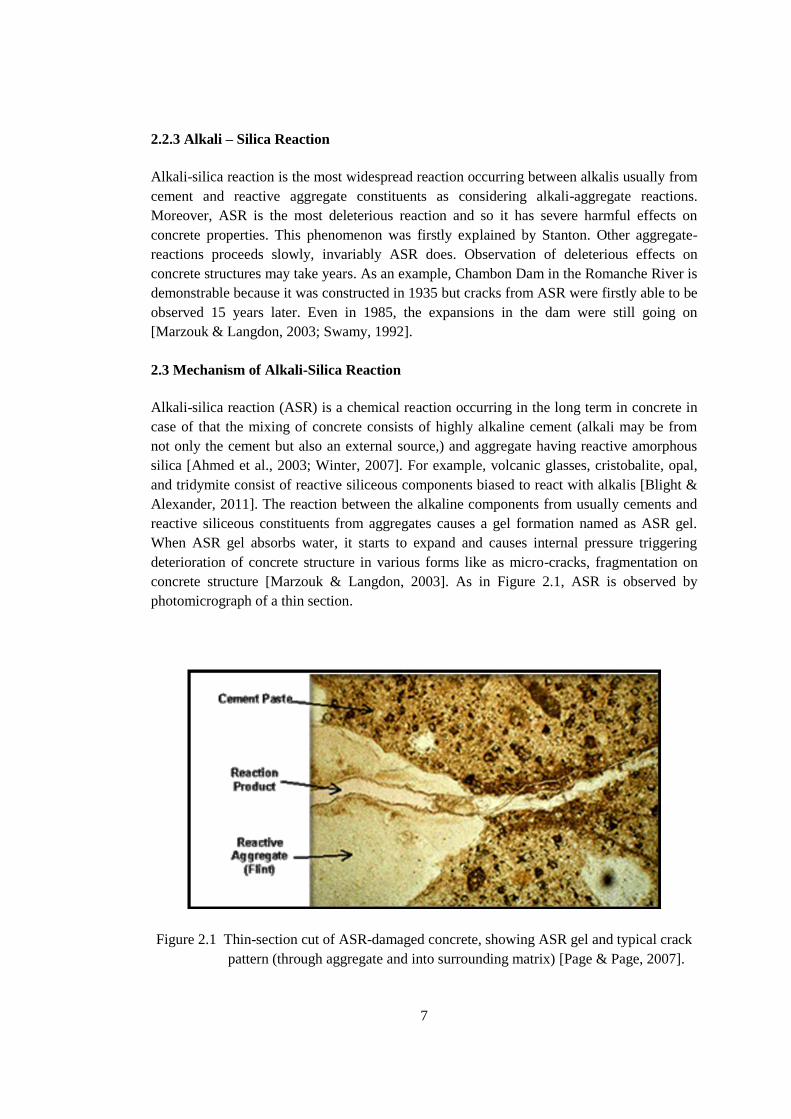
concrete structure [Marzouk & Langdon, 2003]. As in Figure 2.1, ASR is observed by
photomicrograph of a thin section.
Figure 2.1 Thin-section cut of ASR-damaged concrete, showing ASR gel and typical crack
pattern (through aggregate and into surrounding matrix) [Page & Page, 2007].
8
Alkali + Silica + Water ASR gel (Reaction 2.2)
2 (Na,K) OH + SiO2 + H2O Na2 SiO3 + 2H2O (Formula 2.2)
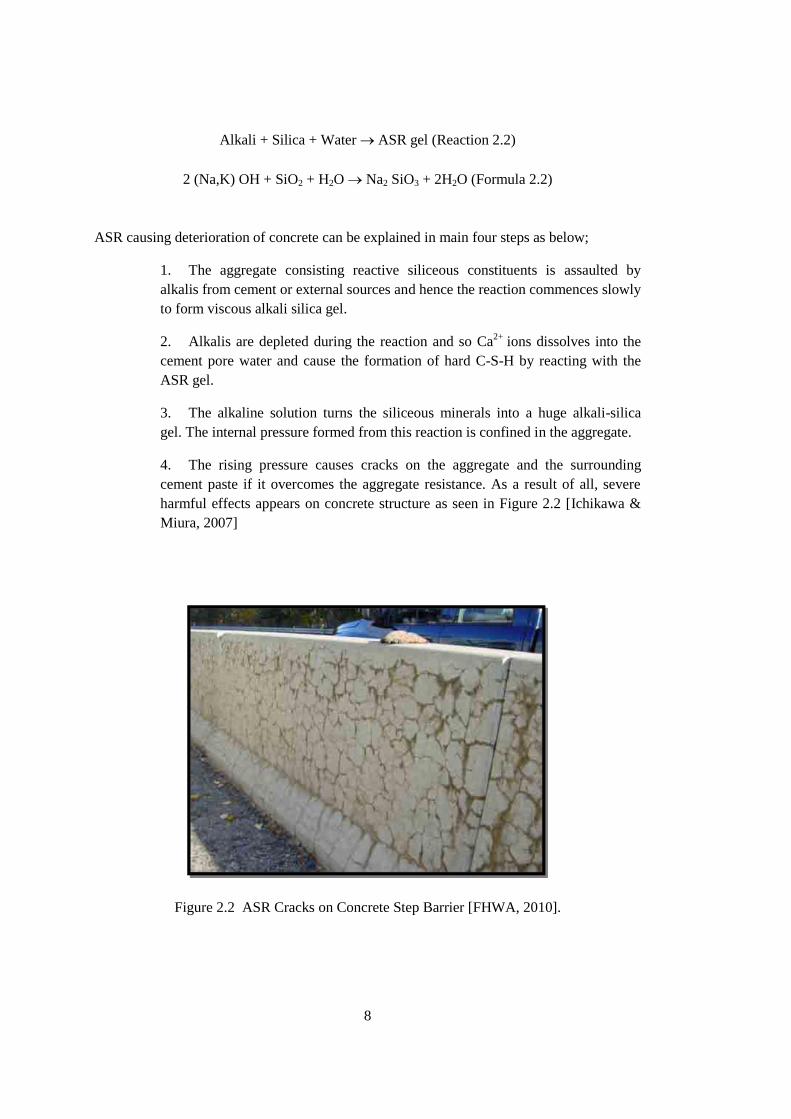
ASR causing deterioration of concrete can be explained in main four steps as below;
1. The aggregate consisting reactive siliceous constituents is assaulted by
alkalis from cement or external sources and hence the reaction commences slowly
to form viscous alkali silica gel.
2. Alkalis are depleted during the reaction and so Ca2+
ions dissolves into the
cement pore water and cause the formation of hard C-S-H by reacting with the
ASR gel.
3. The alkaline solution turns the siliceous minerals into a huge alkali-silica
gel. The internal pressure formed from this reaction is confined in the aggregate.
4. The rising pressure causes cracks on the aggregate and the surrounding
cement paste if it overcomes the aggregate resistance. As a result of all, severe
harmful effects appears on concrete structure as seen in Figure 2.2 [Ichikawa &
Miura, 2007]
Figure 2.2 ASR Cracks on Concrete Step Barrier [FHWA, 2010].

9
Many investigations have been made about the mechanism of ASR expansion and many
theories have come out until now but ASR expansion is not able to be proved clearly.
Hansen (1944) explained the ASR expansion by his osmotic theory that the cement paste
environs the reactive particles and acts as a semi-permeable cover. Water or pore solution are
able to pass the cover unlike huge and combined silicate ions and thus a new osmotic
pressure cell occurs. After that, the hydrostatic pressure giving rise to cracking on the mortar
appears on the cement paste [Musaoğlu, 2012].
2.4 The Factors Affecting Alkali-Silica Reaction Expansion
Alkali-silica reaction is a very complex phenomenon so there are many factors affecting the
ASR expansion process. These factors are one by one as follows;
2.4.1 Nature of Reactive Silica
The crust of the earth is composed of silica in nearly 65% so it is not surprising that many
rock types include silica. While most rock types consist of different mineral component, pure
dolomites and limestone is not. However, only 2% reactive silica constituents in these rock
types may be the reason for ASR expansion and deterioration of concrete properties. The
potentials of some rock types for ASR expansion formation are seen in Figure 2.3. Reactive
silica groups can be examined as main three main heading which are crystalline, low density
polymorphs of silica and deformed forms of quartz. The major alkali-reactive forms of silica
types are examined as in Table 2.1 [Mehta & Monteiro, 1999; Blanks & Kennedy, 1955;
Swamy, 1992]
Figure 2.3 Effect of rock types on ASR expansion [Blanks & Kennedy, 1955]

10
Crystallinity and the silica‟s hydration state have an important role on the reactivity.
According to the results of much research, grain size, the fractured state of rock, and porosity
affects the ASR reactivity. Moreover, degree of deformation in rocks has directly affects on
alkali-silica reaction [Monteiro et al., 2001].
Table 2.1 Alkali-reactive silica types [Mehta & Monteiro, 1999; Mindess & Young, 1981]
Reactive
Material
Chemical
Composition
Physical
Character
Rock Types
Silica glass Alumina,
Siliceous
Amorphous Volcanic glasses and
tuffs; synthetic glass
Opal SiO2.nH2O Amorphous Shales, siliceous,
limestones, cherts, flints
Quartz in
certain forms
SiO2 -Microcrystalline to
cryto-crystalline-
Crystalline
Igneous and metamorphic
rocks, quartzite sands,
sandstones
Chalcedony SiO2 -Microcrystalline to
cryto-crystalline
Siliceous limestone and
sandstones, flints
Cristoballite,
tridymite
SiO2 Crystalline Fired ceramics, opaline
rocks
2.4.2 Amount of Reactive Material
Studies on alkali-silica reaction have revealed that more ASR expansion appears as relatively
large quantity reactive materials presents in the aggregate and also a certain content of
reactive aggregate called pessimum content causes the maximum expansion on concrete
structure. Pessimum content may alter based on the alkali content in cements. It can be
nearly % 5 in opal as seen in Figure 2.4 [Woods, 1968].
11
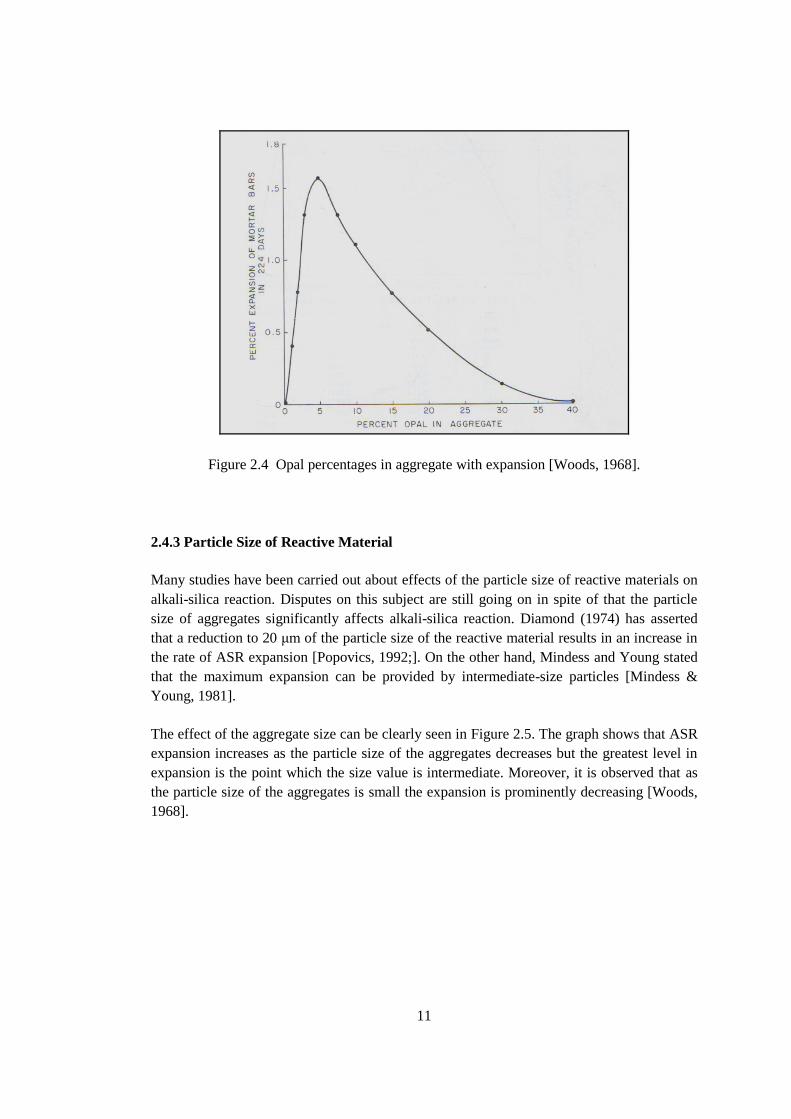
Figure 2.4 Opal percentages in aggregate with expansion [Woods, 1968].
2.4.3 Particle Size of Reactive Material
Many studies have been carried out about effects of the particle size of reactive materials on
alkali-silica reaction. Disputes on this subject are still going on in spite of that the particle
size of aggregates significantly affects alkali-silica reaction. Diamond (1974) has asserted
that a reduction to 20 μm of the particle size of the reactive material results in an increase in
the rate of ASR expansion [Popovics, 1992;]. On the other hand, Mindess and Young stated
that the maximum expansion can be provided by intermediate-size particles [Mindess &
Young, 1981].
The effect of the aggregate size can be clearly seen in Figure 2.5. The graph shows that ASR
expansion increases as the particle size of the aggregates decreases but the greatest level in
expansion is the point which the size value is intermediate. Moreover, it is observed that as
the particle size of the aggregates is small the expansion is prominently decreasing [Woods,
1968].

12
Figure 2.5 Effect of the size of reactive material on ASR expansion [Woods, 1968].
2.4.4 Alkali Content
Sodium and potassium which exist in the raw material of Portland cement in a small
proportion are the two common alkalis. The two main facts showing the alkali prone to alkali
silica reaction are the amount of cement and the alkali content in this cement. Alkalis are
present in Portland cement in 0.5-1.3 % ratio and generally on the surface of clinker grains
[Lea, 1970; Swamy, 1992].
Alkali content of Portland cement expressed as sodium equivalent (Na2Oe) is determined by
Formula 2.3 as follow;
Na2Oe = Na2O + 0.658K2O (Formula 2.3)
in where Na2O = sodium oxide content, in percent and
K2O = potassium oxide content, in percent.
13
The other source of alkalis can be supplementary cementing materials (e.g., fly ash, slag,
silica fume), aggregates, chemical admixtures, external sources (e.g., seawater and de-icing
salts), wash water (if used) [FHWA, 2003].
Batic and Sota demonstrated that some types of aggregates can give large amounts of alkali
to the pore solution based on the fineness and mineralogical content [Bitic & Sota, 1990].
Grattan-Bellew and Beaudoin pointed that the aggregate including mica and phlogopite
contribute alkalis to pore solution and so they enhance ASR expansion. Another triggering
material for ASR by releasing alkali is clay mineral illite which resembles phlogopite
structurally. Besides, some volcanic rocks from New Mexico, andesite from Japan can be
considered in the previous group mineral [Grattan-Bellew, 1994]. In addition, dawsonite
which is a scarce mineral mined in Montreal area may affect expansion in a like manner
[Gillot & Rogers 1994].
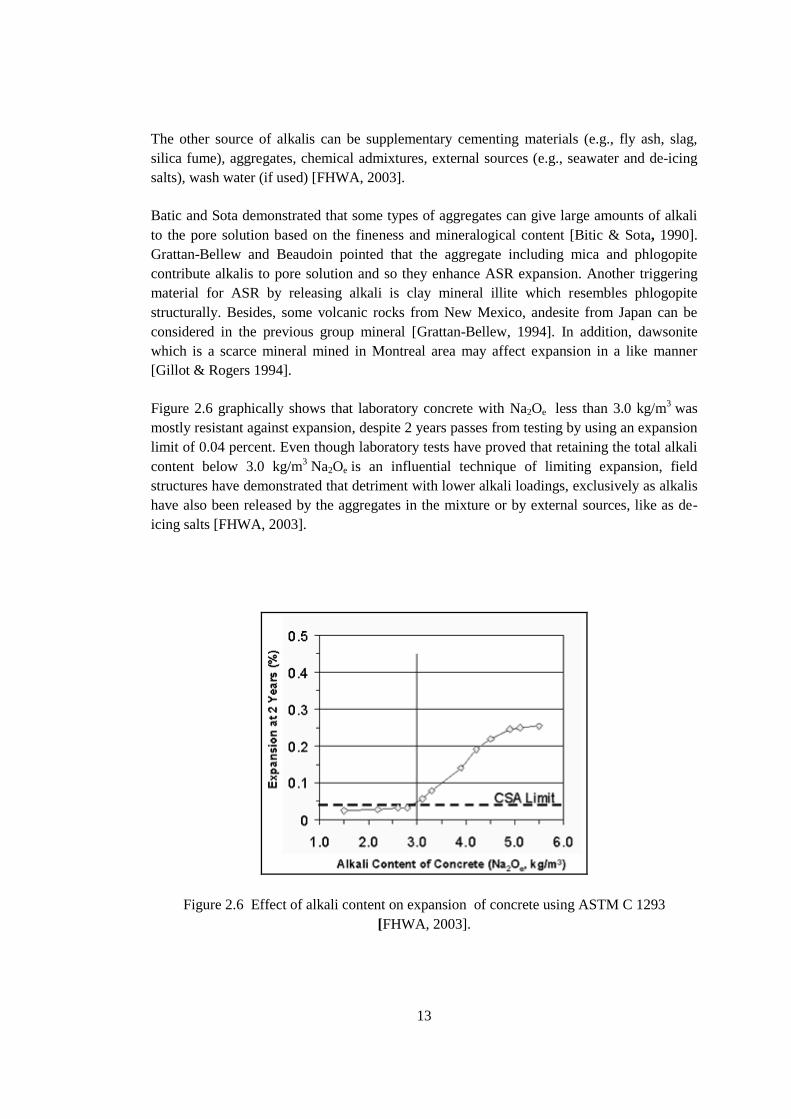
Figure 2.6 graphically shows that laboratory concrete with Na2Oe less than 3.0 kg/m3 was
mostly resistant against expansion, despite 2 years passes from testing by using an expansion
limit of 0.04 percent. Even though laboratory tests have proved that retaining the total alkali
content below 3.0 kg/m3 Na2Oe is an influential technique of limiting expansion, field
structures have demonstrated that detriment with lower alkali loadings, exclusively as alkalis
have also been released by the aggregates in the mixture or by external sources, like as de-
icing salts [FHWA, 2003].
Figure 2.6 Effect of alkali content on expansion of concrete using ASTM C 1293
[FHWA, 2003].

14
2.4.5 Moisture Effect
According to much research and studies, moisture is an important factor having an
important role on ASR that is a not only reaction occurring between alkali ions and
hydroxyl ions but also a reaction in which alkali silica gel expands with water and creates
internal pressure in concrete structure [Bektaş, 2002]. It is generally known that 80% RH is
the minimum ratio which is essential for the occurrence of ASR expansion [FHWA, 2003].
On the other hand, it is a general opinion that the ASR expansion may be inconsiderable if
RH is not greater than 75% [Jones & Poole, 1987]. As seen in Figure 2.7, data clearly
reveals the importance of moisture on expansion endorses the former justice. According to
the results carried out with 5 different reactive aggregates, that alkali-silica reaction
expansion is negligible if internal RH is less than 85 % (Figure 2.7) [Pedneault, 1996].
Figure 2.7 Effect of relative humidity on expansion using ASTM C 1293 [Pedneault, 1996].
2.4.6 Temperature Effect
Temperature has an effect on ASR as an accelerator as in most chemical reactions, but it
does not change the total expansion ratio. Gel can form with significantly reactive materials
like as opal in a short time in alkali solution. Likewise moisture, temperature speeds up the
alkali-silica reaction and also leads to an increase in water absorption of gel. Because of this,
high temperature causing increase of the solubility of silica triggers sudden reaction [Swamy,
1992].
Much research has been carried out about the effect of temperature on alkali-silica reaction.
Diamond, who made one of studies represented a study given as a graph in Figure 2.8 below.
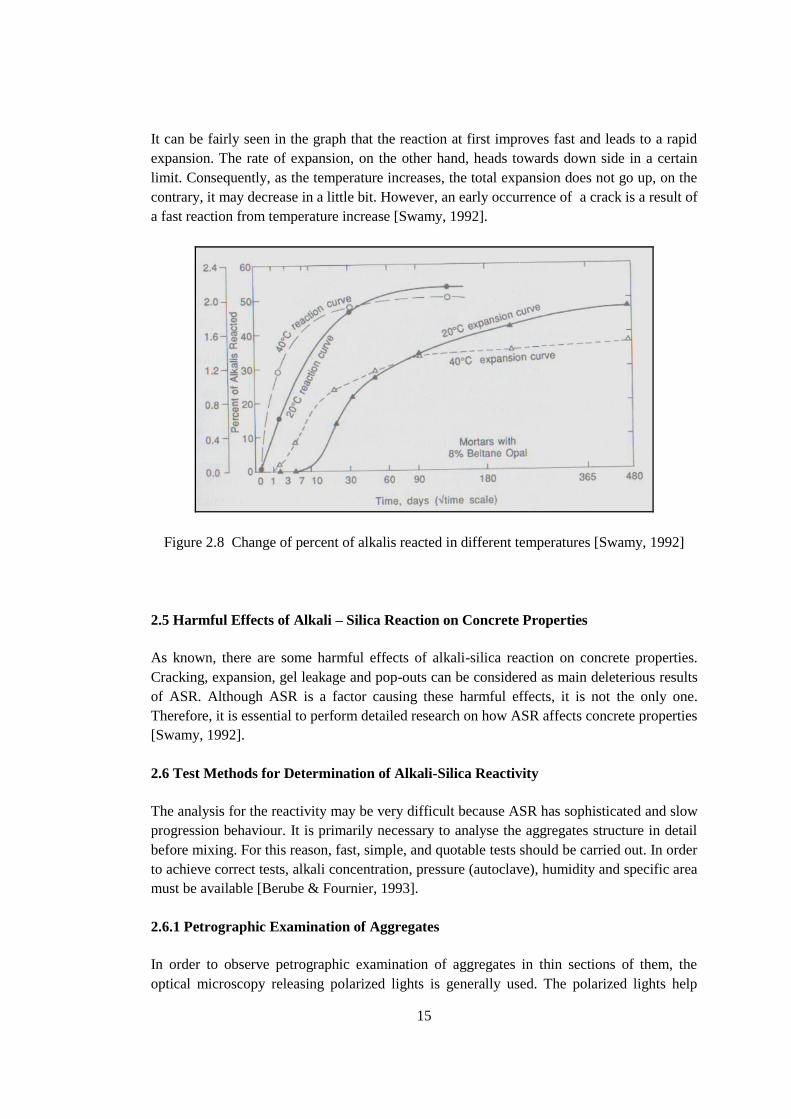
15
It can be fairly seen in the graph that the reaction at first improves fast and leads to a rapid
expansion. The rate of expansion, on the other hand, heads towards down side in a certain
limit. Consequently, as the temperature increases, the total expansion does not go up, on the
contrary, it may decrease in a little bit. However, an early occurrence of a crack is a result of
a fast reaction from temperature increase [Swamy, 1992].
Figure 2.8 Change of percent of alkalis reacted in different temperatures [Swamy, 1992]
2.5 Harmful Effects of Alkali – Silica Reaction on Concrete Properties
As known, there are some harmful effects of alkali-silica reaction on concrete properties.
Cracking, expansion, gel leakage and pop-outs can be considered as main deleterious results
of ASR. Although ASR is a factor causing these harmful effects, it is not the only one.
Therefore, it is essential to perform detailed research on how ASR affects concrete properties
[Swamy, 1992].
2.6 Test Methods for Determination of Alkali-Silica Reactivity
The analysis for the reactivity may be very difficult because ASR has sophisticated and slow
progression behaviour. It is primarily necessary to analyse the aggregates structure in detail
before mixing. For this reason, fast, simple, and quotable tests should be carried out. In order
to achieve correct tests, alkali concentration, pressure (autoclave), humidity and specific area
must be available [Berube & Fournier, 1993].
2.6.1 Petrographic Examination of Aggregates
In order to observe petrographic examination of aggregates in thin sections of them, the
optical microscopy releasing polarized lights is generally used. The polarized lights help
16
detecting the deleterious reactive components. Some of another supplementary way for
petrographic examination is x-ray diffraction, scanning electron microscopy, or spectroscopy
[Swamy, 1992; Berube & Fournier, 1993]
2.6.2 Chemical Methods Applied to Aggregates
ASTM C289 Chemical Method is widely spread to detect the potential reactivity of silica
in aggregates. As for the procedure of the test, the size of aggregates is disintegrated to 150-
300 μm particles and the aggregate is submerged in a 1N NaOH solution for 24 hours. This
solution is filtrated and analyzed to determine dissolved (Sc) and reduction in alkalinity (Rc)
[Berube & Fournier, 1993]
Dissolution Test (Germany) has been put forward to analyse the alkali-silica potential of
aggregates consisting of opal and flint. The particles including specified grain sizes (1-2 and
2-4 mm) are submerged in a 1N NaOH solution for 1 hour. After that process, the aggregates
are washed, dried and lastly weighed. In view of the loss in mass, named as soluble to
alkalis, the potential reactivity can be determined [Berube & Fournier, 1992].
Osmotic Cell Test (USA) is a method carried out by a special apparatus, named as osmotic
cell. This apparatus consisting two wells (reservoir and reaction wells) which are both full
with 1N NaOH. A cement paste cover separates the wells. As the reaction happens, the 1N
NaOH solution flows from the reservoir well towards the reaction well. This process is
named as positive flow and it happens by the cement paste cover. The height disjoint in the
vertical capillary tubes fastened to the top of each chamber [Berube & Fournier, 1992].
Gel Pat Test (UK) is introduced by Stanton et al.. In this test, gel formation in a dense
alkaline solution is observed to examine the potential alkali-silica reactivity of concrete
aggregates [Berube & Fournier, 1992].
Chemical Shrinkage Method (Denmark) is a quick chemical test method designed by
Knudsen. In this test, reactive sand is exposed to a chemical shrinkage which is a kind of
volume decrement when its silica dissolves [Berube & Fournier, 1992]
2.6.3 Mortar Bar Methods
ASTM C227 Mortar Bar Method is carried out with mortar bars, 25x25x285 mm
dimension. In this test method, the aggregates are examined by using cement containing high
alkali content. The samples moulded in mortar bars are kept in sealed containers with wicks
and over water at 38 0C and 100% RH. The length of the samples is measured in a certain
period. Expansion limit for 3 months is suggested as 0.05%, as for 3 months, it is 0.10%. In
spite of these periods, Grattan-Bellew claims that the measurement should be at 6 and 12
months. [Swamy, 1992; Berube & Fournier, 1993]
CCA Mortar Bar Method is a method offered by the Cement and Concrete Association, in
the UK. 3 bars with 25x25x250 mm dimensions are used in this method. The mix design of
17
samples consists of 3 unit aggregate, 1 unit cement having 1.0% Na2Oe (alkali ) content and
water in accordance with 0.4 water cement ratio [Berube & Fournier, 1992].
Accelerated Mortar Bar Method has recently been most popular because the result can be
taken soundly and quickly. Accelerated mortar bar method is performed in almost same
technique in many countries. Some standards of this method in different countries can be
considered as ASTM C1260, Canadian CSA A23.2-25A, Australian RTA T363, and RILEM
A-TC 106-2. In this test method, the mortar bars are stored in 1N NaOH solution at 80 0C
and expansion is calculated by observing 2-weeks length change. The expansion limits in the
standards differs from each other but aggregates causing expansion below 0.10% are
regarded as harmless [Bektaş, 2002].
Duncan Method is a method in which four mortar bars in size 25*25*285 mm like ASTM
C227 bars are stored over water 64 0C and 100% RH. As distinct from ASTM C227 mortar
bar method, temperature increases and serves an accelerator in the reaction. Moreover, the
expansion limit is 0.05% at 16 weeks in this test [Swamy, 1992]
Danish Salt Method is performed by using mortar bars, 40x40x160 mm dimension, and
mixing the materials in 3 unit aggregate, 1 unit cement and water in accordance with 0.5
water cement ratio. The samples are cured in water for 28 days and then a saturated NaCl
solution is added to water by retaining the solution at 50 0C. The length change is measured
every week until 20 weeks and 0.10 % expansion is a limit showing whether the aggregates
are harmless [Berube & Fournier, 1992].
2.6.4. Autoclave Methods
Japanese Rapid Test is a method introduced by Nishibayashi et al. In this method, mortars
bars with 40x40x160 mm dimensions and a mixing consisting of cement and water in 0.45
(w/c) ratio and aggregate twice as cement by weight. Moreover, in order to reach 2% Na2Oe ,
NaOH is added to the mixing. The samples are stored at 20 0C and 100% RH for 24 hours
and then they are exposed to 0.15 MPa in autoclave for 4-5 hours. There is no expansion
limit in this test [Berube & Fournier, 1992].
Chinese Autoclave Test is a short term test method introduced by Tang et al and it takes
only two days. In this test method, mortar bars, 10x10x40 mm in size, are used for
performing the test. Specified quantities of cement, aggregate and water are mixed and
NaOH for ensuring 1.5% alkali content is added. The bars are exposed to curing at 20 0C and
100 % RH for 24 hours and steam for hours. After these water and steam curing, the bars are
submerged in 10% KOH solution for 6 hours in autoclave at high temperature, 150 0C, .
Expansion ratio for considering that aggregates are reactive and naturally harmless may be
0.10-0.15% [Berube & Fournier, 1992].
Canadian Autoclave Test is a method proposed by Fournier et al.. The test is carried out
with mortar bars, 25x25x285 mm in size, same as ASTM C227 mortar bars. In this test,
water-cement ratio is 0.50 and the target alkali content ratio provided by adding NaOH to
18
mix water is 3.5% Na2Oe.. The samples are exposed to 0.17 MPa in autoclave for 5 hours.
Expansion in excess of 0.15 % within 5 hours indicates the potentially reactive aggregates
[Berube & Fournier, 1992].
2.6.5. Concrete Prism Methods
Canadian CSA-A23.2-14A is a long term test method which is carried out on concrete
prisms with minimum, 75x75x300 mm in size, and maximum, 120x120x450 mm in size.
The materials used for this test are non-reactive sand, and normal cement including 0.8-1.2%
alkalis. Alkali content is raised to 1.25% Na2Oe of the mass of cement by addition of NaOH
to the mix water. The samples are kept in a wet room at 23 0C, the another alternative is
keeping them over water in sealed container at 38 0C. Measurements are orderly taken for 1
year [Berube & Fournier, 1992; Berube & Fournier, 1993]. As for expansion limits,
aggregate is considered as non-reactive if expansion ratio is less than 0.04 %, aggregate is
considered as slightly reactive if expansion ratio is between 0.04 and 0.12 %, aggregate is
considered as highly reactive if expansion ratio is greater 0.12 % [FHWA,2003].
ASTM C1293 is a common test method performed on concrete prisms with dimensions
75x75x300 mm. The materials used for this test are aggregates, and normal cement including
1.0% alkalis. Alkali content is raised to 1.25% Na2Oe of the mass of cement by addition of
NaOH to the mix water. The concrete prisms are kept in sealed container at 38 0C for 1 year
likewise Canadian CSA test method is. The expansion limit accepted is 0.04 % at end of the
year.
As seen in Figure 2.9, the expansion ratio found by using the concrete prism tests determines
whether tested aggregates are reactive or not.

19
Figure 2.9 Expansion-age graph of the concrete samples including reactive aggregates
[Page & Page, 2007]
The other common concrete prism test methods are CCA Concrete Prism Method,
Accelerated Concrete Prism Method, South African Concrete Prism Method, RILEM B-TC
106-3, and CN Research‟s Concrete Method (Duggan Test) [Bektaş, 2002].
Briefly, Table 2.2 gives available standard test methods for evaluating ASR and comments
on them.
Table 2.2 Available standard tests for evaluating ASR [FHWA, 2003].
Test Method Comments
ASTM C 227: Standard Test Method for
Potential Alkali Reactivity of Cement-
Aggregate Combinations
(Mortar Bar Method)
Used for examining cement-aggregate
combinations.
Specimens kept in containers at high-
humidity and 380C .
Significant leaching of alkalis can be
seen as a problem related to test

20
Table 2.2 (continued)
ASTM C 289: Standard Test Method for
Potential Alkali-Silica Reactivity of
Aggregates
(Chemical Method)
Crushed aggregate is investigated in
views of dissolved silica and alkalinity
after exposed to 1 molar NaOH
solution for 1 day
Reliability is not good
Some problems about test as follow:
Dissolution of silica can be
affected by other phases occur in
aggregate.
Some reactive phases might be
disappeared during process of
pre-testing.
ASTM C 295: Standard Guide for
Petrographic Examination of Aggregates
for Concrete
Used for determining many potentially
reactive constituents of aggregates.
Individual skill and experience of
petrographer directly affect reliability
of test.
Unlike ASTM C 1260 and/or ASTM C
1293, results from test are not used for
only accepting or rejecting aggregate
ASTM C 856: Practice for Petrographic
Analysis of Hardened Concrete
Useful for analyzing concrete in views
of reactive aggregates.
Individual skill and experience of
petrographer directly affect reliability
of test.

21
Table 2.2 (continued)
ASTM C 1260: Standard Test Method for
Potential Alkali Reactivity of Aggregates
(Mortar Bar Method)
Recommended Test
Mortar bar test used to evaluate
reactivity of aggregate.
Bars are immersed in 1 molar NaOH
solution at 80 0C for 2- weeks.
Aggregates causing expansion less
than 0.10% are described as harmless.
However, if both ASTM C 1260 and
ASTM C 1293 are applied for
evaluating reactivity of aggregate,
results obtained by ASTM C 1293 are
available.
ASTM C 1293: Standard Test Method for
Concrete Aggregates by Determination of
Length Change of Concrete Due to Alkali-
Silica Reaction
Recommended Test
Concrete prism test are generally seen
as best indicator for determining
reactivity of aggregate
Prisms are stored in nearly at 100 %
RH and 38 0C
Aggregates and normal cement
including 1.0 % alkalis are used.
Alkali content is raised to 1.25%
Na2Oe of the mass of cement by
addition of NaOH to the mix water.
Although test is considerably accepted,
test period taking long time is an
important problem with test.
In addition to all these test methods, there is a draft method applied in this thesis work called
RILEM TC 219-ACS (Detection of potential alkali-reactivity - accelerated method for
testing aggregate combinations using concrete prisms). In this test method, casting concrete
prisms of lengths 250±50 mm and cross-section 75±5 mm are filled with the aggregate
combination, specified water cement ratio and are kept in hot at 60 0C, 100% RH for 20
weeks to trigger any alkali-silica reaction. Measurements are periodically observed to
examine the expansion of concrete prisms. Portland cement having high alkali content is

22
used in order to trigger potential of alkali-silica reactivity and also NaOH may be added to
the mix if necessary
2.7 Prevention of Alkali-Silica Reaction Effects
There are three common essential components for formation of ASR expansion causing
damage in concrete structures. As seen in Figure 2.12, these essential components are
respectively reactive silica form aggregates, sufficient alkalis (generally from Portland
cement but may be from external resources) and lastly sufficient moisture. Trying to
decrease these components means precluding harmless effects of ASR [FHWA, 2003].
Figure 2.10 Essential components for ASR-induced damage in concrete [FHWA, 2003].
As mentioned above, the common concept is to diminish any one of the essential
components for ASR-Induced damage in concrete structures. It is widely accepted that there
are five measures to achieve this goal as follow; (1) avoidance of reactive aggregate; (2)
avoidance of cement consisting of high alkali; (3) avoidance of usable moisture as much as
possible; (4) addition of mineral admixture to concrete mix; and lastly (5) addition of
chemical additive to concrete mix [Bektaş, 2002]. These preventive measures are explained
as below.
2.7.1 Avoidance of Reactive Aggregate
Although the use of non-reactive aggregate seems like a logical and economical way to
prevent the harmless effects of ASR, it is not so. To analyse the reactivity of the aggregate,
Petrographic Examination, Quick Chemical Test, and Mortar Bar Test methods can be
carried out. However, ASR expansion is based on many different parameters so it is almost
23
impossible to see whether the test results gets along well with field results in views of the
reactivity of the aggregates [Swamy, 1994]. Addition of 25-30% limestone or other non-
reactive aggregate to concrete mix may be useful for eliminating ASR-induced damages if
the aggregate used in concrete does not have reactive constituents [Mehta & Monteiro, 1999]
2.7.2 Avoidance of Cement Consisting of High Alkali
The use of cement consisting of low alkali content which should be less than 0.6% Na2Oe is
considered as a preventive measure against deleterious expansion from ASR. On the other
hand, it does not mean that the avoidance of higher alkali content cement inhibits ASR
expansion because of alkalis from external resources which can find opportunity to reacts
with silica ions [Grattan-Bellew, 1994]. Therefore, the total alkali content in concrete from
cement and other resources should not exceed the maximum limit which is nearly 3.0 kg/m3.
[Mehta & Monteiro, 1999; Neville, 2000]. On the other hand, this limit for total alkali
content is not valid for all circumstances and may change from 3.0 to 1.7 kg/m3 depending
on usage aim of the concrete to alleviate deleterious effects of ASR expansion [Fournier et
al., 1999]
2.7.3 Avoidance of Usable Moisture
Although avoidance of usable moisture and retaining internal relative humidity of ambient at
which the concrete structure deploy during its service life are acceptable as preventive
measures for ASR-induced damages, providing it seems so hard if necessary to be realistic
[Mather, 1999]
2.7.4 Addition of Mineral Admixture to Concrete
Mineral admixtures are effectively avail to alleviate ASR-induced damages on concrete
structure. The prominent of mineral admixtures are counted as fly ash, silica fume,
granulated blast furnace slag, volcanic glass, calcined clay, rice husk ash, and natural
pozzolans. Many laboratory studies have been done to examine the role of pozzolanic
materials to prevent ASR-induced damages. As result of these studies, positive effects on
inhibiting deleterious expansion from ASR have been proved. Moreover, long-term effects
of these mineral admixtures have been analysed by field studies and the results have been
found as positive. For example, Lower Notch dam, in Canada, built with argillite, an
aggregate type having high reactivity and 20 % fly ash has been observed for more than 20
years in views of ASR expansion and no deleterious expansion has been seen. Likewise,
some dams in Britain are good indicator for positive effects of supplementary cementing
materials on preventing ASR-induced damage. These dams built with reactive aggregates
and supplementary cementing materials have still remained in very good condition for more
than 70 years [Thomas, 1996; Duschesne & Berube, 2001]. The reasons why mineral
admixtures have an important role on preventing deleterious expansion from ASR are
reduction of the total alkali content of concrete by using mineral admixtures in place of
cement and refinement of pore structure triggering reduction of ionic mobility and water
permeability [Swamy, 1992; Beleszynski & Thomas, 1998]. As can be seen in Figure 2.13,
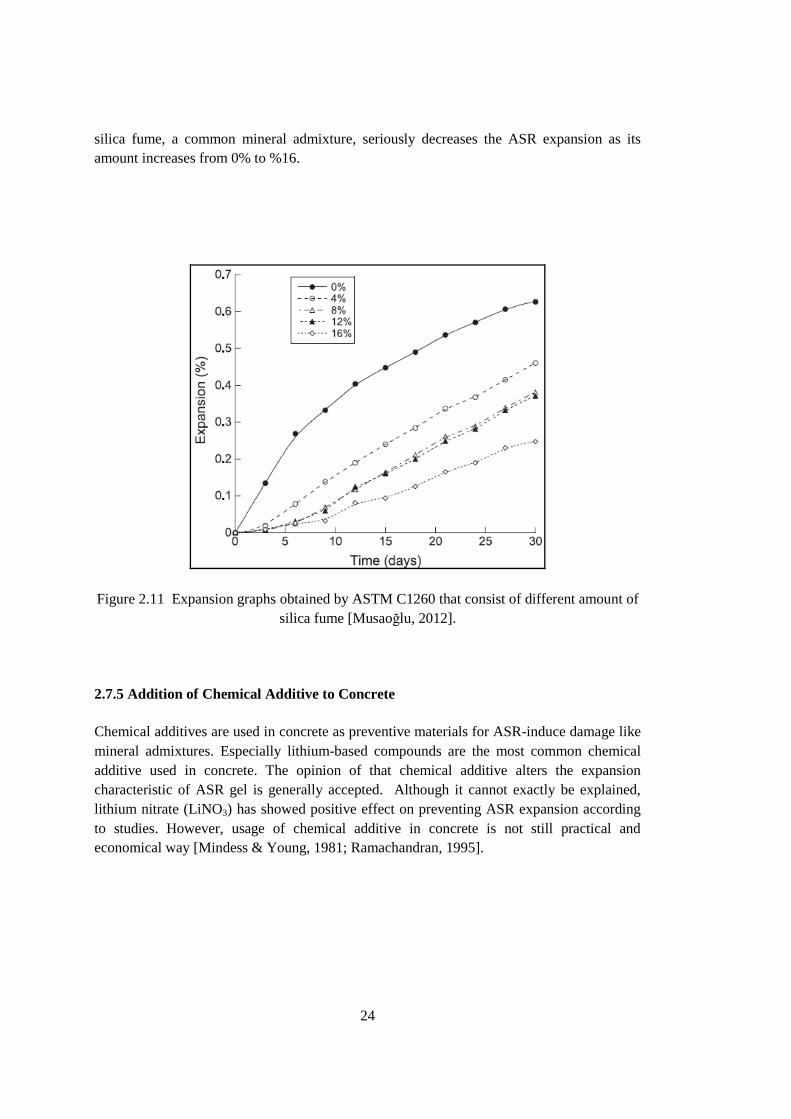
24
silica fume, a common mineral admixture, seriously decreases the ASR expansion as its
amount increases from 0% to %16.
Figure 2.11 Expansion graphs obtained by ASTM C1260 that consist of different amount of
silica fume [Musaoğlu, 2012].
2.7.5 Addition of Chemical Additive to Concrete
Chemical additives are used in concrete as preventive materials for ASR-induce damage like
mineral admixtures. Especially lithium-based compounds are the most common chemical
additive used in concrete. The opinion of that chemical additive alters the expansion
characteristic of ASR gel is generally accepted. Although it cannot exactly be explained,
lithium nitrate (LiNO3) has showed positive effect on preventing ASR expansion according
to studies. However, usage of chemical additive in concrete is not still practical and
economical way [Mindess & Young, 1981; Ramachandran, 1995].

25
CHAPTER 3
3. REVIEW OF RESEARCH ON
EFFECT OF ALKALI-SILICA REACTION EXPANSION ON MECHANICAL
PROPERTIES OF CONCRETE
3.1 General
Many studies have been carried out on ASR effect on mechanical properties of concrete and
in these studies; different standards and test methods have been applied to determine it.
While the studies have focused on effect of ASR expansion on especially compressive
strength and tensile strength (flexural strength, direct tensile strength, and tensile splitting
strength) of concrete, another mechanical properties of concrete such as modulus of
elasticity, pulse velocity, water absorption, , young‟s modulus, dynamics behaviours were
analysed in views of effect of ASR expansion on them. Moreover, in some of these tests,
different types of specimens such as concrete prism, cylinder, and cube were used and how
the dimension of specimens affects the ASR expansion level was investigated.
3.2 Effect of Alkali-Silica Reaction Expansion on Compressive Strength of Concrete
In first test study, T. Ahmed et al. used Thames Valley sand (in Mix A), fused silica (in Mix
B) and slowly reactive aggregate (in Mix C) to investigate the effect of ASR expansion on
compressive strength of concrete. The specimens, 100x100x100 mm in size [BSEN 1290-3,
2000] were cast and cured with respect to BS 1881 Part 122 [BS, 1881]. After casting and
moulding, the cube specimens were cured for 28 days in water at 20 0C and then the
temperature was increased to 38 0C to accelerate alkali-silica reaction. In this temperature,
the specimens were stored at water tank until 12 months passed [Ahmed et al., 2003].After
28-days curing at 20 0C and storage at 38
0C for 12 months, the expansion ratios and
compressive strength are given in Table 3.1.
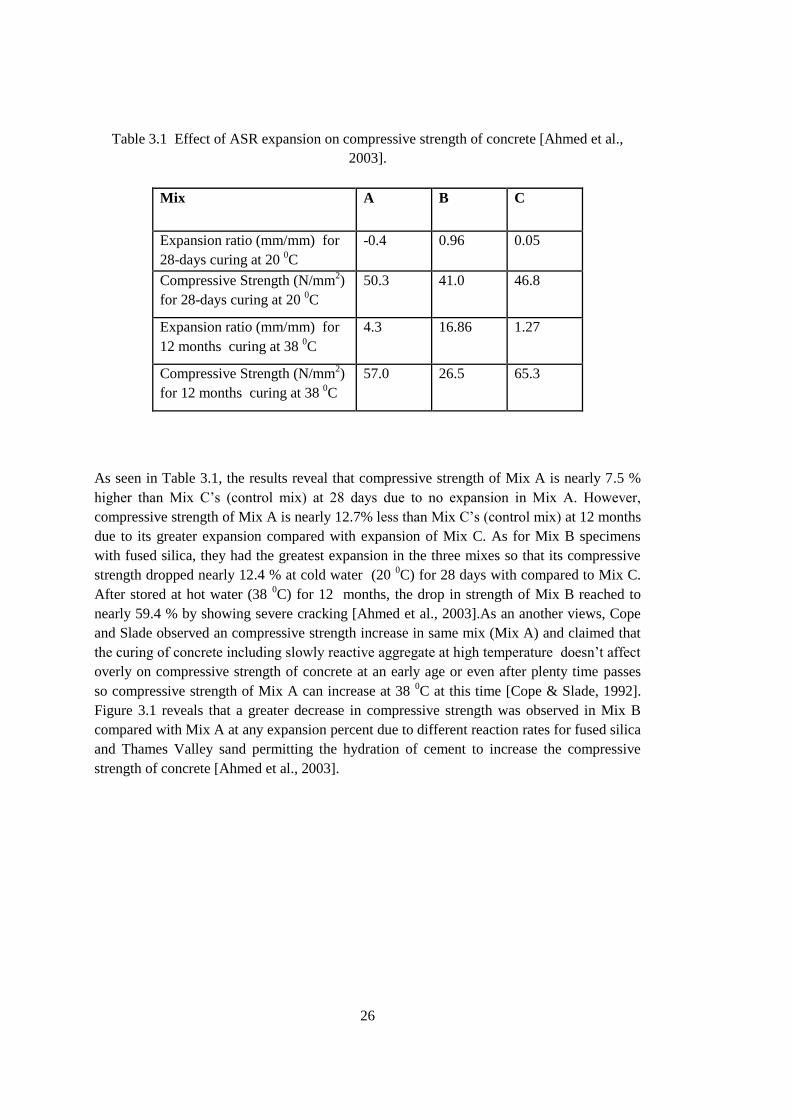
26
Table 3.1 Effect of ASR expansion on compressive strength of concrete [Ahmed et al.,
2003].
Mix A B C
Expansion ratio (mm/mm) for
28-days curing at 20 0C
-0.4 0.96 0.05
Compressive Strength (N/mm2)
for 28-days curing at 20 0C
50.3 41.0 46.8
Expansion ratio (mm/mm) for
12 months curing at 38 0C
4.3 16.86 1.27
Compressive Strength (N/mm2)
for 12 months curing at 38 0C
57.0 26.5 65.3
As seen in Table 3.1, the results reveal that compressive strength of Mix A is nearly 7.5 %
higher than Mix C‟s (control mix) at 28 days due to no expansion in Mix A. However,
compressive strength of Mix A is nearly 12.7% less than Mix C‟s (control mix) at 12 months
due to its greater expansion compared with expansion of Mix C. As for Mix B specimens
with fused silica, they had the greatest expansion in the three mixes so that its compressive
strength dropped nearly 12.4 % at cold water (20 0C) for 28 days with compared to Mix C.
After stored at hot water (38 0C) for 12 months, the drop in strength of Mix B reached to
nearly 59.4 % by showing severe cracking [Ahmed et al., 2003].As an another views, Cope
and Slade observed an compressive strength increase in same mix (Mix A) and claimed that
the curing of concrete including slowly reactive aggregate at high temperature doesn‟t affect
overly on compressive strength of concrete at an early age or even after plenty time passes
so compressive strength of Mix A can increase at 38 0C at this time [Cope & Slade, 1992].
Figure 3.1 reveals that a greater decrease in compressive strength was observed in Mix B
compared with Mix A at any expansion percent due to different reaction rates for fused silica
and Thames Valley sand permitting the hydration of cement to increase the compressive
strength of concrete [Ahmed et al., 2003].
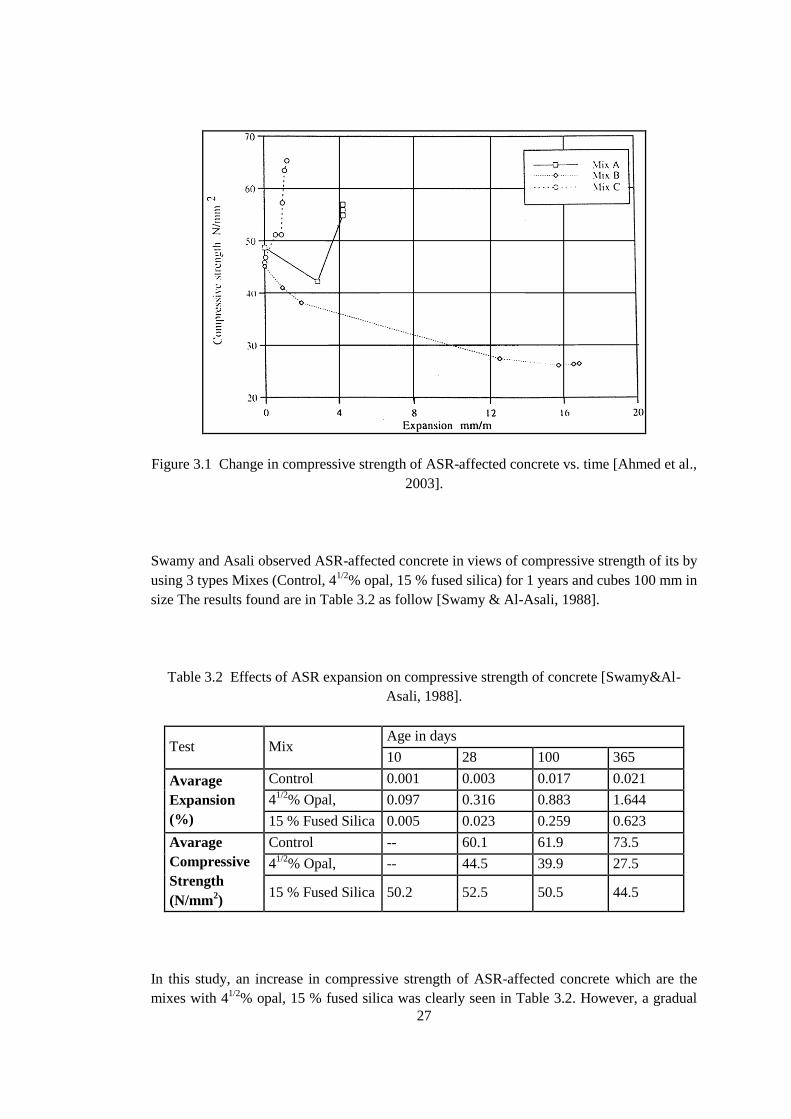
27
Figure 3.1 Change in compressive strength of ASR-affected concrete vs. time [Ahmed et al.,
2003].
Swamy and Asali observed ASR-affected concrete in views of compressive strength of its by
using 3 types Mixes (Control, 41/2
% opal, 15 % fused silica) for 1 years and cubes 100 mm in
size The results found are in Table 3.2 as follow [Swamy & Al-Asali, 1988].
Table 3.2 Effects of ASR expansion on compressive strength of concrete [Swamy&Al-
Asali, 1988].
Test Mix Age in days
10 28 100 365
Avarage
Expansion
(%)
Control 0.001 0.003 0.017 0.021
41/2
% Opal, 0.097 0.316 0.883 1.644
15 % Fused Silica 0.005 0.023 0.259 0.623
Avarage
Compressive
Strength
(N/mm2)
Control -- 60.1 61.9 73.5
41/2
% Opal, -- 44.5 39.9 27.5
15 % Fused Silica 50.2 52.5 50.5 44.5
In this study, an increase in compressive strength of ASR-affected concrete which are the
mixes with 41/2
% opal, 15 % fused silica was clearly seen in Table 3.2. However, a gradual

28
decline in strength appeared in opal concrete after 10 days and fused silica at about 2 months
in accordance with the difference in their expansion ratios that can be seen in the Figure 3.2.
In the following days, the sharp drop in strength of ASR-affected concrete decreased slowly
and return to normal manner nearly at 7 months for opal concrete and at 8 months for fused
silica concrete since hydration of cement went on. As it can be seen in Table 3.2, the
compressive strength of opal concrete was 54% less than that of control concrete for 28 days.
This loss reached to 63% at 1 year compared with the strength of control concrete. On the
other hand, the loss in strength of fused silica concrete was nearly 26% at 28 days and 39%
at 1 year as comparing it with that of control concrete [Swamy & Al-Asali, 1988].
Figure 3.2 Expansion of control and ASR-affected concrete at 20 0C and 96% RH for 1 year.
[Swamy & Al-Asali, 1988].
In Figure 3.3 and Table 3.3, the rate of loss in compressive strength of control concrete and
ASR-affected concrete was shown. The changes in the rate of progression of early strength
of these concretes represent that the reactivity level initially and the time necessary for
causing the deleterious expansion are essential for permitting concrete to advance its early
hydration substantially interfered and to flower before perceptible effects of expansion
occur. Therefore, reaction process of the reactive aggregate is a crucial factor for controlling
and inhibiting the effects of hydration of cement, and the reaction processes in different rates
permit the strength development of opal and fused silica concrete at different rates as seen in
Table 3.3 showing fairly by considering the former data that the drop of compressive
strength of ASR-affected concretes becomes more clear with expansion and is designated
with the rate and level of harmless reactivity [Swamy & Al-Asali, 1988].

29
In another Swamy and Al-Asali‟s study on the same topic, they found that the loss
percentage in the compressive strength of the concrete including 5.2 kg/m3
equivalent
sodium oxide was 12% at 0.1% expansion [Swamy & Al-Asali, 1986].
Figure 3.3 Compressive strength with ASR expansion [Swamy & Al-Asali, 1988].
Table 3.3 Loss of compressive strength of ASR-affected concrete with time [Swamy & Al-
Asali, 1988]

30
Smaoui et al. carried out a study with some mechanical tests on the same topic by separating
the specimens into 2 groups as Low-alkali concrete and High-alkali concrete. According to
the test results, when the alkali content increased, a significant loss in the compressive
strength of concrete appeared. As seen in Table 3.4, the sharp loss in compressive strength of
high-alkali concrete compared with low-alkali concrete‟s was initially shown at 3 days and
then the rate of decline in strength loss changed slightly until 180 days pass. Moreover, the
test results indicated that both of these concretes gained strength in 180-days test periods
since the concretes were stored in the curing room at 23 0C and 100% RH (Figure 3.4)
[Smaoui et al., 2005]
Table 3.4 Difference in compressive strength between low-alkali concrete and high-alkali
concrete [Smaoui et al., 2005]
Property Age in days Low-alkali
concrete
High-alkali
concrete
Difference
(%)
Compressive
Strength (MPa)
3 42.6 31.4 -26.3
7 43.6 34.9 -20.0
28 49.9 41.6 -16.6
90 57.4 46.8 -18.5
180 58.5 51.7 -11.6
Figure 3.4 Results of mechanical testing for compressive strength as a function of time
[Smaoui et al., 2005]

31
In another study with mechanical tests by Giaccio et al., the damaged concrete specimens
were tested as their linear expansion reached the level between 0.11 and 0.18%. As
considering tests after 28 days, a significant strength gain was able to be determined. On the
other hand, there was a different behaviour in concretes containing reactive aggregates that
cannot gain strength and additionally crucial drop in their elastic properties such as (modulus
of elasticity and Poisson‟s ratio).This study clearly show that ASR have an important effect
on the failure mechanism of concrete in compression [Giaccio et al., 2008].
Marzouk and Langdon in their experimental focused on effect of ASR expansion on normal
strength concrete and high strength concrete respectively as distinct from the others.
According to test results, maximum loss in compressive strength was noticed for the normal
strength concrete including the highly reactive aggregates. After exposed to NaOH solution
for 12 weeks, the concrete specimens lost strength by nearly 24% while they gain strength by
14% by exposing the specimens to the de-ionised water. As for the test results on high
strength concrete exposed to NaOH for 12 weeks, 3% increase in compressive strength was
observed in concrete including highly reactive aggregate but concrete including slowly
reactive aggregate shows 23% increase in strength. The two main reasons for this
phenomenon were stated by Marzouk and Langdon as the developed grain refinement and
decreased permeability causing the reduction in the mobility of aggressive agents [Marzouk
& Langdon, 2003].
As another view relating to effects of ASR expansion on compressive strength, like the
other, Jones and Clark concluded by their studies that the ASR expansion negatively affects
on the compressive strength of concrete. On the other hand, visible compressive strength is
seriously affected by restraint perpendicular to the direction of loading [Jones & Clark,
1998]. The strength of ASR-affected concrete can be found by using reduction factors given
by Doran [Doran, 1992]. It is more suitable to applying Doran factors to the strength of an
equivalent non-reactive concrete of the same age instead of concrete‟s 28 day strength [Jones
& Clark, 1998].
3.3 Effect of Alkali-Silica Reaction Expansion on Tensile Strength of Concrete
T. Ahmed et al. have carried out experimental studies on the effect of ASR on tensile
strength (flexural strength, tensile splitting strength, and direct tensile strength) of concrete
by separating concretes into groups that are Mix A with Thames Valley, Mix B with fuse
silica (highly reactive) and Mix C (control concrete).
3.3.1 Flexural Strength (i.e. Modulus of Rupture)
The results of Ahmed et al.‟s experimental studies are fairly given in Figure 3.5 for the
flexural strength. In their test which is performed in hot water, a very small drop in flexural
strength of mix A and naturally expansion and cracking in mix A concrete after 6 weeks
were observed by using the prismatic specimens, 100X100X500 mm in size [BSEN 12390-
5, 2000]. After 3 months in hot water, Thames Valley sand concrete, mix A showed a
significant decrease with an expansion that is 2.9 mm/m. As the expansion reached to 4.3
mm/m that occurred between 6 weeks and 6 months, a dramatic drop appeared in the flexural

32
strength of mix A stored in hot water. As for Mix B, fused silica concrete, the mix B
specimens exhibited a sharp drop in strength after 6 weeks at 15.73 mm/m expansion and the
drop went on until 6 months. The loss in mix B‟s strength reached to 6-months strength loss
in mix A within only 6 weeks. The decline of strength loss of both ASR-affected mixes
started after 6 months but mix A exhibit greater recovery than mix B in views of their
strength loss. These test results relating to the flexural strength processes of mix A, mix B
and control concrete are numerically given in Table 3.5 giving that the loss in flexural
strength is 48.8% for mix A, 86.0% for mix B within 1 year [Ahmed et al., 2003].
Figure 3.5 Variation in flexural strength (i.e. modulus of rupture) of control and ASR-
affected concrete with time [Ahmed et al., 2003].
Table 3.5 Tensile/compressive ratio and percentage loss in the mechanical properties of
ASR-affected concrete [Ahmed et al., 2003].

33
Swamy and Al-Asali performed some tests on the ASR effect in flexural strength of concrete
by using fused silica concrete and control concrete. The results of this study that continued
for 365 days are briefly in Table 3.6. According to test results, a sharp decrease firstly
appeared in fused silica concrete after 7 months while an increase in strength occurred in the
first days because of early hydration. As compared to control concrete, the loss percentage in
strength of ASR-affected concrete was 77 that was a dramatic value. As considering in the
same study of Swamy and Al-Asali on compressive strength, it can be easily understandable
that flexural strength is far more sensitive than compressive strength against ASR-damaged
effect since severe decreases were seen in flexural strength of fused concrete compared with
control concrete. The loss percentage in strength of fused silica with time is clearly explained
in Figure 3.6 and Table 3.9. [Swamy & Al-Asali, 1988].
Table 3.6 Effects of ASR expansion on tensile strength (flexural and splitting) of concretes
[Swamy & Al-Asali, 1988].
Test Mix Age in days
1 2 3 7 10 28 100 365
Expansion (%)
Control 0.0 0.0 0.0 0.0 0.001 0.003 0.017 0.021
15 % Fused
Silica 0.0 0.0 0.0 0.0 0.005 0.023 0.259 0.623
Flexural Strength
(MOR) (N/mm2)
Control 3.5 -- 4.2 4.9 -- 60.1 61.9 73.5
15 % Fused
Silica --- 3.8 -- -- 5.3 4.6 1.8 1.3
Splitting (Indirect)
Tensile Strength
(N/mm2)
Control 2.6 -- 3.2 3.6 -- 3.9 4.3 4.3
15 % Fused
Silica -- 2.8 -- -- 3.7 3.3 -- 1.8
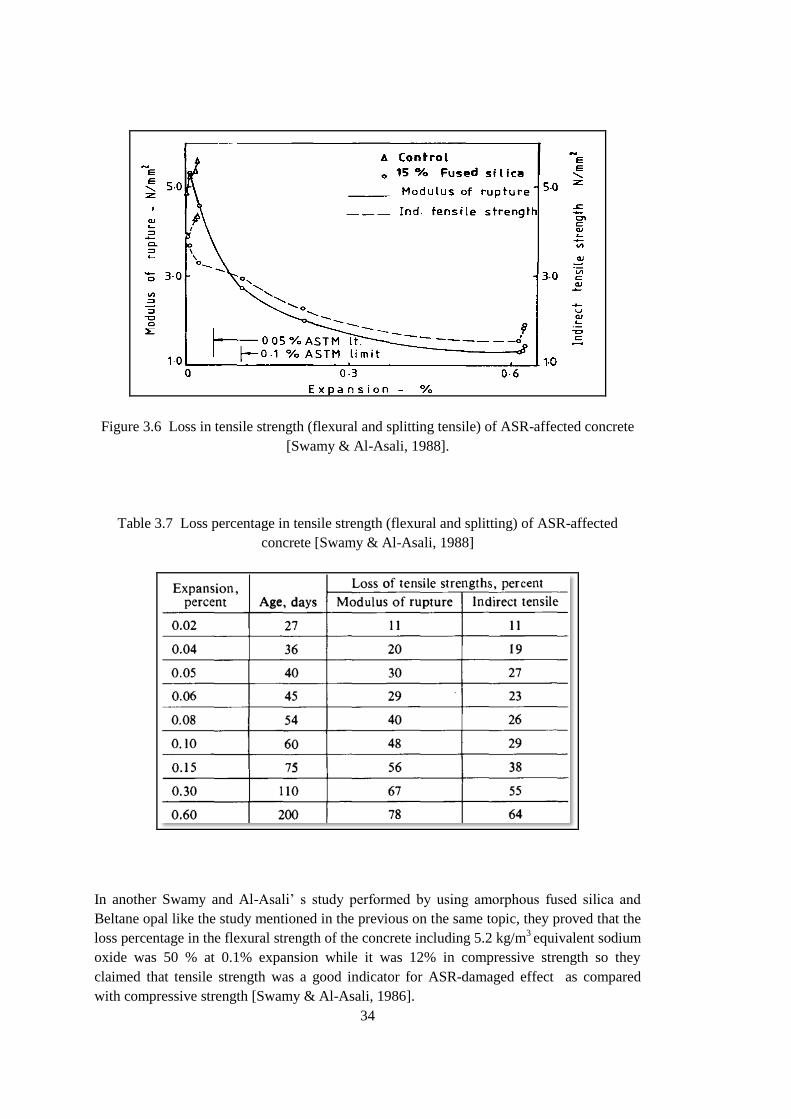
34
Figure 3.6 Loss in tensile strength (flexural and splitting tensile) of ASR-affected concrete
[Swamy & Al-Asali, 1988].
Table 3.7 Loss percentage in tensile strength (flexural and splitting) of ASR-affected
concrete [Swamy & Al-Asali, 1988]
In another Swamy and Al-Asali‟ s study performed by using amorphous fused silica and
Beltane opal like the study mentioned in the previous on the same topic, they proved that the
loss percentage in the flexural strength of the concrete including 5.2 kg/m3 equivalent sodium
oxide was 50 % at 0.1% expansion while it was 12% in compressive strength so they
claimed that tensile strength was a good indicator for ASR-damaged effect as compared
with compressive strength [Swamy & Al-Asali, 1986].
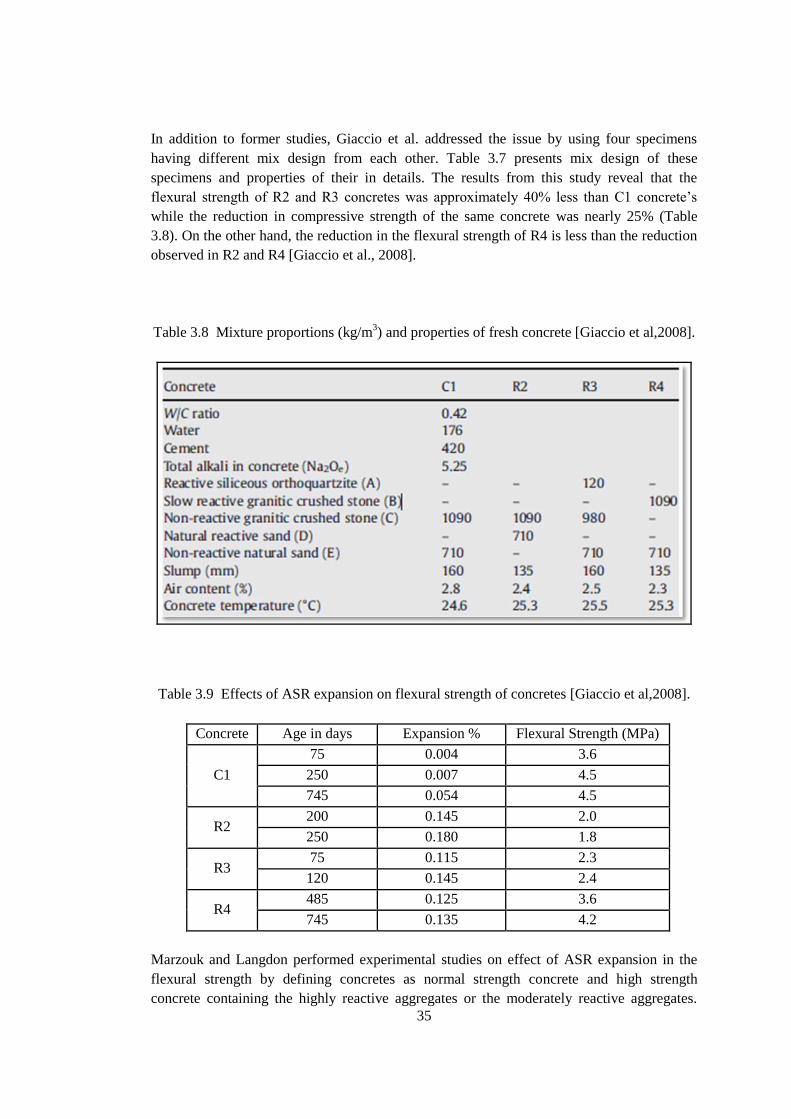
35
In addition to former studies, Giaccio et al. addressed the issue by using four specimens
having different mix design from each other. Table 3.7 presents mix design of these
specimens and properties of their in details. The results from this study reveal that the
flexural strength of R2 and R3 concretes was approximately 40% less than C1 concrete‟s
while the reduction in compressive strength of the same concrete was nearly 25% (Table
3.8). On the other hand, the reduction in the flexural strength of R4 is less than the reduction
observed in R2 and R4 [Giaccio et al., 2008].
Table 3.8 Mixture proportions (kg/m3) and properties of fresh concrete [Giaccio et al,2008].
Table 3.9 Effects of ASR expansion on flexural strength of concretes [Giaccio et al,2008].
Concrete Age in days Expansion % Flexural Strength (MPa)
C1
75 0.004 3.6
250 0.007 4.5
745 0.054 4.5
R2 200 0.145 2.0
250 0.180 1.8
R3 75 0.115 2.3
120 0.145 2.4
R4 485 0.125 3.6
745 0.135 4.2
Marzouk and Langdon performed experimental studies on effect of ASR expansion in the
flexural strength by defining concretes as normal strength concrete and high strength
concrete containing the highly reactive aggregates or the moderately reactive aggregates.

36
The tests carried out for normal concrete resulted in the same direction with other
researchers, who are like Swamy and Al-Asali [Swamy & Al-Asali, 1990; Swamy & Al-
Asali, 1995]. After exposed to NaOH solution for 12 weeks, the reduction in strength of the
specimens with the highly reactive aggregate was observed as nearly 9% if the final flexural
strength was compared with the initial strength after 28-day curing period. As for the
specimens with the moderately reactive aggregate, a similar manner appeared but all
specimens in the de-ionised water showed a small increase in the strength after 12 weeks. On
the other hand, an apparent increase in the flexural strength of all specimens in the same
condition with NaOH solution was shown from this study. The increase in the specimens
with the highly reactive aggregate was 10% and that in ones with the moderately reactive
aggregate was 21%. In the de-ionised water, the strength of all specimens orderly developed
because the high strength concrete has developed micro-structure and low permeability
inhibiting ASR-damaged effect [Marzouk & Langdon, 2003].
3.3.1 Tensile Splitting Strength
The results of Ahmed et al.‟s experimental studies performed by using by using the
cylindrical specimens, 100X100 mm in size [BSEN 1230-6, 2000] on the effect of ASR in
the tensile splitting strength of concrete are clearly given in Figure 3.9 and the splitting
strength tests for Thames Valley sand concrete, mix A, yielded results in the same direction
with flexural strength results carried out by Ahmed et al.‟s, yet the same manner was not
valid for strength of fused silica concrete, mix B. Although a drop in strength of Mix B in
first 6 weeks appeared, there was a marked increase in strength of Mix A. As seen in Table
3.5, the loss in tensile splitting strength is 33.6% for mix A, 60.0 % for mix B after 1 year
[Ahmed et al., 2003].
Swamy and Al-Asali carried out an experimental study on the ASR effect in tensile splitting
strength of concrete by using fused silica concrete and control concrete. The results of this
study that continued for 365 days are briefly in Table 3.6. According to test results, a marked
decrease firstly appeared in fused silica concrete after 7 months while an increase in strength
occurred in the first days due to early hydration. A severe decrease which is at 57%
compared with control concrete was observed in tensile splitting strength of ASR-affected
concrete .As considering in the same study of Swamy and Al-Asali on compressive strength,
like flexural strength, tensile splitting strength is far more sensitive than compressive
strength against ASR-damaged effect. The loss percentage in strength of fused silica with
time is clearly explained in Figure 3.6 and Table 3.6 [Swamy & Al-Asali, 1988].

37
Figure 3.7 Splitting tensile strength of ASR-affected and control concretes with time
[Ahmed et al, 2003].
Smaoui et al. performed a study with some mechanical tests on the same topic by separating
the specimens into 2 groups as Low-alkali concrete and High-alkali concrete. As seen in
Table 3.9 and Figure 3.8, a marked loss that varied from 5% to 16% within 180 days testing
period in splitting tensile strength of high-alkali concrete compared with low-alkali
concrete‟s was observed but it is noticeable point that the difference between both concrete
does not gradually increase with time [Smaoui et al., 2005]
Table 3.10 Difference in splitting tensile strength between low-alkali concrete and high-
alkali Concrete [Smaoui et al., 2005]
Property Age in
days
Low-alkali
concrete
High-alkali
concrete
Difference
(%)
Splitting Tensile
Strength (MPa)
3 2.3 2.8 -6
7 3.4 3.0 -10
28 4.6 3.8 -16
90 4.2 4.0 -5
180 4.9 4.2 -14
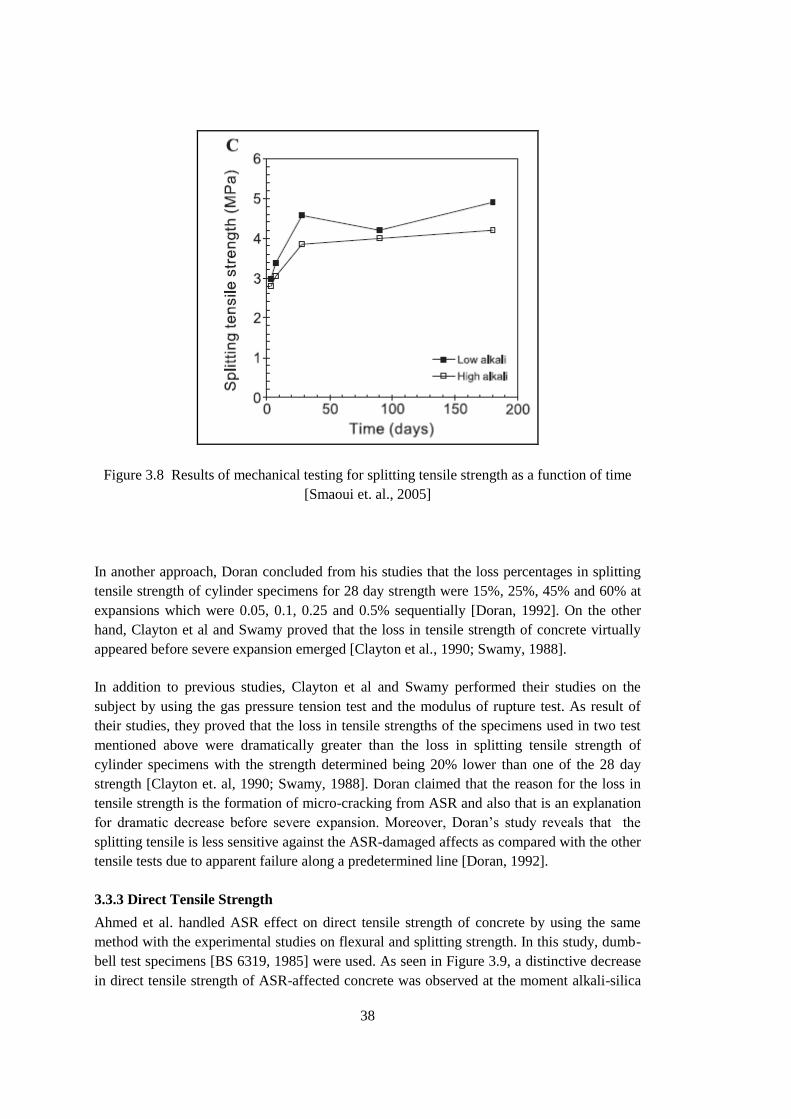
38
Figure 3.8 Results of mechanical testing for splitting tensile strength as a function of time
[Smaoui et. al., 2005]
In another approach, Doran concluded from his studies that the loss percentages in splitting
tensile strength of cylinder specimens for 28 day strength were 15%, 25%, 45% and 60% at
expansions which were 0.05, 0.1, 0.25 and 0.5% sequentially [Doran, 1992]. On the other
hand, Clayton et al and Swamy proved that the loss in tensile strength of concrete virtually
appeared before severe expansion emerged [Clayton et al., 1990; Swamy, 1988].
In addition to previous studies, Clayton et al and Swamy performed their studies on the
subject by using the gas pressure tension test and the modulus of rupture test. As result of
their studies, they proved that the loss in tensile strengths of the specimens used in two test
mentioned above were dramatically greater than the loss in splitting tensile strength of
cylinder specimens with the strength determined being 20% lower than one of the 28 day
strength [Clayton et. al, 1990; Swamy, 1988]. Doran claimed that the reason for the loss in
tensile strength is the formation of micro-cracking from ASR and also that is an explanation
for dramatic decrease before severe expansion. Moreover, Doran‟s study reveals that the
splitting tensile is less sensitive against the ASR-damaged affects as compared with the other
tensile tests due to apparent failure along a predetermined line [Doran, 1992].
3.3.3 Direct Tensile Strength
Ahmed et al. handled ASR effect on direct tensile strength of concrete by using the same
method with the experimental studies on flexural and splitting strength. In this study, dumb-
bell test specimens [BS 6319, 1985] were used. As seen in Figure 3.9, a distinctive decrease
in direct tensile strength of ASR-affected concrete was observed at the moment alkali-silica
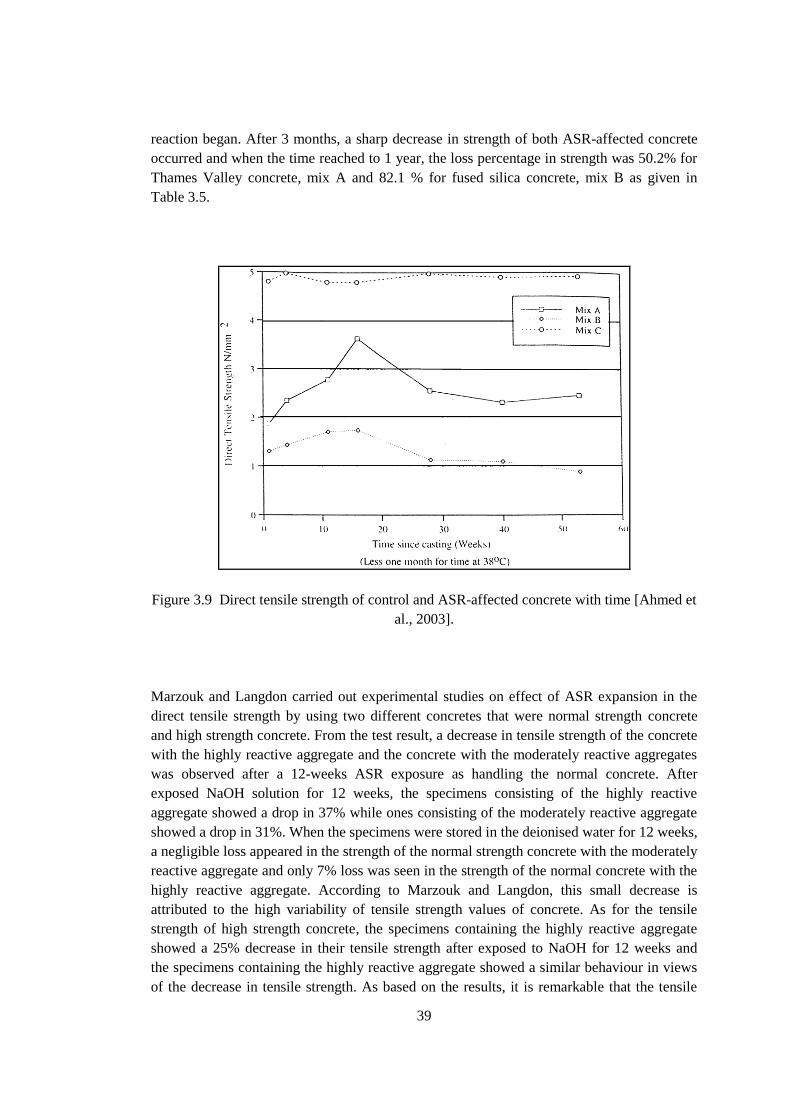
39
reaction began. After 3 months, a sharp decrease in strength of both ASR-affected concrete
occurred and when the time reached to 1 year, the loss percentage in strength was 50.2% for
Thames Valley concrete, mix A and 82.1 % for fused silica concrete, mix B as given in
Table 3.5.
Figure 3.9 Direct tensile strength of control and ASR-affected concrete with time [Ahmed et
al., 2003].
Marzouk and Langdon carried out experimental studies on effect of ASR expansion in the
direct tensile strength by using two different concretes that were normal strength concrete
and high strength concrete. From the test result, a decrease in tensile strength of the concrete
with the highly reactive aggregate and the concrete with the moderately reactive aggregates
was observed after a 12-weeks ASR exposure as handling the normal concrete. After
exposed NaOH solution for 12 weeks, the specimens consisting of the highly reactive
aggregate showed a drop in 37% while ones consisting of the moderately reactive aggregate
showed a drop in 31%. When the specimens were stored in the deionised water for 12 weeks,
a negligible loss appeared in the strength of the normal strength concrete with the moderately
reactive aggregate and only 7% loss was seen in the strength of the normal concrete with the
highly reactive aggregate. According to Marzouk and Langdon, this small decrease is
attributed to the high variability of tensile strength values of concrete. As for the tensile
strength of high strength concrete, the specimens containing the highly reactive aggregate
showed a 25% decrease in their tensile strength after exposed to NaOH for 12 weeks and
the specimens containing the highly reactive aggregate showed a similar behaviour in views
of the decrease in tensile strength. As based on the results, it is remarkable that the tensile

40
strength of all specimens gradually increased in the de-ionised water. Marzouk and Langdon
leaned this increase on the maturity and developed micro-structure of high strength concrete
[Marzouk & Langdon, 2003].
The sentence thinkable as a summary for this topic was told by Doran who proved from his
experimental study that the direct tensile strength is negatively affected from ASR and might
even be almost zero as exposing to long term loads [Doran, 1992].
3.4 Effect of Alkali-Silica Reaction Expansion on Modulus Elasticity of Concrete
As a first approach ,T. Ahmed et al. carried out an experimental investigation to determine
the effect of ASR expansion on the static modulus of elasticity of concrete by using Thames
Valley sand (in mix A), fused silica (in mix B) and slowly reactive aggregate (in mix C) .
After casting and moulding The specimens, 150X300 mm in size [BS 1881, 1983] were
cured for 28 days in water at 20 0C and then the temperature was increased to 38
0C to
accelerate alkali-silica reaction. The results of this study are given in Figure 3.10 and Table
3.5. Although they showed an initial increase, the modulus of elasticity of mix A decreased
with time. However, mix B didn‟t show the same behaviour with mix A in view of the initial
increase, the trend of the curve of modulus of elasticity of mix A continuously went in the
direction of the reduction. As for mix c, a gradual increase in its modulus of elasticity was
observed at varying rates until 1 year (Table 3.10 and Figure 3.11). After that a sharp
decrease was observed in the modulus of elasticity of mix B at expansion coming 2 mm/mm,
a continuous decrease at varying rates appeared until the tests finished. As for mix a, unlike
mix B, a sharp decrease was not shown in a short time even in 3 months a significant change
in elasticity was not determined. After 6 months, elasticity commenced to show a
considerable drop. It was an interesting result that the drop in elasticity continued in up to the
end of test even though there was no expansion between 6 months and 12 months [Ahmed et
al., 2003].

41
Figure 3.10 Variation in static modulus of elasticity (SME) with time [Ahmed et al., 2003].
Table 3.11 Effects of ASR expansion on static modulus of elasticity (SME) [Ahmed et al.,
2003].
Test
Mix
Age
Time at 20 0 C Time in hot water at 38
0 C
7
days
28
days
7
weeks
3
months
6
months
9
months
12
months
Cylinder
expansion
(mm/mm)
(Side)
A -- -0.29 1.1 3.3 5.1 7.3 7.3
B -- 1.2 10.4 13.2 22.4 26.6 27
C 0.23 0.23 1.4 1.5 1.5 1.5
Static
modulus of
elasticity
(kN/mm2)
A 34.4 38.6 34.7 33.4 27.1 15.3 12.7
B 20.2 21.1 8.9 2.9 2.9 2.2 1.7
C 28.3 31.4 32.5 33.7 34.0 35.3 36.4

42
Figure 3.11 Variation in static modulus of elasticity (SME) with expansion [Ahmed et al.,
2003].
Smaoui et al. carried out an investigation including some mechanical tests on the ASR–
damaged effects on modulus of elasticity under compression by separating the specimens
into 2 groups as Low-alkali concrete and High-alkali concrete. As given in Table 3.11, both
concrete revealed the result in the same direction for 28 days even though the elasticity in
high alkali concrete was lower than in low-alkali concrete in the long term (Figure 3.12). In
the opinion of Smaoui et al., this event may be appeared due to limited the number of cracks
in the cement paste for both concretes within 0 and 40% of the ultimate strength. [Smaoui et
al., 2005]
Table 3.12 Difference of modulus of elasticity between low-alkali concrete and high-alkali
Concrete [Smaoui et al., 2005]
Property Age in
days
Low-alkali
concrete
High-alkali
concrete
Difference
(%)
Average
modulus of
elasticity (GPa)
3 34.7 32.4 -7
7 35.3 33.3 -6
28 35.8 37.8 +1
90 39.0 40.1 +1
180 44.1 41.1 -7
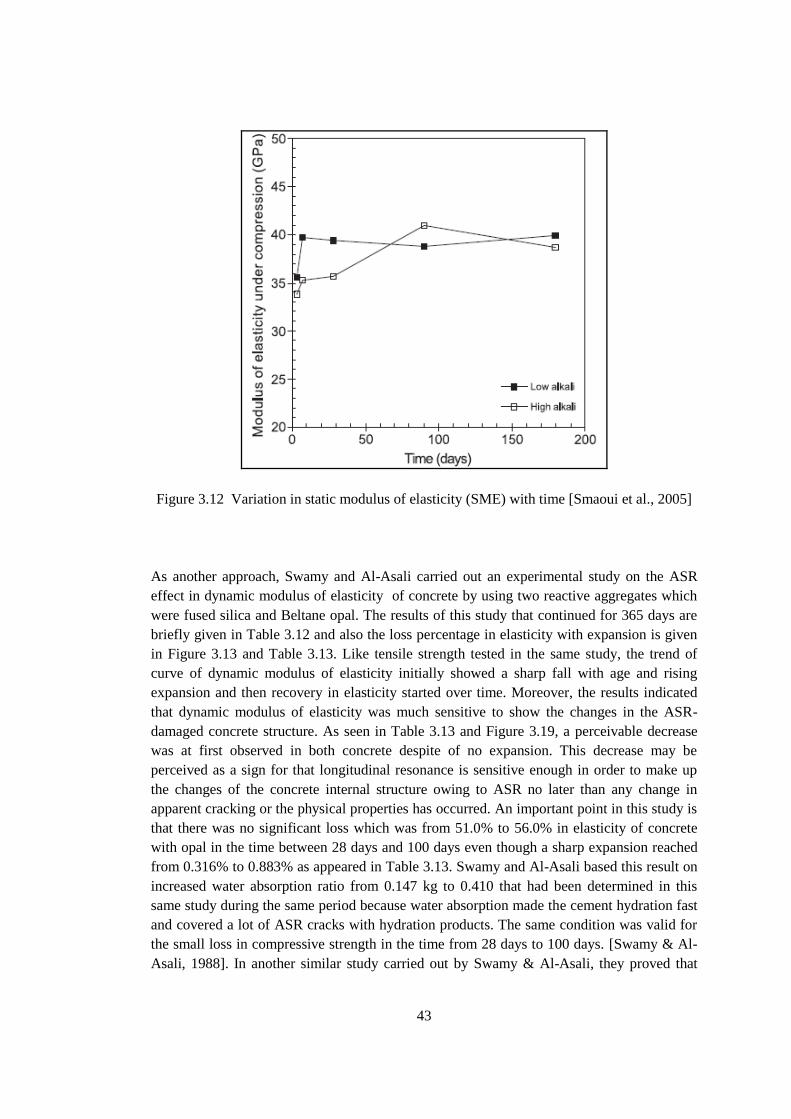
43
Figure 3.12 Variation in static modulus of elasticity (SME) with time [Smaoui et al., 2005]
As another approach, Swamy and Al-Asali carried out an experimental study on the ASR
effect in dynamic modulus of elasticity of concrete by using two reactive aggregates which
were fused silica and Beltane opal. The results of this study that continued for 365 days are
briefly given in Table 3.12 and also the loss percentage in elasticity with expansion is given
in Figure 3.13 and Table 3.13. Like tensile strength tested in the same study, the trend of
curve of dynamic modulus of elasticity initially showed a sharp fall with age and rising
expansion and then recovery in elasticity started over time. Moreover, the results indicated
that dynamic modulus of elasticity was much sensitive to show the changes in the ASR-
damaged concrete structure. As seen in Table 3.13 and Figure 3.19, a perceivable decrease
was at first observed in both concrete despite of no expansion. This decrease may be
perceived as a sign for that longitudinal resonance is sensitive enough in order to make up
the changes of the concrete internal structure owing to ASR no later than any change in
apparent cracking or the physical properties has occurred. An important point in this study is
that there was no significant loss which was from 51.0% to 56.0% in elasticity of concrete
with opal in the time between 28 days and 100 days even though a sharp expansion reached
from 0.316% to 0.883% as appeared in Table 3.13. Swamy and Al-Asali based this result on
increased water absorption ratio from 0.147 kg to 0.410 that had been determined in this
same study during the same period because water absorption made the cement hydration fast
and covered a lot of ASR cracks with hydration products. The same condition was valid for
the small loss in compressive strength in the time from 28 days to 100 days. [Swamy & Al-
Asali, 1988]. In another similar study carried out by Swamy & Al-Asali, they proved that
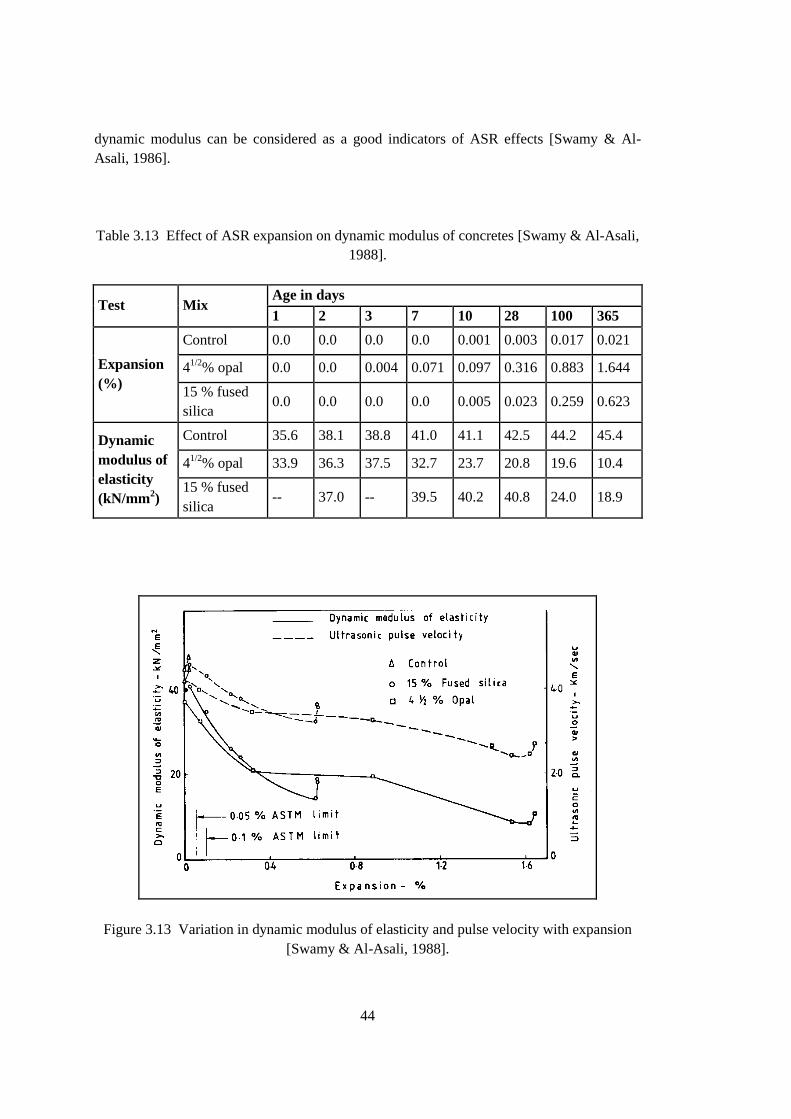
44
dynamic modulus can be considered as a good indicators of ASR effects [Swamy & Al-
Asali, 1986].
Table 3.13 Effect of ASR expansion on dynamic modulus of concretes [Swamy & Al-Asali,
1988].
Test Mix Age in days
1 2 3 7 10 28 100 365
Expansion
(%)
Control 0.0 0.0 0.0 0.0 0.001 0.003 0.017 0.021
41/2
% opal 0.0 0.0 0.004 0.071 0.097 0.316 0.883 1.644
15 % fused
silica 0.0 0.0 0.0 0.0 0.005 0.023 0.259 0.623
Dynamic
modulus of
elasticity
(kN/mm2)
Control 35.6 38.1 38.8 41.0 41.1 42.5 44.2 45.4
41/2
% opal 33.9 36.3 37.5 32.7 23.7 20.8 19.6 10.4
15 % fused
silica -- 37.0 -- 39.5 40.2 40.8 24.0 18.9
Figure 3.13 Variation in dynamic modulus of elasticity and pulse velocity with expansion
[Swamy & Al-Asali, 1988].

45
Table 3.14 Percentage loss in dynamic modulus of ASR- affected concretes [Swamy & Al-
Asali, 1988].
Like other researcher, Sargolzahi concluded from her mechanical test performed by using
spratt limestone as a reactive aggregate and Limeridge limestone as a non-reactive aggregate
and keeping specimen in a condition at 38 0C in 1 molar NaOH and at RH > 90% that
dynamic modulus of elasticity is the best indicator for evaluating ASR effect in concrete. In
this study, a loss of 35% was observed as the expansion percentage exceeded 0.06% due to
the remnant damage in concrete structure [Sargolzahi, 2009].
3.5 Effect of Alkali-Silica Reaction Expansion on Water Absorption of Concrete
As mention in the previous part, the alkali-silica gel that absorbs water and improves and
causes cracking in concrete structure is the most important product of ASR. [Ahmed et
al.,2003].Therefore, Ahmed et al. needed to apply an experimental investigation to observe
the effect of ASR expansion on the water absorption of concrete by using Thames Valley
sand (in mix A), fused silica (in mix B) and slowly reactive aggregate (in mix C). After
casting and moulding, The cube specimens, 100X100X100 mm in size were cured for 28
days in water at 20 0C and then the temperature was increased to 38
0C to accelerate alkali-
silica reaction. As seen in Table 3.14 and Figure 3.14, the curve of water absorption trended
to increase at different rates with time. The ASR-affected concretes, mix A and mix B,
initially represented different demand for water but the control concrete, mix C, didn‟t. A
dramatic increase firstly appeared in mix B until 4th week in hot water at 38
0 C. The increase
curve headed to decline in time between 4 weeks and 11 weeks, another sharp increase was
shown as coming 16 weeks. Although the increase in water absorption was lower, Mix A
showed similar behaviour with mix B. Water absorption of mix A increased up to week 27
and remained stable by the time test finished at week 52. Mix C, the control concrete,
indicated a small increase up to 2 weeks and then remains almost constant until the end of

46
investigations, at 1 year. Consequently, at the end of 12 months, the water absorption of mix
A and mix B was found as 1.9 and as 6.4 times more than that of mix C, the control,
respectively. Ahmed et al. leaned this continuous increase in water absorption on new cracks
or the existing channel permitting water to attain new reaction areas [Ahmed et al., 2003].
Table 3.15 Effect of ASR expansion on water absorption [Ahmed et al., 2003].
Test Mix
Time at 20 0 C Time in hot water at 38
0 C
7
days
28
days
7
weeks
3
months
6
months
9
months
12
months
Prism
expansion
(mm/mm)
A -- -0.4 -0.8 2.9 4.3 4.3 4.3
B -- 0.96 2.0 12.53 15.73 16.56 16.86
C -- 0.05 0.6 0.93 1.0 1.13 1.27
Water
absorption
(g)
A 8.0 9.6 15.4 21.3 29.3 29.1 29.6
B 14.8 28.0 43.9 71.6 73.2 75.2 75.2
C 8.9 9.7 10.4 10.4 10.3 10.7 10.2
Figure 3.14 Variation in water absorption with expansion [Ahmed et al.,2003].
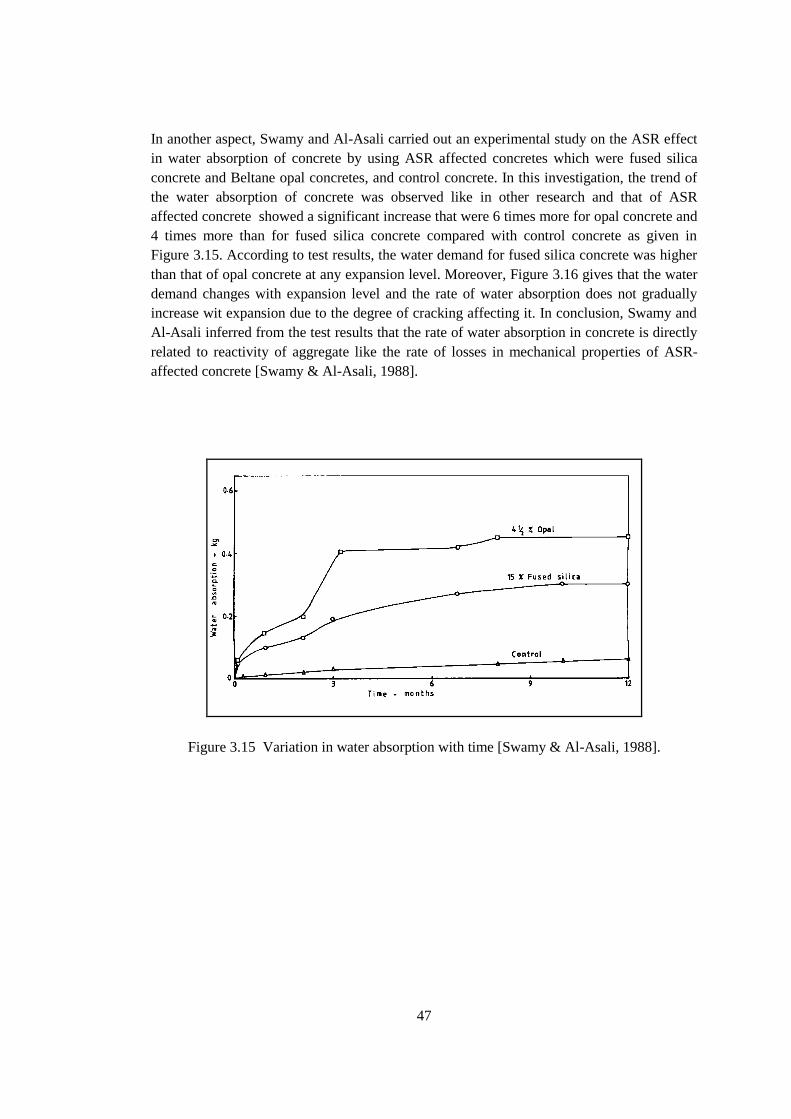
47
In another aspect, Swamy and Al-Asali carried out an experimental study on the ASR effect
in water absorption of concrete by using ASR affected concretes which were fused silica
concrete and Beltane opal concretes, and control concrete. In this investigation, the trend of
the water absorption of concrete was observed like in other research and that of ASR
affected concrete showed a significant increase that were 6 times more for opal concrete and
4 times more than for fused silica concrete compared with control concrete as given in
Figure 3.15. According to test results, the water demand for fused silica concrete was higher
than that of opal concrete at any expansion level. Moreover, Figure 3.16 gives that the water
demand changes with expansion level and the rate of water absorption does not gradually
increase wit expansion due to the degree of cracking affecting it. In conclusion, Swamy and
Al-Asali inferred from the test results that the rate of water absorption in concrete is directly
related to reactivity of aggregate like the rate of losses in mechanical properties of ASR-
affected concrete [Swamy & Al-Asali, 1988].
Figure 3.15 Variation in water absorption with time [Swamy & Al-Asali, 1988].
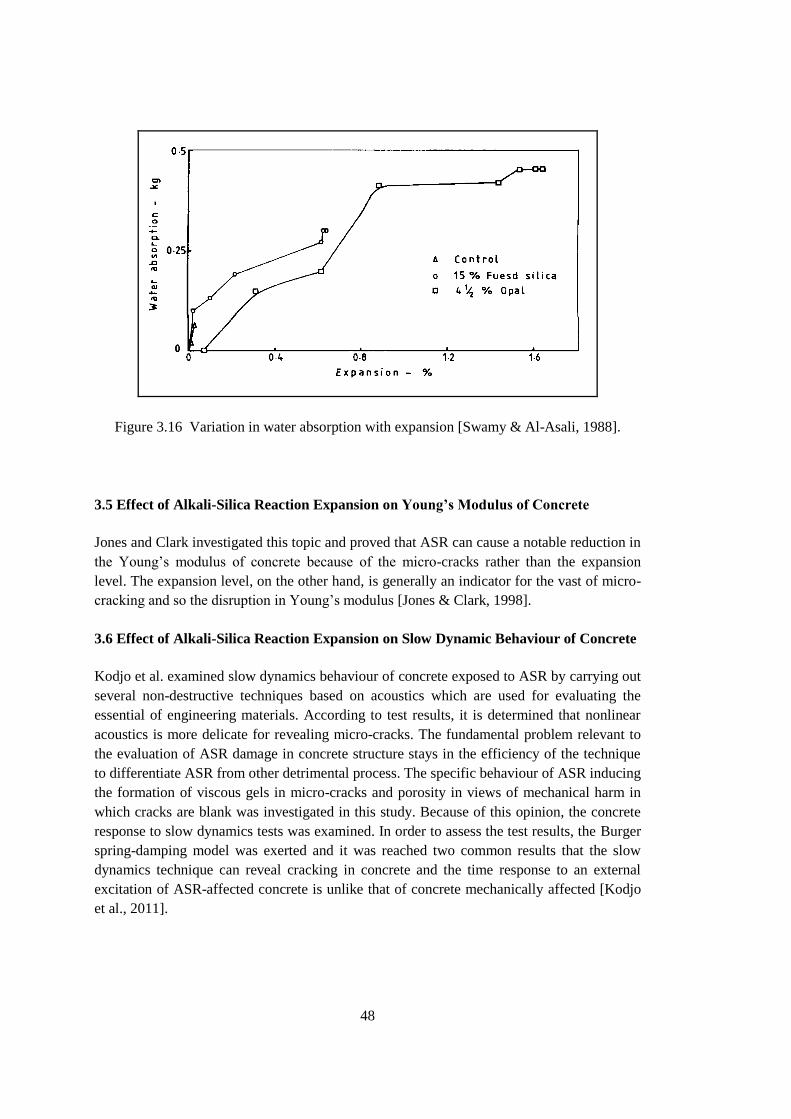
48
Figure 3.16 Variation in water absorption with expansion [Swamy & Al-Asali, 1988].
3.5 Effect of Alkali-Silica Reaction Expansion on Young’s Modulus of Concrete
Jones and Clark investigated this topic and proved that ASR can cause a notable reduction in
the Young‟s modulus of concrete because of the micro-cracks rather than the expansion
level. The expansion level, on the other hand, is generally an indicator for the vast of micro-
cracking and so the disruption in Young‟s modulus [Jones & Clark, 1998].
3.6 Effect of Alkali-Silica Reaction Expansion on Slow Dynamic Behaviour of Concrete
Kodjo et al. examined slow dynamics behaviour of concrete exposed to ASR by carrying out
several non-destructive techniques based on acoustics which are used for evaluating the
essential of engineering materials. According to test results, it is determined that nonlinear
acoustics is more delicate for revealing micro-cracks. The fundamental problem relevant to
the evaluation of ASR damage in concrete structure stays in the efficiency of the technique
to differentiate ASR from other detrimental process. The specific behaviour of ASR inducing
the formation of viscous gels in micro-cracks and porosity in views of mechanical harm in
which cracks are blank was investigated in this study. Because of this opinion, the concrete
response to slow dynamics tests was examined. In order to assess the test results, the Burger
spring-damping model was exerted and it was reached two common results that the slow
dynamics technique can reveal cracking in concrete and the time response to an external
excitation of ASR-affected concrete is unlike that of concrete mechanically affected [Kodjo
et al., 2011].

49
3.7 Effect of Alkali-Silica Reaction Expansion on Reinforced Concrete Beams
Fan and Hanson performed a laboratory study to examine the effect of ASR expansion and
cracking on the structural behaviour of reinforced concrete beams and on mechanical
properties of cylinders with same concrete. The results of the study are given as follow;
(1) ASR cracking was shown on reinforced concrete beams consisting of the reactive
aggregate after exposed to NaOH solution at 38 0C and then cooled to room
temperature, as length expansion from ASR approached to nearly 500
microstrain. The overpowering cracks were directed in the direction parallel to
the reinforcement.
(2) A significant damage did not occurred on the mechanical properties of concrete
cylinders until visible cracks appeared on the face of concrete cylinder. After 6
months in time the specimens were stored in ASR accelerated conditioning, a loss
of 24%, 38% and 31% in compressive, splitting tensile strength, and dynamic
modulus were sequentially observed by views of the 28-day strength values. In
the following 6-months period, there was no significant loss in these values.
(3) Unlike the other properties, the reinforced concrete beams with reactive aggregate
showed a decrease in flexural strength in spite of visible crack compared with that
of the nonreactive beam on which there was no visible crack [Fan & Hanson,
1998].
The numerical data derived for reinforcement pretending as a lateral confinement
fairly shows that the strain/stress state led by ASR in reinforced concrete
specimens has an oriented form. The latter is in qualified accord with
experimental data [Multon et al.\ 2005; Multon & Toutlemonde, 2006].
Moreover, the available experimental results along with the parametric studies
performed here, fairly indicate the importance of a suitable definition of the
impact of stress rate on the improvement of ASR-affected deterioration. This
view was investigated by some researcher performing related experiments.
[Hobbs 1988; Clark 1991; Charlwood & Solymar, 1994; Leger et al., 1996;
Multon & Toutlemonde, 2006]. Some of the available material models, on the
other hand, [Hobbs, 1988; Clark, 1991.; Ulm et al. 2000; Steffens et al., 2003;
Bangert et al. 2004] disregard this impact. This may cause important faults in the
forecasted counter, especially in the content of breakdown of limitation value
challenge.
3.8 Monitoring of Ultrasonic Pulse Velocity (UPV) and Surface Expansion on ASR-
affected Concrete
With the same condition and concrete types that mentioned in previous part, Ahmet et. al.
utilized UPV [BSEN 13791, 1986] in order to examine the ASR-damaged effect. Figure 3.17
and Figure 3.18 in sequence give the UPV of the horizontally cast prism, 100x100x500 mm
in size and the vertically cylinders, 150x300 mm in size which change with time and
expansion. Although there were no significant expansion and visible cracks, the UPV of Mix

50
B decreased sharply in the early stages of the reaction. The UPV value went on decreasing
with different rate but after a period of time, a modest recovery appeared in that. As can be
observed in and Table 3.15, the loss percentage in prism and cylinder were in sequence
nearly 23% and 27%. Unlike mix B, mix A firstly represented an increase in UPV that was
based on hydration of cement or the gel filling the cracks by Ahmet et. al. The decrease in
UPV of mix A started in around 6th weeks and continued up to 6th months, after then a
modest recovery appeared in UPV. The loss percentage in UPV of mix B was quite greater
than in that of mix A which were nearly 2% for prisms and 3% for cylinders. As comparing
with mix C, the loss percentage in UPV of prisms of mixes A and B were in order
approximately 7% and 28% that are clearly seen in Table 3.5 [Ahmed et al/, 2003].
As additional information, Hughes and Ash claimed that the water gain issue causes the
formation of weaker planes in concrete. Therefore, the ASR gels appeared at these weaker
planes and cracks form in shape of parallel to the weaker planes and perpendicular to
direction of casting that may lead to a decrease in UPV of concrete [Hughes & Ash,1969].
In another study performed by Swamy and Al-Asali (1988), UPV analysis was carried out at
the top, middle, and bottom of the 100x100 mm cross section taken from fused silica, opal
and control concretes and the results were given as an average. After the first three readings
of UPV were measured, any significant differences were not observed due to some cover in
the areas across that measurements were done. Figure 3.19 and Figure 3.13 indicate the
variation in UPV with time and expansion, respectively, and also Table 3.16 briefly gives the
loss percentage in UPV with both expansion and time. According to test results, having
regard to these of loss percentages, it was determined that UPV was substantially sensitive
against ASR-damaged effect as compared with other mechanical properties of concrete
examined in the same study even though UPV was not found as sensitive as dynamic
modulus [Swamy & Al-Asali,1988].
Table 3.16 Effect of ASR expansion on ultrasonic pulse velocity [Ahmed et. al., 2003].
Test
Mix
Age
Time at 20 0 C Time in hot water at 38
0 C
7
days
28
days
7
weeks
3
months
6
months
9
months
12
months
Prism
expansion
(mm/mm)
A -- -0.4 -0.8 2.9 4.3 4.3 4.3
B -- 0.96 2.0 12.53 15.73 16.56 16.86
C -- 0.05 0.6 0.93 1.0 1.13 1.27
Cylinder
expansion
(mm/mm)
(side)
A -- -0.29 1.05 3.3 5.1 7.3 7.3
B -- 1.2 10.4 13.2 22.4 26.6 27
C -- 0.23 0.23 1.4 1.5 1.5 1.5

51
Table 3.16 (continued)
Ultrasonic
pulse velocity
(km/s)(prisms)
A -- 4.8 4.9 4.6 4.6 4.7 4.7
B -- 4.7 3.6 3.2 3.1 3.3 3.6
C -- 4.9 5.0 5.1 5.1 5.1 5.1
Ultrasonic
pulse velocity
(km/s)
(cylinder)
A -- 4.9 4.9 4.7 4.6 4.7 4.8
B -- 4.6 3.7 3.6 3.2 3.3 3.4
C -- 4.8 4.8 4.8 5.0 4.9 4.9
Figure 3.17 Variation in UPV of prism and cylinder with time [Ahmed et al., 2003].
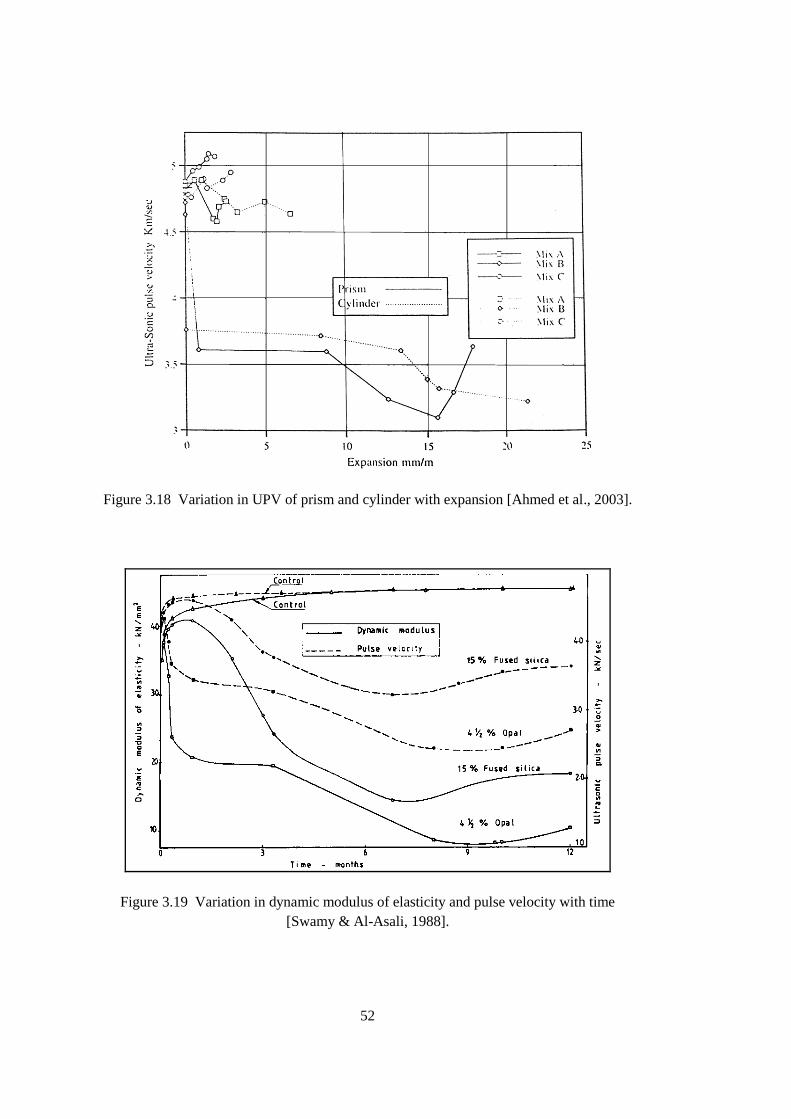
52
Figure 3.18 Variation in UPV of prism and cylinder with expansion [Ahmed et al., 2003].
Figure 3.19 Variation in dynamic modulus of elasticity and pulse velocity with time
[Swamy & Al-Asali, 1988].

53
Table 3.17 Loss percentage in UPV of ASR-affected concretes [Swamy & Al-Asali, 1988].
3.9 Expansion Varying with Different Type of Specimens
Ahmet et. al. carried out the measurement of expansion from ASR on both vertically cast
prism (100x100x500 mm) and horizontally cast cylinder (150x300 mm) specimens by using
demec points glued on. In this study taking 12 months, the specimens were cured at 20 0C for
28 days before they were stored in hot water at 38 0C. Figure 3.20 comparatively reveals the
overall expansion of prism and cylinder samples cast from Thames valley concrete (mix A),
fused silica concrete (mix B) and control concrete (mix C).As considering prism specimens,
it was surprising that negative expansion called as shrinkage appeared in mixes A and C for
the first 4 weeks in hot water even though a visible expansion in the first week in hot water
was observed in mix B. As the test period reached to nearly 50 days, Mixes A and B showed
a significant expansion and but the curves stated to vary in the following period. That he
expansion in mix B, fused silica concrete, was higher than that in mix A, Thames valley
concrete was explained as numerical in Table 3.14. The final lateral expansion of mix B was
determined as 25.93 mm/m while that of mix A was 8.1 mm/m. As for the final longitudinal
expansions of mixes B and A, they were 16.86 mm/m and 4.3 mm/m, respectively [Ahmet et
al., 2003].
According to the results of the same study, cylinder vertically cast indicated a greater
expansion than the horizontally cast prisms at the end of the test. As clearly seen in Figure in
3.20 and Table 3.14 and mentioned in the previous part, the final longitudinal expansion of
mixes B and A for the prisms were determined as 16.86 mm/m and 4.3 mm/m, respectively
while the expansion of mixes B and A for the cylinder in side were determined as 27.0
mm/m and 7.3 mm/m, respectively. As comparing the lateral expansion in prism with the
face expansion in cylinder, on the contrary, there was a converse event that the final lateral
expansion of mixes B and A for the prisms were determined as 25.93 mm/m and 8.1 mm/m,
respectively while the expansion of mixes B and A for the cylinder in face were determined
as 14.6 mm/m and 3.7 mm/m. Hence, one of the most important factor to explain the
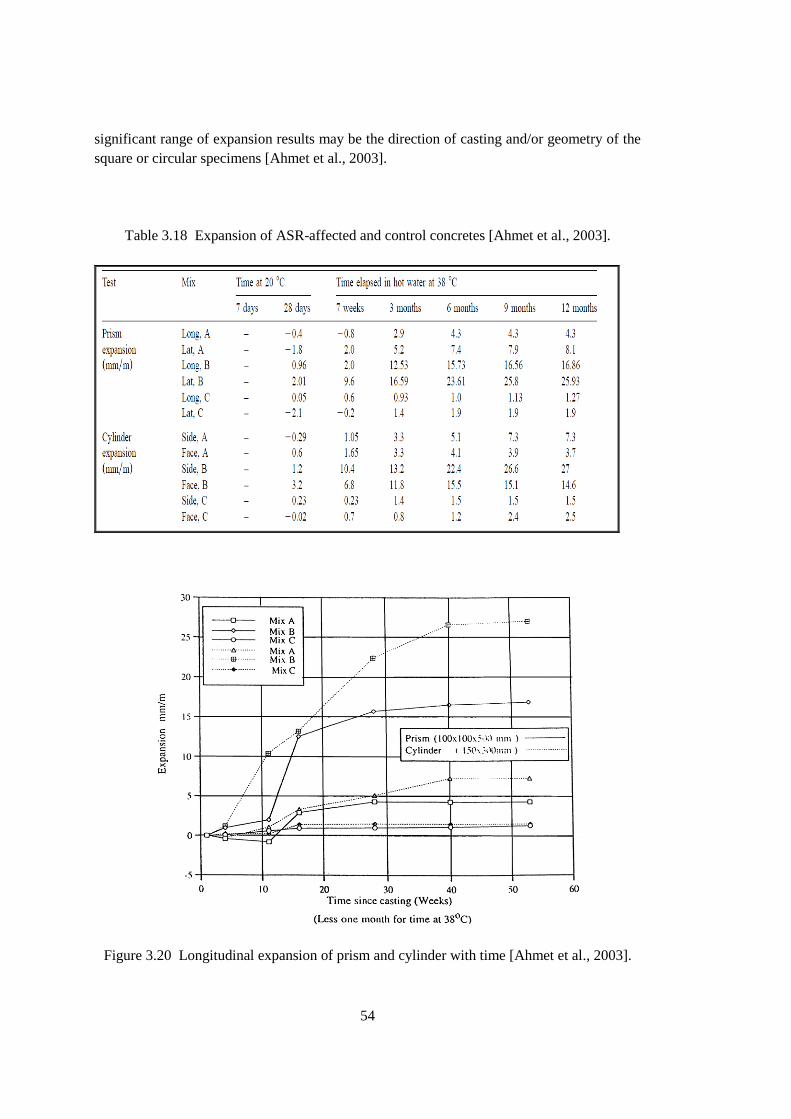
54
significant range of expansion results may be the direction of casting and/or geometry of the
square or circular specimens [Ahmet et al., 2003].
Table 3.18 Expansion of ASR-affected and control concretes [Ahmet et al., 2003].
Figure 3.20 Longitudinal expansion of prism and cylinder with time [Ahmet et al., 2003].

55
CHAPTER 4
4. EXPERIMENTAL STUDY
4.1 Experimental Study
The main aims of the study in this thesis were to examine ASR-affected concrete in view of
mechanical properties at minimum 0.04% expansion and also to observe the effect of
specimen types on ASR expansion. Most tests, such as compressive strength, flexural
strength, splitting tensile strength, and modulus of elasticity, were carried out at the
Materials of Construction Laboratory of Turkish Standards Institute (TSE) and only pullout
strength test was performed at Structural Mechanics Laboratory of Middle East Technical
University.
Before this experimental study was performed, according to RILEM TC 219-ACS, a total of
24 concrete prisms (285x80x80 mm) were cast by using four different aggregates (perlite&
limestone, perlite & perlite, sand & limestone, limestone & perlite) in order to reach to
minimum 0.04% expansion in long term. As using sand and limestone combinations in
mortar, the concrete prisms expands to 0.04% in nearly 5-6 weeks and so sand & limestone
combination was selected as the most appropriate material and used in this study for
examining ASR effect on mechanical properties of concrete (Figure 4.1)
Figure 4.1 Trial samples used to find the most appropriate material

56
After materials were selected, 45 specimens at 5 different types in dimension were totally
prepared for achieving the aims of this study in accordance with the mix design described in
RILEM TC 219-ACS. The types of specimens depending on their use were put in order as
follows;
1) 9 concrete prismatic, 285x80x80 mm in size, were cast in order to observe the effect
of ASR on flexural strength of concrete. Steel reference studs were placed into the mid-
points of the end faces of the prisms but expansion measurements were performed in 6
specimens which were ASR-affected (Figure 4.2).
Figure 4.2 Specimens for flexural strength test
2) 9 cubic specimens, 150x150x150 mm in size, were cast in order to observe the effect
of ASR on compressive strength of concrete. Moreover, the steel reference studs were
placed on two different surfaces of 6 specimens to compare the ASR expansion with
that of another specimen types.
3) 9 cylindrical specimens, 200x100 mm in size, were cast in order to examine the
effect of ASR on modulus elasticity and compressive strength of concrete. For 6 of all
specimens, the steel reference studs were installed into the mid-points of the end faces
of the cylinders.
4) 9 cylindrical specimens, 200x100 mm in size, were cast in order to investigate the
effect of ASR on splitting tensile strength of concrete. Unlike the other specimens, there
was no usage of the reference steel studs for expansion measurement. The test was
performed by taking the expansion of the cylindrical specimens which were prepared
for evaluating modulus of elasticity as a reference (Figure 4.3).
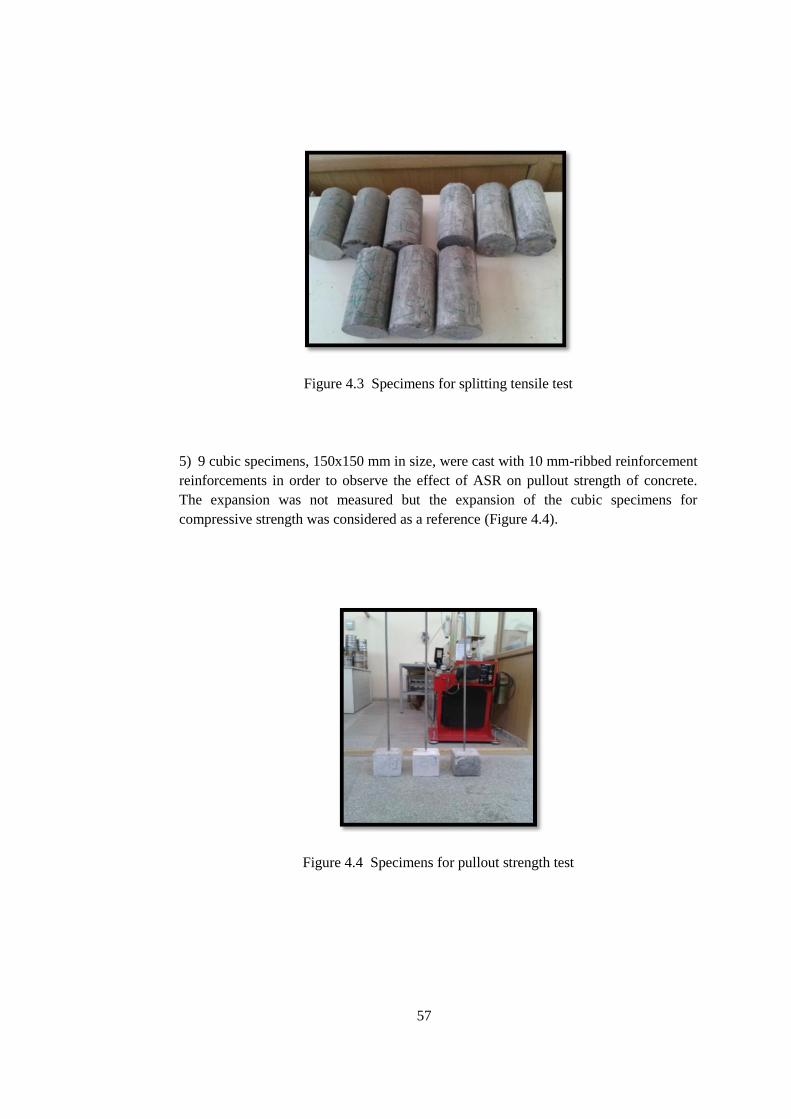
57
Figure 4.3 Specimens for splitting tensile test
5) 9 cubic specimens, 150x150 mm in size, were cast with 10 mm-ribbed reinforcement
reinforcements in order to observe the effect of ASR on pullout strength of concrete.
The expansion was not measured but the expansion of the cubic specimens for
compressive strength was considered as a reference (Figure 4.4).
Figure 4.4 Specimens for pullout strength test
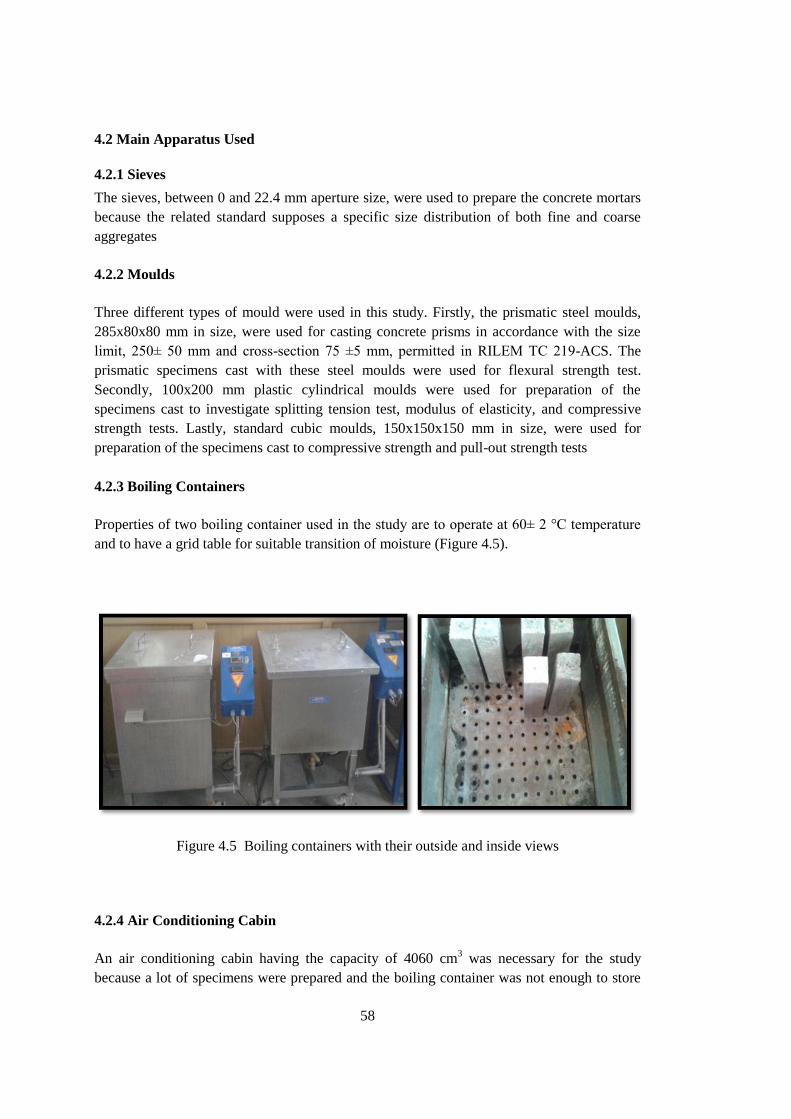
58
4.2 Main Apparatus Used
4.2.1 Sieves
The sieves, between 0 and 22.4 mm aperture size, were used to prepare the concrete mortars
because the related standard supposes a specific size distribution of both fine and coarse
aggregates
4.2.2 Moulds
Three different types of mould were used in this study. Firstly, the prismatic steel moulds,
285x80x80 mm in size, were used for casting concrete prisms in accordance with the size
limit, 250± 50 mm and cross-section 75 ±5 mm, permitted in RILEM TC 219-ACS. The
prismatic specimens cast with these steel moulds were used for flexural strength test.
Secondly, 100x200 mm plastic cylindrical moulds were used for preparation of the
specimens cast to investigate splitting tension test, modulus of elasticity, and compressive
strength tests. Lastly, standard cubic moulds, 150x150x150 mm in size, were used for
preparation of the specimens cast to compressive strength and pull-out strength tests
4.2.3 Boiling Containers
Properties of two boiling container used in the study are to operate at 60± 2 °C temperature
and to have a grid table for suitable transition of moisture (Figure 4.5).
Figure 4.5 Boiling containers with their outside and inside views
4.2.4 Air Conditioning Cabin
An air conditioning cabin having the capacity of 4060 cm3 was necessary for the study
because a lot of specimens were prepared and the boiling container was not enough to store

59
all specimens. The notable property of this cabin is to provide the necessary condition, 60± 2
°C temperature and nearly %100 RH (Figure 4.6).
Figure 4.6 Air conditioning cabin
4.2.5 Digital Length Comparator
A digital length comparator with the sensitivity of 0.001 mm was used to measure expansion
in the specimens (Figure 4.7).
Figure 4.7 Digital length comparator
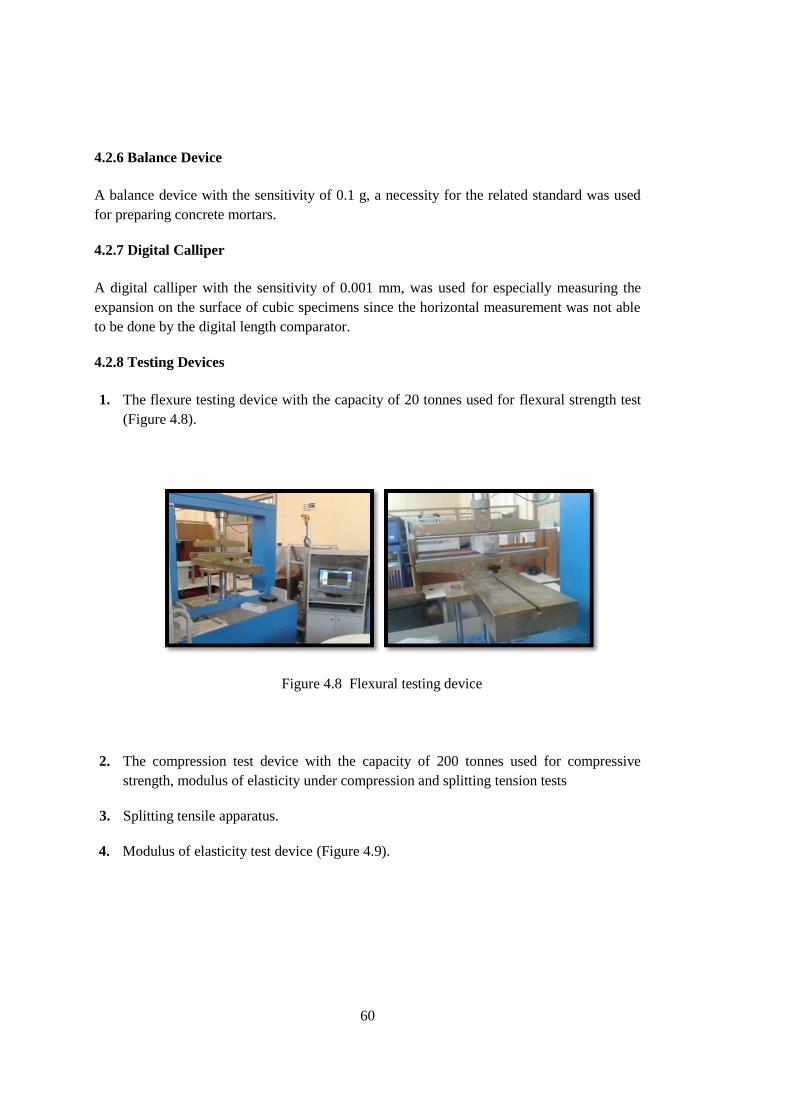
60
4.2.6 Balance Device
A balance device with the sensitivity of 0.1 g, a necessity for the related standard was used
for preparing concrete mortars.
4.2.7 Digital Calliper
A digital calliper with the sensitivity of 0.001 mm, was used for especially measuring the
expansion on the surface of cubic specimens since the horizontal measurement was not able
to be done by the digital length comparator.
4.2.8 Testing Devices
1. The flexure testing device with the capacity of 20 tonnes used for flexural strength test
(Figure 4.8).
Figure 4.8 Flexural testing device
2. The compression test device with the capacity of 200 tonnes used for compressive
strength, modulus of elasticity under compression and splitting tension tests
3. Splitting tensile apparatus.
4. Modulus of elasticity test device (Figure 4.9).

61
Figure 4.9 Modulus of elasticity test device
5. Pullout strength test set (Figure 4.10).
Figure 4.10 Setup for pullout strength test
4.3 Materials
4.3.1 Cement
The related standard followed in this study permits the usage of an ordinary Portland
Cement, produced according to TS EN 197-1 CEM I or ASTM C150 Type or similar, with a
total alkali content of 0.9-1.2% sodium oxide equivalent. Therefore, Turkish Portland CEM I
42.5 R providing the required essentials was used in the experiments. Sodium oxide
equivalent is calculated from Formula 2.3. According to this formula, sodium oxide

62
equivalent of the cement used was calculated as nearly 1.2 %, a percentage revealing that the
usage of this cement is accordance with the related standard by using the values in table 4.1
giving chemical compositions and physical properties of the cement.
Table 4.1 Chemical compositions and physical properties of the cement [Baştaş Çimento,
2012]
PHYSICAL PROPERTIES ASTM C150
Limits
Specific Gravity
(g/cm3)
3.16
Fineness (cm2/g) 4250 >2800
Water Demand 0
Hydration Heat (cal/g) 87
CHEMICAL COMPOSITION OXIDES (%)
CaO 63.43
SiO2 20.21
Al2O3 5.30
Fe2O3 3.08
MgO 1.56 <6.00
SO3 3.41 <3.50
Na2O 0.60
K2O 0.90
Cl 0.015
Insoluble Residue 1.37
Loss on Ignition 1.88 <3.00
4.3.2 Aggregates
The aggregates combination used may consist of two types of the aggregates as follow;
1) A reactive natural-sand originated from Kızılırmak River was used as fine
aggregates.
2) A non-reactive crushed-limestone derived from Elmadag was used as coarse
aggregates.
The natural river sand was examined by applying accelerated mortar bar methods (ASTM
C1260) before this experimental study was carried out. Its 14-day expansion slightly

63
exceeded 0.2 percent and so this aggregate was determined as a moderate reactive material.
The reactivity of the crushed limestone was investigated by same test method and its
expansion was found as less than 0.05 percent. Therefore, the crushed limestone was
described as an non-reactive material. Aggregate proportions were briefly explained as
below;
The natural river sand (fine aggregate) - 40% (0 to 4 mm)
The crushed limestone (Coarse aggregate) - 60% (4 to 22.4 mm)
In Table 4.4, the aggregate grading curve range prepared accordance with the related
Standard gives the aggregate proportions in details. The physical properties of these
aggregates are given in Table 4.2.
Table 4.2 The physical properties of natural river sand and crushed limestone
Bulk Density (g/cm3) Natural
River Sand
Crushed
Limestone
SSD (TS EN 1097-6) 2.72 2.68
DRY(TS EN 1097-6) 2.67 2.65
Water Absorption 24h (% by mass)
(TS EN 1097-6) 1.84 0.62
Los Angeles Abrasion (%)
(TS EN 1097-2) -- 23
Water Content (% by mass)
(TS EN 1097-5) 0.73 0.13
4.3.3 Water
There were two main types water used in this investigation. Firstly, municipal tap water was
used as the mixing water supposed to be free from organic matter, oil and alkalis. Secondly,
distilled water was used in the NaOH solution in a certain quantity.
4.3.4 Sodium Hydroxide
Sodium Hydroxide (NaOH) is a chemical material containing alkalis. It was used for NaOH
solution to accelerate the alkali-silica reaction in the investigation. 1 molar NaOH solution
was prepared according to the specified quantity described in ASTM C1260. 1 molar NaOH
solution consists of 2700 g tap water, 300 g distilled water, and 120 g NaOH.
64
4.4 Investigation Method
4.4.1 Determination of Expansion from Alkali-Silica Reaction
285x80x80 mm concrete prisms were cast in accordance with RILEM TC 219-ACS to
determine the expansion level from ASR in this study. Unlike concrete prisms, 100x200
mm2 cylinder concretes and 150x150 mm standard cube concretes were cast to measure ASR
expansion despite the lack of compliance with the dimension specified in the standard. On
the other hand, the mix design of concrete for all specimens was carried out in accordance
with this standard as follow;
According to RILEM TC 219-ACS, in 1 m3 concrete consists of cement 440 kg/m³ cement,
220 kg/m³ free (effective) water, coarse and fine aggregates; 60% and 40%, respectively by
mass or as specified in Table 4.3 and assumed nearly 2 % air. Moreover, size distribution of
aggregates, suitable to the standard is given in Table 4.4.
For the calculation of extra water in the aggregates, Equation 4.1 and Formulas below are
applied.
Extra water needed = [(water absorption of the aggregate - measured water content
of the aggregate)/100] x [calculated mass of the dry aggregate] (Equation 4.1)
or
Wextra = [(WA - W) / 100] x [(quantityssd of the aggregate) / (1 + WA / 100)]
(Formula 4.1)
For fine aggregate,
Wextra = [(1.84 – 0.73) / 100] x [(663) / (1 1.84 / 100)] 7 kg (Formula 4.2)
For coarse aggregate,
Wextra = [(0.62 – 0.13) / 100] x [(995) / (1 + 0.62 / 100)] 5 kg (Formula 4.3)

65
Table 4.3 Common mix design of 1 m3 concrete
Grading(mm) Proportion (%) Quantity (kg/m³)
Coarse aggregate 4/22.4 60 995-5 = 990
Fine aggregate 0/4 40 663-7 = 656
Cement 440
Water (free) 220+5+7 = 232
Air (assumed 2%)
(TS EN 12350-6) --
Total 2318
Table 4.4 Size distribution of aggregates
Sieve size The mass percentage passed
from the sieve (%)
22.4 100
16.0 90
8.0 70
4.0* 40*
2.0 35
1.0 25
0.5 15
0.25 5
0.125 2
*The mass percentage passed from 4 mm sieve was purposely arranged as 40 % because the
60 % of total aggregate was coarse crushed limestone.
The provisions in RILEM TC 219-ACS were validated in preparation of these specimens,
especially in views of mix design and conditioning. As the specimens were cast, a room
condition was maintained at 20±2 0C and then they were waited in the moulds for over 24
hours. Immediately after demoulding, all the specimens were cured in water at 20 0C for 1 h
and the first measurements for the specimens with reference steel studs were taken. The
former measurements for all specimens were taken after curing in water at 20 0C for 24 h.
After these processes applied on all specimens, for each testing groups, 3 of 9 specimens
were exposed to ASR at 60± 2 °C temperature and a relative humidity as close as possible to
100% for the time varying from 6 to 8 weeks until the expansion exceeded the limit, 0.04
percent and so this 3-specimens group was called as G-A Concrete with expansion of
greater than 0.04 percent. Like mix A, another 3-specimens group was exposed to ASR in
66
the same condition for 14 weeks. While the aim of this exposure for longer time was to
investigate the effect of ASR on mechanical properties of concrete at expansion exceeding
the limit of 0.10 percent, the expansion for all specimens could not reach to this limit.
Therefore, these specimens were started to be exposed to 1 molar NaOH solution for the
time varying with respect to specimen types from 2 to 4 week in order to pass the limit of
0.10 percent and was called as G-B Concrete with expansion of greater than 0.10 percent. In
addition to these ASR-affected concrete, the last 3 specimens were cured in water at 20 0C
until the expansion level of mix A concrete exceeded expansion limit of 0.04 percent and so
these specimens were used control concrete and called as G-C Concrete.
4.4.2 Determination of the Effect of Alkali-Silica Reaction Expansion on the
Mechanical Properties of Concrete
Flexural strength test on concrete prisms cast as ASR-affected concrete and control concrete
was performed in accordance with ASTM C78 by the use of a simple beam with third-point
loading. The results found in this test method may be utilized to detect accordance with
specifications or as a principle for proportioning, mixing and placement operations. The
results were calculated from Formula 4.4 as follow
R= PL / bd2 (Formula 4.4)
R = flexural Strength, MPa
P = maximum applied load shown by the testing machine, N,
L = span length, mm,
b = average width of specimen, mm, at the fracture, and
d = average depth of specimen, mm at the fracture.
TS EN 12390-3 was applied on the determination of compressive strength of all cylinder and
cube concrete specimens. The calculation was simply done by Formula 4.5 below
σ= P / A (Formula 4.5)
σ flexural strength, MPa
P = maximum applied load shown by the testing machine, N
A = cross section area, mm2,

67
As for the determination of the splitting tensile strength of cylindrical concrete specimens, it
was examined in accordance with ASTM C496. Applying a diametrical force along the
length of a cylindrical concrete until failure happened is the main content of this test method.
This loading leads to tensile stresses on the plane including the applied load and greater
compressive stresses in the areas around the applied load. Tensile failure is observed instead
of compressive failure due to a state of triaxial compression that means resistance to much
more compressive strength. Formula 4.6 was used to get the results of this test.
T = 2P/π*l*d (Formula 4.6)
T = splitting tensile strength, MPa
P = maximum applied load shown by the testing machine,
l = length, mm, and
d = diameter, mm
Modulus of elasticity values of cylindrical concrete specimens under compression were
determined by applying the method in ASTM C469. This test method yields a stress/strain
ratio and lateral strain/longitudinal strain ratio value for concrete. In this method, the
compressive stresses applied for determining modulus of elasticity were as much as 0 to 40
% of ultimate concrete strength. The formulas given and gradually explained in ASTM C469
were used in order to determine the modulus of elasticity of cylindrical concrete specimens.
The test method for determination of pullout strength of hardened concrete is fairly clarified
in ASTM C900. However, this method was completely not able to be exerted in this study
because it required a specific metal to be inserted into fresh concrete. Therefore, a 10 mm-
ribbed reinforcement was embedded into fresh concrete cast with cubic moulds, 150x150
mm in size. The calculation of pullout strength was performed by Formula 4.7 as below
σ= (F*µ)/ (π*d*l) (Formula 4.7)
σ pullout strength, MPa
F = maximum applied pullout force applied by the testing machine, N
µ friction coefficient between concrete and steel (0.45)
d = diameter of the reinforcement, mm, and
l = length of stud

68
69
CHAPTER 5
5.RESULTS AND DISCUSSION
5.1 General
In this study, the effect of ASR expansion on mechanical properties of concrete and the
effect of specimen types on ASR expansion were investigated. Mechanical tests were
performed on both the specimens exceeding expansion from ASR of 0.04 percent and ones
exceeding that of 0.10 percent. In this part, the results for G-A concrete with greater than
expansion of 0.04 percent, G-B concrete with greater than that of 0.10 percent, and G-C
concrete (control concrete) were given with graphs and tables in the following parts. While
ASR-affected concrete (G-A, G-B) were started to be stored at 60 0
C and 100% RH, G-B
concrete was compulsorily exposed to NaOH solution in recent weeks in order to provide
expansion percentage of G-B concrete to exceed the limit of 0.10 percent.G-C concrete, on
the other hand, was cured in water at 20 0
C and used as control concrete. As known, the
formed ASR gel absorbs water, expands, and causes internal pressure that causes cracking,
which then continues and leads to expansion in concrete structure.
5.2 Effect of ASR Expansion on Compressive Strength of Concrete
The ASR effect on compressive strength was examined by using cubic specimens, 150x150
mm in size, and cylindrical specimens, 100x200 mm in size. While the mix design of all
specimens was prepared according to regulations as described by RILEM TC 219-ACS,
compressive test for all specimens were carried out in accordance with the provisions in TS
EN 12390-3. Limestone, non-reactive aggregate, and natural river sand, moderately reactive
aggregate, were used as coarse and fine aggregates, respectively. The expansion results in
weeks and compressive strength for all specimens are given in Figures 5.1, 5.2 and 5.4 and
also Tables 5.1, 5.2 and 5.3.
.

70
Figure 5.1 Expansion of G-A concrete for cube and cylindrical specimens with time
Figure 5.2 Expansion of G-B concrete for cube and cylindrical specimens with time
The expansion for both cube and cylindrical specimens are plotted against time in Figure 5.1
and 5.2, respectively. The expansion in cube specimen exceeded the limit of 0.04 at the end
of 6th week while that in cylindrical specimen exceeded the limit at the end of 8
th week.
Therefore, cube specimens of G-A concrete were exposed to ASR at 60 0C and 100 % RH
for 6 weeks. After 6 weeks, when the expansion in G-A concrete reached a value of 0.0422
percent, the specimens of G-A concrete and G-C were tested for compressive strength. As
seen in Table 5.1, the average compressive strength of G-A concrete was found as 48.5 MPa.
This result indicated that a decrease of 7.6 percent in strength of G-A concrete is obtained
when compared to G-C concrete that was averagely 52.4 MPa (Table 5.3). Unlike others, the
specimens of G-B concrete were stored not only at 60 0
C and 100 % RH but also in 1 molar
71
NaOH and 60 0
C because the expansion level could not reach to the limit of 0.10 percent
which was one of the main targets of this study. During 17 weeks of storage period, 3 of
which includes exposure to NaOH solution, the average expansion of G-B concrete exceeded
0.10 percent limit and average compressive strength of G-B concrete was determined as 45.1
MPa. The loss percentage in compressive strength for control concrete, G-C concrete, which
was cured in water at 20 0
C and tested in the same way as the ASR-affected concretes was
obtained as 14.1. It can be clearly noticed from previous data that loss percentage in
compressive strength increases with expansion and is controlled by the rate and size of
detrimental reactivity. While the losses of 7.6 percent and 14.1 percent could be thought
directly proportional with the expansion percentage 0.0422 and 0.1010, respectively, the loss
rate in compressive strength slightly decreased. The specimens of G-B concrete were tested
nearly 11 weeks after completion of the tests of G-A and G-C concretes. Therefore,
continuum of the hydration of cement that provided some avail effects on strength may be
reason for the decrease in the loss rate in compressive strength. From the results in Table 5.2
and 5.3, it is seen that the compressive strength test on cylindrical specimens gave results in
parallel with cube specimens. The expansion in cylindrical specimens for G-A concrete
exceeded the limit of 0.04 percent at the end of 8th week which is 2 weeks after the cube
specimens. Likewise in the first limit, a week later than cube specimens appeared in G-B
concrete for reaching the second limit of 0.10 percent, the expansion in cylindrical
specimens for G-B exceeded the second limit at the end of 18th week. At the expansion of
0.0402 percent in G-A concrete and 0.1002 percent in G-B concrete, the values of average
compressive strength were found as 37.1 MPa and 35.6 MPa, respectively. Considering the
value of average compressive strength of G-C concrete determined as nearly 40.7 MPa, the
loss percentages for G-A concrete and G-B concrete were 8.9 and 12.5, respectively.
The difference between the loss percentages of cube and cylindrical specimens can be
ignored but at the end of test, the loss percentage in cylinder specimens of G-B concrete
(12.5 MPa) was less than that in cube specimens (14.1 MPa). This result may be related to
the longer hydration period of cylindrical specimens. However, it is a fact that compressive
strength for all specimens was negatively affected by ASR expansion. Moreover, with time,
while the hydration of cement reduced the loss in compression strength for all specimens
against ASR expansion, it did not seem to inhibit extension of crack pattern. Therefore, a
recovery in strength was not able to be observed, the compressive strength fell again at the
end of test though at a slower pace.

72
Table 5.1 Expansion and compressive strength of all concretes for cube specimens
G-A Concrete
Age, weeks
Time elapsed at 60 0 C and 100 % RH at 60
0 C and NaOH
2 3 4 6 8 10 12 14 15 16 17
Expansion %
1 0.0163 0.0224 0.0343 0.0417 --- --- --- --- --- --- ---
2 0.0165 0.0247 0.0337 0.0423 --- --- --- --- --- --- ---
3 0.0173 0.0253 0.0345 0.0427 --- --- --- --- --- --- ---
Av. 0.0167 0.0241 0.0342 0.0422 --- --- --- --- --- --- ---
Compressive strength (MPa) Av. --- --- --- 48.5 --- --- --- --- --- --- ---
G-B Concrete
Expansion % 1 0.0175 0.0257 0.0337 0.0423 0.0497 0.0569 0.0594 0.0615 0.0789 0.0916 0.1006
2 0.0145 0.0233 0.0325 0.0425 0.0495 0.0566 0.0597 0.0622 0.0803 0.0920 0.1011
3 0.0163 0.0265 0.0367 0.0437 0.0513 0.0573 0.0604 0.0628 0.0806 0.0926 0.1013
Av. 0.0161 0.0252 0.0343 0.0428 0.0502 0.0569 0.0598 0.0622 0.0799 0.0921 0.1010
Compressive strength (MPa) Av. --- --- --- --- --- --- --- --- --- ---
45.1
G-C Concrete in water at 20 0 C
Compressive strength (MPa) Av. --- --- --- 52.4 --- --- --- --- --- --- ---
72

73
Table 5.2 Expansion and compressive strength of all concretes for cylindrical specimens
G-A Concrete
Time elapsed at 60 0 C and 100 % RH at 60
0 C and NaOH
Age, weeks
2 3 4 6 8 10 12 14 15 16 17 18
Expansion %
1 0.0140 0.0215 0.0295 0.0370 0.0415 --- --- --- --- --- --- ---
2 0.0150 0.0205 0.0280 0.0360 0.0400 --- --- --- --- --- --- ---
3 0.0140 0.0215 0.0305 0.0350 0.0390 --- --- --- --- --- --- ---
Av. 0.0143 0.0212 0.0293 0.0360 0.0402 --- --- --- --- --- --- ---
Compressive strength
(MPa) Av. --- --- --- --- 37.1 --- --- --- --- --- --- ---
G-B Concrete
Expansion %
1 0.0130 0.0210 0.0290 0.0360 0.0410 0.0455 0.0500 0.0525 0.0700 0.0850 0.0920 0.1025
2 0.0135 0.0195 0.0280 0.0350 0.0390 0.0435 0.0490 0.0505 0.0690 0.0810 0.0910 0.0990
3 0.0150 0.0185 0.0275 0.0335 0.0380 0.0430 0.0485 0.0505 0.0695 0.0795 0.0900 0.0990
Av. 0.0138 0.0197 0.0282 0.0348 0.0393 0.0440 0.0492 0.0512 0.0695 0.0818 0.0910 0.1002
Compressive strength
(MPa) Av. --- --- --- --- --- --- --- --- --- --- --- 35.6
G-C Concrete in water at 20 0 C
Compressive strength
(MPa) Av. --- --- --- --- 40.7 --- --- --- --- --- --- ---
73

74
Table 5.3 Loss in compressive strength of ASR-affected concrete comparing with control
concrete
Cube Specimens Age, weeks
Concrete 6 8 17 18
Expansion % G-A 0.0422 --- --- ---
G-B 0.0428 0.0502 0.1010 ---
Compressive strength
(MPa)
G-A 48.5 --- --- ---
G-B --- --- 45.1 ---
G-C 52.4 --- --- ---
Loss in Compressive
Strength (%)
G-A --- --- --- ---
G-B 7.6 --- 14.1 ---
Cylindrical
Specimens
Expansion % G-A 0.0360 0.0402 --- ---
G-B 0.0348 0.0393 0.0910 0.1002
Compressive strength
(MPa)
G-A --- 37.1 --- ---
G-B --- --- --- 35.6
G-C --- 40.7 --- ---
Loss in Compressive
Strength (%)
G-A --- 8.9 --- ---
G-B --- -- --- 12.5
5.3 Effect of ASR Expansion on Flexural Strength of Concrete
The specimens cast with prismatic moulds, 285x80x80 mm in size, were used for
investigating the ASR expansion effect on flexural strength of concrete. In this experimental
study, all processes of specimen preparation were carried out by complying with the
provisions in RILEM TC 219-ACS and ASTM C78/C78M- 10. Limestone was used as non-
reactive and coarse aggregate and also natural river sand was used as fine and moderately
reactive aggregate. The results of the expansion rate for prismatic specimens of ASR-
affected concretes are given in Figure 5.3 and Figure 5.4 as a graph and also the results of
flexural strength and the loss percentage in them with expansion are given in Table 5.4. The
loss percentages in flexural strength of ASR-affected concrete were calculated by comparing
with that of control concrete.
The expansion in prismatic specimens initially stored at 60 0
C and 100 % RH for formation
of ASR exceeded the first expansion limit of 0.04 percent in 6 weeks and so the specimens
of G-A concrete with expansion of 0.0461 percent were tested for flexural strength. In Table
5.4, the average flexural strength of the specimens of G-C concrete cured in water at 20 0
C
for 6 weeks was determined as 4.5 MPa by using related test method. As for the test result
for G-A concrete, the value of average flexural strength was found as 3.50 MPa and loss
percentage in flexural strength was calculated as 22.4. This loss value signed a sharp drop in
flexural strength when the expansion exceeded 0.04 percent. As seen in Figure 5.5, deep

75
cracks from ASR are the most important factor to lead significant loss in flexural strength of
concrete.
Figure 5.3 Expansion of G-A concrete for prismatic specimens with time
Figure 5.4 Expansion of G-B concrete for prismatic specimens with time
Before starting to flexural strength test on the prismatic specimens of G-B concrete, the
second expansion limit, 0.10 percent, was tried to be provided but the expansion of the these
prismatic almost came to a halt point in expansion of nearly 0.07 percent even though they

76
had been exposed to ASR at 60 0
C and 100 % RH for 14 weeks. Therefore, the specimens
were necessarily kept in 1 molar NaOH solution for 2 weeks to reach 0.10 percent
expansion. It is noted that on G-B concrete samples, with increasing expansion, cracks on
the surface were observed as more clear and deeper than that of G-A concrete (Figure 5.5).
Naturally, the loss percentage in flexural strength increased sharply when the expansion was
0.1060 percent. The average flexural strength of G-A concrete was found as 2.5 MPa and the
value of loss percentage in flexural strength of G-B concrete was 45.5 as comparing with
that of control concrete, G-C concrete. The loss of 45.5 percent in flexural strength was a
serious risk to cause much deterioration of concrete structures.
By evaluating the data in Table 5.3 and 5.4, it was deduced that flexural strength is far more
sensitive to the detrimental effects of ASR expansion such as internal stresses and cracking
than compressive strength. As expansion reached a value more than 0.04 percent, the
prismatic specimens experienced a loss of 22.4 percent in flexural strength, whereas the loss
in compressive strength for cube and cylindrical specimens was 7.6 and 8.9 percent,
respectively. With increasing expansion, the difference between the loss in flexural and
compressive strength grew widely that at expansion value of over 0.10 percent, the loss in
flexural strength of the prismatic specimens reached 45.5 percent; on the other hand, the loss
in compressive strength was sequentially 14.1 and 12.5 percent for cube and cylindrical
specimens. From the results, it is observed that ASR causing cracks and internal stresses
formed in concrete structure showed detrimental effect more significantly on flexural
strength of concrete.
Figure 5.5 Prismatic specimens of G-C, G-A, and G-B concretes respectively

77
Table 5.4 Loss in compressive strength of ASR-affected concrete with expansion
G-B Concrete Time elapsed at 60
0 C and 100 % RH at 60
0 C and NaOH
Age,weeks
2 3 4 6 8 10 12 14 15 16
Expansion %
1 0.0180 0.0302 0.0361 0.0439 --- --- --- --- --- ---
2 0.0185 0.0270 0.0386 0.0474 --- --- --- --- --- ---
3 0.0170 0.0281 0.0411 0.0470 --- --- --- --- --- ---
Av. 0.0178 0.0284 0.0386 0.0461 --- --- --- --- --- ---
Flexural
strength (MPa) Av. 3.5 --- --- --- --- --- ---
Loss in Flexural Strength
(%) Av. 22.4 --- --- --- --- --- ---
G-B Concrete
Expansion %
1 0.0193 0.0284 0.0407 0.0470 0.0551 0.0565 0.0674 0.0698 0.0888 0.1063
2 0.0175 0.0302 0.0372 0.0467 0.0533 0.0670 0.0625 0.0656 0.0874 0.1049
3 0.0182 0.0309 0.0389 0.0488 0.0589 0.0649 0.0698 0.0716 0.0895 0.1067
Av. 0.0184 0.0298 0.0389 0.0475 0.0558 0.0628 0.0665 0.0690 0.0885 0.1060
Flexural strength (MPa) Av. --- --- --- --- --- --- --- --- --- 2.5
Loss in Flexural Strength
(%) --- --- --- --- --- --- --- --- --- 45.5
G-C Concrete in water at 20
0 C
Flexural strength (MPa) Av. --- --- --- 4.5 --- --- --- --- --- ---
77
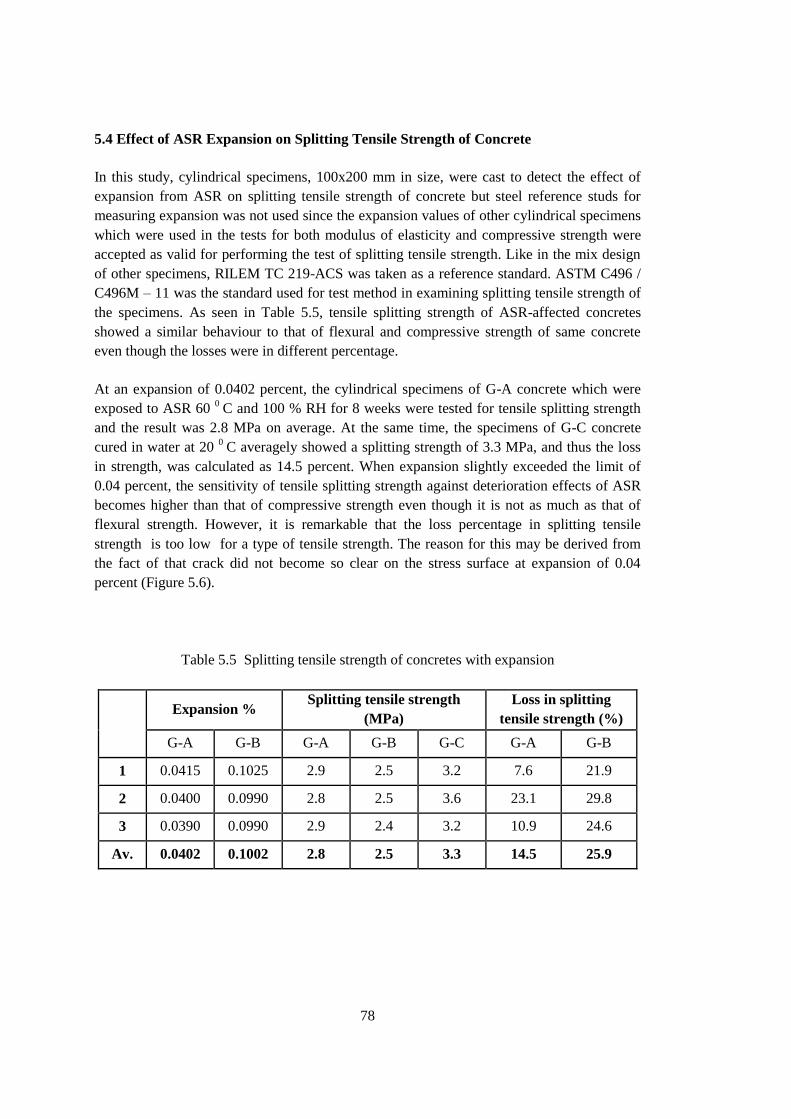
78
5.4 Effect of ASR Expansion on Splitting Tensile Strength of Concrete
In this study, cylindrical specimens, 100x200 mm in size, were cast to detect the effect of
expansion from ASR on splitting tensile strength of concrete but steel reference studs for
measuring expansion was not used since the expansion values of other cylindrical specimens
which were used in the tests for both modulus of elasticity and compressive strength were
accepted as valid for performing the test of splitting tensile strength. Like in the mix design
of other specimens, RILEM TC 219-ACS was taken as a reference standard. ASTM C496 /
C496M – 11 was the standard used for test method in examining splitting tensile strength of
the specimens. As seen in Table 5.5, tensile splitting strength of ASR-affected concretes
showed a similar behaviour to that of flexural and compressive strength of same concrete
even though the losses were in different percentage.
At an expansion of 0.0402 percent, the cylindrical specimens of G-A concrete which were
exposed to ASR 60 0
C and 100 % RH for 8 weeks were tested for tensile splitting strength
and the result was 2.8 MPa on average. At the same time, the specimens of G-C concrete
cured in water at 20 0
C averagely showed a splitting strength of 3.3 MPa, and thus the loss
in strength, was calculated as 14.5 percent. When expansion slightly exceeded the limit of
0.04 percent, the sensitivity of tensile splitting strength against deterioration effects of ASR
becomes higher than that of compressive strength even though it is not as much as that of
flexural strength. However, it is remarkable that the loss percentage in splitting tensile
strength is too low for a type of tensile strength. The reason for this may be derived from
the fact of that crack did not become so clear on the stress surface at expansion of 0.04
percent (Figure 5.6).
Table 5.5 Splitting tensile strength of concretes with expansion
Expansion %
Splitting tensile strength
(MPa)
Loss in splitting
tensile strength (%)
G-A G-B G-A G-B G-C G-A G-B
1 0.0415 0.1025 2.9 2.5 3.2 7.6 21.9
2 0.0400 0.0990 2.8 2.5 3.6 23.1 29.8
3 0.0390 0.0990 2.9 2.4 3.2 10.9 24.6
Av. 0.0402 0.1002 2.8 2.5 3.3 14.5 25.9
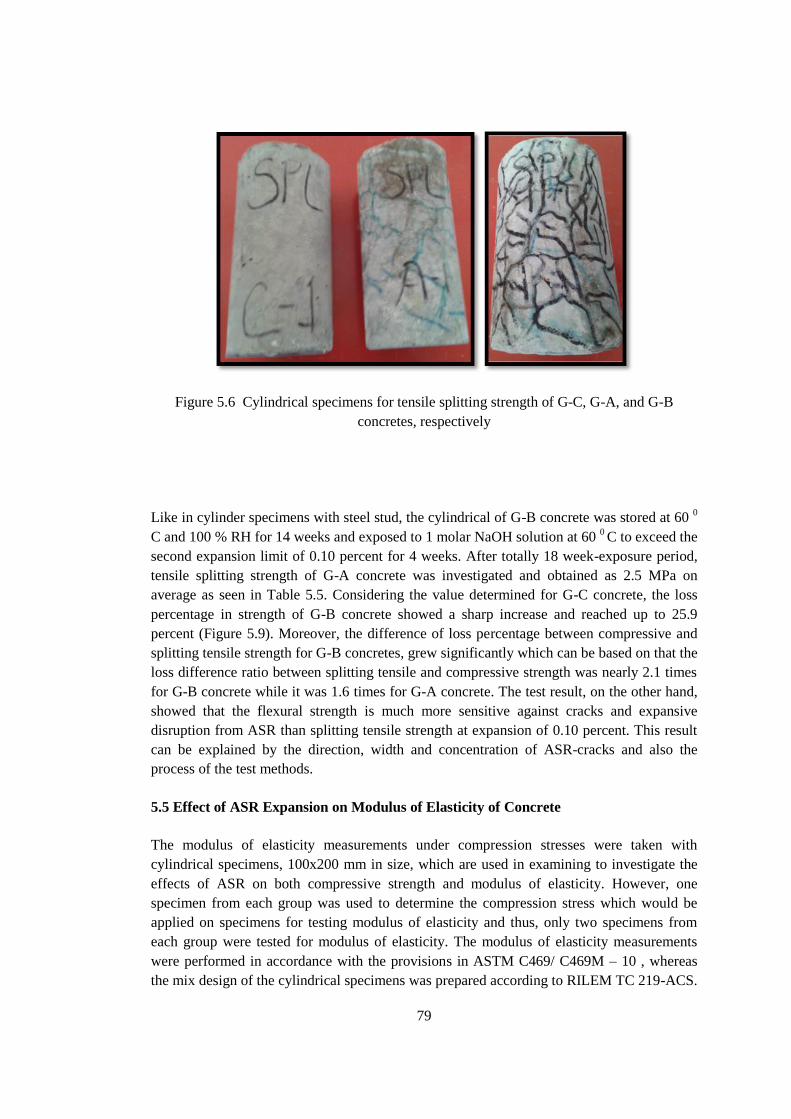
79
Figure 5.6 Cylindrical specimens for tensile splitting strength of G-C, G-A, and G-B
concretes, respectively
Like in cylinder specimens with steel stud, the cylindrical of G-B concrete was stored at 60 0
C and 100 % RH for 14 weeks and exposed to 1 molar NaOH solution at 60 0 C to exceed the
second expansion limit of 0.10 percent for 4 weeks. After totally 18 week-exposure period,
tensile splitting strength of G-A concrete was investigated and obtained as 2.5 MPa on
average as seen in Table 5.5. Considering the value determined for G-C concrete, the loss
percentage in strength of G-B concrete showed a sharp increase and reached up to 25.9
percent (Figure 5.9). Moreover, the difference of loss percentage between compressive and
splitting tensile strength for G-B concretes, grew significantly which can be based on that the
loss difference ratio between splitting tensile and compressive strength was nearly 2.1 times
for G-B concrete while it was 1.6 times for G-A concrete. The test result, on the other hand,
showed that the flexural strength is much more sensitive against cracks and expansive
disruption from ASR than splitting tensile strength at expansion of 0.10 percent. This result
can be explained by the direction, width and concentration of ASR-cracks and also the
process of the test methods.
5.5 Effect of ASR Expansion on Modulus of Elasticity of Concrete
The modulus of elasticity measurements under compression stresses were taken with
cylindrical specimens, 100x200 mm in size, which are used in examining to investigate the
effects of ASR on both compressive strength and modulus of elasticity. However, one
specimen from each group was used to determine the compression stress which would be
applied on specimens for testing modulus of elasticity and thus, only two specimens from
each group were tested for modulus of elasticity. The modulus of elasticity measurements
were performed in accordance with the provisions in ASTM C469/ C469M – 10 , whereas
the mix design of the cylindrical specimens was prepared according to RILEM TC 219-ACS.

80
Figures 5.1 and 5.2 graphically show the expansion values of ASR-affected concretes and
also Table 5.1 numerically gives the expansion of ASR-affected concretes.
The modulus of elasticity under compression were carried out on the cylindrical specimens
of G-A concrete which were exposed to ASR at 60 0
C and 100 % RH for 8 weeks when
expansion exceeded the limit of 0.04 percent. Like in other test, the specimens of G-C cured
in water at 20 0
C were tested for modulus elasticity at the same time these of G-A were
tested. As seen in Table 5.6, the average modulus of elasticity of G-A concrete and G-C
concrete was found as 27.5 and 35.0 GPa, respectively. From these values, the loss
percentage in elasticity was 21.3 percent that was a dramatic value. In the first process, these
results affirm that modulus of elasticity shows a very high sensitivity against ASR causing
the changes in the structure of deteriorating concrete. In other words, visible cracks (Figure
5.7) from ASR showed seriously negative effects on elasticity of concrete. Considering G-A
concretes, the sensitivity of elasticity is very higher than those of compressive strength and
splitting tensile strength and almost as much as that of flexural strength.
After 14-weeks exposure of ASR at 60 0
C and 100 % RH and 4-weeks exposure of NaOH
solution at 60 0
C, the specimens of G-B concrete were tested to investigate the change in
modulus of elasticity of concrete when expansion exceeded the limit of 0.10 percent. In this
process, data shown in Table 5.6, confirms that modulus of elasticity exhibited a pattern of
behaviour similar to especially flexural strength. The average modulus of elasticity was
found as 22.4 GPa and the loss percentage reached up to 35.9 percent. Like in G-A
concretes, modulus of elasticity is more sensitive to detrimental effects of ASR than
compressive and tensile splitting strength. Modulus of elasticity was defined as sensitive
nearly as much as flexural strength for G-A concretes since the difference between their loss
percentages was only 1.1 percent. However, flexural strength is much more sensitive to ASR
for G-B concretes than modulus of elasticity due to extent of difference between their loss
percentages showing a sharp increase and calculated as 9.6 percent. This could be dependent
on the fact that ASR-crack being more clear and deeper with expansion caused a greater
detrimental effect on the flexural strength.
In general, like other properties, the speed and extent of loss in modulus of elasticity are
affected by the type of reactive aggregate and its reactivity. The detrimental effect of the
ASR which was an expansive reactivity and hydration of the cement paste can be seen as
main factors of rate of change in structural and physical properties of the ASR-affected
concrete.

81
Table 5.6 Modulus of elasticity of concretes with expansion
Expansion %
Modulus of elasticity
(GPa)
Loss in modulus
of elasticity (%)
G-A G-B G-A G-B G-C G-A G-B
1 0.0415 0.1025 -- -- -- -- --
2 0.0400 0.0990 28.2 21.7 33.6 16.2 35.3
3 0.0390 0.0990 26.9 23.1 36.3 26.0 36.5
Av. 0.0402 0.1002 27.5 22.4 35.0 21.3 35.9
Figure 5.7 Cylindrical specimens for modulus of elasticity of G-A, G-C, and G-B concretes,
respectively
5.6 Effect of ASR Expansion on Pullout Strength of Concrete
In this experimental study ASTM C900-13 was selected as the application method for
performing pullout strength test. However, this method was not able to be completely
applied because of absence of a specific metal to be inserted into fresh concrete required by
the related standard. Instead of this, a 10 mm-ribbed reinforcement was embedded into fresh
concrete cast with cubic moulds, 150x150x150 mm in size, to examine the effect of ASR on
pullout strength of concrete. Like in other specimens, the cube specimens were prepared in
accordance with the mix design procedure in RILEM TC 219-ACS. The expansion
measurement was not performed in these specimens but pullout strength on these cube

82
specimens was examined by taking the expansion of the cube specimens used in compressive
strength test as reference values.
When the expansion was accepted to exceed the limit of 0.04 percent, the cube specimens of
G-A concrete which were exposed to ASR at 60 0C and 100 % RH for 6 weeks were tested
for pullout strength test to investigate ASR effect. From test results, the average pull strength
of G-A concrete was obtained as 3.3 MPa whereas that of G-C concrete was 3.6 MPa. As
seen in Table 5.7, the loss percentage calculated in pullout strength for first group specimens
was 7.0. The result confirms that pullout strength of concrete has more resistance to
detrimental effects of ASR among the other properties of concrete. When compared to the
loss percentages of G-A concretes for compressive strength, flexural strength, splitting
tensile strength and modulus of elasticity were 7.6, 22.4, 14.5 and 21.3 percent, it is
interesting to obtain 7.0 percent for pullout strength (Table 5.8). The reason for the
sensitivity of pullout strength to ASR being very low could be that thin crack formed at
expansion of about 0.04 percent did not sufficiently disrupt the inter bond between the
aggregate and cement paste providing the ribbed steel to hold into concrete.
Figure 5.8 Cube specimens for pullout strength of G-A, G-C, and G-B concretes,
respectively
Table 5.7 Pullout strength of concretes with expansion
Expansion %
Pullout strength
(MPa)
Loss in
Pullout strength (%)
G-A G-B G-A G-B G-C G-A G-B
1 0.0417 0.1006 3.5 2.6 3.6 2.1 26.4
2 0.0423 0.1011 3.3 2.8 3.7 10.1 24.0
3 0.0427 0.1013 3.2 2.8 3.5 8.6 20.3
Av. 0.0422 0.1002 3.3 2.8 3.6 7.0 23.6

83
At the second process, the specimens of G-B concrete were tested for pullout strength after
14 weeks of exposure to ASR at 60 0C and 100 % RH and also 3 weeks exposure of NaOH
solution at 60 0C by considering the expansion of the cube specimens for compressive
strength a reference. As seen in Figure 5.6, when expansion value exceeded the limit of 0.10
percent, cracks from ASR started to become clearer, thicker and intensive. From the test
result, average pullout strength of G-A concrete was obtained as 2.8 MPa that indicated a
loss of 23.6 percent (Table 5.8). When comparing all mechanical properties of concrete,
pullout strength is more sensitive than compressive strength and nearly sensitive as much as
splitting tensile strength but less sensitive than flexural strength, modulus of elasticity at
expansion more than 0.10 percent. On the other hand, it should be mentioned result that the
proportional variation in pullout strength between at expansion more than 0.04 and 0.10
percent is the highest among all other mechanical properties. As seen graphically in Table
5.8, the proportional variations in pullout, flexural, splitting tensile, compressive strength,
and modulus of elasticity are 3.4, 2.0, 1.9, 1.8 and 1.7 respectively. This could be attributed
to the fact that ASR cracks, which became clearer, thicker and more intensive at expansion
of more than 0.10 percent, seemed to deteriorate significantly the inter bond between
aggregate and cement paste providing concrete strength to grasp the ribbed steel.
Table 5.8 Loss percentages in mechanical properties of concrete
Test
Loss (%)
Proportional
variation
Expansion over 0.04
percent
(G-A Concrete)
Expansion over
0.10 percent
(G-B Concrete)
Compressive Strength
(Cube/Cylinder)
7.6/8.9
14.1/12.5 1.9/1.4
Flexural Strength 22.4 45.5 2.0
Splitting Tensile
Strength 14.5 25.9 1.8
Modulus of Elasticity 21.3 35.9 1.7
Pullout Strength 7.0 23.6 3.4
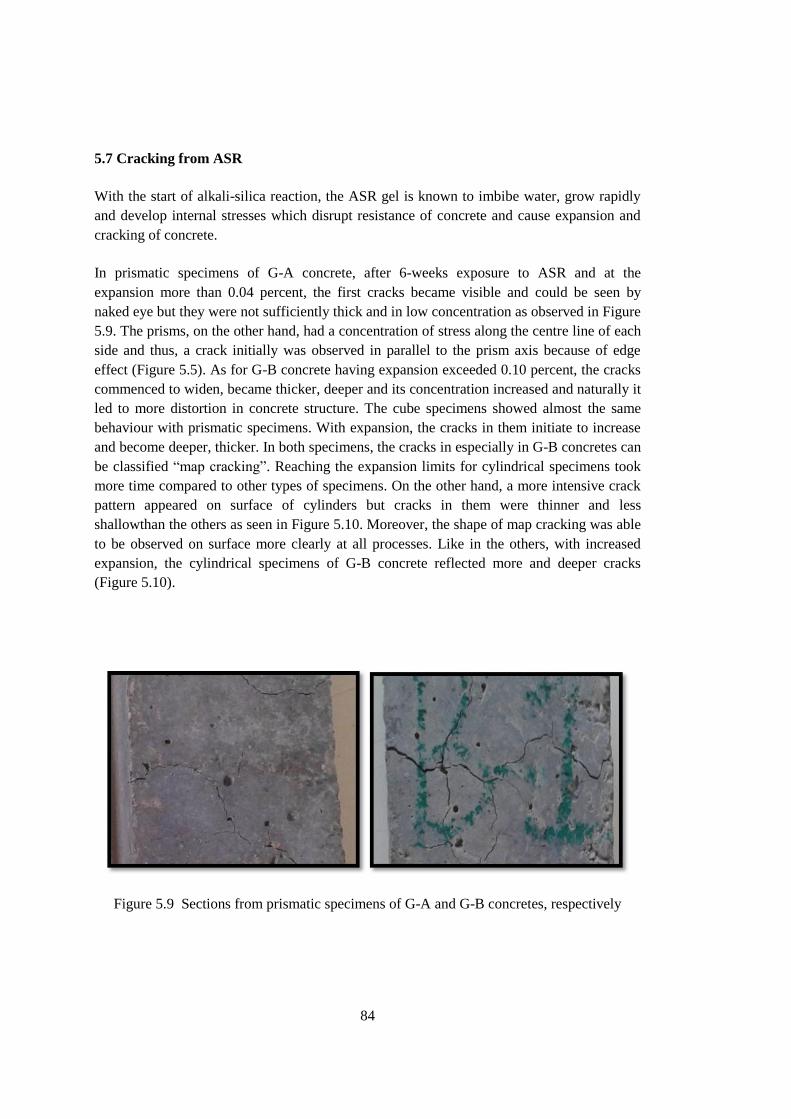
84
5.7 Cracking from ASR
With the start of alkali-silica reaction, the ASR gel is known to imbibe water, grow rapidly
and develop internal stresses which disrupt resistance of concrete and cause expansion and
cracking of concrete.
In prismatic specimens of G-A concrete, after 6-weeks exposure to ASR and at the
expansion more than 0.04 percent, the first cracks became visible and could be seen by
naked eye but they were not sufficiently thick and in low concentration as observed in Figure
5.9. The prisms, on the other hand, had a concentration of stress along the centre line of each
side and thus, a crack initially was observed in parallel to the prism axis because of edge
effect (Figure 5.5). As for G-B concrete having expansion exceeded 0.10 percent, the cracks
commenced to widen, became thicker, deeper and its concentration increased and naturally it
led to more distortion in concrete structure. The cube specimens showed almost the same
behaviour with prismatic specimens. With expansion, the cracks in them initiate to increase
and become deeper, thicker. In both specimens, the cracks in especially in G-B concretes can
be classified “map cracking”. Reaching the expansion limits for cylindrical specimens took
more time compared to other types of specimens. On the other hand, a more intensive crack
pattern appeared on surface of cylinders but cracks in them were thinner and less
shallowthan the others as seen in Figure 5.10. Moreover, the shape of map cracking was able
to be observed on surface more clearly at all processes. Like in the others, with increased
expansion, the cylindrical specimens of G-B concrete reflected more and deeper cracks
(Figure 5.10).
Figure 5.9 Sections from prismatic specimens of G-A and G-B concretes, respectively

85
Figure 5.10 Sections from cylindrical specimens of G-A and G-B concretes, respectively
5.7 Impact of Type of Specimen on ASR Expansion
Expansion measurement is a basic method to monitor the physical progress of the alkali-
silica reaction. In this study, reference steel studs were installed into the mid-points of the
end faces of the prisms, and the cylinders. They are placed on two surfaces of cube
specimens to measure longitudinal expansion. Expansion measurement gave different results
for each type of specimens and so the specimens exceeded the expansion limits required to
perform the tests at different times. The expansion of G-A and G-B concretes for all types of
specimens are plotted against time in Figures 5.11 and 5.12, respectively.
Among all types of specimens of G-A concrete, prisms and cubes which were exposed to
ASR at 60 0
C and 100 % RH exceeded the first expansion limit of 0.04 percent in 6 weeks
but cylinders did that in 8 weeks. During the test period, expansion was at different rate for
all types of specimens. Evaluation of expansion values were done step by step for G-B
concretes because the same mixes were used in both G-A and G-B concrete, after all the
results expansion of them showed a very similar behaviour as seen in related figures.

86
Figure 5.11 Expansion of G-A concretes for all types of specimens with time
Figure 5.12 Expansion of G-B concretes for all types of specimens with time
Table 5.9 gives comparatively the results of expansion for three types of specimens with
time. From taking the first measurement of expansion at the end of 2nd
week of cast, the
results showed that the highest speed of expansion among three types of specimens was
determined in prisms with an expansion of 0.0184 percent and the lowest one was in
cylinders with an expansion of 0.0138. As for the expansion in cubes, it was 0.0161 percent.
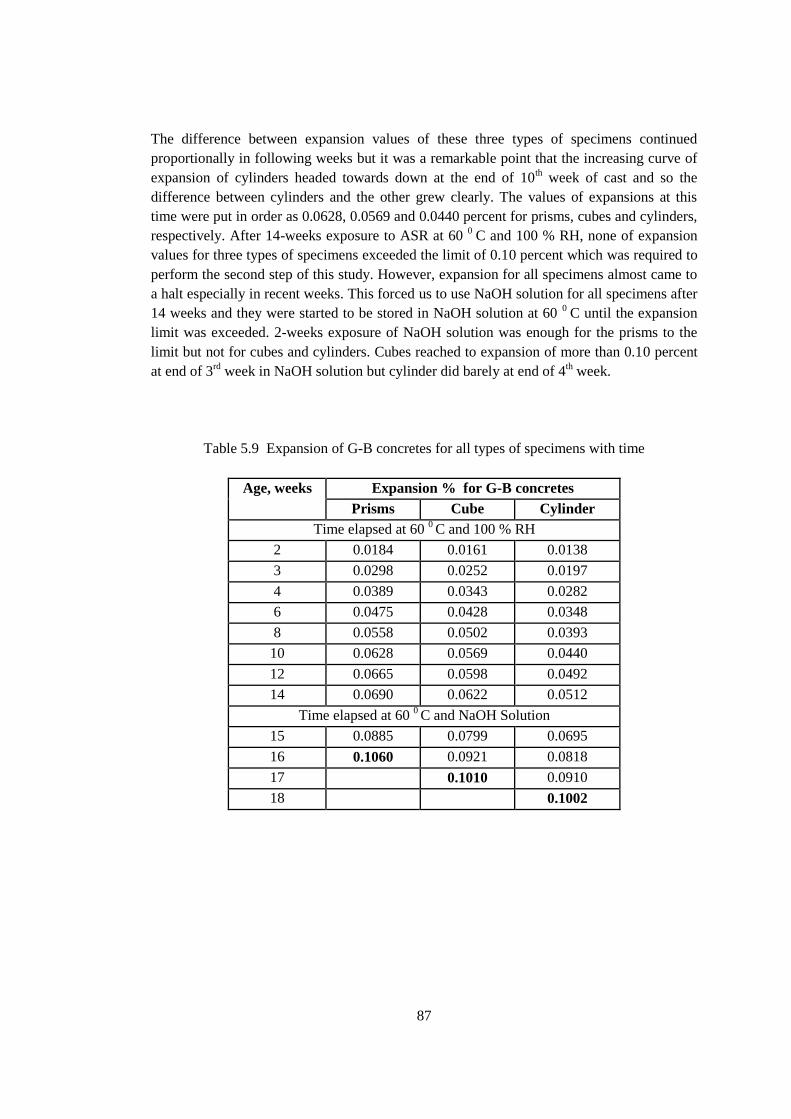
87
The difference between expansion values of these three types of specimens continued
proportionally in following weeks but it was a remarkable point that the increasing curve of
expansion of cylinders headed towards down at the end of 10th week of cast and so the
difference between cylinders and the other grew clearly. The values of expansions at this
time were put in order as 0.0628, 0.0569 and 0.0440 percent for prisms, cubes and cylinders,
respectively. After 14-weeks exposure to ASR at 60 0
C and 100 % RH, none of expansion
values for three types of specimens exceeded the limit of 0.10 percent which was required to
perform the second step of this study. However, expansion for all specimens almost came to
a halt especially in recent weeks. This forced us to use NaOH solution for all specimens after
14 weeks and they were started to be stored in NaOH solution at 60 0
C until the expansion
limit was exceeded. 2-weeks exposure of NaOH solution was enough for the prisms to the
limit but not for cubes and cylinders. Cubes reached to expansion of more than 0.10 percent
at end of 3rd
week in NaOH solution but cylinder did barely at end of 4th week.
Table 5.9 Expansion of G-B concretes for all types of specimens with time
Age, weeks Expansion % for G-B concretes
Prisms Cube Cylinder
Time elapsed at 60 0 C and 100 % RH
2 0.0184 0.0161 0.0138
3 0.0298 0.0252 0.0197
4 0.0389 0.0343 0.0282
6 0.0475 0.0428 0.0348
8 0.0558 0.0502 0.0393
10 0.0628 0.0569 0.0440
12 0.0665 0.0598 0.0492
14 0.0690 0.0622 0.0512
Time elapsed at 60 0 C and NaOH Solution
15 0.0885 0.0799 0.0695
16 0.1060 0.0921 0.0818
17 0.1010 0.0910
18 0.1002

88

89
CHAPTER 6
CONCLUSIONS
In this study, effect of ASR expansion on certain mechanical properties of concrete which
are compressive, flexural, splitting tensile, pullout strength and modulus of elasticity, and the
impact of type of specimen on alkali-silica expansion were investigated. Two main concrete
prism methods, ASTM C1293 and Canadian CSA–A23.2-14A, describe aggregates causing
expansion of more than 0.04 percent in concrete as potentially deleteriously reactive.
Therefore, how this expansion amount affects mechanical properties were tested due to
experimental studies performed on the specimens which were prism, cube and cylinder in
specified dimension and also the same tests on the specimens with expansion of more than
0.10 percent were performed. Coarse limestone and fine sand was used as non-reactive and
reactive aggregate, respectively. While mix design of all specimens was prepared according
to RILEM TC 219-ACS, the related test methods for each mechanical tests were separately
applied to examine the ASR effect and the conclusions obtained from this study can be
summarized as follows:
1) The compressive strength of G-A concrete for cube specimens for 6 weeks
decreases by 7.6 percent compared to G-C control concrete at expansion of more
than 0.04 percent. That of G-B concrete exposed to ASR and NaOH solution for
totally 17 weeks decreases by 14.1 percent. No significant loss in compressive
strength is observed in these specimens at any expansion so it can be concluded
that compressive strength is less sensitive against ASR and not a good indicator
of ASR.
2) The compressive strength of G-A concrete and G-B for cylindrical specimens
kept in same condition gives the results in the same direction but in different
rates. The losses in compressive strength for G-A and G-B concretes are 8.9 and
12.5 percent, respectively. The loss difference between G-A and G-B concretes
for cylindrical specimens is slightly lower than that for cube specimens. Based on
the results, compressive strength for cylindrical specimens is observed as less
sensitive than even that for cube specimens. Its sensitivity can be seen as the
lowest as considering the test results of other mechanical properties.
3) The flexural strength of concrete is said to have the highest sensitivity among
other mechanical properties based on the results. When the expansion exceeds
0.04 percent, the loss percentage in G-A concrete is obtained as 22.4 percent.
With increased expansion, more than 0.10 percent, that in G-B concrete reaches
to 45.5 percent. These values show that flexural strength is a reliable indicator of
ASR which deteriorates concrete structure.

90
4) The ASR causes losses of 14.5 and 25.9 percent in splitting tensile strength of G-
A and G-B concretes, respectively. Bearing in mind these losses, it can be
concluded that splitting tensile strength is acceptable as a good indicator to show
sound better effects of ASR for both expansion limits even though it is not as
much as flexural tensile strength.
5) At expansion of more than 0.04 percent, modulus of elasticity in G-A concrete
shows a loss of 21.3 percent that is a value nearly as much as flexural strength in
same group concrete. However, the loss percentage in G-B concrete doesn‟t
sharply increase unlike in flexural strength and it is calculated as 35.9 percent
when the expansion exceeds 0.10 percent. From the results, it is noticed that
modulus of elasticity is less sensitive to ASR than flexural strength, but it is more
sensitive than compressive, tensile splitting, and pullout strength of concrete.
6) Increasing expansion influences pullout strength of concrete much more than the
others while it is not very sensitive to ASR. As expansion exceeds 0.04 percent,
the loss in pullout strength of G-A concrete exposed to ASR for 6 weeks is
determined as 7.0 percent compared to G-C concrete. At the first stage, the result
shows that pullout strength has a maximum resistance to detrimental effects of
ASR. With increased expansion that exceeded 0.10 percent, the specimens
exhibit a significant loss of 21.8 percent. This sharp drop can be attributed to the
fact that ASR cracks which widen, become thicker and deeper with expansion
seemed to significantly deteriorate the bond between aggregate and cement paste
which provides strength concrete to grasp the ribbed steel.
7) ASR affects all these mechanical properties at different rates. Besides, the level
of losses in these properties is principally influenced by the extent of deleterious
expansion progressing from over 0.04 percent to 0.10 percent.
8) With expansion, cracks initiate to become visible and their concentration headed
to increase on surface of specimens. As expansion achieves high level, wider,
deeper and more intense cracks appeared on the surface. Especially in cylinders,
the pattern of map cracking that is main signal of ASR formation can be observed
on the specimens.
9) The expansion measurements confirm that the rate and extent of detrimental
expansion is directly affected by type of specimen. The prisms shows more
expansion at any time than cubes and cylinders so that they can reach the required
expansion limits to perform tests earliest among all. The cylinders shows more
resistance to expansion compared to prisms and cubes due to probably non-
angular structure and naturally their expansion takes more time to achieve the
limits.

91
CHAPTER 7
7. RECOMMENDATIONS
Alkali silica reaction is considered as one of the vital problems in the construction industry
because it starts to become visible much later the completion of construction. The principal
problem about ASR is that the progression of the reaction is not yet clearly understood and
doped out. Therefore, the reactivity of aggregate used in concrete should be examined well
before concrete production starts. If expansion from ASR reaches to threatening level,
mechanical properties of concrete are negatively affected and that causes deterioration of the
stability of the concrete structure. Besides, many studies have proven that ASR is an
important reason for unsafe structures and preventive measures to retard deleterious effect of
ASR on mechanical properties should be taken.
Bearing in mind the results drawn from these experimental studies, the following
recommendations will be avail for further research.
1) Mechanical properties were tested by the unreinforced specimens. They can be
performed by using longitudinal reinforcements. Moreover, the effect of
reinforcement on the crack pattern can be examined.
2) Natural river sand was used to increase the reactivity, but the required expansion
limits for mechanical test to exceed took plenty of time. Therefore, the specimens
could gain extra strength due to hydration of cement after 17-18 weeks exposure
of ASR. The specimens cast with the same materials can be exposed to ASR with
NaOH solution shortly after demoulding so that 28-day strength of the specimens
affected by ASR for 5 mechanical properties of concrete performed in these
experimental studies can be examined.
3) Mechanical tests might be carried out on more concrete with higher level of
expansion to obtained more definite conclusions. In order to provide higher level
of expansion, highly reactive aggregate can be added to the mix instead of
limestone used as coarse and non-reactive aggregate.
4) In this study, the effect of ASR on 5 mechanical properties of concrete mentioned
in previous part was investigated. In addition to them, the effect of ASR on direct
tensile strength, water absorption, permeability and pulse velocity of concrete
may be examined.
5) Besides, the effect of ASR on concrete which is cast mix design and exposed to
ASR in the same condition can be inspected in views of durability of concrete
such as freezing and thawing, salt scaling at same expansion values.

92
6) The effect of type of specimen on ASR expansion was examined by the
prisms, cubes and cylinders in different size and only longitudinal expansion on
them was measured. Especially in cylinders and prisms, lateral expansion can be
measured at higher levels of expansion.
93
REFERENCES
Ahmed, T., Burley, B., Rigden S., & Abu-Tair A.I. (2003). The Effect of Alkali Reactivity
on the Mechanical Properties of Concrete. Construction and Building Materials 17,
123–144.
ASTM C1260, Standard Test Method for Potential Alkali Reactivity of Aggregate (Mortar –
Bar Method), Annual Book of ASTM Standards, 2007.
ASTM C1293, Standard Test Method for Determination of Length Change of Concrete Due
to Alkali-Silica Reaction, Annual Book of ASTM Standards, 2009.
ASTM C150, Standard Specification for Portland Cement, Annual Book of ASTM Standards,
2009.
ASTM C227, Standard Test Method for Potential Alkali Reactivity of Cement-Aggregate
Combinations, Annual Book of ASTM Standards, 2010.
ASTM C289, Standard Test Method for Potential Alkali-Silica Reactivity of Aggregates
(Chemical Method), Annual Book of ASTM Standards, 2007.
ASTM C295, Standard Guide for Petrographic Examination of Aggregates for Concrete,
Annual Book of ASTM Standards, 2012.
ASTM C469, Standard Test Method for Static Modulus of Elasticity and Poisson‟s Ratio of
Concrete in Compression, Annual Book of ASTM Standards, 2010.
ASTM C496, Standard Test Method for Splitting Tensile Strength of Cylindrical Concrete
Specimens, Annual Book of ASTM Standards, 2011.
ASTM C78, Standard Test Method for Flexural Strength of Concrete (Using Simple Beam
with Third-Point Loading), Annual Book of ASTM Standards, 2010.
ASTM C856, Standard Practice for Petrographic Examination of Hardened Concrete, Annual
Book of ASTM Standards, 2011.
ASTM C900, Standard Test Method for Pullout Strength of Hardened Concrete, Annual
Book of ASTM Standards, 2013.
Bangert, F., Kuhl, D., & Meschke, G. (2004). Chemo-Hygromechanical Modelling and
Numerical Simulation of Concrete Deterioration Caused by Alkali-Silica Reaction.

94
International Journal for Numerical and Analytical Methods in Geomechanics 28,
689–714.
Beleszynski, R.F. & Thomas, M.D.A. (1998). Microstructural Studies of Alkali-Silica
Reaction in Fly Ash Concrete Immersed in Alkaline Solution, Advanced Cement
Based Materials 7, 66-78
Berube M.A, & Fournier. (1993). Canadian Experience with Testing for Alkali-Aggregate
reactivity in Concrete. Cement and Concrete Composites 15, 27-47.
Berube, M., & Fournier, B. (1992). Accelerated Test Methods for Alkali-Aggregate
Reactivity. V. Malhotra (ed.). Advances in Concrete Technology (p. 583-627).
CANMET.
Bektaş, F. (2002). Ms Thesis. Preventive Measures Against Alkali-Silica Reaction. Middle
East Technical University, Ankara, Turkey.
Blanks, R., & Kennedy, H. (1955). The Technology of Cement and Concrete. New York:
John Wiley & Sons.
Blight, G. E., & Alexander, M. G. (2011). Alkali-Aggregate Reaction and Structural Damage
to Concrete. Leiden, Netherlands: CRC Press.
BS 1881, Method of Determination of Static Modulus of Elasticity in Compression, Part 121,
1983.
BS 6319, Method for Measurement of Tensile Strength, Part7: Testing of Resin
Compositions for Use in Concrete, 1985.
BS EN 1230-6. Method for Determination of Tensile Splitting Strength: Making Test
cylinders from Fresh Concrete, 2000
BS EN 12390-3, Method of Determination of Compressive Strength of Concrete Cubes,
2000.
BS EN 12390-5. Method for Determination of Flexural Strength, 2000
Charlwood, R. G., & Solymar, Z. V. (1994). “A review of AAR in dams.” Dam Engineering
5, 31-62.
Clark, L. A. (1991). Modelling the structural effects of alkali-silica reactions on reinforced
concrete. ACI Material. Journal 88, 271-277.
Clayton, N., Currie K.J., Moss R.M. (1990). The Effect of Alkali Silica Reaction on The
Strength of Pre-Stressed Concrete Beams. Engineering Structures 15,287 –92.
95
Cope R.J & Slade, L. (1992). Effect of AAR on Shear Capacity of Beams, Without Shear
Reinforcement. 9th International Conference on AAR in Concrete, London, UK, 184
CSA A23.2-14A. Potential Expansivity of Aggregates Due to AAR in Concrete Prisms,
Canadian Standards Association, 1994
Doran, D.K. (1992). Structural Effects of Alkali Aggregate Reaction. The Institution of
Structural Engineer, London.
Duschesne, J. & Berube, M.A. (2001). Long-term effectiveness of Supplementary
Cementing Materials Against Alkali-Silica Reaction, Cement and Concrete Research
31, 1057-1063
Fan, S. &Hanson, J.M. (1998). Effect of Alkali Silica Reaction Expansion and Cracking on
Structural Behaviour of Reinforced Concrete Beams. ACI Structural Journal 95,
498-505
FHWA. (2003). Chapter 2 Alkali-Silica Reaction. Guidelines for the Use of Lithium to
Mitigate or Prevent Alkali-Silica Reaction (ASR). Retrieved 2013-05-28.
FHWA. (2010). Alkali-Silica Reactivity (ASR) – Concrete – Pavements – FHWA. Alkali-
Silica Reactivity (ASR) Development and Deployment Program. Retrieved 2012-07-
28.
Fournier, B., Berube, M.A. & Rogers, C. (1999). Proposed Guidelines for the Prevention of
Alkali-Silica Reaction in New Structures (paper No.99-1176), Transportation
Research Record 1668, 48-53
Giaccio, G., Zerbino, R., Ponce, J.M. & Batic, O.R. (2008). Mechanical behaviour of
concretes damaged by alkali-silica reaction. Cement and Concrete Research 38,993-
1004.
Gillot, J.E. & Rogers, C.A. (1994). Alkali-Aggregate Reaction and Internal Release of
Alkalis, Magazine of Concrete Research 46, 99-112
Grattan-Bellew, P.E. (1994). Alkali Contribution from Limestone Aggregate to Pore
Solution of Old Concrete, ACI Materials Journal 91, 173-177
Hobbs, D. W. (1988). Alkali-silica reaction in concrete, Thomas Telford, London.
Hughes B.P. & Ash J.E. (1969) The Effect of Water-Gain on the Behaviour of Concrete in
Tension, Torsion and Compression. The Concrete Society. Technical paper PCS 54,.
Ichikawa, T. & Miura, M. (2007) Modified Model of Alkali-Silica Reaction. Cement and
Concrete Research 37, 1291–1297

96
Jones, A.E.K. & Clark, L.A. (1998). The effects of ASR on the properties of concrete and
the implications for assessment. Engineering Structures 20, 785-791
Jones, T.N., & Poole, A.B. (1987). Alkali-Silica Reaction in Several UK Concretes: The
Effect of Temperature and Humidity on Expansion, and the Significance of
Ettringite Development, Proceedings of 7th International Concference,1986, Ottowa,
Canada, P.E. Grattan-Bellew (ed.), Noyes Publications, New Jersey, USA, 446-450
Kodjo, A.S., Rivard, P., Cohen-Tenoudji, F. & Gallias JL. (2011). Impact of The Alkali–
Silica Reaction Products on Slow Dynamics Behaviour of Concrete. Cement and
Concrete Research 41, 422-428
Lea, F. (1970). The Chemistry of Cement and Concrete (Third Edition b.). Glasgow: Edward
Arnold (Publishers) Ldt.
Léger, P., Côté, P., & Tinawi, R. (1996). Finite-Element Analysis of Concrete Swelling Due
to Alkali-Aggregate Reactions in Dams. Computers & Structures 60(4), 601–611.
Marzouk, H. & Langdon S. (2003). The Effect of Alkali Aggregate Reactivity on the
Mechanical Properties of High and Normal Strength Concrete, Cement and Concrete
Composites 25, 549–556.
Mather, B. (1999). How to make concrete that will not suffer deleterious alkali-silica
reaction, Cement and Concrete Research 29, 1277-1280
Mehta, P., & Monteiro, M. (1999). Concrete: Microstructure, Properties, Materials. Indian
Concrete Institute.
Mindless, S., & Young, J. F. (1981). Concrete. New Jersey: Prentice Hall.
Monteiro, P.J.M., Shomglin, K., Wenk, H.R. & Hasparyk. (2001). Effect of Aggregate
Deformation on Alkali-Silica Reaction. ACI Material Journal 98, 179-183
Multon, S., & Toutlemonde, F. (2006). “Effect of Applied Stresses on Alkali-Silica
Reaction-Induced Expansions.” Cement Concrete Research 36, 912-920.
Multon, S., Seignol, J., & Toutlemonde, F. (2005). Structural behaviour o Concrete Beams
Affected by Alkali-Silica Reaction. ACI Material Journal 36, 67-76.
Musaoğlu, O. (2012). MS Thesis. Effect of Reinforcement and Pre-Stressing Force on ASR
Expansion. Middle East Technical University, Ankara, Turkey.
Neville, A. (1990). Properties of Concrete (Third Edition ). New York: Longman
Scientific and Technical.

97
Neville, A. (2000). Properties of Concrete, First Indian reprint. Pearson Education Asia
Ptc.Ltd.
Neville, A., & Brooks, J. (1987). Concrete Technology. Harlow, Essex: Longman Scientific
& Technical.
Page, C. L., & Page, M. M. (2007). Durability of concrete and cement composites.
Cambridge, UK: Woodhead Publishing Limited.
Pedneault, A. (1996). MS Thesis. Development of Testing and Analytical Procedures for the
Evaluation of the Residual Potential of Reaction, Expansion, and Deterioration of
Concrete Affected by ASR. Memoir, Laval University, Québec City, Canada, 133.
Popovics, S. (1992). Concrete Materials: Properties, Specifications and Testing. New
Jersey, USA: Noyes Publications.
Ramachandran (ed.), V.S. (1995). Concrete Admixture Handbook: Properties, Science, and
Technology, Second Edition, Noyes Publications, New Jersey, USA
RILEM TC 219-ACS, Detection of Potential Alkali-reactivity - Accelerated Method for
Testing Aggregate Combinations Using Concrete Prisms, Reunion Internationale des
Laboratoires et Experts des Materiaux, 2010.
Sargolzahi, M. (2009). PhD Thesis. Evaluation of Alkali-Silica Reaction Evolution in
Concrete Using Ultrasonic Tests. Sherbrooke University, Sherbrooke, Canada.
Skalny, J. P. (1989). Materials Science of Concrete I. Westerville: The American Ceramic
Society, Inc.
Smaoui, N., Berube, M.A., Fournier, B., Bissonnette, B., & Durand, B. (2005). Effects of
alkali addition on the mechanical properties and durability of concrete. Cement and
Concrete Research 35, 203- 212
Steffens, A., Li, K., and Coussy, O. (2003). Aging Approach to Water Effect on Alkali-Silica
Reaction Degradation of Structures. Journal of Engineering Mechanical 129 (1) ,
50-59.
Swamy, R. (1994). Alkali-Aggregate Reaction - The Bogeyman of Concrete. M. at Mohan,
Concrete Technology Past, Present, and Future (p. 105-124). Detroit: American
Concrete Institute.
Swamy, R. N. (1992). The Alkali-Silica Reaction in Concrete. Glasgow and London, UK:
Blackie and Son ltd.

98
Swamy, R.N. & Al-Asali, M.M. (1986). Influence of Alkali-Silica Reaction on Engineering
Properties of Concrete, ASTM Special Technical Publication A 930, 69-89.
Swamy, R.N. & Al-Asali, M.M. (1988). Engineering Properties of Concrete Affected by
Alkali-Silica Reaction, ACI Material Journal, 85-M41, 367-374.
Swenson, E.G. & Gillott, J.E. (1964). Alkali–carbonate rock reaction. Highway Research
Record 45: 21-40.
Thomas, M.D.A. (1996). Field Studies of Fly Ash Concrete Structures Containing reactive
aggregates, Magazine of Concrete Research 48, 265-279
TS EN 1097-2, Tests for mechanical and physical properties of aggregates - Part 2: Methods
for the determination of resistance to fragmentation, Turkish Standards Institution,
Ankara, 2010.
TS EN 1097-5, Tests for mechanical and physical properties of aggregates - Part 5:
Determination of the water content by drying in a ventilated oven, Turkish Standards
Institution, Ankara, 2009.
TS EN 1097-6, Tests for mechanical and physical properties of aggregates - Part 6:
Determination of particle density and water absorption, Turkish Standards
Institution, Ankara, 2002
TS EN 12390-3, Testing hardened concrete - Part 3: Compressive strength of test specimens,
Turkish Standards Institution, Ankara, 2010.
TS EN 197-1, Composition, Specifications and Conformity Criteria for Common Cements,
Turkish Standards Institution, Ankara, 2012
Ulm, F.J., Coussy, O., Li, K., & Larive, C. (2000). Thermo-Chemomechanics of ASR
Expansion in Concrete Structures.” Journal of Engineering Mechanical 126(3),
233-242.
Winter, B.N. (2007). Alkali Silica Reaction in Concrete, Understanding Cement, 119.
Woods, H. (1968). Durability of Concrete Construction. Michigan: American Concrete
Institute.