effect of aging on aluminum hydroxide complexes in dilute … · 2011-03-08 · effect of aging on...
TRANSCRIPT

Effect of Aging on Aluminum Hydroxide Complexes in Dilute Aqueous Solutions
GEOLOGICAL SURVEY WATER-SUPPLY PAPER 1827-D
Effect of Aging on Aluminum Hydroxide Complexes in Dilute Aqueous SolutionsBy R. W. SMITH and J. D. HEM
CHEMISTRY OF ALUMINUM IN NATURAL WATER
GEOLOGICAL SURVEY WATER-SUPPLY PAPER 1827-D
UNITED STATES GOVERNMENT PRINTING OFFICE, WASHINGTON : 1972
UNITED STATES DEPARTMENT OF THE INTERIOR
ROGERS C. B. MORTON, Secretary
GEOLOGICAL SURVEY
V. E. McKelvey, Director
Library of Congress catalog-card No. 79-189478
For sale by the Superintendent of Documents, U.S. Government Prlntim, OfficeWashington, D.C. 20402 - Price 40 cents (paper cover)
Stock Number 2401-2144

CONTENTS
Page
Abstract.__.._._.__..___._._..._....._....._....._..._._._..__..___ DlAcknowledgments.________________--___ _______-___-___-_______--_-- 1Purpose and scope.__________________________________________________ 2Experimental techniques.____________________________________________ 3Characteristics of Ala __________________________----_-__--______--___- 5Characteristics of Alb and Al°_ ________________________________________ 18Electron microscope observations...___________________________________ 26Effect of rate of addition of base on Alb ._______________________________ 28Approach of solutions to equilibrium...._______________________________ 32
Kinetics and structure of nonequilibrium species.___________________ 32Evaluation of aging process by nonequilibrium thermodynamics. _ _ _ _ _ _ 38
Calculation of the Gibbs free energy of the "face" and "edge" of gibbsite inequilibrium with its saturated solution.._____________________________ 42
Conclusions relative to aluminum in mildly acid aqueous media.__________ 49References. ___ ____-_______-______--___-____-__------__--__-------__- 50
ILLUSTRATIONS
Page
FIGURES 1-3. Graphs showing concentration of 1. Ala as a function of rn value.___________________ D62. Ala as a function of pH for solutions B-H at variour
aging times____________________.____________ 83. Ala+b as a function of pH at various aging times. __ 9
4-11. Graphs showing aging time effect on activity of monomeric species as a function of pH for
4. Solution B---_-----___------__---___-_------- 105. Solution C-------_---------------_----------- 116. Solution D_.___._____________________________ 127. Solution E--__--_______-__--___-_--_--------- 138. Solution F_____.___________-__--__-----__-_-- 149. Solution G_-_-_-_-_.-_-.-_-._-__--__-_-_-__-- 15
10. Solution H_ _________________________________ 1611. Solution J___________________________________- 17
12-18. Concentration of Alb and Al° as a function of pH and aging time for
12. Solution B___________________________________ 1913. Solution C-____,___________-_-_-_---_--_---_- 2014. Solution D______________________________-__-_ 2115. Solution E_.___._______-_-------_---_-----_-- 22
III

IV CONTENTS
Page
FIGURES 12-18. Concentration of Alb and Al c as a function of pH and aging time for Continued
16. Solution F.__________________________________ D2317. Solution G__-._.___----.--_...__________.____ 2418. Solution H____.____---.-_._.-__-.___.___.____ 25
19-22. Electron micrograph of microcrystalline gibbsite f-om 19. Solution F aged 2 years..___.._._..._.._____.__ 2620. Solution C aged 2 years..______________________ 2721. Solution E aged 2 years________________________ 2822. Solution J2 aged about 2 months._______________ 29
23-25. Graphs showing 23. Effect of length of time of adding base in p-eparing
solutions on amount of Alb formed.___________ 3024. First-order rate plot of Alb data from figure 23_._ _ 3125. Number of aluminum atoms as a functio^ of the
OH:Alb ratio of the Alb particle. ______________ 3426. Schematic representation of the ring structure formed by six
aluminum hydroxide octahedra.______________________ 3527. Sketch showing growth of polynuclear aluminum hydroxide 36
28-31. Graphs showing 28. Concentration of Alb residual as a function of aging
time for solutions D, E, F, G, and H_ __________ 3729. Advancement of the reaction (^Aib) as a function of
aging time for solutions D, E, F, G, and H_____ 4030. Reaction affinity as a function of reaction velocity
(d£A ib /<&)__ ________________________________ 4331. Relationship between the D dimension of the Alb
particles and the OH:Alb ratio of these particles.. 46
TABLES
TABLE 1. Concentrations of various types of aluminum in relation to age___ D42. Concentrations of monomeric aluminum (Ala)__________________ 53. Gibbs free energies of formation of monomeric aluminum snecies__ 54. Activity coefficients of monomeric species for ~10~2 ionic strength
solutions._______________________________________________ 75. Reaction affinities of solutions in relation to age________________ 396. Advancement of the reaction (^Aib) values and Alb residual values of
solutions in relation to age._______________________________ 397. Estimated order of aging reaction relative to Alb _ ______________ 428. OH: Alb ratios for Alb particles and corresponding reaction affinities 479. Calculated yE and yF values________._______-_______----_____ 48

CHEMISTRY OF ALUMINUM IN NATURAL WATER
EFFECT OF AGING ON ALUMINUM HYDROXIDE COMPLEXES IN DILUTE AQUEOUS SOLUTIONS
By R. W. SMITH and J. D. HEM
ABSTRACT
Aqueous aluminum solutions containing 4X10~5 mole/liter aluminum and a constant total ionic strength of 10~2 , but with varying ratios of hydroxide to alumi num (OH:A1), were prepared. Progress of these solutions toward equilibrium con ditions over aging periods of as much as 2 years was studied by determining the composition and pH of the solutions at various time intervals. The solution-?, after mixing, were supersaturated with respect to both crystalline and amorphous forms of aluminum oxides and aluminum hydroxides. The compositions of the solutions were determined by use of a timed colorimetric analytical procedure which allowed the estimation of three separate forms of aluminum that have been designated Ala , Alb , and Al°. Form Ala appeared to be composed of monomeric species such as A1(H20) 6 +3, A1(OH)(H2 0) 6 +2, A1(OH)2 (H20) 4 +1 and A1(OH)«-. Form Alb was poly- nuclear material containing perhaps 20-400 aluminum atoms per structure. It appeared to be a metastable material. Form Al° was composed of relatively large, microcrystalline, clearly solid A1(OH) 3 particles.
For each OH:A1 ratio, the concentration of Ala remained constant with agir<* time, Alb decreased, and Alc increased. It appeared that Alb particles were increasing in size and ultimately were converted to Alc particles. After a few weeks' ag'ng, Alc particles had the structure of gibbsite.
In all solutions, equilibrium was only very slowly achieved, and the time required depended on the OH:A1 ratio and how rapidly the solution was initially prepared (mixing time). Lower ratios caused a slower approach to equilibrium; sometimes equilibrium was not achieved even after several years' aging. The more slowly base was initially added (to obtain the proper OH:A1 ratio), the more slowly was equilib rium approached. Ultimate equilibrium values of dissolved aluminum concentration and pH were consistent with known thermodynamic data on monomeric aluminum species.
From data determined during the aging study and by considering Alb material to consist of extremely small solid gibbsite particles, it was possible to estimate the Gibbs free energy of the (001) crystal face (yp, the gibbsite "face") and th^> Gibbs free energy of the (110) and (100) crystal faces (yE, the gibbsite "edge") of gibbsite in equilibrium with its saturated solution. These values were:
7P = 140±24 ergs/cm2, and 75 = 483±84 ergs/cm2 .
ACKNOWLEDGMENTS
Much of the material used in this paper was taken from a drserta- tion submitted by R. W. Smith in partial fulfillment of the require ments for the Ph. D. degree, Stanford University.
Dl

D2 CHEMISTRY OF ALUMINUM IN NATURAL WATER
The help of and many discussions with Prof. G. A. Parks of Stanford University are gratefully acknowledged.
PURPOSE AND SCOPE
The experiments described in chapter A of this water-supply paper (Hem and Roberson, 1967) were concerned with dilute aqueous solu tions of aluminum in the presence of perchlorate, hydroxide, hydro gen, and sodium ions. When these solutions were partly neutralized by addition of sodium hydroxide so that the molar ratio (r) of com bined hydroxide to total aluminum (OH:A1) was between 1.0 and 3.0, the solutions contained both monomeric and polymeric forms of aluminum hydroxide complexes. When the ratio exceeded 2.0, sus pended gibbsite crystals about O.lOju (microns) in diameter could be detected in the solutions after 10 days of aging. Smaller aggregates and monomeric ions were also present.
The properties of the solutions and the suspended or dissolved material that had formed in them after 10 days continued to change slowly with further aging. The pH generally tended to decrease, with little or no change in the total concentration of the monomeric dis solved aluminum. This effect was attributed to an increasing order liness of the polymerized material which resulted as the hydroxide in the polymer was incorporated into bridging positions between the aluminum ions. Bridging hydroxide presumably would not be in volved in H+-OH~ equilibria in the solution. Somewhat similar effects can be expected as the crystalline particles grow in size. The longest aging time in the solution studies by Hem and Roberson was between 4 and 5 months.
A more extensive and detailed study of the aging process, with longer aging times, was undertaken by the senior author in order to evaluate more closely the chemistry of the polymerization process and explore more fully the nature of unstable aluminum species. The results of the work are summarized in this paper and are given in greater detail in a larger paper by Smith (1969). The results of these experiments, which involved some solutions aged as long as 3 years, show that the solid formed in solutions whose pH is below neutrality eventually attains a solubility similar to that of bayer'te which is formed relatively rapidly in alkaline solutions and which charac teristically consists of crystals that are l.Oju or more in diameter (Hem and Roberson, 1967; Schoen and Roberson, 1970). The greater solu bility of microcrystalline gibbsite that forms earlier in the aging process is essentially a particle-size effect.
Although microcrystalline gibbsite is metastable, it is altered very slowly in solutions similar to natural water and therefore has consid erable significance in the chemistry of aluminum in natural systems.
AGING OF ALUMINUM HYDROXIDE COMPLEXES D3
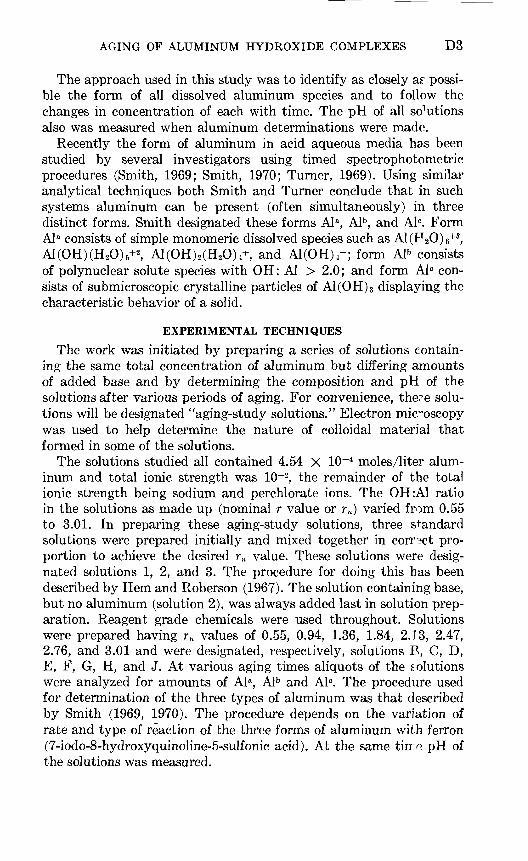
The approach used in this study was to identify as closely as" possi ble the form of all dissolved aluminum species and to follow the changes in concentration of each with time. The pH of all sections also was measured when aluminum determinations were made.
Recently the form of aluminum in acid aqueous media ha.s been studied by several investigators using timed spectrophotometric procedures (Smith, 1969; Smith, 1970; Turner, 1969). Using similar analytical techniques both Smith and Turner conclude that in such systems aluminum can be present (often simultaneously) in three distinct forms. Smith designated these forms Ala, Alb, and AK Form Ala consists of simple monomeric dissolved species such as A1(F20) 6+3, A1(OH)(H20) 5+2, A1(OH) 2 (H20) 4+, and A1(OH) 4-; form Alb consists of polynuclear solute species with OH: Al > 2.0; and form Alc con sists of submicroscopic crystalline particles of A1(OH) 3 displaying the characteristic behavior of a solid.
EXPERIMENTAL TECHNIQUES
The work was initiated by preparing a series of solutions contain ing the same total concentration of aluminum but differing amounts of added base and by determining the composition and pH of the solutions after various periods of aging. For convenience, the?e solu tions will be designated "aging-study solutions." Electron microscopy was used to help determine the nature of colloidal material that formed in some of the solutions.
The solutions studied all contained 4.54 X 10~4 moles/liter alum inum and total ionic strength was 10~2, the remainder of the total ionic strength being sodium and perchlorate ions. The OH:A1 ratio in the solutions as made up (nominal r value or rn) varied from 0.55 to 3.01. In preparing these aging-study solutions, three standard solutions were prepared initially and mixed together in corr3ct pro portion to achieve the desired rn value. These solutions were desig nated solutions 1, 2, and 3. The procedure for doing this has been described by Hem and Roberson (1967). The solution containing base, but no aluminum (solution 2), was always added last in solution prep aration. Reagent grade chemicals were used throughout. Solutions were prepared having rn values of 0.55, 0.94, 1.36, 1.84, 2.13, 2.47, 2.76, and 3.01 and were designated, respectively, solutions B, C, D, E, F, G, H, and J. At various aging times aliquots of the solutions were analyzed for amounts of Ala, Alb and AK The procedure used for determination of the three types of aluminum was that described by Smith (1969, 1970). The procedure depends on the variation of rate and type of reaction of the three forms of aluminum with ferron (7-iodo-8-hydroxyquinoline-5-sulfonic acid). At the same time pH of the solutions was measured.
D4 CHEMISTRY OF ALUMINUM IN NATURAL WAT^R
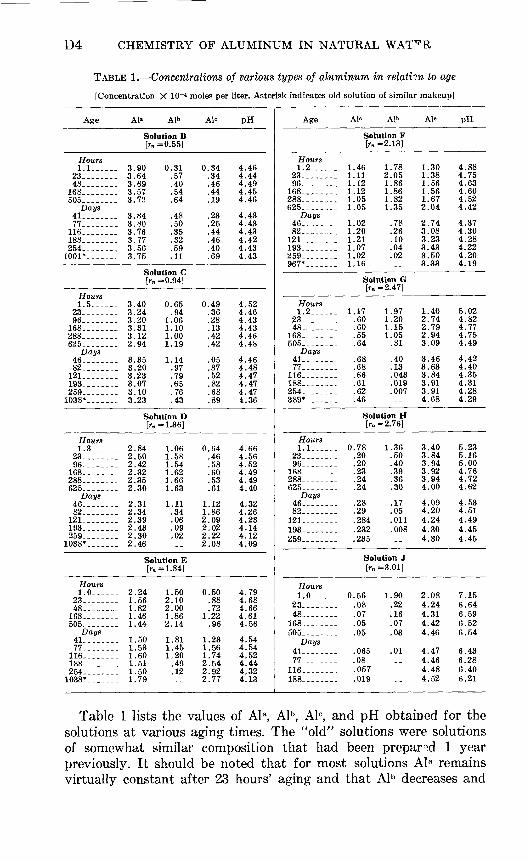
TABLE 1. Concentrations of various types of aluminum in relation to age
[Concentration X 10"1 moles per liter. Asterisk indicates old solution of similar makeup]
Age
Hours 1.1- ..
23..... ..48.......
168-__--_.505 .- -
41 .-.77-.....-
116-......188.......254- .-
1001* .-
1.5.---.23-----.-96-- .
288- 625_-- _-
Days 46- 82.......
121..-..-.193 259- .-
1038* - -
Hours 1 Q
23 . .-96
168.......288...--..
Days 46---....82 .
121-..-.-.193-.-.-..259.......
1038*--..-.
Hours 1.0-.__.
23. ------48_ _ -
168.-...-.
Days41.......77.--.-.-
116,-..--_1 OO
254. ------1038*
Al» Alb
Solution B[rn =0.55]
. 3.90 0.31
. 3.64 .57
. 3 . 69 .40
. 3.57 .54
. 3.72 .64
. 3.84 .48
. 3.80 .50
. 3.76 .35
. 3.77 .32
. 3.75 .11
[rn =0.94]
. 3.40 0.65- 3.24 .94- 3.20 1.06. 3.31 1.10. 3.12 1 . 00_ 2.94 1.19
- 3.35 1.14. 3.20 .97. 3.23 .79- 3.07 .65- 3 . 10 .76. 3.23 .43
Solution D[rn =1.36]
_ 2.84 1.06
. 2.42 1.54
. 2.35 1.66- 2.30 1.63
2 Q1 111
- 2.34 .34. 2.39 .06. 2.43 .09. 2.30 .02. 2.46
Solution E[rn =1.84]
. 2.24 1.50- 1.56 2,10
1 OO O AA
_ 1.46 1.86- 1.44 2.14
- 1 . 50 1 . 81- 1.53 1.45
1.51 .49- 1.50 .12- 1.79
Al°
0.34.34.46.44.19
.23
.25
.44
.46
.4069
0.49.36.28.13.42.42
.05
.37
.52
.82
.68
.89
0.64.46.58.60.53.61
1 19
2.092.022.222.08
0.50.88.72
1 99
96
1.231.561. 74 2.542 Q92.77
PH
4.464.444.494.454.46
4.434.434.434.424.434.43
4.524.464 434.434.464.48
4.464.484.474.474.474.36
4.664.564.524 494.494.40
4 qo
4.264.234.144.124.09
4.794.68
4.614.56
4.544.544.52 4.444.324.13
Age
Hours 1.2 ...
23... _.96 .
168-......288-....,.625.......
46 ..-..82.......
121 .193- --259_- _-967*
Hours1.2____.
23 _ _-48 .
168. _--._-505-
Days 41 -77----
116-.--.188. 254 . .-389*--
Hours 1.1
23-..---.96 -
168_--_--.288. 625-
Days 46__-_-.82_-_.-_.
121-.-.---1 QQOCQ
Hours 1.0-_-_-
23.--.---48-- - ---
168_.-_---505-------
41.--.-..77 -
116. -__---188_------
Al» Alb
Solution F[r. =2.13]
. 1.46 1.78
. 1.11 2.05
. 1.12 1.86
. 1.12 1.86
. 1.05 1.82
. 1.05 1.35
_ 1.02 .78. 1.20 .26- 1.21 .10. 1.07 .04. 1.02 .02
Solution G[f» -2.47]
- 1.17 1.97.60 1.20.60 1.15.55 1.05.64 .81
.68 .40
.68 .13
. 66 . 043
.61 .019
.62 .007
.46
Solution H[rB =2.76]
. 0.78 1.36.20 .50.20 .40.23 .39.24 .36.24 .30
.28 .17
.29 .05
.284 .011
.232 .008OQ r
Solution J[rn =3.01]
.08 .22
.07 .16
.05 .07
.05 .03
.065 .01
.08
.057
.019
Al°
1.301.381.561.561.672.04
2.743.083.233.433.503 qq
1.402.742.792.943.09
3.463.633.843.913.914.68
3.403.843.943.923.944.00
4.094.204.244.30
2 AO
4.244.314.424.46
4.474.464.484.52
PH
4.884.754.634.604.524.42
4.374.304.284.224.204 19
5.024.824.774.754.49
4.424.404.354.314.284.29
5.235.165.004.764.724.62
4.534.514.494.454.45
7 1 1
6.646.596.526.54
6.436.286.406.21
Table 1 lists the values of Al a, Alb, Alc, and pH obtained for the solutions at various aging times. The "old" solutions were solutions of somewhat similar composition that had been prepared 1 year previously. It should be noted that for most solutions Al a remains virtually constant after 23 hours' aging and that Alb decreases and

AGING OF ALUMINUM HYDROXIDE COMPLEXES D5
Alc increases as functions of aging time. Values for Ala from the var ious solutions are listed in table 2, and the relationship between initial r value (rn ) and Ala value is shown graphically in figure 1.
TABLE 2. Concentrations of monomeric aluminum (Ala )[Numbers in parentheses beneath solutions indicate rn values. Asterisk indicates old solutions of
similar makeup]
Age
Hours 23..... _ .............48-..---.---...--..-...96. ....................168. ...................288....................505.. ..................625..------.-----.---..
Days 41-46-.-.----..---..-.77-82..................116-121-.--.. ..........188-193. ---.----_---.-.254-259.. .- -.-.... .
Average. ---._---.
Solution
B(0.55)
.---. 3
._-.. 3
.-- 3
.---. 3
..... 3
.---. 3
.---. 3
.---. 3
..... 3
..... 3,
...-- 3
.64
.69
,57
.72
.84
.80
.76
.77
.56
.71
,75
C (0.94)
3.24
3.20 3.31 3.12
2.94
3.35 3.20 3.23 3.07 3.10
3.18
3.23
D(1.36)
2.
2 2, 2,
2.
2. 2, 2,2. 2
2,
2.
.50
.42 ,32 .35
.30
.31
.34
.31
.43
.30
.36
,46
E(1.84)
1 1
1
1
1 1 1 1. 1
1
1,
.56
.82
.46
.44
.50
.53
.60
.51
.50
.55
,77
F(2.13)
1.11
1.12 1.12 1.05
1.05
1.02 1.20 1.21 1.07 1.02
1.10
1.16
G(2.47)
0.60 .60
.55
.64
.68
.68
.66
.61
.62
.63
.46
H(2.76)
0.20
.20
.23
.24
.24
.28
.29
.28
.23
.23
.24
--
J(3.01)
0.08 .07
.05
.05
.07
.08
.06
.02
.06
--
CHARACTERISTICS OF Ala
The form of aluminum, Al a, that reacts almost instantly with ferron can be reasonably assumed to consist of only simple morjomeric species; that is, A1+3 , A1(OH)+2, A1(OH) 2+, and A1(OH) 4- with ap propriate coordinated water molecules. These forms do not include any bridging hydroxide, which was shown by Hem and Roberson (1967) to stabilize the structure of aluminum hydroxide pdymers and make them slow to react to changes in the solution. Standard Gibbs free energies of formation (A(7°) for the monomeric species are available in the chemical literature. Table 3 lists some of these values, in kilocalories, plus a Gibbs free energy value for gibbsite, oAl(OH) 3 , taken from the literature. This value corresponds to the most nega tive values for AG° for aluminum hydroxide solids reported by Hem and Roberson (1967).
Concentrations of Al a measured in the aging solutions can be as signed to the four monomeric solute species by chemical equilibrium
TABLE 3. Gibbs free energies of formation of monomeric aluminum species
Species
Al+3A1(OH) +2Al(OH),+...__. __________Al(OH) 4-_. ..________.___aAl(OH)s-_--_ _
Standard Gibbs free energies of formation (AG° kcal)
____ -115.0____ -164.9____ -215.1.__- -311.7____ -273.9
Source
Latimer (1952).Raupach (1963a, b)
Do.
Latimer (1952).(1967).
5-125 O - 72 - 2

D6 CHEMISTRY OF ALUMINUM IN NATURAL WATER
4.0
2X
UJ_J O
y 2.0
ce
UJo
o o
1.0
Total Al=4.54 X 10⁻⁴ mole/liter
0123
rn value
FIGURE 1. Concentration of Ala as a function of rn value.
calculations, based on earlier, more detailed investigations of these forms.
The Gibbs free energy values for A1+3 , A1(OH)+2 and A1(OH) 4- were selected to be consistent with the work of Hem and Roberson (1967). Few values for A1(OH) 2+ were available, and Raupach's was selected for consistency because of the use of his value for A1(OH)+2 .
Hem and Roberson (1967) determined a value of 10~4 - 75 for *Ki (the first hydrolysis constant of A1+3 ) and reported that this gave a satisfactory fit of their data without considering the species A1(OH) 2 +. The calculations here were refined by including both A1(OH)+2 and

AGING OF ALUMINUM HYDROXIDE COMPLEXES D7
A1(OH)2+ species, but the total amount of hydroxide bound in Ala species comes out about the same by either procedure.
From data of table 3 the following can be written:
aAl(OH) 3 +3H+^>Al+3 +3H20 (1)
aAl(OH) 3 +2H+^A10H+2 +2H20 (2)*Ksi = 10+3 - 22
aAl(OH) 3 +H+^Al(OH)2++H20 (3)*KS2 = 10-1 - 54
aAl(OH) 3 +H20<=±Al(OH) 4-+H+ (4)*KS 4 = 10-13 - 9
Al+3 +H2CMAl(OH)+2 +H+ (5)*#i = 10-5 - 00
+ H20<=>Al(OH)2++H+ (6)
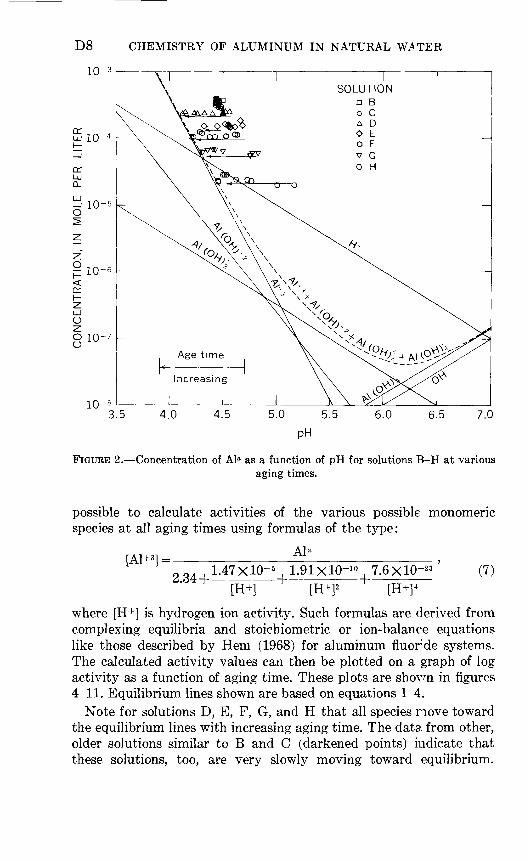
Using the above equations plus estimated activity coefficients (table 4), the theoretical concentrations of the monomeric species can be calculated and plotted as a function of pH. Further, actual concentrations of Ala for the various solutions and aging times can be plotted on the same chart. This combined plot is shown in figure 2. Increasing aging time is indicated by the arrows.
Figure 2 shows that Ala concentration remains nearly constant while pH drops, at least for solutions D-H, as a function of aging time until the theoretical equilibrium line for Al+3 +Al(OH)+2 + A1(OH) 2++A1(OH) 4~ is reached. The sum of the Al a specie? thus conforms to the thermodynamic solubility of gibbsite.
Figure 3 shows curves similar to those of figure 2 except that Ala+b concentrations are plotted rather than Ala concentrations alone. The trend of the total aluminum concentrations in figure 3 is down ward during aging, owing to decreases in Alb.
From equations 1-6 and the several activity coefficients it is also
TABLE 4. Activity coefficients of monomeric species for ~10~z ionic strength solutionsSpecies Coefficient
Al+3 _ ___--_-____..___________ ____________________________ » 0.427Al(OH) +2__ .__.._-_.___.__._.-......__..__.._ .____________ 2 .678Al(OH),+_-__-___-_____ ______-___-___-. ____________________ 2 .907Ai(OH) 4- ----------------------------------------------- 3 .sro
1 From Debye-Hiickel limiting law using parameter a = 9.2 From Debye-Huckel limiting law using parameter a =6.3 From Debye-Hiickel limiting law using parameter a =3.NOTE. The use of the above values for parameter a is in accord with Butler (1964). The activity
coefficients used for A1+3 and A1(OH)+2 were identical to the values used by Hem and Robersin (1967) for similar solutions.
D8 CHEMISTRY OF ALUMINUM IN NATURAL WATER
10
3.5 4.0 4.5 5.0 5.5 6.0 6.5 7.0
FIGURE 2. Concentration of Ala as a function of pH for solutions B-H at variousaging times.
possible to calculate activities of the various possible monomeric species at all aging times using formulas of the type:
[Al+ 3]=-Al*
1.47xlO- 5 + 1.91XlO-10 7.6X10⁻²³ (7)[H- [H+12 [H+14
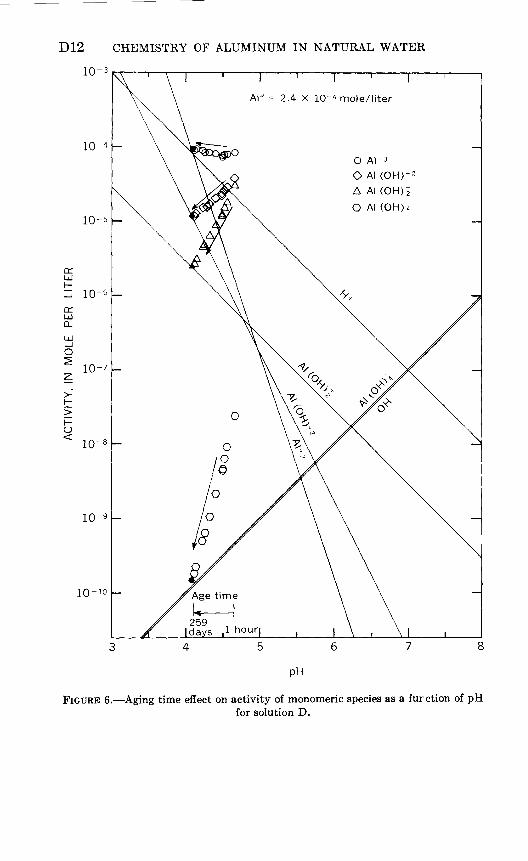
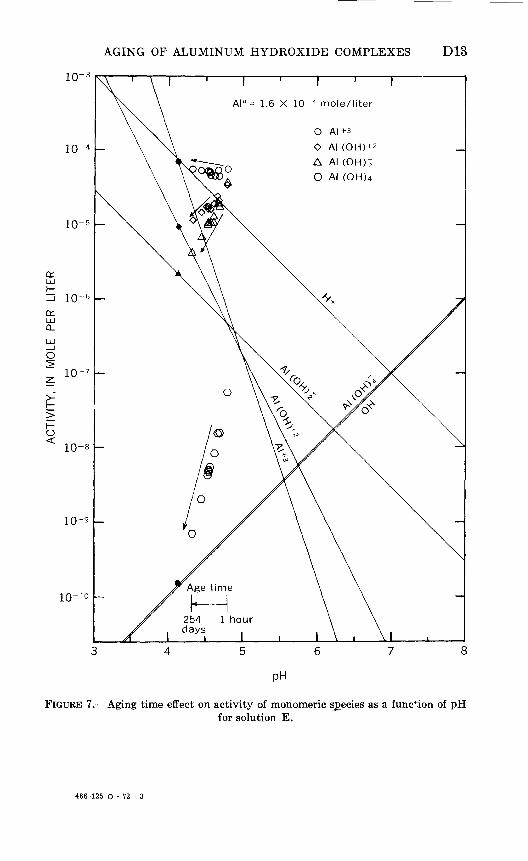
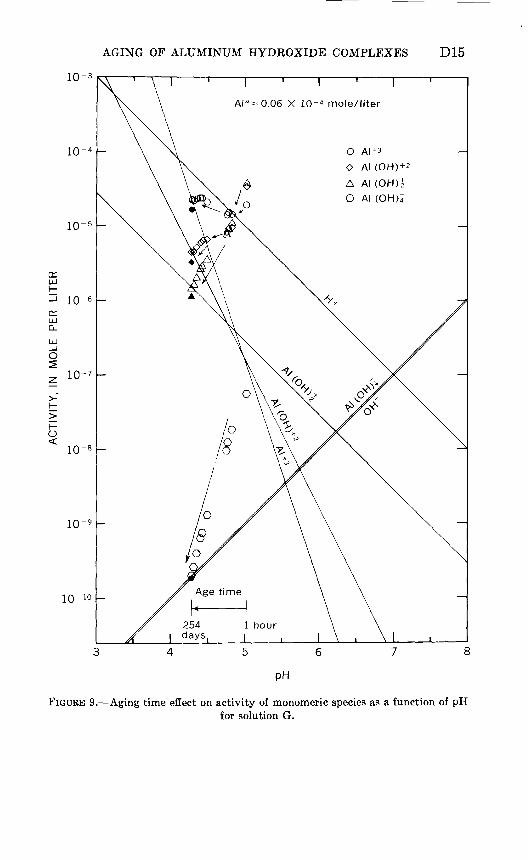
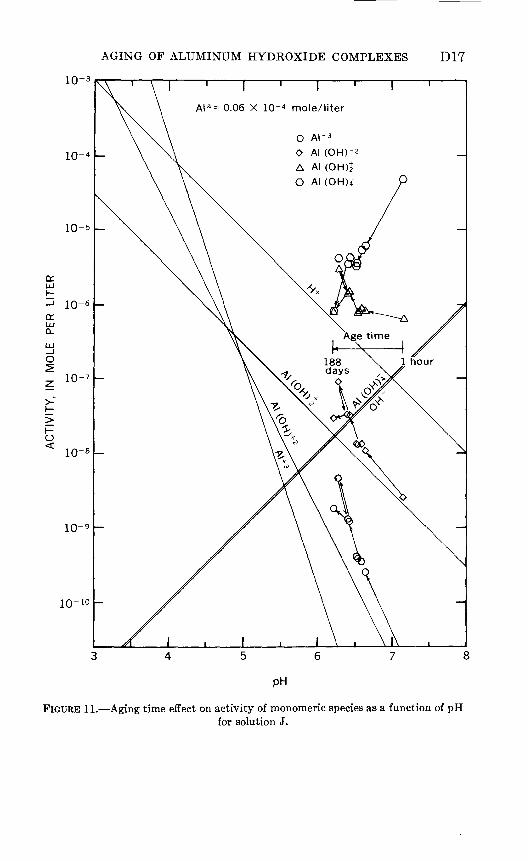
where [H+] is hydrogen ion activity. Such formulas are derived from complexing equilibria and stoichiometric or ion-balance equations like those described by Hem (1968) for aluminum fluorde systems. The calculated activity values can then be plotted on a graph of log activity as a function of aging time. These plots are shovn in figures 4-11. Equilibrium lines shown are based on equations 1-4.
Note for solutions D, E, F, G, and H that all species nove toward the equilibrium lines with increasing aging time. The data, from other, older solutions similar to B and C (darkened points) indicate that these solutions, too, are very slowly moving toward equilibrium.

AGING OF ALUMINUM HYDROXIDE COMPLEXES D9
10
4.5 5.0 5.25
pH
FIGURE 3. Concentration of Ala+b as a function of pH at various aging times.
Solution J with its high r n value is acting in a somewhat different manner, although there is evidence that it also is moving toward proper equilibrium values.
The experimental results consistently show that for each solution the total concentration of monomeric aluminum remains constant

DIG CHEMISTRY OF ALUMINUM IN NATURAL WATER
Al a = 3.7 X 10~ 4 mole/liter
O AI +
O Al (OH)
A Al
O Al (OH) 4
PH
FIGURE 4. Aging time effect on activity of monomeric species as a function of pHfor solution B.

AGING OF ALUMINUM HYDROXIDE COMPLEXES Dll
Al a ~ 3.2 X 10- 4 mole/liter
O AI+3
O Al (OH)+2
A Al (OH)2
O Al (OH)4
PH
FIGURE 5. Aging time effect on activity of monomeric species as a function of pHfor solution C.
D12 CHEMISTRY OF ALUMINUM IN NATURAL WATER
TI I 1 , , ,
a = 2.4 X 10^4 mole/liter
O AI+3
O Al (OH)+ 2
A Al (OH) 2
O Al (OH) 4
PH
FIGURE 6. Aging time effect on activity of monomeric species as a furction of pHfor solution D.
AGING OF ALUMINUM HYDROXIDE COMPLEXES D13
a:UJi
crUJ Q_
O<
Al a = 1.6 X 10~ 4 mole/liter
O AI+3
O Al (OH)+ 2
A Al (OH) +
O Al (OH)4
10-9 _
10-io _
pH
FIGURE 7. Aging time effect on activity of monomeric species as a function of pHfor solution E.
466-125 O - 72 - 3

D14 CHEMISTRY OF ALUMINUM IN NATURAL WATFR
ceLJI-
ceLJ Q_
1C- 3
10-4
1C- 5
10-6
10- 7
o<
10-
I 'I '1.1 X 10~4 mole/liter
O AI + 3
O
A AI(OH)
O AI(OH)Z
PH
FIGURE 8. Aging time effect on activity of monomeric species as a function of pHfor solution F.
AGING OF ALUMINUM HYDROXIDE COMPLEXES D15
10-3
10- 4 -
10~ 5 -
10- 6 -
UJ D_
O < io- 8 -
10~ 9 -
Al a = 0.06 X 10 4 mole/liter
O AI+ 3
O Al (OH)+ 2
A Al (OH)£
O Al (OH)!
PH
FIGURE 9. Aging time effect on activity of monomeric species as a function of pHfor solution G.

D16
10
10-5
o:LU Q.
io- 7
o < 10-
lO-io
CHEMISTRY OF ALUMINUM IN NATURAL WATER
1 \ I ' I ' I ' I
Al a = 0.2 X 10^4 mole/liter
O AI+ 3
O Al (OH)+2
A Al (OH)I
O Al (OH)4
PH
FIGURE 10. Aging time effect on activity of monomeric species as a function of pHfor solution H.
AGING OF ALUMINUM HYDROXIDE COMPLEXES D17
10-
io-4 -
10-5 _
crUJ
o;UJo_UJ
O
10~ 6 -
10-7 -
o<
10~ 9 -
lO-io
Al a =0.06 X 10- 4 mole/liter
O AI+ 3
O Al (OH)+2
A Al (OH)£
O Al (OH)?
PH
FIGURE 11. Aging time effect on activity of monomeric species as a function of pHfor solution J.

D18 CHEMISTRY OF ALUMINUM IN NATURAL WATEP
with age. The pH of the solution, however, changed during aging, finally attaining a value that represents equilibrium with gibbsite having the free energy shown in table 3. At intermediate aging times Al a concentration is greater than it should be if solid, Al a, and the observed pH were in equilibrium. Further, all major adjustments of the system have to do with pH, Al b, and Al c. Changes in monomeric species' activities merely reflect an essentially instantaneous adjust ment of these activities to changing pH, with an increase in propor tion of A1+ 3 to hydroxylated forms as pH decreases.
CHARACTERISTICS OF Alb AND Alc
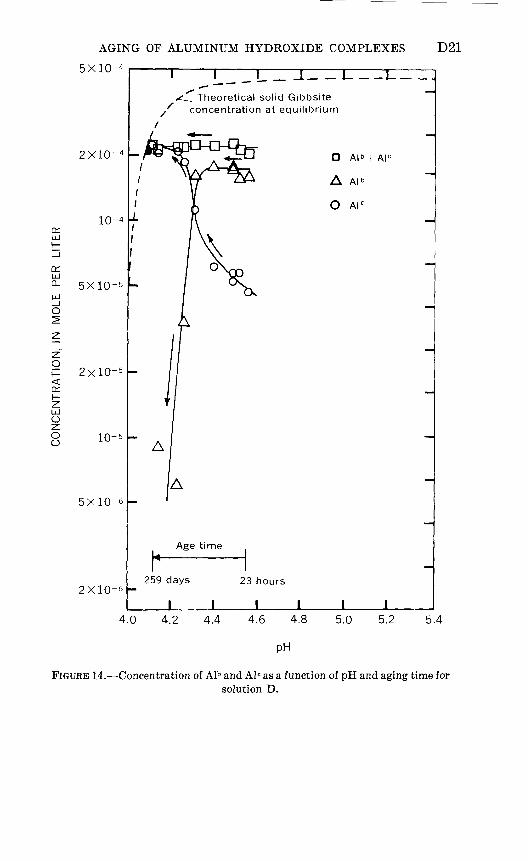
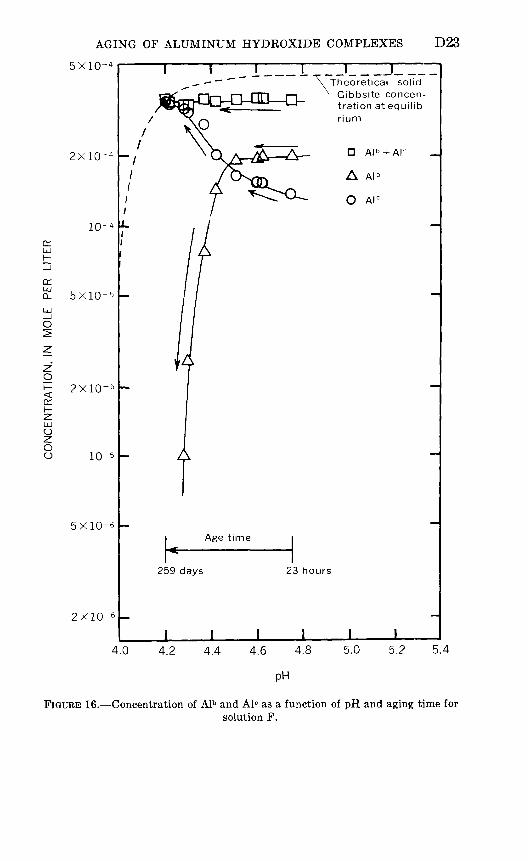
Figures 12 through 18 have been constructed to show clearly progress of the amounts of Al b, Al c, and Al b+c with time and pH. Darkened points are for old solutions aged 1-3 years. Since Al c ap pears to be a solid material it is actually incorrect to think of Al c in terms of concentration "in solution." However, such a designation is convenient and helpful in showing the amount of solid species produced and in following the system as a function of time. These curves of minus log concentration of Al b and Al c versus pH with ap propriate times indicated again show that Alb decreases in concen tration with time and Al c increases. As a corollary to corstant Al a it should be noted that Alb+c concentration stays constant with aging time. Equilibrium is reached in the systems when the Alc and the Al b+c lines reach the dotted line which indicates the amount of crystal line gibbsite that should be present at equilibrium as a function of pH. It is noted that, after a few days' aging, the equilibrium pH for these systems can be accurately predicted by extrapolating the Al b+c curve, which generally appears to be a straight line parallel to the pH axis, to its intersection with the dotted gibbsite concen tration curve.
Form Al a appears to be composed of monomeric species, and its total concentration is approximately constant after about 23 hours' aging. Form Alc, from both analysis and aging data and from electron micro scope observation, consists of crystalline solid (colloidal) particles, and its concentration increases as a function of aging time until equi librium is achieved. Form Al b is present in all the solutions at 23 hours' aging arid often in considerable concentrations. Its concentra tion then drops as a function of aging time until it finally disappears from solution when equilibrium is reached. It is obviously not per manently stable material and is ultimately converted to Al c. It reacts with ferron in the analytical procedure according to a first-crder rate law which suggests that all aluminum atoms in the material are indi vidually reacting with ferron in a way that does not change as the Al b structures react and dimmish in size in the procedure. Tl is would

S
f\j
cn
rv)
cn
r\)
_
X
X
XX
X
to
i i
i >
i >
i
i '
i
i
i O
O
OO
O
OO
1 1 III III
^^O
l
O1
O1
O1
O
l*.fc
§ b
o to 3 h-J
&3
.^
f
^
a "o-
£»
&3
a ^ S-
jp.§
J '<*
td
» P
T3
S*
3
-^
§-.
°°
o'
O i-t.
>rt
U1
W
b3 P- w
^3 TO £?
.
S
cn
i 1
11
r
'~~
"i"
----
^1 "~
s^
^ » o
__
o
~ r~
°q
era
" T
^5
» ^ _
1
Si
Q)
n±
^
iv i>
- lO
* '^
^tfri
^'
^ ^
.^. O
O A
Pr7
"vpf
fr*f*
^*"
iR
~>era
^
*"
O
^^^>
D
£
(D
-
C a E'
3
O
>
D
>
>
>~
"a
~ > °
M
1 III III
S4
^>-t
cn X 1^
.
o
t>-
2
\ ?\
-5
\ 2.
^
o'
\
o>
»o
IS
I
1 r
2. 1
S"
i U
1 1 1 1 r
i i (_ i i i i
z; o 0 ^ J >; KH
^ d S ffi 0 o d M O O T) UH X C/2 ( 1
CD

o 5 H i i
co i *
§ b
0 § <rh
>-»
tt
^o
ro3 O £
**
^»
£la
s'- 1
*
13
p
CT>
O »
' P
TD
3-
^S
*"a
boo
3
O 1-H
O
Ol
W
bP 3 &
.
w
P1
5'
N>oq rt
-
CD
CJl
--------,.--
...-
. _
. .
_.._..
K>
(n
X
V
^
01£
£
x
xo
^t
'-'
'-'
^°
? ?
° o
5 f ;*
^ - _
__
_ ci.
T
-
nr
~>
^^^\0
1 -
°
2 ~
jrj-C
^x^fe
g5
CD
\J\J
^
t^
K^*p
»^9
^0)
rt
- . -
N
_
i/i 5'
3
3
OQ
»
- ^ ' " 1 _
__
__
__
_ 1
ro
cX 1-
.0
c
i c
-^
^r^
§ -l\
j3
3~
"~2
» N
t S
°N
=r CD
\1
»s-
\1
§ -
' ~B
-i
w 1
TJ
Q)
O
CD
Cl
£9 cr
fff
Iff
3
O
>
D
>
>
> + >
-
1 _
__
__
__
__
__
_ L.
to 0Jl >< 0
01
w H g h- 1
G
O to L>
^S O *J > f a s h- 1 ^ a s h- 1 55
|H
> z; > H a td > t-1 <j <i > H H W
AGING OF ALUMINUM HYDROXIDE COMPLEXES
5X10- 4D21
10-4crUJ
cr°- 5X10⁻⁵
2xlO- 5
o
8
5X10⁻⁶
2X10- 6
I I_ _L -L- \---\-~-.xi__ Theoretical solid Gibbsite
f concentration at equilibrium
A
Age time
D Al b + Al c
A Al b
O Al c
259 days 23 hours
I I I4.0 4.2 4.4 4.6 4.8 5.0 5.2 5.4
PH
FIGURE 14. Concentration of Alb and Alc as a function of pH and aging time forsolution D.

D22 CHEMISTRY OF ALUMINUM IN NATURAL WATER5X10-4
I__J_ _J .1 I ..~~ ~" ^\_Theoretical solid Gibbsite
concentration at equilibrium
2X10- 5
10-5
254 days 23 hours
I I I I
4.0 4.2 4.4 4.6 4.8 5.0 5.2 5.4
2X10- 6
FIGURE 15. Concentration of Alb and Alc as a function of pH and aping time forsolution E.
CO
NC
EN
TR
AT
ION
, IN
M
OLE
P
ER
LI
TE
R
O §
» S
f-S
.§-
.{>
o "r
1
i-t>
HI
c
-h
-
X I ' o
O I ( ^ o o d
Sd
o O O 13 tr1

CO
NC
EN
TR
AT
ION
, IN
M
OLE
P
ER
LI
TE
R
O o 3
O
3c
«
f fc
o I
01 00 CJI
b tn fo
en
Xen
X
XCJ
IX
O
>
D
O
to s a I-H d I-H
2 H

AGING OF ALUMINUM HYDROXIDE COMPLEXES
5X10~ 4
D25
2X10- 4
5X10⁻⁵
enLU
en
LU
O
p 2X10⁻⁵
enh-
LUO
I io- 5
5X10- 6
/^Theoretical solid Gibbsite /concentration at equilibrium D A|b + Al l
A Al b
O Al c
259
I I
Age time
days 23 hours
1 1 1 1
4.0 4.2 4.4 4.6 4.8 5.0 5.2 5.4
pH
FIGURE 18. Concentration of Alb and Alc as a function of pH and aging time forsolution H.
D26 CHEMISTRY OF ALUMINUM IN NATURAL WATER
indicate that the structures comprising Alb are not very large. One would expect large units to react at a rate proportional to the surface area exposed and to follow a rate law of order less than one. However, since it takes ferron a finite length of time to break down the Alb struc tures as compared with the time required to break down the Al a structures, it would appear that the structures are rather strongly bound together. A structure of limited size containing 100-400 alumi num atoms in coalesced six-membered aluminum hydroxide rings, as suggested by either Hem and Roberson (1967) or Hsu and Bates (1964a, 1964b), would appear reasonable.
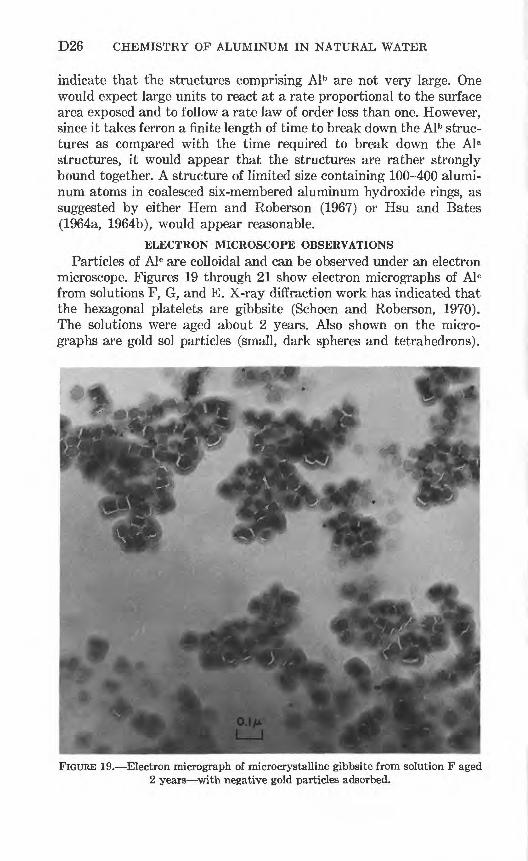
ELECTRON MICROSCOPE OBSERVATIONSParticles of Alc are colloidal and can be observed under an electron
microscope. Figures 19 through 21 show electron micrographs of Alc from solutions F, G, and E. X-ray diffraction work has indicated that the hexagonal platelets are gibbsite (Schoen and Roberson, 1970). The solutions were aged about 2 years. Also shown on the micro graphs are gold sol particles (small, dark spheres and tetrahedrons).
FIGURE 19. Electron micrograph of microcrystalline gibbsite from solution F aged 2 years with negative gold particles adsorbed.

AGING OF ALUMINUM HYDROXIDE COMPLEXES D27
FIGURE 20. Electron micrograph of microcrystalline gibbsite from solution C aged 2 years with negative gold particles adsorbed.
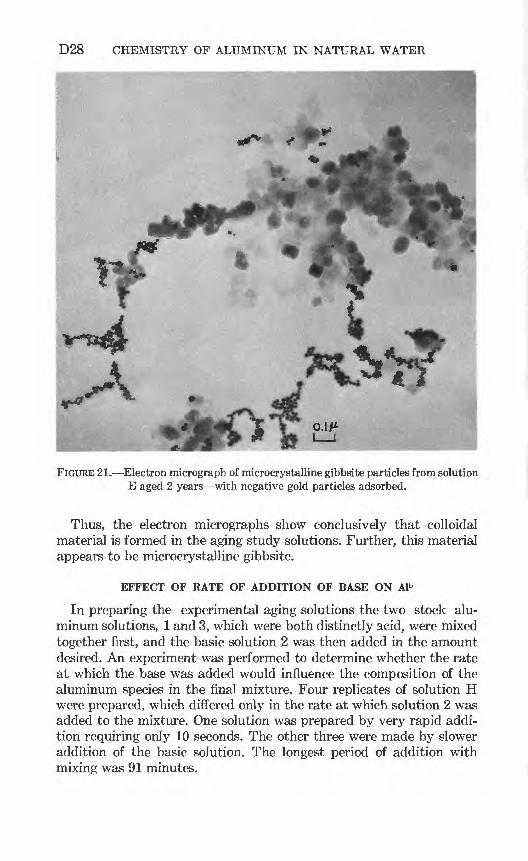
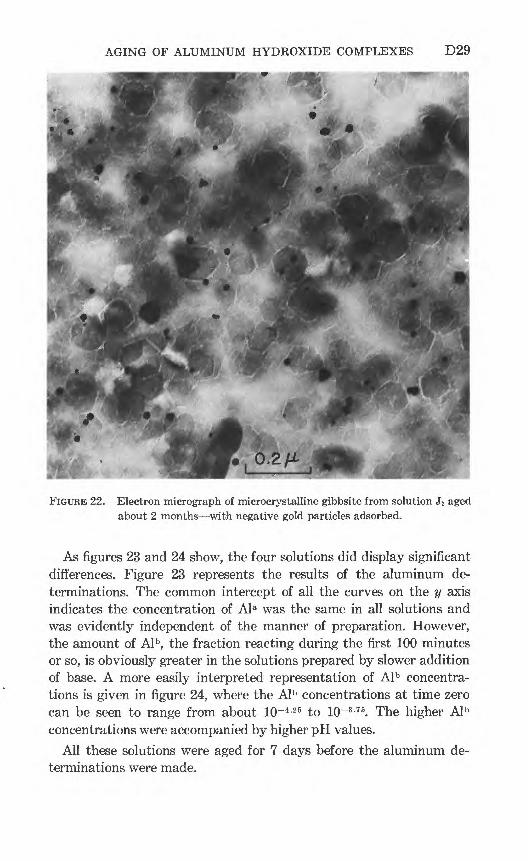
Figure 22 shows an electron micrograph of particles from solution J2 which was 4.55 X 10~3 molar in aluminum, had an ionic strength of about 0.1, and had an r value of 2.98. The solution was aged for about 2 months. The figure shows much of the detail of the particles, such as their typical crystalline shape and imperfections. The gold sol particles as prepared in this work are negatively charged (Thiessen, 1942, 1947). It is interesting to note that these particles tend to ad sorb on edges, corners, and imperfection points of the gibbsite crystals, particularly at the last two types of sites. The suggestion is, then, that corners and imperfection points are the most highly positive sites on the gibbsite surface.
The electron micrograph of the gibbsite of solution F is of particular interest since it apparently shows edges (rectangular shapes) as well as faces and indicates the relative thickness of the particles. Also, it can be seen that the particles appeared layered much in the manner of microscopic mica particles. The electron micrograph of material from solution C indicates that microcrystalline gibbsite is ultimately formed even if rn value is as low as 0.94 and pH is near 4.
D28 CHEMISTRY OF ALUMINUM IN NATURAL WATER
FIGURE 21. Electron micrograph of microcrystalline gibbsite particles from solution E aged 2 years with negative gold particles adsorbed.
Thus, the electron micrographs show conclusively that colloidal material is formed in the aging study solutions. Further, this material appears to be microcrystalline gibbsite.
EFFECT OF RATE OF ADDITION OF BASE ON Alb
In preparing the experimental aging solutions the two stock alu minum solutions, 1 and 3, which were both distinctly acid, were mixed together first, and the basic solution 2 was then added in the amount desired. An experiment was performed to determine whether the rate at which the base was added would influence the composition of the aluminum species in the final mixture. Four replicates of solution H were prepared, which differed only in the rate at which solution 2 was added to the mixture. One solution was prepared by very rapid addi tion requiring only 10 seconds. The other three were made by slower addition of the basic solution. The longest period of addition with mixing was 91 minutes.
AGING OF ALUMINUM HYDROXIDE COMPLEXES D29
FIGURE 22. Electron micrograph of microcrystalline gibbsite from solution J2 aged about 2 months with negative gold particles adsorbed.
As figures 23 and 24 show, the four solutions did display significant differences. Figure 23 represents the results of the aluminum de terminations. The common intercept of all the curves on the y axis indicates the concentration of Ala was the same in all solutions and was evidently independent of the manner of preparation. However, the amount of Al b, the fraction reacting during the first 100 minutes or so, is obviously greater in the solutions prepared by slower addition of base. A more easily interpreted representation of Al b concentra tions is given in figure 24, where the Al b concentrations at time zero can be seen to range from about 10~4 - 25 to 10~3 - 75. The higher Al b concentrations were accompanied by higher pH values.
All these solutions were aged for 7 days before the aluminum de terminations were made.

D30 CHEMISTRY OF ALUMINUM IN NATURAL WATER
3.0
oi (X cr
0=2.0UJ Q_
C/)
GJ 1.0 crLJ
OoUJcr
I \ I I I
SOLUTION H :
Total Al = 4.54X10⁻⁴ mole/liter -
91 minutes . j_
I I I I20 40 80 120 160
ANALYSIS TIME, IN MINUTES
FIGURE 23. Effect of length of time of adding base in preparing solutions on amount of Alb formed aluminum recovered as a function of analysis time.
In general the results of this experiment show that the more slowly the base is added the farther away from equilibrium the mixture is when the aging period begins. The solutions where addition of base was made very slowly have the highest concentration of Al b, produced at the expense of AK For a particular rn value Al a is constant and independent of rate of base addition. Also, pH at the end of 1 week's aging is higher.
Rapid addition promotes formation of solid A1(OH) 3 particles, possibly originally of a partly amorphous character. These particles appear to soon start organizing themselves into crystalline form (gibbsite under our experimental conditions). Slow addition gives less opportunity for local excess of base and formation of amorphous solid A1(OH) 3. With slower addition of base, more monomeric and polynuclear species are initially formed. The monomeric species very rapidly convert to polynuclear microparticles or macroions in roughly the manner outlined by Hem and Roberson (1967).

AGING OF ALUMINUM HYDROXIDE COMPLEXES D31
0 20 40 60 80
ANALYSIS TIME, IN MINUTES
FIGURE 24. First-order rate plot of Alb data from figure 23.
100
D32 CHEMISTRY OF ALUMINUM IN NATURAL WATER
APPROACH OF SOLUTIONS TO EQUILIBRIUM
The aging studies show that the amount of Ala stay^ nearly con stant after 1 day even though pH drops and that concentration of Al b decreases as Alc increases. Meanwhile, activities of monomeric species, as A1+ 3 and A1(OH)+2, adjust themselves according to what ever pH change occurs in the system. It appears that individual A\ zb (QH) n:c+ v particles must grow by combining with each other accompanied with the "splitting out" of protons from combined water molecules. The relation between the monomeric species and the pH of the solution can be summed up in the equation (obtained by combining eq. 1-4)
Al+ 3 +Al(OH)+2 +Al(OH) 2++Al(OH) 4-+5H20 <± (8)4A1(OH) 3 +5H+.
The A.l z (OB.) nz+y intermediates are, of course, left out of the above equation because they are not of thermodynamic significance, dis appearing from solution before equilibrium is attained.
The existence and distributions of activities of monomeric species of aluminum such as those on the left side of equation 8 seem to fit reasonably well at the equilibrium conditions attained after long aging. The possibility of dimeric or other small forms of aluminum hydroxide complexes is not ruled out by this equilibrium. Hem and Roberson (1967, p. 33) studied the kinetics of dissolution in acid of aluminum hydroxide species prepared in the same way as the ones described here. The kinetic behavior of hydroxide present in bridging positions was shown to differ sharply from that assignable to mono meric or unbridged positions. The studies of Hem and Roberson indi cated that essentially all structural (bridging) hydroxide is associated with polymerized forms, or the equivalent of what is termed Al b and Al° in this report. Essentially no bridging hydroxide was left over to be assigned to AK
It seems logical to conclude that Al a consists of monomeric alu minum hydroxide complexes with negligible amounts of dimers, such as A1 2 (OH) 2+4, trimers, tetramers, or higher products of polymerization. Formation of polymers requires the initial step of forming a double hydroxide bridge between two monomers. This step appears to require an energy input because it does not occur in these solutions at a significant rate after the very early stages of the aging process (Ala remains nearly constant).
KINETICS AND STRUCTURE OP NONEQUILIBRIUM SPECIES
The procedure used here for determining the amount of Al b that is present during aging is based on the distinctive kinetics of this fraction of the aluminum when participating in complexing reactions
AGING OF ALUMINUM HYDROXIDE COMPLEXES D33
with ferron. In earlier studies by Hem and Roberson (1967) the kinetics of the reaction of aluminum hydroxide species with H+ were used to identify the equivalents of Alb and Al°. The structural or bridging hydroxide was the substance whose quantity was directly determined; the molar proportion of bridging hydroxide to aluminum in this kind of material is directly related to the size of polymeric units if the units are considered to be evolving toward crystalline gibbsite. In this process there are strict geometric constraints that such structures impose on the way individual aluminum ions can be bound into the unit.
The work of Hem and Roberson further demonstrated that after the first few days the hydroxide contained in polymerized forms of aluminum hydroxide was nearly all in bridging positions. One could possibly explain the behavior of the Al b toward ferron by postulating that the material is a poorly organized polymer of indefinite str.icture and size which contains many imperfections, perhaps missirg hy droxide bridges or nonbridging hydroxide present in randorr posi tions. A more logical explanation, however, would seem to b^ that Al b represents reasonably well organized units having gibbsite struc tures, and containing only minor amounts of unbridged hydroxide, which differ from Al c units only in being smaller. This explanation would appear to be the better one in view of the experimental obser vations of Hem and Roberson, which appear to rule out any large proportion of nonbridging hydroxide in polymeric material.
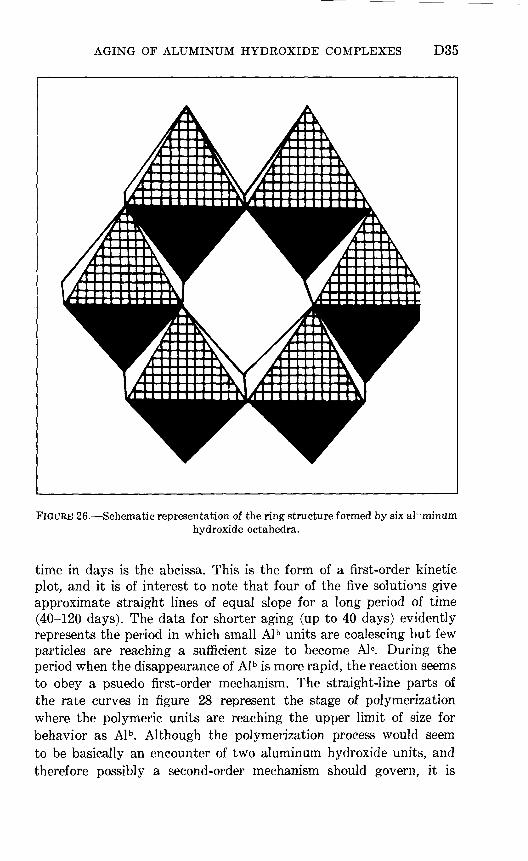
The number of aluminum ions per Al b unit can be calculated if the gibbsite structural pattern is imposed and if the mole ratio of hy droxide to aluminum in the units is known. The relationship is ex pressed graphically in figure 25. The simplest single ring structure Al6 (OH)i2+6 (fig. 26) has six aluminum ions and a ratio of OH:A1 of 2.0 (fig. 25). By the time the ratio reaches 2.95 the structure contains about 600 aluminum ions bound in a system of coalesced rings. The process of increasing size of structure is shown in figure 27.
The coalescing of structures as shown in figure 27 represents de- protonation of water molecules along edges of the units as the hy droxide double bridges are formed. It is to be expected that this process will affect the pH of the system, and therefore the amount of change in H+ activity during aging should be a rather direct indica tion of the amount of polymerization that is taking place.
From data in table 1 showing the amount of Al b present at various times during aging and the pH measurements made at the same times, an insight into the limiting composition of Al b can be obtained. Data from the table are shown graphically in figure 28, where the negative log of residual concentration of Al b is the ordinate and aging

D34 CHEMISTRY OF ALUMINUM IN NATURAL WATER
1000
100
10
I ' I ^ T T I
I . 111.8 2.0 2.2 2.4 2.6 2.8 3.0
OH:Al b
FIGURE 25. Number of aluminum atoms as a function of the OH:Alb ratio of theAlb particle.
AGING OF ALUMINUM HYDROXIDE COMPLEXES D35
FIGURE 26. Schematic representation of the ring structure formed by six al"minumhydroxide octahedra.
time in days is the abcissa. This is the form of a first-order kinetic plot, and it is of interest to note that four of the five solutions give approximate straight lines of equal slope for a long period of time (40-120 days). The data for shorter aging (up to 40 days) evidently represents the period in which small Al b units are coalescing but few particles are reaching a sufficient size to become AK During the period when the disappearance of Al b is more rapid, the reaction seems to obey a psuedo first-order mechanism. The straight-line parts of the rate curves in figure 28 represent the stage of polymerization where the polymeric units are reaching the upper limit of size for behavior as Al b. Although the polymerization process would seem to be basically an encounter of two aluminum hydroxide units, and therefore possibly a second-order mechanism should govern, it is

D36 CHEMISTRY OF ALUMINUM IN NATURAL WATER
AI 12 (OH)22 (H 2 0){68 Q QO
A|6(OH) 12 (H 2 0);2bAI 24 (OH)60 (H 2 0) +2412
FIGURE 27. Growth of polynuclear aluminum hydroxide.
evident that the measurements of Al b give no indication of the number of units involved. A psuedo first-order behavior may therefore be within reason.
The decline in rate after 120 days probably is caused by lack of precision in measurements, as well as by the probability that the polymerization mechanism itself can operate at a relatively rapid rate only when Al b units are plentiful enough so that random en counters between units occur very frequently. As concentrations de crease the probability of encounters between units drops off rapidly.
As a further observation, it might be noted that the upper size limit of the Al b particles seems to be fairly definite and specific. At least the solutions acted very much alike after the point in the aging process where significant losses of Al b began to take place.
The aging data provide a means for calculating the average size of Al b units during the time these were being most rapidly transformed into AK The concentration of Al b remaining in solution after 120 days' aging, subtracted from the amount present after about 40 days' aging, gives the quantity of aluminum converted from Al b to Al c during this period. The Alc is assumed to contain three hydroxide ions per aluminum ion. The change in pH of the solution during this aging period can be equated to the hydroxide demand of the Al b that was converted to Al c. When this is done the amcunt of hy droxide originally present in the converted Al b can readihr be calcu lated, and the value of the mole ratio OH:Al b determined for the material just before it became AK The size of the units can then be estimated from figure 25.
For example, in solution F the decrease in concentration of Al b between the 46-day and 121-day observations was 0.68 XlO~4 moles/ liter, and the pH change indicated a gain of O.llXlO"4 moles/liter in concentration of H+ during this period. The amount of hydroxide required for 0.68X1Q- 4 moles of A1(OH) 3 is 2.04 X10~4 moles. The

AGING OF ALUMINUM HYDROXIDE COMPLEXES D37
o
W
H
'I as
q (6
10uS
(N06
ivnaiS3dgiv 001 SHNIIAI
D38 CHEMISTRY OF ALUMINUM IN NATURAL WA^ER
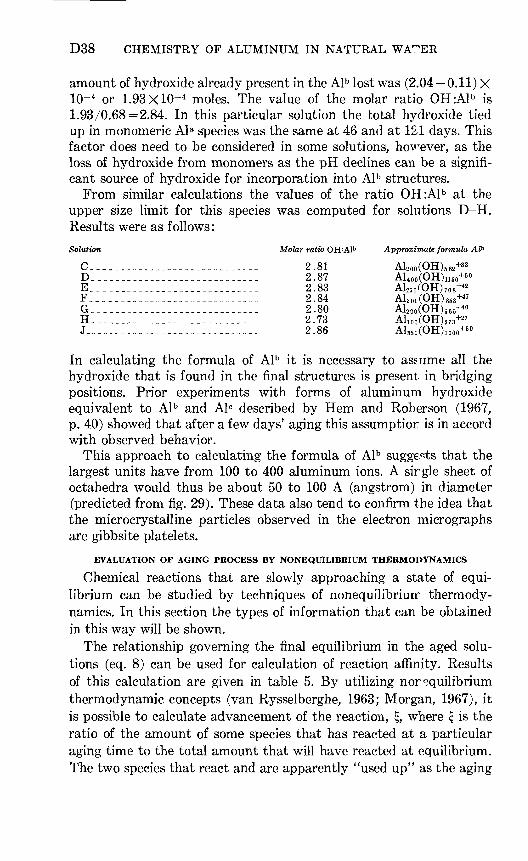
amount of hydroxide already present in the Al b lost was (2.04 0.11) X 10~ 4 or 1.93XlO~4 moles. The value of the molar ratio OH:Al b is 1.93/0.68=2.84. In this particular solution the total hydroxide tied up in monomeric Al a species was the same at 46 and at 121 days. This factor does need to be considered in some solutions, however, as the loss of hydroxide from monomers as the pH declines can be a signifi cant source of hydroxide for incorporation into Al b structures.
From similar calculations the values of the ratio OH:Al b at the upper size limit for this species was computed for solutions D-H. Results were as follows:
Solution Molar ratio OH:Alb Approximate formula A1P
C___.......................... 2.81 Al2 oo(OH) 662 +38D.......__.........._......_.- 2.87 Al 4 oo(OH) 116 o+50E......._.._...._...._........ 2.83 AWOH) 708 +42
2.84 Al 30c(OH)-+47+40G....._......_...........-_... 2.80 Al20o(OH) 560
H..._...._._...._-...-_....--. 2.73 Al10 o(OH) 273 +27J...._._...__.........___...... 2.86 Al35o(OH) 10 on +50
In calculating the formula of Al b it is necessary to assume all the hydroxide that is found in the final structures is present in bridging positions. Prior experiments with forms of aluminum hydroxide equivalent to Al b and Al° described by Hem and Roberson (1967, p. 40) showed that after a few days' aging this assumptior is in accord with observed behavior.
This approach to calculating the formula of Al b suggests that the largest units have from 100 to 400 aluminum ions. A sirgle sheet of octahedra would thus be about 50 to 100 A (angstrom) in diameter (predicted from fig. 29). These data also tend to confirm the idea that the microcrystalline particles observed in the electron micrographs are gibbsite platelets.
EVALUATION OF AGING PROCESS BY NONEQUILIBRIUM THERMODYNAMICS
Chemical reactions that are slowly approaching a state of equi librium can be studied by techniques of nonequilibriuir thermody namics. In this section the types of information that can be obtained in this way will be shown.
The relationship governing the final equilibrium in the aged solu tions (eq. 8) can be used for calculation of reaction affinity. Results of this calculation are given in table 5. By utilizing nor equilibrium thermodynamic concepts (van Rysselberghe, 1963; Morgan, 1967), it is possible to calculate advancement of the reaction, £, where £ is the ratio of the amount of some species that has reacted at a particular aging time to the total amount that will have reacted at equilibrium. The two species that react and are apparently "used up" as the aging

AGING OF ALUMINUM HYDROXIDE COMPLEXES D39
TABLE 5. Reaction affinities in kilocalories per mole, of solutions B through H inrelation to age
Hours1__ ____ 7
QO C LI& O
48_______ 7
505 6625.......
Days41__.__._ 6
77. _. 6
254 6
B
053
6~9
5
5
5
3
3
76
666
6
6
6
6
6
6
c
66
1?,
.5
.6
6
9
6
6
6
97
666
4
3
?,
?,
D
?.4
81
.2
.8
6
7
3
9
5
E
10.48.08.1
6.2
6.0
6.0
5.8
4.5
2.6
108
664
3
?,
1
1
F
5?,
51
.8
.3
5
8
5
3
0
G
11.67.67.0
5.83~2
2.3
1.9
1.1
.3
.0
128
744
2
1
1
1
H
,89
?,7
.1
.7
8
6
?,
.2
?,
process proceeds are Alb and OH~. Table 6 shows calculated £A i b values for solutions D, E, F, G and H.
It should be noted that in all cases the amount of Al b did not change until a certain aging time had elapsed. For calculating £A i b which is the ratio of the Al b reacted at a particular aging time to total amount originally present, an average value for total Alb noted was taken. From data of table 6, the curves of figure 29 were constructed. This figure shows £ A i b as a function of time. A tangent to a curve at any aging time is a measure of d^/dt at that particular aging time. From
TABLE 6. Advancement of the reaction (fAib) values and Alb residual values of solutionsin relation to age
[Alb, residual, concentrations X1(H]
Hours 23... __48____.-.96-...--.
168. __.--.288.......505-.....-625-....--
Days 41.......46.......77-.--.-.82.......
116.......121.......188.......193.__._._254.......259--.....
]
Alb
. 1.58
_ 1.54. 1.62
1.66
. 1.63
. 1.11
.34
.06
.09
.02
D
{Alb
0.000
.000
.000
.000
.000
.323
.789
.963
.938
.987
Alb
2.102.00
1.86
2.14
1.82
1.45
1.20
.49
.12
E
lAlb
0.000.000
.000
.000
.104
.286
.408
.758
QAO
Alb
2 nc
1.861.861.82
1 Qfi
.78
.26
.10
.02
F
lAlb
0.000
.000
.000
OQQ
cqn
.863
947
.990
i
Alb
1.201.15
1.04
.81
.40
1 9
019
.007
G
|Alb
.000
.000
.289
.649
.887
.962
QQO
All
0.50
.40
.39
.36
on
.17
.0)
.111
.00")
H
lAlb
0.000
.000
.000
.000
.268
.585
.878
1.000

D40 CHEMISTRY OF ALUMINUM IN NATURAL WATER
these d^/dt values plus the Al b concentrations at the same aging time, it is possible to estimate the order of the reactions over various dis crete time intervals.
In general,dx 7 = k xn , dt
(9)
where x is the concentration of some species (in our case Al b), t is time, A; is a constant, and n is the order of the reaction relative to species x.
_d\,x (total)/dt dt
Thus, for a time interval such as between 12 and 26 days' aging, values of d^/dt and x can be substituted in equation 9, k can be eliminated, and the value of n can be determined. By this general procedure the data of table 7 were determined. Solution E was not included because of anomalies in the data for this solution. From the table it can be seen that the reaction involving the loss of Al b from solution is very close to the first order with respect to Al b over much of the aging time.
1.0
0.8
0.6
0.4
0.2
0
SOLUTION D
i i i i i i i i"0 20 40 60 80 100 120 140 160 180 200 220 240 260
AGE TIME, IN DAYS
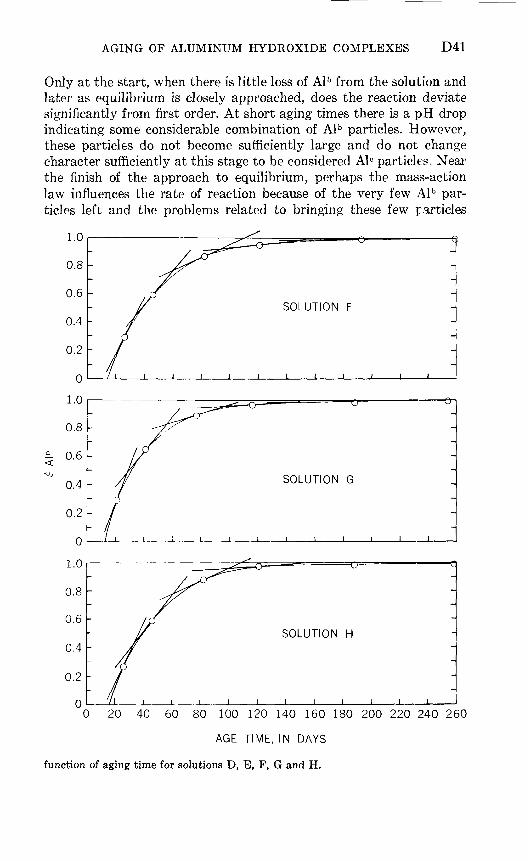
FIGURE 29. Advancement of the reaction (£AI»>) as a
AGING OF ALUMINUM HYDROXIDE COMPLEXES D41
Only at the start, when there is little loss of Alb from the solution and later as equilibrium is closely approached, does the reaction deviate significantly from first order. At short aging times there is a pH drop indicating some considerable combination of Al b particles. However, these particles do not become sufficiently large and do not change character sufficiently at this stage to be considered Alc particles. Near the finish of the approach to equilibrium, perhaps the mass-action law influences the rate of reaction because of the very few Alb par ticles left and the problems related to bringing these few particles
I_____I ! I I I I 1 I
0 20 40 60 80 100 120 140 160 180 200 220 240 260
AGE TIME, IN DAYS
function of aging time for solutions D, E, F, G and H.
D42 CHEMISTRY OF ALUMINUM IN NATURAL WATER
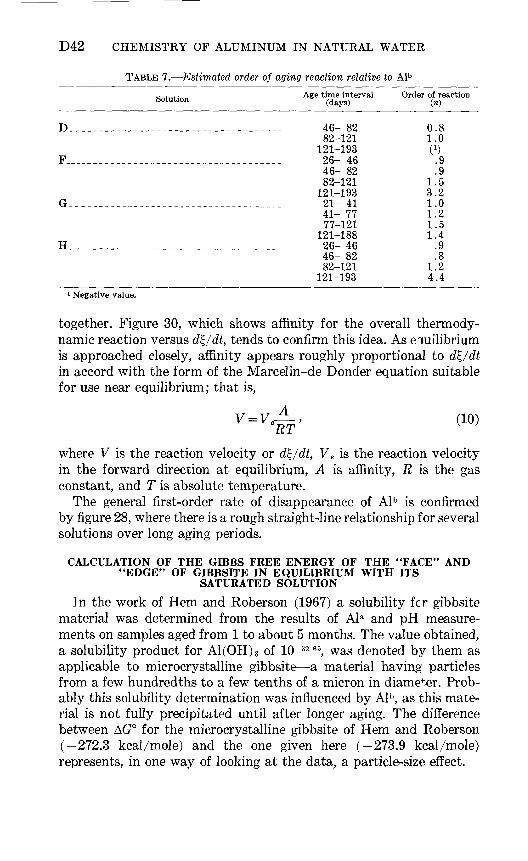
TABLE 7. Estimated order of aging reaction relative to AIba , .. Age time interval Order of reaction Solutlon (days) (n)
D.. _._.._._.......____.
F
G. ___.....__.._.____. _.
H. .__.._.-___.___.____
..-.___...__..__ 46- 8282-121
121-193 ........._...... 26- 46
46- 82 82-121 121-193
._..--._....__._ 21- 4141- 77 77-121
121-188 ...-._...--.-..- 26- 46
46- 82 82-121
121-193
0.81.00).9.9
1.5 3.2 1.01.2 1.5 1.4 .9.8
1.2 4.4
1 Negative value.
together. Figure 30, which shows affinity for the overall thermody- namic reaction versus d^/dt, tends to confirm this idea. As equilibrium is approached closely, affinity appears roughly proportional to d^/dt in accord with the form of the Marcelin-de Bonder equation suitable for use near equilibrium; that is,
(10)
where V is the reaction velocity or d^/dt, Ve is the reaction velocity in the forward direction at equilibrium, A is affinity, R is the gas constant, and T is absolute temperature.
The general first-order rate of disappearance of Al b is confirmed by figure 28, where there is a rough straight-line relationship for several solutions over long aging periods.
CALCULATION OF THE GIBBS FREE ENERGY OF THE "FACE" AND"EDGE" OF GIBBSITE IN EQUILIBRIUM WITH ITS
SATURATED SOLUTION
In the work of Hem and Roberson (1967) a solubility fcr gibbsite material was determined from the results of Al a and pH measure ments on samples aged from 1 to about 5 months. The value obtained, a solubility product for A1(OH) 3 of 10~32 65, was denoted by them as applicable to microcrystalline gibbsite a material having particles from a few hundredths to a few tenths of a micron in diameter. Prob ably this solubility determination was influenced by Alb, as this mate rial is not fully precipitated until after longer aging. The difference between AG° for the microcrystalline gibbsite of Hem and Roberson (-272.3 kcal/mole) and the one given here (-273.9 kcal/mole) represents, in one way of looking at the data, a particle-size effect.

AGING OF ALUMINUM HYDROXIDE COMPLEXES D43
8 12 16 2
d(Mh /dt (1/hr X103 )
EXPLANATION
O SOLUTION D V SOLUTION G
O SOLUTION F D SOLUTION H
FIGURE 30. Reaction affinity as a function of reaction velocity (d%A.v>/dt).
From thermodynamic reasoning (Adamson, 1967) it can be rhown, in principle at least, that small crystals should exhibit a greate" solu bility than large ones. The age study solutions, over much of the aging time, appeared supersaturated with respect to monomeric aluminum species. During the same period, there appeared to be polynuclear aluminum present. If the polynuclear particles are considered to be extremely small crystals, it should be possible from the data ot tained in the course of experimentation to calculate the Gibbs free energy of the (001) crystal face (which will be designated the gibbsite "face") and the (110) and (100) crystal faces (which together will be desig nated the gibbsite "edge"). These calculations will be made with the gibbsite in equilibrium with its saturated solution. It will also be necessary to estimate the dimensions of the polynuclear particles.
If the Al b and Al c particles are considered to have the shape of hexagonal platelets of roughly the following form
D44 CHEMISTRY OF ALUMINUM IN NATURAL WA^ER
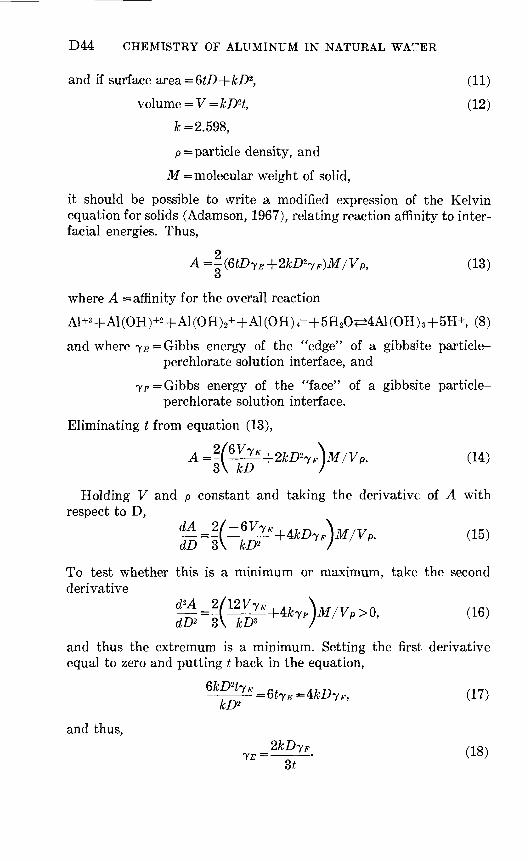
and if surface area = QtD+kD2, (11)
volume = V = kDH, (12)
k =2.598,
p= particle density, and
M= molecular weight of solid,
it should be possible to write a modified expression of the Kelvin equation for solids (Adamson, 1967), relating reaction affinity to inter- facial energies. Thus,
A =^(QtDyE +2kD27F)M/VP, (13) o
where A =affinity for the overall reaction
Al+3 +Al(OH)+2 +Al(OH) 2++Al(OH) 4-+5H20^±4Al(OH) 3 +5H+ (8)
and where 7#=Gibbs energy of the "edge" of a gibbsite particle- perchlorate solution interface, and
7f=Gibbs energy of the "face" of a gibbsite particle- perchlorate solution interface.
Eliminating t from equation (13),
A =¥±+ZkD»>YM/Vp. (14)
Holding V and p constant and taking the derivative of A with respect to D,
<M = 2/-6y7g+4H) \M/V (15)dD 3\ kD* ) '
To test whether this is a minimum or maximum, take the second derivative
TO A n /1 r>T7 \
(16)
and thus the extremum is a minimum. Setting the first derivative equal to zero and putting t back in the equation,
(17)kD*
and thus,

AGING OF ALUMINUM HYDROXIDE COMPLEXES D45
Substituting back into equation 13 and also eliminating V,
_tAp. (19) 7F 4M
Similarly,(20)
6M 6M
Equation 18 can also be written as
s 2fcD (21)
Close observation of the electron micrograph in figure 19 indicates that the ratio D/t has a numerical value of about 2. If this value is assumed, equation 21 reduces to
"y f =3.46 (22)7F
Equations 19-22 can now be used to estimate JE and yF . Affinity for a particular solution at a particular aging time can be readily obtained from the aging study. The density of gibbsite can be used for p. The problem, then, in solving these equations revolves about estimating D.
According to Hem and Roberson (1967), the probable way in which six or more aluminum hydroxide-water octahedra are bound to gether is through sharing of two adjacent hydroxide ions. Six-mem- bered rings of the form shown in figure 26 can be produced owing to the angles at which the octahedra are joined. The maximum dimen sion of such a ring is about 9 A, and a single ring probably has the formula Al 6 (OH) 12 (H20)i2+6 (Hem and Roberson, 1967; Hsu and Bates, 1964b) if all hydroxide is assumed to be present in br'dging, or shared positions. This type of structure should grow by coalescence of such rings which would accompany deprotonation of water in the shared positions. Hsu and Bates (1964b) proposed a coalesced-ring structural pattern of the types shown in figure 27 for such enlarged structures. The OH :A1 ratio of the single-ring structure is 2.0, and as the rings coalesce into larger structures, the OH:A1 ratio becomes large, approaching a maximum of 3.0 for very large structures. Figure 25 shows the relationship between the number of A1+ 3 ions per struc tural unit and OH:A1 ratio. Considering that the maximum dimen-

D46 CHEMISTRY OF ALUMINUM IN NATURAL WATER
sion across a ring is 9 A, the following simplified figure can be con structed :
9A
|*-4.5A-*|
7.8A
_L
Using Hsu and Bates' coalescence structure, it can be reen that, if there are six aluminum atoms per structure, the D dimension is about 4.5 A; if there are 24, the dimension D is about 15.6 A; if there are 54, the dimension D is about 23.4 A; and so forth. From this information, figure 31 was constructed. If, then, the OH:A1 ratio of the small
2.8
2.4
<
o2.0
1.6
1.2
I I I0 8020 40 60
DIMENSION Z>,IN ANGSTROMS
FIGURE 31. Relationship between the D dimension of the Alb particles and the OH:Alb ratio of these particles.
AGING OF ALUMINUM HYDROXIDE COMPLEXES D47
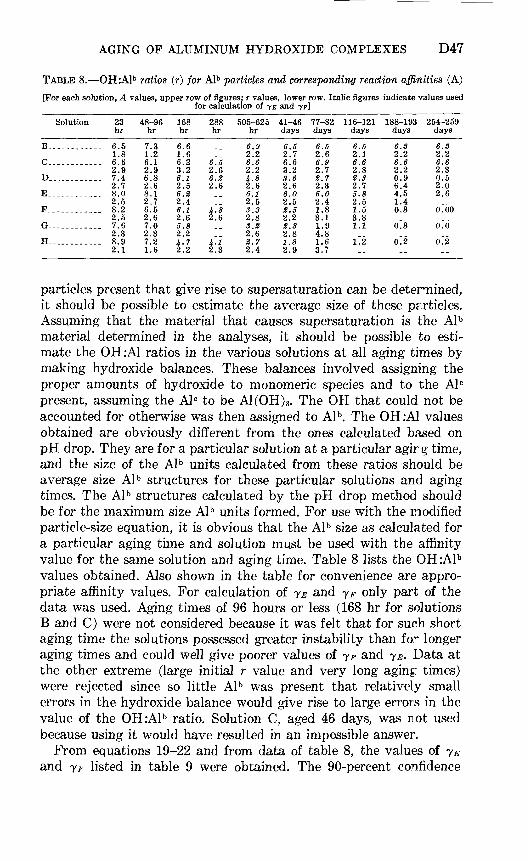
TABLE 8. OH:Alb ratios (r) for Alb particles and corresponding reaction affinities (A)[For each solution, A values, upper row of figures; r values, lower row. Italic figures indicate values used
for calculation of yE and yp]
Solution 23 hr
B--____
C------
D--_---_
£-._--_
P.......
G ....
EL......
----- 6.1.
----- 6.2,
----- 7.2.
----- 8,2.
----- 8,2.
----- 7.2.
.-- - 8.2.
R.8 .6 .9 .4 .7 0
.5
.2 ,5 6
.3
.9 ,1
48-96 hr
7.31.2 6.1 2.96.8 2.6 8.12.7 6.5 2.6 7.02.3 7.2 1.6
168 hr
6.61.6 6.2 3.2 6.1 2.5 6.22.4 6.1 2.6 5.82.2 4.7 2.2
288 hr
6~5
2.6 6.2 2.6
U.8 2.6
U-1 2.3
505-625 hr
6.9 2.2 6.6 2.2 U.8 2.6 6.1 2.5 3.3 2.8 3.2 2.6 2.7 2.4
41-46 days
6.5 2.7 6.6 3.2 3.6 2.6 6.0 2.5 2.5 2.2 2.3 2.8 1.8 2.9
77-82 days
6.5 2.6 6.9 2.7 2.7 2.3 6.0 2.4 1.8 3.1 1.9 4.8 1.6 3.7
116-121 days
6.5 2.1 6.62 0
. O
2.3 2.7 5.8 2.5 1.5 3.8 1.11~2
188-193 days
6.3 2.2 6.6 2.2 0.9 6.4 4.5 1.4 0.30~3
0~2
254-259 days
6.3 2.2 6.6 2.3 0.5 2.0 2.60~00
o~60~2
particles present that give rise to supersaturation can be determined, it should be possible to estimate the average size of these particles. Assuming that the material that causes supersaturation is the Alb material determined in the analyses, it should be possible to esti mate the OH :A1 ratios in the various solutions at all aging times by making hydroxide balances. These balances involved assigning the proper amounts of hydroxide to monomeric species and to the Alc present, assuming the Alc to be A1(OH) 3. The OH that could not be accounted for otherwise was then assigned to Alb. The OH :A1 values obtained are obviously different from the ones calculated based on pH drop. They are for a particular solution at a particular agirg time, and the size of the Al b units calculated from these ratios should be average size Al b structures for these particular solutions and aging times. The Al b structures calculated by the pH drop method should be for the maximum size Alb units formed. For use with the modified particle-size equation, it is obvious that the Alb size as calculated for a particular aging time and solution must be used with the affinity value for the same solution and aging time. Table 8 lists the OH :Al b values obtained. Also shown in the table for convenience are appro priate affinity values. For calculation of yE and yF only part of the data was used. Aging times of 96 hours or less (168 hr for solutions B and C) were not considered because it was felt that for such short aging time the solutions possessed greater instability than fo^ longer aging times and could well give poorer values of yF and yE. Data at the other extreme (large initial r value and very long aging times) were rejected since so little Al b was present that relatively small errors in the hydroxide balance would give rise to large errors in the value of the OH:Alb ratio. Solution C, aged 46 days, was rot used because using it would have resulted in an impossible answer.
From equations 19-22 and from data of table 8, the values of yE and jF listed in table 9 were obtained. The 90-percent confidence

D48 CHEMISTRY OF ALUMINUM IN NATURAL WATER
TABLE 9. Calculated J-E and JF values, in ergs per square centimeterAge re VF
Solution B505 hr.._._._
41 days77 days. . . _
116 days____188 days. . . .254 days. . . .
280940
__.._ 740_____ 210_____ 270
970
82 273 213
6078 78
Solution C288hr....._.625 hr_.__._
82 days....121 days193 days. . . .259 days_...
._... 740---_ 280_.___ 1010
1470_-.._ 280_____ 360
213 82
291 425
82 104
Solution D168hr_-__.__288 hr_ _ . . _ _625hr...._._
82 days_...121 days....
540_..__ 700__.__ 540_____ 400..... 150.._._ 330
156 204 156 117
44 96
Age re 7F
Solution E168hr_.._.._505hr_..._._
77 days...,116 days____
..... 420_____ 540..... 520...._ 400-..._ 510
121 156 151 117 147
Solution F168 hr.......288 hr. .....625 hr._...._46 days _
_____ 690-_.-. 540
790_____ 100
200 156 208
30
Solution G
168 hr.......CAC >.,.
41 days
_..__ 240o/?A
_____ 510
69 104 147
Solution H168hr..__ .288hr._..__.625 hr__.__._46 days
_____ 200-_... 180..... 180__.._ 800
57 52 52
230
interval of the mean of yE, using the t distribution, is 483 ±?4 ergs/cm2 (ergs per square centimeter). The similar confidence interval of the mean of JF is 140±24 ergs/cm2 . It is of interest to compare these values with other Gibbs energy values of crystals in equilibrium with their saturated solutions as measured by solubility versus particle- size studies. Eniistun and Tiirkevich (1960) reported the value of 85 ergs/cm2 for SrS0 4-H20 system. Schindler (1967) reports 770±330 ergs/cm2 for ZnO-0.2M NaC10 4 solution, 690 ±150 for CuO-0.2M NaC10 4 solution, and 410±130 for Cu(OH) 2-0.2 NaC10 4 solution. The last value is of particular interest considering a hydroxide is being measured and the closeness to our value for the gibHite edge- perchlorate solution system.
Several comments should be made regarding 7^ and JE- Probably in addition to edge and face energies a "corner" energy should be taken into account. Considering figures 26 and 27 it will be noticed that all "edge" sites cannot be the same. One could, perhaps, think of the single six-membered ring as consisting only of "faces" and "corners." Such "corners," of course, must have dimensions of area. When two rings become bound together, an "edge" also is introduced. As the structure becomes larger, this "edge" area becomes relatively greater compared to "corner" area. Many of the electron micrographs show ing negative gold particles adsorbed on gibbsite edges, imperfections, and, in particular, corners tend to confirm the importance of corner adsorption sites and the greater energies associated with these loca tions.

AGING OF ALUMINUM HYDROXIDE COMPLEXES D49
CONCLUSIONS RELATIVE TO ALUMINUM IN MILDLY ACID AQUEOUS MEDIA
From the aluminum hydrolysis work and electron microscopy, several conclusions can be reached relative to the behavior of alu minum in acid aqueous systems. These conclusions are:1. If aluminum perchlorate solutions are made up to contain
4.54xlO~ 4 moles/liter aluminum (total ionic strength about 10~2 molar), provided the nominal ratio of bound hydroxide to aluminum (rn value) is 3.00 or less, there will initially be present in the system three different forms of aluminum which can be designated Al a, Al b , and AK Form Al a appears to be composed entirely of the monomeric species A1+ 3, A10H+2, A1(OH) 2+, and A1(OH) 4~. Form Al b appears to consist of polynuclear aluminum hydroxide species probably of a general six-membered ring struc ture in which each aluminum is bonded to its neighbor through shared pairs of OH ions. The individual rings tend to coalesce into larger structures until they ultimately become large enough to be filtered out and identified by electron microscopy as gibbsite crystals. The manner in which the rings coalesce appears to be gov erned by a first-order rate law relative to the Alb material. The Alb particles appear to range in size up to Alioo(OH) 27 3+27 to Al 4 oo(OH)ii50+50. Form Alc is solid material which may be ini tially all or partly amorphous, but which rapidly becomes crystalline and takes on the structure of gibbsite.
2. For a particular rn value the amount of Ala is nearly constant, at least after 23 hours' aging, and is independent of how long the solution has aged and the rate at which base was added to the solution in the initial solution preparation. A corollary to this statement is that the amount of Alb+c also is constant. The significance of these statements is great for they indicate that the Gibbs free energy of formation of Al b is not much less than solid AH In fact, from the affinity calculations the difference appears to be only a few kilocalories. Although the concentration of Al a remains constant with aging time the activities of the individual monomeric species adjust themselves almost instantly to change in pH of the solution.
3. The pH of the solutions decrease with aging time until equilibrium pH values are ultimately achieved. The equilibrium pH values are consistent with known thermodynamic values for mono meric species and solubility products. The equilibrium pH achieved in a particular solution depends on its initial rn value. The lower the rn value the lower is the equilibrium pH. The rate at which equilibrium is approached depends on rn value and also on the rate at which base is added during solution make

D50 CHEMISTRY OF ALUMINUM IN NATURAL WATER
up. The lower the rn value the slower is the progress toward equilibrium. For example, if rn is around 2.8 equilibrium may be achieved in 6 or 8 months (depending on how much Al b was initially formed during base addition). If r» value is 1.0 or less, equilibrium will probably not be achieved after several years' aging.
4. The amount of Al b present in solution after 23 hour*'' aging de pends on the rate of base addition during solution preparation. The slower the base is added, the greater the quant: ty of Ala+b formed and the less Al c initially formed. Some of the Al a formed is rapidly converted into Al b, but this conversion is limited by the particle-size solubility effect. Thus, as soon as enough Al b is formed to bring this effect into operation, the concentration of Al a remains constant. The amount of Al b present then decreases as a function of aging time. Over considerable time intervals during aging, the disappearance of Al b is approximately first order with respect to concentration of Al b . As Al b disappears from the system, an equivalent amount of Alc is formed. It seems that Al b particles are coalescing into larger particles as a function of time. At some critical size the character of the Al b particles appears to change, and they behave as the less reactive Al° particles. After equilibrium is achieved, the quartity of Al b present is below the detection limit.
5. If Al b is considered to be small solid particles holding the solution at apparent supersaturation relative to activities of monomeric species, it is possible to estimate the Gibbs free energy of the "face" (TF) and "edge" (7^) of a gibbsite particle-perchlorate interface. From the present work, assuming the overall reac tions taking place to be
Al+ 3 +Al(OH)+2 +Al(OH)2++Al(OH) 4-+5H20<=±4Al(OH) 3 +5H+,
the values (90-percent-confidence-level intervals for the mean of values obtained) for these excess energies are
7£=483±84 ergs/cm2, and
7F = 140 ±24 ergs/cm2 .
REFERENCES
Adamson, A. W., 1967, Physical chemistry of surfaces: New York, Interscience Publishers, 747 p.
Butler, J. N., 1964, Ionic equilibrium A mathematical approach: Reading, Massa chusetts, Addison-Wesley Publishing Co., 547 p.
Eniistun, B. V. and Tiirkevich, John, 1960, Solubility of fine particles of strontium nitrate: Am. Chem. Soc. Jour., v. 82, p. 4502-4509.

AGING OF ALUMINUM HYDROXIDE COMPLEXES D51
Hem, J. D., 1968, Graphical methods for studies of aqueous aluminum hyc^oxide,fluoride and sulfate complexes: U.S. Geol. Survey Water-Supply Paper 3827-B,p. 3-5.
Hem, J. D., and Roberson, C. E., 1967, Form and stability of aluminum hydroxidecomplexes in dilute solution: U.S. Geol. Survey Water-Supply Paper I827-A,55 p.
Hsu, P. H., and Bates, T. F., 1964a, Fixation of hydroxy-aluminum polymers byvermiculite: Soil Sci. Soc. America Proc., v. 28, p. 763-769.
1964b, Formation of X-ray amorphous and crystalline aluminum hydroxides:Mineralog. Mag., v. 33, p. 749-768.
Latimer, W. M., 1952, Oxidation Potentials: New York, Prentice-Hall Inc.. 392 p. Morgan, J. J., 1967, Applications and limitations of chemical thermodynamics in
natural water systems, in Equilibrium concepts in natural water systems:Am. Chem. Soc. Advances in Chemistry Series 67, p. 1-29.
Raupach, M., 1963a, Solubility of simple aluminum compounds expected in soils,II. Hydrolysis and conductance of A13+ : Australian Jour. Soil Research, v. 1,p. 36-45.
1963b, Solubility of simple aluminum compounds expected in scils, IV. Reactions of aluminum hydroxide under acid conditions: Australian Jcur. Soil Research, v. 1, p. 55-62.
Rysselberghe, Pierre van, 1963, Thermodynamics of irreversible processes: New York, Blaisdell Publishing Co., 165 p.
Schindler, P. W., 1967, Heterogenous equilibria involving oxides, hydroxides, car bonates, and hydroxide carbonates, in Equilibrium concepts in natural water systems: Am. Chem. Soc. Advances in Chemistry Series 67, p. 196-221.
Schoen, Robert, and Roberson, C. E., 1970, Structures of aluminum hydroxide and geochemical implications; Am. Mineralogist, v. 55, p. 43-77.
Smith, R. W., 1969, The state of Al(III) in aqueous solution and adsorption of hydrolysis products on aAl2O3 : Palo Alto, Calif., Stanford Univ., Ph. D. dis sert., 194 p.
1971, Relations among equilibrium and non-equilibrium aqueous species of aluminum hydroxy complexes: Am. Chem. Soc. Advances in Chemistry Series 106, p. 250-279.
Thiessen, P. A., 1942, Wechselseitige Adsorption von kolloiden: Ztschr. Elecktro- chem. Bd. 48, Nr 12, p. 675-680.
1947, Kennzeichnung submikroskopischer grensflachenbereiche Verschie- denartiger Wirksamkeit: Z. Anorg. Chemie, Bd. 253, p. 161-169.
Turner, R. C., 1969, Three forms of aluminum in aqueous systems detenrmed by 8-quinolinolate extraction methods: Canadian Jour. Chemistry, v. 47, p. 2521- 2527.
U.S. GOVERNMENT PRINTING OFFICE: 1972 O 466-125