effect of acute l-alanyl-l-glutamine …sustamine.com.br/site/artigos/2.pdf · ingestion on...
TRANSCRIPT

EFFECT OF ACUTE L-ALANYL-L-GLUTAMINE (SUSTAMINETM) AND ELECTROLYTE INGESTION ON COGNITIVE FUNCTION, MULTIPLE OBJECT TRACKING AND
REACTION TIME FOLLOWING PROLONGED EXERCISE
by GABRIEL JOSE PRUNA
B.S. University of Central Florida, 2012
A thesis submitted in partial fulfillment of the requirements for the degree of Master of Science
in the College of Education and Human Performance at the University of Central Florida
Orlando, Florida
Spring Term 2014

ABSTRACT
Changes in physiological function occurring during a body water deficit may result in
significant decrements in performance, cognitive function and fine motor control during
exercise. This may be due to the magnitude of the body water deficit. Rehydration strategies are
important to prevent these deleterious effects in performance. The purpose of this study was to
examine the changes before and after prolonged exercise of an alanine-glutamine dipeptide (AG)
on cognitive function and reaction time.
Twelve male endurance-trained runners (age: 23.5 ± 3.7 y; height: 175.5 ± 5.4 cm;
weight: 70.7 ± 7.6 kg) participated in this study. Participants were asked to run on a treadmill at
70% of their predetermined VO2max for 1 h and then run at 90% of VO2max until volitional
exhaustion on four separate days (T1-T4). T1 was a dehydration trial and T2-T4 were all
different hydration modalities (electrolyte drink, electrolyte drink with a low dose of AG,
electrolyte drink with a high dose of AG, respectively) where the participants drank 250 mL
every 15 min. Before and after each hour run, cognitive function and reaction tests were
administered. Hopkins Magnitude Based Inferences were used to analyze cognitive function and
reaction time data.
Results showed that physical reaction time was likely faster for the low dose trial than the
high dose trial. Dehydration had a possible negative effect on the number of hits in 60-sec
compared to both the low and high dose trials. Comparisons between only the electrolyte drink
and the high dose ingestion appeared to be possibly negative. Analysis of lower body quickness
indicates that performance in both the low and high dose trials were likely improved (decreased)
ii

in comparison to the dehydration trial. Multiple object tracking analysis indicated a possible
greater performance for dehydration and low dose compared to only the electrolyte drink, while
there was a likely greater performance in multiple object tracking for the high dose trial
compared to consumption of the electrolyte drink only. The serial subtraction test was possibly
greater in the electrolyte drink trial compared to dehydration.
Rehydration with the alanine-glutamine dipeptide during an hour run at a submaximal
intensity appears to maintain or enhance subsequent visual reaction time in both upper and lower
body activities compared to a no hydration trial. The combination of the alanine-glutamine
dipeptide may have enhanced fluid and electrolyte absorption from the gut and possibly into
skeletal tissue to maintain neuromuscular performance.
iii

ACKNOWLEDGMENTS
First of all, I would like to thank all 12 participants for volunteering in this study.
Without their time and effort, we would not have been able to accomplish our goals. The Human
Performance Laboratory staff, namely Adam Jajtner, Jeremy Townsend, Michael La Monica and
Johnathan Bohner, was a tremendous help in completing the study. I also would like to thank
my family for their support and the support of my friends, especially my lovely girlfriend Tara.
She was always there to help whenever I needed it.
I would like to give a special thank you to my partner and the principle investigator of
this study, William McCormack. William was a great help, not only during the study, but as a
mentor throughout my whole thesis process. He guided me in the right direction to ensure that I
would succeed. He did all of this while he was busy working on his own dissertation. I truly
appreciate all of his guidance and leadership.
Finally, I would also like to thank my thesis committee, Dr. Jeffrey Stout, Dr. Maren
Fragala, Dr. David Fukuda and most especially my thesis advisor, Dr. Jay Hoffman. Dr.
Hoffman made this all possible in terms of helping starting up the study, analyzing the data and
assisting in writing/editing my thesis. I could not have asked for a better advisor to lead me
through this process as well as my entire graduate program here at the University of Central
Florida. Without all of the help from all of these special people I have stated above, none of this
would have been possible. I could not be more thankful for all of your help in my path to
achieve my Master’s degree. Thank you!
iv
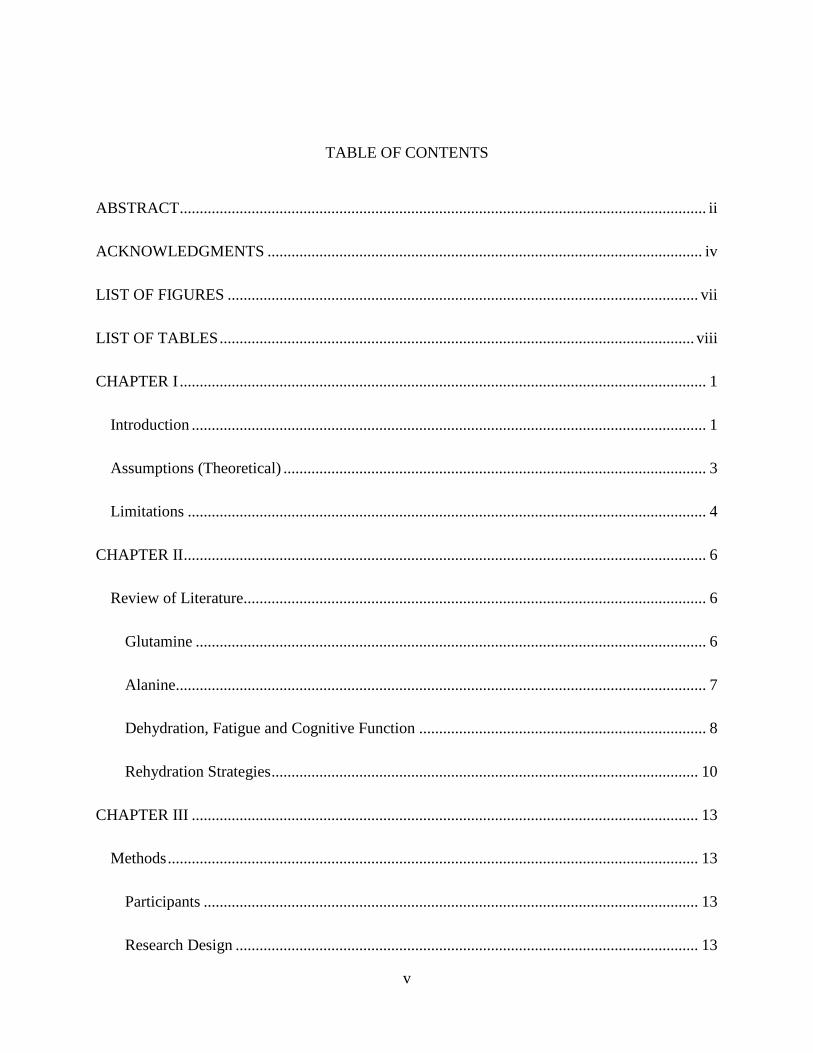
TABLE OF CONTENTS
ABSTRACT .................................................................................................................................... ii
ACKNOWLEDGMENTS ............................................................................................................. iv
LIST OF FIGURES ...................................................................................................................... vii
LIST OF TABLES ....................................................................................................................... viii
CHAPTER I .................................................................................................................................... 1
Introduction ................................................................................................................................. 1
Assumptions (Theoretical) .......................................................................................................... 3
Limitations .................................................................................................................................. 4
CHAPTER II ................................................................................................................................... 6
Review of Literature.................................................................................................................... 6
Glutamine ................................................................................................................................ 6
Alanine..................................................................................................................................... 7
Dehydration, Fatigue and Cognitive Function ........................................................................ 8
Rehydration Strategies ........................................................................................................... 10
CHAPTER III ............................................................................................................................... 13
Methods ..................................................................................................................................... 13
Participants ............................................................................................................................ 13
Research Design .................................................................................................................... 13
v

Reaction Testing .................................................................................................................... 16
Cognitive Function Measurements ........................................................................................ 18
Statistical Analysis ................................................................................................................ 19
CHAPTER IV ............................................................................................................................... 21
Results ....................................................................................................................................... 21
CHAPTER V ................................................................................................................................ 29
Discussion ................................................................................................................................. 29
APPENDIX A UCF IRB APPROVAL LETTER ........................................................................ 33
APPENDIX B NEW ENGLAND IRB APPROVAL LETTER ................................................... 35
APPENDIX C INFORMED CONSENT ...................................................................................... 37
APPENDIX D MEDICAL QUESTIONNAIRE AND PAR-Q .................................................... 47
APPENDIX E FLYER .................................................................................................................. 52
REFERENCES ............................................................................................................................. 54
vi

LIST OF FIGURES
Figure 1. Study Protocol 14
Figure 2. Body weight losses for all four run trials. 21
Figure 3a. Changes in Visual Reaction Time between dehydration and drinking trials. 22
Figure 3b. Changes in Motor Reaction Time between dehydration and drinking trials. 22
Figure 3c. Changes in Physical Reaction Time between dehydration and drinking trials. 23
Figure 4. Changes in number of hits in 60 sec between dehydration and drinking trials. 24
Figure 5. Changes in hits with a cognitive stimulus between dehydration and drinking trials. 25
Figure 6. Changes in lower body quickness between dehydration and drinking trials. 26
Figure 7. Changes in multiple object tracking between dehydration and drinking trials. 27
vii
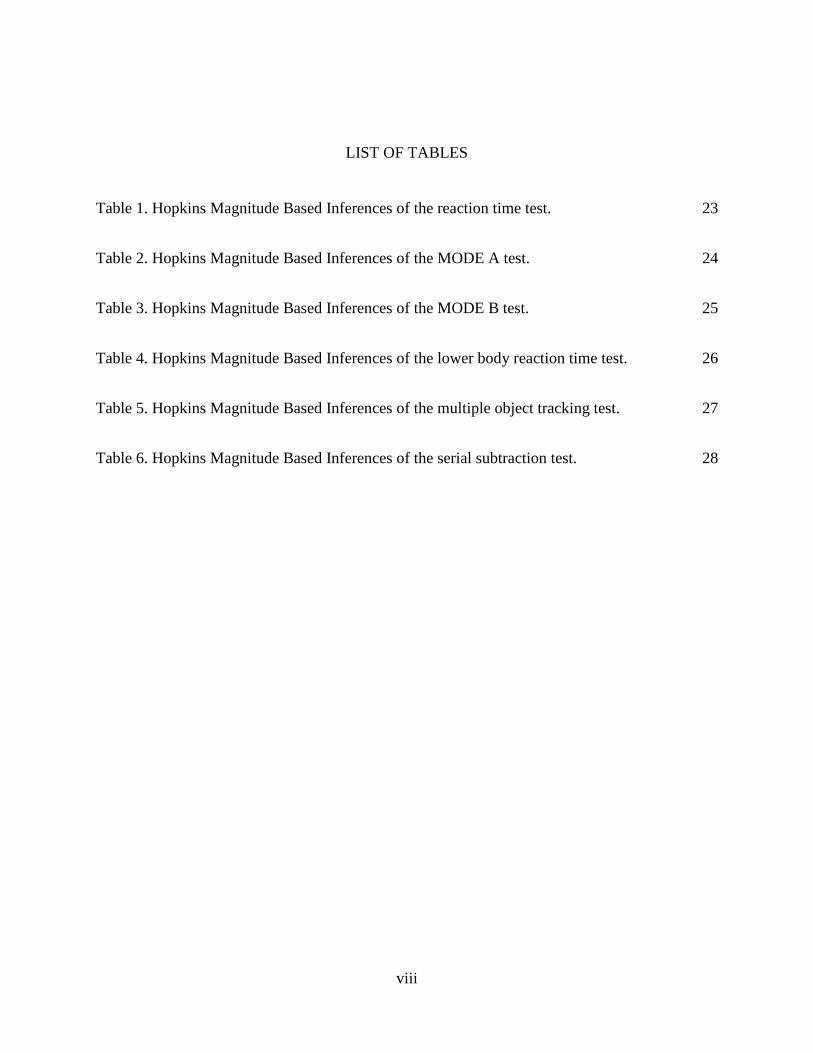
LIST OF TABLES
Table 1. Hopkins Magnitude Based Inferences of the reaction time test. 23
Table 2. Hopkins Magnitude Based Inferences of the MODE A test. 24
Table 3. Hopkins Magnitude Based Inferences of the MODE B test. 25
Table 4. Hopkins Magnitude Based Inferences of the lower body reaction time test. 26
Table 5. Hopkins Magnitude Based Inferences of the multiple object tracking test. 27
Table 6. Hopkins Magnitude Based Inferences of the serial subtraction test. 28
viii

CHAPTER I
Introduction
Changes in physiological function occurring during a body water deficit may result in
significant decrements in performance during exercise. These changes appear to be related to the
magnitude of water deficit. During exercise in a temperate environment maximal aerobic power
appears to be maintained when body weight loss does not exceed 3% (Goulet, 2012; 2013),
however as body water deficits exceed 3% significant decreases in aerobic power and greater
fatigue rates are reported (Casa et al., 2010; Goulet, 2012; 2013). During short duration
anaerobic events (e.g., high intensity activity of 40 sec or less), the effect of a body water deficit
on strength, power and anaerobic capacity does not appear to impede performance, even when
the magnitude of dehydration reaches 5% body weight loss (Jacobs, 1980). This is relevant for
sports that involve high intensity, short duration events. However, in sports that rely on
intermittent bouts of high intensity activity, such as basketball or football, dehydration often
occurs as a result of inadequate fluid intake. Although power performance has been shown to be
maintained in such events (Dougherty, Baker, Chow & Kenney, 2006; Hoffman et al., 1995;
2012), levels of hypohydration of approximately 2% (ranging from 1.9% – 2.3%) have been
shown to result in significant performance decrements (e.g., 8% - 12.5% difference in shooting
percentages and a significant slower response in visual reaction time) (Hoffman et al., 1995;
2012). This may potentially impact game outcomes as a thirst response doesn’t appear to occur
until a body water deficit of approximately 2% is reached (Rothstein, Adolph, & Wells, 1947).
1

In addition to decrements in fine motor control and reaction time during mild levels of
hypohydration, previous studies have also indicated that a body water deficit of this magnitude
can also impair cognitive performance (Ganio et al., 2011; Lieberman et al., 2005;
Tomporowski, Beasman, Ganio, & Cureton, 2007). Ganio and colleagues (2011) indicated that
a combination of diuretic and exercise induced -1.59% loss in body weight resulted in a decrease
in cognitive performance with specific decrements in visual vigilance and visual working
memory. Others have demonstrated that slightly greater levels of dehydration (2% - 3% body
weight loss) induced by exercise only, resulted in no detrimental effect in short term memory,
but a significant decrement in executive functioning (i.e., ability to move through problem sets)
(Tomporowski, Beasman, Ganio, & Cureton, 2007). However, when dehydration (2.6% body
weight loss) is induced by water restriction only, cognitive-motor performance may not be
affected (Szinnai et al., 2005). It appears that the combination of fatigue and fluid deprivation
during exercise has a more profound effect on cognitive function than dehydration only.
To reduce potential performance decrements during exercise the concept of developing a
rehydration strategy becomes imperative. Rehydrating with electrolyte drinks has been
suggested to be a potential alternative to water only rehydration. The benefit of this rehydration
strategy is that the flavored drink may induce greater hydration (Hubbard et al., 1990), but of
even more importance is that electrolyte drinks may prevent hyponatremia that becomes a
concern with water only rehydration (Almond et al., 2005). However, this does not appear to be
an issue in exercise durations that are less than 3 – 4 hours in duration. Although electrolyte loss
may affect motor unit recruitment and muscle contractile capabilities (Sjogaard, 1986), there is
little to no research that has examined the efficacy of electrolyte supplementation on high
2

intensity activity. Recently, a rehydration strategy using an alanine-glutamine dipeptide was
demonstrated to enhance fluid uptake and reduce the magnitude of performance decrements
during exercise to exhaustion more than water alone in dehydrated subjects (Hoffman et al.,
2010). A subsequent study examined the effect of this dipeptide during a competitive basketball
game (Hoffman et al., 2012). Participants consuming the dipeptide were able to maintain
shooting accuracy and respond to a visual stimulus significantly quicker than when they
consumed water only. The alanine-glutamine dipeptide is thought to enhance fluid and
electrolyte uptake from the gut (Lima et al., 2002). Interestingly, the previous investigations
examining the ergogenic effects of this dipeptide have used water as the fluid medium that it is
delivered. Whether these affects can be exacerbated when combined with an electrolyte drink has
not been examined. Thus, the purpose of this study was to examine the efficacy of two different
doses of the alanine-glutamine dipeptide in a commercially available electrolyte drink to the
electrolyte drink only on multiple object tracking, reaction time and cognitive function following
endurance activity.
Assumptions (Theoretical)
1. Subjects accurately answered the medical history and activity questionnaire.
2. All subjects gave maximal effort when performing the VO2max test.
3. Participants maintained their current training routine throughout the duration of the study.
4. Participants consumed a similar diet prior to each experimental testing session.
3

5. The consumption of any caffeine did not impact reaction, cognitive or strength testing
measures.
6. Participants were well rested prior to each experimental testing session.
7. Participants were unable to identify which drink was consumed during experimental trials
T2 through T4, and there was no influence on effort during the trial.
8. The weight loss during T1 was approximately the sweat rate for that participant, with no
consideration to the loss of the metabolic fuel used during the run.
9. The absorption and effect of SustamineTM was the same across individuals.
Limitations
1. The participants were male only this could have impacted generalizability. Furthermore,
the participants were endurance-trained males, which could have further impacted
generalizability.
2. The main recruiting mechanism was in-class announcements through the College of
Education courses, which made subject selection not truly random.
3. The sample was made up of volunteers, therefore not meeting the underlying assumptions
of random selection.
4. The study involves a participant commitment of approximately 15 hours and includes
repeated blood draws and 4 x 1-hour long runs with a trial to exhaustion at the end.
Participant withdrawal may impact the sample size.
4
5. Participants may be unable to ingest 1 liter of sports drink during the 1-hour run at 75%
of VO2max. This will impact the amount of SustamineTM ingested and could affect the
results.
5

CHAPTER II
Review of Literature
Glutamine
Glutamine is a nonessential amino acid. Glutamine is the most abundant amino acid in
the body and it is found in all tissues in the body including the plasma, but the largest storage
area resides in skeletal muscle (Felig, 1975). The resting level of plasma glutamine has been
reported between 550 and 750 µmol∙L-1 with skeletal muscle glutamine concentrations of
approximately 20 mmol∙kg-1 wet weight (Jonnalagadda, 2007, from Gleeson, 2008).
Physiologically, glutamine’s functions include cellular proliferation, acid-base balance, transport
of ammonia between tissues, and antioxidant synthesis (Curi et al., 2005; Newsholme, et al.,
2003; Rutten, Engelen, Schols, & Deutz, 2005). Glutamine has also shown it can lead to an
improvement in performance (Hoffman, et al., 2010). It enhances the absorption of fluid and
electrolytes in both animals and humans (Silva et al., 1998; Lima et al., 2002; van Loon et al.,
1996).
During times of severe catabolic stress, glutamine requirements are increased (Ziegler
1993). The different types of stress include starvation, sepsis, and extended time of physical
activity (Parry-Billings, Leighton, Dimitriadis, Vasconcelos, & Newsholme, 1989; Santos,
Caperuto, & Costa Rosa, 2007; Castell, Newsholme, & Poortmans, 1996; Hankard, Haymond, &
Darmaun, 1997). Skeletal muscle catabolism occurs when internal stores cannot meet physical
6

requirements (Ziegler, 1993). Intravenous supplementation of glutamine has been shown to
decrease mortality and morbidity (Novak, 2002).
Alanine
The addition of alanine to form a dipeptide (such as L-alanyl-L-glutamine) increases the
stability of glutamine, especially at low pH as seen in the gut (Fürst, 2001). A number of studies
have shown that when alanine is combined with glutamine to form the dipeptide L-alanyl-L-
glutamine there is an increase in absorption of glutamine into the plasma (Arii, Kai, & Kokuda
1999; Fürst 2001; Harris, Hoffman, Allsopp, & Routledge, 2012). Harris and colleagues (2012)
had eight human male participants supplement with 89 mg∙kg-1 of L-alanyl-L-glutamine and
reported a 284 ± 84 µmol∙L-1 increase in plasma glutamine levels. The increase in plasma
glutamine following L-alanyl-L-glutamine supplementation was significantly higher than the
elevation in plasma glutamine following only glutamine supplementation.
Alanine is as a major gluconeogenic precursor in extended exercise (Ahlborg, Felig,
Hagenfeldt, Hendler, & Wahren, 1974). Carraro, Naldini, Weber, and Wolfe (1994) examined
the alanine flux during exercise in five healthy males utilizing labeled alanine. The participants
walked on a treadmill at 45% of their VO2max for two hours and during a second visit were also
measured during a two-hour rest period following ingestion of the labeled alanine. Plasma
alanine was measured every 5 minutes from 95 minutes to 120 minutes. The results showed a
nearly 50% increase of plasma alanine during the exercise trial compared to the rest trial.
7

Dehydration, Fatigue and Cognitive Function
During endurance exercise, there is a need for fluid ingestion to decrease the effects of
dehydration (Coyle, 2004). These effects include cardiovascular strain, hyperthermia and
impaired muscle metabolism. Dehydration plays a role in the cardiovascular strain during
endurance activities, with research showing that for every 1% decrease in body weight, there is
an increase in heart rate of 5 to 8 beats∙min-1 (Coyle and Montain, 1992a, b; Sawka and Coyle,
1999; Cheuvront & Haymes, 2001; Cheuvront & Haymes, 2001; Sawka, Montain, & Latzka,
2001). The loss of fluid causes a decrease in blood volume which decreases stroke volume,
which can decrease oxygen delivery to the working muscles (Coyle, 2004). As one becomes
dehydrated, water is lost from both intracellular and extracellular spaces. As exercise duration
increases a larger loss of water occurs intracellularly, partly due to the breakdown of intracellular
glycogen (Costill et al., 1981). When a body water deficit becomes very low, water is
redistributed to ensure vital organs remain functioning (Nose, Morimoto, & Ogura, 1983).
Dehydration causes significant changes to the physiological systems in the body,
primarily impacting cardiovascular and thermoregulatory function. If the magnitude of
hypohydration (e.g., body fluid loss) exceeds 2% of one’s body mass, heart rate increases, and if
exercise is being performed in a hyperthermic environment it may not fully compensate for a
lowered stroke volume, thus reducing cardiac output (Nadel, Fotney, & Wenger, 1980; Sawka,
Knowlton, & Critz, 1979). Core temperature is increased relative to the degree of dehydration
(Sawka, Young, Francesconi, Muza, & Pandolf, 1985), which leads to a reduced ability to
8

dissipate heat. An increase in core temperature also leads to a decrease in sweat rate and blood
flow to the skin (Sawka & Pandolf, 1990).
Endurance exercise performance in a temperate environment can be maintained when
body weight loss does not exceed 3% (Goulet, 2012; 2013). Endurance performance begins to
decline when a body water deficit exceeds 3% (Casa et al., 2010; Goulet, 2012; 2013).
However, anaerobic power performance may be maintained at body water deficits of 2%, 4%
and 5% (Jacobs, 1980).
Hoffman and colleagues (2010) studied the effects of hydration on endurance
performance. Ten physically active males participated by exercising at 75% of their VO2max on
a cycle ergometer. The results showed that participant’s time to exhaustion was increased with
hydration trials when comparing them to the dehydration trial.
Not only does exercise that leads to dehydration affect performance, but fine motor skills
and cognitive function are affected as well. According to Szinnai and colleagues (2005),
dehydration alone seems to have no effect on cognitive-motor performance. This indicates that
the combination of fatigue and fluid deprivation during exercise affects cognitive function rather
than just dehydration alone. Dehydration is sometimes thought of as a competitive advantage in
some sports. In wrestlers, athletes who dehydrated themselves to cut weight had impaired short-
term memory (Choma, Sforzo, & Keller, 1998). This is potentially harmful when a competition
comes around because their mindset is not at maximum working capacity. Cognitive function is
not only an important skill related to sports or every day fitness, but military personnel are
affected by this as well. Before, during and after 53 hours of intense exercise training in the
heat, Lieberman and colleagues (2005) found that cognitive function is severely impaired due to
9

dehydration, fatigue and heat. Studies examining simulated, sustained combat situations have
reported that the deleterious effects of dehydration on reaction time and vigilance, along with
memory and logical reasoning are severely impaired; (Lieberman et al., 2005).
Research done by Ganio and colleagues (2011) used a combination of a diuretic along
with exercise leading to dehydration or exercise leading to dehydration with a placebo or
euhydrated exercise with a placebo. A 1.59% loss in body weight led to impairments in
cognitive function tests like visual vigilance (p = 0.048) and visual working memory (p = 0.021).
Tomporowski and colleagues (2007) studied eleven men who cycled at 60% of their VO2max
and assessed executive processing and short-term memory before and after the exercise. Short-
term memory was not affected, but the response errors in the executive functioning test increased
following exercise.
Rehydration Strategies
To prevent performance decrements it becomes imperative that a rehydration strategy is
planned in order to reduce the effects of dehydration. Benefer and colleagues (2013) examined
the effect of fluid hydration and cognitive performance in 22 males and 13 females was and
reported a non-significant, but positive correlation trend between a water intake score and a word
recall test score (r= 0.564, p = 0.090).
A popular hydration strategy utilizes electrolyte drinks and their potentially greater
effectiveness in rehydrating an individual (Hubbard et al., 1990). After the heat exposure,
subjects were given a glucose drink or nothing. After the battery of cognitive and reaction tests
10

was given, the researchers found that dehydration in a passive heat environment inhibited
reaction time. Almond and colleagues (2005) looked at Boston Marathon runners’ electrolytes in
their blood and fluid consumption throughout the race. Of the 488 qualified subjects, 13% had
hyponatremia and 0.6% of those had critical hyponatremia. Cian, Barraud, Melin & Raphel
(2001) showed how cognitive function is impaired with a loss of electrolytes. Seven male
subjects were placed in a passive heat environment or in an exercise setting in a heated
environment as well. Free recall was significantly higher under the fluid ingestion trials than
under the dehydration or control trials (t > 2, P < 0.05). Electrolyte drinks could help solve that
problem in order to reduce any potential fatal issues.
An alanine-glutamine dipeptide (L-alanyl-L-glutamine) has been shown to enhance fluid
absorption in animals and humans. Silva and colleagues (1998) showed an oral rehydration
solution with added glutamine increases the rate of fluid absorption than just water alone in
rabbits. Lima et al. (2002) showed that glutamine in an oral nutritional rehydration solution
enhances electrolyte and water absorption in rats. Van Loon and colleagues (1996) demonstrated
an increase in water absorption with a glutamine supplement mixed in an oral hydration solution
in humans. Hoffman and colleagues (2012) studied the effects of an alanine-glutamine dipeptide
and performance during a competitive basketball game. Ten NCAA women’s basketball players
were recruited for this study. They participated in four 40-min basketball games with timeouts
as their rehydration time. One of the trials provided no water for the athletes, another provided
only water and the other two provided a low dose and a high dose of water with the alanine-
glutamine dipeptide. The low dose of the dipeptide trial showed a significantly better visual
reaction time (p = 0.014) than the dehydration trial.
11
No published studies are known that examined the effect of adding the alanine-glutamine
dipeptide to a low-calorie sports drink during an endurance event in euhydrated participants.
This research examined cognitive function, reaction time and multiple object tracking in
euhydrated endurance-trained males. The potential outcomes of this research could contribute to
expand the knowledge of exercise science students and researchers. Specifically, whether the
changes from different trials (dehydration, hydration, or hydration with alanine-glutamine
dipeptide) maintain cognitive function and fine motor control following prolonged endurance
exercise.
12

CHAPTER III
Methods
Participants
Twelve male endurance-trained runners (age: 23.5 ± 3.7 y; height: 175.5 ± 5.4 cm;
weight: 70.7 ± 7.6 kg) were recruited for this study. All participants were recruited by flyer or
word of mouth throughout the university and the local running community. Participants needed
to be free of any physical limitations or injuries by completing a Confidential Medical and
Activity questionnaire and/or Physical Activity Readiness Questionnaire (PAR-Q). Following
an explanation of all procedures, risks, and benefits, each participant gave his informed consent
prior to participation in this study. The Institutional Review Board of the University approved
the research protocol. Participants were not permitted to use any additional nutritional
supplements or medications while enrolled in the study. Screening for nutritional supplements
and performance enhancing drug use was accomplished via a health history questionnaire
completed during participant recruitment.
Research Design
The design of this research was a double-blind, randomized, placebo-controlled, cross-
over study (Figure 1). Participants were asked to report to the University Human Performance
Lab (HPL) on 6 separate visits. The first two visits were preliminary visits (PV1 and PV2)
13

followed by four experimental trial visits (T1 – T4). During PV1 participants completed the
Confidential Medical and Activity questionnaire, PAR-Q, and informed consent. After the
paperwork was completed, a urine sample was collected from each subject. Participants were
provided with a specimen cup to use for urine collection. Each urine sample was analyzed for
osmolality and specific gravity. These measures were used to document euhydration on all
testing days. Participants were considered euhydrated if urine specific gravity ≤ 1.020. During
PV1 and PV2, participants were weighed in a postabsorptive, euhydrated state to establish a
baseline body weight. During PV1 and PV2, familiarization trials were conducted with the
reaction and cognitive function tests. Familiarization sessions on the cognitive and reaction tests
occurred twice during each visit day. Before PV2, participants were asked to complete a 24-hour
food log, which was considered their pre-testing diet and participants were asked to repeat this
diet prior to the experimental trials.
Figure 1. Study Protocol
14

There was a minimum of 48 hours between PV1 and PV2. During PV2 participants
performed a VO2peak and lactate threshold test, which determined the treadmill speed for the
experimental trials.
The experimental testing protocol occurred on four occasions separated by 5 to 7 days.
Each session required participants to perform a 1-h run at 75% of their previously measured
VO2peak from PV1. At the 60-min mark, the treadmill speed was adjusted so that all
participants ran at 90% of their VO2peak until volitional exhaustion. All participants performed
the first trial without any rehydration (DHY). During this session the total weight lost during the
run was determined. Participants were weighed in their running shorts using a Health-O-Meter
Professional scale (Patient Weighing Scale, Model 500 KL, Pelstar, Alsip, IL, USA). Once the
trial to exhaustion was finished, participants changed into another pair of dry running shorts and
weight was measured again. The amount of fluid lost during this session determined the
participant’s sweat rate (L∙hr-1). To continue in the study, the participant’s sweat rate needed to
be or exceed 1.3 L∙hr-1. During the next three trials, participants had to drink 250 ml of fluid
every 15 minutes. During one of these trials participants consumed only a flavored sports drink
(ED), while during the other trials participants consumed the alanine-glutamine supplement
(Sustamine™). This was mixed in the same flavored sports drink at either a 300mg/500ml (LD)
or 1g/500ml (HD). Trials T2, T3, and T4 were performed in a randomized order to follow the
double-blind, randomized study design. Prior to and following each experimental trial,
participants performed the reaction, cognitive function, and serial subtraction tests.
15

Reaction Testing
Both upper and lower body reaction testing took place prior to and following each
experimental trial. The upper body reaction testing consisted of three separate testing protocols
utilizing the Dynavision D2 Visuomotor Training Device (D2; Dynavision International LLC,
West Chester, OH). The D2 is a light-training reaction device, developed to train sensory motor
integration through the visual system. It consists of a light board measuring 1.22 m x 1.22 m.
The light board contains 64 light (target) buttons arranged in five concentric circles surrounding
a center LCD screen that can be illuminated to serve as a stimulus for the participant (Figure 1).
Participants were instructed to assume a comfortable athletic stance in front of the light board
and stand at a distance from the board where they were able to easily reach all of the lights. The
light board was raised or lowered relative to the height of the participant. The light board height
was adjusted so the LCD screen is located just below eye level.
The first assessment measured the participant’s visual, motor, and physical reaction times
to a light with the dominant hand. Participants were told to stand in a comfortable athletic stance
centered on the row of five lights that illuminated during the test. The test initiated when the
participant placed and held his hand on an illuminated “home” button. At this point, a light was
presented randomly in one of five locations in the row either to the left of the LCD screen for
right handed participants or to the right of the LCD screen for left handed participants. Visual
reaction time was measured as the amount of time it takes to identify the light and initiate a
reaction by leaving the home button. Motor response time was measured as the amount of time
it took to physically strike the illuminated light following the initial visual reaction and was
16

measured as the amount of time between the hand leaving the home button and striking the light.
Physical reaction time is a measurement of the total elapsed time from the introduction of the
target light to the physical completion of the task (returning to the home button after striking the
light). All measures were to the 1/100’s of a second. This was repeated ten times per assessment.
(Visual Reaction Time = ICC: 0.835; SEM: 0.033s; Motor Reaction Time = ICC: 0.632; SEM:
0.035s; Wells et al., 2014).
The second assessment measured the participant’s ability to react to a light as it randomly
changes position on the board. An initial light was presented on the light board in a random
location. The light remained lit until it was struck by the participant. The light then appeared at
another random location. The participant was instructed to successfully identify and strike as
many lights as possible within 60 s. The number of hits and the average time per hit were
recorded for each participant. The third assessment was similar to the previous measure in that
participants were required to react to a visual light as it randomly changed position on the board.
However, during this trial the stimulus only remained lit for 1 s before it changed to another
random location. Every 5 seconds a 5-digit number appeared on the LCD screen. The
participant had to verbally recite the five digit number as they continued to strike the lights. The
appearance of the digits placed an additional demand on the information processing resources of
the participant. The participants were instructed to successfully identify and strike each stimulus
before it changed position and score as many strikes as possible within 60 s. The number of
successful hits was recorded for each participant. During these 2 reaction tests, participants were
instructed to focus their gaze on the center of the light board and utilize their peripheral vision to
acquire the lights. (MODE A Hits = ICC: 0.747; SEM: 5.44s; MODE A Average Reaction Time
17

= ICC: 0.675; SEM: 0.043s; MODE B Hits = ICC: 0.734; SEM: 8.57s; MODE B Average
Reaction Time = ICC: 0.717; SEM: 0.03s: Wells et al., 2014).
The lower body reaction testing consisted of a 20-second reaction test on the Quick
Board™ (The Quick Board, LLC, Memphis, TN) reaction timer. Participants stood on a board
of five circles, in a 2 x 1 x 2 pattern. Participants straddled the middle circle and reacted to a
visual stimulus located on a display box that depicts one of five potential lights that corresponds
with the circles on the board. Upon illumination of a light, the participant attempted to strike the
corresponding circle on the board with their foot. Upon a successful “hit” with the foot, the next
light appeared. The total number of successful attempts during the 20-second test and the
average time between the activation of the light and the response to the corresponding circle
were recorded.
Cognitive Function Measurements
Cognitive function was assessed using a Cave Automatic Virtual Environment (CAVE)
system (NeuroTracker, CogniSens, Montreal, Quebec). The CAVE consists of a 2.4 m × 2.4 m
× 2.4 m room that includes a projection screen on the front wall which serves as the surface for
image projection. A three-dimensional image of 8 yellow balls was projected onto the screen.
Four of the balls turned to a grey color for 3 seconds then returned to their normal color.
Participants were instructed to track the 4 balls that were grey. The balls moved in three-
dimensions for 8 seconds. If the participant correctly identified the four balls at the end of the 8
seconds the speed increased for the next trial. If the participant incorrectly identified any of the
18

balls the speed of ball movement decreased for the next trial. Each participant performed 20
trials per session. During each trial participants wore three-dimensional glasses. The velocity of
movement that was most successful was recorded as the score.
A modified version of the original Serial Sevens Test (Smith, 1967) was the second
cognitive function test. This test consists of a two-minute timed oral test in which participants
were required to subtract the number 7 from a random computer generated four digit number, in
order to measure how quickly and accurately they could compute a simple mathematical
problem. The computer generated numbers were written onto standard note cards. Participants
were given a randomized stack of note cards and asked to complete as many calculations as
possible in the two minute period. Participant and scorer sat opposite each other during testing.
The answers to the calculations were written on the back of the note cards in pencil for the scorer
to see. Participants were not able to see the correct answer. Once the participant released the
note card, their answer was considered unchangeable. The number of correct answers and the
average time per correct answer was recorded.
Statistical Analysis
All data is reported as mean ± standard deviation. All reaction and cognitive data was
analyzed utilizing a two-way (time x treatment) repeated measures analysis of variance
(ANOVA). If no significance was found using the ANOVA, then Hopkin’s Magnitude Based
Inferences were used. To make inferences on true effects of the different treatment modalities on
cognitive function and reaction time, an analysis based on the magnitude of differences,
19

calculated from 90% confidence intervals, as described by Batterham and Hopkins (2006) were
used in this study. Changes between the different trials were analyzed to assess differences
between groups (DHY, ED, LD and HD). These values were then analyzed via a published
spreadsheet (Hopkins, 2007), with the smallest non-trivial change set at 20% of the grand
standard deviation (Batterham & Hopkins, 2006). All data is expressed with percent chances of
a positive, trivial and negative outcome. Qualitative inferences, based on quantitative chances
were assessed as: <1% almost certainly not, 1-5% very unlikely, 5-25% unlikely, 25-75%
possibly, 75-95% likely, 95-99% very likely and >99% almost certainly (Hopkins, 2002).
20

CHAPTER IV
Results
The temperature and relative humidity for all trials were consistent (22.9 ± 0.3º C, and
44.2 ± 1.3%, respectively). During the DHY trial subjects lost 1.7 ± 0.23 kg of body mass
during the 60 min run. This represented 2.4% body weight loss. This was significantly more
than that seen during all other trials (Figure 2). No other significant differences between trials
were noted. Fluid intake was the same for all trials (1 L).
Figure 2. Body weight losses for all four run trials.
Changes in visual, motor and physical reaction times to a visual stimulus can be observed
in Figures 3a-c, respectively. Inferential analysis indicated that physical reaction time was
likely faster for LD than HD (see Table 1) No other differences were noted between trials in
reaction performance.
21

Figure 3a. Changes in Visual Reaction Time between dehydration and drinking trials.
Figure 3b. Changes in Motor Reaction Time between dehydration and drinking trials.
22
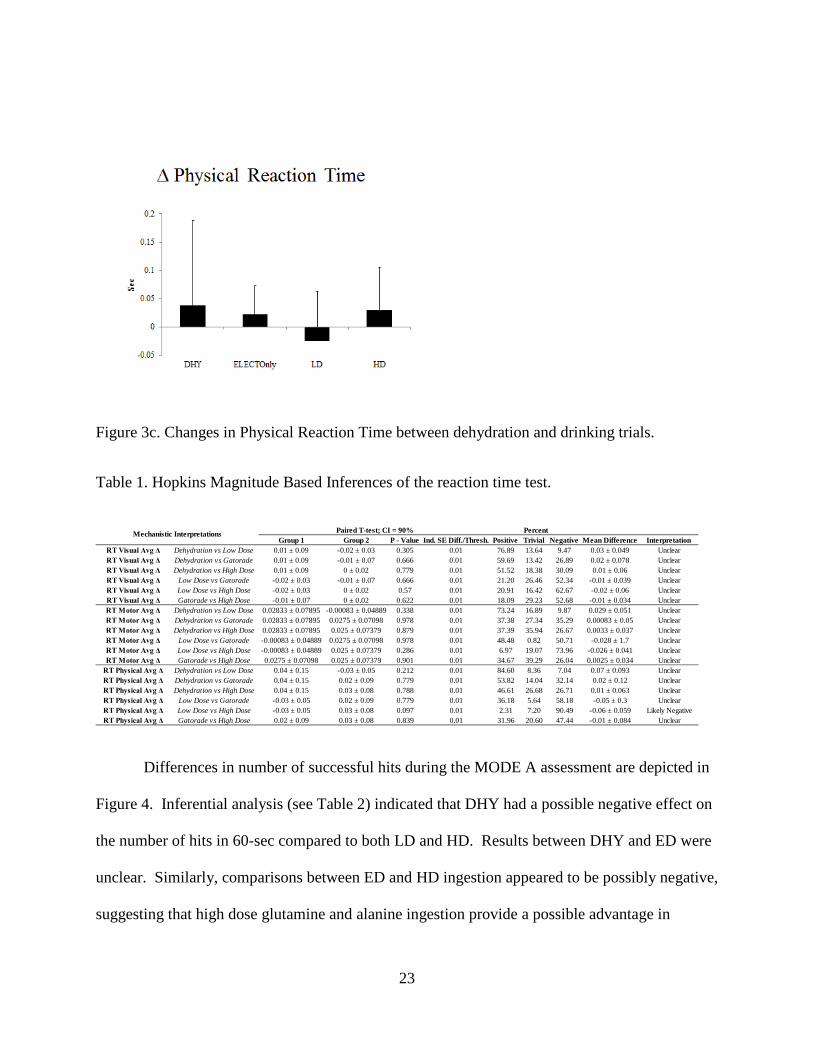
Figure 3c. Changes in Physical Reaction Time between dehydration and drinking trials.
Table 1. Hopkins Magnitude Based Inferences of the reaction time test.
Differences in number of successful hits during the MODE A assessment are depicted in
Figure 4. Inferential analysis (see Table 2) indicated that DHY had a possible negative effect on
the number of hits in 60-sec compared to both LD and HD. Results between DHY and ED were
unclear. Similarly, comparisons between ED and HD ingestion appeared to be possibly negative,
suggesting that high dose glutamine and alanine ingestion provide a possible advantage in
Group 1 Group 2 P - Value Ind. SE Diff./Thresh. Positive Trivial Negative Mean Difference InterpretationRT Visual Avg Δ Dehydration vs Low Dose 0.01 ± 0.09 -0.02 ± 0.03 0.305 0.01 76.89 13.64 9.47 0.03 ± 0.049 UnclearRT Visual Avg Δ Dehydration vs Gatorade 0.01 ± 0.09 -0.01 ± 0.07 0.666 0.01 59.69 13.42 26.89 0.02 ± 0.078 UnclearRT Visual Avg Δ Dehydration vs High Dose 0.01 ± 0.09 0 ± 0.02 0.779 0.01 51.52 18.38 30.09 0.01 ± 0.06 UnclearRT Visual Avg Δ Low Dose vs Gatorade -0.02 ± 0.03 -0.01 ± 0.07 0.666 0.01 21.20 26.46 52.34 -0.01 ± 0.039 UnclearRT Visual Avg Δ Low Dose vs High Dose -0.02 ± 0.03 0 ± 0.02 0.57 0.01 20.91 16.42 62.67 -0.02 ± 0.06 UnclearRT Visual Avg Δ Gatorade vs High Dose -0.01 ± 0.07 0 ± 0.02 0.622 0.01 18.09 29.23 52.68 -0.01 ± 0.034 UnclearRT Motor Avg Δ Dehydration vs Low Dose 0.02833 ± 0.07895 -0.00083 ± 0.04889 0.338 0.01 73.24 16.89 9.87 0.029 ± 0.051 UnclearRT Motor Avg Δ Dehydration vs Gatorade 0.02833 ± 0.07895 0.0275 ± 0.07098 0.978 0.01 37.38 27.34 35.29 0.00083 ± 0.05 UnclearRT Motor Avg Δ Dehydration vs High Dose 0.02833 ± 0.07895 0.025 ± 0.07379 0.879 0.01 37.39 35.94 26.67 0.0033 ± 0.037 UnclearRT Motor Avg Δ Low Dose vs Gatorade -0.00083 ± 0.04889 0.0275 ± 0.07098 0.978 0.01 48.48 0.82 50.71 -0.028 ± 1.7 UnclearRT Motor Avg Δ Low Dose vs High Dose -0.00083 ± 0.04889 0.025 ± 0.07379 0.286 0.01 6.97 19.07 73.96 -0.026 ± 0.041 UnclearRT Motor Avg Δ Gatorade vs High Dose 0.0275 ± 0.07098 0.025 ± 0.07379 0.901 0.01 34.67 39.29 26.04 0.0025 ± 0.034 Unclear
RT Physical Avg Δ Dehydration vs Low Dose 0.04 ± 0.15 -0.03 ± 0.05 0.212 0.01 84.60 8.36 7.04 0.07 ± 0.093 UnclearRT Physical Avg Δ Dehydration vs Gatorade 0.04 ± 0.15 0.02 ± 0.09 0.779 0.01 53.82 14.04 32.14 0.02 ± 0.12 UnclearRT Physical Avg Δ Dehydration vs High Dose 0.04 ± 0.15 0.03 ± 0.08 0.788 0.01 46.61 26.68 26.71 0.01 ± 0.063 UnclearRT Physical Avg Δ Low Dose vs Gatorade -0.03 ± 0.05 0.02 ± 0.09 0.779 0.01 36.18 5.64 58.18 -0.05 ± 0.3 UnclearRT Physical Avg Δ Low Dose vs High Dose -0.03 ± 0.05 0.03 ± 0.08 0.097 0.01 2.31 7.20 90.49 -0.06 ± 0.059 Likely NegativeRT Physical Avg Δ Gatorade vs High Dose 0.02 ± 0.09 0.03 ± 0.08 0.839 0.01 31.96 20.60 47.44 -0.01 ± 0.084 Unclear
Mechanistic Interpretations Paired T-test; CI = 90% Percent
23

number of successful hits in a 60-sec reaction test. Differences in number of successful hits
during the MODE B assessment can be observed in Figure 5. Inferential analysis of the
differences between trials on MODE B hits (see Table 3) indicated that performance differences
between the trials were unclear. Differences in lower body reaction time can be observed in
Figure 6. Inferential analysis (see Table 4) indicates that performance in both LD and HD were
likely improved in comparison to DHY. All other comparisons for changes in lower body
quickness appeared to be unclear.
Figure 4. Changes in number of hits in 60 sec between dehydration and drinking trials.
Table 2. Hopkins Magnitude Based Inferences of the MODE A test.
Group 1 Group 2 P - Value Ind. SE Diff./Thresh. Positive Trivial Negative Mean Difference InterpretationMode A Hits Δ Dehydration vs Low Dose 0.75 ± 4.39 2.92 ± 5.26 0.318 1.75 3.88 38.43 57.68 -2.2 ± 3.6 Possibly NegativeMode A Hits Δ Dehydration vs Gatorade 0.75 ± 4.39 1 ± 6.22 0.919 1.75 20.83 52.12 27.04 -0.25 ± 4.2 UnclearMode A Hits Δ Dehydration vs High Dose 0.75 ± 4.39 3.67 ± 6.79 0.191 1.75 2.09 27.70 70.21 -2.9 ± 3.7 Possibly NegativeMode A Hits Δ Low Dose vs Gatorade 2.92 ± 5.26 1 ± 6.22 0.919 1.75 50.35 7.39 42.26 1.9 ± 32 UnclearMode A Hits Δ Low Dose vs High Dose 2.92 ± 5.26 3.67 ± 6.79 0.315 1.75 0.11 90.77 9.11 -0.75 ± 1.3 Likely TrivialMode A Hits Δ Gatorade vs High Dose 1 ± 6.22 3.67 ± 6.79 0.239 1.75 2.87 31.25 65.88 -2.7 ± 3.8 Possibly NegativeMode A Avg Δ Dehydration vs Low Dose -0.003 ± 0.037 -0.023 ± 0.044 0.251 0.01 61.93 35.45 2.61 0.02 ± 0.029 Possibly PositiveMode A Avg Δ Dehydration vs Gatorade -0.003 ± 0.037 -0.005 ± 0.063 0.938 0.01 31.14 42.91 25.95 0.002 ± 0.044 UnclearMode A Avg Δ Dehydration vs High Dose -0.003 ± 0.037 -0.028 ± 0.061 0.22 0.01 69.46 27.71 2.83 0.025 ± 0.034 Possibly PositiveMode A Avg Δ Low Dose vs Gatorade -0.023 ± 0.044 -0.005 ± 0.063 0.938 0.01 44.41 5.04 50.55 -0.018 ± 0.4 UnclearMode A Avg Δ Low Dose vs High Dose -0.023 ± 0.044 -0.028 ± 0.061 0.302 0.01 2.51 97.47 0.02 0.005 ± 0.0081 Very Likely TrivialMode A Avg Δ Gatorade vs High Dose -0.005 ± 0.063 -0.028 ± 0.061 0.206 0.01 67.69 30.14 2.17 0.023 ± 0.03 Possibly Positive
PercentMechanistic Interpretations Paired T-test; CI = 90%
24

Figure 5. Changes in hits with a cognitive stimulus between dehydration and drinking trials.
Table 3. Hopkins Magnitude Based Inferences of the MODE B test.
Group 1 Group 2 P - Value Ind. SE Diff./Thresh. Positive Trivial Negative Mean Difference InterpretationMode B Hits Δ Dehydration vs Low Dose 3.42 ± 8.43 4.5 ± 4.81 0.7 2.46 10.62 58.32 31.06 -1.1 ± 4.7 UnclearMode B Hits Δ Dehydration vs Gatorade 3.42 ± 8.43 2.25 ± 11.82 0.747 2.46 36.06 47.88 16.05 1.2 ± 6.1 UnclearMode B Hits Δ Dehydration vs High Dose 3.42 ± 8.43 2.75 ± 8.97 0.858 2.46 31.57 48.20 20.22 0.67 ± 6.3 UnclearMode B Hits Δ Low Dose vs Gatorade 4.5 ± 4.81 2.25 ± 11.82 0.747 2.46 48.77 26.19 25.04 2.3 ± 12 UnclearMode B Hits Δ Low Dose vs High Dose 4.5 ± 4.81 2.75 ± 8.97 0.544 2.46 40.19 52.22 7.59 1.8 ± 4.9 UnclearMode B Hits Δ Gatorade vs High Dose 2.25 ± 11.82 2.75 ± 8.97 0.913 2.46 25.96 40.61 33.43 -0.5 ± 7.8 UnclearMode B Avg Δ Dehydration vs Low Dose -0.0233 ± 0.0398 -0.0158 ± 0.032 0.543 0.01 8.13 49.99 41.89 -0.0075 ± 0.021 UnclearMode B Avg Δ Dehydration vs Gatorade -0.0233 ± 0.0398 0 ± 0.0369 0.15 0.01 2.22 18.03 79.75 -0.023 ± 0.027 Likely NegativeMode B Avg Δ Dehydration vs High Dose -0.0233 ± 0.0398 0 ± 0.0226 0.113 0.01 1.37 16.50 82.12 -0.023 ± 0.024 Likely NegativeMode B Avg Δ Low Dose vs Gatorade -0.0158 ± 0.032 0 ± 0.0369 0.15 0.01 1.16 28.39 70.44 -0.016 ± 0.018 Possibly NegativeMode B Avg Δ Low Dose vs High Dose -0.0158 ± 0.032 0 ± 0.0226 0.306 0.01 5.03 30.22 64.75 -0.016 ± 0.026 UnclearMode B Avg Δ Gatorade vs High Dose 0 ± 0.0369 0 ± 0.0226 1 0.01 N/A N/A N/A N/A No Difference
PercentPaired T-test; CI = 90%Mechanistic Interpretations
25

Figure 6. Changes in lower body quickness between dehydration and drinking trials.
Table 4. Hopkins Magnitude Based Inferences of the lower body reaction time test.
Figure 7 compares differences between trials in multiple object tracking. Inferential
analysis indicated a possible greater performance for DHY and LD compared to ED., while there
was a likely greater performance in multiple object tracking for HD compared to consumption of
Group 1 Group 2 P - Value Ind. SE Diff./Thresh. Positive Trivial Negative Mean Difference InterpretationQuickBoard Hits Δ Dehydration vs Low Dose -1.42 ± 3.12 0.75 ± 1.91 0.098 0.59 1.93 9.16 88.90 -2.2 ± 2.2 Likely NegativeQuickBoard Hits Δ Dehydration vs Gatorade -1.42 ± 3.12 -0.5 ± 2.88 0.528 0.59 15.18 25.83 58.99 -0.92 ± 2.5 UnclearQuickBoard Hits Δ Dehydration vs High Dose -1.42 ± 3.12 1.17 ± 3.88 0.087 0.59 1.92 7.10 90.99 -2.6 ± 2.5 Likely NegativeQuickBoard Hits Δ Low Dose vs Gatorade 0.75 ± 1.91 -0.5 ± 2.88 0.528 0.59 63.09 19.15 17.75 1.3 ± 3.3 UnclearQuickBoard Hits Δ Low Dose vs High Dose 0.75 ± 1.91 1.17 ± 3.88 0.195 0.59 0.19 70.12 29.69 -0.42 ± 0.54 Possibly TrivialQuickBoard Hits Δ Gatorade vs High Dose -0.5 ± 2.88 1.17 ± 3.88 0.334 0.59 9.72 16.75 73.53 -1.7 ± 2.9 Unclear
PercentMechanistic Interpretations Paired T-test; CI = 90%
26

the electrolyte drink only. All other comparisons appeared to be unclear (Table 5)
Figure 7. Changes in multiple object tracking between dehydration and drinking trials.
Table 5. Hopkins Magnitude Based Inferences of the multiple object tracking test.
Inferential comparisons on the serial subtraction test can be observed in Table 6. Results
indicated that performance in the serial subtraction test was possibly greater in the ED trial
compared to DHY. No other differences were noted between any of the other comparisons.
Group 1 Group 2 P - Value Ind. SE Diff./Thresh. Positive Trivial Negative Mean Difference InterpretationNeuroTracker Δ Dehydration vs Low Dose 0.14 ± 0.257 0.132 ± 0.314 0.956 0.11 24.48 54.33 21.19 0.008 ± 0.24 UnclearNeuroTracker Δ Dehydration vs Gatorade 0.14 ± 0.257 -0.033 ± 0.33 0.292 0.11 65.59 29.72 4.70 0.17 ± 0.28 Possibly PositiveNeuroTracker Δ Dehydration vs High Dose 0.14 ± 0.257 0.201 ± 0.402 0.671 0.11 12.32 50.47 37.20 -0.061 ± 0.24 UnclearNeuroTracker Δ Low Dose vs Gatorade 0.132 ± 0.314 -0.033 ± 0.33 0.292 0.11 64.40 31.18 4.42 0.17 ± 0.26 Possibly PositiveNeuroTracker Δ Low Dose vs High Dose 0.132 ± 0.314 0.201 ± 0.402 0.275 0.11 0.45 72.83 26.72 -0.069 ± 0.11 Possibly TrivialNeuroTracker Δ Gatorade vs High Dose -0.033 ± 0.33 0.201 ± 0.402 0.061 0.11 0.44 14.46 85.10 -0.23 ± 0.2 Likely Negative
Mechanistic Interpretations Paired T-test; CI = 90% Percent
27

Table 6. Hopkins Magnitude Based Inferences of the serial subtraction test.
Group 1 Group 2 P - Value Ind. SE Diff./Thresh. Positive Trivial Negative Mean Difference InterpretationSerial Sub Correct Δ Dehydration vs Low Dose 1.25 ± 5.029 3.083 ± 5.961 0.428 1.58 7.33 38.23 54.45 -1.8 ± 3.9 UnclearSerial Sub Correct Δ Dehydration vs Gatorade 1.25 ± 5.029 3.917 ± 4.738 0.197 1.58 2.27 27.33 70.40 -2.7 ± 3.4 Possibly NegativeSerial Sub Correct Δ Dehydration vs High Dose 1.25 ± 5.029 3.917 ± 7.305 0.405 1.58 9.52 27.08 63.40 -2.7 ± 5.4 UnclearSerial Sub Correct Δ Low Dose vs Gatorade 3.083 ± 5.961 3.917 ± 4.738 0.197 1.58 0.04 87.54 12.41 -0.83 ± 1.1 Likely TrivialSerial Sub Correct Δ Low Dose vs High Dose 3.083 ± 5.961 3.917 ± 7.305 0.763 1.58 19.32 41.27 39.40 -0.83 ± 4.7 UnclearSerial Sub Correct Δ Gatorade vs High Dose 3.917 ± 4.738 3.917 ± 7.305 1 1.58 N/A N/A N/A N/A No DifferenceSerial Sub Sec/Corr Δ Dehydration vs Low Dose -0.173 ± 0.774 -0.26 ± 0.468 0.751 0.17 38.15 44.20 17.66 0.087 ± 0.46 UnclearSerial Sub Sec/Corr Δ Dehydration vs Gatorade -0.173 ± 0.774 -0.406 ± 0.427 0.374 0.17 59.62 33.84 6.54 0.23 ± 0.44 UnclearSerial Sub Sec/Corr Δ Dehydration vs High Dose -0.173 ± 0.774 -0.24 ± 0.628 0.858 0.17 39.23 34.27 26.50 0.067 ± 0.64 UnclearSerial Sub Sec/Corr Δ Low Dose vs Gatorade -0.26 ± 0.468 -0.406 ± 0.427 0.374 0.17 44.22 52.67 3.11 0.15 ± 0.28 Possibly TrivialSerial Sub Sec/Corr Δ Low Dose vs High Dose -0.26 ± 0.468 -0.24 ± 0.628 0.516 0.17 0.00 100.00 0.00 -0.02 ± 0.052 Most Likely TrivialSerial Sub Sec/Corr Δ Gatorade vs High Dose -0.406 ± 0.427 -0.24 ± 0.628 0.497 0.17 8.83 41.78 49.40 -0.17 ± 0.41 Unclear
Mechanistic Interpretations Paired T-test; CI = 90% Percent
28

CHAPTER V
Discussion
Results of this study indicated that participants performing the exercise protocol and not
rehydrating lost approximately 2.4% of their body mass, which was significantly greater than
that observed during the other trials. Participants consuming the alanine-glutamine dipeptide
(both LD and HD) appeared to possibly enhance their performance to successfully react to
multiple visual stimuli in 60-sec (MODE A assessment) following the exercise protocol more so
than in DHY. In addition, ingestion of a high dose of the alanine-glutamine dipeptide (HD trial)
also appeared to enhance performance in the MODE A measure following exercise to a greater
extent than the commercial sports drink (ED trial) only. In addition, lower body reaction time to
a visual stimulus was likely better during LD and HD compared to DHY. Although this
magnitude of dehydration did not appear to impact cognitive performance (as seen in MODE B
and the serial subtraction tests), there did appear to be a likely benefit for greater performance in
tracking multiple objects with ingestion of HD compared to ED only. These results are similar
to previous research by Hoffman and colleagues (2012) that reported that alanine-glutamine
ingestion was able to enhance visual reaction time significantly greater than when subjects were
dehydrated. The magnitude of the body water deficit between this present study and the previous
study by Hoffman et al. (2012) were similar (2.4% versus 2.3%, respectively). The major
differences between these studies were the mode of exercise and the medium that the supplement
was delivered in. The former study examined reaction performance following a competitive
29

basketball game, while this present study examined performance following prolonged endurance
exercise and a bout of high intensity exercise performed until exhaustion. In addition, in the
former study participants consumed the dipeptide dissolved in water, whereas in the present
study a commercial sport drink containing electrolytes was used.
Previous studies have indicated that body water deficits of 1.6% - 3% have been shown to
decrease cognitive performance (Cian, Barraud, Melin, & Raphel, 2001; Ganio et al., 2011;
Lieberman et al., 2005; Tomporowski, Beasman, Ganio, & Cureton, 2007). However,
decrements in cognitive performance at the lower magnitudes of dehydration appear to occur
when dehydration occurs from the combination of a diuretic and exercise (Ganio et al., 2011).
When dehydration occurs through exercise only, it appears that loss of cognitive ability is only
seen when dehydration is between 2% - 3% of body weight loss (Cian et al., 2001; Lieberman et
al., 2005; Tomporowski, Beasman, Ganio, & Cureton, 2007). Considering that the magnitude of
body water deficit in this study was at 2.4%, this may not have reached the threshold level
necessary to cause cognitive function loss. Our results though do support the deleterious effects
associated with low to moderate levels of dehydration on fine motor control and reaction time
(Baker, Dougherty, Chow, & Kenney, 2007; Hoffman et al., 1995; 2012).
The results of this study do support our previous work that demonstrated that the alanine-
glutamine dipeptide mixed in water is more effective than water only in maintaining fine motor
control and reaction time in competitive and recreational athletes (Hoffman et al., 2010; 2012).
The mechanism suggested for these effects is focused on the ability of the alanine-glutamine
dipeptide to enhance both fluid and electrolyte absorption in the gut (Lima et al., 2002). These
30

findings have also been confirmed by others (Harris et al., 2012), and suggest that during activity
lasting for at least an hour the ability to enhance fluid and/or electrolyte uptake may allow
athletes to maintain fine motor control and reaction ability. Interestingly, these studies have used
water only as the ingestion medium. Considering that the alanine-glutamine dipeptide can
enhance electrolyte absorption as well, it was interesting to explore the potential benefits of
consuming the dipeptide combined with an electrolyte containing commercial sports drink and
determine whether it would provide a greater benefit than an electrolyte drink by itself. The
results of this present study indicate that when the alanine-glutamine dipeptide is combined with
a commercial sports electrolyte drink the ergogenic benefits are greater than that seen with a
commercial sports electrolyte drink only. Therefore, it appears that consumption of a
commercial sports drink with the alanine-glutamine dipeptide enhances fluid and electrolyte
absorption greater than that seen from an electrolyte drink only. The benefits of a greater
electrolyte absorption by skeletal muscle may be related to enhanced motor unit recruitment
patterns and muscle contractility (Sjogaard, 1986). During an activity requiring fine motor
control, these performance decrements may become more sensitive to a dehydration stress. Thus,
the greater absorption capability seen during the alanine-glutamine ingestion trials likely
contributed to the ergogenic effects noted in this study, and contributed to the likely benefit
noted between ED and HD during the MODE A measure. It is possible that the higher
concentration of the alanine-glutamine dipeptide in the HD trial was able to achieve a threshold
effect that was not seen in the comparison between LD and HD.
In conclusion, rehydration with the alanine-glutamine dipeptide during an hour run at a
submaximal intensity appears to maintain or enhance subsequent visual reaction time in both
31

upper and lower body activities compare to a no hydration trial. These same effects were not
apparent when participants consumed the commercial sports electrolyte drink only, suggesting
that the combination of the alanine-glutamine dipeptide enhanced fluid and electrolyte
absorption from the gut and possibly into skeletal tissue to maintain neuromuscular performance.
Differences between groups regarding cognitive function were unclear, indicating that at this low
to mild level of body fluid deficit no advantage was noted between any of the hydration methods
examined in this study.
32

APPENDIX A UCF IRB APPROVAL LETTER
33

34

APPENDIX B NEW ENGLAND IRB APPROVAL LETTER
35

36

APPENDIX C INFORMED CONSENT
37

38

39

40

41

42

43

44

45

46

APPENDIX D MEDICAL QUESTIONNAIRE AND PAR-Q
47

48

49

50

51

APPENDIX E FLYER
52

53

REFERENCES
Almond, C. S., Shin, A. Y., Fortescue, E. B., Mannix, R. C., Wypij, D., Binstadt, B. A., Duncan,
C.N, Olson, D. P., Salerno, A. E., Newburger, J. W., & Greenes, D. S. (2005).
Hyponatremia among runners in the Boston Marathon. New England Journal of
Medicine, 352(15), 1550-1556.
Ahlborg, G., Felig, P., Hagenfeldt, L., Hendler, R., & Wahren, J. (1974). Substrate turnover
during prolonged exercise in man. splanchnic and leg metabolism of glucose, free fatty
acids, and amino acids. The Journal of Clinical Investigation, 53(4), 1080-1090.
doi:10.1172/JCI107645.
Arii, K., Kai, T., & Kokuba, Y. (1999). Degradation kinetics of L-alanyl-L-glutamine and its
derivatives in aqueous solution. European Journal of Pharmaceutical Sciences, 7(2), 107-
112.
Baker, L. B., Dougherty, K. A., Chow, M., Kenney, W. L. (2007). Progressive dehydration
causes a progressive decline in basketball skill performance. Medicine and Science in
Sports and Exercise, 39(7), 1114-1123.
Batterham, A. M., Hopkins, W. G. (2006). Making Meaningful Inferences About
Magnitudes. Sportscience, 9, 6-13.
Benefer, M. D., Corfe, B. M., Russell, J. M., Short, R., & Barker, M. E. (2013). Water intake and
post-exercise cognitive performance: an observational study of long-distance walkers and
runners. European Journal of Nutrition, 52(2), 617-624.
54

Carraro, F., Naldini, A., Weber, J. M., & Wolfe, R. R. (1994). Alanine kinetics in humans during
low-intensity exercise. Medicine and Science in Sports and Exercise, 26(3), 348-353.
Casa, D. J., Stearns, R. L., Lopez, R. M., Ganio, M. S., McDermott, B. P., Yeargin, S. W.,
Yamamoto, L. M., Mazerole, S. M., Roti, M. W., Armstrong, L. E., & Maresh, C. M.
(2010). Influence of hydration on physiological function and performance during trail
running in the heat. Journal of Athletic Training, 45(2), 147.
Castell, L., Newsholme, E., & Poortmans, J. (1996). Does glutamine have a role in reducing
infections in athletes? European Journal of Applied Physiology and Occupational
Physiology, 73(5), 488-490.
Cheuvront, S. N., & Haymes, E. M. (2001). Ad libitum fluid intakes and thermoregulatory
responses of female distance runners in three environments. Journal of Sports Sciences,
19(11), 845-854.
Cheuvront, S. N., & Haymes, E. M. (2001). Thermoregulation and marathon running. Sports
Medicine, 31(10), 743-762.
Choma, C. W., Sforzo, G. A., & Keller, B. A. (1998). Impact of rapid weight loss on cognitive
function in collegiate wrestlers. Medicine and Science in Sports and Exercise, 30(5), 746-
749.
Cian, C., Barraud, P. A., Melin, B., & Raphel, C., (2001). Effects of fluid ingestion on cognitive
function after heat stress or exercise-induced dehydration. International Journal of
Psychophysiology, 42(3), 243-251.
55

Costill, D. L., Sherman, W. M., Fink, W. J., Maresh, C., Witten, M., & Miller. J. M. (1981). The
role of dietary carbohydrates in muscle glycogen resynthesis after strenuous running. The
American Journal of Clinical Nutrition, 34(9), 1831-1836.
Coyle, E. F., & Montain, S. J. (1992). Benefits of fluid replacement with carbohydrate during
exercise. Medicine and Science in Sports and Exercise, 24(9), S324-S330.
Coyle, E. F., & Montain, S. J. (1992). Carbohydrate and fluid ingestion during exercise: Are
there trade-offs. Medicine and Science in Sports Exercise, 24(6), 671-678.
Coyle, E. F. (2004). Fluid and fuel intake during exercise. Journal of Sports Sciences, 22(1), 39-
55.
Curi, R., Lagranha, C. J., Doi, S. Q., Sellitti, D. F., Procopio, J., Pithon-Curi, T. C., Corless, M.,
& Newsholme, P. (2005) Molecular mechanisms of glutamine action. Journal of Cellular
Physiology, 204(2), 392,401.
Dougherty, K. A., Baker, L. B., Chow, M., & Kenney, W. L. (2006). Two percent dehydration
impairs and six percent carbohydrate drink improves boys basketball skills. Medicine and
Science in Sports and Exercise, 38(9), 1650-1658.
Fallowfield, J. L., Williams, C., Booth, J., Choo, B. H., & Growns, S. (1996). Effect of water
ingestion on endurance capacity during prolonged running. Journal of Sports Sciences,
14(6), 497-502.
Felig, P, (1975). Amino acid metabolism in man. Annual Reviews in Biochemistry, 44, 933-955.
56

Fürst, P. (2001). New developments in glutamine delivery. The Journal of Nutrition, 131(9),
2562S-2568S.
Ganio, M. S., Armstrong, L. E., Casa, D. J., McDermott, B. P., Lee, E. C., Yamamoto, L. M.,
Marzano, S., Lopez, R. M., Jimenez, L., Le Bellego, L., Chevillotte, E., & Lieberman, H. R.
(2011). Mild dehydration impairs cognitive performance and mood of men. British journal
of Nutrition, 106(10), 1535.
Gleeson, M. (2008). Dosing and efficacy of glutamine supplementation in human exercise and
sport training. The Journal of Nutrition, 138(10), 2045S-2049S.
Goulet, E. D. (2012). Dehydration and endurance performance in competitive athletes. Nutrition
Reviews, 70(s2), S132-S136.
Goulet, E. D. (2013). Effect of exercise-induced dehydration on endurance performance:
evaluating the impact of exercise protocols on outcomes using a meta-analytic procedure.
British Journal of Sports Medicine, 47(11), 679-686.
Hankard, R.G., Haymond, M.W., & Darmaun, D. (1997). Role of glutamine as a glucose
precursor in fasting humans. Diabetes, 46(10), 1535-1541.
Harris, R. C., Hoffman, J. R., Allsopp, A., & Routledge, N. B. (2012). L-glutamine absorption is
enhanced after ingestion of L-alanylglutamine compared with the free amino acid or wheat
protein. Nutrition Research, 32(4), 272-277.
57

Hoffman, J. R., Ratamess, N. A., Kang, J., Rashti, S. L., Kelly, N., Gonzalez, A. M., Stec, M.,
Andersen, S., Bailey, B. L., Yamamoto, L. M., Hom, L. L., Kupchak, B. R., Faigenbaum,
A. D., & Maresh, C. M. (2010). Examination of the efficacy of acute L-alanyl-L-
glutamine during hydration stress in endurance exercise. Journal of the International
Society of Sports Nutrition, 7(8).
Hoffman, J. R., Stavsky, H., & Falk, B. (1995). The effect of water restriction on anaerobic
power and vertical jumping height in basketball players. International Journal of Sports
Medicine, 16(4), 214-218.
Hoffman, J. R., Williams, D. R., Emerson, N. S., Hoffman, M. W., McVeigh, D. M., Wells, A.
J., McCormack, W. P., Mangine, G. T., Gonzalez, A. M., & Fragala, M. S. (2012). L-
alanyl-L-glutamine ingestion maintains performance during a competitive basketball
game. Journal of the International Society of Sports Nutrition, 9(1), 4.
Hopkins, W. G. Probabilities of Clinical or Practical Significance. Sportscience. 2002;6.
Hopkins, W. G. A Spreadsheet for Deriving a Confidence Interval, Mechanisic Inference and
Clinical Inference from a p value. Sportscience. 2007;11:16-20.
Hubbard, R. W., Szlyk, P. C., & Armstrong, L. E. (1990). Influence of thirst and fluid
palatability on fluid ingestion during exercise (pp. 39-95). Fluid homeostasis during
exercise. Carmel, IN: Benchmark Press.
Jacobs, I. (1980). The effects of thermal dehydration on performance on the Wingate anaerobic
test. International Journal of Sports Medicine, 1, 21-24.
58

Jonnalagadda, S.S. (2007). Glutamine. In J.A. Driskell (Ed.), Sports Nutrition Fats and Proteins
(pp. 261-277). Boca Raton, FL: Taylor & Francis Group.
Lieberman, H. R., Bathalon, G. P., Falco, C. M., Kramer, M., Moran, C. A., & Niro, P. (2005).
Severe decrements in cognition function and mood induced by sleep loss, heat,
dehydration, and undernutrition during simulated combat. Biological Psychiatry, 57(4),
422-429.
Lima, A. A., Carvalho, G. H., Figueiredo, A. A., Gifoni, A. R., Soares, A. M., Silva, E. A., &
Guerrant, R. L. (2002). Effects of an alanyl-glutamine-based oral rehydration and
nutrition therapy solution on electrolyte and water absorption in a rat model of secretory
diarrhea induced by cholera toxin. Nutrition, 18(6), 458-462.
Newsholme, P., Lima, M., Procopio, J., Pithon-Curi, T., Bazotte, R., & Curi, R. (2003).
Glutamine and glutamate as vital metabolites. Brazilian Journal of Medical and Biological
Research, 36(2), 153-163.
Nadel, E. R., Fortney, S. M., & Wenger C. B. (1980). Effect of hydration state of circulatory and
thermal regulations. Journal of Applied Physiology, 49(4), 715-721.
Nose, H., Morimoto, T., & Ogura, K. (1983). Distribution of water losses among fluid
compartments of tissues under thermal dehydration in the rat. The Japanese Journal of
Physiology, 33(6), 1019-1029.
59

Novak, F., Heyland, D. K., Avenell, A., Drover, J. W., & Su, X. (2002). Glutamine
supplementation in serious illness: A systematic review of the evidence. Critical Care
Medicine, 30(9), 2022-2029.
Parry-Billings, M., Leighton, B., Dimitriadis, G., De Vasconcelos, P. R., & Newsholme, E. A.
(1989). Skeletal muscle glutamine metabolism during sepsis in the rat. International Journal
of Biochemistry, 21(4), 419-423.
Rothstein, A., Adolph, E. F., & Wells, J. H. (1947). Voluntary dehydration. Physiology of Man
in the Desert, 254,270.
Rutten, E. P., Engelen, M. P., Schols, A. M., & Deutz, N. E. (2005). Skeletal muscle glutamate
metabolism in health and disease: State of the art. Current Opinion in Clinical Nutrition &
Metabolic Care, 8(1), 41-51.
Santos, R. V. T., Caperuto, É. C., & Costa Rosa, Luis Fernando Bicudo Pereira. (2007). Effects
of acute exhaustive physical exercise upon glutamine metabolism of lymphocytes from
trained rats. Life Sciences, 80(6), 573-578.
Sawka, M. N., & Coyle, E. F. (1999). Influence of body water and blood volume on
thermoregulation and exercise performance in the heat. Exercise and Sports Science
Reviews. 27:167–218.
Sawka, M. N., Knowlton, R. G., & Critz, J. B. (1979). Thermal and circulatory responses to
repeated bouts of prolonged running. Medicine and Science in Sports, 11(2), 177-180.
60

Sawka, M. N., Montain, S. J., & Latzka, W. A. (2001). Hydration effects on thermoregulation
and performance in the heat. Comparative Biochemistry and Physiology Part A: Molecular
& Integrative Physiology, 128(4), 679-690.
Sawka, M. N., & Pandolf, K. B. (1990). Effects of body water loss on physiological function and
exercise performance. Perspectives in Exercise Science and Sports Medicine, 3, 1-38.
Sawka, M. N., Young, A. J., Francesconi, R. P., Muza, S. R., & Pandolf, K. B. (1985).
Thermoregulatory and blood responses during exercise at graded hypohydration levels.
Journal of Applied Physiology, 59(5), 1394-1401.
Silva, A. C., Santos-Neto, M. S., Soares, A. M., Fonteles, M. C., Guerrant, R. L., & Lima, A. A.
(1998). Efficacy of a glutamine-based oral rehydration solution on the electrolyte and water
absorption in a rabbit model of secretory diarrhea induced by cholera toxin. Journal of
Pediatric Gastroenterology and Nutrition, 26(5), 513-519.
Sjogaard, G. (1986). Water and electrolyte fluxes during exercise and their relation to muscle
fatigue. Acta Physiologica Scandinavica. Supplementum, 556, 129-136.
Smith, A. (1967). The serial sevens subtraction test. Archives of Neurology, 17(1), 78.
Szinnai, G., Schachinger, H., Arnaud, M. J., Lender, L., & Keller, U. (2005). Effect of water
deprivation on cognitive-motor performance in healthy men and women. American
Journal of Physiology-Regulatory, Integrative and Comparative Physiology, 289(1),
R275-R280.
61

Tomporowski, P. D., Beasman, K., Ganio, M. S., & Cureton, K. (2007). Effects of dehydration
and fluid ingestion on cognition. International Journal of Sports Medicine, 28(10), 891.
van Loon, F. P., Banik, A. K., Nath, S. K., Patra, F. C., Mohammed, A., Waned, D. D., . . .
Mahalanabis, D. (1996). The effect of L-glutamine on salt and water absorption: A jejunal
perfusion study in cholera in humans. European Journal of Gastroenterology &
Hepatotogy, 8(5)
Wells, A. J., Hoffman, J. R., Beyer, K. S., Jajtner, A. R., Gonzalez, A. M., Townsend, J. R.,
Mangine, G. T., Robinson IV, E. H., McCormack, W. P., Fragala, M. S., & Stout, J. R.
2014. Reliability of the dynavision d2 for assessing reaction time performance. Journal of
Sport Science & Medicine, (13), 145-150.
Ziegler, T., Smith, R., Byrne, T., & Wilmore, D. (1993). Potential role of glutamine
supplementation in nutrition support. Clinical Nutrition, (12), S82-S90.
62