effect of acetate ion on carbon steel corrosion in … · effect of acetate ion on carbon steel...
TRANSCRIPT

EFFECT OF ACETATE ION
ON CARBON STEEL CORROSION
IN THE PRESENCE OF CO2
By
Marc Teyrouz
Submitted in partial fulfillment of the requirements
For the degree of Master of Engineering
Major Subject: Petroleum Engineering
At
Dalhousie University
Halifax, Nova Scotia
Decembre, 2012

ii
DALHOUSIE UNIVERSITY
Faculty of Engineering,
Petroleum Engineering Program
The undersigned hereby certify that they have read and recommend to the Faculty of
Graduate Studies for acceptance a thesis entitled “EFFECT OF ACETATE ION
ON CARBON STEEL CORROSION IN THE PRESENCE OF CO2” by Marc Teyrouz in
partial fulfillment of the requirements for the degree of Master of Engineering.
Dated: Decembre 14th
, 2012
Supervisor: _________________________________
Reader: _________________________________
Departmental representative: e

iii
DALHOUSIE UNIVERSITY
DATE: Decembre 14th
,2012
AUTHOR: Marc Teyrouz
TITLE: EFFECT OF ACETATE ION ON CARBON STEEL
CORROSION IN THE PRESENCE OF CO2
DEPARTMENT OR SCHOOL: Faculty of Engineering, Petroleum Engineering
Program
DEGREE: M.Eng. CONVOCATION: October YEAR: 2012
Permission is herewith granted to Dalhousie University to circulate and to have copied for
non-commercial purposes, at its discretion, the above title upon the request of individuals
or institutions. I understand that my thesis will be electronically available to the public.
The author does not reserve other publication rights and the thesis nor may extensive
extracts from it be printed or otherwise reproduced without the author’s written
permission.
The author attests that permission has been obtained for the use of any copyrighted
material appearing in the thesis (other than the brief excerpts requiring only proper
acknowledgement in scholarly writing), and that all such use is clearly acknowledged.
______________________________
Signature of Author

iv
DEDICATION
I dedicate this work to almighty God, the source of my knowledge and inspiration.

v
ACKNOWLEDGEMENTS
This report could not have been written if it were not for the contribution and
encouragement of various people.
My first wish is to thank the project supervisor, Dr. Michael Pegg for his advice and
support. I am highly indebted to Mr. Mumuni Amadu for his guidance and constant
supervision. Special thanks go to Dr. George Jarjoura for providing necessary information
regarding the project and also for his support in completing my project.
Special gratitude goes to my friends Andrea Darzi, Joanne Massoud, Maria Bou
Rouphael, Jessica Najm and Khalil Azar for their kind co-operation and encouragement.
This report would not have been written without my perseverance. Also, the
encouragement and devotion of my family should be mentioned who have helped a great
deed.

vi
ABSTRACT
The purpose of this study is to find a new technique that will help engineers decrease
corrosion rate and minimize the cost caused by the corrosion of pipelines. It will provide
information on the mechanisms, highlight the effect of acetate, and draw attention to areas
requiring further research.
Internal pipeline corrosion is still one of the main obstacles that slows and decreases the
production of oil and gas. It is primarily associated with the presence of free water,
particularly when it reacts with CO2 and organic acids.
The presence of acetic acid and acetate in the brine can increase the corrosion rate. Some
studies have proven that they work as inhibitors. This report will explain in detail the
mechanism of corrosion and will verify when acetate works as a buffer as well as the effect
it has on corrosion of mild steel pipelines. The findings were backed by researches and
papers of authors who have worked on the same topic but with different models and
approaches.
The lab-work was done on steel coupons and corrosion rates were calculated using the
weight loss technique.

vii
LIST OF SYMBOLS AND ABBREVIATIONS
A Total exposed surface area in in2 or mm
2
A- Conjugate base
Ac–
Acetate ion
CaCl2 Calcium chloride
CaCO3 Calcium carbonate
CH3COOH Acetic acid
CO2 Carbon dioxide
CO3-
Carbonate ion
e–
Electron charge
Fe Iron
Fe2+
Ferrous ion
HA Acid
HAc Acetic acid
H+ Hydrogen ion
HCl Hydrochloric acid
H2CO3 Carbonic acid
HCO3-
Bicarbonate ion

viii
H2S Hydrogen sulfide
H2O Water
K Constant for unit conversion
LPR Linear Polarization Resistance
m Mass of metal in gram
mA Mass of coupon after exposure
mB Mass of coupon before exposure
NaHCO3 Sodium bicarbonate
O2 Oxygen
Rcorr Penetration rate in mil/y
S Surface area of the metal
t Total exposure time in hours
ρ Density

ix
TABLE OF CONTENTS
DEDICATION .............................................................................................................. IV
ACKNOWLEDGEMENTS ............................................................................................ V
ABSTRACT .................................................................................................................. VI
LIST OF SYMBOLS AND ABBREVIATIONS ......................................................... VII
TABLE OF CONTENTS .............................................................................................. IX
LIST OF TABLES ........................................................................................................ XI
LIST OF FIGURES ..................................................................................................... XII
CHAPTER 1: INTRODUCTION ....................................................................................1
1.1 BACKGROUND ............................................................................................................... 1
1.2 CLASSIFICATION OF PIPELINES ...................................................................................... 2
1.3 TRANSPORTED PRODUCTS ............................................................................................. 3
1.4 PIPELINES LEAK DETECTION ......................................................................................... 3
1.5 SOURCE OF ACETIC ACID AND ACETATE ...................................................................... 4
1.6 PROJECT SCOPE AND OBJECTIVES ................................................................................. 4
1.7 PROJECT ORGANIZATION .............................................................................................. 5
CHAPTER 2: LITERATURE REVIEW ........................................................................7
2.1 DEFINITION OF CORROSION ........................................................................................... 7
2.2 TYPES OF CORROSION ................................................................................................... 8
2.3 FACTORS THAT AFFECT CORROSION ............................................................................. 8
2.4 PARAMETERS THAT AFFECT CORROSION IN THE PRESENCE OF ACETIC ACID AND CO2
......................................................................................................................................... 10
2.5 TECHNIQUES TO MEASURE CORROSION RATE ............................................................ 10
2.6 CORROSION RATE CALCULATIONS .............................................................................. 11
2.7 CORROSION PREVENTION AND REDUCTION ................................................................ 12
2.8 TYPES OF WELLS IN RESPECT TO CORROSION ............................................................. 13
2.9 CORROSION CAUSES ................................................................................................... 14
2.10 CONSEQUENCES AND IMPACT OF CORROSION IN THE OIL INDUSTRY ........................ 15
2.11 CORROSION PROBLEMS DURING PRODUCTION .......................................................... 16
2.12 CARBON DIOXIDE CORROSION MECHANISM ............................................................. 17
2.13 PREVIOUS STUDIES ................................................................................................... 18
2.14 EVOLUTION OF CORROSION INVESTIGATION ............................................................. 20
2.15 CORROSION RESEARCH IN THE OIL AND GAS INDUSTRIES MODELS USED ................ 23
2.15.1 De Waard Corrosion ......................................................................................... 23
2.15.2 Slight Modification to the De Waard Model ..................................................... 23
2.15.3 Electrochemical Model ..................................................................................... 24
2.16 EFFECT OF ACETATE AND ACETIC ACID ON CORROSION .......................................... 24
2.17 BUFFERING EFFECT OF ACETATE .............................................................................. 26

x
2.18 FORMATION OF FERROUS ACETATE COMPLEXES AT HIGH TEMPERATURES .............. 27
CHAPTER 3: EXPERIMENTAL SETUP .................................................................... 28
3.1 MATERIALS ................................................................................................................. 28
3.2 SAMPLE PREPARATION AND PROCEDURE .................................................................... 29
3.3 CORROSION TEST METHODOLOGY .............................................................................. 30
3.4 CORROSION RATE FROM COUPON MASS LOSS ............................................................ 31
CHAPTER 4: RESULTS AND DISCUSSION ............................................................. 34
4.1 ANALYSIS OF THE RESULTS ......................................................................................... 34
4.2 CORROSION TEST RESULTS ......................................................................................... 38
CHAPTER 5: CONCLUSIONS .................................................................................... 39
CHAPTER 6: RECOMMENDATIONS ....................................................................... 40
REFERENCES .............................................................................................................. 41
APPENDIX .................................................................................................................... 44

xi
LIST OF TABLES
TABLE 1: EFFECTS OF THE KEY CHEMICAL CHARACTERISTICS OF CORROSION ...................... 9
TABLE 2: COMPOSITION, MASS AND PH OF THE 14 DIFFERENT SAMPLES ............................... 30
TABLE 3: EFFECT OF SODIUM ACETATE ON THE CORROSION RATE OF THE MILD STEEL
COUPONS ....................................................................................................................... 34
TABLE 4: EFFECT OF SODIUM ACETATE ON THE CORROSION RATE OF MILD STEEL COUPONS IN
SOLUTIONS SATURATED WITH CO2 ................................................................................ 35
TABLE 5: EFFECT OF PH ON CORROSION RATE OF MILD STEEL COUPONS IN SOLUTIONS
SATURATED WITH CO2 .................................................................................................. 36
TABLE 6: EFFECT OF SODIUM ACETATE AND SODIUM BICARBONATE ON THE CORROSION RATE
IN A SOLUTION WITHOUT CO2 ........................................................................................ 36
TABLE 7: EFFECT OF SODIUM ACETATE AND SODIUM BICARBONATE ON THE CORROSION RATE
IN A SOLUTION SATURATED WITH CO2 .......................................................................... 37
TABLE 8: EFFECT OF CO2 ON THE CORROSION RATE OF MILD STEEL ..................................... 37
TABLE 9: EFFECT OF SODIUM BICARBONATE ON THE CORROSION RATE OF MILD STEEL IN
SOLUTION SATURATED WITH CO2 .................................................................................. 38
TABLE 10: THE LAB RESULTS ............................................................................................... 44

xii
LIST OF FIGURES
FIGURE 1: THE BAYLIS CURVE. ............................................................................................. 15
FIGURE 2: THE CAPILLARY PRESSURE SYSTEM USED TO SATURATE THE BRINE SOLUTION
WITH CO2 ...................................................................................................................... 32
FIGURE 3: THE CAPILLARY PRESSURE SYSTEM THAT WAS USED TO BUBBLE CO2 IN THE. ..... 33
FIGURE 4: PH METER (METLER TOLEDO) USED DURING OPERATION TO CHECK THE
VARIATION OF PH .......................................................................................................... 45
FIGURE 5: PH-INDICATORS USED WHEN TOLEDO WAS NOT AVAILABLE ................................ 45
FIGURE 7: COUPON USED FOR THE CORROSION TEST ............................................................. 46
FIGURE 8: SAMPLE NUMBER 3 WHERE CORROSION CAN BE SPOTTED ON THE COUPON .......... 46
FIGURE 9: SOLUTION SATURATED WITH CO2 ........................................................................ 47

1
CHAPTER 1: INTRODUCTION
1.1 Background
The transportation of the produced oil from its place of recovery to where it is
processed and the transportation of the refined product from where it is processed to where
it is consumed is a key element in the oil industry and its smooth functioning. Until today,
pipeline transportation is the most economical way to transport large quantities of oil and
gas and is by far the safest method. Without these pipelines, our world would struggle to
satisfy its need of oil and gas. In fact, any substance that is chemically stable can be
delivered through a pipeline.
To avoid leakage and any sort of catastrophe, all pipelines should be frequently
examined, checked and well maintained. For example, engineers should always check if
the cathodic protection levels are at the proper range and if there is any kind of erosion.
They should always run cleaning pigs when there is any corrosive element carried in the
pipelne to identify the thickness of the metal and eventually determine if the pipeline is
deteriorating.
Nowadays, corrosion is a serious matter that is debated and studied around in the
field. It is a major concern to the engineers interested in the safety and protection of a good
and complete running operating system. "While you read this, 760 kg of iron has been
corroded" - this slogan was a poster displayed in an exhibition in 1937 in Brussels that
highlighted how much corrosion happens at every moment (Vámos and Petrik, 1937).
Because all pipelines are mainly made of steel, and since it is well known that corrosion
often occurs in the presence of steel, the main focus is to manage this corrosion. There are
many ways to decrease and avoid corrosion but each one has its own and different expense
so it is necessary to find an ideal solution with the lowest cost. In that matter, some
engineers tried to replace steel pipelines by plastic pipelines, since plastic does not corrode.

2
But this replacement was ineffective since plastic doesn't normally have the same strength
as steel. However, plastic pipelines could serve as a valuable product for low pressure
applications such as local distribution lines.
1.2 Classification of Pipelines
There are three categories of pipelines based upon their purpose:
1. The first category is the ''gathering pipelines"; this type of pipeline is mainly used
to carry natural gas or crude oil, through an interconnected network of smaller
pipelines towards a treatment plant. Those pipelines mainly have a small diameter
and a length ranging from 100 to 200 metres. Sub-sea pipelines are listed as well
under this category.
2. The second category is the ''transportation pipelines''; their main role is based on
their enormous length in order to move the products from one position to another,
for example from one country to another or even more from one continent to
another. This comprises, in parallel, many pumps and compressor stations to keep
the flow coming.
3. Finally, the third category is the ''distribution pipelines''; they have a small diameter
so they could lead the product to its final destination, which means the consumer.
They distribute the gas, oil, water and chemicals to the cities using a narrowed
network.

3
1.3 Transported Products
The pipelines transport a vast diversity of products and in large quantity. The
transported products are mainly gasoline, jet fuel, diesel and natural gas. In addition, many
liquids and fuels like crude oil, alcohol and various grades of petrol are also transported.
Moreover, water is present in large quantities as a by-product of oil and gas.
1.4 Pipelines Leak Detection
To ensure the reliability of the infrastructure, it is of paramount importance to be able
to detect a shortage or a failure in any part of the pipeline system and at the appropriate
time. (Yudaya, 2006)
Leaks in pipes where liquid flows can be detected by:
1. Ground producing liquid bubbles.
2. Oil glistening on water.
3. Flames that erupt from the ground.
4. Vapor clouds.
and leaks in pipes where gas is flown can be detected by
1. Blowing sound, hissing, or roaring.
2. Dirt or water that are ejected in the atmosphere.
3. Non-stop bubbling in wet/flooded areas.
4. Ground emerging flames.
5. Vegetation; whether dead or brown found in green fields.
6. Melted snow over the pipeline found during winter time.

4
1.5 Source of Acetic Acid and Acetate
Oil and gas reservoirs always contain short chain carboxylic acids alongside other
corrosive compounds like carbon dioxide (CO2) and hydrogen sulfide (H2S) (Gulbrandsen
and Bilkova, 2006). The most abundant of organic acids, which was first discovered in
1944 from oil and gas production and transport lines, is acetic acid (Crolet et al., 1999).
Acetic acid can also be written as CH3COOH, and abbreviated HAc. Acetate can also be
found in formation waters.
To classify the organic acids, the molecular weight is analyzed. The organic acids with a
lower molecular weight are more soluble in water. On the other hand, those of higher
molecular weight are only soluble when in their oil phase and solely cause corrosion at
elevated temperatures.
1.6 Project Scope and Objectives
Corrosion tests were specified only for brine saturated with CO2 versus pilot tests
that exclude CO2. It was important for the experiment that the brine solution be saturated
with CO2 so the acetic acid could react with it and start the series of reactions that will be
studied later in this paper. Acetic acid and acetate play a significant role on the rate of
corrosion that will affect the safety, maintenance and lifetime of the stainless steel pipes
that carry the oil and water. The major objectives of this project work were:
1. To study the effects of addition of sodium acetate and sodium bicarbonate in the
saturated brine solution on the corrosion of mild steel coupons.
2. To study the effects of carbon dioxide addition on the corrosion of mild steel
coupons.

5
1.7 Project Organization
This paper is based on projects and studies already completed but with different
instruments and different materials. In this project, some of the previous studies on the
effect of acetate on corrosion in the presence of CO2 will be reviewed. This work project is
outlined as follows:
1. Introduction: the first chapter is where the reader is introduced to the project.
Background information on corrosion, pipelines and the acetic acid as the source of
corrosion, as well as the scope and objectives of this project are approached.
2. Literature review: past research studies on how acetate causes corrosion of mild
steel when found saturated with CO2, is mainly studied in this chapter; in addition
to information and calculation equations on how to measure the corrosion rate.
3. Corrosion background: some general knowledge about corrosion is introduced in
this chapter.
4. Experimental design: this chapter includes all the details about the step-by-step
procedure used in carrying out the laboratory work for this project.
5. Results and discussion: in this chapter, all the results and the observations obtained
from the experimental work are listed.
6. Summary and conclusions: this chapter summarizes the project with its
interpretations and results obtained.
7. Recommendations: suggestions and advices that will help in the accuracy and
improvement of future works and studies on this topic.
8. References: consists of a list of bibliographies used in writing this paper.

6
9. Appendix: this chapter consists of some extra data and information that can be
helpful in understanding the study. It also includes pictures taken from the lab
while doing the experiments.

7
CHAPTER 2: LITERATURE REVIEW
Corrosion is one of the main challenges that engineers try to overcome every time they
have to design a well or a pipeline because it decreases the lifetime of these metal tools.
The biggest concern of the engineers is the prevention of corrosion. Because of its high
impact on the industry, corrosion control has been a main concern for a long time and is
constantly being a center of research in order to improve the efficacy of the metals and to
decrease the corrosion of the pipelines. Corrosion can cost a lot of money to the industry if
it is not checked and controlled properly. It can also reduce the heat transfer and water
flow due to the blockage of pipes and valves.
2.1 Definition of Corrosion
Corrosion is the result of metal reacting with the environment in an electrochemical
fashion causing it to lose some of its material (Asrar, 2010). Liquids and gases in contact
with metal are chemical causes of this corrosion reaction which could be accelerated by
high temperatures, acids and salts (Kanavy and Williams, 2012). The product of this
reaction acts as protective layers. If removed, the metallic surface becomes re-exposed and
vulnerable to a corrosion reaction once again. Ulick R. Evans, considered as the father of
corrosion, talks of this phenomenon which is a three-step electrochemical reaction. First,
free oxygen found in the water enters the metallic surface (the cathode), thus causing a
reaction with the products (water and electrons) of the oxidation process of metal at the
anode side. Then, the hydroxide ion (which is formed by the combination of free electrons,
oxygen and water) will come together with the metal ions, products of the oxidation
reaction taking place at the anode side, thus leading to the creation of an insoluble metal
hydroxide. This leads to metal loss and deposit formation (Bhatia, 2004).

8
2.2 Types of Corrosion
1. Uniform corrosion: when the corrosion reaction occurs in a uniform fashion over
the entire surface area.
2. Pitting corrosion: when the corrosion reaction occurs in a localized point on the
surface area.
3. Galvanic corrosion: occurs when the corrosion is caused by the reaction of two
dissimilar types of metals in contact with one another.
It is important to note that different types of corrosion are also found in the oil and gas
industry. The most important ones are: corrosion fatigue, stress corrosion cracking (SCC),
selective leaching and erosion corrosion.
2.3 Factors that Affect Corrosion
There are many factors that are known to affect the corrosion of steel.
The most important ones are:
1. Dissolved oxygen: the total amount of oxygen that is dissolved in the brine plays an
important role in allowing the cathodic reaction to occur. Without the presence of
oxygen, this reaction does not exist and therefore corrosion does not occur.
2. Alkalinity and acidity: when the alkalinity of water is low, acids are less likely to
be buffered out and corrosion will take place.
3. Total dissolved solids: as the concentration of dissolved solids in water increases,
the conductivity follows and increases so will the overall corrosion.
4. Microbial growth: accelerates the creation and development of corrosion cells.

9
5. Flow velocity: when a high velocity flow rate is applied, more oxygen will be
transported to some metals. Automatically, a higher corrosion rate will be detected.
On the other hand, if the flow rate is very low, a deposition of solids will be noticed
at the bottom and a localized corrosion will happen, thereby increasing the
corrosion rate.
6. Temperature: the temperature increases the corrosion rate.
The effects of the key chemical characteristics of corrosion like pH and alkalinity are
summarized in table 1 just below.
Table 1: Effects of the Key Chemical Characteristics of Corrosion
Chemical Characteristic Effect
pH Low pH may increase the corrosion rate
whereas high pH may protect pipes and
decrease corrosion rates
Alkalinity May help form a protective CaCO3 coating,
helps control pH changes, and reduces
corrosion
Dissolved oxygen (DO) Increases the rate of many corrosion reactions
Chlorine residual Increases corrosion
Total dissolved solids (TDS) High TDS increases conductivity and
corrosion rate
Hardness (Ca and Mg) Ca may precipitate as CaCO3 and thus
provide protection and reduce corrosion rates
Chloride, sulfate High levels increase corrosion of iron
Hydrogen sulfide (H2S) Increases corrosion rates
Silicate, phosphates May form protective films
Natural color, organic matter May decrease corrosion
Iron, zinc, or manganese May react with compounds on the interior of
a pipe to form a protective coating

10
2.4 Parameters that Affect Corrosion in the Presence of Acetic Acid and CO2
A number of factors appear to determine the corrosion rate in presence of acetic acid and
carbon dioxide. These factors include:
1. Concentration of the reactants and products.
2. Electrochemical kinetics of cathodic reactions (activation control or mass transfer
control).
3. Electrochemical kinetics of the anodic reaction (inhibition by HAc, localized or
uniform dissolution).
4. Corrosion product films (kinetics of formation and morphology).
2.5 Techniques to Measure Corrosion Rate
Through time, many measurement techniques were used by many scientists and engineers
in order to achieve some studies and get some results concerning corrosion and how acetic
acid and acetate can affect the corrosion rate in solution saturated with CO2. Some of these
measuring techniques are:
1- Linear Polarization Resistance (LPR): this method relies on a potential current (20mV)
that will be applied to a corroding solid sensor where the resulting current response will
be measured (Stern and Geary, 1957).
The main advantage for the use of this LPR is the speediness in which it can provide a
measurement of the corrosion rate and thus will give an immediate feedback to
operators. Moreover, LPR can help determine the tendency for pitting and if this pitting
will be shallow or deep.
2- Electrochemical noise measurement: a technique that is based on the fluctuations of
current and potential.

11
3- The potentiodynamic sweep.
4- The electrochemical impedance.
5- Weight loss measurement.
6- The George-De Waard-Nesic (GDN): It is a modification to the de Waard corrosion
model.
Each one of these techniques works best in its own suitable conditions. for example , Keith
George and Srdjan Nesic stated in their paper “electrochemical investigation and modeling
of CO2 corrosion of carbon steel in the presence of acetic acid” in 2004: “At 100 ppm
HAc, the electrochemical model is too conservative in the corrosion rate predicted while
the GDN model is in very good agreement with the experimental values. At high
concentrations of HAc (1000 ppm) the electrochemical model is in very good agreement
with the experimental data while the GDN model under predicts the corrosion rate”
(George et al., 2004).
2.6 Corrosion Rate Calculations
To be able to apply a formula to calculate the corrosion rate, some assumptions should be
taken into consideration. Primary, we should assume a uniform type of corrosion and
secondly a corrosion rate that does not vary with time.
According to some papers, one of the formulas used to calculate the corrosion rate is
tS
mRcorr
(1)
Where:
M the mass of the corroded metal in grams
Rcorr penetration rate of corrosion in mil/y
S the surface area of the metal in in2 and

12
t total exposure time in hours
The more accurate formula to estimate the corrosion rate in this paper for the calculation is
tA
mmKR AB )(
(2)
Where:
A total exposed surface area in in2
ρ density in g/cm3
K constant for unit conversion equal to
mB mass of coupon before exposure in gram
mA mass of coupon after exposure in gram
Δt total exposure time in hours
R penetration rate in mil/y
2.7 Corrosion Prevention and Reduction
These are the best ways used nowadays to prevent corrosion, or at least try to reduce and
control it (Uhlig et al., 1985):
1. Choose the best type of material for the pipelines that will have the maximum
resistance to corrosion.
2. Use of corrosion resistant alloys that contain constituents like chromium. The latter
has the ability to produce a more effective protective film that resists breakdown.
(Shreir et al., 1994).
3. Use some coatings like paints and waxes that will protect the pipes from corrosion
due to their higher tendency potential to corrode than the metal they are protecting.

13
4. Add protective films.
5. Controlling scale and micro-biological growth (Jones, 1996).
6. Use a cathodic and anodic protection device to protect the pipes from the outside.
7. From the inside, sound operating practices can be used in order to protect the
interior from corrosion.
8. Use Smart pigs that are inspection devices to measure things like the pipe thickness
and record information about the internal conditions along a pipeline (Fontana,
1986).
9. Chemicals as Corrosion Inhibitors:
Chromate: excellent steel corrosion inhibitor, but recently banned by USEPA for
environmental issues.
Molybdate is the replacement of chromate and is costly.
Polysilicate: not often used because hard to formulate but happens to be a very
good steel inhibitor at a concentration of 6 mg/L.
Polydiol.
Ortho-phosphate: only works if there is 50mg of calcium present in the composition
Nitrite: has a great ability to be a highly effective steel corrosion inhibitor but a
high concentration is needed in the range of 500 -700 mg/L.
2.8 Types of Wells in Respect to Corrosion
There are three (3) types of wells classified according to their degree of corrosivety:
1. Non-corrosive: wells where no corrosion evidences had been spotted over an 8
years period of time, in spite of significant water cut.

14
2. Corrosive: wells where corrosion problems had been encountered, with short
lifetimes, usually less than 3 years.
3. Possibly corrosive: wells where the absence of corrosion problems is still debatable
and could not be assumed definitive.
2.9 Corrosion Causes
These are some causes that are known to induce corrosion, amongst which:
1. Water wetting of the pipe wall.
2. High potential corrosivity (high2COP , low pH, etc.).
3. An electrical current.
4. Chemical reactions involving water, CO2 and acetic acid.
Moreover, primary factors including alkalinity, pH, hardness, oxidizing agents, CO2, and
dissolved solids can also have an effect on corrosion.
Acidic water by definition is water containing a high concentration of (H+) ions. These
(H+) ions react with the electrons found at the cathode side increasing the capability of a
corrosion reaction. In basic water, meaning water with a high pH, the solubility of calcium
carbonate decreases and thus it is more likely to obtain a precipitate consisting in scale.
The pH of water is measured by its level of alkalinity. When the alkalinity of water is high,
scale will most probably form even at a relatively low pH. On the contrary, when the
alkalinity of water is low, acids are less likely to be buffered out and thus corrosion is more
likely to happen.

15
Figure 1: The Baylis curve (http://water.me.vccs.edu/concepts/corrosioncauses.html).
The Baylis curve shown in Figure 1, describes the relationship between pH, alkalinity and
water stability. The area above the curve in blue indicates scale forming water, the grey
shaded area is indicative of corrosive water while the white area is that of stable water.
2.10 Consequences and Impact of Corrosion in the Oil Industry
Transportation pipelines are among the main factors of environmental risk during offshore
oil developments. One of the main causes of pipeline damage is corrosion. In fact,
corrosion is identified as the most common “in-service” cause of failure of pipelines and
pipeline spills. Depending on the cause and nature of the damage (cracks, ruptures), a
pipeline can become either a source of small and long-term leakage or a sudden blowout of
hydrocarbons near the bottom.
Corrosion attacks every component at every stage in the life of every oil and gas field.
From casing strings to production platforms, from drilling through to abandonment,
corrosion is an adversary worthy of all the high technology and research (Kermani, 1996).

16
2.11 Corrosion Problems during Production
The entire process starting from oil and gas being produced to the making, transporting and
use of the fuel and raw materials for production of certain chemicals is grueling and
complicated. This process does not go smoothly without encountering some obstacles one
of the major ones being corrosion. The time wasted and the materials that are replaced are
costly errors and can be disastrous.
The environmental factors that play a unique role in oil and gas production are the actual
environments in which the process occurs and which should be lacking any oxygen if not
contaminated. Other unique factors are the temperature and pressures that are found.
The geologic environment that is devoid of oxygen supposedly could be exposed to
oxygen contaminated fluids, some of which could be of a corrosive nature while others
could carry the potential to be corrosive only when exposed to oxygen.
The problem of corrosion due to oxygen is found mainly in oil production since the
process takes place at close to ambient pressures which causes the oxygen leakages
through hatches, pump seals and vents to become extremely possible. It is important to
note that oxygen, being the powerful oxidant, causes harm even if it is present in the
smallest amounts. Another issue found in oil and gas production is mainly the use of
carbon and low-alloy steels that are known to have a high corrosion potential.
Another point worth mentioning is hydrogen sulfide which is a weak acid when dissolved
in water that has corrosive potential because of the hydrogen ions in it. In oil and gas
production, this weak acid behaves as a catalyst in order to stimulate the absorption of
hydrogen ions by steel.

17
2.12 Carbon Dioxide Corrosion Mechanism
CO2 dissolved in water leads to the formation of carbonic acid (H2CO3) (Cai, 2005), which
is a weak acid in comparison to mineral acids, as it does not fully dissociate.
In the case of carbon steel in brine, the presence of acetate and carbon dioxide leads to the
formation of acetic acid.
Moreover, in many of the brines containing acetate and carbon dioxide, the concentration
of acetic acid is far higher than that of free proton (H+) and it is this that leads to an
enhancement of the rate of corrosion by acetate.
The CO2 corrosion mechanism that occurs on the metallic surface is affected by several
conditions such as temperature, pressure and pH. As Derek Pletcher claimed in 2003; "The
speciation of the medium can influence the corrosion of a metal through either the type of
film formed on the surface of the corroding metal or through the thermodynamics and
kinetics of the anodic and cathodic reactions leading to corrosion" (Pletcher et al.,2003) .
The process and mechanism have been studied widely throughout many experiments and
are summarized as follows:
Carbon dioxide dissolved in water leads to a hydration reaction, thus producing a weak
carbonic acid as shown below:
CO2(g) ⇔ CO2 (3)
CO2 +H2O ⇔ H2CO3 (4)
The carbonic acid (H2CO3) produced is then partly dissociated into the bicarbonate ion that
may then break down into a carbonate ion by a fast reaction (Pletcher et al., 2002):
H2CO3 ⇔ H+ + HCO3
- (5)

18
HCO3- ⇔ H+
+ CO3- (6)
As it has been demonstrated in many papers and as generally known by many, carbonic
acid solutions are more corrosive than solutions containing strong acids such as HCl to
mild steel, at the same pH (Waard and Lotz, 1993). Many hypotheses were suggested in
order to answer this controversial debate where Waard had the best explanation, in which
he stated that this is because after contact with the metallic surface, there is less
dissociation of the carbonic acid molecule. This step is the rate-determining step in the
CO2 corrosion mechanism. In conclusion, the corrosion rate is directly connected to the
concentration of the un-dissociated H2CO3 molecules in solution.
2.13 Previous Studies
In 1999, Hedges and McVeigh used the rotating cylinder electrodes to investigate the
effect of acetate in CO2 corrosion. The acetate ions were coming from the decomposition
of acetic acid in some experiments and from sodium acetate in others; they noticed that
both sources that they used increased the corrosion rates but the acetic acid decreased the
pH while acetate increased it where he concluded: “The increased corrosion rates were
attributed to the formation of thinner iron carbonate films, since acetate ions have the
ability to form iron acetate and transport iron away from the steel surface”. In fact, they
didn’t control the pH change in their experimental work. So Hedges and McVeigh argued
that: “since HAc dissociation can occur very quickly, it is not possible to distinguish the
reduction of hydrogen ions from direct HAc reduction at the electrode surface” (Hedges
and McVeigh, 1999).
A paper in 2003 by Garsany , Pletcher and Hedges entitled “the role of acetate in CO2
corrosion of carbon steel: studies related to oilfield conditions” used voltammetry on the
X65 carbon steel electrodes fabricated from rods, diameter 0.48 cm, to study the effect of

19
acetate on carbon steel corrosion. The voltammetry was carried out with an EG & G Model
173A potentiostat controlled by a PC operating the HeadstartTM
software through a
Computer Graphics Interface. Voltammograms for the steel samples were recorded as soon
as possible after immersion of the steel in the brine and the potential was scanned from the
negative limit. At the end, they did many experiments using different conditions like
different temperatures and compared the results in Voltammograms. They came up with
many conclusions like: “the rate of corrosion increases with temperature. The lower
solubility of CO2 at the higher temperature will lead to a higher pH and a lower conversion
of acetate to acetic acid but the increased rates of all electron transfer reaction at 333 K
more than overcomes this effect”. Moreover, they have proved that: “a high bicarbonate
concentration can lead to a brine pH that is high enough that the conversion of acetate to
acetic acid is low and hence the impact of the acetate on steel corrosion can then
sometimes be very low” (Pletcher et al., 2003).
Egil Gulbrandsen also studied in one of his paper the effect of addition of acetic acid on
CO2 corrosion and mainly on the formation and protectiveness of corrosion films of iron
carbonate (FeCO3). His tests were carried out at high temperatures 80oC, 0.5 bar CO2 and
using rotating cylinder electrodes. He has studied corrosion electrochemically using a
potentiostat equipped with an eight-channel multiplexer. Corrosion rates were determined
from polarization resistance, which was measured by a 0.1 mV/s potential scan vs. the
corrosion potential. He concluded that: “It was possible to maintain protective FeCO3 films
at 80oC in presence of up to a least 100 ppm free HAc. Protection was lost below this
value” (Gulbrandsen, 2007).

20
2.14 Evolution of Corrosion Investigation
Crolet and Bonis discussed the role of HAc on the in-situ pH. Their experimental data
showed that HAc increased the cathodic limiting currents thus increasing the potential
corrosiveness (Crolet and Bonis, 1983).
Hedges and McVeigh tested the effect of HAc on CO2 corrosion at 60oC .The corrosion
rates increased with increasing HAc concentration and with the adding Ac- to a CO2
system, even if the pH increased since Ac- is converted to HAc by the acidity of CO2 and
since Ac- may be counted as HCO3
-. The problem is that they did not take care of the pH in
their experiments and the solution not replenished (Hedges and McVeigh, 1999).
Crolet, Thevenot and Dugstad investigated in 1999 the effect of HAc on the anodic
dissolution of carbon steel under CO2 atmosphere. It was found that the corrosion rate was
slightly inhibited above 3 mM (180 ppm) HAc. It was also noted that the corrosion rate
remained high when the HAc was continuously replenished in corrosion tests (Crolet et al.,
1999).
Ueda and Takabe in 1998 investigated the effect of 0.5 % (5000 ppm) HAc on carbon and
chromium bearing steels at 60-300oC. They found that the corrosion rate was considerably
higher with HAc than with only CO2. Exception was at 60oC, where HAc gave lower
corrosion rate (Ueda and Takabe, 1998).
The effect of HAc has been studied over a wide range of conditions in a series of recent
papers from Ohio University:
Sun used rotating cylinder specimens in glass cells bubble tests to investigate the effect of
HAc on the part reactions under N2 and CO2 atmospheres at room temperature.
Polarization curves showed that HAc increased the cathodic current, and that the H2

21
evolution from HAc was activation controlled at room temperature. HAc inhibited the
anodic part reaction (Sun et al., 2003).
K. George in 2004 used basically the same setup as Sun to further study the effect HAc on
the corrosion rate in the temperature range 22-60oC, and developed an
electrochemical/hydrodynamic model for the cathodic reaction taking into account the
reduction of (H+) (from the bulk of the solution), H2CO3 and HAc. The mass loss rates
increased substantially with HAc concentration at 40oC and 60
oC but not at 22
oC. It was
observed that the cathodic current in presence of HAc was reduced in synthetic brine with
high salt contents compared to 3 % NaCl (George et al., 2004).
In following papers George, Wang, Nesic and Waard extended the previous experimental
work to corrosion loops at higher CO2 partial pressures. It was noted that the anodic
inhibition observed at room temperature was lifted at 60oC (George et al., 2004).
Nafday and Nesic in 2005 studied the effect of HAc on FeCO3 corrosion product film
protectiveness at 80oC in 3% NaCl under 0.5 bar CO2. No significant effect of HAc on
FeCO3 layer protectiveness or morphology was found in any of the tests. The corrosion
film growth rate, inferred from the rate of decrease of corrosion rate, was determined by
the super saturation (Nafday and Nesic, 2005).
Guo studied the effect of HAc and Ac- (50
oC, 1 bar CO2, and 100
oC, 10 bar CO2). The
polarization curves showed increased cathodic currents, and some indication of inhibition
of the anodic reaction with increasing HAc concentration (0-360 ppm) (Guo et al., 2005).
Hurlen investigated the effect of acetate buffers on the cathodic reaction on iron (N2
atmosphere, 25oC). They observed a limiting cathodic current that was dependent on
stirring and HAc concentration. However, in the potential region of activation controlled

22
reaction the HAc had no (or negligible) effect. This was interpreted as an indication that
HAc is not a direct reactant in the H2 evolution reaction (Hurlen et al., 1984).
Bech-Nielsen investigated the effect of HAc and Ac- on the anodic part reaction on iron
(25oC, N2 atmosphere, pH 4, 1 M NaClO4 solution). Inhibition of the anodic part reaction
was observed also in this work. The reaction order of the anodic reaction with respect to
Ac- was -0.7 (Bech-Nielsen, 1974).
Garsany and Pletcher used voltammetry to study the effect of HAc on the cathodic part
reaction on platinum and steel in CO2 environment. They observed a limiting cathodic
current in HAc solutions, proportional to the HAc concentration, and to square root of the
rotating disc rotation rate. In solutions with both HAc and CO2 present the cathodic
limiting current was the sum of the individual contributions of diffusion limited reduction
of solution equilibrium protons, diffusion limited reduction of HAc and reaction limited
reduction of H2CO3. The relative importance of these reactions depends, amongst many
factors, on convection, temperature and concentration of the involved species. It was found
that The HAc reduction is activation controlled under CO2 corrosion conditions. It was also
found that the anodic currents were influenced by the presence of HAc or Ac- (Pletcher et
al., 2003).
Halvorsen and Andresen in 2005 demonstrated that pH-stabilization efficiently reduced the
corrosion rates in presence of large amounts of total Ac-. By increasing the pH of the
aqueous phase in the bottom of the line the concentration of HAc was reduced, and hence
the partial pressure of HAc over the liquid. This caused a decrease in the concentration of
HAc in the condensing liquid, and a reduction in the top-of-line corrosion rate (Halvorsen
and Andresen, 2005).

23
2.15 Corrosion Research in the Oil and Gas Industries Models Used
2.15.1 De Waard Corrosion
De Waard and Milliams first reported a CO2 corrosion model for wet gas pipelines in 1975.
The semi-empirical model was based on experimental data (weight loss and LPR
measurements) taken from glass cells (Waard and Milliams, 1975). The model is
considered to be a “worst case” model due to its conservative estimate for the corrosion
rate. The model, through the years, has been revised (1991, 1993 and 1995) to take into
account new parameters important to the corrosion process as experimental data became
available. For example, in the 1991 model revisions (Waard, 1991) the effect of higher
pressures, protective film formation, high system pH, presence of hydrocarbons and water
condensation were taken into account. All of the parameters are accounted for in the model
through the use of factors which are multiplied by the “worst case” corrosion rate.
The “worst case” corrosion rate was found from the following equation:
1/Vcorr =1/Vr +1/Vm (7)
Where:
Vcorr the corrosion rate in mil/yr
Vr reaction rate in mil/yr
Vm maximum mass transfer rate of the corrosive species in mil/yr
(Pickett, 1974)
2.15.2 Slight Modification to the De Waard Model
Also called the George-de Waard-Nesic is needed to account for the presence of HAc.
The new equation is:
1/Vcorr =1/Vr +1/Vm(H2CO3) +1/Vm(HAc) (8)
Where:
Vm(H2CO3) mass transfer rate of carbonic acid
Vm(HAc) mass transfer term for HAc in mil/yr

24
2.15.3 Electrochemical Model
The second popular model used is the electrochemical model where the nature of the
measured cathodic and anodic reactions must be found. Acetic acid can affect the cathodic
reaction in CO2 corrosion according to at least two possible scenarios. The first is HAc
acting as a source of hydrogen ions through dissociation and the second is HAc being
directly reduced on the metal surface. The model takes into account the electrochemical
reactions of hydrogen ion (H+) reduction, carbonic acid (H2CO3) reduction, direct water
reduction, oxygen reduction, and anodic dissolution of iron. The corrosion process was
monitored using polarization resistance, potentiodynamic sweep, electrochemical
impedance, and weight-loss measurements. The experiments were made under many
temperatures ranging from 20oC to 80
oC. Experiments in a three-electrode setup were
conducted at atmospheric pressure in a battery of eight glass cells. CO2 gas was bubbled
through the cells continuously. Electrochemical measurements were made using a Gamry
Instruments potentiostat with an eight-channel multiplexer connected to a personal
computer. The glass cells were filled with 3 L of distilled water and a 1 mass% NaCl. In
different experiments, CO2 was bubbled through the electrolyte to saturate the solution.
Monitoring of pH and O2 concentration was used to judge when the solution was in
equilibrium. When needed, hydrochloric acid (HCl) or sodium bicarbonate (NaHCO3) was
added to adjust the pH. At the end, more than 50 glass cell experiments were conducted.
2.16 Effect of Acetate and Acetic Acid on Corrosion
The overall acetate concentration and the bicarbonate level (or more precisely the ratio of
HCO3- to CO2 concentrations) are two main elements that can determine the concentration
of acetic acid (and hence its importance in influencing the rate of steel corrosion) (Harrop,
2006).

25
The level of bicarbonate is likely to influence significantly the acetate/ acetic acid ratio and
the solution pH (Sidorin, 2005).
At low pH, the un-dissociated form of acetic acid (HAc) is mainly the cause for the rise in
the corrosion rate.
When saturated with CO2 the pH is about 4.5 at room temperature. Therefore, much of the
total acetate should be present as acetic acid and the acetate present would be expected to
enhance the corrosion of carbon steel. The bicarbonate concentrations are much higher and
it is to be expected that the pH remains closer to neutral when saturated with CO2. Much of
the acetate will remain in solution as acetate ion and its influence on the steel corrosion
rate will be less. Whether enhanced corrosion is observed will depend on the actual acetate
level. It should also be stressed that the measured pH alone is, in practice, an indicator of
the bicarbonate level (Pletcher, 2003).
When in the system, HAc is found wavering between the aqueous and the gas forms as
seen in reaction (9). The aqueous phase of HAc partly dissociates into hydrogen and
acetate ions according to reaction (10):
HAc(g) ⇔ HAc(aq) (9)
HAc(aq) ⇔ H+
+ Ac– (10)
In liquid solutions, iron acetate salt can be produced, but it has a higher solubility than that
of iron carbonate so an iron acetate precipitate and protective film do not easily form. In
1999, Crolet described that low concentrations of HAc (6 ppm to 60 ppm) can affect the
corrosion rates of carbon steel. They stated that the rate of corrosion is faster in the
presence of acetic acid because of the inversion of the bicarbonate to acetate ratio (Guo et
al., 2005); “It becomes the main source of corrosion in spite of how minimal the amount is
present” This is explained by the fact that at this specific point, the acetic acid
predominates over the carbonic acid (Crolet, 1999).

26
Experiments were done to show the role that acetate plays in CO2 corrosion. Both HAc and
sodium acetate were used as sources of acetate in different media. Both caused an increase
in the rate of corrosion due to less iron carbonate precipitates since acetate ions have the
ability to form iron acetate and keep iron away from the metallic surface.
Carbon dioxide (CO2) becomes an issue on corrosion when the concentration of acetic acid
in water is higher than 0.1 to 1 mM. In contrast, fields with lower CO2 contents are not
corrosive: the corrosion by CO2 disappears at low CO2 pressure, except in the presence of
even minute traces of free acetic acid (Yin, 2008).
In Summary, carbonic acid is often used to indicate a solution of dissolved CO2
(carbonated water). CO2 gas dissolves readily in water and forms dissolved CO2(aq). The
dissolved CO2 reacts with H2O to form carbonic acid, H2CO3 according to reaction (11).
CO2 (aq) + H2O = H2CO3 (11)
The H2CO3 concentration is only a small fraction (ca. 1/600) of the CO2 (aq) concentration.
H2CO3 dissociates to form bicarbonate, HCO3-according to reaction (12).
H2CO3 = H+ + HCO3
- (12)
pKa, an indicative index of the strength of an acid, of HAc is 4.8 , and pKa of H2CO3 in
equation 6 is 3.5 at 25oC. So, contrary to the general knowledge, carbonic acid is a stronger
acid than acetic acid (Crolet, 1983).
Equations (11) and (12) can be added to give reaction (13)
CO2 (aq) + H2O = H+ + HCO3
- (13)
2.17 Buffering Effect of Acetate
A buffer is defined as an aqueous solution that has a highly stable pH, the components of
which are either a weak acid with its conjugate base or a weak base with its respective
conjugate acid. The pH of a buffer solution is hardly affected if at all by the addition of

27
either a strong acid or base and therefore is used for the sole purpose of retaining the pH of
a solution at a nearly constant value.
It is not possible to distinguish the reductions of acetic acid and free proton (H+). Pletcher,
Garsany and Hedges pointed out that when dealing with brine solutions which are made up
of acetate and saturated with CO2, we are truly dealing with an acetate buffer. Thus with
the addition of CO2, the brine goes acidic but the change is not significant with the
presence of acetate which acts as a buffer thus limiting the change in the pH value
(Pletcher et al., 2002).
By converting acetate to an un-dissociated acetic acid, the act of buffering occurs and thus
with any increase in pH value there is a corresponding rise in the concentration of proton
donor.
2.18 Formation of Ferrous Acetate Complexes at High Temperatures
At high temperatures and neutral pH, if a small amount of HAc is initially added,
approximately less than 10 % of the Fe (II) is present as a complex FeAc+. The creation of
this acetate complex is barely noticeable and can be negligible. But when the initial
amount of HAc is high, almost 65 % of the Fe (II) is existent as acetate complexes and
acetate, because their concentration is no more negligible. Furthermore, this complex
formation shifts equilibrium of reaction (10) towards the right hand side, more Ac- will
form and so lower concentration of free Fe2+
will be left in the solution. When this shift
happens, the formation of iron carbonate become more difficult.

28
CHAPTER 3: EXPERIMENTAL SETUP
The experimental work consisted in having an initial solution of concentrated CO2 and
studying the effects of the addition of acetate and bicarbonate ions on the corrosion of
coupons using the weight loss technique. The different steps of the experiment included the
monitoring of the pH change of the solution as well as the measuring of the weight loss
due to the above-mentioned additions.
3.1 Materials
This is the list of all equipment and materials used during the experimental work
- 14 beakers.
- An accurate weighting balance: Sartorius CP 1245 (S/N –serial no. 18650185).
- 2 types of pH meter:
- pH indicators.
- Mettler toledo (MP 120 pH meter GMbH, serial No. 228476).
- CO2 Tank.
- Capillary pressure system.
- Thermometer.
- Nineteen (19) 1-inch by 1-inch steel coupons (cold rolled steel grade A1008 with a
thickness of 0.024 inch).
- Distilled water.
- 15% HCl solution.
- Hygenic gloves.
- Chemicals: Sodium acetate (NaOAc).
Calcium chloride (CaCl2).
Sodium Chloride (NaCl).

29
3.2 Sample Preparation and Procedure
The following step by step procedures were completed during this labwork experiment:
1. The coupons were pre-treated in absolute ethanol followed by acetone in order to
be degreased;
2. The degreased coupons were heavily rinced with de-ionized water;
3. The coupons were dried;
4. Every coupon was accurately weighted and the mass recorded;
5. 100ml of distilled water was placed in each of the 14 beakers in addition to 4g of
NaCl and 0.5g of CaCl2;
6. 9 of the 14 solutions were bubbeled for 8 consecutive hours with CO2 using the
capillary pressure system;
7. A coupon was placed in each cell containing the brine;
8. Time was recorded throughout the experience and the pH measured with a pH
meter (Mettler toledo) (see figure 9 in appendice 1);
9. After 5 days (120 hours) , the coupons were removed from the beakers;
10. The coupons were rinced with de-ionized water followed by 15% HCl to remove
the corrosion products, and then rinced again with de-ionized water;
11. The coupons were then dried-up and weighted to obtain the new mass.
Details of the 14 beackers and their content could be seen in Table 2.

30
Table 2: Composition, mass and pH of the 14 different samples
Sample
Composition of the sample
Original mass
of coupon(g)
(±0.0003)
pH
1 Without CO2 saturation + 100ml brine + coupon 2.9016 6
2 Without CO2 saturation + 100ml brine + coupon +1g sodium
acetate
2.9011 6
3 Without CO2 saturation+100ml brine +coupon + 1.5 g sodium
acetate
2.8611 7
4 CO2 saturated+100 ml brine+coupon 2.9006 4.5
5 CO2 saturated +100ml brine +coupon+0.05g (50mg) sodium
acetate
2.8875 4
6 CO2 saturated +100ml brine +coupon+0.1g(100mg) sodium
acetate
2.9109 4
7 CO2 saturated +100ml brine +coupon+0.3g(300mg) sodium
acetate
2.9025 5
8 CO2 saturated+100 ml brine+ coupon+ 0.5g (500mg) sodium
acetate
2.8962 6
9 CO2 saturated+100 ml brine + coupon+1g sodium acetate 2.9062 7
10 CO2 saturated+100 ml brine + coupon+1.5g sodium acetate 2.8734 7
11 Without CO2 saturation+ 100 ml brine+1g sodium bicarbonate 2.9110 9
12 Without CO2 saturation+100ml brine +2g sodium bicarbonate 2.9019 10
13 CO2 saturated+ 100 ml brine+1g sodium bicarbonate 2.9003 7
14 CO2 saturated+ 100 ml brine+2g sodium bicarbonate 2.8992 7
3.3 Corrosion Test Methodology
The brine solution was made of distilled water, 4% by weight of NaCl and 0.5% by weight
of CaCl2. Another composition could have been used but it was determined that this
composition was mostly used and was relevant to the brine formation in the field.
Having a pre-saturated CO2-bubbled solution was a pre-requisite for the experimental
work. To obtain this solution, a CO2 tank was connected to the capillary pressure system in
order to bubble CO2 into the solution until it reached a saturated state.

31
Every solution was bubbled with CO2 for 8 hours to ensure saturation.
It should be duly noted that in the absence of oxygen, no corrosion can occur under any
circumstances. Oxygen is responsible for reacting with the hydrogen ions that are released
at the cathode due to the electron accommodation. In the lack of oxygen, hydrogen ions
accumulate on the cathode and prevent electron accommodation, thus stopping the
corrosion process.
3.4 Corrosion Rate from Coupon Mass Loss
When studying and working with coupons, the mass loss is measured and calculated by
weighting the specimen before and after exposure, subtracting the two obtained values and
converting the result to a penetration rate.
The corrosion rate is estimated according to equation (2).
Assumptions should be made in order to have satisfactory and conclusive results, such as:
1- The penetration is uniform, so the attack will be distributed over the whole surface
equally.
2- Areas are unchanged during the period of exposure. When estimating the penetration
rate we should assume that the dimensions before and after exposure are still the same.
3- The penetration rate stays the same throughout the exposure period.

32
Figure 2: The capillary pressure system used to saturate the brine solution with CO2

33
Figure 3: The capillary pressure system that was used to bubble CO2 in the solution
and saturate it. The beaker containing the solution to be tested was placed inside the
grey plastic vessel.

34
CHAPTER 4: RESULTS AND DISCUSSION
4.1 Analysis of the Results
Experimental results are presented in tables 3 to 9.
Table 3: Effect of sodium acetate on the corrosion rate of the mild steel coupons
Sample composition Corrosion rate (mpy) pH
1 Without CO2 saturation + 100ml brine + coupon 22 6
2 Without CO2 saturation + 100ml brine + coupon +1g
sodium acetate 8 6
3 Without CO2 saturation+100ml brine +coupon + 1.5 g
sodium acetate 7 7
From table 3, it can be seen that an increase in the amount of sodium acetate decreases the
corrosion rate of the coupons. This decrease could be attributed to the minimization of free
(H+) ions in solution, according to reaction (10) and (12). It can also be attributed to the
ability of sodium acetate forming a protective layer on the surface of the coupons thus
decreasing the corrosion rate.

35
Table 4: Effect of sodium acetate on the corrosion rate of mild steel coupons in
solutions saturated with CO2
Sample composition Corrosion rate (mpy) pH
4 CO2 saturated+100 ml brine+coupon 83 5
5 CO2 saturated +100ml brine +coupon+0.05g (50mg)
sodium acetate 107 4
6 CO2 saturated +100ml brine +coupon+0.1g (100mg)
sodium acetate 110 4
7 CO2 saturated +100ml brine +coupon+0.3g (300mg)
sodium acetate 83 5
8 CO2 saturated+100 ml brine+ coupon+ 0.5g (500mg)
sodium acetate 65 6
9 CO2 saturated+100 ml brine + coupon+1g (1000mg)
sodium acetate 56 7
10 CO2 saturated+100 ml brine + coupon+1.5g (1500mg)
sodium acetate 50 7
From table 4, it can be seen that sodium acetate increases the corrosion rate of the coupons
when it is added in low amounts (50-100 mg). This could be due to the sodium acetate
providing a partial coverage of the coupon, thus changing the ratio of the cathode to the
anode, hence increasing the corrosion rate of the anodic areas. Amounts higher than about
200 mg sodium acetate, has considerable inhibitive effect on the corrosion rate of mild
steel coupons. This can be attributed to the ability of sodium acetate to provide a full
protective layer on the mild steel and to bind the free (H+) ions, resulting from the
dissociation of H2CO3 in solution.

36
Table 5: Effect of pH on corrosion rate of mild steel coupons in solutions saturated
with CO2
Sample composition Corrosion rate (mpy) pH
7 CO2 saturated +100ml brine +coupon+0.3g(300mg)
sodium acetate 83 5
8 CO2 saturated+100 ml brine+ coupon+ 0.5g (500mg)
sodium acetate 65 6
9 CO2 saturated+100 ml brine + coupon+1g sodium
acetate 56 7
10 CO2 saturated+100 ml brine + coupon+1.5g sodium
acetate 50 7
From table 5, it can be seen that the higher the pH of the solution, the lower the corrosion
rate of the coupons. This could be due to the higher concentration of acetate ions reacting
with free protons coming from the dissociation of carbonic acid in equation (12). The
higher the concentration of acetate, the higher is the consumption of (H+) ions due to the
direct reaction between acetate and (H+) ions to form undissociated acetic acid (equation
8). Less (H+) ions will be left in the solution causing a higher pH and a lower corrosion
rate, knowing that pH is a function of (H+) (pH= - log [H
+]).
Table 6: Effect of sodium acetate and sodium bicarbonate on the corrosion rate in a
solution without CO2
Sample composition Corrosion rate (mpy) pH
1 Without CO2 saturation + 100ml brine + coupon 22 6
2 Without CO2 saturation + 100ml brine + coupon +1g
sodium acetate 8 6
11 Without CO2 saturation+ 100 ml brine+1g sodium
bicarbonate 5 9
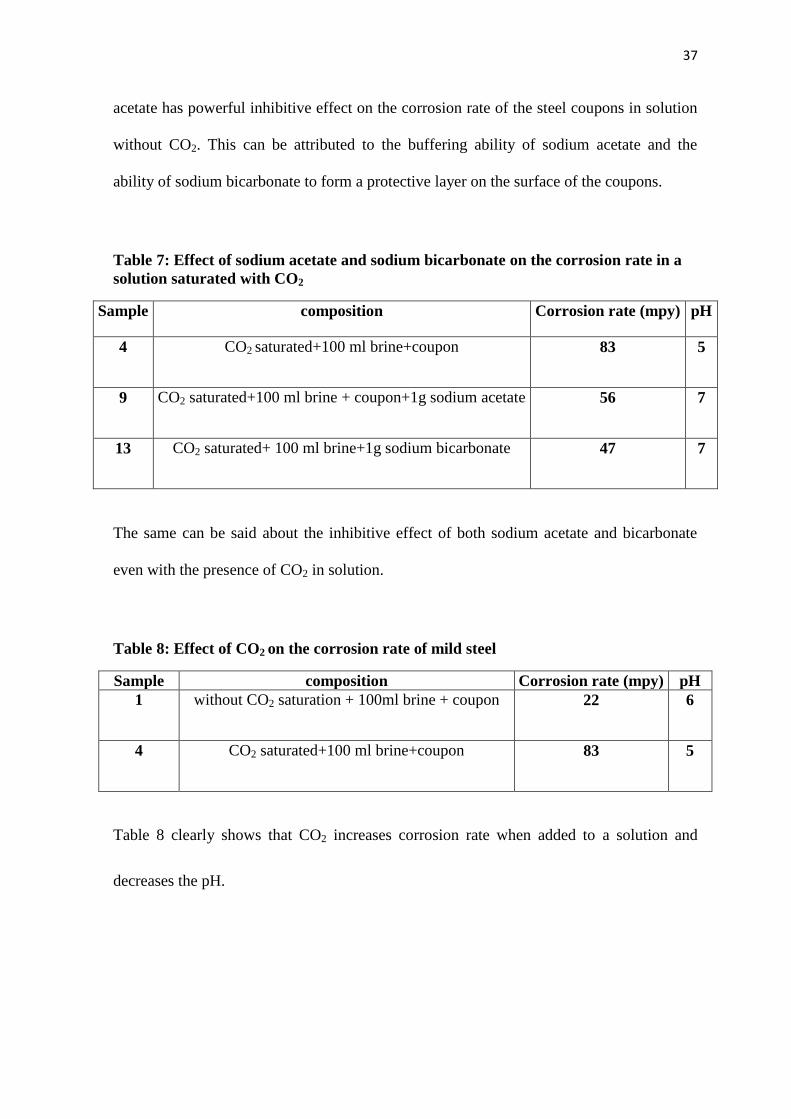
From table 6, one can see that the presence of sodium bicarbonate as well as sodium
37
acetate has powerful inhibitive effect on the corrosion rate of the steel coupons in solution
without CO2. This can be attributed to the buffering ability of sodium acetate and the
ability of sodium bicarbonate to form a protective layer on the surface of the coupons.
Table 7: Effect of sodium acetate and sodium bicarbonate on the corrosion rate in a
solution saturated with CO2
Sample composition Corrosion rate (mpy) pH
4 CO2 saturated+100 ml brine+coupon 83 5
9 CO2 saturated+100 ml brine + coupon+1g sodium acetate 56 7
13 CO2 saturated+ 100 ml brine+1g sodium bicarbonate 47 7
The same can be said about the inhibitive effect of both sodium acetate and bicarbonate
even with the presence of CO2 in solution.
Table 8: Effect of CO2 on the corrosion rate of mild steel
Sample composition Corrosion rate (mpy) pH
1 without CO2 saturation + 100ml brine + coupon 22 6
4 CO2 saturated+100 ml brine+coupon 83 5
Table 8 clearly shows that CO2 increases corrosion rate when added to a solution and
decreases the pH.

38
Table 9: Effect of sodium bicarbonate on the corrosion rate of mild steel in solution
saturated with CO2
Sample composition Corrosion
rate (mpy)
pH
4 CO2 saturated+100 ml brine+coupon 83 5
13 CO2 saturated+ 100 ml brine+1g sodium bicarbonate 47 7
14 CO2 saturated+ 100 ml brine+2g sodium bicarbonate 46 7
4.2 Corrosion Test Results
The rates of corrosion have been calculated using equation (14):
TA
wR
41023.2 (14)
Where:
R corrosion rate, mil/yr (mpy)
W coupon weight loss, g
A total area of exposure = 1 in2
(for all coupons)
T exposure time, days (5 for all coupons)
ρ density of metal = 7.85 g/cm3

39
CHAPTER 5: CONCLUSIONS
The main conclusions drawn from the experimental study can be summarized as follow:
First, sodium acetate increases the corrosion rate of the coupons when it is added in low
amounts (50-200 mg) by increasing the corrosion rate of the anodic areas. On the other
hand, corrosion rate decreases with increasing acetic acid concentration above 200 mg, due
to inhibition of the anodic reaction. In addition, it is confirmed that pH change has a
considerable role on the effect of acetate on the corrosion rate: the higher the pH, the lower
the corrosion rate. Furthermore, Sodium acetate has buffering capabilities due to powerful
inhibitive effect that it has on the corrosion rate of steel coupons. Finally, sodium
bicarbonate decreases the corrosion rate by forming a protective layer on the surface of the
coupons.

40
CHAPTER 6: RECOMMENDATIONS
The following recommendations are considered helpful for future studies.
- Conduct the same research using coupons made from steel grades used in the industry.
- Use a coupon holder in order to avoid error caused by coupon sticking to the base of the
beaker.
- A longer sampling time for corrosion coupons is recommended for future studies.
- It is recommended that in the future study, more experiments be conducted to determine
the effect of pressure, temperature and other down-hole conditions on the corrosion of the
coupons, keeping in mind that at 60oC some effect of acetate will be different.

41
REFERENCES
Asrar N. 2010. Corrosion control of drilling tools through chemical treatments
effectiveness and challenges. SPE International Conference on oilfield corrosion
Bech-Nielsen G. August, 1974. The Anodic Dissolution of Iron , Electrochim Acta, 19
Bhatia A. 2004. Cooling Water Problems and Solutions. Continuing Education and
Development,Inc. 9 Greyridge Farm Court Stony Point, NY 10980
Cai J. October,2005. Experimental Studies of Water Wetting in Large-Diameter
Horizontal Oil/Water Pipe Flows. Proceedings of SPE Annual Technical Conference and
Exhibition ATCE
Causes of corrosion. December 2012.Available from:
http://water.me.vccs.edu/concepts/corrosioncauses. html
Crolet J-L, Bonis M. 1983. The Role of Acetate in CO2 Corrosion. Corrosion 83. Houston,
TX: NACE International
Crolet J-L, Thevenot N, Dugstad A. 1999. Role of Free Acetic Acid on the CO2 Corrosion
of Steels. Houston, TX: NACE International
Fontana M. 1986. Corrosion Engineering, McGraw-Hill, New York, 1986
George K, Nesic S. 2004. Electrochemical investigation and modeling of CO2 corrosion of
carbon steel in the presence of acetic acid. Institute for Corrosion and Multiphase
Technology Ohio University, Athens, OH 45701
George K, Wang S, Nesic S, Waard K. 2004. Modeling of CO2 Corrosion of Mild Steel at
High Pressures of CO2 and in the Presence of Acetic Acid. Corrosion 2004. Paper no.
623,Houston, TX: NACE International
Gulbrandsen E, Bilkova k. 2006. Solution chemistry effects on corrosion of carbon steels
in presence of CO2 and acetic acid. San Diego California, USA
Gulbrandsen E. 2007. Acetic acid and carbon dioxide corrosion of carbon steel covered
with iron carbonate
Guo X, Bando K , Tomoe Y, Chen Z, Liu D. 2005. The effect of acetic acid and acetate on
CO2 corrosion of carbon steel. Corrosion 2005
Halvorsen A, Andersen T. 2005. pH Stabilization for Internal Corrosion Protection of
Pipeline Carrying Wet Gas With CO2 and Acetic Acid. Corrosion 2003, Paper no.
329,Houston, TX: NACE International
Harrop D. May 2006. Our Water Chemistry Contains Organic Acid. SPE International
Oilfield Corrosion Symposium OFCS
Hedges B, McVeigh L. 1999. The Role of Acetate in CO2 Corrosion, the Double
Whammy. Corrosion 99.Paper no. 21, Houston, TX: NACE International

42
Hurlen T, Gunvaldsen S, Blaker F. 1984. Effects of Buffers on Hydrogen Evolution at Iron
Electrodes. Electrochim Acta, 29, 1163
Jones D. 1996. Prentice Hall, Upper Saddle River NJ, Principles and Prevention of
Corrosion (2nd edition)
Kanavy C, Williams J. April 2012. Strengthening our navy one rust spot at a time
Kermani M. August 1996. The Impact of Corrosion on Oil and Gas Industry. SPE
Production & Facilities
Nafday O, Nesic S. 2005. Iron Carbonate Scale Formation and CO2 Corrosion in the
Presence of Acetic Acid. Corrosion 2005. Paper no. 295, Houston, TX: NACE
International
Oddo J, Tomson M. 1999. The prediction of Scale and CO2 Corrosion in Oil Field
Systems. Corrosion 99, Paper no. 41, Houston, TX: NACE International
Okafor P. June 2009. CO2 corrosion of carbon steel in the presence of acetic acid at higher
temperatures. Journal of Applied Electrochemistry
Pickett A . 1974. Electrochimica Acta, Vol 19, p 875
Pletcher D, Garsany Y, Hedges B. 2002. The role of acetate in CO2 corrosion of carbon
steel: Has the chemistry been forgotten. Corrosion 2002. Denver, Paper 02273
Pletcher D, Garsany Y, Hedges B. 2003. Speciation and electrochemistry of brines
containing acetate ion and carbon dioxide. J. Electroanal Chem
Pletcher D, Garsany Y, Hedges B. 2003. The role of acetate in CO2 corrosion of carbon
steel: Studies related to oilfield conditions
Pletcher D, Yannick G. 2003. Role of Acetate in CO2 Corrosion of Carbon Steel. San
Diego Ca
Shreir L, Jarman R, Burstein G. 1994. Corrosion Butterworth-Heinemann, Oxford, Boston
Sidorin V. July 2005. The electrochemistry of 13% chromium stainless steel in oilfield
brines, Electrochimica Acta
Stern M, Geary A. Jan 1957. Electrochemical Polarization. Journal of the Electrochemical
Society, Vol. 104
Sun Y, George K, Nesic S. 2003. The Effect of Acetic Acid on Localized CO2 Corrosion in
Wet Gas Flow. Corrosion 2003, Paper no. 327. Houston, TX: NACE International
Uhlig H, Revie R. 1985. Wiley, Corrosion and Corrosion Control: An Introduction to
Corrosion Science and Engineering, New York
Ueda M, Takabe H. 1998. Effect of Organic Acid on CO2 Corrosion of Carbon and Cr
Bearing Steels. Corrosion 98, Paper no. 35.Houston, TX: NACE International
Vámos I, Szki P. 1997. Measuring the rate of iron corrosion, Budapest, Hungary

43
Waard C, Milliams D. 1975. Carbonic Acid Corrosion of Steel. Corrosion Vol 31, No 5,
p 175
Waard C, Lotz U, Dugstad A. 1995. Influence of Liquid Flow Velocity on CO2 Corrosion:
A Semi-Empirical Model. Corrosion 1995, Paper No.128, Houston, TX: NACE
International
Waard C, Lotz U, Milliams D. 1991. Prediction Model for CO2 Corrosion Engineering in
Wet Gas Pipeline. Corrosion, Vol 47, No 12, p 976
Waard C, Lotz U. 1993. Prediction of CO2 Corrosion in Carbon Steel. Corrosion 1993.
Paper no. 69 Houston, TX: NACE
West J, Horwood E. 1980. Basic Corrosion and Oxidation, Chichester UK
Yin Z. September 2008. Pitting behavior on super 13Cr stainless steel in 3.5% NaCl
solution in the presence of acetic acid. Journal of Solid State Electrochemistry
Yudaya S. 2006. Natural Gas Leak Detection in Pipelines. 1291-A, Cumberland Avenue.
West Lafayette, IN 47906

44
APPENDIX
Table 10: The lab results
Sample label Original mass of
coupon W1 (g)
(±0.0003)
Final mass of
couponW2 (g)
(±0.0003)
Weight loss (g)
W=W1-W2
(±0.0003)
1 2.9016 2.8617 0.0399
2 2.9011 2.8866 0.0145
3 2.8611 2.8477 0.0134
4 2.9006 2.7538 0.1468
5 2.8875 2.6976 0.1899
6 2.9109 2.7157 0.1952
7 2.9025 2.7564 0.1461
8 2.8962 2.7811 0.1158
9 2.9062 2.8064 0.0998
10 2.8734 2.7840 0.0894
11 2.9110 2.9021 0.0089
12 2.8019 2.7954 0.0065
13 2.9003 2.8171 0.0832
14 2.8992 2.8182 0.0810

45
Figure 4: pH meter (METLER TOLEDO) used during operation to check the
variation of pH
Figure 5: pH-indicators used when Toledo was not available

46
Figure 6: coupon used for the corrosion test
Figure 7: Sample number 3 where corrosion can be spotted on the coupon

47
Figure 8: Solution saturated with CO2