ef epi · participate in the ef epi: take the free ef set at efset.org 3. executive summary for...
TRANSCRIPT
EF EPIEF English Proficiency Index
2018www.ef.com /epi
TAKE THE FREE
EF SETThe EF Standard
English Test
www.efset.org

WHAT'S NEW THIS YEAR?1. 1.3 million test takers, a 30% increase over
last year
2. 13 new entrants: Afghanistan, Albania, Belarus, Bolivia, Croatia, Ethiopia, Georgia, Honduras, Lebanon, Myanmar, Nicaragua, Senegal, and Uzbekistan
3. A closer look at English proficiency in the workplace, with scores by industry, seniority, and job function
4. New correlations showing that societies that speak English are more open and egalitarian
5. English proficiency scores for over 400 regions and cities
2 www.ef.com/epi

TABLE OF CONTENTSTABLE OF CONTENTS
Executive Summary
EF EPI 2018 Rankings
EF EPI 2018 City Scores
EF EPI Facts and Figures
English, Economics, and Trade
English and Innovation
English in the Workplace
English and Society
English and Technology
Europe
Asia
Latin America
Africa
Middle East
Conclusions
Appendix A: About the Index
Appendix B: EF EPI Proficiency Bands
Appendix C: CEFR Levels and Can-Do Statements
Appendix D: EF EPI Country and Region Scores
Appendix E: Selected References
04
06
08
10
12
14
16
18
20
22
26
30
34
38
42
44
46
47
48
50
Participate in the EF EPI: take the free EF SET at efset.org
3

EXECUTIVE SUMMARY
For companies, English is a key component of remaining competitive and fostering innovation in an internationalized marketplace. As English becomes necessary for ever more interactions in the globalized world, the value of proficiency in the language grows apparent, and the cost of not speaking English grows steeper.
As a consequence of its popularity, English is more detached than ever from any particular culture. Less than a quarter of the world’s English speakers are “natives,” and that proportion will continue to decline as more people learn English as an additional language. Already, experts estimate that the majority of the world’s population speaks two or more languages.
This report aims to broaden the understanding of how and where English proficiency is developing around the world. In order to create the eighth edition of the EF English Proficiency Index, we’ve analyzed the results of 1.3 million test takers who took our English tests in 2017.
Our key findings are:
ENGLISH PROFICIENCY IMPROVED OVERALL Eight countries demonstrated significant improvement (by more than two points), and 12 countries—a record number—reached the highest proficiency band. Global trends suggest that this improvement will continue. Public and private investment in English language instruction has not slowed. English is as present as ever in the workplace. International travel increased by 7% in 2017.
SOCIETIES THAT SPEAK ENGLISH ARE MORE OPEN, LESS HIERARCHICAL, AND FAIRER TO WOMEN Although English cannot be said to cause these societal improvements, it does seem to accompany them. The correlation makes sense. English breaks down barriers, fosters international exchange, and exposes individuals to the wider world.
ENGLISH AND INNOVATION GO HAND IN HAND More scientific journals are published in English than in any other language, and we’ve found consistent correlations between English and investment in R&D. This relationship is particularly interesting in light of recent research showing that companies with managers from many countries earn more of their revenue from innovation than less diverse competitors. English is changing the way that ideas flow from one place to another.
WOMEN SPEAK ENGLISH BETTER THAN MEN This finding has been true for all eight EF EPI indices, and the gender gap, which narrowed in 2016, has widened again. Research into how boys and girls learn foreign languages has shown that female students are more motivated, use a wider variety of strategies to retain new information, and are more willing to make mistakes. Women on the whole are also more likely than men to finish secondary school and attend university. Unfortunately, businesses are not benefitting as much as they could from women’s English skills. Studies have shown that women speak less in meetings and negotiations than men and are interrupted more when they do speak.
ON AVERAGE, ADULTS IN THEIR TWENTIES SPEAK THE BEST ENGLISH For the first time, adults aged 26 to 30 outperform those aged 21 to 25 worldwide, but the relative skills of different age cohorts vary widely among regions. Where economic incentives to learn English are strong, professionals invest time and money in improving their English and become more proficient than students. When English has been introduced or prioritized in a school system fairly recently, the youngest cohort outstrips all others. In places with little discernible difference between age groups, there have often been no major changes in the English learning landscape for decades, and everyone speaks English equally well. Or equally poorly.
MANAGERS HAVE A BETTER GRASP OF ENGLISH THAN EXECUTIVES OR STAFF This finding holds true across a large majority of industries and countries. Managers interact with their colleagues and clients overseas more regularly than junior staff, so they get more practice speaking English. English skills are also at a premium, and those who have them are often promoted to managerial positions. Executives, on the other hand, tend to be older, and to have come up in a business climate where English skills were less valued. Building English proficiency across all seniority levels would allow companies to develop more international teams and share information more quickly across their organizations.
In 2018, the English language is as important as it has ever been. It is the de facto language of communication for all types of international exchange—goods, services, and ideas.
4 www.ef.com/epi

ENGLISH PROFICIENCY VARIES WIDELY BETWEEN INDUSTRIES AND JOB FUNCTIONS Although many recruiters now demand English skills in almost all candidates, it is clear that the best English speakers cluster in particular roles, such as legal and strategy, and in particular industries, such as banking and IT. The gap between the industries with the highest proficiency and those with the lowest in any given country can be over 15 points, or three proficiency bands, although the worldwide gap between industries is narrowing. The pressures of globalization mean that almost every industry is subject to international competition. Weaker English skills make competing more difficult. AFRICA SHOWED THE STRONGEST GAINS IN ENGLISH PROFICIENCY South Africa’s English improved more than any other country or region in the world, and Algeria, Egypt, and Nigeria also experienced significant gains. This is promising news for a continent with a young population and enormous potential for growth. English skills will enable further engagement with the international community.
ENGLISH SKILLS ARE STRONGER IN EUROPE THAN IN ANY OTHER REGION, ALTHOUGH NOT UNIFORMLY SO Three of the continent’s largest economies—Spain, Italy, and France—have persistent English skill deficiencies, while countries in northern Europe occupy six of the top 10 positions in the index. Sweden returns to first position after a two-year absence, bumping the Netherlands to second place. The countries on the fringes of Europe lag significantly behind the European average.
IN ASIA, ENGLISH PROFICIENCY DID NOT IMPROVE DESPITE HIGH LEVELS OF INVESTMENT IN ENGLISH Previous editions of the EF EPI have found a large gap between the highest and lowest proficiency countries in the region, and in 2017, that gap grew. Singapore improved from an already strong base, moving into third position in the overall ranking. China and Japan did not experience significant changes, and both remain in the Low Proficiency band. The lack of English skills in Central Asia became clearer this year with the addition of Uzbekistan to the index, which, along with Kazakhstan, falls in the Very Low Proficiency band.
LATIN AMERICA IS THE ONLY REGION IN THE WORLD THAT EXPERIENCED A SLIGHT DECLINE IN ENGLISH PROFICIENCY The region remains the most uniform of any in the world in terms of English skills, with only 11 points separating Venezuela, the region’s lowest scorer, from Argentina, the region’s highest. Underperforming education systems and high levels of economic inequality are hampering efforts to improve English proficiency.
THE MIDDLE EAST HAS THE WEAKEST ENGLISH PROFICIENCY OF ANY REGION, AND ALSO THE MOST ERRATIC Most countries in the region experienced an improvement or decline of more than one point since last year. The addition of Lebanon to this year's index made the regional average rise slightly, although the country only falls in the Moderate Proficiency band. Kuwait and Iraq experienced significant improvements, but not large enough to lift them from the Very Low Proficiency band.
5

EF EPI 2018 RANKINGS
High
Very High
Low
Moderate
Very Low
PROFICIENCY BANDS
VERY HIGH PROFICIENCY HIGH PROFICIENCY MODERATE PROFICIENCY
28 India 57.13
29 Nigeria 56.72
30 Hong Kong SAR 56.38
31 South Korea 56.27
32 Spain 55.85
33 Lebanon 55.79
34 Italy 55.77
35 France 55.49
36 Costa Rica 55.01
37 Dominican Republic 54.97
38 Belarus 53.53
39 Senegal 53.50
40 Uruguay 53.41
41 Vietnam 53.12
42 Russia 52.96
43 Ukraine 52.86
44 Macau SAR 52.57
13 Poland 62.45
14 Philippines 61.84
15 Switzerland 61.77
16 Romania 60.31
17 Croatia 60.16
18 Serbia 60.04
19 Portugal 60.02
20 Czech Republic 59.99
21 Hungary 59.51
22 Malaysia 59.32
23 Greece 58.49
24 Slovakia 58.11
25 Bulgaria 57.95
26 Lithuania 57.81
27 Argentina 57.58
01 Sweden 70.72
02 Netherlands 70.31
03 Singapore 68.63
04 Norway 68.38
05 Denmark 67.34
06 South Africa 66.52
07 Luxembourg 66.33
08 Finland 65.86
09 Slovenia 64.84
10 Germany 63.74
11 Belgium 63.52
12 Austria 63.13
6 www.ef.com/epi

LOW PROFICIENCY VERY LOW PROFICIENCY
78 Kuwait 45.64
79 Oman 45.56
80 Kazakhstan 45.19
81 Algeria 44.50
82 Myanmar 44.23
83 Saudi Arabia 43.65
84 Afghanistan 43.64
85 Cambodia 42.86
86 Uzbekistan 42.53
87 Iraq 40.82
88 Libya 39.64
66 Iran 48.29
67 Morocco 48.10
68 Tunisia 47.85
69 Honduras 47.80
70 El Salvador 47.42
71 U.A.E. 47.27
72 Nicaragua 47.26
73 Turkey 47.17
74 Jordan 47.10
75 Venezuela 46.61
76 Syria 46.37
77 Azerbaijan 45.85
45 Georgia 52.28
46 Chile 52.01
47 China 51.94
48 Taiwan 51.88
49 Japan 51.80
50 Pakistan 51.66
51 Indonesia 51.58
52 Albania 51.49
53 Brazil 50.93
54 Ethiopia 50.79
55 Guatemala 50.63
56 Panama 49.98
57 Mexico 49.76
58 Sri Lanka 49.39
59 Peru 49.32
60 Colombia 48.90
61 Bolivia 48.87
62 Egypt 48.76
63 Bangladesh 48.72
64 Thailand 48.54
65 Ecuador 48.52
7
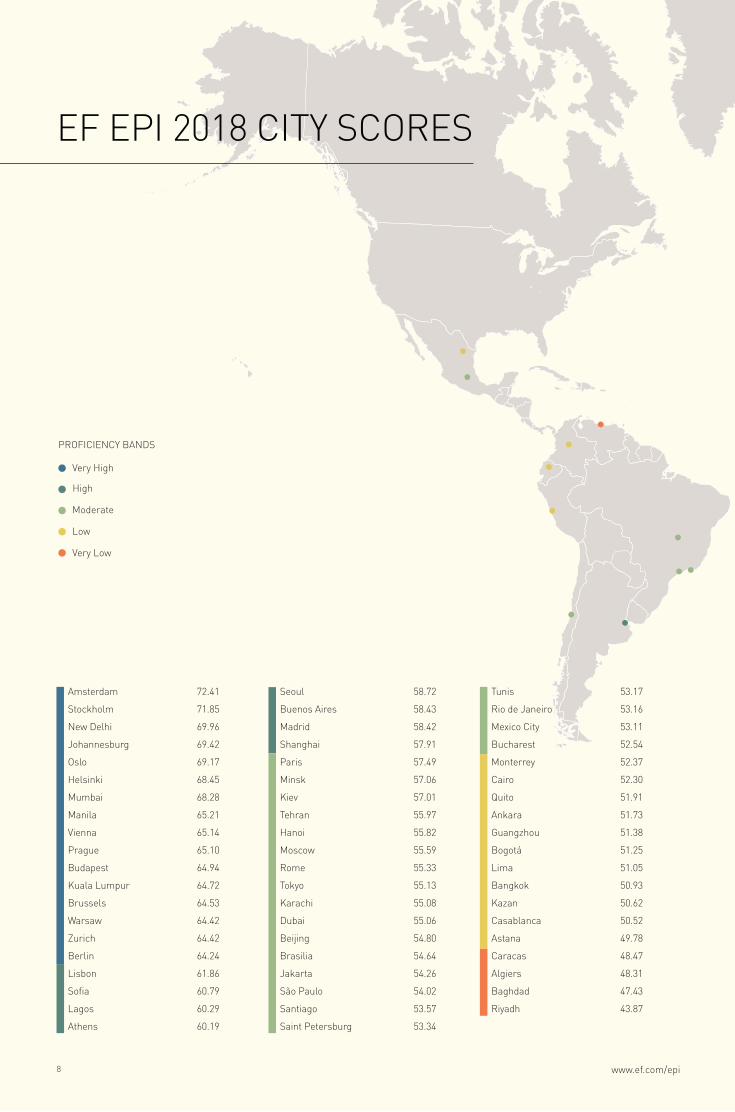
EF EPI 2018 CITY SCORES
Seoul 58.72
Buenos Aires 58.43
Madrid 58.42
Shanghai 57.91
Paris 57.49
Minsk 57.06
Kiev 57.01
Tehran 55.97
Hanoi 55.82
Moscow 55.59
Rome 55.33
Tokyo 55.13
Karachi 55.08
Dubai 55.06
Beijing 54.80
Brasilia 54.64
Jakarta 54.26
São Paulo 54.02
Santiago 53.57
Saint Petersburg 53.34
Amsterdam 72.41
Stockholm 71.85
New Delhi 69.96
Johannesburg 69.42
Oslo 69.17
Helsinki 68.45
Mumbai 68.28
Manila 65.21
Vienna 65.14
Prague 65.10
Budapest 64.94
Kuala Lumpur 64.72
Brussels 64.53
Warsaw 64.42
Zurich 64.42
Berlin 64.24
Lisbon 61.86
Sofia 60.79
Lagos 60.29
Athens 60.19
Tunis 53.17
Rio de Janeiro 53.16
Mexico City 53.11
Bucharest 52.54
Monterrey 52.37
Cairo 52.30
Quito 51.91
Ankara 51.73
Guangzhou 51.38
Bogotá 51.25
Lima 51.05
Bangkok 50.93
Kazan 50.62
Casablanca 50.52
Astana 49.78
Caracas 48.47
Algiers 48.31
Baghdad 47.43
Riyadh 43.87
High
Very High
Low
Moderate
Very Low
PROFICIENCY BANDS
8 www.ef.com/epi

English proficiency scores for over 400 regions and cities, as well as national gender, age, and industry data, are available for download at www.ef.com/epi.
9

EF EPI FACTS AND FIGURES
WHO ARE THE TEST TAKERS?
HOW DO GENDER AND AGE AFFECT ENGLISH PROFICIENCY?
Female
54.5752.63
70
30
35
40
45
50
55
60
65
Male
EF EPI Score
GLOBAL GENDER GAP
26Median Age
92%Under 40 years old
60%Female
40%Male
88Countries & Regions
Europe 32
Asia 21
Latin America 17
Africa 9
Middle East 9
HighVery High LowModerate Very Low
GLOBAL GENERATION GAP
EF EPI Score
18-20 26-3021-25 31-40 41+
70
30
35
40
45
50
55
60
65
54.62 53.72 54.08 53.55
50.73
Age Groups
1.3MTest Takers
PROFICIENCY BANDS
10 www.ef.com/epi

HIGHLIGHTS OF THIS YEAR'S EF EPI:
EF EPI REGIONAL AVERAGES
EF EPI Score
HighVery High LowModerate Very LowPROFICIENCY BANDS
EF EPI 2018 REGIONAL TRENDS
EF EPI AND POPULATION SIZE
EUROPE ASIA AFRICA LATIN AMERICA MIDDLE EAST
HIGHEST SCORE Sweden Singapore South Africa Argentina Lebanon
LOWEST SCORE Azerbaijan Uzbekistan Libya Venezuela Iraq
MOST IMPROVED +2.12 Czech Republic +2.60 Singapore +3.15 South Africa +1.88 Costa Rica +2.70 Iraq
LARGEST DECLINE -2.59 Denmark -2.24 Bangladesh -1.16 Tunisia -1.81 Mexico -2.12 Syria
Participate in the EF EPI: take the free EF SET at efset.org
Europe Latin AmericaAsia Africa Middle East
70
30
35
40
45
50
55
60
65
56.64
53.49
46.02
World Average Score 53.34
50.33
53.21
The size of a country's population does not generally correlate with English proficiency, and there are high proficiency countries of all sizes. However, very small countries tend to have above average levels of English proficiency. Small countries have more pressing economic drivers to integrate internationally than their larger neighbors.
30 COUNTRIES WITH FEWER THAN 10 MILLION PEOPLE
32 COUNTRIES WITH 10-50 MILLION PEOPLE
23 COUNTRIES WITH MORE THAN 50 MILLION PEOPLE
AVERAGE 56.20 AVERAGE 51.13 AVERAGE 53.59
HIGHEST SCORES HIGHEST SCORES HIGHEST SCORES
Sweden 70.72 9.9M Netherlands 70.31 17.1M South Africa 66.52 54.8M
Singapore 68.63 5.9M Belgium 63.52 11.5M Germany 63.74 80.6M
Norway 68.38 5.3M Poland 62.45 38.5M Philippines 61.84 104.3M
Population size in millions (M)
11

English proficiency is positively correlated with productivity as measured by the amount of work produced for each hour of labor.
WORKING SMARTER
Source: Cato Institute’s Human Progress Project, 2017
High
Very High
Low
Moderate
Very Low
PROFICIENCY BANDS
ENGLISH, ECONOMICS, AND TRADE
Labor productivity per hour worked
16.4
8 U
SD20.43 USD
34.26 USD34.91 USD
65.82 USD
Most economies are increasingly powered by trade, which represented 56% of world GDP in 2015, up from 44% in 1995. Overwhelmingly, the common language required for these global transactions is English. Not surprisingly, there is a strong correlation between English proficiency and many import and export-related indicators, including logistics performance (Graph A), documents to export, and time to import.
A BETTER ENVIRONMENT FOR BUSINESSES Every edition of the EF EPI has found a strong correlation between ease of doing business and English proficiency (Graph B). While small-time entrepreneurs and artisans may not need English to do business locally, a growing proportion of businesses operate internationally—as part of a global supply chain, as customers of finished products, or as competitors with similar businesses abroad. According to Professor Tsedal Neeley of Harvard Business School, close to 60% of all multinational organizations already operate
ENGLISH AND ECONOMIC DEVELOPMENT For economies around the world, higher English proficiency comes with significant benefits. English proficiency correlates with higher gross domestic product, higher average gross income (Graph C), and growth in other key economic indicators. In developing economies, the transition from agriculture or manufacturing to a knowledge-based economic model requires not only technological infrastructure but also skilled adults who are able to sell their services internationally. Accordingly, there is a strong correlation between English proficiency and service exports (Graph D), as well as between English proficiency and productivity. In many places, retail is the single biggest private employer, but with e-commerce growing at an average rate of 20% per year globally, not even this quintessentially local sector is guaranteed to remain local. The future of the workplace is international, and speaking English is one of the basic skills required to gain access.
in English. Those that do not will find it difficult to catch up to the first-movers.
THE CORPORATE LANGUAGE It takes time to develop a workforce with strong English skills, but multinational companies are increasingly convinced of its necessity. Rakuten, the Japanese e-commerce giant, began the transition to using English as their worldwide corporate language in 2010. Today, 80% of the new engineers in their Tokyo offices are non-Japanese, and the company has gone from 200 million users to 1.1 billion by expanding outside its home market. Honda, Nissan, Renault, Siemens, Nestle, Sodexo, and many other multinationals headquartered in non-English-speaking countries have also adopted English as their corporate language in order to remain competitive. Integrating an international workforce demands a common language.
12 www.ef.com/epi

Source: Cato Institute’s Human Progress Project, 2017
GRAPH C
GRAPH B
GRAPH D
ENGLISH AND BUSINESS
Ease of Doing Business Index
EF EPI ScoreSource: World Bank, 2017
ENGLISH AND INCOME ENGLISH AND SERVICE EXPORTS
Service Exports (BoP, per capita, current USD, log scale)
Source: World Bank, 2016
Average Gross Income (USD, 2016 exchange rate)
EF EPI ScoreSource: World Bank, 2016
HighVery High LowModerate Very LowPROFICIENCY BANDS
35 40 45 50 70 7560 6555
Easy
HardR=0.59
ENGLISH AND LOGISTICS
Logistics Performance Index
EF EPI ScoreSource: World Bank, 2016
GRAPH A
R=0.69
1.0
1.5
2.0
2.5
3.0
3.5
4.0
4.5
5.0
35 40 45 50 70 7560 6555
EF EPI Score
35 40 45 50 70 7560 65550
1.5
1.0
0.5
2.5
2.0
4.0
3.5
3.0
5.0
4.5
R=0.66
Participate in the EF EPI: take the free EF SET at efset.org
R=0.64
35 40 45 50 70 7560 65550
5,000
10,000
15,000
20,000
25,000
30,000
35,000
40,000
45,000
50,000
13
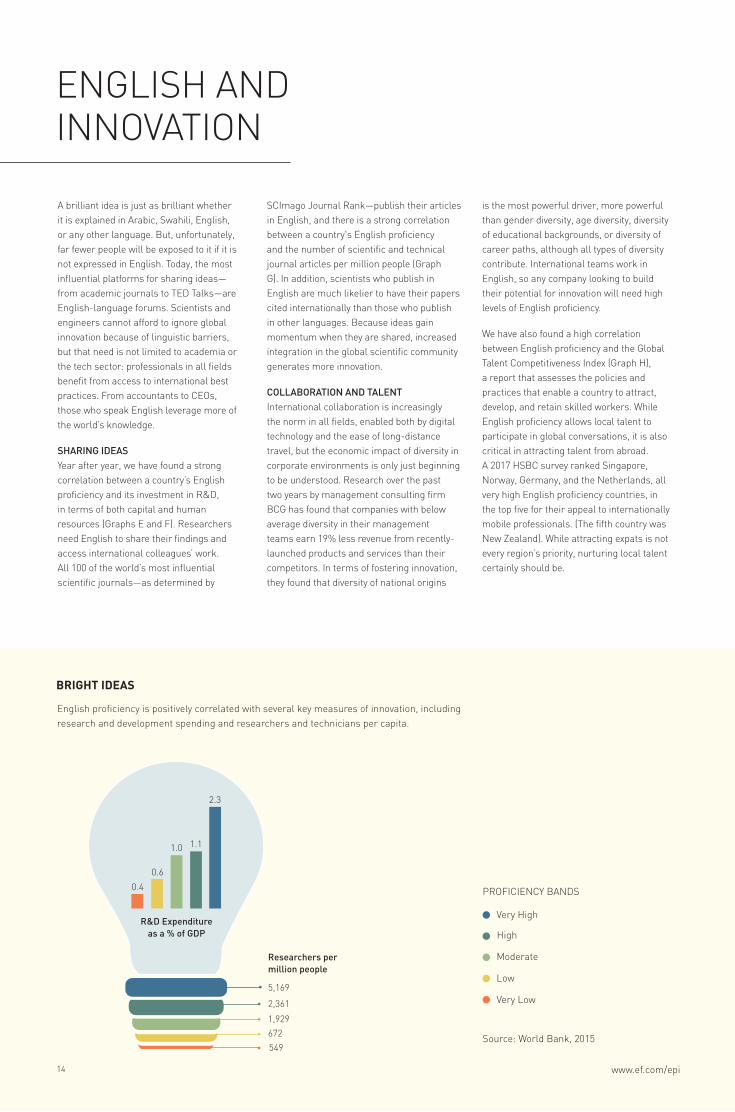
English proficiency is positively correlated with several key measures of innovation, including research and development spending and researchers and technicians per capita.
ENGLISH AND INNOVATION
BRIGHT IDEAS
Source: World Bank, 2015
High
Very High
Low
Moderate
Very Low
PROFICIENCY BANDS0.4
0.6
1.0 1.1
2.3
5,169
2,361
1,929
672
549
R&D Expenditure as a % of GDP
Researchers per million people
A brilliant idea is just as brilliant whether it is explained in Arabic, Swahili, English, or any other language. But, unfortunately, far fewer people will be exposed to it if it is not expressed in English. Today, the most influential platforms for sharing ideas—from academic journals to TED Talks—are English-language forums. Scientists and engineers cannot afford to ignore global innovation because of linguistic barriers, but that need is not limited to academia or the tech sector: professionals in all fields benefit from access to international best practices. From accountants to CEOs, those who speak English leverage more of the world’s knowledge.
SHARING IDEAS Year after year, we have found a strong correlation between a country’s English proficiency and its investment in R&D, in terms of both capital and human resources (Graphs E and F). Researchers need English to share their findings and access international colleagues’ work. All 100 of the world’s most influential scientific journals—as determined by
SCImago Journal Rank—publish their articles in English, and there is a strong correlation between a country's English proficiency and the number of scientific and technical journal articles per million people (Graph G). In addition, scientists who publish in English are much likelier to have their papers cited internationally than those who publish in other languages. Because ideas gain momentum when they are shared, increased integration in the global scientific community generates more innovation.
COLLABORATION AND TALENT International collaboration is increasingly the norm in all fields, enabled both by digital technology and the ease of long-distance travel, but the economic impact of diversity in corporate environments is only just beginning to be understood. Research over the past two years by management consulting firm BCG has found that companies with below average diversity in their management teams earn 19% less revenue from recently-launched products and services than their competitors. In terms of fostering innovation, they found that diversity of national origins
is the most powerful driver, more powerful than gender diversity, age diversity, diversity of educational backgrounds, or diversity of career paths, although all types of diversity contribute. International teams work in English, so any company looking to build their potential for innovation will need high levels of English proficiency.
We have also found a high correlation between English proficiency and the Global Talent Competitiveness Index (Graph H), a report that assesses the policies and practices that enable a country to attract, develop, and retain skilled workers. While English proficiency allows local talent to participate in global conversations, it is also critical in attracting talent from abroad. A 2017 HSBC survey ranked Singapore, Norway, Germany, and the Netherlands, all very high English proficiency countries, in the top five for their appeal to internationally mobile professionals. (The fifth country was New Zealand). While attracting expats is not every region’s priority, nurturing local talent certainly should be.
14 www.ef.com/epi

Source: World Bank, 2015
ENGLISH AND TALENT
EF EPI ScoreSource: INSEAD, 2018
ENGLISH AND SCHOLARSHIP
EF EPI ScoreSource: World Bank, 2016
350
1,500
500
1,000
2,000
2,500
3,000
40 45 50 7060 6555 75
ENGLISH AND RESEARCHERS
EF EPI Score
Source: World Bank, 2015
351.0
1.5
2.0
2.5
3.0
3.5
4.0
4.5
5.0
40 45 50 70 7560 6555
ENGLISH AND R&D EXPENDITURE
EF EPI Score
Source: World Bank, 2015
GRAPH E GRAPH F
GRAPH G GRAPH H
Research and Development Expenditure (% of GDP)
R=0.74
Researchers in R&D (per million people)
Scientific and Technical Journal Articles (per million people)
R=0.78
Global Talent Competitiveness Index
35 40 45 50 70 7560 65550
30
20
10
40
50
60
70
80
90
R=0.73
350
2.0
0.5
1.0
1.5
2.5
3.0
3.5
4.5
5.0
40 45 50 7060 6555 75
4.0
R=0.65
Participate in the EF EPI: take the free EF SET at efset.org
HighVery High LowModerate Very LowPROFICIENCY BANDS
15

ENGLISH EVERYWHEREEnglish is necessary for more jobs in more companies than ever before. Where once English skills were a job requirement in particular roles at particular seniority levels, today, supply chains, technical support, customer contacts, documentation, and management hierarchies all cross national borders. The number of multinational enterprises worldwide rose by 25% between 2006 and 2016. In a 2016 survey, more than 70% of companies in 28 non-English-speaking countries reported that English was important for their business, and 11% said it was the main language used.
A CLOSING GAP Our data indicate another aspect of this trend. While differences in English proficiency still exist between industries, they are primarily at the national level. Worldwide, the gap between the industries with the highest and lowest English proficiency has narrowed enormously. In 2016 it was 19 points; today it is barely 10. This global reduction in skill disparity is entirely thanks to improved proficiency in the weakest industries. More companies are investing in English training, more adults are investing in their own English skills, and more professionals are getting the opportunity to use English at work.
ENGLISH IN THE WORKPLACE
EF EPI BY INDUSTRY
20 40 60 80EF EPI Score
Media
Banking & Finance
Agriculture
Information Technology
Pharmaceuticals
Consulting
Travel & Tourism
Healthcare
Engineering & Construction
Mining & Energy
Food & Beverage
Automotive
Insurance
Public Sector
Telecommunications
Logistics
Manufacturing
Retail
Aviation
16 www.ef.com/epi

MANAGERS TAKE THE LEAD Managers speak English better than executives and staff worldwide, especially in regions where the median age skews younger. The gap is widest in Latin America, where despite recent investments in improving English education in schools, the average level of adult English proficiency has declined since last year. Asia and Europe have older populations and smaller proficiency gaps between workers of different seniority levels. Asia is the only region in which executives are leading by example, keeping pace with their management teams in mastering English. In Europe, it is the junior professionals who speak English best.
THE JOB FUNCTION DIVIDE Of all the workplace indicators, job function determines English level most reliably. English levels by job function span all five of our proficiency bands, from very high to very low. This is most likely a recruitment-driven effect of current or past hiring practices. The danger for companies is that instead of one integrated corporate talent pool to develop and deploy, they are creating two parallel classes of employee: an internationally-mobile, English-speaking elite and a locally-limited, non-English-speaking support staff.
EF EPI BY JOB FUNCTIONEF EPI BY SENIORITY
EF EPI Score 2020 4040 6060 8080 EF EPI Score
Europe
World
Latin America
Asia
Middle East
StaffManagerExecutive
HighVery High LowModerate Very LowPROFICIENCY BANDS
Participate in the EF EPI: take the free EF SET at efset.org
Legal
Strategy & Planning
IT
Marketing & Sales
Accounting & Finance
R & D
Purchasing & Procurement
Human Resources
Customer Service
Admin & Clerical
Distribution
17
ENGLISH AND SOCIETY
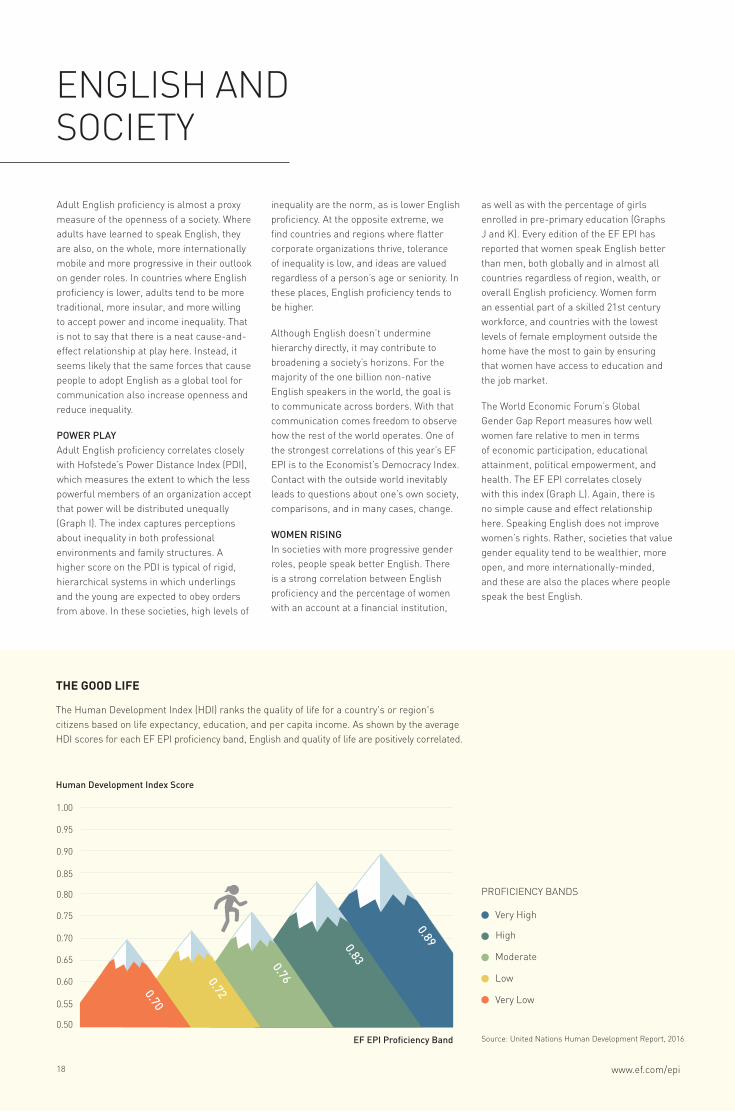
The Human Development Index (HDI) ranks the quality of life for a country's or region's citizens based on life expectancy, education, and per capita income. As shown by the average HDI scores for each EF EPI proficiency band, English and quality of life are positively correlated.
THE GOOD LIFE
0.70
0.72
0.76
0.83
0.89
EF EPI Proficiency Band
High
Very High
Low
Moderate
Very Low
PROFICIENCY BANDS
Source: United Nations Human Development Report, 2016
0.50
0.65
0.55
0.60
0.70
0.75
0.80
0.85
0.90
0.95
1.00
Human Development Index Score
Adult English proficiency is almost a proxy measure of the openness of a society. Where adults have learned to speak English, they are also, on the whole, more internationally mobile and more progressive in their outlook on gender roles. In countries where English proficiency is lower, adults tend to be more traditional, more insular, and more willing to accept power and income inequality. That is not to say that there is a neat cause-and-effect relationship at play here. Instead, it seems likely that the same forces that cause people to adopt English as a global tool for communication also increase openness and reduce inequality.
POWER PLAY Adult English proficiency correlates closely with Hofstede’s Power Distance Index (PDI), which measures the extent to which the less powerful members of an organization accept that power will be distributed unequally (Graph I). The index captures perceptions about inequality in both professional environments and family structures. A higher score on the PDI is typical of rigid, hierarchical systems in which underlings and the young are expected to obey orders from above. In these societies, high levels of
inequality are the norm, as is lower English proficiency. At the opposite extreme, we find countries and regions where flatter corporate organizations thrive, tolerance of inequality is low, and ideas are valued regardless of a person’s age or seniority. In these places, English proficiency tends to be higher.
Although English doesn’t undermine hierarchy directly, it may contribute to broadening a society’s horizons. For the majority of the one billion non-native English speakers in the world, the goal is to communicate across borders. With that communication comes freedom to observe how the rest of the world operates. One of the strongest correlations of this year’s EF EPI is to the Economist’s Democracy Index. Contact with the outside world inevitably leads to questions about one’s own society, comparisons, and in many cases, change.
WOMEN RISING In societies with more progressive gender roles, people speak better English. There is a strong correlation between English proficiency and the percentage of women with an account at a financial institution,
as well as with the percentage of girls enrolled in pre-primary education (Graphs J and K). Every edition of the EF EPI has reported that women speak English better than men, both globally and in almost all countries regardless of region, wealth, or overall English proficiency. Women form an essential part of a skilled 21st century workforce, and countries with the lowest levels of female employment outside the home have the most to gain by ensuring that women have access to education and the job market.
The World Economic Forum’s Global Gender Gap Report measures how well women fare relative to men in terms of economic participation, educational attainment, political empowerment, and health. The EF EPI correlates closely with this index (Graph L). Again, there is no simple cause and effect relationship here. Speaking English does not improve women’s rights. Rather, societies that value gender equality tend to be wealthier, more open, and more internationally-minded, and these are also the places where people speak the best English.
18 www.ef.com/epi

ENGLISH AND GIRLS IN PRESCHOOL
School Enrollment, Pre-primary, Female (% gross)
EF EPI Score
Source: World Bank, 2016
350
30
40
50
60
10
20
70
80
90
100
40 45 50 7060 6555 75
GRAPH J
GRAPH K GRAPH L
R=0.61
HighVery High LowModerate Very LowPROFICIENCY BANDS
ENGLISH AND POWER DISTANCE
EF EPI ScoreSource: Hofstede Insights, 2010
350
20
40
60
80
100
120
40 45 50 7060 6555 75
GRAPH I
Power Distance Index (inverse)
R=0.58
ENGLISH AND WOMEN WITH BANK ACCOUNTSAccount at a Financial Institution, Female (%, age 15+)
EF EPI Score
Source: World Bank, 2016
350
20
40
60
80
100
120
40 45 50 70 7560 6555
R=0.70
ENGLISH AND GENDER EQUALITY
Global Gender Gap Index
EF EPI Score
Source: World Economic Forum, 2017
35 0.50
0.55
0.60
0.65
0.70
0.75
0.80
0.85
0.90
40 45 50 70 7560 6555
R=0.56
Participate in the EF EPI: take the free EF SET at efset.org
19

Source: World Bank, 2016
High
Very High
Low
Moderate
Very Low
PROFICIENCY BANDS
ENGLISH AND TECHNOLOGY
Tunisia 51%
Iran
44%
Myanm
ar 25%
China 53%
Average 49%
Aver
age
52% Average 64%
Average 72%
Aver
age
86%
Ecuador
54%
Brazil
60%
Italy
61
%
Uru
guay
66%
Belarus
71%
Poland 73%
Malaysia 78%
Switzerland 89%
Belgium
87%
Netherlands
90%
Norway
97
%
VERY LOW
HIG
H
MODERATE
VERY HIGH
LOW
VIRTUAL WORLD, REAL SKILLS
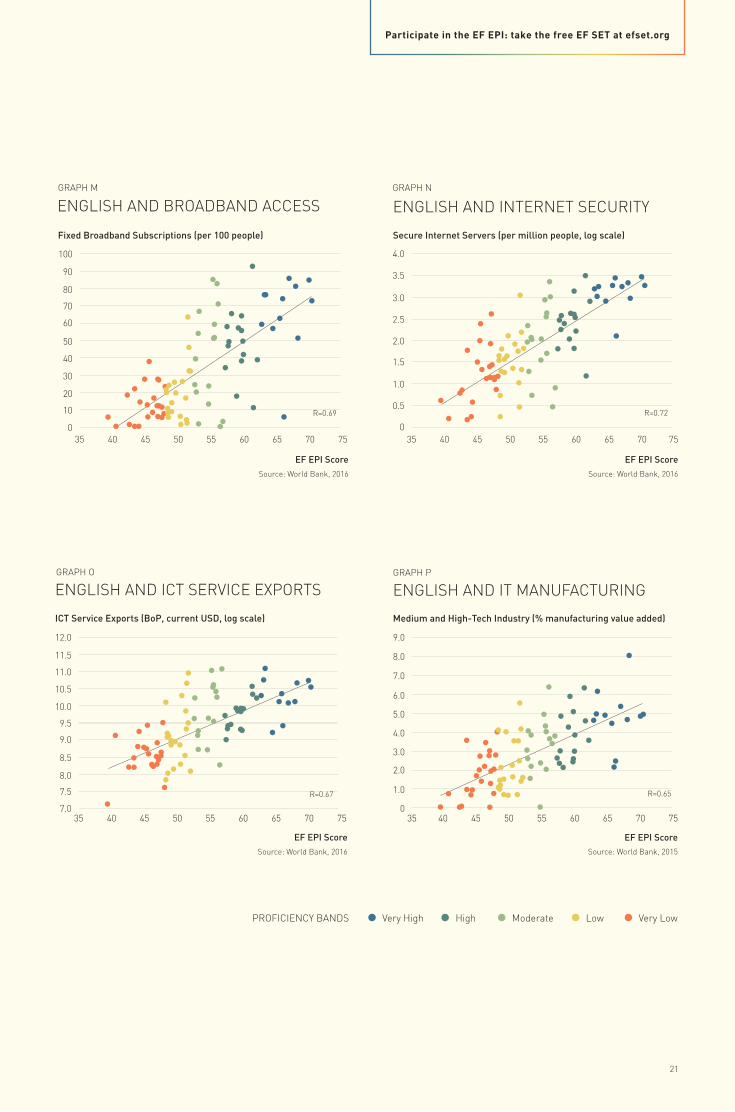
Average internet penetration—the percentage of people with Internet access—is higher in countries with better English. Online, English skills allow access to more content, which in turn improves their skills.
Taken together, English proficiency and good Internet connections allow people to access more of the world's knowledge, find global collaborators, and share their ideas with a wider audience. More than half of the 10 million most-visited websites on the Internet are written in English. Cutting-edge research and innovation in tech almost inevitably requires some facility with the language. There is evidence that technological literacy can also boost English proficiency. Internet use gives people more exposure to the English language. It is a self-reinforcing cycle, with English allowing access to a broader range of information, and international exposure building English skills. As such, higher levels of Internet access are correlated with higher English proficiency, according to measures such as broadband subscriptions and the number of secure servers (Graphs M and N).
A WORLD OF SHARED KNOWLEDGE Most of the world’s most influential technology companies are American, and almost all of the most commonly used programming languages are based on English vocabulary. More IT documentation and technology research is published in
English than in any other language. As a result, poor English proficiency makes it difficult for tech workers to access key resources in their fields. More broadly, limited access to new research hinders the formation of a technically savvy professional class that can deploy the latest IT infrastructure and manage international e-commerce development.
TECHNOLOGY AND TRADE Technology does not just bolster existing trade. It creates entirely new sectors of exchange. According to the WTO, exports of telecommunication, computer, and information services surpassed 1.421 trillion USD in 2016. Europe is by far the largest exporter of these services, accounting for nearly half of global information and computer technology (ICT) exports in the same year. It comes as no surprise that ICT service exports correlate strongly with English proficiency (Graph O), as does manufacturing value added in the technology industry (Graph P). In order to expand into these sectors, developing economies need both technology skills and a workforce capable of communicating in English with international clients.
LEARNING ENGLISH ONLINE Technology is already one of the most powerful drivers of English language acquisition. Digital tools and platforms expose individual learners to a range of authentic English sources and free them from a top-down approach to instruction. In many cases, technology can deliver higher quality English training than is available locally. In theory, the increasing availability of fast mobile connections and the diversification of both public and private online English training should make it much easier for adults to customize their learning experiences and improve their English outside of formal schooling. Advancements in artificial intelligence, virtual reality, and other emerging technologies could usher in a new era of even more immersive and relevant digital training. In practice, however, many online courses are hampered by low adoption and high attrition rates. For technology-enabled English training to reach its full potential, more providers will need to engage students with compelling design strategies and live online teaching.
20 www.ef.com/epi
ENGLISH AND IT MANUFACTURINGENGLISH AND ICT SERVICE EXPORTS
Source: World Bank, 2016
ENGLISH AND INTERNET SECURITY
EF EPI ScoreSource: World Bank, 2016
ENGLISH AND BROADBAND ACCESS
Fixed Broadband Subscriptions (per 100 people)
EF EPI ScoreSource: World Bank, 2016
GRAPH M GRAPH N
GRAPH O GRAPH P
Secure Internet Servers (per million people, log scale)
EF EPI ScoreSource: World Bank, 2015
Medium and High-Tech Industry (% manufacturing value added)
EF EPI ScoreSource: World Bank, 2016
ICT Service Exports (BoP, current USD, log scale)
350
30
10
20
40
50
60
80
90
100
40 45 50 7060 6555 75
70
R=0.69
350
0.5
1.0
1.5
2.0
2.5
3.0
3.5
4.0
40 45 50 70 7560 6555
R=0.72
357.0
7.5
8.0
8.5
9.5
9.0
10.5
10.0
12.0
11.0
11.5
40 45 50 70 7560 6555
R=0.67
350
7.0
6.0
5.0
2.0
1.0
4.0
3.0
8.0
9.0
40 45 50 7060 6555 75
R=0.65
Participate in the EF EPI: take the free EF SET at efset.org
HighVery High LowModerate Very LowPROFICIENCY BANDS
21
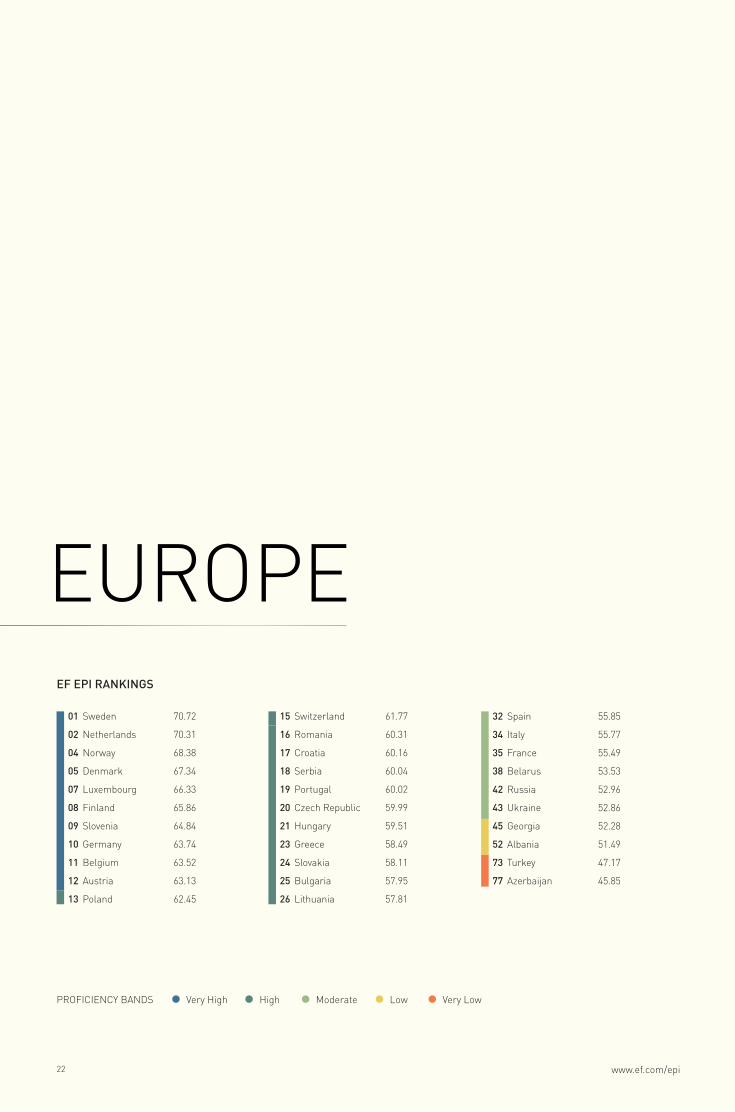
EUROPEEF EPI RANKINGS
32 Spain 55.85
34 Italy 55.77
35 France 55.49
38 Belarus 53.53
42 Russia 52.96
43 Ukraine 52.86
45 Georgia 52.28
52 Albania 51.49
73 Turkey 47.17
77 Azerbaijan 45.85
15 Switzerland 61.77
16 Romania 60.31
17 Croatia 60.16
18 Serbia 60.04
19 Portugal 60.02
20 Czech Republic 59.99
21 Hungary 59.51
23 Greece 58.49
24 Slovakia 58.11
25 Bulgaria 57.95
26 Lithuania 57.81
01 Sweden 70.72
02 Netherlands 70.31
04 Norway 68.38
05 Denmark 67.34
07 Luxembourg 66.33
08 Finland 65.86
09 Slovenia 64.84
10 Germany 63.74
11 Belgium 63.52
12 Austria 63.13
13 Poland 62.45
HighVery High LowModerate Very LowPROFICIENCY BANDS
22 www.ef.com/epi

Azerbaijan
Sweden
FinlandNorway
Netherlands
Luxembourg
Belgium
Germany
Austria
Switzerland
France
PortugalSpain
Italy
Turkey
Denmark
Ukraine
Poland
Romania
Czech Republic
Hungary
Slovakia
Russia
Serbia
Bulgaria
Croatia
Slovenia
Albania
Lithuania
Belarus
Greece
Georgia
23

Of the 27 countries in this year’s index with high or very high English proficiency, 22 are in Europe. This success reflects decades of effective policymaking. The world’s largest student mobility program, Erasmus+, is run by the EU, with over 700,000 European students and teachers studying abroad each year. Eighty-three percent of European students have begun learning at least one foreign language in school by age 10, and 97% of 13-year-olds are studying English. Modern Europe, forged in the wake of two devastating wars, defines itself by its multilingualism and international collaboration.
EUROPE EXCELS IN ENGLISH Sweden has returned to its first place position after a two-year absence, despite having welcomed more refugees per capita over the past five years than any other European country. Sweden also scored first in the 2017 European Commission’s Innovation Scoreboard, a comparative analysis of 27 indicators, including human resources, investments, and intellectual assets. Scandinavians on the whole have remarkably high levels of English, thanks to strong education systems, daily exposure to English in the media, and an entrenched culture of internationalism.
Central Europe is becoming an increasingly attractive business hub, in part due to high levels of English proficiency and relatively low costs. Economic growth has drastically slowed emigration of young central Europeans to the U.K. and Ireland in the past five years, and many of those who left have begun to return, bringing their English skills with them. The Czech Republic, Hungary, and Romania are experiencing unemployment rates below 6%. GDP per capita at Purchasing Power Parity has more than doubled since 2004 in Romania, Poland, Bulgaria, and Slovakia. English is facilitating global investment in these countries and improving the business environment.
…BUT NOT UNIVERSALLY Both Italy and France saw their adult English proficiency rise since last year, but not significantly enough to change their regional positions. Both countries lag behind other major European economies. In Italy, a 2018 court decision forbid universities from offering degree programs entirely in English, citing the need to preserve the Italian language. France, under the leadership of its young, English-speaking president, is discussing reforms of its continuing education funding scheme, apprenticeship programs, and secondary school exit exam
to reduce inequality and close a perceived national skill gap. However, protection of the French language has always been an explicit priority there. Whenever English is perceived as a threat to national languages, English proficiency suffers.
Outside the European Single Market, European countries have notably lower English proficiency than their neighbors, with an average score a full 10 points below the Common Market as a whole. Language is not the only obstacle to closer ties with Europe for these countries, but communication barriers do not make progress any easier.
A WIDE GAP REMAINS Despite the centralizing forces at the heart of the European project, the region remains heterogeneous. Some of that diversity is reflected in wide disparities in English skill. The English proficiency gap between Sweden and France is over 15 points. Include the countries at Europe’s borders, and the skill gap between the highest and lowest performers is as wide as anywhere in the world. The threats of populism and anti-European sentiment remain real, driven in part by rising inequalities, immigration, and profound questions of national identity.
Europe has, by far, the highest English proficiency of any region in the world, and the region's average score improved slightly since last year despite the high baseline.
INTERNATIONALISM…PROBABLY
24 www.ef.com/epi

EF EPI Score
Europe World
57.92
54.92
70
30
35
40
45
50
55
60
65
54.5752.63
+0.95+0.82
+1.26+1.58
+0.61 +0.61
+0.03-0.62-2.59
Den
mar
k
Net
herl
ands
Azer
baija
n
Turk
ey
Spai
n
Slov
enia
*
Finl
and
Swed
en
Pol
and
Slov
akia
Nor
way
Bul
gari
a
Serb
ia
Lith
uani
a
Rus
sia
Switz
erla
nd
Hun
gary
Aust
ria
Fran
ce
Rom
ania
Por
tuga
l
Gre
ece
Ger
man
y
Italy
Luxe
mbo
urg
Bel
gium
Ukr
aine
Cze
ch
Rep
ublic
-0.21-1.14 -0.13-1.12+0.32
+0.90
+1.35
+1.76+1.94 +1.95
+2.12
+0.77
+0.38+0.67
+1.18+1.39
+0.48+0.73
+1.10
* This country did not appear in the EF EPI seventh edition, so this score comes from earlier EF EPI editions.
GENERATION GAP
EF EPI TRENDS
EuropeWorld
Europe
World
Trending Down Trending Up
Slight Decrease Slight Increase
GENDER GAP
Average scores for Europeans of both genders remain significantly above global averages. The gender gap in Europe has doubled, with women’s scores rising more than one point compared to last year, while men performed slightly worse. The difference in English skills between women and men in Europe is now twice as large as in Asia and Latin America.
Adults in all age groups in Europe performed above global averages. Compared to last year, adults over 25 performed significantly better, with adults over 40 improving the most. Young adults aged 18-20 were the only group to experience a decline.
Europe saw few dramatic score changes this year, but the majority of countries in the region improved, with the Czech Republic improving most. Denmark is the only European country to have experienced a significant decline. Eight European countries moved into higher proficiency bands this year—more than in any other region.
EF EPI Score
18-20 26-3021-25 31-40 41+ Age Groups
70
30
35
40
45
50
55
60
65
58.11 57.23 57.7056.87
53.2054.62 53.72 54.08 53.55
50.73
EF EPI Score Change from Last Year
Participate in the EF EPI: take the free EF SET at efset.org
25
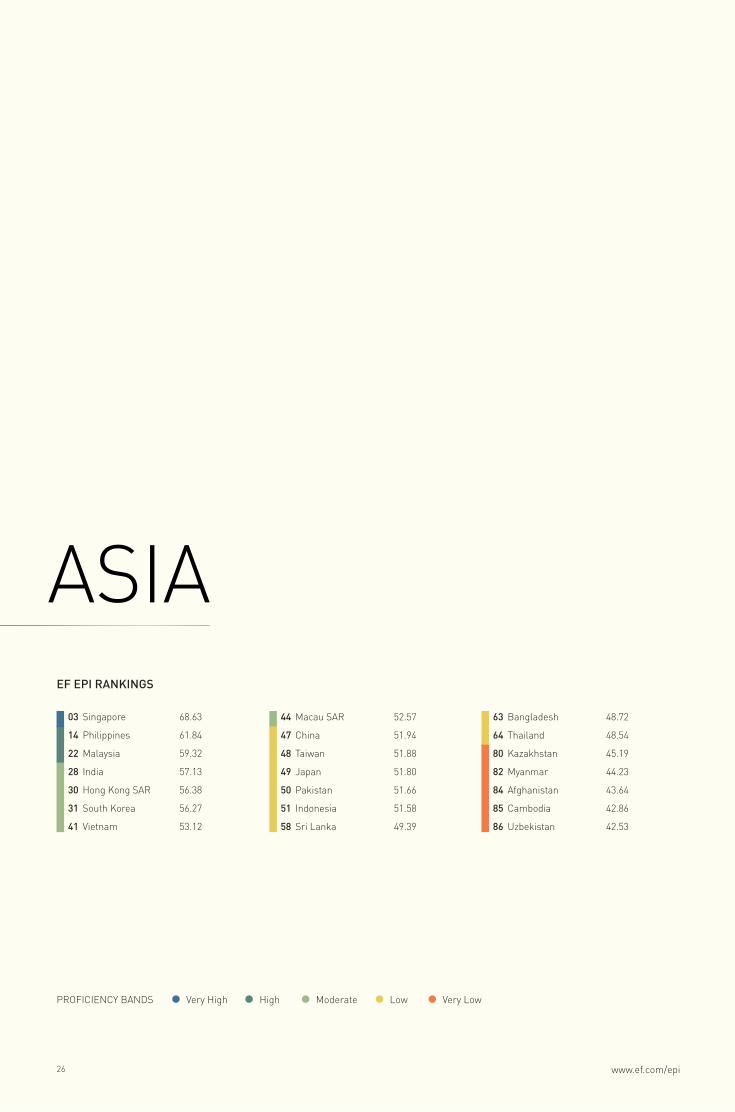
ASIAEF EPI RANKINGS
HighVery High LowModerate Very LowPROFICIENCY BANDS
63 Bangladesh 48.72
64 Thailand 48.54
80 Kazakhstan 45.19
82 Myanmar 44.23
84 Afghanistan 43.64
85 Cambodia 42.86
86 Uzbekistan 42.53
44 Macau SAR 52.57
47 China 51.94
48 Taiwan 51.88
49 Japan 51.80
50 Pakistan 51.66
51 Indonesia 51.58
58 Sri Lanka 49.39
03 Singapore 68.63
14 Philippines 61.84
22 Malaysia 59.32
28 India 57.13
30 Hong Kong SAR 56.38
31 South Korea 56.27
41 Vietnam 53.12
26 www.ef.com/epi
Kazakhstan
Singapore
Indonesia
Malaysia
Vietnam
Bangladesh
Cambodia
Thailand
India
Sri Lanka
Pakistan
China
Afghanistan
South Korea
Taiwan
Hong Kong SAR
Japan
Myanmar
Philippines
Macau SAR
Uzbekistan
27

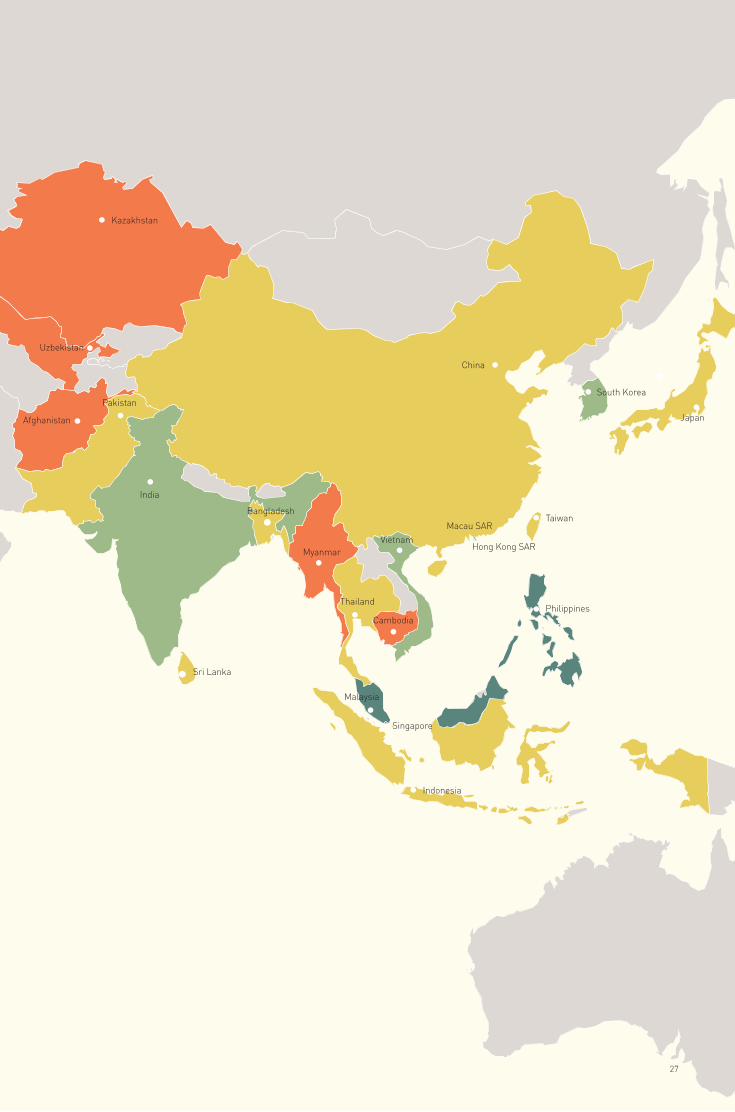
Asia has the largest range of English proficiencies of any region, with three countries or territories in the upper quartile of this year’s index and four in the bottom 10%.
NO HALF MEASURES
Although average adult English proficiency in Asia was stable relative to last year, half of the countries and regions included in both indices experienced a rise or fall of more than one point. This vast and populous continent is anything but monotonous.
APPRECIATING ENGLISH With rapid growth in trade and technology, Asian countries with strong English proficiency are thriving. Singapore, which has consistently scored in the top 10 of the EF EPI, has had a trade to GDP ratio of over 300% since 1960. Although India is better-known for offshore services, it is the Philippines, with less than 10% of India’s population, which has the larger number of call centers.
In some Asian countries and regions, though, English education is still too focused on rote learning. In particular, China’s transition from a manufacturing economy to a knowledge-based economy requires more people with strong English communication skills. According to The Economist, at its present pace, China’s tech industry will be at parity with America’s within the next 15 years. But despite this rapid progress, less than 25% of Chinese scientific papers published in 2016 cited an international
co-author. Awareness of the value of speaking English in China is extremely high, however. Seventy percent of parents surveyed want their children to learn more English in school. Aspiring English students who are no longer in school or who are dissatisfied with public education offerings have many other options. The private English language training market in China is estimated to be growing at 22% per year.
Japan’s English proficiency declined slightly since last year, but even in this insular country, there are signs of change. Nearly 15% of companies in the Nikkei 225 now have at least one non-Japanese person on their boards, and the number of foreign workers in Japan exceeded one million for the first time in 2017. With its rapidly aging population, Japan would benefit from an influx of younger workers from abroad. English will become an official subject in primary school in 2020, but with no plans for teacher retraining, Japan will have to do more if it wants to raise its level of English.
SWEEPING REFORMS In many countries, deficiencies in English education reflect much larger systemic issues. Just 2% of GDP is spent on education in Myanmar, and a third of
teachers in Bangladesh are not certified to teach. Facing severe educational gaps, Pakistan is reforming its schools at an extraordinary pace, banking on privatization to improve an underperforming system. Private providers have taken over 4,300 schools in Punjab and are expected to take over 10,000 in the region before the end of this year. Private money currently pays for more of Pakistan’s education system than the government does. It remains to be seen whether this privatization push will improve educational outcomes, but there is evidence that in severely underperforming systems, expanding public-private partnerships is a faster solution than system-wide reform.
WORKERS LEFT BEHIND Informal and temporary employment is widespread in many parts of Asia, meaning that relatively few workers have access to ongoing, employer-subsidized education to improve their English skills. More than half of South Korea’s workforce is employed on temporary contracts, and 90% of India’s workforce is employed without a contract at all. Teaching English in schools is important, but in countries with an aging population, it will be impossible to develop English proficiency without helping adults learn English as well.
28 www.ef.com/epi

EF EPI Score
Asia World
54.5753.07
70
30
35
40
45
50
55
60
65
Asia has the largest range of English proficiencies of any region, with three countries or territories in the upper quartile of this year’s index and four in the bottom 10%.
54.5752.63
GENERATION GAP
EF EPI TRENDS
Asia
World
Asia
World
Trending Down Trending Up
Slight Decrease Slight Increase
GENDER GAP
Asian gender scores are on par with global averages. Asian women improved their English slightly while men’s scores declined slightly, so, as in Europe, the gender gap in Asia has widened significantly, increasing from half a point last year to one and half points this year.
An age gap in English proficiency has emerged in Asia this year. This age gap is in line with worldwide trends, but it is new to Asia, where previously most age groups scored similarly to each other. Except for 18-20 year olds, all Asian age groups saw their proficiency scores decline, with adults over age 40 declining most.
The 18 countries and regions profiled in Asia are evenly divided between nine that improved and nine that did not. Singapore and Cambodia posted significant increases in their scores this year, while Bangladesh experienced a significant decrease. Only Sri Lanka and Macau SAR moved from a lower proficiency band to a higher one.
EF EPI Score
18-20 26-3021-25 31-40 41+ Age Groups
70
30
35
40
45
50
55
60
65
55.1553.74 53.75 53.86
50.94
54.62 53.72 54.08 53.55 50.73
Ban
glad
esh
Mal
aysi
a
Thai
land
Kaz
akhs
tan
Indo
nesi
a
Japa
n
Chi
na
Viet
nam
Taiw
an
Hon
g K
ong
SAR
Mac
au S
AR
Sout
h K
orea
Indi
a
Phi
lippi
nes
Sri L
anka
Pak
ista
n
Cam
bodi
a
Sing
apor
e
+1.01
-0.31 -0.16-0.76-2.24 -1.75 -1.24 -0.57
+1.25+0.95
-0.54
+0.57
-0.51
+0.70
+1.55+1.78
+2.00
+2.60EF EPI Score Change from Last Year
Participate in the EF EPI: take the free EF SET at efset.org
29

LATIN AMERICA
EF EPI RANKINGS
HighVery High LowModerate Very LowPROFICIENCY BANDS
27 Argentina 57.58
36 Costa Rica 55.01
37 Dominican Republic 54.97
40 Uruguay 53.41
46 Chile 52.01
53 Brazil 50.93
55 Guatemala 50.63
56 Panama 49.98
57 Mexico 49.76
59 Peru 49.32
60 Colombia 48.90
61 Bolivia 48.87
65 Ecuador 48.52
69 Honduras 47.80
70 El Salvador 47.42
72 Nicaragua 47.26
75 Venezuela 46.61
30 www.ef.com/epi

Ecuador
ArgentinaUruguay
Dominican Republic
Peru
Brazil
Colombia
VenezuelaCosta Rica
Bolivia
Panama
Mexico
Guatemala
El Salvador
Chile
Nicaragua
Honduras
31
This finding reflects the addition of Bolivia, Honduras, and Nicaragua to the index, all of which have scores below the regional average, but the main downward drivers are Mexico and Brazil, the two most populous countries in the region, which both registered declines in English proficiency. In the past decades, Latin America has made enormous progress in ensuring that all children have access to education, but the region still suffers from high levels of economic inequality, fragile democracies, and unacceptable levels of violence, all of which undermine the development of a skilled workforce.
A BROKEN SYSTEM Although children in some rural areas still lack access to education, the primary challenge for schools in Latin America is poor educational outcomes. UNESCO test results indicate that 50% of third-grade pupils in the region have not achieved a basic level of competency in mathematics, and 30% have not achieved basic competency in literacy. The latest PISA results found a similar pattern among secondary students. This skill deficit reflects broader problems within education systems that impact English language instruction as well. Overcrowded schools, low teacher wages, and inadequate teacher training are all contributing factors.
The educational situation in Argentina, Chile, and Costa Rica, with their highly diversified economies and strong university attendance rates, seems very different from places like Venezuela and Nicaragua. Judging by their English proficiency levels, though, these countries aren’t the polar opposites they appear. In fact, Latin America has the narrowest spread of English proficiency scores in the world, with fewer than 12 points separating the highest proficiency country from the lowest. It is striking that, despite having a shared language, most countries in the region trade more with the United States, the EU, and China than with each other.
REFORMS TAKE TIME Costa Rica improved its English proficiency the most out of any country in the region since last year. Because of major reforms in teacher training and initial qualification, more than 95% of teachers in Costa Rica now hold a tertiary degree, and there is healthy competition for available jobs. Still, teacher assessments administered in 2015 showed that 40% of English teachers had not mastered the content of the curriculum that they were expected to teach. Colombia, Ecuador, and Peru have all also launched English teacher retraining programs in the past five years.
Latin America is the only region in the world to have experienced a decline in average adult English skills since 2017.
GROWTH WITHOUT PROGRESS
TACKLING INEQUALITY Latin America is in the midst of a skills crisis, and on-the-job training is weak. Only about 10% of workers in the region receive any training in a given year, compared with about half of workers in Europe. This is in part because of the high rates of employment in the informal sector, where small family businesses dominate the landscape. In Peru, 70% of the workforce was employed in the informal sector in 2013, and in the region as a whole, half of all workers work informally, according to the International Labor Organization. When adults don’t have access to professional training or opportunities for career growth, productivity and English proficiency can’t develop, the possibility for advancement diminishes, and existing inequalities are reinforced. Inequality is perhaps the greatest challenge facing Latin America. Although both income and wage inequality declined throughout the 2000s in the region, according to the latest World Bank data (2016), eight of the world's 20 most unequal countries are in Latin America. Inequality is a multifaceted problem, but stronger education systems—including stronger English education—are part of the solution. English provides access to skills and global networks that can help drive social mobility.
32 www.ef.com/epi

Latin America
World
Latin America
World
EF EPI Score
Latin America World
51.0449.69
70
30
35
40
45
50
55
60
65
54.5752.63
GENERATION GAP
EF EPI TRENDS
Trending Down Trending Up
Slight Decrease Slight Increase
GENDER GAP
Latin American men and women both score significantly below global averages. In previous editions, we have found that Latin America was the only region without a gender gap in English proficiency. That is no longer true. Women in the region improved slightly while men declined, leaving a gap that is of comparable size to the one in Asia.
All age cohorts in Latin America perform below global averages, with adults over 30 reporting the widest skill deficiency compared to their peers abroad. The highest proficiency age group in the region has shifted from 18-20 to 21-25 this year, which may indicate improving higher education in the region. The slight decline in proficiency recorded among the youngest age cohort is, however, less promising.
Unlike every other region of the world, no Latin American country experienced a significant change in score. Argentina rebounded from a slight decline last year that had placed it in the Moderate Proficiency band. Uruguay’s modest improvement propelled it from Low to Moderate.
EF EPI Score
18-20 26-3021-25 31-40 41+ Age Groups
70
30
35
40
45
50
55
60
65
51.98 52.9051.14
48.6546.98
Mex
ico
Dom
inic
an R
epub
lic
Per
u
Col
ombi
a
Bra
zil
Ecua
dor
Pan
ama
Chi
le
Vene
zuel
a
Arge
ntin
a
Gua
tem
ala
Uru
guay
El S
alva
dor
Cos
ta R
ica
+1.72
+0.51
+0.90
-1.07-1.81 -1.34 -1.18 -0.99
+1.88+1.68
-0.90
+1.07
-0.70
+1.11
54.62 53.72 54.08 53.55 50.73
EF EPI Score Change from Last Year
Participate in the EF EPI: take the free EF SET at efset.org
33

AFRICAEF EPI RANKINGS
HighVery High LowModerate Very LowPROFICIENCY BANDS
06 South Africa 66.52
29 Nigeria 56.72
39 Senegal 53.50
54 Ethiopia 50.79
62 Egypt 48.76
67 Morocco 48.10
68 Tunisia 47.85
81 Algeria 44.50
88 Libya 39.64
34 www.ef.com/epi

Morocco
Algeria
Libya
Egypt
Tunisia
South Africa
Ethiopia
Senegal
Nigeria
35

In part, this finding reflects the exclusion of Angola and Cameroon from this year’s index due to a lack of data. A much stronger factor, though, is substantial improvement in several of the continent’s most populous countries. Egypt and Nigeria both experienced significant gains, and South Africa’s EF EPI score rose more than any other country in the world. Today, average adult English proficiency scores in Africa are similar to those in Asia, although the limitations of our data set, which only includes nine African countries, make it difficult to get a complete picture of the continent.
A PRACTICAL APPROACH South Africa, with the highest English proficiency measured on the continent, has eleven official languages, including English. In a country with so many linguistic communities, multilingualism is the norm. Only 10% of the population speaks English as a native language, according to the 2011 census, but English is widely used in the media and as a bridge language, particularly in urban areas. English has emerged as the language of government and higher education because, lacking strong ethnic or colonial ties, it is perceived as more inclusive.
In West Africa, Nigeria and Senegal are trying to build adequate infrastructure and provide quality education for rapidly growing populations, and both countries have achieved moderate English proficiency among adults. In Nigeria, urban elites are usually native English speakers, but, outside of cities, English is spoken far less often, even though it is the country’s only official language. In Senegal, where French is the only official language, English is becoming important as well. In both countries, English clubs, conversation groups, and mobile learning platforms are increasingly popular. The approach to English in West Africa tends to be highly utilitarian, with practical communication as the core objective instead of mastery of technical grammar rules. That kind of pragmatic focus pays off.
MAKING ROOM FOR ENGLISH North Africa is different from the rest of the continent in many ways, including its very low English proficiency. Adults in North Africa speak English at levels similar to those in the Middle East. However, multilingualism is common in North Africa, and Algeria, Morocco, and Tunisia have complex linguistic landscapes, with local dialects of Arabic,
Berber, French, and Modern Standard Arabic all serving various roles in private life, the education system, and the public sphere. English is a relative newcomer to the mix, but it’s increasingly valued, particularly for its neutrality and business potential. In Egypt, where the private sector has stagnated, this year’s improvement in English proficiency may come as welcome news. More openness and international trade would benefit North Africa considerably.
DIVERSE OBSTACLES Different countries in Africa face different obstacles to developing English proficiency. Some, like Tunisia and Morocco, have labor markets with an oversized public sector and high levels of youth unemployment— conditions that offer few incentives for learning and often push the most ambitious students overseas. Others, like Ethiopia, have low-quality education systems or a lack of school infrastructure. Still others, like Libya, are in the midst of armed conflict. It is our hope that in the coming years, more African adults will test their English so that we can get a clearer picture of adult proficiency levels on this vast and diverse continent.
Between 2016 and 2017, English proficiency scores in Africa improved more than in any other region of the world.
BURSTING WITH POTENTIAL
36 www.ef.com/epi
EF EPI Score
Africa World
55.20
51.58
70
30
35
40
45
50
55
60
65
54.5752.63
GENERATION GAP
EF EPI TRENDS
Trending Down Trending Up
Slight Decrease Slight Increase
GENDER GAP
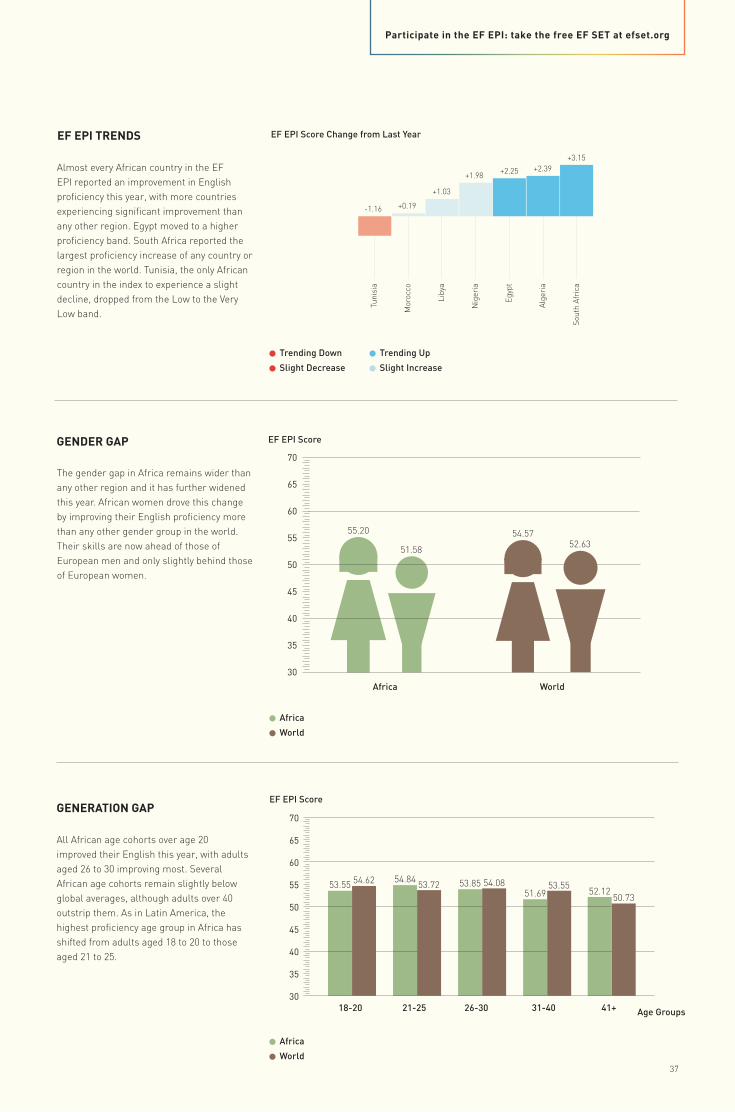
The gender gap in Africa remains wider than any other region and it has further widened this year. African women drove this change by improving their English proficiency more than any other gender group in the world. Their skills are now ahead of those of European men and only slightly behind those of European women.
All African age cohorts over age 20 improved their English this year, with adults aged 26 to 30 improving most. Several African age cohorts remain slightly below global averages, although adults over 40 outstrip them. As in Latin America, the highest proficiency age group in Africa has shifted from adults aged 18 to 20 to those aged 21 to 25.
Almost every African country in the EF EPI reported an improvement in English proficiency this year, with more countries experiencing significant improvement than any other region. Egypt moved to a higher proficiency band. South Africa reported the largest proficiency increase of any country or region in the world. Tunisia, the only African country in the index to experience a slight decline, dropped from the Low to the Very Low band.
Tuni
sia
Mor
occo
Liby
a
Nig
eria
Egyp
t
Alge
ria
Sout
h Af
rica
+1.98
-1.16 +0.19
+1.03
+2.25 +2.39+3.15
Africa
World
Africa
World
EF EPI Score
Age Groups18-20 26-3021-25 31-40 41+
70
30
35
40
45
50
55
60
65
53.55 54.84 53.8551.69 52.12
54.62 53.72 54.08 53.55 50.73
EF EPI Score Change from Last Year
Participate in the EF EPI: take the free EF SET at efset.org
37

MIDDLE EAST
EF EPI RANKINGS
HighVery High LowModerate Very LowPROFICIENCY BANDS
78 Kuwait 45.64
79 Oman 45.56
83 Saudi Arabia 43.65
87 Iraq 40.82
33 Lebanon 55.79
66 Iran 48.29
71 U.A.E. 47.27
74 Jordan 47.10
76 Syria 46.37
38 www.ef.com/epi

Jordan
Saudi Arabia U.A.E.
Syria
Oman
Iran
Kuwait
IraqLebanon
39

However, despite its status as a crossroads, the Middle East has lower English proficiency than any other part of the world. This is also one of the youngest regions in the world, with an average age of just 25, giving it enormous potential for change.
OPENING UP The countries of the Gulf Cooperation Council (GCC) all recognize the need to move from petroleum-based economies to other models, and they have recently launched a wave of government-led initiatives to invest in jobs and education, many of which could lead to better English proficiency. Among these initiatives is Saudi Arabia’s Vision 2030, which aims to diversify the country’s economy through foreign investment and tourism, and the U.A.E.’s Vision 2021, which aims to transform the country into a knowledge based economy. The U.A.E. has the highest English proficiency score of the GCC countries. The majority of the country’s population is foreign-born, making the need for a shared language like English more immediate in daily life.
Saudi Arabia is the largest Arab economy and home to King Abdulaziz University, the highest-ranked university in the region
according to the 2018 Times Higher Education World University Rankings. However, its population is spread over a huge and unevenly-developed geography, leading to varying levels of access to English instruction in schools. Young Saudis will need English to meet the demands of the new, more globalized local market their leadership envisions, in which women will work alongside men. English training and vocational upskilling programs will be essential to achieving this cultural transformation.
Lebanon is included in the index for the first time this year. English proficiency in Lebanon is well above the regional average, which lifted the overall score for the region slightly.The majority of Lebanese university and private schools use languages other than Arabic, making the country more multilingual than most others in the region. Nearby Jordan has English proficiency levels more in line with regional averages, even though the majority of its universities use English as their language of instruction. This disparity might be explained by the wide gap between the level of English instruction in public schools and the English required at the university level, a phenomenon unfortunately found in almost
every Arab country. Most adults don't have the opportunity to attend university and thus never get to plug this proficiency gap.
REFUGEES IN CRISIS Conflicts in Syria and Iraq have resulted in large numbers of displaced people and a complete halt to education in some cities. More stability raises hopes of restoring public education, but for the millions of people suffering violence and hardship, there are more pressing needs than learning English.
AN UNCERTAIN FUTURE Fragile economies, persistent conflict, and over-reliance on public sector employment are among the challenges facing Middle Eastern countries that want to equip their youthful populations with the skills required for the global workforce. Meeting these challenges could have a transformative effect on the region, and improving the region's poor English proficiency will be an essential part of that transition. It remains to be seen, though, whether such a transition can be made smoothly amid regional tensions and a changing global energy market.
The location of the Middle East, sitting at the meeting point of three continents, heavily influences trade, geopolitics, and education systems in the region.
STRUGGLING TO TRANSITION
40 www.ef.com/epi
EF EPI Score
Middle East World
45.51 46.39
70
30
35
40
45
50
55
60
65
54.5752.63
GENERATION GAP
EF EPI TRENDS
Trending Down Trending Up
Slight Decrease Slight Increase
GENDER GAP
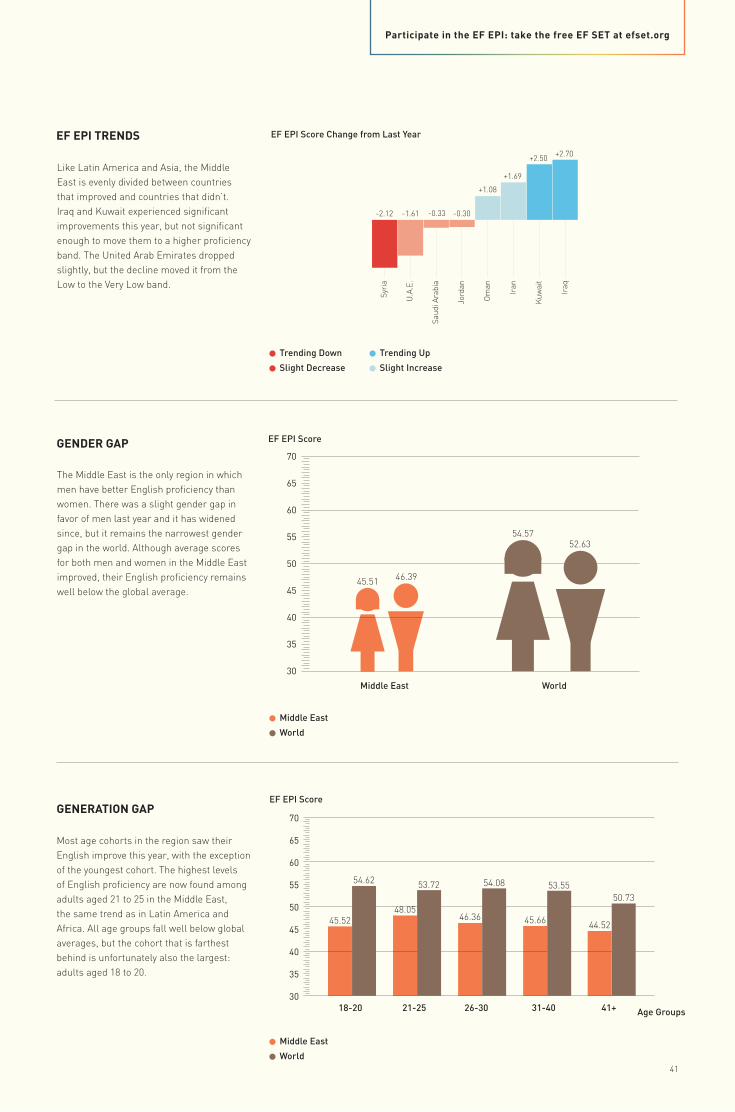
The Middle East is the only region in which men have better English proficiency than women. There was a slight gender gap in favor of men last year and it has widened since, but it remains the narrowest gender gap in the world. Although average scores for both men and women in the Middle East improved, their English proficiency remains well below the global average.
Most age cohorts in the region saw their English improve this year, with the exception of the youngest cohort. The highest levels of English proficiency are now found among adults aged 21 to 25 in the Middle East, the same trend as in Latin America and Africa. All age groups fall well below global averages, but the cohort that is farthest behind is unfortunately also the largest: adults aged 18 to 20.
Like Latin America and Asia, the Middle East is evenly divided between countries that improved and countries that didn’t. Iraq and Kuwait experienced significant improvements this year, but not significant enough to move them to a higher proficiency band. The United Arab Emirates dropped slightly, but the decline moved it from the Low to the Very Low band.
Syri
a
U.A
.E.
Saud
i Ara
bia
Jord
an
Om
an
Iran
Kuw
ait
Iraq
+2.70
-0.30-2.12 -1.61 -0.33
+1.08
+1.69
+2.50
Middle East
World
Middle East
World
EF EPI Score
Age Groups18-20 26-3021-25 31-40 41+
70
30
35
40
45
50
55
60
65
45.5248.05
46.36 45.66 44.52
54.62 53.72 54.08 53.55 50.73
EF EPI Score Change from Last Year
Participate in the EF EPI: take the free EF SET at efset.org
41

CONCLUSIONS
For these reasons and more, millions of parents invest in English tutoring, summer study abroad programs, and online English education programs for their children. This is also why millions of professionals make the same investments in their own English education, and governments include English on the core school curriculum.
English is unique in having such a wealth of educational resources outside the boundaries of formal schooling. Other skills—like web programming, accounting, numeracy, and literacy—are also extremely valuable, but they are already provided by public schools, or they are only required for certain types of jobs. English is unique in that it is in high demand for many professions, and yet most students do not master it adequately in school.
It’s not just individuals: companies, cities, regions, and countries stand to benefit from developing English proficiency. English facilitates international collaboration, investment, and mobility. In English-proficient communities, engineers have
access to the latest techniques, recruiters can draw from a global talent pool, and mergers take place more smoothly and comprehensively. And if that were not enough, English proficiency is also correlated with key development indicators, including metrics of income, equality, and productivity.
There is no one-size-fits-all solution to building a culture of English proficiency, but the regions and countries with the strongest English skills share certain time-tested strategies. In particular, they:
• officially recognize English as a key skill
• teach English to all children starting from primary school, using a communication-based methodology
• set minimum standards of English proficiency for students and test them to make sure no one falls behind
• choose not to dub movies and television shows, ensuring regular exposure to English from a young age across the broadest possible swath of the population
• fund short and long-term study abroad opportunities at the secondary and tertiary level
• allow universities to teach courses using English as the medium of instruction
• include English language requirements for all university majors and in all vocational schools
• include English in the training regimens for all new teachers
• re-train English teachers in communicative methods and teaching skills
• set up professional support networks for English teachers to share best practices
• provide high-quality English language instruction in job centers and unemployment reduction programs
• lead by example, with politicians, businesspeople, and celebrities coming out in support of English learning
Learning to speak English can open the door to a better job, offer new opportunities for personal exploration and professional growth, and provide access to the world’s shared knowledge.
www.ef.com/epi42
Companies with strong cultures of English proficiency also tend to pursue certain strategies. They:
• make English the official corporate language
• foster a culture of internationalism and mobility
• offer partially or fully funded English training to employees, usually in collaboration with a third-party supplier
• train employees according to their roles using an appropriate role-specific English curriculum rather than general English training
• test the entire workforce to identify strategic weaknesses in English skills and focus on improving those first
• set minimum standards of English proficiency for different roles and test that those standards are met on time
• prioritize hiring strong English speakers
• compose diverse teams that include people from many nationalities
• require that all company documents be written in English
• encourage executives to lead by example, speaking about their personal experiences as English learners and English speakers
While the exact strategies vary from place to place, the benefits of improved English proficiency are clear. Communities with strong English skills are more competitive and open, and better able to take advantage of opportunities, knowledge, and talent around the world. There is no sign that globalization is slowing, and technology promises to make international communication ever simpler. Now more than ever, English gives people access to the world.
43

ABOUT THE INDEX
METHODOLOGY The EF English Proficiency Index is increasingly cited as an authoritative source by journalists, educators, officials, and business leaders. EF is pleased to contribute to the ongoing global conversation about English language education. This eighth edition of the EF EPI is based on test data from more than 1,300,000 test takers around the world who took the EF Standard English Test (EF SET) in 2017.
THE EF STANDARD ENGLISH TEST (EF SET) The EF SET is an online, adaptive English test of reading and listening skills. It is a standardized, objectively-scored test designed to classify test takers’ language abilities into one of the six levels established by the Common European Framework of Reference (CEFR). The EF SET is available to any Internet user for free. For more information about the research and development of the EF SET, visit www.efset.org/research/.
EF EPI 2018 scores have been found to correlate strongly with TOEFL iBT 2017 scores (r=0.82) and IELTS Academic Test 2016 scores (r=0.71). These correlations show that, while these tests have different designs and test taker profiles, they reveal similar trends in national English proficiency.
TEST TAKERS Although the sample of test takers for the EF EPI is biased toward respondents who are interested in pursuing language study and younger adults, the sample is balanced between male and female respondents and represents adult language learners from a broad range of ages.
• Female respondents comprised 60% of the overall sample.
• The median age of adult respondents was 26 years.
• 86% of all respondents were under the age of 35, and 99% under the age of 60.
• The median age of male and female respondents was the same.
Only cities, regions, and countries with a minimum of 400 test takers were included in the index, but in most cases the number of test takers was far greater. Cuba, Qatar, Mongolia, Angola, Cameroon, and Laos were included in the previous edition of the EF EPI but did not have enough test takers to be included in this edition.
SAMPLING BIASES The test-taking population represented in this index is self-selected and not guaranteed to be representative. Only those who want to learn English or are curious about their English skills will participate in one of these tests. This could skew scores lower or higher than those of the general population. However, there is no incentive for test takers to inflate their scores artificially on these low-stakes tests by cheating, as the results are purely for personal use.
The EF SET is free and online, so anyone with an Internet connection can participate. Almost all of our test takers are working adults or young adults finishing their studies. People without Internet access would be automatically excluded, although the EF SET site is fully adaptive and 30% of test takers complete the exam from a mobile device.
In parts of the world where Internet usage is low, we would expect the impact of an online format to be strong. This sampling bias would tend to pull scores upward by excluding poorer and less educated people. Nevertheless, open-access online tests have proven effective in gathering very large amounts of data about a range of indicators, and we believe they provide valuable information about global English proficiency levels.
APPENDIX A
www.ef.com/epi44

SCORE CALCULATION To calculate an EF EPI score, we used the 100 point scale of the EF SET. Regional averages are weighted by population. Based on score, we assigned countries, regions, and cities to proficiency bands. This allows recognition of clusters with similar English skill levels and comparisons within and between regions. The proficiency bands are aligned to the Common European Framework of Reference (CEFR) and EF’s course levels:
• The Very High Proficiency band corresponds to CEFR level B2.
• The High, Moderate, and Low Proficiency bands correspond to CEFR level B1, with each band corresponding to a single EF course level.
• The Very Low Proficiency band corresponds to CEFR level A2.
OTHER DATA SOURCES The EF EPI is created through a different process from the one used by public opinion research organizations such as Euromonitor and Gallup, or by the OECD in skills surveys such as PISA and PIAAC. Those studies select survey participants using age, gender, level of education, income, and other factors. Their survey panels tend to be small, with at most a few thousand participants in each
place. Because they have been composed using complex sampling methods, they are considered representative of the entire population. Unfortunately, no such survey of English skills has ever been performed at an international level.
Another source of data about English proficiency comes from national education systems. Many schools test the English skills of every high school student or university applicant using a standardized national assessment. The results may or may not be made public, but educators and government officials use the data to assess the efficacy of education reform and pinpoint areas for improvement. Unfortunately, those national assessments are not comparable to each other, and they are not administered to adults, so while they give a good indication of English proficiency among high school students in one part of the world, they cannot be used for international comparison, nor can they tell us much about adult English proficiency levels.
The EF EPI does not aim to compete with or contradict national test results, language polling data, or any other data set. Instead, these data sets complement each other. Some are granular but limited in scope to a single age group, country, region, or test taker profile. The EF EPI is broad, examining working-aged adults around the world using
a common assessment method. There is no other data set of comparable size and scope, and, despite its limitations, we, along with many policymakers, scholars, and analysts, believe it to be a valuable reference point in the global conversation about English language education.
RELATED EF EPI REPORTS The EF EPI research series has two separate reports: this main EF EPI report, which is published annually and looks at adult English proficiency; and the EF EPI for Schools (EF EPI-s), which is published biannually and looks at English proficiency among secondary school and university students. This year, we are publishing the EF EPI eighth edition. The EF EPI-s second edition was published in 2017. All EF EPI reports are available for download at www.ef.com/epi.
EF EDUCATION FIRST EF Education First (www.ef.com) is an international education company that focuses on language, academics, cultural exchange, and educational travel. Founded in 1965, EF's mission is "opening the world through education." With more than 500 schools and offices in more than 50 countries, EF is the Official Language Training Partner for the Tokyo 2020 Olympic and Paralympic Games. The EF English Proficiency Index is published by Signum International AG.
45

EF EPIPROFICIENCY BANDS
VERY HIGH PROFICIENCY
SWEDEN
NETHERLANDS
SINGAPORE
SAMPLE TASKS
HIGH PROFICIENCY
POLAND
PHILIPPINES
SWITZERLAND
MODERATE PROFICIENCY
INDIA
NIGERIA
HONG KONG SAR
LOW PROFICIENCY
GEORGIA
CHILE
CHINA
VERY LOW PROFICIENCY
IRAN
MOROCCO
TUNISIA
Use nuanced and appropriate language in social situations
Read advanced texts with ease
Negotiate a contract with a native English speaker
Make a presentation at work
Understand TV shows
Read a newspaper
Participate in meetings in one’s area of expertise
Understand song lyrics
Write professional emails on familiar subjects
Navigate an English-speaking country as a tourist
Engage in small talk with colleagues
Understand simple emails from colleagues
Introduce oneself simply (name, age, country of origin)
Understand simple signs
Give basic directions to a foreign visitor
ABOUT EF EPI PROFICIENCY BANDS The EF English Proficiency Index places the surveyed countries and territories into five proficiency bands, from Very High to Very Low. The bands make it easier to identify countries and regions with similar skill levels and to draw comparisons between and within regions.
APPENDIX B
In the chart below, we give examples of tasks that an individual could accomplish at each proficiency band. The selection of tasks is not meant to be exhaustive, but it is a useful reference for understanding how skills advance across the bands.
It is important to keep in mind that a proficiency band merely indicates the level of the “average” person. The EF EPI seeks to compare countries and territories, which necessitates overlooking individual strengths and weaknesses.
www.ef.com/epi46
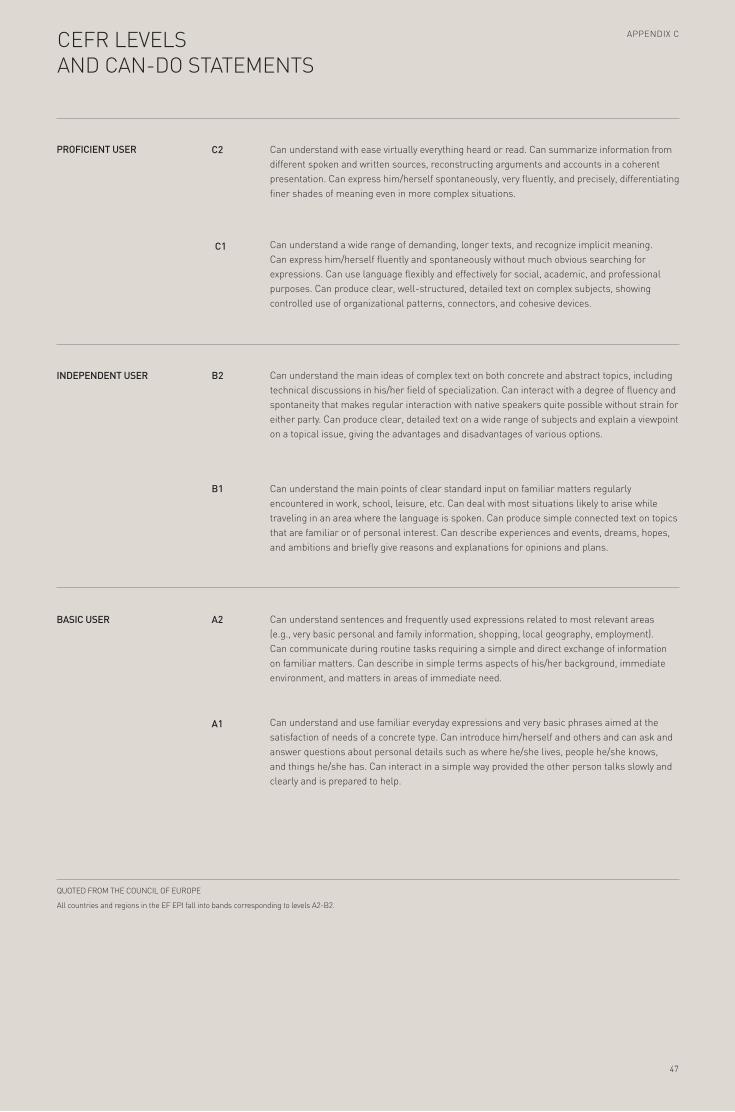
CEFR LEVELSAND CAN-DO STATEMENTS
Can understand with ease virtually everything heard or read. Can summarize information from different spoken and written sources, reconstructing arguments and accounts in a coherent presentation. Can express him/herself spontaneously, very fluently, and precisely, differentiating finer shades of meaning even in more complex situations.
Can understand a wide range of demanding, longer texts, and recognize implicit meaning. Can express him/herself fluently and spontaneously without much obvious searching for expressions. Can use language flexibly and effectively for social, academic, and professional purposes. Can produce clear, well-structured, detailed text on complex subjects, showing controlled use of organizational patterns, connectors, and cohesive devices.
Can understand the main ideas of complex text on both concrete and abstract topics, including technical discussions in his/her field of specialization. Can interact with a degree of fluency and spontaneity that makes regular interaction with native speakers quite possible without strain for either party. Can produce clear, detailed text on a wide range of subjects and explain a viewpoint on a topical issue, giving the advantages and disadvantages of various options.
Can understand the main points of clear standard input on familiar matters regularly encountered in work, school, leisure, etc. Can deal with most situations likely to arise while traveling in an area where the language is spoken. Can produce simple connected text on topics that are familiar or of personal interest. Can describe experiences and events, dreams, hopes, and ambitions and briefly give reasons and explanations for opinions and plans.
Can understand sentences and frequently used expressions related to most relevant areas (e.g., very basic personal and family information, shopping, local geography, employment). Can communicate during routine tasks requiring a simple and direct exchange of information on familiar matters. Can describe in simple terms aspects of his/her background, immediate environment, and matters in areas of immediate need.
Can understand and use familiar everyday expressions and very basic phrases aimed at the satisfaction of needs of a concrete type. Can introduce him/herself and others and can ask and answer questions about personal details such as where he/she lives, people he/she knows, and things he/she has. Can interact in a simple way provided the other person talks slowly and clearly and is prepared to help.
QUOTED FROM THE COUNCIL OF EUROPE
All countries and regions in the EF EPI fall into bands corresponding to levels A2-B2.
PROFICIENT USER C2
B2
B1
A2
A1
INDEPENDENT USER
BASIC USER
APPENDIX C
C1
47
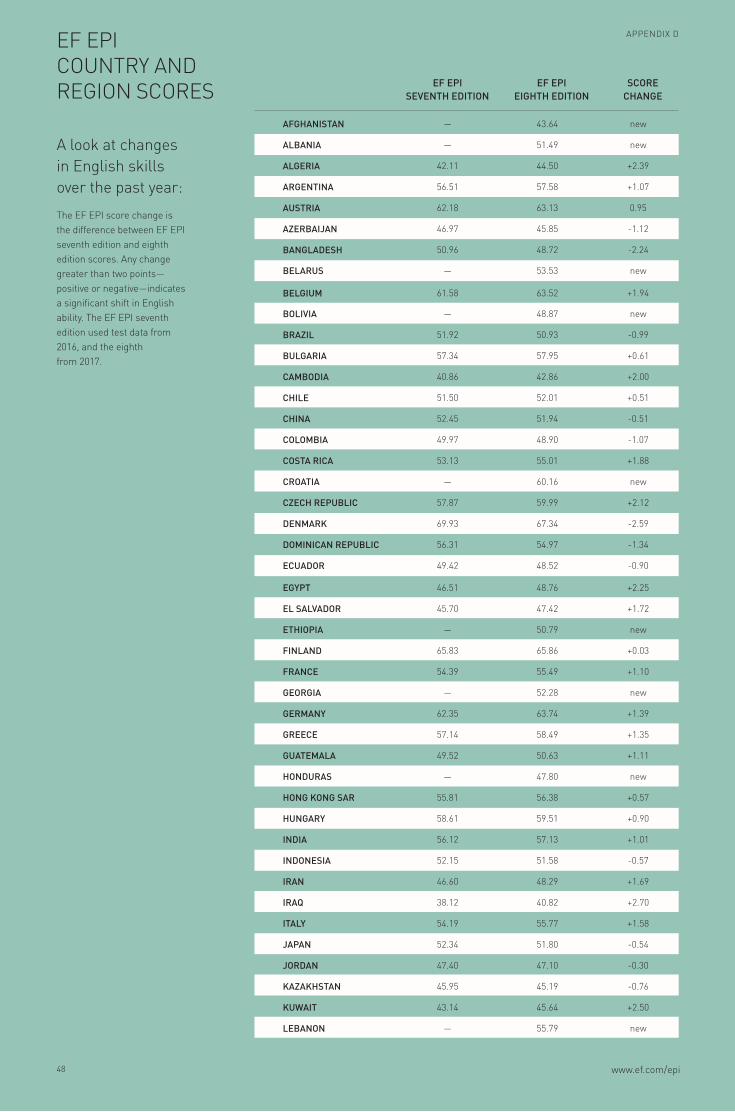
EF EPI SEVENTH EDITION
EF EPI EIGHTH EDITION
SCORE CHANGE
A look at changes in English skills over the past year:
The EF EPI score change is the difference between EF EPI seventh edition and eighth edition scores. Any change greater than two points—positive or negative—indicates a significant shift in English ability. The EF EPI seventh edition used test data from 2016, and the eighth from 2017.
AFGHANISTAN — 43.64 new
ALBANIA — 51.49 new
ALGERIA 42.11 44.50 +2.39
ARGENTINA 56.51 57.58 +1.07
AUSTRIA 62.18 63.13 0.95
AZERBAIJAN 46.97 45.85 -1.12
BANGLADESH 50.96 48.72 -2.24
BELARUS — 53.53 new
BELGIUM 61.58 63.52 +1.94
BOLIVIA — 48.87 new
BRAZIL 51.92 50.93 -0.99
BULGARIA 57.34 57.95 +0.61
CAMBODIA 40.86 42.86 +2.00
CHILE 51.50 52.01 +0.51
CHINA 52.45 51.94 -0.51
COLOMBIA 49.97 48.90 -1.07
COSTA RICA 53.13 55.01 +1.88
CROATIA — 60.16 new
CZECH REPUBLIC 57.87 59.99 +2.12
DENMARK 69.93 67.34 -2.59
DOMINICAN REPUBLIC 56.31 54.97 -1.34
ECUADOR 49.42 48.52 -0.90
EGYPT 46.51 48.76 +2.25
EL SALVADOR 45.70 47.42 +1.72
ETHIOPIA — 50.79 new
FINLAND 65.83 65.86 +0.03
FRANCE 54.39 55.49 +1.10
GEORGIA — 52.28 new
GERMANY 62.35 63.74 +1.39
GREECE 57.14 58.49 +1.35
GUATEMALA 49.52 50.63 +1.11
HONDURAS — 47.80 new
HONG KONG SAR 55.81 56.38 +0.57
HUNGARY 58.61 59.51 +0.90
INDIA 56.12 57.13 +1.01
INDONESIA 52.15 51.58 -0.57
IRAN 46.60 48.29 +1.69
IRAQ 38.12 40.82 +2.70
ITALY 54.19 55.77 +1.58
JAPAN 52.34 51.80 -0.54
JORDAN 47.40 47.10 -0.30
KAZAKHSTAN 45.95 45.19 -0.76
KUWAIT 43.14 45.64 +2.50
LEBANON — 55.79 new
EF EPICOUNTRY AND REGION SCORES
APPENDIX D
www.ef.com/epi48

EF EPI SEVENTH EDITION
EF EPI EIGHTH EDITION
SCORE CHANGE
LIBYA 38.61 39.64 +1.03
LITHUANIA 57.08 57.81 +0.73
LUXEMBOURG 64.57 66.33 +1.76
MACAU SAR 51.87 52.57 +0.70
MALAYSIA 61.07 59.32 -1.75
MEXICO 51.57 49.76 -1.81
MOROCCO 47.91 48.10 +0.19
MYANMAR — 44.23 new
NETHERLANDS 71.45 70.31 -1.14
NICARAGUA — 47.26 new
NIGERIA 54.74 56.72 +1.98
NORWAY 67.77 68.38 +0.61
OMAN 44.48 45.56 +1.08
PAKISTAN 49.88 51.66 +1.78
PANAMA 50.68 49.98 -0.70
PERU 50.50 49.32 -1.18
PHILIPPINES 60.59 61.84 +1.25
POLAND 62.07 62.45 +0.38
PORTUGAL 58.76 60.02 +1.26
ROMANIA 59.13 60.31 +1.18
RUSSIA 52.19 52.96 +0.77
SAUDI ARABIA 43.98 43.65 -0.33
SENEGAL — 53.50 new
SERBIA 59.37 60.04 +0.67
SINGAPORE 66.03 68.63 +2.60
SLOVAKIA 57.63 58.11 +0.48
SLOVENIA 64.97* 64.84 -0.13
SOUTH AFRICA 63.37 66.52 +3.15
SOUTH KOREA 55.32 56.27 +0.95
SPAIN 56.06 55.85 -0.21
SRI LANKA 47.84 49.39 +1.55
SWEDEN 70.40 70.72 +0.32
SWITZERLAND 60.95 61.77 +0.82
SYRIA 48.49 46.37 -2.12
TAIWAN 52.04 51.88 -0.16
THAILAND 49.78 48.54 -1.24
TUNISIA 49.01 47.85 -1.16
TURKEY 47.79 47.17 -0.62
UKRAINE 50.91 52.86 +1.95
UNITED ARAB EMIRATES 48.88 47.27 -1.61
URUGUAY 51.73 53.41 +1.68
UZBEKISTAN — 42.53 new
VENEZUELA 45.71 46.61 +0.90
VIETNAM 53.43 53.12 -0.31
* This country or region did not appear in the EF EPI seventh edition, so this score comes from earlier EF EPI editions.49

SELECTED REFERENCES
Central Intelligence Agency. (2018). The World Factbook. Retrieved from https://www.cia.gov/ library/publications/the-world-factbook/
Council of Europe. (2018). Language Education Policy Profiles. Retrieved from http://www.coe.int/t/dg4/ linguistic/Profils1_EN.asp
Council of Europe. (2001). Common European framework of reference for languages: Learning, teaching, assessment. Cambridge, U.K: Press Syndicate of the University of Cambridge.
The Economist. (2017). Stumped for Words: A Battle over Language is Hampering Algeria’s Development. Retrieved from https://www.economist.com/news/middle-east-and-africa/21726743-arabic-berber-french-and-hybrid-three-vie-dominance-battle-over
Euromonitor International. (2018). Retrieved from http://www.euromonitor.com/income-and-expenditure
European Commission. (2018). Erasmus+. Retrieved from https://ec.europa.eu/programmes/erasmus-plus/node_en
European Commission/EACEA/Eurydice Facts and Figures. (2015). National Sheets on Education Budgets in Europe 2015. Luxembourg: Publications Office of the European Union.
Human Progress (2017). Labor productivity per hour worked. Retrieved from https://humanprogress.org/dwworld?p=293&yf=1950&yl=2017
International Labour Organization. (2017). Global Employment Trends for Youth 2017.Retrieved from http://www.ilo.org/wcmsp5/groups/public/---dgreports/---dcomm/---publ/documents/publication/wcms_598669.pdf
International Labour Organization. (2014). Trends in informal employment in Peru: 2004-2012. Retrieved from http://www.ilo.org/wcmsp5/groups/public/---americas/---ro-lima/documents/publication/wcms_245891.pdf
Neeley, T. (2017). The Language of Global Success How a Common Tongue Transforms Multinational Organizations. Princeton, NJ: Princeton University Press.
Organization for Economic Cooperation and Development. (2015). Programme for International Student Assessment. Retrieved from http://www. oecd.org/pisa/
Statistics South Africa. (2012). Census 2011. Retrieved from http://www.statssa.gov.za/?page_id=3839
Saudi Vision 2030. (2018). Vision 2030. Retrieved from http://vision2030.gov.sa/en
Technavio. (2017). ELT Market in China 2017-2021. Retrieved from https://www.researchandmarkets.com/research/sktqck/elt_market_in
TIMSS & PIRLS International Study Center, Lynch School of Education, Boston College, and International Association for the Evaluation of Educational Achievement. (2018). TIMSS & PIRLS. Retrieved from https://timssandpirls.bc.edu/
UNICEF. (2018). In Yemen, children’s education devastated after three years of escalating conflict. Retrieved from https://www.unicef.org/media/media_102771.html
United Nations Conference on Trade and Development. (2017). World Investment Report 2017. Retrieved from http://unctad.org/en/PublicationsLibrary/wir2017_overview_en.pdf
United Nations Development Programme. (2017). Human Development Report 2017: Human Development for Everyone. Retrieved from http:// report.hdr.undp.org/
The Wharton School of the University of Pennsylvania. (2018). Why a Japanese E-commerce Giant Made its Employees Learn English. Retrieved from http://knowledge.wharton.upenn.edu/article/do-global-firms-need-a-common-language/
The World Bank. (2018). World Bank Open Data. Retrieved from https://data.worldbank.org/
World Trade Organization. (2018). Statistical Tables. Retrieved from https://www.wto.org/english/res_e/statis_e/wts2016_e/wts16_chap9_e.htm
EF EPIEF English Proficiency Index
www.ef.com/epi
EF ENGLISH PROFICIENCY INDEX 1st Edition (2011)
EF EPIEF English Proficiency Index
www.ef.com/epi
EF EPI 2012 Report_FINAL.indd 45 28/3/13 6:49 PM
EF ENGLISH PROFICIENCY INDEX 2nd Edition (2012)
VISIT WWW.EF.COM/EPI TO DOWNLOAD PREVIOUS EDITIONS OF THE EF EPI.
www.ef.com/epi
EF EPIEF English Proficiency Index
EF ENGLISH PROFICIENCY INDEX 3rd Edition (2013)
EF ENGLISH PROFICIENCY INDEX 4th Edition (2014)
EF ENGLISH PROFICIENCY INDEX 5th Edition (2015)
EF ENGLISH PROFICIENCY INDEX 6th Edition (2016)
EF ENGLISH PROFICIENCY INDEX 7th Edition (2017)
EF ENGLISH PROFICIENCY INDEX 8th Edition (2018)
APPENDIX E
50 www.ef.com/epi


EF EPIEF English Proficiency Index
Copyright © 2018 EF Education First Ltd. All Rights Reserved
CONTACT USwww.ef.com/epi