eeg under anesthesia - feature extraction with tespar et al. 2009.pdf · eeg under anesthesia -...
TRANSCRIPT
EEG under anesthesia - feature extraction withTESPAR
Vasile V. Moca a,∗,1, Bertram Scheller b,1, Raul C. Muresan a,c,Michael Daunderer d, Gordon Pipa c,e,f
aCenter for Cognitive and Neural Studies (Coneural), Str. Ciresilor nr. 29, 400487Cluj-Napoca, Romania
bClinic for Anesthesiology, Johann Wolfgang Goethe University, Theodor-Stern-Kai 7,60590 Frankfurt am Main, Germany
cMax Planck Institute for Brain Research, Deutschordenstraße 46, 60528 Frankfurt amMain, Germany
dClinic for Anesthesiology, Ludwig Maximilians University, Nussbaumstraße 20, 80336Munich, Germany
eFrankfurt Institute for Advanced Studies, Johann Wolfgang Goethe University,Max-von-Laue-Str. 1, 60438 Frankfurt am Main, Germany
fMassachusetts General Hospital, Dep. of Anesthesia and Critical Care, 55 Fruit Street,Boston, MA 02114, USA
Abstract
We investigated the problem of automatic depth of anesthesia (DOA) estimation from elec-troencephalogram (EEG) recordings. We employed TESPAR (Time Encoded Signal Pro-cessing And Recognition), a time-domain signal processing technique, in combination withmulti layer perceptrons to identify DOA levels. The presented system learns to discrimi-nate between five DOA classes assessed by human experts whose judgements were basedon EEG mid latency auditory evoked potentials (MLAEP) and clinical observations. Wefound that our system closely mimicked the behavior of the human expert, thus proving theutility of the method. Further analyses on the features extracted by our technique indicatedthat information related to DOA is mostly distributed across frequency bands and that thepresence of high frequencies (> 80 Hz), which reflect mostly muscle activity, is beneficialfor DOA detection.
Key words: Depth of anesthesia, EEG, MLP, TESPAR, MLAEP
Preprint submitted to Elsevier 24 September 2009
1 Introduction
Feature extraction techniques applied to biomedical signals have proven essential inlife-science applications (automated external defibrillators, implanted pacemakers,diagnosis of epilepsia, etc). For general anesthesia it remains a challenge to moni-tor the impact of anesthetics on the brain. Two recent studies showed an incidenceof unwanted and primarily undetected patient awareness during general anesthesiaof about 0.13% [1, 2]. Since awareness and memory formation can cause severepsychological trauma [3], these studies have motivated the need for DOA moni-toring devices. Substantial progress has been made in identifying signal featuresthat relate well to anesthetics, in a dose-dependent way, for both spontaneous elec-troencephalogram (EEG) and mid latency auditory evoked potentials (MLAEP).Consequently, monitoring devices are commercially available today [2, 4, 5, 6, 7].
An important issue in automated DOA assessment is the feature extraction tech-nique applied to the EEG signal. The most successful commercial monitors extracta combination of features based on time- and frequency-domain (BIS (Aspect Med-ical Systems), Narcotrend (Monitor Technik)) or entropy (Narcotrend, M-Entropy(Datex-Ohmeda)) from spontaneous EEG. In addition, evoked potentials (electricalresponses of the nervous system elicited by and time locked to external stimulation)have also kept a major role in DOA assessment [8]: Certain peaks and troughs inthe MLAEP decrease in amplitude and increase in latency with increasing DOA[9, 10]. Other methods, extracting features in the time-domain [2, 11, 12, 13, 14]have also been developed, most based on probabilistic approaches. Such a methodis the A-line ARX Index (Danmeter A/S) [15], the only commercially availablemonitoring device based on MLAEP.
Situations may arise in which some monitors fail to perform adequately [6, 16,17, 18, 19, 20, 21]. Therefore, it has been suggested that improved DOA assess-ment should rely on multiple features extracted from EEG [22]. Here we proposean additional feature extraction technique, namely TESPAR (Time Encoded SignalProcessing and Recognition), that is novel to the problem of EEG DOA detection.It has shown impressive performance in voice recognition and engineering appli-cations [23, 24, 25], and being a time-domain approach, it has the possibility tocapture information that is not distinguishable in the frequency-domain. We com-bined TESPAR with a non-linear classification technique based on multi-layer per-ceptrons (MLP), in order to validate the usefulness of TESPAR for DOA detection.The technique we introduce is not to be considered a competitor of well establishedDOA monitors, but the additional features extracted by TESPAR may be useful toenhance the already established methods.
∗ Corresponding author at: Coneural, Cluj-Napoca, Romania. Tel.: 004 0744 374993; Fax:004 0364 800172.
Email address: [email protected] (Vasile V. Moca).1 Authors have equal contribution.
2
2 Material and Methods
We developed an artificial system that extracts features from the raw EEG signalusing TESPAR. The features are then fed to a non-linear MLP classifier, which istrained and tested on trials labeled by a human expert relying on a morphologicallydifferent signal (MLAEP).
2.1 Anesthesia
With the approval of the local ethics committee (Ludwig-Maximilians-UniversityMunich), 62 patients were enrolled in the study after having provided their writ-ten informed consent. After the induction of general anesthesia and administrationof muscle relaxation, the anesthesia was maintained with a combination of hyp-notics and opioids. The choice of these substances was left to the discretion of theattending anesthesiologist and the dosage was based on clinical routine. The admin-istration of hypnotic agent was adjusted when signs of wakefulness were presentand was preemptively increased before anticipated painful surgical stimulation. TheMLAEP was not available to the responsible anesthesiologist (for detailed informa-tion see appendix A.1).
2.2 Data acquisition
During the medical procedures (see also appendix A.2) auditory stimulation wasapplied to the patients in the form of short clicks with a continuous repetition rateof 9.1 Hz. All the intraoperative events such as awake, induction, intubation, cough-ing, spontaneous breathing, response to simple or complex requests and so on werecoded by keystrokes and stored along the recorded EEG. Data was recorded con-tinuously from induction to wake-up. The EEG signal was recorded differentiallybetween A1 and Fp2, according to the international 10/20 system [26], with a sam-pling rate of 4 kHz.
2.3 Data pre-processing
The amplified and recorded data, with a bandwidth of 0.5 to 600 Hz, were processedoffline for further filtering, artifact removal (for detailed information see appendixA.3), and rejection of power line frequency (50 Hz). Next we divided the data into100 seconds long segments, recorded before and after intraoperative events. Theseevents offered additional information to the human expert and were concomitant
3

with actions performed on the patient (e.g. changes in the drugs administration, in-tubation, skin incision, etc.) or with feedback detected from the patient (e.g. bloodpressure variation, tears, heart rate change, active breathing, etc.). The data fromeach segment were analyzed in two different ways. First, we divided the segmentinto short trials (110 ms long) aligned to the auditory stimulus. Segments that con-tained less than 600 artefact free trials were discarded. The trials were used forthe MLAEP-based classification performed by human experts. Second, segmentsvalidated previously were also analyzed in their full length (without dividing theminto trials) using the TESPAR method. Subsequently, features extracted by TES-PAR were used for the classification performed by MLP artificial neural networks.To further identify the importance of different frequency bands for classification,filtering was also applied on each segment, prior to feature extraction.
2.4 Human expert classification
We randomly selected 600 segments across all 62 patients that included periodswith different depths of anesthesia. To manually classify the data based on theMLAEP, we computed the evoked responses by averaging 600 to 800 artefact-clean trials per segment. Next the MLAEPs were visually categorized into one offive classes by two human experts, each expert being unaware of the other expert’sjudgement. Additional information was provided by the corresponding intraopera-tive events (see above). The experts relied on this additional information to decidebetween two adjacent DOA classes. The five DOA classes were defined as follows:class 5 corresponded to an awake patient able to respond to complex verbal re-quests; class 4 was defined as very light anesthesia with patients able to respond tovery simple requests like hand squeeze; class 3 was associated with states of sleep,in which patients do not respond to light stimuli but might react to strong ones;class 2 corresponded to the optimal anesthesia level; and class 1 was linked to toodeep anesthesia, where brain activity is unnecessarily low (burst suppression).
The Observer’s Assessment of Alertness/Sedation (OAA/S) [27] scale has beenwidely in use to develop and evaluate DOA monitoring devices with a main focuson periods when induction of anesthesia is performed or when patients return toconsciousness. With the DOA scales used in this study we intended to cover thefull range of clinical anesthesia. With the DOA assessment as used in our studythere is a coarser resolution for the states of sedation with the DOA levels 4 and5 corresponding to OAA/S levels 2-5. On the side of deep general anesthesia theresolution of the scale used in this study is finer with the OAA/S level 1 beingpotentially differentiated onto DOA classes 1-3.
4

Fig. 1. TESPAR coding diagram block. It shows how the digital signal is divided in epochs(delimited by vertical dotted lines). Each epoch is characterized by its number of samples(D) and its number of local minima (S) (we refer to the local minima of the absolutevalue of the waveform). The (D,S) pair stream (values showed for each epoch) is thentransformed in a symbol stream, with the help of an alphabet that maps each pair onto asymbol (number). The symbol stream is further condensed in TESPAR A or S matrices inthe final stage of the coder.
2.5 Feature extraction, TESPAR
First proposed by King and Glossing [25], TESPAR is a time-domain digital lan-guage for coding “band-limited” signals. The simple TESPAR model uses featuresthat can be easily detected by visual inspection of the waveform, namely zero cross-ings and local extremes [28].
Since TESPAR was described in detail previously [25, 23, 28, 24], we will be lim-ited to presenting the most important aspects of TESPAR. First, the signal is splitinto portions situated between two adjacent zero crossings of the waveform, calledepochs (Fig. 1). Each epoch is described by a pair of parameters: (D), called du-ration, characterizes the length of the epoch in samples, and (S), which describesthe shape of the epoch by counting the number of its local minima (we used thenumber of local minima of the absolute value of the waveform). The pair (D,S)is then replaced, based on a TESPAR alphabet (codebook), by a number called aTESPAR symbol. The TESPAR alphabet is specific to each class of signals [28](e.g. voice, EEG, seismic vibrations), and its main purpose is to reduce the noiseaffecting the epochs by assigning the same symbol to similar epochs. The alpha-bet approximates the distribution of epochs in the (D,S) plane by means of vectorquantization (VQ) (e.g. Kohonen maps, K-means, Linde Buzo Gray - VQ). In our
5

case, preliminary tests indicated that the shape of the epochs did not contain use-ful information, therefore, S was not used by the analysis. The duration D of anepoch gives a rough estimation of the most prominent frequency associated withthe respective piece of signal. We ordered TESPAR symbols according to theircorresponding duration (D) such that higher ranking symbols implied a longer du-ration, and thus, a lower dominant frequency of the epoch. By using the TESPARalphabet, the waveform was transformed into a symbol stream which was furtherprocessed to obtain fixed-size descriptors that are called TESPAR matrices (Fig. 2).
The first matrix, called the S matrix, is a histogram of symbols counts (how manytimes a certain symbol is present in the signal). The second matrix, called the Amatrix, is a two-dimensional matrix that counts how many times a pair of symbols,situated L symbols apart, appears in the signal. The L parameter called “lag”, isusually kept constant for a certain implementation. Small or large lag values giveA matrices that describe the short or long time evolution of the signal, respectively[28]. Since time is included through the lag, the A matrix provides a richer informa-tion content than the S matrix. Preliminary tests (results not shown), revealed thatA matrices with a lag = 1 yielded the best performance.
In addition, we applied further processing to the matrices to increase the saliencyof the representation. Long epochs, which were usually more rare, were empha-sized with respect to shorter, more frequent epochs. The nonlinear transformationai j := ln(ai j +1) applied on the element ai j of the A matrix allowed the amplifica-tion of small values and small differences so that long epochs received increasedimportance. The same nonlinear transformation was applied to elements si of the Smatrix. Before the TESPAR matrices were presented to the MLP, they were normal-ized to the interval [0,1], by dividing each element in the matrix by the maximumof the matrix.
2.6 Feature mapping (classification)
To test whether TESPAR matrices contain information about DOA, we used MLPnetworks [29] to compute a mapping between TESPAR matrices and the five classesof DOA. MLP classifiers were chosen because they have recently recorded notablesuccesses in anesthesia-related problems [30]. MLP topologies were constrainedby the mapping problem: The size of the input layer was defined by the size of theinput TESPAR matrix, the output layer had five output neurons (one for each DOAclass), the size and number of hidden layers was optimized in a heuristic manner.The backpropagation algorithm was used for training [31, 32].
Classification performance was further boosted [23, 33, 34] by employing ensem-bles of classifiers [34] trained by using a bagging technique (for each classifier asubset of the training set was randomly selected [35]). To avoid training bias, the
6

Deeply anesthetized
(class 1)
Awake (class 5)
TESPAR S TESPAR A
Symb.
Symb. Symb.
Symb.
Symb.
Symb. Log(#)
Log(#)
Log(#)
Log(#)
Fig. 2. TESPAR S and A matrices (L = 1) for awake (class 5) and deeply anesthetized states(class 1). The S matrix counts how many times symbols appear in the data stream. The Amatrix represents in a gray scale the number of occurrences for each symbol pair situated Lsymbols apart. The log transformation (see section 2.5 “Feature extraction, TESPAR”) hasbeen applied to the matrices. Prominent differences can be seen in the matrices for the twoextreme states (awake, deeply anesthetized).
number of examples was balanced, such that the training set for each class hadthe same size. This limited the training set size to the size of the smallest avail-able training set (in our case, corresponding to class 5). After training, the MLPensemble used a majority vote strategy to give the final classification result.
3 Results
We employed TESPAR and MLP classifiers, to extract DOA information containedin EEG segments comprising multiple trials that followed an auditory stimulus. Anentire segment was considered as either a training or a testing sample. The perfor-mance achieved by the artificial system (TESPAR and MLP) on the EEG segmentswas assessed in comparison to the classification performed by two anesthesiologistswith expertise in visual classification of MLAEPs computed on the same segments.
7
3.1 The human classifier
We first evaluated the performance of the human experts (see appendix A.4). Forthis purpose, the two anesthesiologists were asked to classify the same data ontwo different occasions. Anesthesiologists A and B classified 70.77% and 68.29%of the segments in the same way, respectively (see also Fig. A.1 and Table A.1).These measures of self consistency were regarded as the highest performance thatthe artificial system, learning from the human expert, could achieve.
3.2 Method configuration and calibration
To calibrate the method, we have used MLPs with one hidden layer, trained andtested on TESPAR A matrices (Fig. 2). For each human expert, the validated datawere half-split to obtain a training set and a testing set, and these sets were balancedaccording to the procedure presented above (“Feature mapping (classification)”).Class 5, corresponding to an awake patient, occurred most rarely (19 and 20 timesfor A and B human experts, respectively). Thus, the size of the training set waslimited to 9 and 10 samples per class for anesthesiologist A and B, respectively.
To adjust the TESPAR alphabet size and the hidden-layer dimension, fifteen sin-gle MLPs were constructed for each parameter configuration, each MLP having arandomly assigned training subset. For each MLP the accuracy was evaluated withrespect to the classification performed by one of the anesthesiologists. The medianof classification accuracy over the 15 MLPs was used as the main performanceindicator.
For the TESPAR alphabet size, we tested the range of 2 to 50 symbols. More than15 symbols yielded a classifcation performance above 50%. It is known that analphabet of about 30 symbols should be suitable for most types of signals and ap-plications [28]. Here, the highest performance ( 55%) was obtained for 20 and 32symbol configurations.
Variation of the hidden-layer dimension (3, 5, 10, 15, 20, 30, 50, 100) showedincreased performance for 5 and 10 neurons. Further increase in the number ofhidden layer units resulted in a steady performance decrease. Therefore, we keptthe hidden layer dimension as small as possible to encourage generalization.
The most suitable configuration was obtained with 32-size TESPAR alphabet inconjunction with 5 hidden units. Unless otherwise specified the following architec-ture was used further: input layer with 32 or 1024 units for systems using S and Amatrices, respectively; 5 neurons in the hidden layer and 5 neurons in the outputlayer (one for each DOA class).
8

Fig. 3. The classification performance of the four sets of 2500 MLP networks (a) and theselection of the best 1% (b). On the X axis we indicate which TESPAR matrix is used andwhether the log nonlinearity is applied or not. The dotted line represents the self-consis-tency of the human classifier, which is taken as the maximum achievable performance bythe artificial classifier. The box plots show, for each distribution, the median, the quartilesq1 and q3, and the minimum and the maximum performances. The ensemble performanceis presented through thick grey bars. Note the different scales in a) and b) that are empha-sized by the 10% indication (thick black bars shown on the right).
3.3 The artificial system performance
We first tested if there was a difference in the way that the artificial system learnedone or the other human classifier. For each anesthesiologist we trained 125 MLPson A matrices. To enhance reliability and classification performance, networks wererandomly grouped in 5 ensembles (comprising 25 networks each). We computedthe average and standard deviation across classification performances provided bythese ensembles. For anesthesiologist A, we obtained a mean of 60.06% and a stan-dard deviation of 1.48%. For anesthesiologist B, we obtained a mean of 45.38% anda standard deviation of 2.05%. The test indicated that the artificial system learnedbetter from anesthesiologist A meaning that the association between segments andDOA classes for anesthesiologist A presented a structure that was easier to graspby the artificial system. Next we considered only anesthesiologist A as a reference.
We further investigated whether MLPs with more than one hidden layer performbetter than MLPs with a single hidden layer. Tests on a set of MLPs with five neu-rons in two hidden layers, grouped in the same configuration as above, did not indi-cate any increase in classification performance (average of 60.62% and a standarddeviation of 1.17%) for anesthesiologist A.
In the following, we tested whether the logarithmic nonlinearity enhances the saliencyof the TESPAR matrices, and whether the temporal information contained in the Amatrix is beneficial. We trained four sets of 2500 MLPs, each corresponding toa different system configuration (using S or A matrices with or without the loga-rithmic nonlinearity). For each configuration, we analyzed the distribution of in-dividual MLP classification performances and the score achieved by the ensemble
9
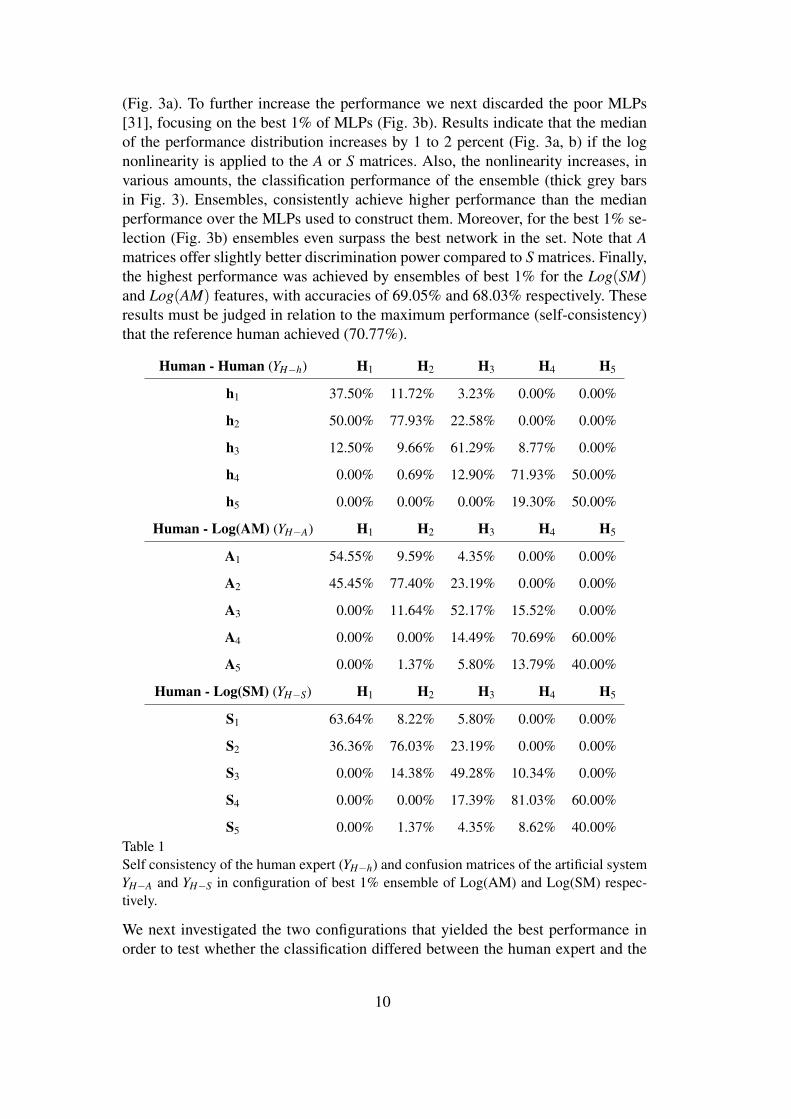
(Fig. 3a). To further increase the performance we next discarded the poor MLPs[31], focusing on the best 1% of MLPs (Fig. 3b). Results indicate that the medianof the performance distribution increases by 1 to 2 percent (Fig. 3a, b) if the lognonlinearity is applied to the A or S matrices. Also, the nonlinearity increases, invarious amounts, the classification performance of the ensemble (thick grey barsin Fig. 3). Ensembles, consistently achieve higher performance than the medianperformance over the MLPs used to construct them. Moreover, for the best 1% se-lection (Fig. 3b) ensembles even surpass the best network in the set. Note that Amatrices offer slightly better discrimination power compared to S matrices. Finally,the highest performance was achieved by ensembles of best 1% for the Log(SM)and Log(AM) features, with accuracies of 69.05% and 68.03% respectively. Theseresults must be judged in relation to the maximum performance (self-consistency)that the reference human achieved (70.77%).
Human - Human (YH−h) H1 H2 H3 H4 H5
h1 37.50% 11.72% 3.23% 0.00% 0.00%
h2 50.00% 77.93% 22.58% 0.00% 0.00%
h3 12.50% 9.66% 61.29% 8.77% 0.00%
h4 0.00% 0.69% 12.90% 71.93% 50.00%
h5 0.00% 0.00% 0.00% 19.30% 50.00%
Human - Log(AM) (YH−A) H1 H2 H3 H4 H5
A1 54.55% 9.59% 4.35% 0.00% 0.00%
A2 45.45% 77.40% 23.19% 0.00% 0.00%
A3 0.00% 11.64% 52.17% 15.52% 0.00%
A4 0.00% 0.00% 14.49% 70.69% 60.00%
A5 0.00% 1.37% 5.80% 13.79% 40.00%
Human - Log(SM) (YH−S) H1 H2 H3 H4 H5
S1 63.64% 8.22% 5.80% 0.00% 0.00%
S2 36.36% 76.03% 23.19% 0.00% 0.00%
S3 0.00% 14.38% 49.28% 10.34% 0.00%
S4 0.00% 0.00% 17.39% 81.03% 60.00%
S5 0.00% 1.37% 4.35% 8.62% 40.00%Table 1Self consistency of the human expert (YH−h) and confusion matrices of the artificial systemYH−A and YH−S in configuration of best 1% ensemble of Log(AM) and Log(SM) respec-tively.
We next investigated the two configurations that yielded the best performance inorder to test whether the classification differed between the human expert and the
10
Simple action
0
5
10
15
1 2 3 4 5
Start induction
0
5
10
1 2 3 4 5
Coughing
0
5
10
1 2 3 4 5
Intubation
0
5
10
1 2 3 4 5
Reduce anesthetic
0
10
20
1 2 3 4 5
Spontaneous movement
0
3
6
1 2 3 4 5
Start medication
0
5
10
1 2 3 4 5
Increase anesthetic
0
5
10
15
1 2 3 4 5
Stop anesthetic
0
5
10
15
1 2 3 4 5
DOA
AwakeDeep
#
#
#
#
#
#
#
#
#
*
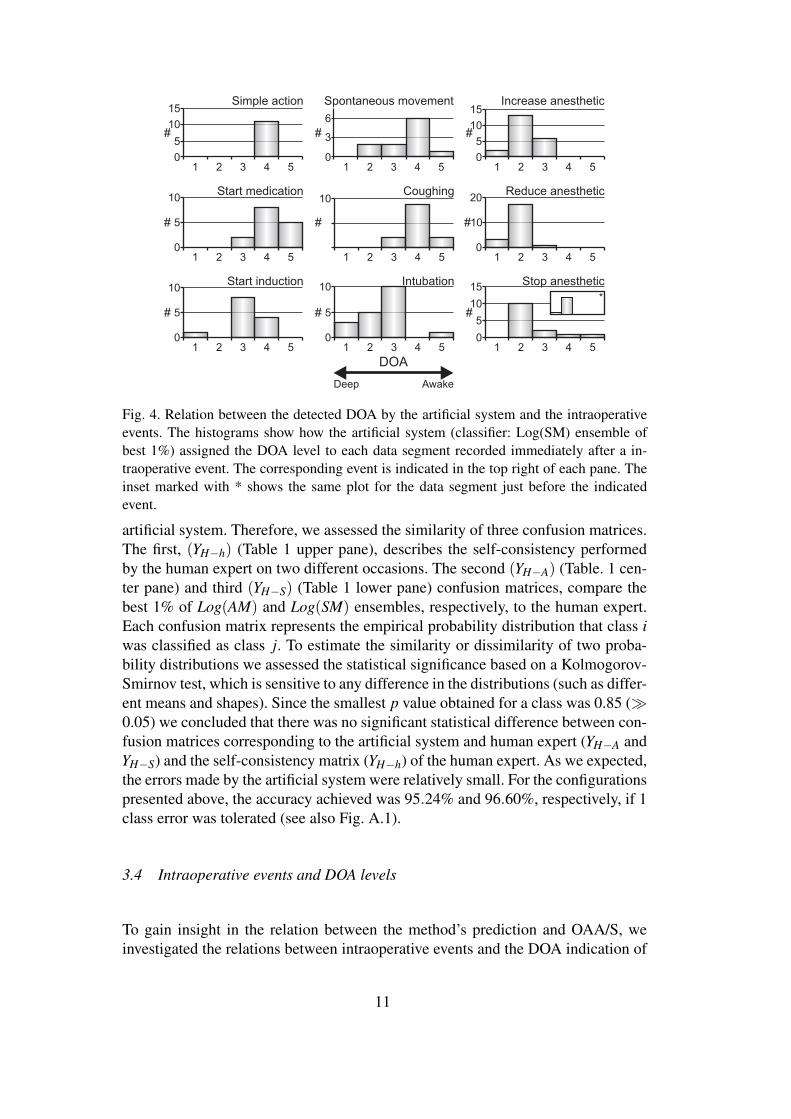
Fig. 4. Relation between the detected DOA by the artificial system and the intraoperativeevents. The histograms show how the artificial system (classifier: Log(SM) ensemble ofbest 1%) assigned the DOA level to each data segment recorded immediately after a in-traoperative event. The corresponding event is indicated in the top right of each pane. Theinset marked with * shows the same plot for the data segment just before the indicatedevent.
artificial system. Therefore, we assessed the similarity of three confusion matrices.The first, (YH−h) (Table 1 upper pane), describes the self-consistency performedby the human expert on two different occasions. The second (YH−A) (Table. 1 cen-ter pane) and third (YH−S) (Table 1 lower pane) confusion matrices, compare thebest 1% of Log(AM) and Log(SM) ensembles, respectively, to the human expert.Each confusion matrix represents the empirical probability distribution that class iwas classified as class j. To estimate the similarity or dissimilarity of two proba-bility distributions we assessed the statistical significance based on a Kolmogorov-Smirnov test, which is sensitive to any difference in the distributions (such as differ-ent means and shapes). Since the smallest p value obtained for a class was 0.85 (À0.05) we concluded that there was no significant statistical difference between con-fusion matrices corresponding to the artificial system and human expert (YH−A andYH−S) and the self-consistency matrix (YH−h) of the human expert. As we expected,the errors made by the artificial system were relatively small. For the configurationspresented above, the accuracy achieved was 95.24% and 96.60%, respectively, if 1class error was tolerated (see also Fig. A.1).
3.4 Intraoperative events and DOA levels
To gain insight in the relation between the method’s prediction and OAA/S, weinvestigated the relations between intraoperative events and the DOA indication of
11

the artificial system (Fig. 4). Meaningful relations were clearly visible and some ex-amples are presented in Fig. 4. “Simple action” was detected only at DOA 4, while“Start medication” and “Coughing” were detected mostly in DOA 4-5. “Sponta-neous movement” was associated rarely with DOA 2 (properly sedated) and DOA3 but appeared more often in states with light (DOA 4) anesthesia. “Intubation”represents a very strong and disturbing stimulus and was performed during properanesthesia (DOA 2 or sometimes DOA 1). During this procedure some patients ex-hibited an increase in the level of arousal (DOA 3) while others remained in the areaof deep anesthesia. “Increase anesthetic” and “Reduce anesthetic” were meant tokeep the patient in a properly sedated state. “Stop anesthetic” occurs usually at theend of the surgical procedures when the patient is still deeply sedated but painfulstimuli are not present. Accordingly, before this event, the detected DOA level was2 (see inset) while after the event the DOA level shifted towards more awake.
3.5 Frequency band analysis
We tested how the information content of various frequency bands was related tothe classification performance of the artificial system. The same test and trainingsets were used as above, with additional filtering applied to isolate or to reject fre-quency bands of interest such as: delta (0.5 - 4 Hz), theta (4 - 8 Hz), alpha (8 - 12Hz), beta (12 - 30 Hz), gamma (30 - 80 Hz), and high frequencies (80 - 600 Hz). Theadditional filtering was applied only on the data processed by the artificial system.The data underlying MLAEP was not filtered, such that MLAEP waveforms and,thus, the DOA segment associations remained unchanged. For each filter setting,5 ensembles comprising 25 individual MLP networks were constructed. The aver-age and standard deviation of the 5 ensemble distributions, for each filter set andeach DOA class, are presented in Fig. 5. We created sets of filters in order to: iso-late one frequency band (Fig. 5a), eliminate one frequency band (Fig. 5b), preservemore and more frequency bands starting with low frequencies (Fig. 5c), preservemore and more frequency bands starting with high frequencies (Fig. 5d), and keepprogressively more (Fig. 5e) or progressively less (Fig. 5f) frequency bands in thetheta-gamma range. For comparison, the classification performance on the unfil-tered data (Fig. 5a-f, ALL) is shown in each case. Figure 5 illustrates a complexrelation between the expression of various frequency bands and the correct detec-tion of different DOA classes. For DOA class 1, individual alpha and beta bands areless informative (Fig. 5a, DOA 1) and either one’s absence facilitates classificationwhen all the other bands are kept intact (Fig. 5b, DOA 1). Delta and theta bands,when taken together, or in combination with both alpha and beta, provide a gooddiscrimination of this DOA class (Fig. 5c, DOA 1). Another prominent peak is in-terestingly obtained for a combination of gamma and high frequencies (Fig. 5d,DOA 1). Importantly, DOA class 1 is not well discriminated when all frequencybands are lumped together, but seems to be well classified only when low (delta -theta) or high (gamma - high) frequencies are grouped (Fig. 5c and 5d, DOA 1),
12

30%
60%
30%
60%
30%
60%
30%
60%
0%
30%
60%
δ-----
- ----
θ-- ---
α--- --
β---- -
γ-----h
- h
θαβγ
δ αβγ
- h
δθ βγ
- h
δθα γ
- h
δθαβ-h
δθαβγ-
δ-----
δθ----
δθα---
δθαβ--
δθαβγ-
-----h
---- h
γ--- h
βγ
-- h
αβγ
- h
θαβγ
---- -
γ--- -
βγ
-- -
αβγ
- -
θαβγ
δ----h
δθ---h
δθα--h
δθαβ-h
ALL
ALL
ALL
ALL
ALL
ALL
40.5
812
30
80
600
a) b) c) d) e) f)
1
2
3
4
5
DO
Ale
ve
l
90%
Fig. 5. The effects of filtering on the classification performance. The bottom part shows thefrequency bands preserved (filled rectangles) after filtering the EEG. For each frequencycontent upper traces represent the mean and the standard deviation of the classificationperformance for each DOA level (DOA level shown on the right). The results are groupedto emphasize: a) - b) the importance of each frequency band, c) - d) the importance of lowand high frequencies, and e) - f) the importance of frequencies in the theta – gamma range.
or when either alpha or beta bands are eliminated while other bands are preserved(Fig. 5b, DOA 1). DOA class 2 is better classified when relying on individual alpha,beta, or gamma bands than on other individual frequency bands (Fig. 5a, DOA 2).Nonetheless, in this case, adding progressively more bands is beneficial for classifi-cation (Fig. 5c, DOA 2). For DOA class 3, the relation between different frequencybands and classification performance is less clear, such that it is rather a combi-nation of multiple bands, in various configurations, that can provide informativefeatures to the classifier (Fig. 5a-f, DOA 3). DOA class 4 is best detected wheneither very high (> 80 Hz) or all frequency bands are preserved (Fig. 5a, DOA 4).Most other combinations prove to be less informative for detecting this class. Fi-nally, DOA class 5 is best detected when only the gamma frequency band is kept(Fig. 5a, DOA 5). Adding other frequency bands mostly impairs classification. Thecombination of frequency bands yielding the next best performance as compared togamma includes the alpha, beta and gamma bands lumped together (Fig. 5e, DOA5).
13

4 Discussion
4.1 Methodological considerations
For practical reasons the following drawbacks could not be avoided. First, one ofthe drawbacks of this study is the low number of training examples for the less rep-resented conditions (mostly the deeply anesthetized state, and to a smaller degree,the awake state), which are avoided during surgery. However, the system was ableto generalize, even based on just a few examples. Second, since OAA/S scale wasnot suitable for this study, the artificial system was evaluated with respect to the hu-man expert, who is subject to variability and errors. This was somehow alleviatedby the relations between the detected DOA and the occurrence of intraoperativeevents. Third, even if TESPAR does not use averaged data, still, a quite long wave-form (about 100 seconds) is needed for reliable construction of S and A matrices;this could be problematic if rapid transitions in the sedation level should occur (e.g.when an unprecedented strong stimulus is applied to the patient). Fourth, furtherstudies are needed before a conclusion can be formulated on which component (on-going activity or stimulus-induced locked/non-locked activity) of the EEG signal isimportant for DOA assesment. These studies should make use of EEG recordingswith and without auditory stimulation. Despite these drawbacks, we believe thatTESPAR feature extraction proves to be valuable in DOA detection.
4.2 Mapping signals onto DOA
4.2.1 The human expert.
The confusion matrix of the human expert is not ideal (Table 1 (YH−h)). This isexpressed through an uncertainty in the MLAEP mapping onto DOA levels. How-ever, this uncertainty is limited to one DOA class (Fig. A.1). There are severalpossible reasons for that. First, the states visited by the brain passes throughoutsurgery might not be stationary and, thus, a MLAEP might capture aspects frommore than one state. Second, the five classes defined do not have clear separationborders. Third, some of the classes chosen here are close, from the clinical point ofview, to each other. The EEG signals, for these cases, have similar properties ren-dering MLAEP based visual discrimination difficult (e.g. class 1 with class 2 andclass 5 with class 4). This subjectivity could have been reduced if an OAA/S likeobservation-based scale would have been available [27, 36, 37]. Although, OAA/Sscore was not assessed we have found meaningful relations between the detectedDOA level and the occurrence of intraoperative events, which are part of OAA/Sassessment.
14

4.2.2 The artificial system
MLP networks were previously used in DOA detection [30]. Other studies reportedbetter performance if two hidden layers are used, but in our case, an extra hiddenlayer did not seem beneficial. However, in all cases, grouping MLP networks inensembles made the mapping more robust, sometimes even surpassing the perfor-mance achieved by the best MLP within the ensemble.
Since we used the classification performed by the human expert (who misclassifiesusually by at most one class) to train and test the artificial system, we expected atmost one class erroneous classification by the latter as well. Indeed, confusion ma-trices between the human-human and human-system pairs were very close to eachother. Thus both systems presented similar mapping patterns (Table 1). The artifi-cial system’s performance was very close to the self-consistency of the referencehuman expert.
4.3 Features and feature extraction
During TESPAR alphabet generation, the vector quantization eliminates the smallvariability present in similar epochs, endowing the system with robustness to noise.Because the symbols in the alphabet were ordered in ascending order according totheir duration, each symbol could be associated with a certain frequency. Generally,as the patient went into deeper anesthesia (Fig. 2), symbols with longer durationwere more frequent, and thus, lower frequencies were more prominent in the EEG.In addition, the log nonlinearity emphasizes the importance of these, more rare,long epochs. Tests (Fig. 3) showed that the log nonlinearity(see section 2.5 “Featureextraction, TESPAR”) increased the separability in the DOA domain, for both Aand S matrices and thus increased the classification performance. The system basedon the A matrix performed, however, better than the one with the S matrix in mostcases, indicating that the temporal structure of the EEG contains useful informationfor DOA assessment. All, these results validate the usefulness of TESPAR featuresfor DOA detection.
Regarding the frequency content of EEG during anesthesia, we found that infor-mation related to DOA is mostly distributed across frequency bands (Fig. 5). Thenon-linear classification using TESPAR and MLPs can take advantage of multi-ple frequencies, such that, in general, there is a combination of multiple frequencybands that yields the best detection results. This was particularly true for deeperanesthesia conditions (classes 1 and 2), for which multiple combinations of fre-quency bands across the spectrum are required for good classification.
In states of low sedation or wakefulness, higher frequency bands start to play amore prominent role. High frequencies (> 80 Hz) reflect mainly muscle activityand are frequently considered to be an artifact. Here however, we found that their
15

presence is beneficial. For example, frequencies > 80 Hz proved useful for thecorrect detection of low sedation levels (class 4) and also contributed, in combi-nation with other frequency bands, to the correct detection of other DOA classes.Hence, muscle activity may carry DOA relevant information which should not beoverlooked. Indeed muscle activity was considered useful also by the M-Entropymonitor described in [38]. Results indicate that gamma band activity (30 - 80 Hz) isvery important for correctly identifying states of wakefulness (class 5) and that thepresence of other components, especially of low frequencies, impairs the detectionof such states. This is highly consistent with findings that gamma band activity cor-relates with visual and cognitive cortical processing, thus representing a hallmarkof the awake state [39].
High frequency neuronal signals reflecting muscle or gamma band activity are usu-ally not stimulus-locked, and hence they are not visible in MLAEP. Nevertheless,TESPAR descriptors can take advantage of non-locked activity. The good agree-ment between, physiological correlates of wakefulness (e.g. gamma activity) andthe awake class identified with MLAEP shows that the artificial classifier presentedhere can learn important signal features that were not originally used by the anes-thesiologists in order to classify the data.
4.4 Comparison to other methods
Other time-domain approaches to EEG signal processing, namely the zero crossingfrequency [12, 13] and the aperiodic analysis [14], have shown that certain pointsin the signal’s waveform, like minima or zero crossings, contain DOA related infor-mation. It has been suggested [11] that one major disadvantage of these two meth-ods is that they do not take into account the small ripples of the waveform. In ourcase, these small ripples (the shape parameter) seemed unimportant. However, thereare several differences between these two methods and TESPAR. The zero cross-ing frequency tries to detect the average frequency by counting how many timesthe signal crosses the zero level. The aperiodic analysis describes the waveformportion between two adjacent minima through its amplitude and frequency (recip-rocal of its duration). Then, the frequency-amplitude pair is displayed concurrentlyfor two frequency bands. By contrast, TESPAR takes the signal into the symbolicprocessing domain, where it extracts compact, fixed-size descriptors. Moreover,besides the frequency-related information (provided by the average length of theepochs), TESPAR also provides information about the temporal structure of thesignal (through the A matrix).
The time-domain approach is perhaps best represented by methods based on evokedpotentials (MLAEP) such as the A-line ARX Index. Evoked potentials extractstimulus-locked information that can survive an averaging procedure. Both ongo-ing activity and non-locked stimulus-induced activity are lost through averaging.
16

TESPAR does not use the averaging procedure, therefore, it has the opportunityto extract more information from the signal. However, further investigations arerequired to answer whether the ongoing activity, the stimulus-induced activity, orperhaps a combination of these two is informative for TESPAR.
Among frequency-domain techniques, the bispectral index method is based mostlyon frequency-domain signal processing (although phase, or time, information isalso included in bicoherence index which is a part of the bispectral index) [11].The Narcotrend monitor uses both time and frequency information in addition toentropy measurements [5], while M-Entropy monitor is based on entropy measure-ments [38]. There are several advantages of TESPAR over many of these, and es-pecially frequency-domain, methods. First, the computational effort is at least oneor two orders of magnitude smaller. Second, the only requirement imposed on thesignal is to have a finite bandwidth, which is true for any signal produced by natu-ral sources. Third, the fixed size of the TESPAR matrices, regardless of the signal’slength, makes them perfect candidates for a plethora of classifiers [23, 24, 25]. Fi-nally, since TESPAR is a time-domain method, it can detect differences in signalsthat look identical in the frequency-domain [28].
4.5 Concluding remarks
An intimate relation exists between the TESPAR processed EEG and DOA states ofthe patient undergoing general anesthesia. Indeed, the classification performance ofDOA obtained with the artificial system reached very close (about 2% difference)to the mapping performed by the human expert, which indicates that DOA-relevantinformation is captured by TESPAR matrices. However, to reliably extract this in-formation, we need to cope with the nontrivial relation between the descriptors andthe DOA state. In order to perform the mapping, we took advantage of the humanexpertise, which, although biased, offered the artificial system the possibility to un-ravel such a nontrivial relation. As the artificial system’s performance is limited bythe imperfect human expert, further studies employing more data, a more objectiveDOA scale, and perhaps unsupervised learning are required to asses the real valueof this method and whether the ongoing and/or the stimulus-induced activity arecaptured by it.
TESPAR offers small, compact, fixed-size, and highly informative EEG descriptorsproviding, thus, a promising asset to DOA detection which could enhance alreadyexisting DOA monitors. TESPAR is perhaps most valuable in applications wherelight computational resources are desirable.
17
A Appendices
A.1 Anesthesia protocol
After oral premedication with 7.5 mg midazolam 30 minutes prior to general anaes-thesia, patients were transferred to the operation theater. Patients were placed supine,and physiologic monitoring according to anesthesiologic standards, consisting of a3 lead electrocardiogram (ECG), pulse oximetry, and oscillometric blood pressuremonitoring were installed. An 18G cannula was inserted into a large forearm vein,and an infusion of isotonic saline solution was started. Then a priming dose of non-depolarizing muscle relaxant (atracurim besilate 0.01 mg/kg) and a loading dose ofan opioid (left to the discretion of the attending anesthesiologist: fentanyl 0.1 mg,sufentanil 0.01 mg, alfentanil 1 mg or remifentanil continuously 0.1 mg/h) wereapplied i.v. and preoxygenation was started with pure oxygen via face mask in acalm environment. An equilibration period of 2 minutes was allowed, regardlessof the opioid used. General anaesthesia was induced by intravenous injection ofthiopentone (4-6 mg/kg) or propofol (2-4 mg/kg) until the loss of the eyelid re-flex occured and no response to loud verbal commands were visible. All patientswere ventilated manually via face mask with pure oxygen. Muscle relaxation wasinduced with atracurium besilate (0.05 mg/kg) i.v. Tracheal intubation was per-formed 2 minutes after application of the muscle relaxing agent. All patients wereventilated mechanically, with minute ventilation adjusted by capnography in orderto ensure normocapnia with a mixture of oxygen in air sufficient to provide an SpO2of greater than 97%. Balanced anaesthesia was maintained with either isoflurane,sevoflure, desflurane, or propofol (the choice of substance was left to the discre-tion of the attending anesthesiologist), in combination with the opioid chosen forinduction. The dosage of the hypnotic agent was based on clinical routine, adjustedby the occurrence of motor signs of wakefulness, while the further delivery of opi-oids was performed pre-emptively prior to periods of anticipated painful surgicalstimulations, adjusted by autonomic signs of inadequate analgesia (rise in heartrate, blood pressure, sweating, and tear production). The responsible anesthesiol-ogist was blinded towards the recorded auditory evoked potential (AEP) signal.No further muscle relaxants were applied. At the end of the surgical procedure,the delivery of all anesthetic agents was discontinued and mechanical ventilationwas terminated when sufficient spontaneous breathing returned. The patients weregiven verbal commands repetitively every 2 minutes. After the first response to theverbal commands, patients’ tracheas were extubated and patients were allowed tobreath pure oxygen via face mask.
18
A.2 Data acquisition
Electrodes for AEP monitoring and headphones were applied after having insertedthe iv-line. For auditory stimulation, rarefaction clicks of 98 µs duration and anintensity of 95 dB (SPL) were presented binaurally to the patient, with a contin-uous repetition rate of 9.1 Hz via headphones (TDH 39, Toennies/Viasys health-care, Hoechberg, Germany). AEP were recorded by silver/silver-chloride adhe-sive electrodes (Neuroline 7200 00-S, Ambu / Medicotest, Denmark) placed afterskin preparation with acetone, according to the international 10/20 system. Inter-electrode impedances were kept below 5 kΩ. The electrodes were connected to apreamplifier (POD, Siemens Medical, Erlangen, Germany) with short connectingcables wired to feed 4 recording channels (A1/Fp1, A2/Fp2, A1/Cz, A2/Cz) withFpz as common ground, according to the 10/20-system [26]. The signals were am-plified and digitized (sensitivity 0.0170 V, sampling rate 4 kHz) within the pream-plifier; the digital signal was transmitted to the recording system via broadbandglass fibre cables. On the recording system, the data were stored on a hard disc and,for quality control purposes, the raw EEG signal and averaged AEP epochs of 500sweeps were displayed on a screen. All intraoperative events (awake, induction,intubation, tears, spontaneous breathing, coughing, response to complex request,and so on) were coded by keystrokes on the recording system by the investigatorand stored along with the AEP-data. An interval of 2 minutes was allowed for thepatients to rest with closed eyes for collection of baseline measurement variables.Data acquisition continued continuously throughout induction, surgical procedures,and wake-up procedure after surgical procedures had been finished. Data acquisi-tion was stopped after the patients had regained consciousness and orientation withregard to the patient’s name.
A.3 Artefact detection and removal
After rejection of 50 Hz power line frequency, we obtain EEG signals with a bandof 0.5 to 600 Hz. Muscles, eye movements, heart electrical activity, head movementand electrical devices can generate electrical artefacts in the EEG recordings [40].To detect the artefacts, we utilized the amplitude of the recorded signal in two fre-quency bands. The first band, including frequencies from 0.5 to 600 Hz, was usedto detect artefacts specific to the EEG like fast drifts of the potentials. The secondfrequency band focuses on artefacts in the high frequency-domain, from 100 to 600Hz, that can be caused by the surgical manipulation on the patient (eg. cuttering).The advantage of the second high frequency band is that the biological signals haverather low amplitudes in this frequency-domain, which allows for higher sensitivityfor artefact detection. For each of the two filtered signals we rejected each stimulusinterval of 110 ms length for which the signal amplitude exceeded one of the twodefined thresholds. The first threshold was set to 25 mV and corresponds to a limit
19

Fig. A.1. The agreement between classifications performed on two different occasions onthe same data by the same anesthesiologist. It shows how the differences between the DOAclasses assigned on the two occasions are distributed. In more than 98% of the cases, theclassification agreement is in within one class difference.
Expert A - Expert B (YH−B) H1 H2 H3 H4 H5
B1 33.33% 2.76% 1.72% 1.61% 0.00%
B2 54.55% 81.89% 46.55% 11.29% 0.00%
B3 12.12% 10.24% 44.83% 38.71% 23.53%
B4 0.00% 3.54% 6.03% 41.94% 70.59%
B5 0.00% 1.57% 0.86% 6.45% 5.88%Table A.1The comparison between two human experts. It shows, in percentages, how segments clas-sified as DOA class Hi by anesthesiologist A are classified as DOA class B j by anesthesi-ologist B.
that is not expected to be exceeded not even in recordings with very high noise.The second threshold, for each recording, corresponded to a value of 4 times thestandard deviation of the amplitude distribution. It was introduced to detect rareand very high amplitudes likely to be non-biological. The combination of adap-tive decision stage and robust feature extraction methods should allow the artificialsystem to cope fairly well with the remaining noise. For further selection, the datawhich, in the anesthesiologists’ opinions, produced MLAEP containing artefactswere excluded from this study.
A.4 The human classifier
The artificial system (TESPAR + MLP) uses the human expert (medic) to learnthe association between the EEG signal and DOA. Before judging the classifica-tion accuracy of the artificial system, we must assess how well the human modelclassifier performs. For this purpose, in addition to the original set (600 segments),each anesthesiologist was asked to reclassify a subset of 300 randomly selectedsegments. Both anesthesiologists were unaware that these control segments were
20

already presented before for classification. This allowed us to see how the samesegments are classified, by the same anesthesiologist, on two different occasions.Anesthesiologist A validated 284 segments, out of which 70.77% (201) segmentswere classified in the same way, while anesthesiologist B validated 246 segments,out of which 68.29% (168) segments were classified in the same way (Fig. A.1).We considered these scores as a measure of self-consistency for the human experts.In Table 1 the confusion matrix of anesthesiologist A (YH−h) shows in more detailthe difference in classification behavior. It shows, in percentage, how many timesan initial class i is classified as class j in the control classification. In the ideal case,when the human classifier is perfectly consistent with himself, the matrix should be100% on the diagonal.
There has been some degree of disagreement between the two human classifiers.The difference (more than 10%) in the number of segments rejected by the anes-thesiologists was an indication that they perform the classification differently. Wetested to what degree they agreed with each other (Table A.1), and we found that in61.83% of the cases they assigned the same segment to the same DOA condition.Segments that were considered to contain artifacts by any of the anesthesiologistswere eliminated from this analysis. Table A.1 shows that the second anesthesiolo-gist tends to assign deeper DOA levels in comparison to the first anesthesiologist.
Acknowledgments
We gratefully acknowledge the financial support from the Hertie Foundation, threegrants of the Romanian Government (Human Resources Program RP-5/2007 con-tract 1/01.10.2007 and Ideas Program ID 48/2007 contract 204/01.10.2007 both fi-nanced by MECT/UEFISCSU, and Partnerships Program contract 11039/18.09.2007financed by MECT/ANCS), a grant for the ”Max Planck - Coneural Partner Group”,andthe EU (EU project GABA-FP6-2005-NEST-Path-043309). We want to thank Prof.Wolf Singer, Diek Wheeler and Ovidiu Jurjut for useful discussions and commentson the manuscript.
Conflict of Interest Statement
None declared.
21

References
[1] P. S. Sebel, T. A. Bowdle, M. M. Ghoneim, I. J. Rampil, R. E. Padilla, T. J.Gan, K. B. Domino, The incidence of awareness during anesthesia: a multi-center United States study, Anesth Analg 99 (3) (2004) 833–9.
[2] P. S. Myles, K. Leslie, J. McNeil, A. Forbes, M. T. V. Chan, Bispectral indexmonitoring to prevent awareness during anaesthesia: the B-Aware randomisedcontrolled trial, Lancet 363 (9423) (2004) 1757–63.
[3] S. Pockett, Anesthesia and the electrophysiology of auditory consciousness,Conscious Cogn 8 (1) (1999) 45–61.
[4] J. C. Drummond, Monitoring depth of anesthesia: with emphasis on the appli-cation of the bispectral index and the middle latency auditory evoked responseto the prevention of recall, Anesthesiology 93 (3) (2000) 876–82.
[5] S. Kreuer, A. Biedler, R. Larsen, S. Altmann, W. Wilhelm, Narcotrend mon-itoring allows faster emergence and a reduction of drug consumption inpropofol-remifentanil anesthesia, Anesthesiology 99 (1) (2003) 34–41.
[6] R. E. Anderson, J. G. Jakobsson, Entropy of EEG during anaesthetic induc-tion: a comparative study with propofol or nitrous oxide as sole agent, Br JAnaesth 92 (2) (2004) 167–170.
[7] F. Weber, H. Hollnberger, J. Weber, Electroencephalographic Narcotrend In-dex monitoring during procedural sedation and analgesia in children, PaediatrAnaesth 18 (9) (2008) 823–830.
[8] P. Martorano, E. Facco, G. Falzetti, P. Pelaia, Spectral entropy assessmentwith auditory evoked potential in neuroanesthesia, Clin Neurophysiol 118 (3)(2007) 505–512.
[9] C. Thornton, R. M. Sharpe, Evoked responses in anaesthesia, Br J Anaesthesia81 (1998) 771–781.
[10] E. W. Jensen, A. Nebot, P. Caminal, S. W. Henneberg, Identification of causalrelations between haemodynamic variables, auditory evoked potentials andisoflurane by means of fuzzy logic, Br J Anaesth 82 (1) (1999) 25–32.
[11] I. J. Rampil, A primer for EEG signal processing in anesthesia, Neuropsy-chobiology 89 (4) (1998) 980–1002.
[12] N. Burch, Period analysis of the EEG on a general-purpose digital computer,in: Ann N Y Acad Sci 1964, Vol. 115, 1964, pp. 827–43.
[13] F. F. Klein, A waveform analyzer applied to the human EEG, IEEE TransBiomed Eng 23 (3) (1976) 246–52.
[14] T. K. Gregory, D. C. Pettus, An electroencephalographic processing algorithmspecifically intended for analysis of cerebral electrical activity, J Clin Monit2 (3) (1986) 190–7.
[15] H. Litvan, E. W. Jensen, M. Revuelta, S. W. Henneberg, P. Paniagua, J. M.Campos, P. Martnez, P. Caminal, J. M. V. Landeira, Comparison of auditoryevoked potentials and the A-line ARX index for monitoring the hypnotic levelduring sevoflurane and propofol induction, Acta Anaesthesiol Scand 46 (3)(2002) 245–251.
[16] A. Lehmann, J. Boldt, E. Thaler, S. Piper, U. Weisse, Bispectral index in
22

patients with target-controlled or manually-controlled infusion of propofol,Anesth Analg 95 (3) (2002) 639–44, table of contents.
[17] K. Hirota, Special cases: ketamine, nitrous oxide and xenon, Best Pract ResClin Anaesthesiol 20 (1) (2006) 69–79.
[18] K. Kanata, S. Sakura, H. Kushizaki, T. Nakatani, Y. Saito, Effects of epiduralanesthesia with 0.2% and 1% ropivacaine on predicted propofol concentra-tions and bispectral index values at three clinical end points, J Clin Anesth18 (6) (2006) 409–414.
[19] G. Schneider, A. W. Gelb, B. Schmeller, R. Tschakert, E. Kochs, Detection ofawareness in surgical patients with EEG-based indices–bispectral index andpatient state index, Br J Anaesth 91 (3) (2003) 329–335.
[20] M. Messner, U. Beese, J. Romstock, M. Dinkel, K. Tschaikowsky, The bis-pectral index declines during neuromuscular block in fully awake persons,Anesth Analg 97 (2) (2003) 488–91.
[21] I. F. Russell, The Narcotrend ’depth of anaesthesia’ monitor cannot reliablydetect consciousness during general anaesthesia: an investigation using theisolated forearm technique, Br J Anaesth 96 (3) (2006) 346–352.
[22] A. Schultz, M. Siedenberg, U. Grouven, T. Kneif, B. Schultz, Comparison ofNarcotrend Index, Bispectral Index, spectral and entropy parameters duringinduction of propofol-remifentanil anaesthesia, J Clin Monit Comput 22 (2)(2008) 103–111.
[23] Y. Freund, R. E. Schapire, Experiments with a new boosting algorithm, in:L. Saitta (Ed.), ICML 1996, Morgan Kaufmann, 1996, pp. 148–156.
[24] R. A. King, T. C. Phipps, A low-power, low-complexity, low-cost TESPAR-based architecture for the real-time classification of speech and other band-limited signals, in: ICSPAT 2000, 2000.
[25] R. A. King, W. Glossing, Electronic Letters 14 (15) (1978) 456–457.[26] H. H. Jasper, The ten-twenty electrode system of the international federation,
Electroencephalography and Clinical Neurophysiology 10 (1958) 371–375.[27] D. A. Chernik, D. Gillings, H. Laine, J. Hendler, J. M. Silver, A. B. Davidson,
E. M. Schwam, J. L. Siegel, Validity and reliability of the Observer’s Assess-ment of Alertness/Sedation Scale: study with intravenous midazolam, J ClinPsychopharmacol 10 (4) (1990) 244–251.
[28] R. A. King, T. C. Phipps, Shannon, TESPAR and approximation strategies,Computers & Security 18 (5) (1999) 445–453.
[29] P. Norvig, S. Russell, Artificial Intelligence: A Modern Approach, Prentice-Hall, 1995.
[30] C. Robert, P. Karasinski, C. D. Arreto, J. F. Gaudy, Monitoring anesthesiausing neural networks: a survey, J Clin Monit Comput 17 (3-4) (2002) 259–67.
[31] S. W. Smith, Scientist and Engineer’s Guide to Digital Signal Processing,California Technical Publishing, 1997.
[32] D. E. Rumelhart, G. E. Hinton, Learning representations by backpropagatingerrors, Nature 323 (1986) 533–536.
[33] K. Tumer, J. Ghosh, Error correlation and error reduction in ensemble classi-
23

fiers, Electronic Letters 8 (3) (1996) 385 – 404.[34] G. Brown, J. Wyatt, R. Harris, X. Yao, Diversity creation methods: a survey
and categorisation, Information Fusion 6 (1) (2005) 5–20.[35] L. Breiman, Bagging predictors, Machine Learning 24 (2) (1996) 123 – 140.[36] R. E. Anderson, U. Sartipy, J. G. Jakobsson, Use of conventional ECG elec-
trodes for depth of anaesthesia monitoring using the cerebral state index: aclinical study in day surgery, Br J Anaesth 98 (5) (2007) 645–648.
[37] M. S. Avidan, L. Zhang, B. A. Burnside, K. J. Finkel, A. C. Searleman, J. A.Selvidge, L. Saager, M. S. Turner, S. Rao, M. Bottros, C. Hantler, E. Jacob-sohn, A. S. Evers, Anesthesia awareness and the bispectral index, N Engl JMed 358 (11) (2008) 1097–1108.
[38] H. Viertio-Oja, V. Maja, M. Sarkela, P. Talja, N. Tenkanen, H. Tolvanen-Laakso, M. Paloheimo, A. Vakkuri, A. Yli-Hankala, P. Merilainen, Descrip-tion of the entropy algorithm as applied in the Datex-Ohmeda S/5 EntropyModule, Acta Anaesthesiol Scand 48 (2) (2004) 154–161.
[39] G. Buzsaki, Rhythms of the brain, Oxford University Press, 2006.[40] P. Anderer, S. Roberts, A. Schlogl, G. Gruber, G. Klosch, W. Herrmann,
P. Rappelsberger, O. Filz, M. J. Barbanoj, G. Dorffner, B. Saletu, Artifact pro-cessing in computerized analysis of sleep EEG - a review., Neuropsychobiol-ogy 40 (3) (1999) 150–157.
24