eea core set of indicators
TRANSCRIPT

EEA Technical report No 1/2005
EEA core set of indicators
Guide
ISSN 1725-2237

European Environment Agency
EEA core set of indicators — Guide
(EEA Technical report No 1/2005 — ISSN 1725-2237)
Luxembourg: Office for Official Publications of the European Communities
2005 — 38 pp. — 21 x 29.7 cm

EEA core set of indicators
Guide
EEA Technical report No 1/2005

Cover design: EEA
Layout: EEA
Legal notice
The contents of this publication do not necessarily reflect the official opinions of the European
Commission or other institutions of the European Communities. Neither the European Environment
Agency nor any person or company acting on behalf of the Agency is responsible for the use that
may be made of the information contained in this report.
All rights reserved
No part of this publication may be reproduced in any form or by any means electronic or mechanical,
including photocopying, recording or by any information storage retrieval system, without the
permission in writing from the copyright holder. For rights of translation or reproduction please
contact EEA project manager Ove Caspersen (address information below).
Information about the European Union is available on the Internet. It can be accessed through the
Europa server (http://europa.eu.int).
Luxembourg: Office for Official Publications of the European Communities, 2005
ISBN 92-9167-757-4
ISSN 1725-2237
© EEA, Copenhagen, 2005
European Environment AgencyKongens Nytorv 61050 Copenhagen KDenmark
Tel.: +45 33 36 71 00Fax: +45 33 36 71 99
Web: www.eea.eu.intEnquiries: www.eea.eu.int/enquiries

5
Contents
Contents
Foreword ........................................................................................... 6
1. EEA core set of indicators: purpose, scope and users ................. 8Purpose ...........................................................................................8Scope ...........................................................................................8Users ...........................................................................................9
2. EEA CSI is supported by a dynamic process .............................. 10Quality assurance and update ............................................................... 10EEA indicator-related activities .............................................................. 11Role of stakeholders ............................................................................ 12
Annex 1: EEA core set of indicators ................................................ 13
Annex 2: Calendar of indicator publishing ....................................... 14
Annex 3: EEA core set of indicators in the DPSIR framework and by type ....................................................................... 15
Annex 4: Policy questions related to the EEA core set of indicators . 16
Annex 5: Data sets used in EEA core set of indicators ..................... 18
Annex 6: EEA core set indicators linkages to other international indicators ......................................................................... 25
Annex 7: Main EEA indicator-related products by environmental issue and sector ................................................................ 34
Annex 8: Quality evaluation of the EEA core set of indicators .......... 36

EEA core set of indicators — Guide6
The EEA management board approved the core set of indicators in March 2004. The set has been established for three main purposes: to provide a manageable and stable basis for indicator-based reporting by the EEA; to prioritise improvements in the quality and geographical coverage of data flows, especially Eionet priority data flows; and, to streamline EEA/Eionet’s contributions to other European and global indicator initiatives, for example, EU structural indicators, EU sustainable development indicators and OECD environment indicators.
This guide provides information on the quality of the 37 indicators in the EEA core set. Its primary role is to support improved implementation of the core set in the EEA, European topic centres and the European environment information and observation network (Eionet). In parallel, it is aimed at helping users outside the EEA/Eionet system make best use of the indicators in their own work. It is hoped that the guide will promote cooperation on improving indicator methodologies and data quality as part of the wider process to streamline and improve environmental reporting in the European Union and beyond.
The indicators in the core set were selected from a much larger set on the basis of criteria widely used elsewhere in Europe and by the OECD. The criteria are listed in Section 2.1. While all the criteria are important when considering indicators, particular attention has been paid to relevance to policy priorities, objectives and targets; the availability of high-quality
data over both time and space, and the application of well-founded methods for indicator calculation.
The core set will be reviewed on a regular basis with stakeholders in Eionet. The trend assessment for each of the 37 indicators will be updated in line with data flow cycles and published on the web, as well as selectively in several EEA publications, including the EEA Signals report.
This guide should be used in conjunction with the core set of indicators (CSI), which is available on the EEA's web site at http://www.eea.eu.int/coreset. This is the point of dissemination for:
• the specification of each of the indicators in the core set;
• links to the updated assessments;
• information on changes to the core set made under the regular review process;
• improvements through ongoing work on data quality and methodological development.
EEA hopes this guide will be of use to all those involved in indicator reporting as well as of interest for all EEA clients and cooperating parties.
European Environment Agency
March 2005
Foreword

7Definitions
Definitions
Indicator An indicator is a measure, generally quantitative, that can be used to illustrate and communicate complex phenomena simply, including trends and progress over time. ‘An indicator provides a clue to a matter of larger significance or makes perceptible a trend or phenomenon that is not immediately detectable. An indicator is a sign or symptom that makes something known with a reasonable degree of certainty. An indicator reveals, gives evidence, and its significance extends beyond what is actually measured to a larger phenomenon of interest’ (IETF, 1996).
EEA core set of indicators
The core set supports EU policy priorities, is regularly updated, and is of known quality. It is based on nine selection criteria (see Section 2.1.) and approved by EEA member countries.
Other EEA indicators
The EEA also works with other indicators for its assessments. Some of these are developed for eventual inclusion in the core set (such as chemicals, material flows); others for specific processes such as to support reporting on progress with sectoral integration (transport, energy, agriculture).
Indicator profile
The indicator profile contains information on the indicator specification (see below) plus assessment of the latest trends for the indicator, including supporting graphics and data. A standard set of information from the complete profile for each indicator is available on the EEA's web site.
Indicator specification
The indicator specification contains general information that explains aspects that are relatively static over time; these include the indicator name, its policy relevance, data sources, methodologies and guidelines for presentation of the assessment.
DPSIR The work of the EEA is built around a conceptual framework know as the DPSIR assessment framework. DPSIR stands for ‘driving forces, pressures, states, impacts and responses’. DPSIR builds on the existing OECD model and offers a basis for analysing the interrelated factors that impact on the environment. Reference: http://org.eea.eu.int/documents/brochure/brochure_reason.html.
Type of indicator
The EEA classifies its indicators according to a typology: A = descriptive indicator, B = performance indicator, C = eco-efficiency indicator, D = policy effectiveness indicator, E = total welfare indicator.
Policy question A short question related to EU priority policy objectives. The key message, indicator trend and assessment should answer the policy question.
Target A quantitative value which usually underpins a European Union or other international policy objective. The target usually has a time deadline that should be met through the design and implementation of measures by countries.
Threshold A threshold is a point or level which if being approached or exceeded then policy or other actions should be considered in order to alleviate adverse impacts either on the environment or people’s health.
Data set name Name of original data set, which contains national data delivered by countries to be used in the indicator construction.
Data source Name of institution, which owns the original data set.
Reporting obligations of the data set
Name of reporting obligation (legal or moral) under which countries deliver their national data. EEA has developed a database known as the reporting obligations database (ROD) that contains such information http://rod.eionet.eu.int/.
Glossary for indicator management: http://ims.eionet.eu.int/IMS/About/references.

EEA core set of indicators — Guide8
Purpose
In 2004, the EEA identified a core set of 37 indicators (see list in Annex 1).
The purpose of the core set of indicators is to:
• prioritise improvements in the quality and coverage of data flows, which will enhance comparability and certainty of information and assessments;
• streamline contributions to other indicator initiatives in Europe and beyond;
• provide a manageable and stable basis for indicator-based assessments of progress against environmental policy priorities.
Scope
The establishment and development of the EEA core set of indicators has been guided by the need to identify a small number of policy-relevant indicators that are stable, but not static, and that give answers to selected priority policy questions. They should, however, be considered alongside other information if they are to be fully effective in environmental reporting.
The core set covers six environmental themes (air pollution and ozone depletion, climate change, waste, water, biodiversity and terrestrial environment) and four sectors (agriculture, energy, transport and fisheries). All the topics address EU policy priorities, as described in the EEA strategy (1).
Some other relevant priorities (chemicals, noise, industry, consumption, material flows) have not yet been included because
indicators are insufficiently developed, but this will be the main focus for the future development of the core set. The EEA has no plans to develop a specific set of environment and health indicators but will continue to contribute to other activities in this area, notably by the WHO and the European Commission.
Each indicator in the core set can be positioned in the DPSIR framework, (D = driving forces, P = pressures, S = states, I = impacts, R = responses) but they are not spread in a balanced and comprehensive way (see Annex 3). The primary aim with the core set is to focus on priorities and be policy-relevant, not to provide the basis for integrated assessment across DPSIR.
The indicators are also classified by type (A = descriptive indicator, B = performance indicator, C = eco-efficiency indicator, D = policy effectiveness indicator, E = total welfare indicator). All of the indicators in the core set are either descriptive or performance based and one of the challenges for the future will be to develop more and better indicators of eco-efficiency, policy effectiveness and welfare (see Annex 3). Issues like the value and degradation of natural capital, global resource flows, cost-effectiveness and the intergenerational and environmental aspects of the quality of life, will be considered in this regard.
Each indicator has its own storyline that goes through the indicator profile (see definition in the beginning and link to Indicator profile template: http://ims.eionet.eu.int/IMS/About/references). All parts of the profile are connected and support the answers to policy questions (see Annex 4) in a coherent way from the gathering of data to the application of methodologies, to the trend calculation, through final presentation and assessment of the indicator. The profile
1 Available at http://org.eea.eu.int/documents/strategy-docs/strategy_web-en.pdf.
1. EEA core set of indicators: purpose, scope and users
9EEA core set of indicators: purpose, scope and users
also includes an evaluation of the overall quality of the indicator, based on the nine criteria described in Section 2.1.
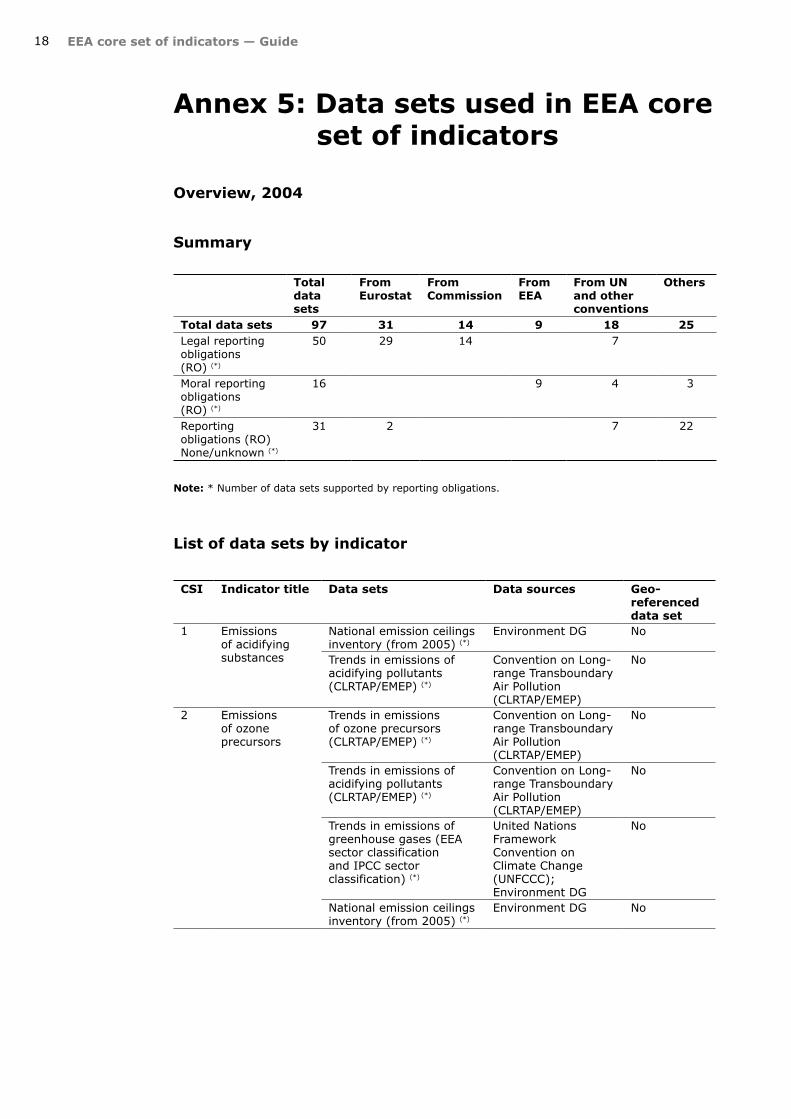
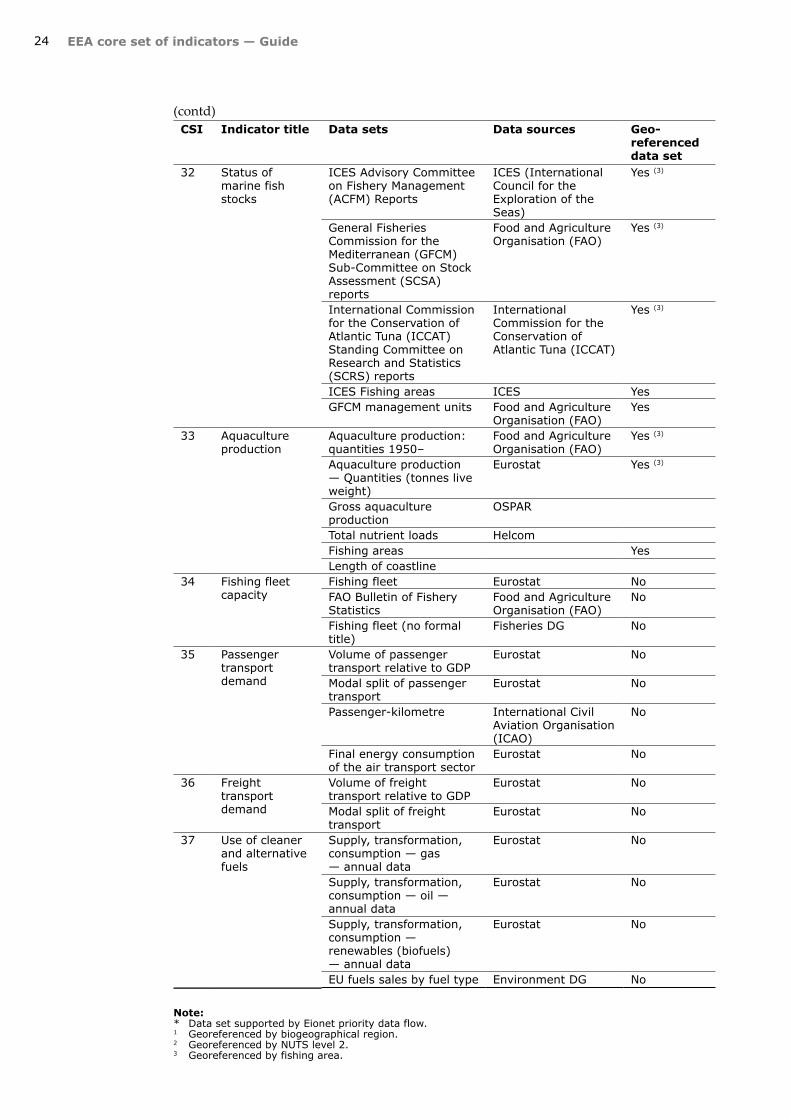
For the core set, there are 40 different sources of data and around 100 different data sets (see Annex 5). Eurostat is the main data source with about 30 data sets followed by the Environment DG with about 14 data sets, and the EEA is the source for nine data sets on air, water, soil, land cover and designated areas. Many times the same data sets are used for different indicators to allow the issue to be looked at from several angles, for different purposes and by different users.
Many of the indicators in the EEA core set are also used in indicator processes being implemented elsewhere, notably at the European Commission, OECD, and WHO. Annex 6 describes these processes and provides an analysis of how each of the core set indicators map to similar indicators found under other processes.
Users
The core set of indicators is designed for various users, who have a variety of information needs.
Its assessments and key messages are targeted mainly at policy makers at the EU and national level who can use the outcomes to inform progress with their policies. EU and national institutions can also use the core set to support streamlining of data flows at the EU level.
Environmental experts can use it as a tool for their own work by using the underlying data and methodologies to do their own analysis. They can also look at the set critically, give feedback and so contribute to future EEA core set developments.
General users will be able to access the core set on the web in an easily understandable way, and use available tools and data to do their own analyses and presentations.

EEA core set of indicators — Guide10
2. EEA CSI is supported by a dynamic process
1. Policy relevance This criterion is checked against identified objectives in EU and other international policy documents and reviewed in consultation with countries.
2. Progress towards targets This criterion becomes relevant where quantitative or qualitative targets linked to objectives have been set in policy documents.
3. Available and routinely collected data This criterion is based on the extent to which data requirements are supported by reporting obligations signed up to by countries. Both legal and non-legal obligations are taken into account. This criterion also supports streamlining of data flows and ensures that the indicator can be updated regularly.
4. and 5. Spatial and temporal coverage These criteria are based on the actual coverage of reported data compared with the target coverage. The EEA aims to cover all of its 31 member countries, unless the focus of the indicator is different (for example, where indicators are based on the implementation of directives by the EU-25). The aim is also to have time trends available as far back as possible.
6. National scale and representativeness of data This criterion enables benchmarking of countries’ performances. The EEA therefore works with countries to obtain common understanding on the data sources used for calculating indicators and on methodologies used for benchmarking.
7. Understandability of indicators This criterion focuses on clear definition of the indicator and appropriate assessment and presentation. Contradictory messages should not occur (crosschecking across the core set ensures this); if any do occur, they should be explained.
8. Methodologically well founded This criterion can be met through a clear description of the methodology and formulae used, with appropriate scientific references. This criterion is more likely to be satisfied if a similar indicator is also being used in other indicator initiatives at the international level.
9. EU priority policy issues This criterion is applied to ensure that indicators map to priorities for policy and in the EEA management plan. The priority issues should also frame the core set as a whole, be the basis for balance across the core set and support its regular review.
Quality assurance and update
The core set selection has been based on criteria widely used elsewhere in the EU and OECD, while accommodating EEA needs and management practices.
Criteria for selection of the EEA core set of indicators

11
Continuing evaluation of the indicators against these criteria will be an important basis for future quality assurance of the core set (see quality overview of core set indicators by topic and in the specification of each indicator in http://www.eea.eu.int/coreset). Attention will be paid to some topics that still need improvement (biodiversity, terrestrial, chemicals, noise, ecological water quality, etc.) and to some aspects of individual indicators that seem to be weak (such as spatial coverage of the indicators on passenger transport demand and gross nutrient balance, or the methodology for answering policy questions on consumption and production of ozone-depleting substances). More transparency is also needed on the data sources and the reporting obligations behind the data, to ensure the most cost-effective use of national data and to enable more effective country benchmarking exercises. These criteria will also be used in future to decide whether new indicators should be added to the core set or existing ones deleted from it. The Agency will review the core set regularly with its member countries and other stakeholders. The outcomes and actions resulting from these reviews will be subject to endorsement by the EEA management board.
EEA indicator-related activities
The EEA has several indicator-related activities in its management plan, ranging from the methodological and development issues to publishing of indicators. Indicators are published as contribution to other EU indicator activities (TERM, IRENA, EU headline indicators), and as part of assessments in topic reports. Core set indicators will be regularly published in the EEA indicator-based report EEA Signals and on the web (see calendar of indicator publishing in Annex 2 and published EEA indicator-related reports by topics in Annex 7).
Web publishing and indicator management
The EEA has published indicators on web since 2001 (http://themes.eea.eu.int/indicators/). The indicators have
EEA CSI is supported by a dynamic process
been updated as new data have become available. Web users get information on the underlying data and key message for each indicator, as well as the complete assessment and graphical information underpinning the message. Additional background documentation is available for those who wish to obtain a fuller picture.
For the core set, EEA is developing a web-based indicator management service that extends the above concept. This application allows thematic and sectoral experts to manage the EEA core set and facilitates communication in their wider work on indicators. The specification of the indicator and its assessment is stored in the indicator management service http://ims.eionet.eu.int/IMS/. The relationship between the data required for the indicator and reporting obligations are provided from the EEA data service and from the reporting obligations database (ROD). This system-based approach to linking directly to the data provided by countries will provide a transparent audit trail enabling efficient information flows and tracking of the quality of data from the original source in countries to final presentation at the European level.
The indicator management service (IMS) will be fully operational by the end of 2005, and will support the following indicator tasks:
• drafting, reviewing (including consultation with countries), quality assurance and publishing (including dissemination calendar) of all indicators in the core set;
• downloading of indicator data sets for own use and calculation;
• discussion forums on indicator outcomes and to support regular review processes;
• glossary for management of the core set indicators;
• access to procedural guidelines and templates.

EEA core set of indicators — Guide12
Indicators and reporting obligations as part of a shared information system
Indicators are a useful tool for prioritising which environmental information is most useful as part of a shared European environmental information system.
The indicator approach assumes that data is only requested from member countries if it is policy-relevant and supplies the basis for environmental assessment. Many data requests occur because countries have made legally binding commitments. This obligation-based reporting — on the state of the environment, compliance or policy effectiveness — is also often relevant for assessing environmental progress (and is widely used by the EEA for its indicators) but in some cases it can be outdated because the nature of problems have changed since the legislation was adopted. This type of reporting therefore needs to be complemented by reporting of data through other channels leading to more relevant and demand-driven environmental information. This has been the approach taken by the EEA when requesting additional data from countries in Eionet — a good example is the Corine Land Cover 2000 dataset. Both reporting approaches result in a common pool of environmental information — some obligation-driven, some responding to new requirements based on most recent policy demands, which have not yet found their way into legislation — which is policy relevant and which is seen to be used.
Future developments on the integration and use of environmental data will be strongly influenced within the ‘Infrastructure for spatial information in Europe’ (Inspire) initiative, which seeks to trigger the creation of a European spatial information infrastructure, that delivers to the users integrated spatial information services. These services should allow the users to identify and access spatial or geographical information from a wide range of sources, from the local level to the global level, in an inter-operable way for a
variety of uses. Over time, environmental data will be fully integrated within the Inspire infrastructure. The establishment by 2008 of a European capacity for global monitoring of environment and security (GMES) will further contribute to securing the provision of environmental information. Such a capacity will encompass a wide range of information sources, making full use of Earth-based in-situ monitoring capacities as well as airborne and space-based Earth observation. Strong links between Inspire and GMES will ensure that new monitoring and observation capacities established by the latter will be integrated, accessible and usable within the framework of Inspire.
Several international organisations have activities to develop frameworks and indicator sets for environmental issues, environment-sector integration and sustainable development issues. Annex 6 contains a brief description of international indicator activities and an overview of the linkage between the EEA core set indicators and similar indicators in the international sets. The EEA aims to contribute, with the core set of indicators, to the wider picture in the indicator area with a streamlining of data flows and an improving quality of indicators.
Role of stakeholders
National perspectives are very important for the development, publication and use of the core set of indicators. The EEA has already run two consultation processes with countries and is providing up-to-date information about developments.
A combination of formal (consultation, review of core set) and informal (voluntary contributions, country tests) involvement of countries supports the general processes of core set development, using meetings of Eionet expert thematic and national focal point groups, the scientific committee and the EEA management board. The development of the indicator management service will host a forum for discussion.

13
Annex 1: EEA core set of indicators
Theme CSI Indicator title Specification version
Air pollution and ozone depletion
1 Emissions of acidifying substances 20042 Emissions of ozone precursors 20043 Emissions of primary particulates and
secondary particulate precursors2004
4 Exceedance of air quality limit values in urban areas
2004
5 Exposure of ecosystems to acidification, eutrophication and ozone
2004
6 Consumption of ozone-depleting substances 2004Biodiversity 7 Threatened and protected species 2004
8 Designated areas 20049 Species diversity 2004
Climate change 10 Greenhouse gas emissions and removals 200411 Projections of greenhouse gas emissions and
removals and policies and measures2004
12 Global and European temperature 200413 Atmospheric greenhouse gas concentrations 2004
Terrestrial 14 Land take 200415 Progress in management of contaminated sites 2004
Waste 16 Municipal waste generation 200417 Generation and recycling of packaging waste 2004
Water 18 Use of freshwater resources 200419 Oxygen-consuming substances in rivers 200420 Nutrients in freshwater 200421 Nutrients in transitional, coastal and marine
waters2004
22 Bathing water quality 200423 Chlorophyll in transitional, coastal and marine
waters2004
24 Urban wastewater treatment 2004Agriculture 25 Gross nutrient balance 2004
26 Area under organic farming 2004Energy 27 Final energy consumption 2004
28 Total energy intensity 200429 Total energy consumption 200430 Renewable energy consumption 200431 Renewable electricity 2004
Fisheries 32 Status of marine fish stocks 200433 Aquaculture production 200434 Fishing fleet capacity 2004
Transport 35 Passenger transport demand 200436 Freight transport demand 200437 Use of cleaner and alternative fuels 2004
Annex 1: EEA core set of indicators
Overview, 2004

EEA core set of indicators — Guide14
Annex 2: Calendar of indicator publishing
CSI Indicator title Publishing plan Frequency
Air pollution and ozone depletion1 Emissions of acidifying substances November 2005 Yearly2 Emissions of ozone precursors November 2005 Yearly3 Emissions of primary particulates and secondary
particulate precursorsNovember 2005 Yearly
4 Exceedance of air quality limit values in urban areas
November 2005 Yearly
5 Exposure of ecosystems to acidification, eutrophication and ozone
November 2005 Yearly
6 Consumption of ozone-depleting substances November 2005 Yearly Biodiversity7 Threatened and protected species December 2007 5-yearly8 Designated areas December 2005 Yearly9 Species diversity December 2004 5-yearly Climate change
10 Greenhouse gas emissions and removals June 2005 Yearly11 Projections of greenhouse gas emissions and
removals and policies and measuresJune 2005 Yearly
12 Global and European temperature June 2005 Yearly13 Atmospheric greenhouse gas concentrations Terrestrial
14 Land take June 2005 10-yearly15 Progress in management of contaminated sites December 2005 Yearly Waste
16 Municipal waste generation December 2005 2-yearly17 Generation and recycling of packaging waste December 2005 Yearly Water
18 Use of freshwater resources September 2005 Yearly19 Oxygen-consuming substances in rivers September 2005 Yearly20 Nutrients in freshwater September 2005 Yearly21 Nutrients in transitional, coastal and marine
watersSeptember 2005 Yearly
22 Bathing water quality September 2005 Yearly23 Chlorophyll in transitional, coastal and marine
watersSeptember 2005 Yearly
24 Urban wastewater treatment September 2005 Yearly Agriculture
25 Gross nutrient balance June 2008 3-yearly26 Area under organic farming April 2005 Yearly Energy
27 Final energy consumption December 2005 Yearly28 Total energy intensity December 2005 Yearly29 Total energy consumption December 2005 Yearly30 Renewable energy consumption December 2005 Yearly31 Renewable electricity December 2005 Yearly Fisheries
32 Status of marine fish stocks September 2005 Yearly33 Aquaculture production September 2005 Yearly34 Fishing fleet capacity September 2005 Yearly Transport
35 Passenger transport demand December 2005 Yearly36 Freight transport demand December 2005 Yearly37 Use of cleaner and alternative fuels December 2005 Yearly
Overview, 2004

15Annex 3: EEA core set of indicators in the DPSIR framework and by type
Annex 3: EEA core set of indicators in the DPSIR framework and by type
D = Driving force indicatorP = Pressure indicatorS = State indicatorI = Impact indicatorR = Response indicator
A = Descriptive indicatorB = Performance indicatorC = Efficiency indicatorD = Policy effectiveness indicatorsE = Total welfare indicator
Further description can be found in EEA report: Environmental indicators: Typology and overview. Technical report No 25, 1999 (http://reports.eea.eu.int/TEC25/en).
Overview, 2004
D P S I R A B C D E
Air quality and ozone depletion
4 2 6
Biodiversity 1 1 1 3
Climate change 2 2 1 3
Terrestrial 1 1 2
Waste 1.5 0.5 1.5 0.5
Water 1 5 1 6 1
Agriculture 1 2
Energy 3 2 2 3
Fishery 2 1 3
Transport 2 1 2 1
Total 7 9.5 10.5 3 7 22.5 14.5

EEA core set of indicators — Guide16
Annex 4: Policy questions related to the EEA core set of indicators
Overview, 2004
CSI Policy questionK = Key policy questionS = Specific policy question
Indicator title
1 K:
S:
What progress is being made in reducing emissions of acidifying pollutants across Europe?How do different sectors and processes contribute to emissions of acidifying pollutants?
Emissions of acidifying substances
2 K:
S:
What progress is being made in reducing emissions of ozone precursors across Europe?How do different sectors and processes contribute to emissions of ozone precursors?
Emissions of ozone precursors
3 K:
S:
What progress is being made in reducing emissions of particulates (PM10) and their precursors across Europe?How do different sectors and processes contribute to the emissions of PM10 and their precursors?
Emissions of primary particulates and secondary particulate precursors
4 K: What progress is being made towards to the limit values for SO2, NO2 and PM10 and the target values for ozone as defined in the AQ-FWD and its daughter directives in the EEA-31 as a whole?
Exceedance of air quality limit values in urban areas
5 K: What is the progress towards AQ limit values? (Exceedances of critical loads ecosystems)
Exposure of ecosystems to acidification, eutrophication, and ozone
6 K: Are ozone-depleting substances being phased out according to the agreed schedule?
Consumption of ozone-depleting substances
7 K: S:
Will the loss of biodiversity be halted by 2010?What measures are being taken to conserve or restore biodiversity?
Threatened and protected species
8 K:
S:
S:
S:
What measures are being taken to conserve or restore biodiversity?What measures are being taken to conserve or restore biodiversity at national level?What measures are being taken to conserve or restore biodiversity at the EU level? Are these measures effective in reaching the objectives?
Designated areas
9 K: S:
What is the state and trend of biodiversity?What is the state and trend of birds, butterflies and mammals related to certain ecosystem types?
Species diversity
10 K:
S:
What is the progress in reducing GHG emissions towards the Kyoto Protocol targets in Europe?What are the emission changes by sector?What are the emission changes by greenhouse gases?
Greenhouse gas emissions and removals
11 K:
S:
What is the projected European progress (to 2010) in GHG emissions reduction towards the Kyoto Protocol targets: with current domestic policies and measures, with additional domestic policies and measures and with additional use of the Kyoto mechanisms?What is the projected European progress (to 2010) in GHG by sectors?
Projections of greenhouse gas emissions and removals and policies and measures
12 K:
S:
Will the global average temperature increase stay within the 2 °C target and the rate of global average temperature increase will stay within the 0.2 °C per decade target?Will the European average temperature increase stay within the 2 °C target and will, the rate of European average temperature increase stay within 0.2 °C per decade?
Global and European temperature
13 K: Will GHG concentration remain below levels needed to limit global temperature rise to 2 °C or less; typically this requires GHG concentrations to stay below 550 ppm CO2-equivalents in the long term?
Atmospheric greenhouse gas concentrations

17Annex 4: Policy questions related to the EEA core set of indicators
14 K: What is the specific footprint of land take by built-up areas and its development/increasing in relation to general trends and to the European integration policies?
Land take
15 K:
S:
S:
S:
S:
How well is the problem of contaminated sites being addressed (clean-up of historical contamination and prevention of new contamination)?What are the sectors contributing to soil contamination and what are their contributions?How much progress is being achieved in the management and control of local soil contamination?What are the main contaminants that affect soil and groundwater in and around contaminated sites?How much is being spent on cleaning-up soil contamination and what is the share of public budgets?
Progress in management of contaminated sites
16 K: Are we reducing the generation of municipal waste? Municipal waste generation
17 K: S:
Are we preventing the generation of packaging waste?Do we manage the generated waste (packaging) in a sustainable way?
Generation and recycling of packaging waste
18 K: S:
Is the abstraction rate of water-use sustainable?Is the use of water by sectors sustainable?
Use of freshwater resources
19 K: Is the pollution of rivers by organic matter decreasing? Oxygen-consuming substances in rivers
20 K:
K:
Are nutrient concentrations in our surface waters decreasing?Are we reducing the impact of nitrate on our groundwaters?
Nutrients in freshwater
21 K: Are nutrient concentrations in our surface waters decreasing?
Nutrients in transitional, coastal and marine waters
22 K: Is bathing water quality improving? Bathing water quality23 K: Is eutrophication in European surface waters
decreasing?Chlorophyll in transitional, coastal and marine waters
24 K:
S:
How effective are existing policies in reducing discharges of nutrients and organic matter?Is the Urban WasteWater Treatment Directive (91/271/ECC) being implemented in Member States?
Urban wastewater treatment
25 K: How are emissions from agriculture developing?Is the environmental impact of agriculture improving?
Gross nutrient balance
26 K: What are the environmentally-relevant key trends in agricultural production systems?
Area under organic farming
27 K: Are we using less final energy? Final energy consumption
28 K: Are we decoupling energy consumption from economic growth?
Total energy intensity
29 K: Are we switching to less polluting fuels to meet our energy consumption?
Total energy consumption
30 K: Are we switching to renewable energy sources? Renewable energy consumption
31 K: Are we switching to renewable energy sources to meet our electricity needs?
Renewable electricity
32 K: Is the use of commercial fish stocks sustainable? Status of marine fish stocks
33 K: S:
Is the current level of aquaculture sustainable? How is the environmental performance of aquaculture?
Aquaculture production
34 K: Is the size and capacity of the European fishing fleet being reduced?
Fishing fleet capacity
35 K:
S:
Is passenger transport demand being decoupled from economic growth?Is the percentage of passenger car transport in total inland passenger transport being reduced relative to other modes?
Passenger transport demand
36 K:
S:
Is freight transport demand being decoupled from economic growth? Is the percentage of goods transported by road being reduced relative to other modes?
Freight transport demand
37 K: Is the EU’s progress towards promoting cleaner and alternative fuels satisfactory?
Use of cleaner and alternative fuels
(contd) CSI Policy question
K = Key policy questionS = Specific policy question
Indicator title
EEA core set of indicators — Guide18
Annex 5: Data sets used in EEA core set of indicators
Overview, 2004
Summary
Total data sets
From Eurostat
From Commission
From EEA
From UN and other conventions
Others
Total data sets 97 31 14 9 18 25Legal reporting obligations (RO) (*)
50 29 14 7
Moral reporting obligations (RO) (*)
16 9 4 3
Reporting obligations (RO) None/unknown (*)
31 2 7 22
Note: * Number of data sets supported by reporting obligations.
List of data sets by indicator
CSI Indicator title Data sets Data sources Geo-referenced data set
1 Emissions of acidifying substances
National emission ceilings inventory (from 2005) (*)
Environment DG No
Trends in emissions of acidifying pollutants (CLRTAP/EMEP) (*)
Convention on Long-range Transboundary Air Pollution (CLRTAP/EMEP)
No
2 Emissions of ozone precursors
Trends in emissions of ozone precursors (CLRTAP/EMEP) (*)
Convention on Long-range Transboundary Air Pollution (CLRTAP/EMEP)
No
Trends in emissions of acidifying pollutants (CLRTAP/EMEP) (*)
Convention on Long-range Transboundary Air Pollution (CLRTAP/EMEP)
No
Trends in emissions of greenhouse gases (EEA sector classification and IPCC sector classification) (*)
United Nations Framework Convention on Climate Change (UNFCCC);Environment DG
No
National emission ceilings inventory (from 2005) (*)
Environment DG No

19Annex 5: Data sets used in EEA core set of indicators
3 Emissions of primary particulates and secondary particulate precursors
Trends in emissions of acidifying pollutants (CLRTAP/EMEP) (*)
Convention on Long-range Transboundary Air Pollution (CLRTAP/EMEP)
No
Trends in emissions of particulates
Convention on Long-range Transboundary Air Pollution (CLRTAP/EMEP)
No
RAINS Model CAFE baseline PM10 emissions estimates
IIASA No
National emission ceilings inventory (from 2005) (*)
Environment DG No
4 Exceedance of air quality limit values in urban areas
Settlements pan-Europe (STEU)
Eurostat Yes
Airbase (*) Environment DG YesQuestionnaire for annual reporting on ambient air quality assessment
Environment DG Yes
5 Exposure of ecosystems to acidification, eutrophication and ozone
Airbase ozone measurementsEMEP Chemical Coordinating Centre (CCC) ozone measurements EMEP Coordination Centre for Effects (CCE) critical thresholds and their exceedances European land use database (to be replaced from 2004 by Corine Land Cover) (*)
Yes
Yes
Yes
Yes
6 Consumption of ozone-depleting substances
Production of ozone depleting substances
UNEP (United Nations Environment Programme) Ozone Secretariat
No
Ozone-depleting substances — statistical fact sheet
Environment DG No
7 Threatened and protected species
IUCN Red List of Threatened Species
IUCN — World Conservation Union
No
Annexes of the EC 79/709 and 92/43 Directives
Environment DG Yes (1)
Annexes of Convention on the Conservation of European Wildlife and Natural Habitats (Bern Convention, 1979)
Convention on the Conservation of European Wildlife and Natural Habitats (Bern Convention)
Yes (1)
8 Designated areas
Nationally designated areas (CDDA) (*)
EEA Yes
Common database on designated areas (CDDA International)
UNEP/WCMC (World Conservation Monitoring Centre)
Yes
Conclusions of the Natura 2000 bio-geographic seminars
Environment DG Yes (1)
Natura 2000 database Environment DG Yes
(contd)CSI Indicator title Data sets Data sources Geo-
referenced data set

EEA core set of indicators — Guide20
9 Species diversity
Trends of bears Large Carnivore Initiative Council of Europe/WWF
No
Trends of wolves Large Carnivore Inititative Council of Europe/WWF
No
Trends of farmland birds European Bird Census Council, BirdLife International;Royal Society for the Protection of Birds
No
Trends of woodland, park and garden birds
European Bird Census Council, BirdLife International;Royal Society for the Protection of Birds
No
Trends of butterflies The Dutch Butterfly Conservation
No
10 Greenhouse gas emissions and removals
Trends in emissions of greenhouse gases (EEA sector classification and IPCC sector classification) (*)
United Nations Framework Convention on Climate Change (UNFCCC);Environment DG
No
11 Projections of greenhouse gas emissions and removals and policies and measures
National communications UNFCCC NoNational projections, policies and measures
Environment DG No
12 Global and European temperature
Global average monthly and annual temperature
Climatic Research Unit (CRU) University of East Anglia, UK
Yes
European average annual and monthly temperature, Based on CruTempV2 (CRU, KNMI)
KNMI (Netherlands Meteorological Institute)
Yes
Trends in annual, summer and winter temperature station data in Europe
KNMI (Netherlands Meteorological Institute)
Yes
Trends in the frequency of summer days (> 25 °C) and cold, and heat wave occurrence, based on station data in Europe
KNMI (Netherlands Meteorological Institute)
Yes
13 Atmospheric greenhouse gas concentrations
CO2 concentrations SIO (Scripps Institution of Oceanography)
Yes
CH4 and N2O concentrations
Atmospheric lifetime experiment (ALE), the global atmospheric gases experiment (GAGE), and the present advanced GAGE (AGAGE)
Yes
HFC-134a and SF6 concentrations
NOAA/CMDL/HATS (National Oceanic and Atmospheric Administration/Climate Monitoring and Diagnostics Laboratory
Yes
(contd)CSI Indicator title Data sets Data sources Geo-
referenced data set

21
14 Land take Land use by main category
Eurostat No
CLC2000, CLC change database (*)
EEA Yes
15 Progress in management of contaminated sites
Soil contamination (*) EEA No
16 Municipal waste generation
Population: total, urban and rural
World Bank No
Wastebase — Municipal waste
Eurostat;OECD
No
17 Generation and recycling of packaging waste
Packaging waste generation and treatment in EU
Environment DG No
Gross domestic product at market prices (Eurostat)
Eurostat No
Population: total, urban and rural
World Bank No
18 Use of freshwater resources
Annual water abstraction by source and by sector
Eurostat No
Irrigated area Food and Agriculture Organisation (FAO)
No
Population: total, urban and rural
World Bank No
19 Oxygen-consuming substances in rivers
Waterbase — Rivers (*) EEA Yes
20 Nutrients in freshwater
Waterbase — Groundwater
EEA Yes
Waterbase — Lakes (*) EEA YesWaterbase — Rivers (*) EEA Yes
21 Nutrients in transitional, coastal and marine waters
Waterbase — Transitional, coastal and marine waters (*)
EEA;ICES (International Council for the Exploration of the Seas);Black Sea Environmental Programme (OceanBase Version 2.02 TU-BS)
Yes
Euromaps on CD-ROM. Digital Map Data, Version 1.0
Bartholomew Digital Data. Harper Collins Publishers, London, UK
Yes
22 Bathing water quality
Compliance to the bathing water quality directive 76/160/EEC: coastal and fresh water zones
Environment DG No
(contd)CSI Indicator title Data sets Data sources Geo-
referenced data set
Annex 5: Data sets used in EEA core set of indicators

EEA core set of indicators — Guide22
23 Chlorophyll in transitional, coastal and marine waters
Waterbase — Transitional, coastal and marine waters (*)
EEA;ICES (International Council for the Exploration of the Seas);Black Sea Environmental Programme (OceanBase Version 2.02 TU-BS)
Yes
Euromaps on CD-ROM. Digital Map Data, Version 1.0
Bartholomew Digital Data, Harper Collins Publishers, London, UK
Yes
24 Urban wastewater treatment
National population connected to wastewater treatment plants
Eurostat No
National programmes for urban wastewater treatment
Environment DG No
25 Gross nutrient balance
Nitrogen balances Eurostat Yes (2)
26 Area under organic farming
Certified and policy-supported organic and in-conversion land area
Organic Centre Wales No
Land use, utilised agricultural area (UAA)
Eurostat No
27 Final energy consumption
Supply, transformation, consumption — all products — annual data
Eurostat;International Energy Agency (IEA)
No
28 Total energy intensity
Energy intensity of the economy
Eurostat No
Gross inland consumption of energy (Supply, transformation, consumption — all products — annual data)
Eurostat No
Gross domestic product at (1995) market prices
Eurostat No
29 Total energy consumption
Supply, transformation, consumption — all products — annual data
Eurostat;International Energy Agency (IEA)
No
Supply, transformation, consumption — solid fuels — annual data
Eurostat;International Energy Agency (IEA)
No
Supply, transformation, consumption — oil — annual data
Eurostat;International Energy Agency (IEA)
No
Supply, transformation, consumption — gas — annual data
Eurostat;International Energy Agency (IEA)
No
Supply, transformation — nuclear energy — annual data
Eurostat;International Energy Agency (IEA)
No
Supply, transformation, consumption — renewables and wastes (total, solar heat, biomass, geothermal, wastes) — annual data
Eurostat;International Energy Agency (IEA)
No
(contd)CSI Indicator title Data sets Data sources Geo-
referenced data set

23
30 Renewable energy consumption
Supply, transformation, consumption — all products — annual data
Eurostat;International Energy Agency (IEA)
No
Supply, transformation, consumption — renewables and wastes (total, solar heat, biomass, geothermal, wastes) — annual data
Eurostat;International Energy Agency (IEA)
No
Supply, transformation, consumption — renewables (hydro, wind, photovoltaic) — annual data
Eurostat;International Energy Agency (IEA)
No
Supply, transformation, consumption — renewables (biofuels) — annual data
Eurostat;International Energy Agency (IEA)
No
31 Renewable electricity
Share of renewable energy (including indicative targets)
Environment DG;Eurostat;International Energy Agency (IEA)
No
Primary production of hydro power(Supply, transformation, consumption — renewables (hydro, wind, photovoltaic) — annual data)
Eurostat;International Energy Agency (IEA)
No
Primary production of wind energy(Supply, transformation, consumption — renewables (hydro, wind, photovoltaic) — annual data)
Eurostat;International Energy Agency (IEA)
No
Primary production of photovoltaic power(Supply, transformation, consumption — renewables (hydro, wind, photovoltaic) — annual data)
Eurostat;International Energy Agency (IEA)
No
Gross electricity generation — Geothermal power plants(Supply, transformation, consumption — electricity — annual data)
Eurostat;International Energy Agency (IEA)
No
Gross electricity generation — Biomass-fired power stations(Supply, transformation, consumption — electricity — annual data)
Eurostat;International Energy Agency (IEA)
No
Total gross electricity generation(Supply, transformation, consumption — electricity — annual data)
Eurostat;International Energy Agency (IEA)
No
Gross inland consumption of electricity(Supply, transformation, consumption — electricity — annual data)
Eurostat;International Energy Agency (IEA)
No
(contd)CSI Indicator title Data sets Data sources Geo-
referenced data set
Annex 5: Data sets used in EEA core set of indicators
EEA core set of indicators — Guide24
32 Status of marine fish stocks
ICES Advisory Committee on Fishery Management (ACFM) Reports
ICES (International Council for the Exploration of the Seas)
Yes (3)
General Fisheries Commission for the Mediterranean (GFCM) Sub-Committee on Stock Assessment (SCSA) reports
Food and Agriculture Organisation (FAO)
Yes (3)
International Commission for the Conservation of Atlantic Tuna (ICCAT) Standing Committee on Research and Statistics(SCRS) reports
International Commission for the Conservation of Atlantic Tuna (ICCAT)
Yes (3)
ICES Fishing areas ICES YesGFCM management units Food and Agriculture
Organisation (FAO)Yes
33 Aquaculture production
Aquaculture production: quantities 1950–
Food and Agriculture Organisation (FAO)
Yes (3)
Aquaculture production — Quantities (tonnes live weight)
Eurostat Yes (3)
Gross aquaculture production
OSPAR
Total nutrient loads HelcomFishing areas YesLength of coastline
34 Fishing fleet capacity
Fishing fleet Eurostat NoFAO Bulletin of Fishery Statistics
Food and Agriculture Organisation (FAO)
No
Fishing fleet (no formal title)
Fisheries DG No
35 Passenger transport demand
Volume of passenger transport relative to GDP
Eurostat No
Modal split of passenger transport
Eurostat No
Passenger-kilometre International Civil Aviation Organisation (ICAO)
No
Final energy consumption of the air transport sector
Eurostat No
36
Freight transport demand
Volume of freight transport relative to GDP
Eurostat No
Modal split of freight transport
Eurostat No
37 Use of cleaner and alternative fuels
Supply, transformation, consumption — gas — annual data
Eurostat No
Supply, transformation, consumption — oil — annual data
Eurostat No
Supply, transformation, consumption — renewables (biofuels) — annual data
Eurostat No
EU fuels sales by fuel type Environment DG No
(contd)CSI Indicator title Data sets Data sources Geo-
referenced data set
Note:* Data set supported by Eionet priority data flow.1 Georeferenced by biogeographical region.2 Georeferenced by NUTS level 2.3 Georeferenced by fishing area.

25
Annex 6: EEA core set indicators linkages to other international indicators
International environmental indicator sets
Overview, 2004
The following table lists a brief description of international indicator activities. The OECD has been one of the main actors in relation to development of environmental and sector indicators over the past 15 years. The EU activities in relation to indicators started in the mid-1990s with a Eurostat project on pressure indices. The development of indicators at an EU level has been speeded up after the European Council in Cardiff in summer 1998 together with activities in relation to integration of environmental concerns in relation to environmental policies.
International indicator sets and brief summary description Abbreviation
CEC structural indicators: http://epp.eurostat.cec.eu.int/portal/page?_pageid=1133,1400891,1133_1402816&_dad=portal&_schema=PORTAL.An annual synthesis report (spring report) on the basis of the structural indicators provide an instrument for an objective assessment of the progress made towards the Lisbon objectives.The 42 structural indicators cover the five domains of employment, innovation and research, economic reform, social cohesion, environment as well as the general economic background.
CEC SI
Eurostat’s sustainable development indicators (SDI) task forceCirca Forum: http://forum.europa.eu.int/Public/irc/dsis/susdevind/information. Since 2002, Eurostat has been working on a set of sustainable development indicators related to the EU sustainable development strategy.
ESS SDI
Eurostat energy, transport and environment indicators: http://epp.eurostat.cec.eu.int/portal/page?_pageid=1073,1135281,1073_1135295&_dad=portal&_schema=PORTAL&p_product_code=KS-DK-04-001 and http://epp.eurostat.cec.eu.int/cache/ITY_OFFPUB/KS-DK-04-001/EN/KS-DK-04-001-EN.PDF.The pocketbook entitled Energy, transport and environment indicators comprises a broad set of data collected by Eurostat and the European Environment Agency. The objective of this publication is to provide an overview of the most relevant indicators on energy, transport and the environment, with particular focus on sustainable development. It presents data for the EU-25 Member States, for the EFTA countries as well as for Bulgaria, Romania and Turkey.
Eurostat ETE
Eurostat ‘Towards environmental pressure indicators for the EU’: http://epp.eurostat.cec.eu.int/portal/page?_pageid=1073,1135281,1073_1135295&_dad=portal&_schema=PORTAL&p_product_code=KS-59-04-249.In 1990 and 2001, Eurostat published a set of environmental pressure indicators for the EU, addressing the most important anthropogenic pressures on the environment in 8–10 major policy fields. In 2003, Eurostat updated and extended to cover the acceding countries, the indicators in four of these policy fields, namely, air pollution, climate change, resource depletion and waste, for which data are readily available at Eurostat and the European Environment Agency. 2003 report in pdf: http://epp.eurostat.cec.eu.int/cache/ITY_OFFPUB/KS-59-04-249/EN/KS-59-04-249-EN.PDF.TEPI homepage at JRC including methodology sheets: http://esl.jrc.it/envind/hm_me_en.htm.
EU TEPI
Annex 6: EEA core set indicators linkages to other international indicators

EEA core set of indicators — Guide26
OECD’s different sets of environmental indicators are described in OECD 2003: ‘Environmental indicators — development, measurement and use. Reference paper’ (2) OECD key environmental indicators (KEI) OECD core environmental indicators (CEI)OECD agriculture-environment indicatorsOECD energy-environment indicatorsOECD transport-environment indicatorsOECD sustainable household consumption indicators
OECD KEIOECD CEIOECD AGRIOECD EEIOECD TEIOECD SDH
UN Commission on Sustainable Development (UNCSD): The 1992 Rio Conference recognised the importance of indicators for decision-making and Chapter 40 of Agenda 21 calls for the development of indicators of sustainable development indicators. In 1996, the UNCSD launched a working list of 134 SDI related to the different chapter of Agenda 21 including economic, environmental, social and institutional indicators (http://www.un.org/esa/sustdev/natlinfo/indicators/indisd/english/english.htm). Eurostat reported in 2002 in the report ‘Measuring progress towards a more sustainable Europe’ 59 of the CSD1996 indicators for the EU-15 countries (http://epp.eurostat.cec.eu.int/cache/ITY_OFFPUB/KS-37-01-203/EN/KS-37-01-203-EN.PDF). In 2001, the UNCSD proposed a core set consisting of 57 indicators (http://www.un.org/esa/sustdev/natlinfo/indicators/isdms2001/table_4.htm).
CSD1996
CSD2001
International Atomic Energy Agency and International Energy Agency 2001: indicators for sustainable energy development.
IEA SDE
WHO Environment and Health (EH) indicators: http://www.who.dk/EHindicators/Publications/20030625_1.The WHO — European Centre for Environment and Health is implementing a project to establish an environmental health (EH) indicator system. The system is designed to serve public health monitoring and environmental policies in Member States as well as to support multinational analyses. The methodology developed by the WHO project provides the basis for a set of core environment and health indicators for EU countries. On the basis of the European Commission-sponsored WHO project ‘Development of environment and health indicators for the EU countries’ (ECOEHIS) a working group, in 2003, identified a set of environment and health indicators adequate for EH monitoring in the EU covering the following seven issues: air quality, noise, housing and settlement, transport accidents, water and sanitation, chemical emergencies and radiation. In early spring 2004, WHO started a pilot study on the feasibility of the proposed 45 indicators in the EU Member States.
WHO EH
Sustainability profile — European common indicators. The development of a European common set of local sustainability indicators comes from a joint initiative from the European Commission (Environment DG), the European Environment Agency and from the expert group on the urban environment. The indicator set contains 10 indicators: http://www.europa.eu.int/comm/environment/urban/home_old_en.htm#Documents.
ECI
Convention on Biological Diversity (CBD), The 2010 biodiversity target — Indicators. Eight indicators have been identified for immediate testing and several requiring further development and leading to a balanced set suitable for assessing progress at the global level towards the 2010 target, and for effectively communicating trends in biodiversity related to the three objectives of the Convention.
CBD2004
2 Available at http://www.oecd.org/dataoecd/7/47/24993546.pdf.
(contd) International indicator sets and brief summary description Abbreviation

27Annex 6: EEA core set indicators linkages to other international indicators
Comparison of EEA core set of indicators with other international indicator sets
Overview, 2004
In the tables, the EEA core set indicators are compared with identical or similar indicators in indicator sets, produced by international organisations. Abbreviations for the international indicator sets can be found in the first table in this annex.
Air pollution, ozone layer depletion, climate change, energy and transport
CSI Indicator title Identical or similar indicator by international organisationsS: short-term indicator M: medium-term indicator L: long-term indicator
Air pollution and ozone depletion
Review papers: Energy and emission indicators (3)
OECD 1999: Advanced air quality indicators and reporting (http://www.olis.oecd.org/olis/1999doc.nsf/linkto/env-epoc-ppc(99)9-final).
1 Emissions of acidifying substances
Eurostat ETE: Emissions of acidifying substances (EEA)ESS SDI Emissions of acidifying substances and ozone precursors and GDP at constant pricesEU TEPI AP-1 Emissions of nitrogen oxides (NOx)EU TEPI AP-3 Emissions of sulphur dioxide (SO2)EU TEPI AP-7 Emissions of ammonia (NH3)OECD KEI SOx and NOx emission intensitiesOECD CEI Index of acidifying substances (M/L)OECD CEI Emissions of NOx and SOx (S)CSD1996 Emissions of sulphur oxidesCSD1996 Emissions on nitrogen oxidesWHO EH Air_P1Emissions of air pollutants
2 Emissions of ozone precursors
ESS SDI Emissions of acidifying substances and ozone precursors and GDP at constant pricesEU TEPI AP-1 Emissions of nitrogen oxides (NOx)EU TEPI AP-2 Emissions of non-methane volatile organic compounds (NMVOCs)OECD KEI SOx and NOx emission intensitiesOECD CEI Emissions of NOx and SOx (S)CSD1996 Emissions on nitrogen oxidesWHO EH Air_P1Emissions of air pollutants
3 Emissions of primary particulates and secondary particulate precursors
EU TEPI AP-1 Emissions of nitrogen oxides (NOx)EU TEPI AP-3 Emissions of sulphur dioxide (SO2)EU TEPI AP-4 Emissions of particlesWHO EH Air_P1Emissions of air pollutants
4 Exceedance of air quality limit values in urban areas
CEC SI Urban air qualityESS SDI Population exposure to air pollution by particulate mattersOECD KEI Population exposure to air pollution (M)OECD CEI Concentrations of air pollutants (S)OECD CEI Population exposure to air pollution (M)CSD1996/CSD2001 Ambient concentrations of pollutants in urban areasWHO EH Air_Ex1 Exposure to ambient air pollutants (urban)ECI A.5 Quality of local ambient air
3 Boonekamp, P.G.M. 2002: Energy and emission indicators: International inventory and assessment. Report from Energy Research Centre of the Netherlands (ECN). Available at http://www.ecn.nl/library/reports/2002e/c02072.html and http://www.ecn.nl/docs/library/report/2002/c02072.pdf.

EEA core set of indicators — Guide28
5 Exposure of ecosystems to acidification, eutrophication, and ozone
ESS SDI Exceedance of critical loads of acidifying substances and N in sensitive natural areasOECD CEI Concentrations in acid precipitation (S)OECD CEI Exceedance of critical loads of pH in water and soil (M/L)
6 Consumption of ozone depleting substances
EU TEPI Indicators on emissions of ozone depleting substances (halons, CFCs, etc.)OECD KEI Indices of apparent consumption of ozone-depleting substances (ODS)OECD CEI Apparent consumption of CFCs and halonsOECD CEI Index of apparent consumption of ozone-depleting substances (ODP) (M)CSD1996/CSD2001 Consumption of ozone-depleting substances
Climate change Review papers: Energy and emission indicators (3)
10 Greenhouse gas emissions and removals
CEC SI Greenhouse gases emissionsEurostat ETE: Greenhouse gases emissions (EEA)Eurostat ETE: Carbon dioxide emissions by main sectorESS SDI Total greenhouse gas emissionsESS SDI GHG emissions by sectorEU TEPI CC1-CC11 Emissions of single GHG OECD KEI CO2 emission intensities (S)OECD KEI Index of greenhouse gas emissions (M)OECD CEI Emissions of CO2, CH4, N2O & CFC (S/M)OECD CEI Index of greenhouse gas emissions (M)CSD1996/CSD2001 Emissions of greenhouse gases (3GHG/6GHG)ECI Local contribution to global climatic change
11 Projections of greenhouse gas emissions and removals and policies and measures
Commissions draft decision (4) (2004) contains obligations for countries to report projections on GHG emissions.
12 Global and European temperature
OECD CEI Global mean temperature (S)
13 Atmospheric greenhouse gas concentrations
OECD CEI Atmospheric concentrations of greenhouse gases (S)
Energy Review papers: Energy and emission indicators (3)
CEC 2001: Energy and environment indicatorsIAEA and IEA 2001 (5): Indicators for sustainable energy development
27 Final energy consumption (by sector)
Eurostat ETE Final enery consumption, by sectorESS SDI Final energy consumption by sectorOECD EEI — Total final consumption by sector IEA SDE Energy intensity by sector
28 Total energy intensity CEC SI Energy intensity of the economyEurostat ETE Energy intensityESS SDI Energy intensity of the economyOECD KEI Intensity of energy use/Energy efficiency indexOECD CEI Energy intensity (total primary energy supply per unit of GDP or per capita) (S)OECD EEI Total final consumption by sector CSD2001 Energy Use per unit of GDPIEA SDE Energy use per unit of GDP
4 Commission draft decision laying down rules implementing Decision 280/2004/EC of the European Parliament and of the Council concerning a mechanism for monitoring Community greenhouse gas emissions and for implementing the Kyoto Protocol.
5 International Atomic Energy Agency and International Energy Agency report available at http://www.iea.org/dbtw-wpd/textbase/papers/2001/csd-9.pdf.
(contd) CSI Indicator title Identical or similar indicator by international
organisations

29
29 Total energy consumption (by fuel)
Eurostat ETE Gross inland consumptionESS SDI Final energy consumption by fuelOECD CEI Structure of energy supply (S)OECD EEI Total primary energy supply by fuel type OECD EEI Total final consumption by fuel type OECD EEI Electricity generation by fuel typeCSD1996/CSD2001 Annual energy consumption per capitaIEA SDE Energy consumption per capita IEA SDE Energy mix
30 Renewable energy consumption
Eurostat ETE Gross inland consumption from renewables and share on total gross inland consumptionESS SDI Share of renewable energy (including indicative targets), by sourceCSD2001 Share of consumption of renewable energy resources
31 Renewable electricity CEC SI Share of renewable energyEurostat ETE Contribution of electricity from RES to total electricity consumptionCSD2001 Share of consumption of renewable energy resources
Transport Review papers: EEA transport and environment reporting mechanism (TERM)
35 Passenger transport demand
CEC SI Volume of inland transport (tonne-km and passenger-km) relative to GDPCEC SI Modal split of transportEurostat ETE Passenger transport by rail, buses and coaches, air and seaESS SDI Vehicle-km and GDP at constant priceESS SDI Car share of inland passenger transportOECD TEI Road traffic trends and densities (passenger, goods)CSD1996/CSD2001 Distance travelled per capita by mode of transportWHO EH Distance travelledECI Local mobility and passenger transportation
36 Freight transport demand
CEC SI Volume of inland transport (tonne-km and passenger-km) relative to GDPCEC SI Modal split of transportEurostat ETE Volume of freight transportESS SDI Road share of inland freight transportESS SDI Volume of freight transport and GDP at constant priceOECD CEI Road traffic volumesOECD TEI Freight transport trends by mode
37 Use of cleaner and alternative fuels
ESS SDI Consumption of biofuels, as a % of total fuel consumption in transportOECD CEI/TEI Consumption of road fuels
(contd) CSI Indicator title Identical or similar indicator by international
organisations
Annex 6: EEA core set indicators linkages to other international indicators

EEA core set of indicators — Guide30
6 Available at http://reports.eea.eu.int/technical_report_2003_96/en.
Waste Review papers: EEA 2003: Assessment of information related to waste and material flows — a catalogue of methods and tools. Technical report No 96 (6) pp. 48–52 reviews waste indicators
16 Municipal waste generation
CEC SI Municipal waste (collected, landfilled and incinerated)Eurostat ETE Treatment and disposal of municipal waste/ municipal waste collectedESS SDI Generation of waste by all economic activities and by householdsESS SDI Municipal waste collected per capitaESS SDI Municipal waste treatment, by type of treatment methodOECD KEI Municipal waste generation intensitiesOECD CEI Generation of waste (municipal, industrial, hazardous, nuclear) CSD1996/CSD2001 Generation of industrial and municipal solid waste
17 Generation and recycling of packaging waste
OECD CEI Recycling rates (glass & paper) (S/M)OECD CEI Waste minimisation (to be further developed)CSD1996/CSD2001 Rate of waste recycling and reuse
(contd) CSI Indicator title Identical or similar indicator by international
organisations

31
Biodiversity and terrestrial
CSI Indicator title Identical or similar indicator by international organisations
Biodiversity Review papers: EEA 2004: An inventory of biodiversity indicators in Europe, 2002. Technical report No 92 (7)
7 Threatened and protected species
CBD2004 Change in status of threatened species (IUCN Red List) (under development)ESS SDI Change in status of threatened and/or protected speciesOECD KEI Threatened speciesOECD CEI Threatened or extinct species as a share of total species known CSD1996 Threatened species as a percent of total native speciesCSD2001 Abundance of selected key species
8 Designated areas CEC SI Protection of natural resources — Areas proposed under the habitats and birds directivesESS SDI Sufficiency of Member States proposals for protected sites under the EU habitats directiveCBD2004 Coverage of protected areasOECD KEI Species and habitat or ecosystem diversity (M)OECD KEI Area of key ecosystems (M)OECD CEI Protected areas as % of national territory — and by type of ecosystemCSD1996/CSD2001 Protected area as a percent of total areaCSD2001 Area of selected key ecosystemsECI Protected areas as a percentage of total municipal area
9 Species diversity CBD2004 Trends in abundance and distribution of selected speciesESS SDI Biodiversity IndexESS SDI Population trends of farmland birdsCSD1996/CSD2001 Abundance of selected key speciesBirdLife International birds as biodiversity indicators (8)
Terrestrial Review papers: EEA 2001: Towards spatial and territorial indicators using land cover data, Technical report No 59 (9) EEA 2002: Assessment of data needs and data availability for the development of indicators on soil contamination, Technical report No 81 (10)
14 Land take ESS SDI Land-use change (Evolution of built-up, natural and agricultural land)ESS SDI Growth of built-up area as a % of total land areaOECD CEI Habitat alteration and land conversion from natural state (L) to be further developed (for example, road network density, change in land cover, etc.)CSD1996 Land use change; changes in land conditionsCSD2001 Area of urban formal and informal settlements
15 Progress in management of contaminated sites
ESS SDI Percentage of total land area at risk of soil contaminationOECD CEI Rehabilitated areas (M/L)CSD1996 Area of land contaminated by hazardous wastes
7 Available at http://reports.eea.eu.int/technical_report_2004_92/en/tab_content_RLR.8 Available at http://www.birdlife.net/eu/pdfs/birdlife_indic_position.pdf.9 Available at http://reports.eea.eu.int/Technical_report_No_59/en.10 Available at http://reports.eea.eu.int/technical_report_2002_81/en.
Annex 6: EEA core set indicators linkages to other international indicators

EEA core set of indicators — Guide32
11 Available at http://reports.eea.eu.int/topic_report_2003_1/en. 12 Available at http://www.helcom.fi/environment/indicators2003.html.
Water
CSI Indicator title Identical or similar indicator by international organisations
Water Review papers: EEA 2003: Europe’s water: an indicator-based assessment. Topic report No 1/2003 (11)
18 Use of freshwater resources
EU TEPI Surface water abstraction; groundwater abstraction and water consumption per capitaESS SDI Fresh water abstraction as a % of available resourcesOECD KEI Intensity of use of water resourcesOECD CEI Intensity of use of water resources — (abstractions/available resources) (S)CSD1996/CSD2001 Annual withdrawals of ground and surface water as of a percent of available water/total renewable water CSD1996 Domestic consumption of water per capita CSD1996 Groundwater reserves
19 Oxygen consuming substances in rivers
OECD CEI BOD/DO in inland waters (S/M)CSD1996/CSD2001 Biochemical oxygen demand (BOD) in water bodies
20 Nutrients in freshwater OECD CEI Concentration of N & P in inland waters (S/M)OECD AGRI Water quality risk indicatorOECD AGRI Water quality state indicator
21 Nutrients in transitional, coastal and marine waters
OECD CEI Concentration of N & P in marine waters (S/M)CSD1996 Releases of nitrogen and phosphorus to coastal watersHELCOM indicator fact sheets: Horizontal variation of dissolved nutrients in the Baltic Sea in 2002
22 Bathing water quality CEC DG ENV The annual bathing water report provide similar diagrams/indicators WHO EH Exceedance of recreational water limit values for microbiological parameters/Recreational water compliance (WatSan_S1)
23 Chlorophyll in transitional, coastal and marine waters
CSD1996 Algae indexCSD2001 Algae concentration in coastal watersHelcom indicator fact sheets (12): Chlorophyll concentrations from satellite remote sensing of ocean colour and temporal variations and regional differences in chlorophyll concentrations from satellite remote sensing of ocean colour
24 Urban wastewater treatment
Eurostat ETE Share of population connected to urban wastewater treatment plants by type of treatmentEU TEPI WP-5 Water treated/water collected ESS SDI Population connected to wastewater treatment systemsOECD KEI Wastewater treatment connection ratesOECD CEI Population connected to sewage treatment plants (S)CSD1996 Wastewater treatment WHOEH Wastewater treatment coverage

33
Agriculture and fisheries
CSI Indicator title Identical or similar indicator by international organisations
Agriculture Review papers: IRENA; Communication from the Commission to the Council and the European Parliament 2000: Indicators for the integration of environmental concerns into the common agricultural policy. COM(2000) 20 finalOECD 2001: Environmental indicators for agriculture Vol. 3
25 Gross nutrient balance ESS SDI Nitrogen surplusOECD CEI Nutrient balance (L)OECD CEI N and P from fertiliser use and from livestock (S)OECD AGRI Use of farm inputs and natural resources — nitrogen balanceCSD1996/CSD2001 Use of fertilisers
26 Area under organic farming
ESS SDI Share of organic farmingOECD AGRI Whole farm management — organic farming
Fisheries Review papers: EEA 2003: An indicator-based approach to assessing the environmental performance of European marine fisheries and aquaculture, Technical report 87 (13)
32 Status of marine fish stocks
CEC SI Protection of natural resources — Fish stocks in European marine watersESS SDI Fish catches outside safe biological limitsESS SDI Trends for spawning stocks of selected speciesOECD KEI Intensity of use of fish resourcesOECD CEI Fish resources — Fish catches, size of spawning stocks, fishing quotasCSD1996 Maximum sustained yield for fisheriesCSD2001 Annual catch by major species
33 Aquaculture production No aquaculture production indicator has been found in international sets
34 Fishing fleet capacity ESS SDI Size of fishing fleetESS SDI Structural support to fisheries and % allocated to promote environmentally friendly fishing practicesNo other fishing fleet indicators have been found in other international sets
13 Available at http://repository.eea.eu.int/reports/technical_report/87/full_report/en/html/abstract.
Annex 6: EEA core set indicators linkages to other international indicators

EEA core set of indicators — Guide34
Annex 7: Main EEA indicator-related products by environmental issue and sector
Agriculture The IRENA operation. The IRENA indicators correspond to the list of agri-environmental indicators published in COM(2001)
Agriculture Towards agri-environmental indicators: Integrating statistical and administrative data with land cover information. Topic report No 6/2001: http://reports.eea.eu.int/topic_report_2001_06/en
Air pollution Air pollution in Europe 1990–2000. Topic report No 4/2003: http://reports.eea.eu.int/topic_report_2003_4/en
Biodiversity An inventory of biodiversity indicators in Europe, 2002. Technical report No 92: http://reports.eea.eu.int/technical_report_2004_92/en
Climate change
Impacts of Europe’s changing climate. EEA Report No 2/2004: http://reports.eea.eu.int/climate_report_2_2004/en
Climate change
Greenhouse gas emission trends and projections in Europe. Environmental issue report No 36: http://reports.eea.eu.int/environmental_issue_report_2003_36/en
Energy Energy and environment in the European Union. Environmental issue report No 31: http://reports.eea.eu.int/environmental_issue_report_2002_31/en
Fisheries An indicator-based approach to assessing the environmental performance of European marine fisheries and aquaculture. Technical report No 87: http://reports.eea.eu.int/technical_report_2003_87/en/tab_content_RLR
Land cover/Terrestrial
Towards spatial and territorial indicators using land cover data. Technical report No 59: http://reports.eea.eu.int/Technical_report_No_59/en
Material flow Total material requirement of the European Union. Technical report No 55: http://reports.eea.eu.int/Technical_report_No_55/en
Soil Assessment of data needs and data availability for the development of indicators on soil contamination. Technical report No 81: http://reports.eea.eu.int/technical_report_2002_81/en
Soil sealing Proceedings of the Technical Workshop on Indicators for Soil Sealing Copenhagen, 26 to 27 March 2001. Technical report No 80: http://reports.eea.eu.int/technical_report_2002_80/en
Transport TERM 2004 — Ten key transport and environment issues for policy-makers. EEA Report No 3/2004: http://reports.eea.eu.int/TERM2004/en
Transport TERM 2002 — Paving the way for EU enlargement — Indicators of transport and environment integration. Environmental issue report No 32: http://reports.eea.eu.int/environmental_issue_report_2002_24/en/tab_summary_RLR
Transport TERM 2001 — Indicators tracking transport and environment integration in the European Union. Environmental issue report No 23: http://reports.eea.eu.int/term2001/en/tab_summary_RLR
Transport Are we moving in the right direction? Indicators on transport and environmental integration in the EU: TERM 2000. Environmental issue report No 12: http://reports.eea.eu.int/ENVISSUENo12/en
Waste Assessment of information related to waste and material flows — a catalogue of methods and tools. Technical report No 96: http://reports.eea.eu.int/technical_report_2003_96/en, Waste indicators pp. 48–53
Water Europe’s water: an indicator-based assessment. Topic report No 1/2003: http://reports.eea.eu.int/topic_report_2003_1/en
Water Testing of indicators for the marine and coastal environment in Europe — Part 1: Eutrophication and integrated coastal zone management. Technical report No 84: http://reports.eea.eu.int/technical_report_2002_84/en
Water Testing of indicators for the marine and coastal environment in Europe — Part 2: Hazardous substances. Technical report No 85: http://reports.eea.eu.int/technical_report_2003_85/en

35Annex 7: Main EEA indicator-related products by environmental issue and sector
Water Testing of indicators for the marine and coastal environment in Europe — Part 3: Present state and development of indicators for eutrophication, hazardous substances, oil and ecological quality. Technical report No 86: http://reports.eea.eu.int/technical_report_2003_86/en
Water ETC/Water 2002: Core set of indicators for water. Final draft January 2002
General Environmental indicators: Typology and overview. Technical report No 25, 1999
Environmental signals 2002 — Benchmarking the millennium, general indicator-based report
(contd)

EEA core set of indicators — Guide36
Annex 8: Quality evaluation of the EEA core set of indicators
Criteria 0 1 2 3 4Is the indicator policy relevant, i.e. supporting EU policies’ priority issues?
Not an EU policy issue and an EEA priority issue
An EU policy issue and an EEA priority issue
Does the indicator monitor progress toward the quantified targets?
No targets Targets but the indicator do not fully reflect these
Qualitative targets (generic)
Qualitative targets (specific) or quantified targets not time bound
Quantified targets time bound
Is the indicator conceptually and methodologically well founded, i.e. in use by other international organisations and/or clear and documented methodology?
Methodology description is missing
Methodology needs major improvements
Methodology needs some improvements
Methodology well founded with references
Is the indicator based on readily available and routinely collected data?
Data not readily available
Some data available — but missing collection procedures
Based on ad hoc data collection or international sources (such as global temperature)
EEA priority data flow or statistical collection by Eurostat or by EU directives
Does the spatial coverage include all or most of EEA countries?
Data from some countries or global/European data
Around half of EEA countries for example, the EU-15
Around 25 countries
Data from nearly all EEA countries
Is the data coverage sufficient to illustrate temporal trends?
Only data from 1–3 years
Trend 4–9 years Trend longer than 10 years
Trend longer than 10 years for most countries
Be consistent in space and temporal coverage and representative for countries (countries comparison)
Country comparison relevant but not possible for the moment
Country comparison not relevant (such as temperature)
Regional comparison or between subset of countries
Possible to use indicator for country benchmarking
The quality of each indicator has been evaluated using the approach described in the table below. The starting point for the evaluation is a subset of the criteria used to select the indicators in the first place. A scoring system has been defined for each criterion. The cumulative result of the evaluation for the indicator is presented as a radar diagram.
The criteria and possible scores are described below and an example of a radar diagram is presented. The full set of quality evaluations for the core set at December 2004 are available under Related documents at: http://www.eea.eu.int/coreset.

37Annex 8: Quality evaluation of the EEA core set of indicators
Example
CSI 018 Use of freshwater resources
Policy-relevant 4
Targets 2
Methodology 2
Routinely collected data 4
Temporal trend 3
Spatial coverage 3
Comparability between countries 4
0
1
2
3
4Policy-relevant
Targets
Methodology
Routinely collecteddata
Temporal trend
Spatial coverage
Comparabilitybetween countries

European Environment AgencyKongens Nytorv 61050 Copenhagen KDenmark
Tel.: +45 33 36 71 00Fax: +45 33 36 71 99
Web: www.eea.eu.intEnquiries: www.eea.eu.int/enquiries
TH
-66-0
5-1
19-E
N-C