ee247 lecture 12 - university of california, berkeleyee247/fa07/files07/lectures/l12_f... · ee247...
TRANSCRIPT

EECS 247 Lecture 12: Data Converter Performance Metrics © 2007 H. K. Page 1
EE247Lecture 12
• Administrative issuesMidterm exam Tues. Oct. 23rd
o You can only bring one 8x11 paper with your own written notes (please do not photocopy)
o No books, class notes or any other kind of handouts/notes, calculators, computers, PDA, cell phones....
o Midterm includes material covered to end of lecture 14
EECS 247 Lecture 12: Data Converter Performance Metrics © 2007 H. K. Page 2
EE247Lecture 12
• Data converters– Static converter error sources
• Offset• Full-scale error• Differential non-linearity (DNL)• Integral non-linearity (INL)
– Measuring DNL & INL• Servo-loop• Code density testing (histogram testing)

EECS 247 Lecture 12: Data Converter Performance Metrics © 2007 H. K. Page 3
Summary of Last Lecture
• Filters (continued)– Example: Switched-capacitor filters in CODEC
integrated circuits– Switched-capacitor filter design summary – Comparison of various filter topologies
• Data Converters– ADC & DAC transfer curve– Sampling, aliasing, reconstruction– Amplitude quantization
EECS 247 Lecture 12: Data Converter Performance Metrics © 2007 H. K. Page 4
Ideal ADC ("Quantizer")• Accepts analog input &
generates it’s digital representation
• Quantization step:
Δ (= 1 LSB)
• Full-scale input range:-0.5Δ … (2N-0.5)Δ
• E.g. N = 3 Bits
VFS= -0.5Δ to 7.5Δ
-1 0 1 2 3 4 5 6 7 801234567
Dig
ital O
utpu
t Cod
e
ADC characteristicsIdeal converter with infinite # of bits
ADC Input Voltage [ Δ]VFS
EECS 247 Lecture 12: Data Converter Performance Metrics © 2007 H. K. Page 5
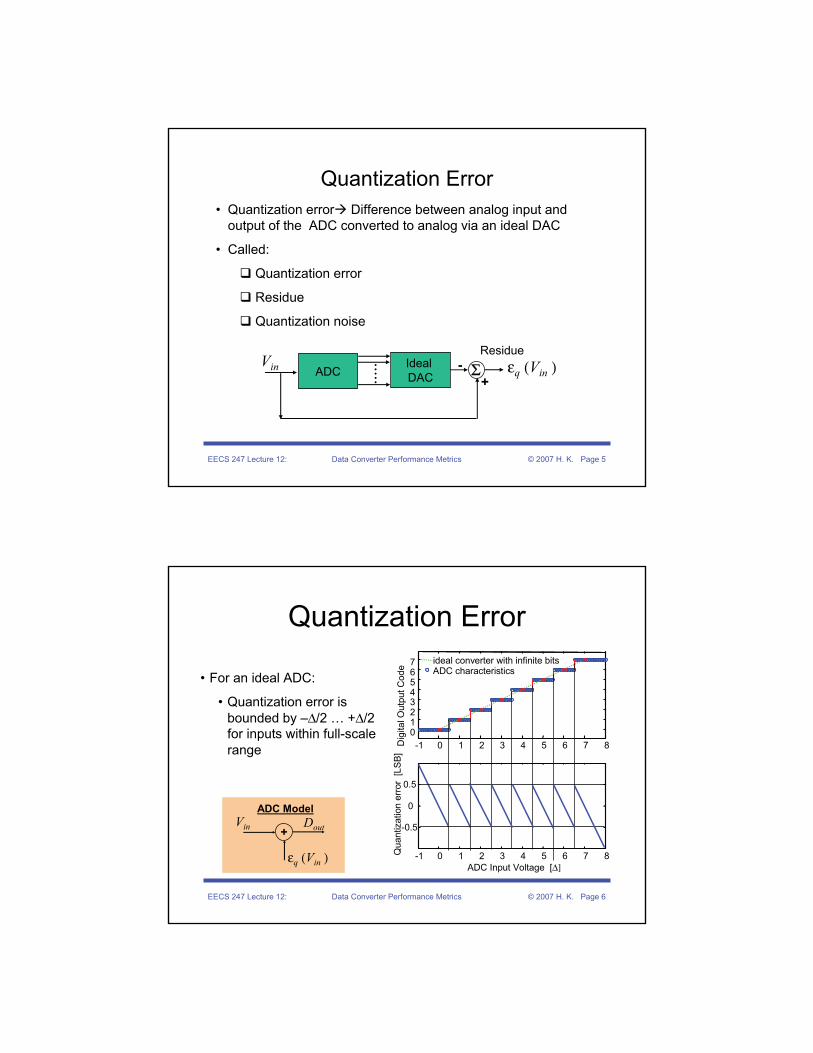
Quantization Error• Quantization error Difference between analog input and
output of the ADC converted to analog via an ideal DAC
• Called:
Quantization error
Residue
Quantization noise
Vin ADCIdeal DAC Σ
Residue
+- εq (Vin ).....
EECS 247 Lecture 12: Data Converter Performance Metrics © 2007 H. K. Page 6
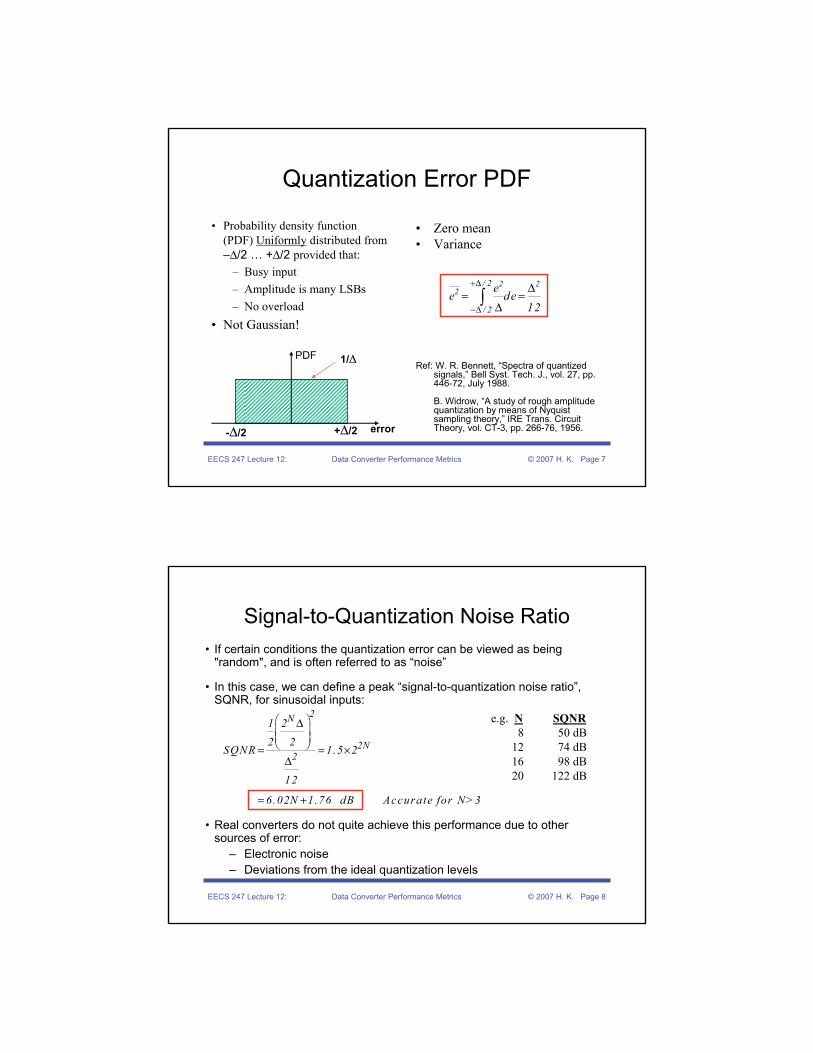
Quantization Error
• For an ideal ADC:
• Quantization error is bounded by –Δ/2 … +Δ/2for inputs within full-scale range
+
εq (Vin )
Vin Dout
ADC Model
-1 0 1 2 3 4 5 6 7 801234567
Dig
ital O
utpu
t Cod
e ADC characteristicsideal converter with infinite bits
-1 0 1 2 3 4 5 6 7 8
-0.5
0
0.5
Qua
ntiz
atio
n er
ror
[LS
B]
ADC Input Voltage [Δ]
EECS 247 Lecture 12: Data Converter Performance Metrics © 2007 H. K. Page 7
Quantization Error PDF
• Probability density function (PDF) Uniformly distributed from–Δ/2 … +Δ/2 provided that:
– Busy input– Amplitude is many LSBs– No overload
• Not Gaussian!
• Zero mean• Variance
Ref: W. R. Bennett, “Spectra of quantized signals,” Bell Syst. Tech. J., vol. 27, pp. 446-72, July 1988.
B. Widrow, “A study of rough amplitude quantization by means of Nyquist sampling theory,” IRE Trans. Circuit Theory, vol. CT-3, pp. 266-76, 1956.-Δ/2
error
1/Δ
+Δ/2
2 22
/ 2
/ 2
ee de
12
+Δ
−Δ
Δ= =
Δ∫
EECS 247 Lecture 12: Data Converter Performance Metrics © 2007 H. K. Page 8
Signal-to-Quantization Noise Ratio• If certain conditions the quantization error can be viewed as being
"random", and is often referred to as “noise”
• In this case, we can define a peak “signal-to-quantization noise ratio”, SQNR, for sinusoidal inputs:
• Real converters do not quite achieve this performance due to other sources of error:
– Electronic noise– Deviations from the ideal quantization levels
2N
2N2
1 22 2
SQNR 1.5 2
12
6.02N 1.76 dB Accurate for N>3
⎛ ⎞Δ⎜ ⎟⎜ ⎟⎝ ⎠= = ×
Δ
= +
e.g. N SQNR8 50 dB
12 74 dB16 98 dB20 122 dB

EECS 247 Lecture 12: Data Converter Performance Metrics © 2007 H. K. Page 9
SQNR Measurement
20log(SQNR)
Vin [dB]0dB
6dB/octaveRealistic
peakSQNR 6.02N 1.76 dB= +
Dynamic Range
Ideal
EECS 247 Lecture 12: Data Converter Performance Metrics © 2007 H. K. Page 10
Static Ideal Macro Models
ADC
+D +-0.5LSB ambiguityoutVin
εq
DACVoutDin
EECS 247 Lecture 12: Data Converter Performance Metrics © 2007 H. K. Page 11
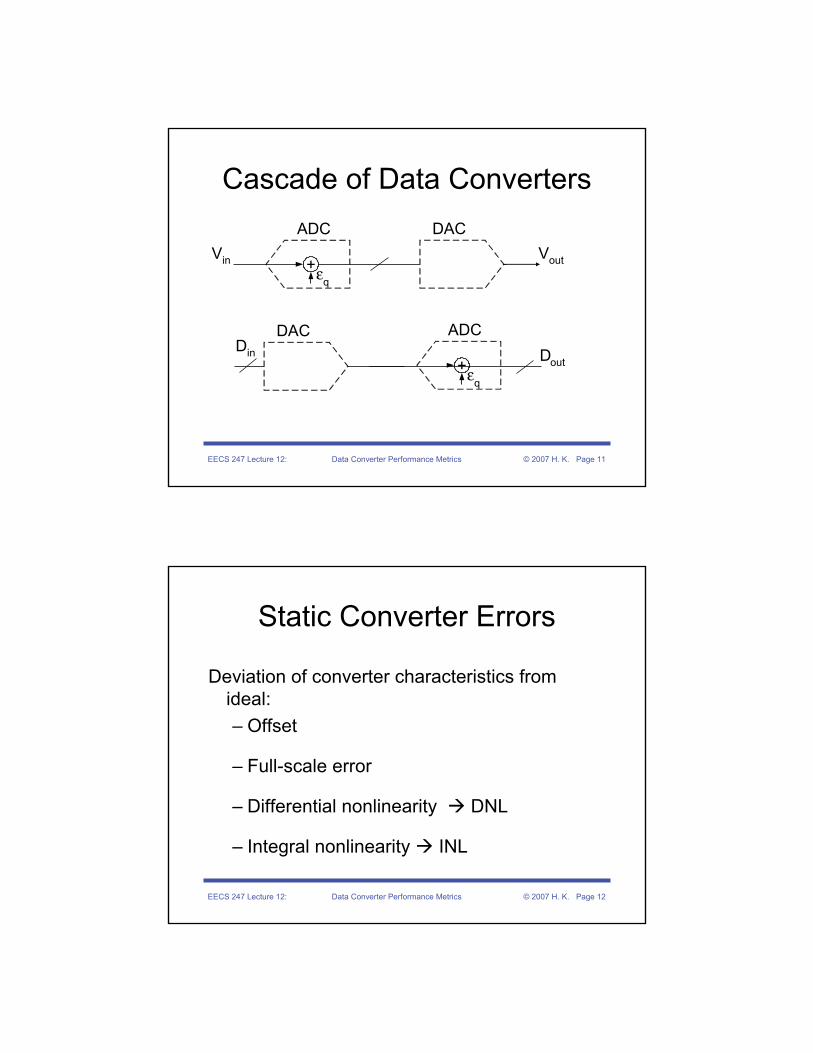
Cascade of Data ConvertersADC
+Vin
εq
DACVout
ADC
+εq
DACDout
Din
EECS 247 Lecture 12: Data Converter Performance Metrics © 2007 H. K. Page 12
Static Converter Errors
Deviation of converter characteristics from ideal:– Offset
– Full-scale error
– Differential nonlinearity DNL
– Integral nonlinearity INL
EECS 247 Lecture 12: Data Converter Performance Metrics © 2007 H. K. Page 13
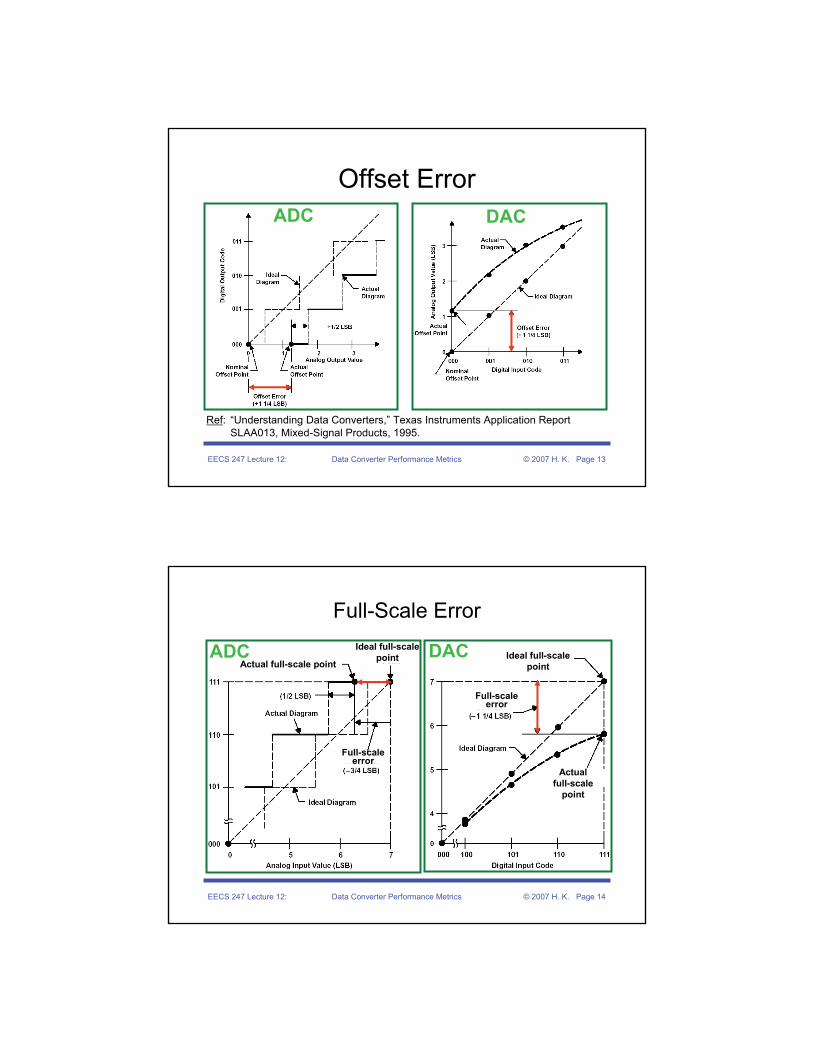
Offset ErrorADC DAC
Ref: “Understanding Data Converters,” Texas Instruments Application Report SLAA013, Mixed-Signal Products, 1995.
EECS 247 Lecture 12: Data Converter Performance Metrics © 2007 H. K. Page 14
Full-Scale Error
Actual full-scale point
Ideal full-scale point Ideal full-scale
point
Full-scale error
Actual full-scale
point
Full-scale error
ADC DAC

EECS 247 Lecture 12: Data Converter Performance Metrics © 2007 H. K. Page 15
Offset and Full-Scale Error
-1 0 1 2 3 4 5 6 7 8
0
1
2
3
4
5
6
7
Dig
ital O
utpu
t Cod
e
ADC Input Voltage [LSB]
ADC characteristicsideal converter
Offset error
Full-scale error
Note:For further measurements (DNL, INL) connecting the endpoints & deriving ideal codes based on the non-ideal endpoints eliminates offset and full-scale error
EECS 247 Lecture 12: Data Converter Performance Metrics © 2007 H. K. Page 16
Offset and Full-Scale Errors
• Alternative specification in % Full-Scale = 100% * (# of LSB value)/ 2N
• Gain error can be extracted from offset & full-scale error
• Non-trivial to build a converter with extremely good full-scale/offset specs
• Typically full-scale/offset is most easily compensated by the digital pre/post-processor
• More critical: Linearity measures DNL, INL

EECS 247 Lecture 12: Data Converter Performance Metrics © 2007 H. K. Page 17
0 1 2 3 4 5 6 7 8
0
1
2
3
4
5
6
7
8ADC Transfer CurveReal Ideal
ADC Differential Nonlinearity
DNL = deviation of code width from
Δ (1LSB)
+0.4 LSB DNL error
-0.4 LSB DNL error
1. Endpoints connected
2. Ideal characteristics derived eliminating offset & full-scale error
3. DNL measured
0 LSB DNL errorDig
ital O
utpu
t Cod
e
ADC Input Voltage [Δ]
EECS 247 Lecture 12: Data Converter Performance Metrics © 2007 H. K. Page 18
ADC Differential Nonlinearity
• Ideal ADC transitions point equally spaced by 1LSB
• For DNL measurement, offset and full-scale error is eliminated
• DNL [k] (a vector) measures the deviation of each code from its ideal width
• Typically, the vector for the entire code is reported
• If only one DNL # is reported that would be the worst case

EECS 247 Lecture 12: Data Converter Performance Metrics © 2007 H. K. Page 19
ExampleOffset, Full-Scale Error, Gain,& DNL
A 3bit ADC is designed to have an ideal:LSB=0.1V VFS=0.8V
The measured transitions levels for the end product is shown in the table, compute offset, full-scale, gain error, & DNL
1- Offset: (real transition-ideal)= -0.03V, in LSB -0.03/0.1= -0.3LSB
2- Full-scale error (real last transition-ideal)= 0.68-0.65=0.03Vin LSB 0.03/0.1=+0.3LSB
3- LSB after correcting for offset & full-scale error: LSB=(Last transition-first transition)/(2N-2)
LSB=(0.68-0.02)/6=0.11V 0.680.657
0.50.556
0.420.455
0.370.354
0.20.253
0.150.152
0.020.051
Real transition point [V]
Ideal transition point [V]
Transition #
EECS 247 Lecture 12: Data Converter Performance Metrics © 2007 H. K. Page 20
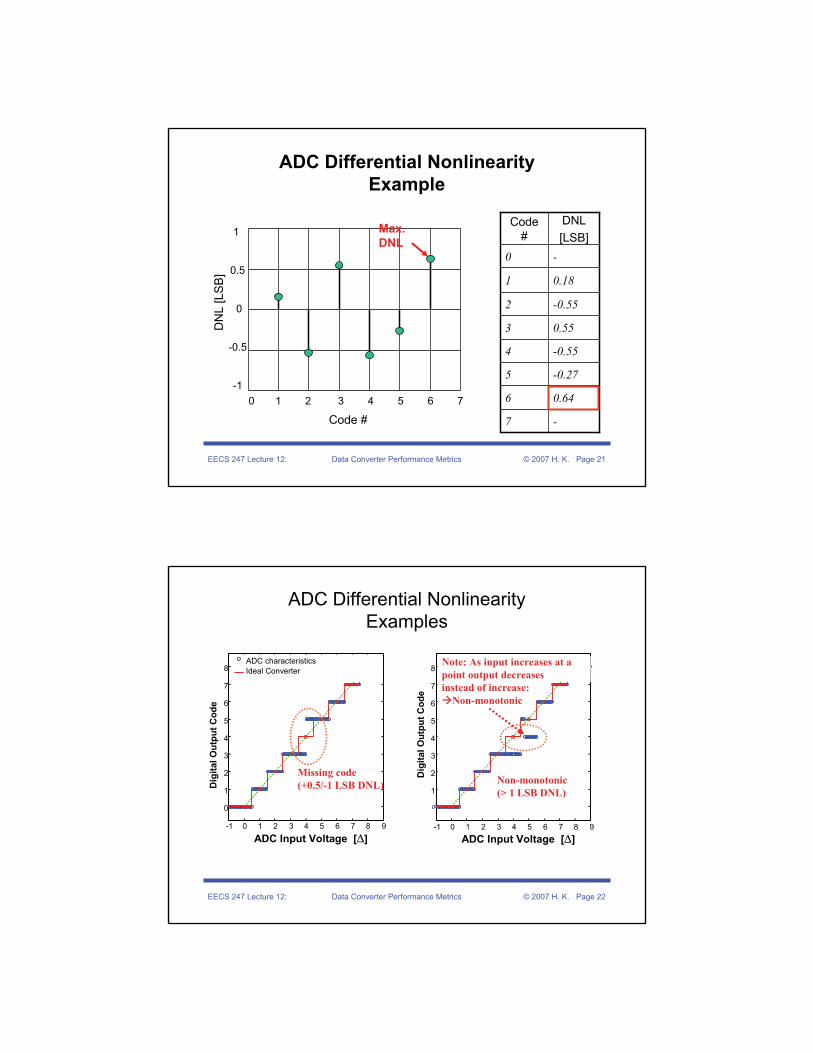
ADC Differential NonlinearityExample
VFS= 2N.0.11V=0.88V4-Gain relative to ideal Gain=0.8/0.88=0.9
Find all code widthsWidth[k]=Transition[k+1]-Transition[k]-Divide code width by LSB W[k]
5- Find DNL:DNL[k]=W[k]-LSB 1.64
0.73
0.45
1.55
0.45
1.18
Width [LSB]
--0
--7
0.640.186
-0.270.085
-0.550.054
0.550.173
-0.550.052
0.180.131
DNL[LSB]
Code Width [V]
Code #
EECS 247 Lecture 12: Data Converter Performance Metrics © 2007 H. K. Page 21
ADC Differential NonlinearityExample
-0
-7
0.646
-0.275
-0.554
0.553
-0.552
0.181
DNL[LSB]
Code #
Code #
DN
L [L
SB
]
0 1 2 3 4 5 6 7
1
0.5
0
-0.5
-1
Max.DNL
EECS 247 Lecture 12: Data Converter Performance Metrics © 2007 H. K. Page 22
-1 0 1 2 3 4 5 6 7 8 9
0
1
2
3
4
5
6
7
8ADC characteristicsIdeal Converter
ADC Differential NonlinearityExamples
-1 0 1 2 3 4 5 6 7 8 9
0
1
2
3
4
5
6
7
8
Non-monotonic(> 1 LSB DNL)
Missing code(+0.5/-1 LSB DNL)
Dig
ital O
utpu
t Cod
e
ADC Input Voltage [Δ]
Dig
ital O
utpu
t Cod
e
ADC Input Voltage [Δ]
Note: As input increases at a point output decreases instead of increase:
Non-monotonic
EECS 247 Lecture 12: Data Converter Performance Metrics © 2007 H. K. Page 23
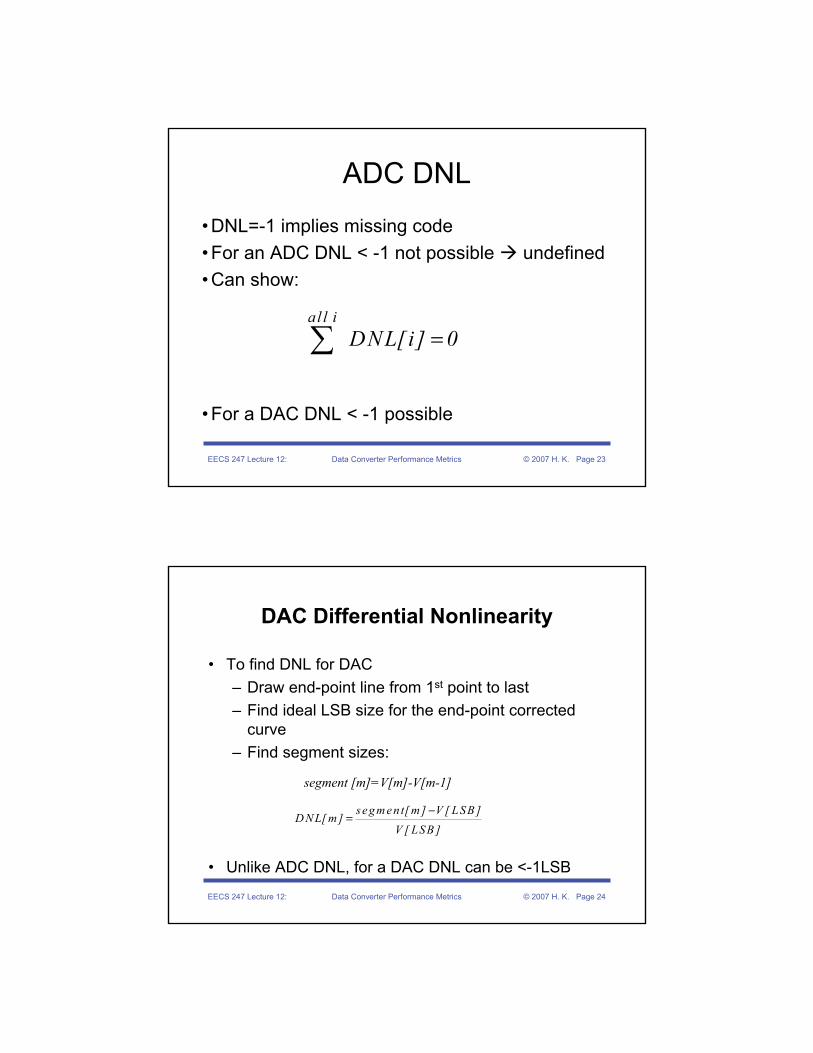
ADC DNL
• DNL=-1 implies missing code• For an ADC DNL < -1 not possible undefined• Can show:
• For a DAC DNL < -1 possible
al l iDNL[i] 0=∑
EECS 247 Lecture 12: Data Converter Performance Metrics © 2007 H. K. Page 24
DAC Differential Nonlinearity
• To find DNL for DAC– Draw end-point line from 1st point to last– Find ideal LSB size for the end-point corrected
curve– Find segment sizes:
segment [m]=V[m]-V[m-1]
• Unlike ADC DNL, for a DAC DNL can be <-1LSB
segm en t[ m ] V [ LSB ]D NL[ m ]
V [ LSB ]−
=

EECS 247 Lecture 12: Data Converter Performance Metrics © 2007 H. K. Page 25
DAC Differential Nonlinearity
EECS 247 Lecture 12: Data Converter Performance Metrics © 2007 H. K. Page 26
Impact of DNL on Performance
• Same as a somewhat larger quantization error, consequently degrades SQNR
• How much – later in the course...
• The term "DNL noise", usually means "additional quantization noise due to DNL"

EECS 247 Lecture 12: Data Converter Performance Metrics © 2007 H. K. Page 27
ADC Transfer Function
IdealReal
INL Curve
INLINLMax
INLMax
Input
OutputINL = deviation of code transition from its ideal location
ADC Integral Nonlinearity
INL is also a vector INL[k]If one INL # reported
Worst case INL
Most common End-point:Straight line through the endpoints is usually used as reference,i.e. offset and full scale errors are eliminated in INL calculation
Ideal converter steps found for the endpoint line, then INL is measured Digital
Output
EECS 247 Lecture 12: Data Converter Performance Metrics © 2007 H. K. Page 28
ADC Transfer Function
IdealReal
INL Curve
INL
Input
OutputINL = deviation of code transition from its ideal location
ADC Integral NonlinearityBest-Fit
Best-FitA best-fit line (in the least-mean squared sense) fitted
Ideal converter steps found then INL measured
Note: Typically INL #s smaller for best-fit compared to end-point

EECS 247 Lecture 12: Data Converter Performance Metrics © 2007 H. K. Page 29
ADC Integral NonlinearityEnd-Point
• Typically, end-point INL reported in publications
-1 0 1 2 3 4 5 6 7 8
0
1
6
7
Dig
ital O
utpu
t Cod
e
ADC Input Voltage [Δ]
INL = deviation of codetransition from its ideal location
-1 LSB INL
2
3
4
5
EECS 247 Lecture 12: Data Converter Performance Metrics © 2007 H. K. Page 30
ADC Integral NonlinearityBest Fit versus End-Point
• Best-Fit
– A best-fit line (in the least-mean squared sense)
– Ideal converter steps is found then INL is measured
-1 0 1 2 3 4 5 6 7 8
0
1
6
7
Dig
ital O
utpu
t Cod
e
ADC Input Voltage [Δ]
-1/2 LSB INL
2
3
4
5
+1/2 LSB INL
Best Fit
End-point INLmax =1LSBBest-fit INLmax =+-1/2LSB

EECS 247 Lecture 12: Data Converter Performance Metrics © 2007 H. K. Page 31
ADC Integral Nonlinearity
m 1
i 1INL[ m] DNL[i]
−
== ∑
Can derive INL by:1-
• Construct uniform staircase between 1st and last transition• INL for each code:
2-• Can show
INL is found by computing the cumulative sum of DNL
T[ m] T[ideal ]INL[m]
W [ideal ]
−=
EECS 247 Lecture 12: Data Converter Performance Metrics © 2007 H. K. Page 32
ADC Differential & Integral NonlinearityExample
m 1
i 1INL[ m] DNL[i]
−
== ∑
Notice:
INL[0] undefined
INL[1]=0
INL[2N-1]=00-7
-0.640.646
-0.37-0.275
0.18-0.554
-0.370.553
0.18-0.552
00.181
--0
INL [LSB]DNL[LSB]
Code #

EECS 247 Lecture 12: Data Converter Performance Metrics © 2007 H. K. Page 33
ADC Differential & Integral NonlinearityExample
--0
0-7
-0.640.646
-0.37-0.275
0.18-0.554
-0.370.553
0.18-0.552
00.181
INL[LSB]
DNL[LSB]
Code #
Code #
DN
L [L
SB
]
0 1 2 3 4 5 6 7
1
0.5
0
-0.5
-1
INL
[LS
B]
0 1 2 3 4 5 6 7
1
0.5
0
-0.5
-1
Max.DNL
Max.INL
EECS 247 Lecture 12: Data Converter Performance Metrics © 2007 H. K. Page 34
DAC Integral Nonlinearity
m 1
i 1INL[ m] DNL[i]
−
== ∑
Can derive INL by:• Connect end points• Find ideal output values• INL for each code:
2-• Can show
INL is found by computing the cumulative sum of DNL
V [ m] V [ideal ]INL[ m]
V [ LSB]
−=

EECS 247 Lecture 12: Data Converter Performance Metrics © 2007 H. K. Page 35
DAC Integral Nonlinearity
EECS 247 Lecture 12: Data Converter Performance Metrics © 2007 H. K. Page 36
DAC DNL and INL
* Ref: “Understanding Data Converters,” Texas Instruments Application Report SLAA013, Mixed-Signal Products, 1995.

EECS 247 Lecture 12: Data Converter Performance Metrics © 2007 H. K. Page 37
Example: INL & DNL
Large INL & Small DNL Large DNL & Small INL
EECS 247 Lecture 12: Data Converter Performance Metrics © 2007 H. K. Page 38
Monotonicity• Monotonicity guaranteed if
| INL | ≤ 0.5 LSBThe best fit straight line is taken as the reference for determining the INL.
• This implies| DNL | ≤1 LSB

EECS 247 Lecture 12: Data Converter Performance Metrics © 2007 H. K. Page 39
Non-Monotonic DAC
000 001 010 011 100 101 110 111
DigitalInput
Analog Output [LSB]
7
6
5
4
3
2
1
0
segment[ m] V [ LSB]DNL[ m]
V [ LSB]
segment[4] V [ LSB]
DNL[4]V [ LSB]
0.5 11.5[ LSB]
12.5 1
DNL[5] 1.5[ LSB]1
−=
−
=
− −= = −
−== =
• DNL< -1LSB for a DACNon-monotonicity
• When can non-monotonicity cause major problems?
-0.52.5
EECS 247 Lecture 12: Data Converter Performance Metrics © 2007 H. K. Page 40
Non-Monotonic ADC
• Code 011 associated with two transition levels !
• For non-monotonic ADC
DNL not defined @ non-monotonic steps
111
110
101
100
011
010
001
000
Digital Output
Analog input
0 Δ 2Δ 3Δ 4Δ 5Δ 6Δ 7Δ

EECS 247 Lecture 12: Data Converter Performance Metrics © 2007 H. K. Page 41
How to measure DNL/INL?
• DAC:– Simply apply digital codes and use a good voltmeter to
measure corresponding analog output
• ADC– Not as simple as DAC need to find "decision levels", i.e.
input voltages at all code boundaries• One way: Adjust voltage source to find exact code trip
points "code boundary servo"• More versatile: Histogram testing
Apply a signal with known amplitude distribution and analyze digital code distribution at ADC output
EECS 247 Lecture 12: Data Converter Performance Metrics © 2007 H. K. Page 42
Code Boundary Servo
C1
ADCInputR2
C2
ADCUnder
Test
VREF
i1
i2
DigitalComp.
A<B
BA≥B
A
InputDigitalCode
ADCOutput
fS

EECS 247 Lecture 12: Data Converter Performance Metrics © 2007 H. K. Page 43
Code Boundary Servo
AD
C D
igita
l Out
put
ADC Analog Input
111
110
101
100
011
010
001
000
Δ 2Δ 3Δ 4Δ 5Δ 6Δ 7Δ
• i1 and i2 are small, and C1 is large, so the ADC analog input moves a small fraction of an LSB each sampling period
• For a code input of 101, the ADC analog input settles to the code boundary shown
EECS 247 Lecture 12: Data Converter Performance Metrics © 2007 H. K. Page 44
Code Boundary ServoGood DVM
C1
R2
C2
ADC
VREF
i1
i2
DigitalComp.
A<B
BA≥B
A
InputDigitalCode
ADCOutput
fS

EECS 247 Lecture 12: Data Converter Performance Metrics © 2007 H. K. Page 45
Code Boundary Servo• A very good digital voltmeter (DVM)
measures the analog input voltage corresponding to the desired code boundary
• DVMs have some interesting properties– They can have very high resolutions (8½ decimal
digit meters are inexpensive)– To achieve stable readings, DVMs average
voltage measurements over multiple 60Hz ac line cycles to filter out pickup in the measurement loop
EECS 247 Lecture 12: Data Converter Performance Metrics © 2007 H. K. Page 46
Code Boundary Servo
• ADCs of all kinds are notorious for kicking back high-frequency, signal-dependent glitches to their analog inputs
• A magnified view of an analog input glitch follows …
Good DVM
R2
C2
ADC
VREF fS

EECS 247 Lecture 12: Data Converter Performance Metrics © 2007 H. K. Page 47
Code Boundary Servo
• Just before the input is sampled and conversion starts, the analog input is pretty quiet
• As the converter begins to quantize the signal, it kicks back charge
time0 1/fS
anal
og in
put
start of conversion
EECS 247 Lecture 12: Data Converter Performance Metrics © 2007 H. K. Page 48
Code Boundary Servo
• The difference between what the ADC measures and what the DVM measures is not ADC INL, it’s error in the INL measurement
• How do we control this error?
time0 1/fS
anal
og in
put
ADC converts this voltage
DVM measures the averageinput including the glitch

EECS 247 Lecture 12: Data Converter Performance Metrics © 2007 H. K. Page 49
Code Boundary Servo
• A large C2 fixes this
• At the expense of longer measurement time
Good DVM
R2
C2
ADC
VREF fS
EECS 247 Lecture 12: Data Converter Performance Metrics © 2007 H. K. Page 50
Histogram Testing
• Code boundary measurements are slow– Long testing time– May miss dynamic errors
• Histogram testing– Quantize input with known pdf (e.g. ramp or
sinusoid)– Measure output pdf– Derive INL and DNL from deviation of measured
pdf from expected result

EECS 247 Lecture 12: Data Converter Performance Metrics © 2007 H. K. Page 51
Histogram Test Setup
Ramp
0
VREF
ADC PC
VREF
• Slow (wrt conversion time) linear ramp applied to ADC• DNL derived directly from total number of occurrences of each
code @ the output of the ADC
Time
fS
EECS 247 Lecture 12: Data Converter Performance Metrics © 2007 H. K. Page 52
A/D Histogram Test Using Ramp SignalDigital Output
Analog input
RampTime
n/fs
ADCInput/Output
Example:
Ramp slope: 10μV/μsec1LSB =10mVEach ADC code 1msec
fs =100kHz Ts=10μsec
n =100 samples/code

EECS 247 Lecture 12: Data Converter Performance Metrics © 2007 H. K. Page 53
A/D Histogram Test Using Ramp Signal
Dig
ital O
utpu
t
Analog input
Ramp
Tim
e
n/fs
ADCInput/Output
Example:
Ramp slope: 10μV/usec1LSB =10mVEach ADC code 1msec
fs =100kHz Ts=10μsec
n =100 samples/code#
ofSa
mpl
esPe
r cod
e
EECS 247 Lecture 12: Data Converter Performance Metrics © 2007 H. K. Page 54
Measuring DNL• Ramp speed is adjusted to provide large number of
output/code - e.g. an average of 100 outputs of each ADC code (for 1/100 LSB resolution)
• Ramp test can be quite slow for high resolution ADCs• Example:
16bit ADC & 100conversions/code @100kHz sampling rate
(216or 65,536 codes)(100 conversions/code)
100,000 conversions/sec= 65.6 sec

EECS 247 Lecture 12: Data Converter Performance Metrics © 2007 H. K. Page 55
Ramp HistogramExample: Ideal 3-Bit ADC
0 1 2 3 4 5 6 7 8
0
1
2
3
4
5
6
7ADC characteristicsideal converter
0 1 2 3 4 5 6 70
20
40
60
80
100
120
140
160
180
200
ADC output codeC
ode
Cou
nt
Dig
ital O
utpu
t Cod
e
ADC Input Voltage [Δ]
EECS 247 Lecture 12: Data Converter Performance Metrics © 2007 H. K. Page 56
Ramp HistogramExample: 3-Bit ADC with Error
0 1 2 3 4 5 6 7 8
0
1
2
3
4
5
6
7ADC characteristicsideal converter
+0.4 LSB DNL
-0.4 LSB DNL
+0.4 LSB INL
0 1 2 3 4 5 6 70
20
40
60
80
100
120
140
160
180
200
ADC output code
Cod
e C
ount
Dig
ital O
utpu
t Cod
e
ADC Input Voltage [Δ]

EECS 247 Lecture 12: Data Converter Performance Metrics © 2007 H. K. Page 57
Example: 3 Bit ADCDNL Extracted from Histogram
1- “Over-range bins”removed (0 and full-scale)
2- Compute average count/bin (600/6=100 in this case)
0 1 2 3 4 5 6 70
20
40
60
80
100
120
140
ADC output code
Cod
e C
ount
, End
bin
s re
mov
ed
EECS 247 Lecture 12: Data Converter Performance Metrics © 2007 H. K. Page 58
Example: 3 Bit ADCDNL Extracted from Histogram
Normalize:3- Divide by average count/bin
(ideal bins have exactly the average count, which, after normalization, is 1)
0 1 2 3 4 5 6 70
0.2
0.4
0.6
0.8
1
1.2
1.4
ADC output code
Nor
mal
ized
Cod
e C
ount

EECS 247 Lecture 12: Data Converter Performance Metrics © 2007 H. K. Page 59
Example: 3 Bit ADCDNL Extracted from Histogram
4- Subtract 1 from the normalized code count
5- Result is DNL (+-0.4Lsb in this case)
0 1 2 3 4 5 6 7-0.4
-0.3
-0.2
-0.1
0
0.1
0.2
0.3
0.4
ADC output code
DN
L =
Cou
nts
/ Mea
n(C
ount
s)
EECS 247 Lecture 12: Data Converter Performance Metrics © 2007 H. K. Page 60
Example: 3-Bit ADCStatic Characteristics Extracted from Histogram
• Width of all codes derived from measured DNL (Code=DNL + 1LSB)
• DNL histogram used to reconstruct the exact converter characteristic (having measured only the histogram)
• INL- (deviation from a straight line through the end points)- is found
-1 0 1 2 3 4 5 6 7 8
0
1
2
3
4
5
6
7
ADC Input Voltage
Rec
onst
ruct
ed C
hara
cter
istic

EECS 247 Lecture 12: Data Converter Performance Metrics © 2007 H. K. Page 61
Example: 3 Bit ADCDNL & INL Extracted from Histogram
-1 0 1 2 3 4 5 6 7 8
0
1
2
3
4
5
6
7
ADC characteristicsideal converter
+0.4 LSB DNL
-0.4 LSB DNL
+0.4 LSB INL
1 2 3 4 5 6-1
-0.5
0
0.5
1
DN
L [L
SB]
DNL and INL of 3 Bit converter (from histogram testing)
1 2 3 4 5 6bin #
INL
[LSB
]
Dig
ital O
utpu
t Cod
e
ADC Input Voltage [Δ]
bin #
-1
-0.5
0
0.5
1
EECS 247 Lecture 12: Data Converter Performance Metrics © 2007 H. K. Page 62
ADC Histogram Testing Sinusoidal Inputs
• Highly linear ramp signals not readily available (>8 to10bits)
• Solution: Use sinusoidal test signal (may need to filter out harmonics)
• Problem: ideal histogram is not flat but has “bath-tub shape”
0 500 1000 1500 2000 2500 3000 3500 40000
50
100
150
200
250
ADC Output- Raw Histogram

EECS 247 Lecture 12: Data Converter Performance Metrics © 2007 H. K. Page 63
A/D Histogram Test Using Sinusoidal Signals
Sinusoid
At sinusoid midpoint crossings:dv/dt max.
least # of samples
At sinusoid amplitude peaks:dv/dt min.
highest # of samples
ADCInput/Output
Dig
ital O
utpu
t
Analog input
Tim
e
# of
Sam
ples
Per c
ode
EECS 247 Lecture 12: Data Converter Performance Metrics © 2007 H. K. Page 64
Resulting DNL and INL
0 500 1000 1500 2000 2500 3000 3500 4000-1
0
1
code
DN
L [L
SB]
DNL = +1.3 / -1 LSB, missing code if (DNL<-0.9)
0 500 1000 1500 2000 2500 3000 3500 4000-1
0
1
2
code
INL
[LSB
]
INL = +1.7 / -0.69 LSB

EECS 247 Lecture 12: Data Converter Performance Metrics © 2007 H. K. Page 65
Correction for Sinusoidal PDF• References:
– [1] M. V. Bossche, J. Schoukens, and J. Renneboog, “Dynamic Testing and Diagnostics of A/D Converters,” IEEE Transactions on Circuits and Systems, vol. CAS-33, no. 8, Aug. 1986.
– [2] IEEE Standard 1057
• Is it necessary to know the exact amplitude and offset of sinusoidal input? No!
EECS 247 Lecture 12: Data Converter Performance Metrics © 2007 H. K. Page 66
DNL/INL Code
function [dnl,inl] = dnl_inl_sin(y);
%DNL_INL_SIN
% dnl and inl ADC output
% input y contains the ADC output
% vector obtained from quantizing a
% sinusoid
% Boris Murmann, Aug 2002
% Bernhard Boser, Sept 2002
% histogram boundaries
minbin=min(y);
maxbin=max(y);
% histogram
h = hist(y, minbin:maxbin);
% cumulative histogram
ch = cumsum(h);
% transition levels
T = -cos(pi*ch/sum(h));
% linearized histogram
hlin = T(2:end) - T(1:end-1);
% truncate at least first and last
% bin, more if input did not clip ADC
trunc=2;
hlin_trunc = hlin(1+trunc:end-trunc);
% calculate lsb size and dnl
lsb= sum(hlin_trunc) / (length(hlin_trunc));
dnl= [0 hlin_trunc/lsb-1];
misscodes = length(find(dnl<-0.9));
% calculate inl
inl= cumsum(dnl);

EECS 247 Lecture 12: Data Converter Performance Metrics © 2007 H. K. Page 67
DNL/INL Code Test
% converter model
B = 6; % bits
range = 2^(B-1) - 1;
% thresholds (ideal converter)
th = -range:range; % ideal thresholds
th(20) = th(20)+0.7; % error
fs = 1e6;
fx = 494e3 + pi; % try fs/10!
C = round(100 * 2^B / (fs / fx));
t = 0:1/fs:C/fx;
x = (range+1) * sin(2*pi*fx.*t);
y = adc(x, th) - 2^(B-1);
hist(y, min(y):max(y));
dnl_inl_sin(y);
-30 -20 -10 0 10 20 30-1
-0.5
0
0.5
1
codeD
NL
[LSB
]
DNL = +0.7 / -0.7 LSB, 0 missing codes (DNL<-0.9)
-30 -20 -10 0 10 20 30-0.20
0.20.40.60.8
INL
[LSB
]
INL = +0.7 / -0.0 LSB
EECS 247 Lecture 12: Data Converter Performance Metrics © 2007 H. K. Page 68
Histogram Testing Limitations• The histogram (as any ADC test, of course) characterizes one
particular converter. Test many devices to get valid statistics.• Histogram testing assumes monotonicity
E.g. “code flips” will not be detected.• Dynamic sparkle codes produce only minor DNL/INL errors
E.g. 123, 123, …, 123, 0, 124, 124, … look at ADC output to detect
• Noise not detected or could improves DNL E.g. 9, 9, 9, 10, 9, 9, 9, 10, 9, 10, 10, 10, …
Ref: B. Ginetti and P. Jespers, “Reliability of Code Density Test for High Resolution ADCs,” Electron. Lett., vol. 27, pp. 2231-3, Nov. 1991.

EECS 247 Lecture 12: Data Converter Performance Metrics © 2007 H. K. Page 69
Example: Hiding Problems in the Noise
• INL 5 missing codes
• DNL "smeared out" by noise!
• Always look at both DNL/INL
• INL usually does not lie...
[Source: David Robertson, Analog Devices]