edward lundberg and the rockville building: energy
TRANSCRIPT

9-212-067
R E V : S E P T E M B E R 3 , 2 0 1 3
________________________________________________________________________________________________________________
Senior Lecturer John D. Macomber and Research Associate Frederik Nellemann prepared this case. The company mentioned in the case is fictional. HBS cases are developed solely as the basis for class discussion. Cases are not intended to serve as endorsements, sources of primary data, or illustrations of effective or ineffective management. Copyright © 2012, 2013 President and Fellows of Harvard College. To order copies or request permission to reproduce materials, call 1-800-545-7685, write Harvard Business School Publishing, Boston, MA 02163, or go to www.hbsp.harvard.edu/educators. This publication may not be digitized, photocopied, or otherwise reproduced, posted, or transmitted, without the permission of Harvard Business School.
J O H N D . M A C O M B E R
F R E D E R I K N E L L E M A N N
Edward Lundberg and the Rockville Building: Energy Efficiency Finance in Commercial Real Estate
Energy efficiency isn’t just low hanging fruit; it’s fruit laying on the ground.
------ Steven Chu, U.S. Energy Secretary, June 20091
Energy efficiency may be fruit lying on the ground, but like most fruit on the ground it is bruised and ugly.
------ Ian Fischer, Clean Energy Solutions, November 20112
Introduction
It was an unusually hot summer afternoon in 2011 as Edward Lundberg drove down Interstate 270 toward the prestigious city of Rockville, Maryland, not far from the U.S. Capital. Lundberg’s real estate company owned several commercial properties in Rockville. He thought about the tenants of the building, since he knew that the building was older and less equipped to handle extremes in temperature than some its more modern neighbors. A few years back he had had an energy audit of the building performed that had identified a wide variety of measures he could take to improve the energy efficiency of the building. The audit claimed that all of the proposed capital initiatives would eventually pay for themselves in operating cost savings.
Lundberg and the other partners of his firm, Lundberg & Partners, had decided to pass on doing a retrofit back then. He was satisfied with the building’s financial performance, and he was uncertain whether, one, he could recoup many of the savings since his tenants paid their own utility bills, and two, whether he could find a financing solution that appropriately addressed his time horizon and appetite for risk. However, he was becoming increasingly concerned about future energy price increases, which would raise not only the costs for his tenants but also his own costs in operating the building. Further, he sensed that participants in the real estate market, including tenants and other real estate investors, were starting to pay close attention to the energy performance of buildings. He wondered whether a retrofitted building might benefit from a ‘‘green premium’’ either in terms of occupancy or rental rates. Or should he at the very least be worried about his building being the victim of a ‘‘brown discount’’ if he did nothing? In other countries, mandatory energy disclosure processes and efficiency ratings have been shown to be good ways to stimulate energy efficiency
This document is authorized for use only in Seminar with Corporate and Thought Leaders by Taner Senturk, Bogazici University from November 2016 to May 2017.
212-067 Edward Lundberg and the Rockville Building: Energy Efficiency Finance in Commercial Real Estate
2
investments.3 Could he expect American efficiency disclosure requirements to affect his U.S. buildings any time soon?
Lundberg was meeting with the other partners of his company later in the day. They planned to revisit their decision of a few years ago. Should they invest in an energy retrofit of the building? How would they finance it? Would this affect how long they planned to hold the building, in order to recoup an incremental investment in energy efficiency? And should they worry about energy efficiency performance in all of their properties?
The Opportunity in the Commercial Real Estate Space
The building market was generally broken into four segments according to size, function, and operating characteristics. The four segments were residential; municipalities, universities, schools, and hospitals (MUSH); commercial properties; and industrial facilities.4 Real estate held for investment and rented to business tenants comprised the bulk of commercial properties. In the United States, buildings accounted for 70% of all electricity consumption.5 Commercial properties like Lundberg’s were relatively heavy energy users. They provided lighting and plug power and heating, ventilation, and air conditioning (HVAC) services a minimum of 10 hours per day throughout the entire year, and the equipment needed to provide these services was more complex than the average building owner or manager could understand.6
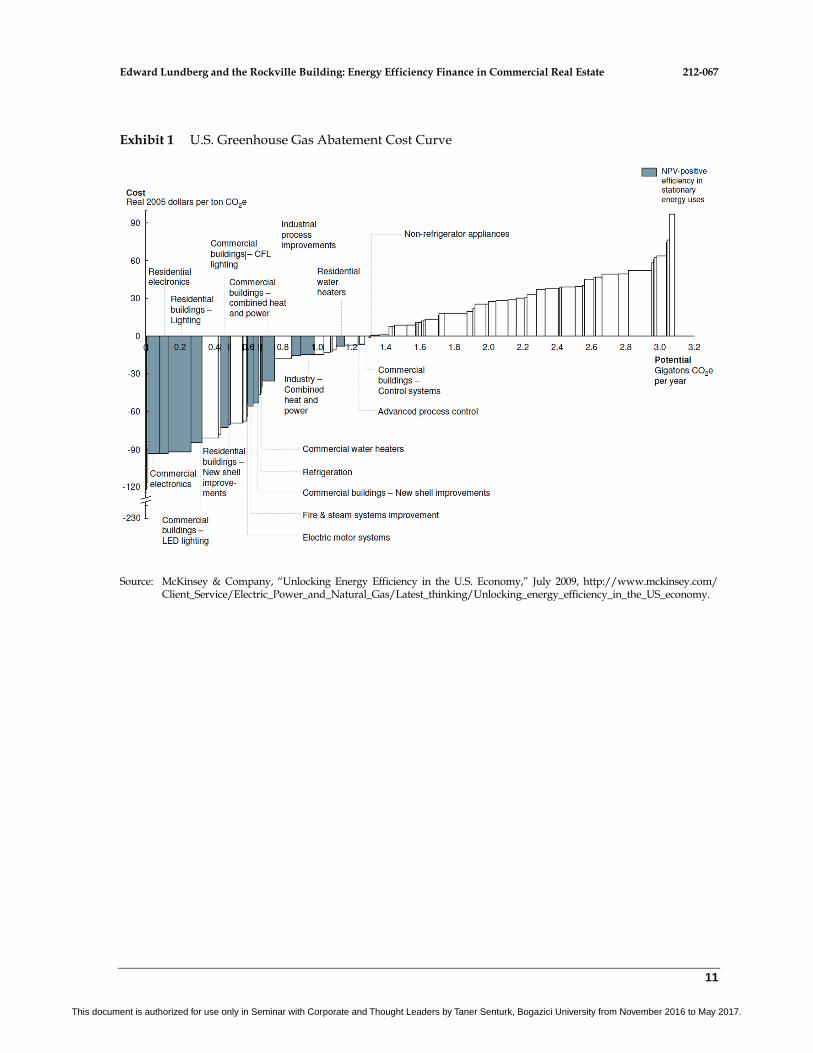
Increasing the energy efficiency of the existing building stock was seen nationally as an obvious step in saving money and creating local construction jobs. Many existing buildings had not been designed for energy efficiency, which meant that there was significant opportunity to retrofit and modernize buildings with existing technologies and systems, enabling owners to save money and reduce their environmental impact. Energy savings potential in the world’s existing buildings was estimated to be between 20% and 40%.7 According to a 2009 study by McKinsey & Company, the United States had the potential for $1.2 trillion in gross energy savings through 2020, well above the $520 billion needed for up-front investments (see Exhibit 1 for the U.S. greenhouse gas abatement cost curve).8 The commercial real estate sector represented 32% of the total potential savings. Current energy efficiency finance in commercial real estate was, however, well below full potential, at around $15 billion to $20 billion per year.9
Energy efficiency investments also presented the opportunity to reduce greenhouse gas emissions associated with generating the electricity that was wastefully powering buildings. Energy efficiency was considered one of the least expensive and lowest risk resources to reduce emissions. Buildings were estimated to be responsible for close to 40% of global CO2e emissions in 2008, with commercial buildings responsible for 30% of global emissions.10 According to one 2010 estimate, it could cost just $0.03 per kWh to save a unit of electricity via efficiency investment compared to over $0.19 per kWh to buy that unit of electricity derived from solar sources. (Both avenues give the end user the same end work benefit). The conclusion was that it is a lot cheaper to invest in efficiency than to invest in replacement production.11
According to James D. Marston of the Environmental Defense Fund who had done research on stimulating private investment in energy efficiency: ‘‘It’s a big deal. We’re talking about tens of billions of dollars in investments, and energy savings that are 10 times that amount. If you do this correctly you will be able to shut down a third of the coal plants in the [United States].’’12
On average, commercial buildings could be in service for up to 100 years, meaning that only 1% of the stock of buildings turned over each year.13 While there was significant savings potential in
This document is authorized for use only in Seminar with Corporate and Thought Leaders by Taner Senturk, Bogazici University from November 2016 to May 2017.

Edward Lundberg and the Rockville Building: Energy Efficiency Finance in Commercial Real Estate 212-067
3
ensuring high levels of efficiency in new buildings, the vast majority of total savings potential lay in retrofitting existing buildings. According to one estimate, 87% of the efficiency savings potential existed in retrofitting old buildings.14
Commercial real estate was also a major global asset class for investors, including individuals and also institutions like pension funds, endowments, insurance companies, real estate investment trusts, and private equity firms. Those financial investors would notice a new way to improve the value of property with a beneficial cash flow and risk-reward aspect.
The Complications
While many of the easiest efficiency measures with very quick payoffs had already been taken, there was substantial energy-efficiency savings potential in the existing stock of commercial buildings. For building owners, energy efficiency had clear benefits in the form of lower operating costs, increased occupancy, enhanced building quality, and increased financial returns.15 Lenders who were eager to deploy investments in energy efficiency seemed to have significant capital. However, the market for financing energy efficiency in commercial buildings was one of the hardest to get right. It suffered from a number of deterrents that prevented owners and lenders from funding and implementing energy efficiency measures.
Capital Issues
Most retrofits required high up-front costs, which meant that owners had to acquire and deploy capital to finance the improvements. Regardless of whether financing came from internal or external sources, these efficiency projects had to compete with other projects for capital.
Organizations made capital available to projects with the greatest potential return. They often did not see energy efficiency as a core component of the business of owning and renting out space. With energy cost representing typically only about 5% of an office tenant company’s operating budget, finding savings was not a priority for either the owner or the tenant. Companies preferred to commit capital to projects that strengthened their core business.16 Further, because of the high up-front costs, capital investments in energy efficiency had relatively long payback periods compared to the shorter payback requirements for standard investments. In the corporate real estate industry, many portfolio managers had maintained even stricter requirements of an 18-month maximum for project paybacks,17 which limited the type of retrofits to relatively simple changes, such as lighting upgrades.
External lenders made capital available to businesses that could demonstrate superior credit performance, had a compelling business model or viable project, and were willing to assign collateral to the loan. The lending rates offered to borrowers reflected these conditions.18 For commercial real estate, the latter two were the main barriers. First, investments were made based on the expectations of future financial performance of the project. There was a risk in energy efficiency projects that the projected energy savings performance would not happen. In turn, this would mean that the return on the invested capital in the project would not be as high as expected. Energy performance models, like those used during retrofits, were often very poor predictors of actual energy use. (Exhibit 2 shows how actual performance mapped against predicted performance in a survey of 98 buildings completed from 2000 to 2006.)
Second, energy efficiency financing was also affected by the lack of collateral available for loans. Many buildings already had some form of permanent debt financing, which put limits on how much more debt the building could assume. The installed energy efficiency infrastructure could not be used
This document is authorized for use only in Seminar with Corporate and Thought Leaders by Taner Senturk, Bogazici University from November 2016 to May 2017.

212-067 Edward Lundberg and the Rockville Building: Energy Efficiency Finance in Commercial Real Estate
4
as collateral, since most mortgages had claims on any improvements or additions made to the building. Any additional debt for a retrofit would require negotiations with the existing lenders. Unwinding any extra loan would also be an added financial complication if the building were to be sold.
Transaction Costs
Most consumers paid for electricity at rates that were higher than what it would cost to spread out the investment to save the same amount of energy. Consumers were willing to pay more to purchase energy than to attempt to save energy because of the relative complexities of the two transactions. Nearly all building owners bought energy as a simple service that affected operating expenses. A customer established an account with a utility company and was billed monthly for its use. Implementing energy efficiency steps, however, required a complex procurement process, capital investments, and the risk associated with the installation and resulting savings.19
The entire process suffered from heavy transaction costs throughout. To improve energy efficiency, a property owner had to first identify the appropriate improvements to install and the operational changes to implement. This required both process expertise and also technical lighting and HVAC expertise. The owner had to measure energy savings and calculate the return. This required the knowledge and expertise of engineers and contractors who could set up the measurement, reporting, and verification (MRV) to track savings. The owner also had to train and manage facility operations staff, and inform occupants and perhaps even ask them to modify their behavior in order to realize the predicted energy savings.20 This was a lot of work outside the core skills and day-to-day tasks of most property managers. Further, deeper retrofits required carefully managing the relationships with existing tenants who would likely be affected by a retrofit project. In high-end commercial buildings, some tenants might have spent large amounts of money designing and decorating their office space, which could prevent even basic upgrades like changing the lighting.
Further, the disaggregated nature and relatively small size of retrofit projects made it a less attractive investment opportunity for lenders, including institutional investors and banks.21
Misaligned Incentives
The commercial real estate market, where the owner (landlord) and occupant (tenant) were different parties, was the most difficult in terms of gaining financing for energy efficiency. Under the terms of most leases, the tenant paid all energy bills. In these circumstances, building owners were not inclined to invest in energy efficiency savings since the revenue from the project (in the form of energy savings) would accrue to the tenant. Similarly, the tenants did not wish to invest in efficiency since their lease time horizon was often uncertain and they did not want to undertake investments in the building that would ultimately benefit the owner upon sale. This issue was not a problem in buildings where the owner and occupier were the same, such as in the MUSH market and company-owned industrial facilities.
Energy Efficiency Securities: The Emergence of a New Asset Class?
Groups like Richard Branson’s Carbon War Room,22 the Clinton Climate Initiative,23 and the World Economic Forum24 were all convinced that the United States and the rest of the world were on the cusp of justifying and making huge investments in energy efficiency that would create jobs and savings, and reduce greenhouse gas emissions. The technology required was mature and field-tested,
This document is authorized for use only in Seminar with Corporate and Thought Leaders by Taner Senturk, Bogazici University from November 2016 to May 2017.
Edward Lundberg and the Rockville Building: Energy Efficiency Finance in Commercial Real Estate 212-067
5
and much of the existing building stock had huge potential for savings. However, retrofitting tended to occur in individual local projects, often at the time of asset repositioning, such as just after the sale of a property. The retrofitting was sometimes partly aided by a maze of utility rebates and government programs with complex approval processes. The large-scale private capital to unlock these improvements did not appear to be readily available.
Much of the energy retrofit financing flowed from the arbitrage of investment returns and perceived risk. Landlords in the U.S. generally expected a return on capital in the mid-teens, based on a number of uncertainties and perceived risks. However, energy efficiency lenders might be satisfied with bond-like returns in the single digits if they could be persuaded that the cash flow stream from future energy savings behaved with the low variability and good payment priority of a bond. Satisfying these conditions required greater certainty about the reliability of savings projections. This required a reliable data set of performance based on the characteristics of the building and geography, being able to identify the ideal candidate buildings for retrofits, as well as understanding commonly accepted standards for data collection and verification. This was one of the keys to unlocking this opportunity and a justification for claims of huge scale benefits. Gary Hattem, president of the Deutsche Bank Americas Foundation, which was working to create a public database of retrofitted buildings, commented:
Retrofitting buildings is considered the low-hanging fruit in carbon reduction, but despite its simplicity, it is still not mainstream. The largest obstacle to making these practices go mainstream is data that will convince building owners to retrofit their properties and at the same time increase underwriters’ willingness to finance projects. . . . If underwriters can determine a predictable savings from retrofits, then they can create a financial instrument backed by these savings to sell on the open market.25
Some business consortia were working to aggregate enough projects that could be financed by larger institutional investors. In 2012, one such consortium, which included Barclays, planned to invest up to $650 million over the subsequent years in commercial buildings in the Miami and Sacramento areas. The consortium was led by Ygrene Energy Fund, which would be responsible for rolling out the retrofit projects. Barclays would provide short-term loans to pay for the upgrades, whose energy savings performance would be guaranteed by the contractors. An insurance underwriter would back the contractors’ warranty. A global reinsurance company would back the insurance contracts. As projects were completed, the upgrade loans provided by Barclays would be bundled into long-term bonds marketed to retirement funds and other similar investors. The upgraded properties would pay a property tax surcharge, less than the energy savings, which effectively went to the bond holders. If an owner sold the property, the surcharge stayed with the property. Success of the project required close scrutiny of the contractors chosen in order to ensure that the retrofits were done cost effectively and properly.26
Could such a model be scaled and replicated across the United States? Given the idiosyncrasies of buildings and local building practices, there were doubts about the scale benefits of energy efficiency retrofits. Every building required a unique design and development of its retrofit opportunities. Further, building practices often differed by region, making it difficult to estimate savings in one area based on performance history in another. Some believed that the challenges were insurmountable, and that the only things that could stimulate large-scale retrofitting were energy efficiency disclosure and performance mandates.
This document is authorized for use only in Seminar with Corporate and Thought Leaders by Taner Senturk, Bogazici University from November 2016 to May 2017.
212-067 Edward Lundberg and the Rockville Building: Energy Efficiency Finance in Commercial Real Estate
6
The Rockville Property
The Building
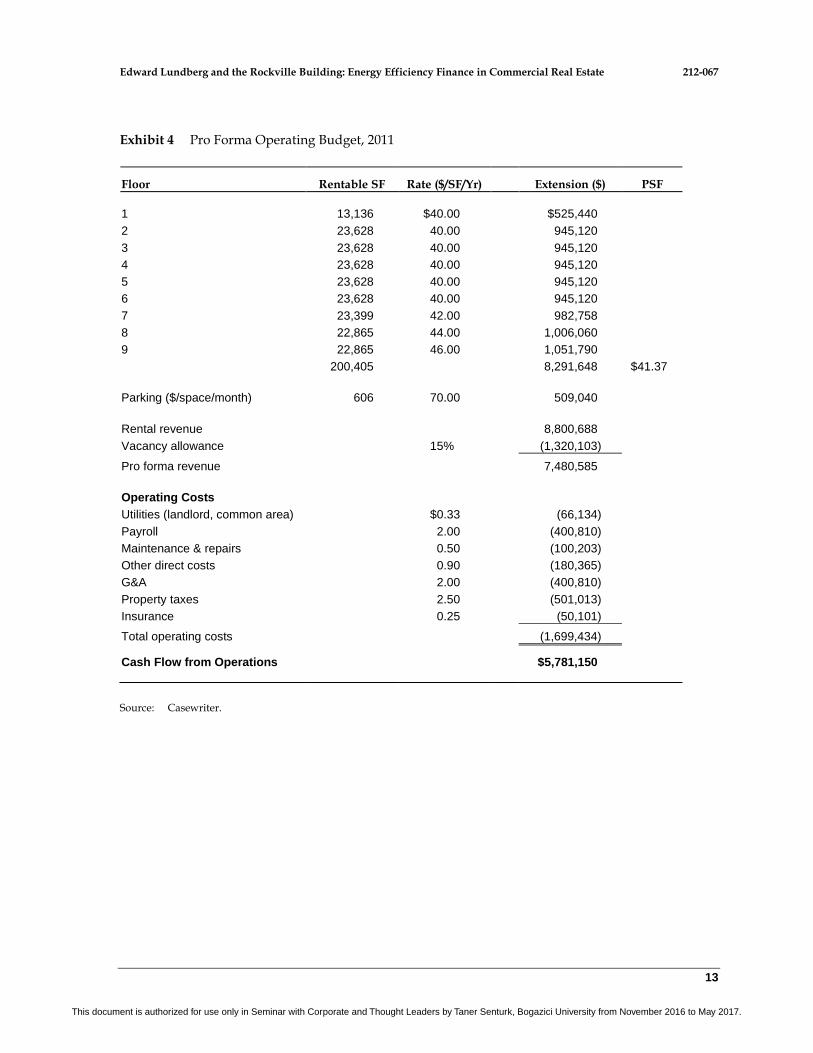
Lundberg & Partners purchased the 200,000-square-foot Rockville building in 2008. Lundberg & Partners normally held its investments for the industry average of 7 to 10 years, although this varied slightly by building.27 However, with the economy still not fully recovered from the global financial crisis, Lundberg was willing to hold onto the building for a longer period. The building, which was constructed in 1971, housed 18 different tenants, all of which were local businesses. (See Exhibit 3 for the financials of a typical tenant.) All of the tenants were signed to ‘‘triple net leases’’ (often abbreviated NNN). This required the tenants to pay their own utilities (like electricity), a pro-rated share of operating expenses for the building (like cleaning and security), and a pro-rated share of taxes and fees for the building. All this was in addition to the fixed rent, which was approximately $41 per square foot. From the landlord’s point of view, the rent was ‘‘net’’ of these costs. Lundberg did, however, bear some costs related to the building’s maintenance and energy use. As landlord, Lundberg paid approximately 10% of the building’s total energy costs. On average, the building used approximately 30 kWh per square foot per year.a,28 (Exhibit 4 shows the landlord’s operating annual pro forma cash flow prior to the energy retrofit project and before any depreciation, amortization, debt service, or income taxes.)
Electricity prices in Maryland were $0.11 kWh, which was a slight 2% decrease from 2010.29 However, since 2000, electricity prices had increased in Maryland by 79% and across the United States by 37%,30 driven in part by growing demand and the increasing share of renewable energy sources in the mix. A more efficient office building was perhaps one way of reducing the risk from future energy cost increases. The continued rise in average global temperatures could not only potentially increase the energy requirements of buildings------for example, through increased heating and cooling demands------but also increase the price of electricity through policies targeting emissions from cheaper but more polluting energy sources like coal.31
While Lundberg & Partners owned the property, it employed the service firm Hallen Properties to oversee all aspects of the property’s operations, including operational and capital budgeting, onsite services, and tenant relationship management. Hallen also acted as the company’s chief engineer, responsible for the day-to-day operations and onsite maintenance and repairs.
The Retrofit
In 2008, when Lundberg’s company had performed an energy audit of the building, it identified a number of areas where it could make significant changes. First, it could improve the building’s weatherization, which required upgrading the loft and wall insulation as well as installing double-glazed windows. Further, the audit recommended installing a more efficient HVAC system, including a control system that would ensure optimal usage. Finally, the audit recommended installing more efficient lighting, as well as motion sensors that turned on only when an area was in use. The total up-front costs of the project were estimated at $4---$8 per square foot; however, unforeseen conditions or delays during the retrofit could drive this cost up. For example, the contractors might find mold or structural problems when opening a wall. For a relatively untouched building from the 1970s, these retrofit changes were projected to reduce the per-kWh energy
a For purposes of simplicity, this building is assumed to be all-electric, although many buildings can fuel heating and cooling by natural gas, oil, or other means. Kilowatt hour (kWh) is a proxy for total energy consumed. Some energy models also look at the variable prices of fuels per unit of energy purchased and deployed, but that is not the situation here.
This document is authorized for use only in Seminar with Corporate and Thought Leaders by Taner Senturk, Bogazici University from November 2016 to May 2017.

Edward Lundberg and the Rockville Building: Energy Efficiency Finance in Commercial Real Estate 212-067
7
consumption of the building by 30% once fully implemented. However, the estimated savings could vary considerably depending on the condition of the building, on whether any of the easier changes had already been done, and on the climate zone. Further, estimated savings and actual performance varied widely once changes had been made, since energy models were often not good predictors of actual energy use. Lundberg had investments in many cities, so its experience as owners could not necessarily be generalized or extended from one geographic area to another, given different climate conditions.
The Financing and Project Planning Options
The energy audit of the building outlined clear measures that Lundberg could implement in the Rockville building. None of the measures required new or untested technologies; however, none of the partners in the firm had any experience with energy efficiency installations or their performance reliability. Lundberg had to make sure that two fundamental tasks were properly addressed, whether by his company or by a third party. First, he needed to finance the up-front costs of the project at an appropriate rate. Second, the design and development of the retrofit project needed to be managed, including finding the right contractors to install the building upgrades. There were uncertainties inherent in both tasks. Where could he get the cheapest financing? Would the upgrade be on budget? Could he really expect 30% energy savings from the retrofit? Would the retrofit generate the returns Lundberg needed to finance the up-front capital costs?
Lundberg began to think about his options for the project, knowing that each had different implications for his financing costs as well as the project management and implementation.
Do-It-Yourself
Bank debt Lundberg could use the company’s local bank, with which it had a long-standing relationship. The firm could undertake the retrofit project itself, finding the necessary contractors and subcontractors to do the work. Under this scenario, Lundberg & Partners would bear all the performance risk of the retrofit. Commercial banks were generally uncomfortable with energy improvement lending to multitenant commercial buildings, since they did not have adequate security supporting the new loan. Since the only effective claim against the loan would be the promise of future energy savings, Lundberg wondered whether the bank would to lend him $1.2 million at an interest rate of less than 11%. The high interest rate reflected the risk that the bank bore from having no claims against newly installed assets from the retrofit (for example, new lighting fixtures), since the debt used to purchase the building required any upgrades to be tied to the original asset. The bank was indifferent to whether this was an energy efficiency upgrade or, say, a lobby redecoration or an upgrade of elevator cabs; it was something to enhance the marketability of the building, and its security position was unchanged. If Lundberg took out a loan, he was likely to pay a fixed-interest-only payment and pay back the full amount upon sale of the building.
Equity financing Alternatively, Lundberg also considered the partner group itself, of which he was a member, as a source of capital. Lundberg & Partners had purchased the building for $76.4 million in 2008, financed with $33 million in debt and $43.4 million in equity. In this scenario, the partner group could simply pay for the upgrade out of retained earnings or with a cash call. This solution, however, also required Lundberg to take on the risk and responsibility of finding the contractors to do the energy efficiency retrofit. Was he comfortable investing his own money in the retrofit? What should his relevant hurdle rate be?
This document is authorized for use only in Seminar with Corporate and Thought Leaders by Taner Senturk, Bogazici University from November 2016 to May 2017.

212-067 Edward Lundberg and the Rockville Building: Energy Efficiency Finance in Commercial Real Estate
8
Energy Service Company
Energy service performance contract Another option for Lundberg was to sign an energy service performance contract (ESPC) with an energy service company (ESCO). ESCOs acted as energy efficiency project developers for building owners and assumed the technical and performance risks associated with the project by monitoring and guaranteeing that the predicted energy savings materialized. However, their ability to guarantee the energy savings depended on measuring both the actual usage and the energy that would have been used without the retrofit. The need to estimate this business-as-usual baseline scenario presented one of the biggest challenges in designing a performance contract.32 An ESCO would do the energy auditing, as well act as general contractor for all the retrofitting work. In addition, the ESCO would pay for any additional maintenance for the duration of the performance contract, which was typically 10 to 15 years.33 A small number of ESCOs owned by equipment manufacturers (such as Siemens or Johnson Controls) generated a majority of the industry revenues; however, most ESCOs were independent.34
Lundberg had also considered signing a non-performance-based contract with an ESCO. Under such a design/build agreement, the ESCO would be compensated for designing and installing the retrofit project, with equipment warranties to ensure that the installed improvements worked as designed. However, the ESCO would not carry any risk for the actual energy savings performance of the retrofit.35 ESCOs worked mostly under performance contracts, but specifically in the commercial market, they had mostly done the cheaper design/build contracts, which were appropriate for the simpler retrofits that commercial building owners typically favored.
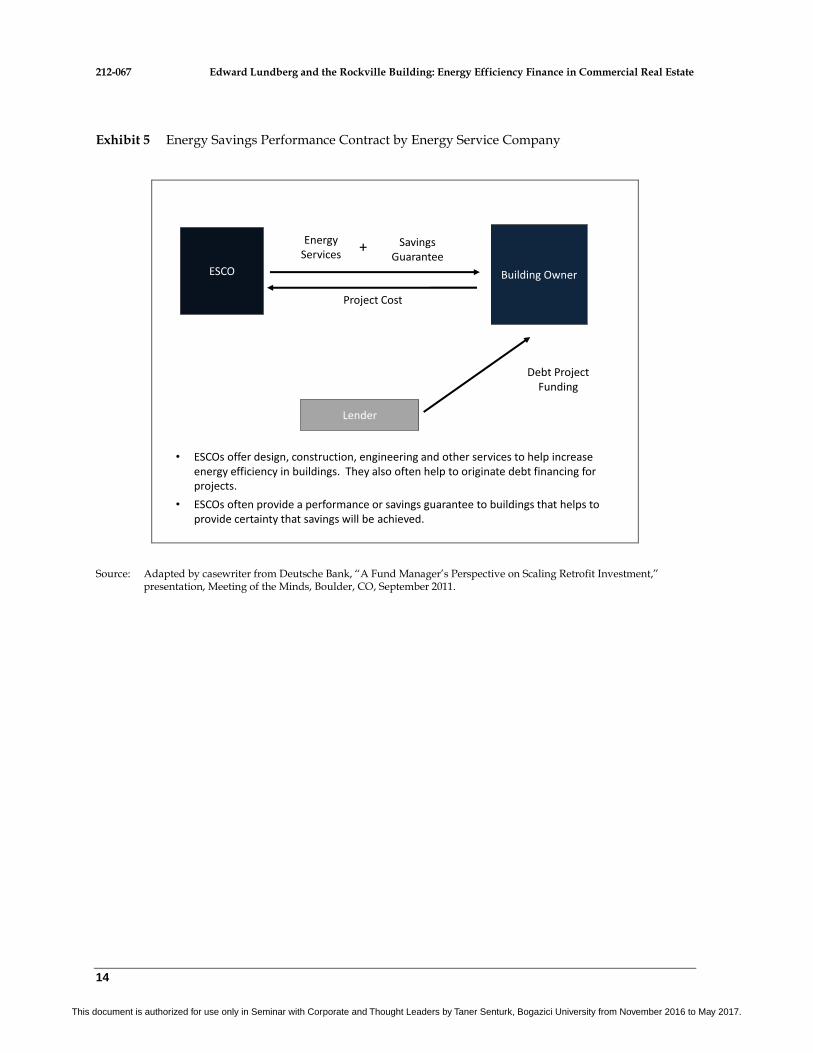
ESCOs did not finance energy efficiency projects, but rather helped secure financing from third-party sources. The borrower, or building owner, was expected to meet its loan obligation, irrespective of whether the savings materialized or the ESCO delivered on its performance guarantee. Thus, the performance guarantee was for the technical performance of the equipment, not the borrower’s ability to pay, meaning most banks did not consider the guarantee to be acceptable collateral against the incremental loan. The ESCO made most of its money up front from the retrofit installation through markups on the audit, design, equipment, construction management labor, and subcontracted labor. It could also sign service contracts for the maintenance and repair of the installed assets for the life of the contract. The ESCO would charge an estimated 20% markup on the project, but less if the contract was only design/build. The third-party financier brought into the deal would be repaid over time from the ESCO-guaranteed savings.36 (See Exhibit 5 for an example.)
The ESCO industry had a long track record primarily in the MUSH market, which accounted for 80% of industry revenues in 2007.37 Customers in this sector tended to own their own facilities, had long-term time horizons, and were often subject to aggressive legislative or executive energy savings mandates.38 Also, because there were relatively high transaction costs in designing, developing, and negotiating performance contracts, ESCOs favored large customers like those in the MUSH market.39 For this reason, ESCOs generally didn’t take on projects of less than $500,000.40 Since the 1970s, ESCOs had completed an estimated $20 billion of projects in the United States.41 In 2007, commercial buildings accounted for only about 9% of industry revenues. The commercial sector seemed to be hindered by owners’ reluctance to burden their buildings with the debt to finance the projects, which might interfere with the future sale of the property.42
This document is authorized for use only in Seminar with Corporate and Thought Leaders by Taner Senturk, Bogazici University from November 2016 to May 2017.
Edward Lundberg and the Rockville Building: Energy Efficiency Finance in Commercial Real Estate 212-067
9
With an ESCO performance guarantee against the energy savings, Lundberg hoped he might be able to borrow the capital needed for the project at an interest rate of approximately 8% per annum.b
ESA, MESA, and Non-Debt Financing
Instead of financing the purchase of energy efficiency upgrades with internal capital or debt, Lundberg could instead purchase the efficiency as an energy service. This financing option was often referred to as an efficiency service agreement (ESA) or a managed energy services agreement (MESA). (See Exhibits 6 and 7 for examples and Exhibit 8 for a glossary of terms.) Under this scenario, ownership of the energy efficiency assets remained with the service provider, while the building owner paid a fee for, or share of, the energy savings generated by the retrofit. The energy efficiency upgrade thus remained off of the building owner’s balance sheet and instead became an operating expense. Splitting ownership of the efficiency upgrade assets and the building itself required carefully drafted contracts. Providers of such lease services were reluctant to call them off-balance sheet financing since the assets were on someone’s balance sheet, namely theirs. Both the ESA and MESA were themselves special purpose entities capitalized by outside debt and equity.43
Financing energy efficiency as a service would help Lundberg avoid all capital outlay associated with a retrofit project. Instead, the owner would pay the service provider for performance for reducing energy use. Under an ESA, the building owner paid either a fixed cost per avoided kWh of electricity or a floating rate equal to a percentage of the actual utility rate. Both the owner and the service provider paid for savings at a pre-agreed baseline. So long as the agreed rate (fixed or floating) was less than the cost of otherwise buying the electricity that had been reduced, the deal made financial sense for the owner. A variation was a MESA, where Lundberg would pay a sum less than or equal to the building’s historical energy bill such that it was at least expense-neutral for the customer. The MESA provider then paid all utility bills, which were lower following the retrofits, on behalf of Lundberg, returning the savings to its own investors. It had the pre-agreed ability to adjust Lundberg’s payments to account for changes in weather, occupancy, usage, and energy costs. Additional costs were incurred to monitor and verify savings, which potentially required an independent auditor.44 Both models had the advantage that the owner’s payment for energy savings (for the ESA or MESA services) could be passed on to tenants as operating expenses if they had a net lease in which they paid their own energy costs. The savings thus accrued to the service provider making the investment, not to the tenants.
Contracts for both models were typically for less than 10 years, with buyout options during the term of the agreement, for example, upon sale of the building. The two models differed in the extent to which professional energy service companies were involved in the auditing, installation, and maintenance of the retrofitting. The ESA model utilized these external players, often involving an ESPC that guaranteed the savings. The MESA model did utilize some third-party service providers, but it often conducted engineering, design, and monitoring services itself to capture a larger share of the rents created by the retrofit.
b A typical MUSH market project in 2011 was financed at rates of 4.5% to 5% for terms of up to 20 years. A typical federal project had rates up to 7%, higher than MUSH market rates, because federal facilities could not take on debt without an act of Congress, thus requiring more complex project financing than MUSH market financing.
This document is authorized for use only in Seminar with Corporate and Thought Leaders by Taner Senturk, Bogazici University from November 2016 to May 2017.

212-067 Edward Lundberg and the Rockville Building: Energy Efficiency Finance in Commercial Real Estate
10
The Pro Forma
Lundberg needed to assess the financial viability of the various financing options before he could make any recommendation. The energy efficiency retrofit clearly created value at the building level when the 30% projected energy savings were compared to the required investment. However, given how the tenant contracts were structured, many of the energy savings wouldn’t accrue to Lundberg. Further, there were many uncertainties that would influence whether this deal would make sense for the company. Would the actual energy savings performance be 30%? Could it expect any impact on rents or occupancy levels? The company was already increasing rents by 3% per annum, in line with expected increases in maintenance cost inflation. Would it be able to increase rents further?
Lundberg also needed to think about how the investment decision affected the company’s time horizon of its ownership of the building, which it purchased in 2007. Normally, it held buildings for 7 to 10 years. How would the economics of the building change if it sold the building in only a few years, but after an energy efficiency retrofit? Most commercial real estate buildings were valued as investments as a function of yield on their annual cash flow from operations, expressed as a capitalization rate (‘‘cap rate’’). The cap rate was the ratio of net operating income to property value. In the Maryland market, buildings were selling at prices that worked out to an 8% yield on cash flow (an 8% cap rate). Would the retrofit generate any increases in net operating income that could boost the property value and sale price?
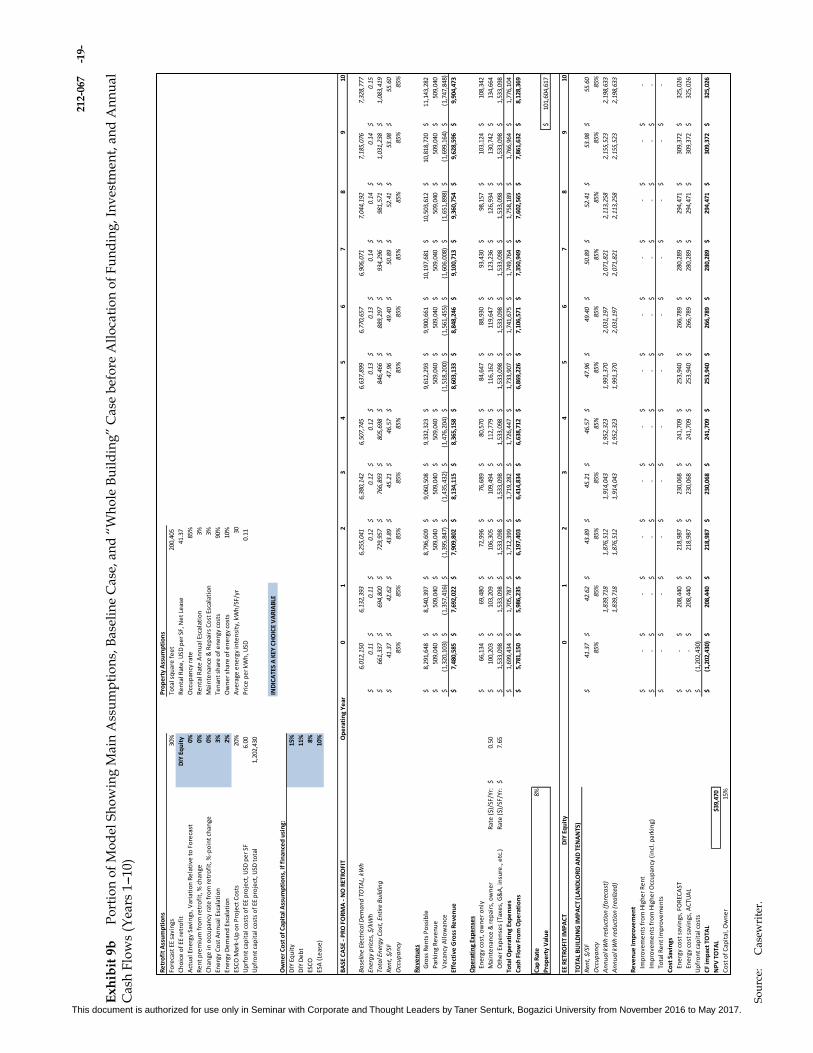
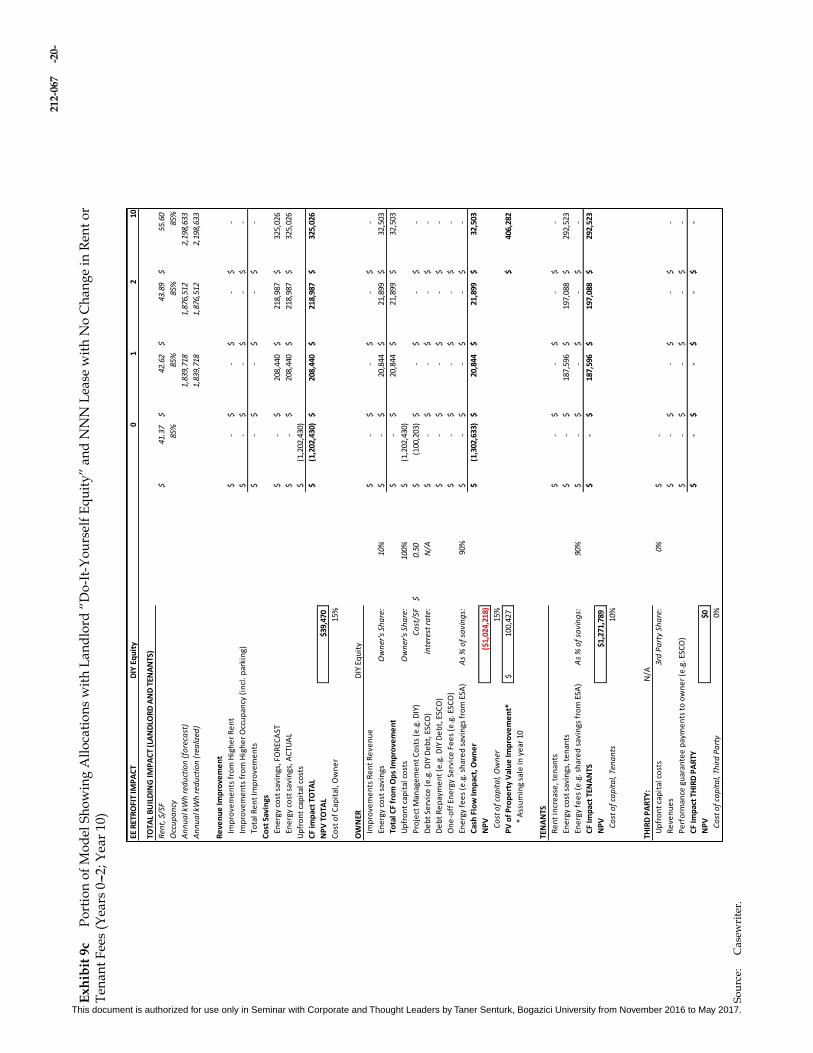
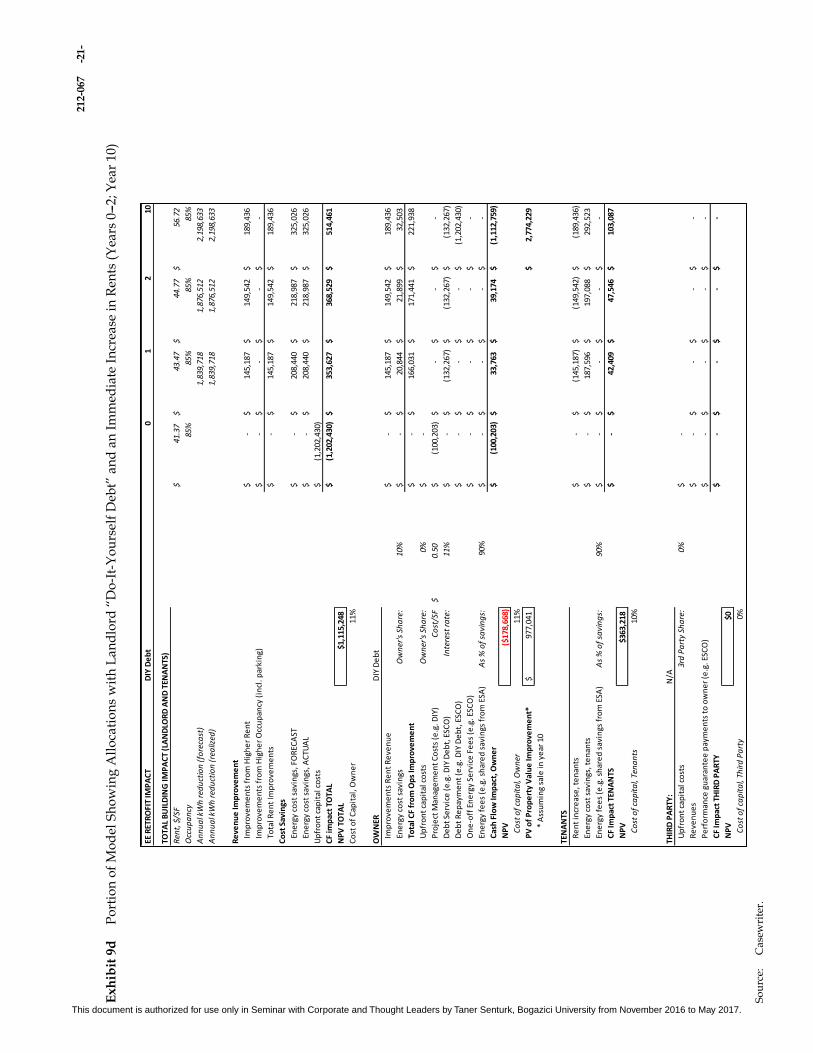
Lundberg’s team built a model to compare baseline operations without an energy efficiency retrofit with the projected impacts of finding the capital, doing the work, and tracking the resultant cash flows. The approach was first to look at the impact on the whole building without regard to the allocation of which parties provided the investment, paid for the improvements, and realized the benefits. (The structure of the model and key assumptions are in Exhibits 9a, b, c, d, and e.) Then, Lundberg ran various scenarios allocating these obligations and benefits in different contractual ways among the parties. He was very interested in the contractual, negotiation, allocation of risk, and cost-of-capital considerations. If there was low-hanging fruit to be had in the financing of energy efficiency retrofits in commercial real estate, thoughtful negotiation, organization, and consideration of markets were needed to garner it. He wondered if entities that could reduce the transaction costs in this process could gain a defensible strategic advantage over others in this piece of a very big industry.
Decision
As Lundberg neared his company’s office, he needed to decide how he would present this idea to his partners. Energy efficiency was clearly a huge opportunity in terms of the entire industry, but could he get a deal done that addressed his specific constraints and concerns? Was there financing that made sense, given the risks?
This document is authorized for use only in Seminar with Corporate and Thought Leaders by Taner Senturk, Bogazici University from November 2016 to May 2017.
Edward Lundberg and the Rockville Building: Energy Efficiency Finance in Commercial Real Estate 212-067
11
Exhibit 1 U.S. Greenhouse Gas Abatement Cost Curve
Source: McKinsey & Company, ‘‘Unlocking Energy Efficiency in the U.S. Economy,’’ July 2009, http://www.mckinsey.com/ Client_Service/Electric_Power_and_Natural_Gas/Latest_thinking/Unlocking_energy_efficiency_in_the_US_economy.
This document is authorized for use only in Seminar with Corporate and Thought Leaders by Taner Senturk, Bogazici University from November 2016 to May 2017.

212-067 Edward Lundberg and the Rockville Building: Energy Efficiency Finance in Commercial Real Estate
12
Exhibit 2 Simulated vs. Measured Energy Use Intensity
Source: Holly W. Samuelson, Andrew Lantz, and Christoph Reinhart, ‘‘Identifying Non-Technical Barriers to Energy Model Sharing and Reuse,’’ Harvard Graduate School of Design, presentation, Building Simulation Conference, Sydney, Australia, November 2011, http://www.gsd.harvard.edu/research/gsdsquare/ Publications/Barriers_BS2011.pdf, accessed January 2012.
Exhibit 3 Relative Cost of Energy in Typical Service Company’s Income Statement
Percent of Revenue
Revenue from tenant’s business 100.0%
Cost of labor 40.0%
Cost of energy 5.0%
Other costs 30.0%
Rent 20.0%
Margin in tenant’s business 5.0%
Source: Casewriter.
This document is authorized for use only in Seminar with Corporate and Thought Leaders by Taner Senturk, Bogazici University from November 2016 to May 2017.
Edward Lundberg and the Rockville Building: Energy Efficiency Finance in Commercial Real Estate 212-067
13
Exhibit 4 Pro Forma Operating Budget, 2011
Floor Rentable SF Rate ($/SF/Yr) Extension ($) PSF
1 13,136 $40.00
$525,440
2 23,628 40.00
945,120
3 23,628 40.00
945,120
4 23,628 40.00
945,120
5 23,628 40.00
945,120
6 23,628 40.00
945,120
7 23,399 42.00
982,758
8 22,865 44.00
1,006,060
9 22,865 46.00
1,051,790
200,405
8,291,648 $41.37
Parking ($/space/month) 606 70.00 509,040
Rental revenue 8,800,688
Vacancy allowance 15% (1,320,103)
Pro forma revenue 7,480,585
Operating Costs
Utilities (landlord, common area) $0.33 (66,134)
Payroll 2.00 (400,810)
Maintenance & repairs 0.50 (100,203)
Other direct costs 0.90 (180,365)
G&A 2.00 (400,810)
Property taxes 2.50 (501,013)
Insurance 0.25 (50,101)
Total operating costs (1,699,434)
Cash Flow from Operations $5,781,150
Source: Casewriter.
This document is authorized for use only in Seminar with Corporate and Thought Leaders by Taner Senturk, Bogazici University from November 2016 to May 2017.
212-067 Edward Lundberg and the Rockville Building: Energy Efficiency Finance in Commercial Real Estate
14
Exhibit 5 Energy Savings Performance Contract by Energy Service Company
Building OwnerESCO
Lender
Energy Services
Debt Project Funding
Project Cost
+ Savings Guarantee
• ESCOs offer design, construction, engineering and other services to help increase energy efficiency in buildings. They also often help to originate debt financing for projects.
• ESCOs often provide a performance or savings guarantee to buildings that helps to provide certainty that savings will be achieved.
Source: Adapted by casewriter from Deutsche Bank, ‘‘A Fund Manager’s Perspective on Scaling Retrofit Investment,’’ presentation, Meeting of the Minds, Boulder, CO, September 2011.
This document is authorized for use only in Seminar with Corporate and Thought Leaders by Taner Senturk, Bogazici University from November 2016 to May 2017.

Edward Lundberg and the Rockville Building: Energy Efficiency Finance in Commercial Real Estate 212-067
15
Exhibit 6 Illustrative Example of an Efficiency Service Agreement
Building Owner
Contractors, ESCO, or
ESPLease Provider
Project Installation
Efficiency Service Agreement: 100% of project cost covered. Customer repayment based on avoided energy use.
Lease Provider executes a contract with an ESCO or ESP to cover all project installation and maintenace
Source: Adapted by casewriter from Bob Hinkle and David Kenny, ‘‘Energy Efficiency Paying the Way: New Financing Strategies Remove First-Cost Hurdles,’’ CalCEF Innovations, February 2010, http://www.fypower.org/pdf/ CALCEF-WP-EE-2010.pdf, accessed January 2012.
This document is authorized for use only in Seminar with Corporate and Thought Leaders by Taner Senturk, Bogazici University from November 2016 to May 2017.

212-067 Edward Lundberg and the Rockville Building: Energy Efficiency Finance in Commercial Real Estate
16
Exhibit 7 Illustrative Example of a Managed Energy Service Agreement
Building Owner
Tenants
Energy Efficiency Lender
Project Control Account
(“Lockbox”)Utility Company
Service AgreementOperating Co.
(Equity)
Utility Disconnection
Rent + expense
above base case
Invested Returns
M&V Costs and Profit
Energy services agreement and retrofit upgrade
Provides Capital
Utility payment
Historic energy
payment
Source: Adapted by casewriter from ‘‘A Profitable and Resource Efficient Future: Catalysing Retrofit Finance and Investing in Commercial Real Estate,’’ World Economic Forum, October 2011, http://www3.weforum.org/docs/WEF_IU_ CatalysingRetrofitFinanceInvestingCommercialRealEstate_Report_2011.pdf, accessed January 2012.
This document is authorized for use only in Seminar with Corporate and Thought Leaders by Taner Senturk, Bogazici University from November 2016 to May 2017.
Edward Lundberg and the Rockville Building: Energy Efficiency Finance in Commercial Real Estate 212-067
17
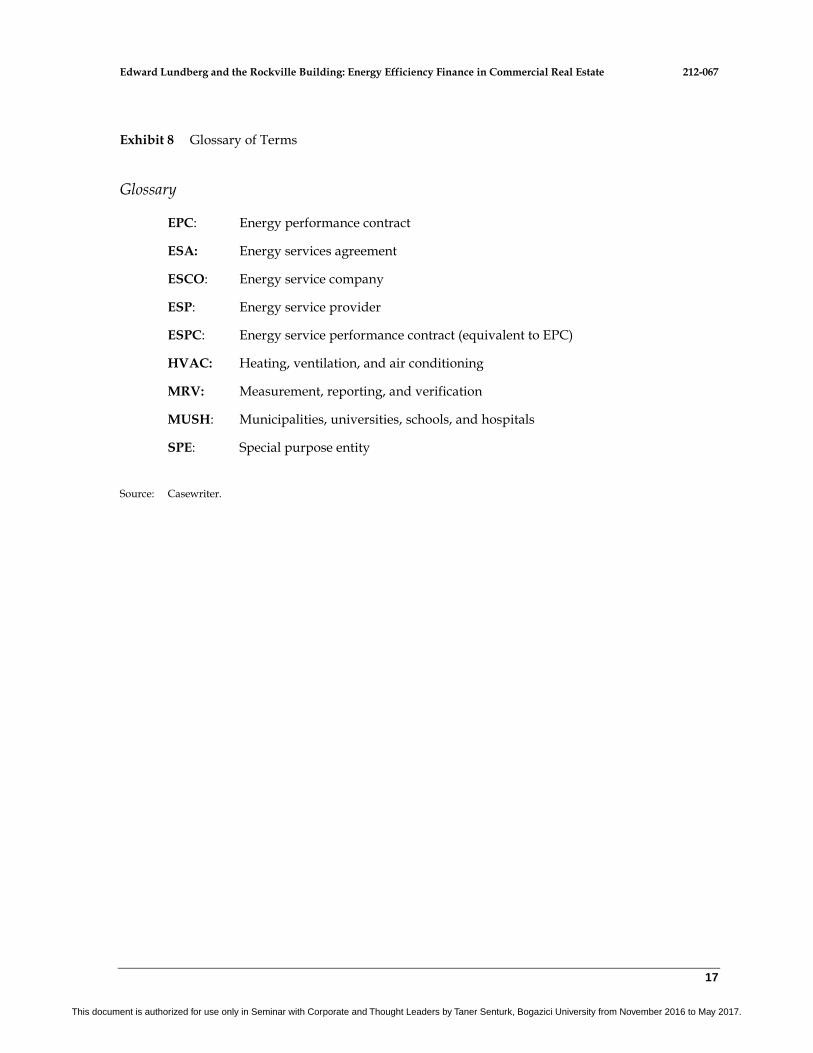
Exhibit 8 Glossary of Terms
Glossary
EPC: Energy performance contract
ESA: Energy services agreement
ESCO: Energy service company
ESP: Energy service provider
ESPC: Energy service performance contract (equivalent to EPC)
HVAC: Heating, ventilation, and air conditioning
MRV: Measurement, reporting, and verification
MUSH: Municipalities, universities, schools, and hospitals
SPE: Special purpose entity
Source: Casewriter.
This document is authorized for use only in Seminar with Corporate and Thought Leaders by Taner Senturk, Bogazici University from November 2016 to May 2017.
212-067 Edward Lundberg and the Rockville Building: Energy Efficiency Finance in Commercial Real Estate
18
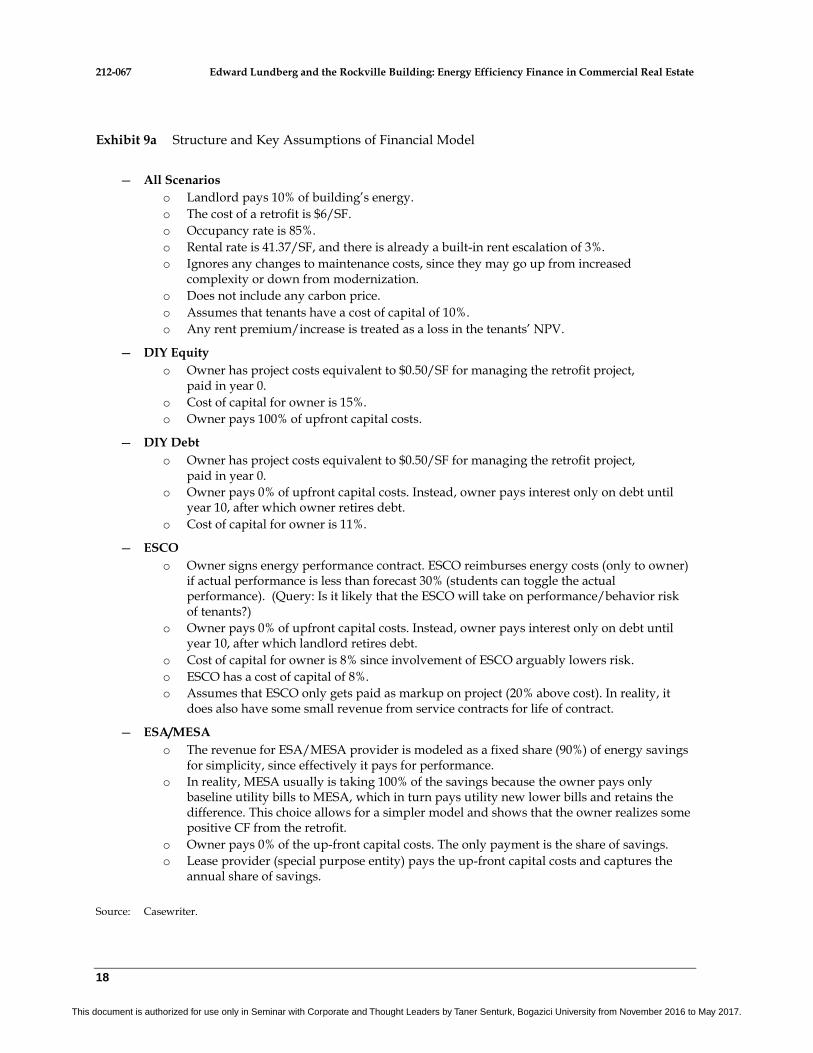
Exhibit 9a Structure and Key Assumptions of Financial Model
— All Scenarios
o Landlord pays 10% of building’s energy.
o The cost of a retrofit is $6/SF.
o Occupancy rate is 85%.
o Rental rate is 41.37/SF, and there is already a built-in rent escalation of 3%.
o Ignores any changes to maintenance costs, since they may go up from increased complexity or down from modernization.
o Does not include any carbon price.
o Assumes that tenants have a cost of capital of 10%.
o Any rent premium/increase is treated as a loss in the tenants’ NPV.
— DIY Equity
o Owner has project costs equivalent to $0.50/SF for managing the retrofit project, paid in year 0.
o Cost of capital for owner is 15%.
o Owner pays 100% of upfront capital costs.
— DIY Debt
o Owner has project costs equivalent to $0.50/SF for managing the retrofit project, paid in year 0.
o Owner pays 0% of upfront capital costs. Instead, owner pays interest only on debt until year 10, after which owner retires debt.
o Cost of capital for owner is 11%.
— ESCO
o Owner signs energy performance contract. ESCO reimburses energy costs (only to owner) if actual performance is less than forecast 30% (students can toggle the actual performance). (Query: Is it likely that the ESCO will take on performance/behavior risk of tenants?)
o Owner pays 0% of upfront capital costs. Instead, owner pays interest only on debt until year 10, after which landlord retires debt.
o Cost of capital for owner is 8% since involvement of ESCO arguably lowers risk.
o ESCO has a cost of capital of 8%.
o Assumes that ESCO only gets paid as markup on project (20% above cost). In reality, it does also have some small revenue from service contracts for life of contract.
— ESA/MESA
o The revenue for ESA/MESA provider is modeled as a fixed share (90%) of energy savings for simplicity, since effectively it pays for performance.
o In reality, MESA usually is taking 100% of the savings because the owner pays only baseline utility bills to MESA, which in turn pays utility new lower bills and retains the difference. This choice allows for a simpler model and shows that the owner realizes some positive CF from the retrofit.
o Owner pays 0% of the up-front capital costs. The only payment is the share of savings.
o Lease provider (special purpose entity) pays the up-front capital costs and captures the annual share of savings.
Source: Casewriter.
This document is authorized for use only in Seminar with Corporate and Thought Leaders by Taner Senturk, Bogazici University from November 2016 to May 2017.
212
-067
-19
-
Ex
hib
it 9
bP
ort
ion
of
Mo
del
Sh
ow
ing
Ma
in A
ssu
mp
tio
ns,
Ba
seli
ne
Ca
se,
an
d ‘‘
Wh
ole
Bu
ild
ing
’’ C
ase
bef
ore
All
oca
tio
n o
f F
un
din
g,
Inv
estm
ent,
an
d A
nn
ual
C
ash
Flo
ws
(Yea
rs 1
---1
0)
So
urc
e:
Ca
sew
rite
r.
Re
tro
fit
Ass
um
pti
on
sP
rop
ert
y A
ssu
mp
tio
ns
Fore
cast
EE
savi
ngs
30%
Tota
l sq
uar
e f
ee
t20
0,40
5
Ch
oic
e o
f EE
re
tro
fit
DIY
Eq
uit
yR
en
tal R
ate
, USD
pe
r SF
, Ne
t Le
ase
41.3
7
Act
ual
En
erg
y Sa
vin
gs, V
aria
tio
n R
ela
tive
to
Fo
reca
st
0%O
ccu
pan
cy r
ate
85%
Re
nt
pre
miu
m f
rom
re
tro
fit,
% c
han
ge0%
Re
nta
l Rat
e A
nn
ual
Esc
alat
ion
3%
Ch
ange
in o
ccu
pan
cy r
ate
fro
m r
etr
ofi
t, %
-po
int
chan
ge0%
Mai
nte
nan
ce &
Re
pai
rs C
ost
Esc
alat
ion
3%
Ene
rgy
Co
st A
nn
ual
Esc
alat
ion
3%Te
nan
t sh
are
of
en
erg
y co
sts
90%
Ene
rgy
De
man
d E
scal
atio
n2%
Ow
ne
r sh
are
of
en
erg
y co
sts
10%
ESC
O M
ark-
Up
on
Pro
ject
Co
sts
20%
Ave
rage
en
erg
y in
ten
sity
, kW
h/S
F/yr
30
Up
rfo
nt
cap
ital
co
sts
of
EE p
roje
ct, U
SD p
er
SF6.
00
Pri
ce p
er
kWh
, USD
0.11
Up
fro
nt
cap
ital
co
sts
of
EE p
roje
ct, U
SD t
ota
l 1,
202,
430
IND
ICA
TES
A K
EY C
HO
ICE
VA
RIA
BLE
Ow
ne
r C
ost
of
Cap
ital
Ass
um
pti
on
s, if
fin
ance
d u
sin
g:
DIY
Eq
uit
y15
%
DIY
De
bt
11%
ESC
O8%
ESA
(Le
ase
)10
%
BA
SE C
ASE
- P
RO
FO
RM
A -
NO
RET
RO
FIT
Op
era
tin
g Y
ear
01
23
45
67
89
10
Ba
selin
e El
ectr
ica
l Dem
an
d T
OTA
L, k
Wh
6,01
2,15
0
6,
132,
393
6,25
5,04
1
6,
380,
142
6,50
7,74
5
6,63
7,89
9
6,
770,
657
6,90
6,07
1
7,
044,
192
7,18
5,07
6
7,32
8,77
7
Ener
gy
pri
ces,
$/k
Wh
0.11
$
0.
11$
0.12
$
0.12
$
0.
12$
0.13
$
0.
13$
0.14
$
0.14
$
0.14
$
0.15
$
Tota
l En
erg
y C
ost
, En
tire
Bu
ildin
g66
1,33
7$
694,
800
$
72
9,95
7$
766,
893
$
80
5,69
8$
846,
466
$
88
9,29
7$
934,
296
$
98
1,57
1$
1,03
1,23
8$
1,08
3,41
9$
Ren
t, $
/SF
41.3
7$
42.6
2$
43.8
9$
45.2
1$
46
.57
$
47.9
6$
49
.40
$
50.8
9$
52.4
1$
53.9
8$
55.6
0$
Occ
up
an
cy85
%85
%85
%85
%85
%85
%85
%85
%85
%85
%85
%
Re
ven
ue
s
Gro
ss R
en
ts P
oss
ible
8,29
1,64
8$
8,
540,
397
$
8,79
6,60
9$
9,
060,
508
$
9,33
2,32
3$
9,
612,
293
$
9,90
0,66
1$
10
,197
,681
$
10
,503
,612
$
10
,818
,720
$
11,1
43,2
82$
Par
kin
g R
eve
nu
e50
9,04
0$
509,
040
$
50
9,04
0$
509,
040
$
50
9,04
0$
509,
040
$
50
9,04
0$
509,
040
$
50
9,04
0$
509,
040
$
509,
040
$
Vac
ancy
All
ow
ance
(1,3
20,1
03)
$
(1
,357
,416
)$
(1
,395
,847
)$
(1
,435
,432
)$
(1,4
76,2
04)
$
(1
,518
,200
)$
(1,5
61,4
55)
$
(1
,606
,008
)$
(1
,651
,898
)$
(1
,699
,164
)$
(1
,747
,848
)$
Effe
ctiv
e G
ross
Re
ven
ue
7,48
0,58
5$
7,
692,
022
$
7,90
9,80
2$
8,
134,
115
$
8,36
5,15
8$
8,
603,
133
$
8,84
8,24
6$
9,
100,
713
$
9,36
0,75
4$
9,
628,
596
$
9,
904,
473
$
Op
era
tin
g Ex
pe
nse
s
Ene
rgy
cost
, ow
ne
r o
nly
66,1
34$
69
,480
$
72,9
96$
76
,689
$
80,5
70$
84
,647
$
88,9
30$
93
,430
$
98,1
57$
10
3,12
4$
10
8,34
2$
Mai
nte
nan
ce &
re
pai
rs, o
wn
er
Rat
e (
$)/S
F/Yr
:0.
50$
100,
203
$
10
3,20
9$
106,
305
$
10
9,49
4$
112,
779
$
11
6,16
2$
119,
647
$
12
3,23
6$
126,
934
$
13
0,74
2$
13
4,66
4$
Oth
er
Exp
en
ses
(Tax
es,
G&
A, i
nsu
re.,
etc
.)R
ate
($)
/SF/
Yr:
7.65
$
1,
533,
098
$
1,53
3,09
8$
1,
533,
098
$
1,53
3,09
8$
1,
533,
098
$
1,53
3,09
8$
1,
533,
098
$
1,53
3,09
8$
1,
533,
098
$
1,53
3,09
8$
1,53
3,09
8$
Tota
l Op
era
tin
g Ex
pe
nse
s1,
699,
434
$
1,70
5,78
7$
1,
712,
399
$
1,71
9,28
2$
1,
726,
447
$
1,73
3,90
7$
1,
741,
675
$
1,74
9,76
4$
1,
758,
189
$
1,76
6,96
4$
1,77
6,10
4$
Cas
h F
low
Fro
m O
pe
rati
on
s5,
781,
150
$
5,98
6,23
5$
6,
197,
403
$
6,41
4,83
4$
6,
638,
712
$
6,86
9,22
6$
7,
106,
571
$
7,35
0,94
9$
7,
602,
565
$
7,86
1,63
2$
8,12
8,36
9$
Cap
Rat
e8%
Pro
pe
rty
Val
ue
101,
604,
617
$
EE R
ETR
OFI
T IM
PA
CT
DIY
Eq
uit
y0
12
34
56
78
910
TOTA
L B
UIL
DIN
G IM
PA
CT
(LA
ND
LOR
D A
ND
TEN
AN
TS)
Ren
t, $
/SF
41.3
7$
42.6
2$
43.8
9$
45.2
1$
46
.57
$
47.9
6$
49
.40
$
50.8
9$
52.4
1$
53.9
8$
55.6
0$
Occ
up
an
cy85
%85
%85
%85
%85
%85
%85
%85
%85
%85
%85
%
An
nu
al k
Wh
red
uct
ion
(fo
reca
st)
1,83
9,71
8
1,
876,
512
1,91
4,04
3
1,
952,
323
1,
991,
370
2,03
1,19
7
2,
071,
821
2,11
3,25
8
2,
155,
523
2,
198,
633
An
nu
al k
Wh
red
uct
ion
(re
aliz
ed)
1,83
9,71
8
1,
876,
512
1,91
4,04
3
1,
952,
323
1,
991,
370
2,03
1,19
7
2,
071,
821
2,11
3,25
8
2,
155,
523
2,
198,
633
Re
ven
ue
Imp
rove
me
nt
Imp
rove
me
nts
fro
m H
igh
er
Re
nt
-$
-
$
-$
-
$
-$
-
$
-$
-
$
-$
-
$
-
$
Imp
rove
me
nts
fro
m H
igh
er
Occ
up
ancy
(in
cl. p
arki
ng)
-$
-
$
-$
-
$
-$
-
$
-$
-
$
-$
-
$
-
$
Tota
l Re
nt
Imp
rove
me
nts
-$
-
$
-$
-
$
-$
-
$
-$
-
$
-$
-
$
-
$
Co
st S
avin
gs
Ene
rgy
cost
sav
ings
, FO
REC
AST
-$
20
8,44
0$
218,
987
$
23
0,06
8$
241,
709
$
25
3,94
0$
266,
789
$
28
0,28
9$
294,
471
$
30
9,37
2$
32
5,02
6$
Ene
rgy
cost
sav
ings
, AC
TUA
L-
$
208,
440
$
21
8,98
7$
230,
068
$
24
1,70
9$
253,
940
$
26
6,78
9$
280,
289
$
29
4,47
1$
309,
372
$
325,
026
$
Up
fro
nt
cap
ital
co
sts
(1,2
02,4
30)
$
CF
imp
act
TOTA
L(1
,202
,430
)$
208,
440
$
21
8,98
7$
230,
068
$
24
1,70
9$
253,
940
$
26
6,78
9$
280,
289
$
29
4,47
1$
309,
372
$
325,
026
$
NP
V T
OTA
L$3
9,47
0
Co
st o
f C
apit
al, O
wn
er
15%
This document is authorized for use only in Seminar with Corporate and Thought Leaders by Taner Senturk, Bogazici University from November 2016 to May 2017.
212
-067
-20
-
Ex
hib
it 9
cP
ort
ion
of
Mo
del
Sh
ow
ing
All
oca
tio
ns
wit
h L
an
dlo
rd ‘‘
Do
-It-
Yo
urs
elf
Eq
uit
y’’
an
d N
NN
Lea
se w
ith
No
Ch
an
ge
in R
ent
or
T
enan
t F
ees
(Yea
rs 0
---2
; Y
ear
10
)
So
urc
e:
Ca
sew
rite
r.
EE R
ETR
OFI
T IM
PA
CT
DIY
Eq
uit
y0
12
10
TOTA
L B
UIL
DIN
G IM
PA
CT
(LA
ND
LOR
D A
ND
TEN
AN
TS)
Ren
t, $
/SF
41.3
7$
42.6
2$
43.8
9$
55.6
0$
Occ
up
an
cy85
%85
%85
%85
%
An
nu
al k
Wh
red
uct
ion
(fo
reca
st)
1,83
9,71
8
1,
876,
512
2,19
8,63
3
An
nu
al k
Wh
red
uct
ion
(re
aliz
ed)
1,83
9,71
8
1,
876,
512
2,19
8,63
3
Re
ven
ue
Imp
rove
me
nt
Imp
rove
me
nts
fro
m H
igh
er
Re
nt
-$
-
$
-$
-
$
Imp
rove
me
nts
fro
m H
igh
er
Occ
up
ancy
(in
cl. p
arki
ng)
-$
-
$
-$
-
$
Tota
l Re
nt
Imp
rove
me
nts
-$
-
$
-$
-
$
Co
st S
avin
gs
Ene
rgy
cost
sav
ings
, FO
REC
AST
-$
20
8,44
0$
218,
987
$
32
5,02
6$
Ene
rgy
cost
sav
ings
, AC
TUA
L-
$
208,
440
$
21
8,98
7$
325,
026
$
Up
fro
nt
cap
ital
co
sts
(1,2
02,4
30)
$
CF
imp
act
TOTA
L(1
,202
,430
)$
208,
440
$
21
8,98
7$
325,
026
$
NP
V T
OTA
L$3
9,47
0
Co
st o
f C
apit
al, O
wn
er
15%
OW
NER
DIY
Eq
uit
y
Imp
rove
me
nts
Re
nt
Re
ven
ue
-$
-
$
-$
-
$
Ene
rgy
cost
sav
ings
Ow
ner
's S
ha
re:
10%
-$
20
,844
$
21,8
99$
32
,503
$
Tota
l CF
fro
m O
ps
Imp
rove
me
nt
-$
20
,844
$
21,8
99$
32
,503
$
Up
fro
nt
cap
ital
co
sts
Ow
ner
's S
ha
re:
100%
(1,2
02,4
30)
$
Pro
ject
Man
age
me
nt
Co
sts
(e.g
. DIY
)C
ost
/SF
0.50
$
(1
00,2
03)
$
-
$
-$
-
$
De
bt
Serv
ice
(e
.g. D
IY D
eb
t, E
SCO
)In
tere
st r
ate
:N
/A-
$
-$
-
$
-$
De
bt
Re
pay
me
nt
(e.g
. DIY
De
bt,
ESC
O)
-$
-
$
-$
-
$
On
e-o
ff E
ne
rgy
Serv
ice
Fe
es
(e.g
. ESC
O)
-$
-
$
-$
-
$
Ene
rgy
fee
s (e
.g. s
har
ed
sav
ings
fro
m E
SA)
As
% o
f sa
vin
gs:
90%
-$
-
$
-$
-
$
Cas
h F
low
Imp
act,
Ow
ne
r(1
,302
,633
)$
20,8
44$
21
,899
$
32,5
03$
NP
V($
1,02
4,21
8)
Co
st o
f ca
pit
al,
Ow
ner
15%
PV
of
Pro
pe
rty
Val
ue
Imp
rove
me
nt*
100,
427
$
406,
282
$
* A
ssu
min
g sa
le in
ye
ar 1
0
TEN
AN
TS
Re
nt
incr
eas
e, t
en
ants
-$
-
$
-$
-
$
Ene
rgy
cost
sav
ings
, te
nan
ts-
$
187,
596
$
19
7,08
8$
292,
523
$
Ene
rgy
fee
s (e
.g. s
har
ed
sav
ings
fro
m E
SA)
As
% o
f sa
vin
gs:
90%
-$
-
$
-$
-
$
CF
Imp
act
TEN
AN
TS-
$
187,
596
$
19
7,08
8$
292,
523
$
NP
V$1
,271
,789
Co
st o
f ca
pit
al,
Ten
an
ts10
%
THIR
D P
AR
TY:
N/A
Up
fro
nt
cap
ital
co
sts
3rd
Pa
rty
Sha
re:
0%-
$
Re
ven
ue
s-
$
-$
-
$
-$
Pe
rfo
rman
ce g
uar
ante
e p
aym
en
ts t
o o
wn
er
(e.g
. ESC
O)
-$
-
$
-$
-
$
CF
Imp
act
THIR
D P
AR
TY-
$
-$
-
$
-$
NP
V$0
Co
st o
f ca
pit
al,
Thir
d P
art
y0%
This document is authorized for use only in Seminar with Corporate and Thought Leaders by Taner Senturk, Bogazici University from November 2016 to May 2017.
212
-067
-21
-
Ex
hib
it 9
dP
ort
ion
of
Mo
del
Sh
ow
ing
All
oca
tio
ns
wit
h L
an
dlo
rd ‘‘
Do
-It-
Yo
urs
elf
Deb
t’’
an
d a
n I
mm
edia
te I
ncr
ease
in
Ren
ts (
Yea
rs 0
---2
; Y
ear
10
)
S
ou
rce:
C
ase
wri
ter.
EE R
ETR
OFI
T IM
PA
CT
DIY
De
bt
01
210
TOTA
L B
UIL
DIN
G IM
PA
CT
(LA
ND
LOR
D A
ND
TEN
AN
TS)
Ren
t, $
/SF
41.3
7$
43.4
7$
44.7
7$
56.7
2$
Occ
up
an
cy85
%85
%85
%85
%
An
nu
al k
Wh
red
uct
ion
(fo
reca
st)
1,83
9,71
8
1,
876,
512
2,19
8,63
3
An
nu
al k
Wh
red
uct
ion
(re
aliz
ed)
1,83
9,71
8
1,
876,
512
2,19
8,63
3
Re
ven
ue
Imp
rove
me
nt
Imp
rove
me
nts
fro
m H
igh
er
Re
nt
-$
14
5,18
7$
149,
542
$
18
9,43
6$
Imp
rove
me
nts
fro
m H
igh
er
Occ
up
ancy
(in
cl. p
arki
ng)
-$
-
$
-$
-
$
Tota
l Re
nt
Imp
rove
me
nts
-$
14
5,18
7$
149,
542
$
18
9,43
6$
Co
st S
avin
gs
Ene
rgy
cost
sav
ings
, FO
REC
AST
-$
20
8,44
0$
218,
987
$
32
5,02
6$
Ene
rgy
cost
sav
ings
, AC
TUA
L-
$
208,
440
$
21
8,98
7$
325,
026
$
Up
fro
nt
cap
ital
co
sts
(1,2
02,4
30)
$
CF
imp
act
TOTA
L(1
,202
,430
)$
353,
627
$
36
8,52
9$
514,
461
$
NP
V T
OTA
L$1
,115
,248
Co
st o
f C
apit
al, O
wn
er
11%
OW
NER
DIY
De
bt
Imp
rove
me
nts
Re
nt
Re
ven
ue
-$
14
5,18
7$
149,
542
$
18
9,43
6$
Ene
rgy
cost
sav
ings
Ow
ner
's S
ha
re:
10%
-$
20
,844
$
21,8
99$
32
,503
$
Tota
l CF
fro
m O
ps
Imp
rove
me
nt
-$
16
6,03
1$
171,
441
$
22
1,93
8$
Up
fro
nt
cap
ital
co
sts
Ow
ner
's S
ha
re:
0%-
$
Pro
ject
Man
age
me
nt
Co
sts
(e.g
. DIY
)C
ost
/SF
0.50
$
(1
00,2
03)
$
-
$
-$
-
$
De
bt
Serv
ice
(e
.g. D
IY D
eb
t, E
SCO
)In
tere
st r
ate
:11
%-
$
(132
,267
)$
(132
,267
)$
(132
,267
)$
De
bt
Re
pay
me
nt
(e.g
. DIY
De
bt,
ESC
O)
-$
-
$
-$
(1
,202
,430
)$
On
e-o
ff E
ne
rgy
Serv
ice
Fe
es
(e.g
. ESC
O)
-$
-
$
-$
-
$
Ene
rgy
fee
s (e
.g. s
har
ed
sav
ings
fro
m E
SA)
As
% o
f sa
vin
gs:
90%
-$
-
$
-$
-
$
Cas
h F
low
Imp
act,
Ow
ne
r(1
00,2
03)
$
33
,763
$
39,1
74$
(1
,112
,759
)$
NP
V($
178,
668)
Co
st o
f ca
pit
al,
Ow
ner
11%
PV
of
Pro
pe
rty
Val
ue
Imp
rove
me
nt*
977,
041
$
2,77
4,22
9$
* A
ssu
min
g sa
le in
ye
ar 1
0
TEN
AN
TS
Re
nt
incr
eas
e, t
en
ants
-$
(1
45,1
87)
$
(1
49,5
42)
$
(1
89,4
36)
$
Ene
rgy
cost
sav
ings
, te
nan
ts-
$
187,
596
$
19
7,08
8$
292,
523
$
Ene
rgy
fee
s (e
.g. s
har
ed
sav
ings
fro
m E
SA)
As
% o
f sa
vin
gs:
90%
-$
-
$
-$
-
$
CF
Imp
act
TEN
AN
TS-
$
42,4
09$
47
,546
$
103,
087
$
NP
V$3
63,2
18
Co
st o
f ca
pit
al,
Ten
an
ts10
%
THIR
D P
AR
TY:
N/A
Up
fro
nt
cap
ital
co
sts
3rd
Pa
rty
Sha
re:
0%-
$
Re
ven
ue
s-
$
-$
-
$
-$
Pe
rfo
rman
ce g
uar
ante
e p
aym
en
ts t
o o
wn
er
(e.g
. ESC
O)
-$
-
$
-$
-
$
CF
Imp
act
THIR
D P
AR
TY-
$
-$
-
$
-$
NP
V$0
Co
st o
f ca
pit
al,
Thir
d P
art
y0%
This document is authorized for use only in Seminar with Corporate and Thought Leaders by Taner Senturk, Bogazici University from November 2016 to May 2017.

212
-067
-22
-
Ex
hib
it 9
eP
ort
ion
of
Mo
del
Sh
ow
ing
En
erg
y S
erv
ices
Ag
reem
ent
wit
h S
av
ing
s F
low
ing
Pri
ma
rily
to
ES
A P
rov
ider
(Y
ears
0---
2;
Yea
r 1
0)
So
urc
e:
Ca
sew
rite
r.
EE R
ETR
OFI
T IM
PA
CT
ESA
(Le
ase
)0
12
10
TOTA
L B
UIL
DIN
G IM
PA
CT
(LA
ND
LOR
D A
ND
TEN
AN
TS)
Ren
t, $
/SF
41.3
7$
42.6
2$
43.8
9$
55.6
0$
Occ
up
an
cy85
%85
%85
%85
%
An
nu
al k
Wh
red
uct
ion
(fo
reca
st)
1,83
9,71
8
1,
876,
512
2,19
8,63
3
An
nu
al k
Wh
red
uct
ion
(re
aliz
ed)
1,83
9,71
8
1,
876,
512
2,19
8,63
3
Re
ven
ue
Imp
rove
me
nt
Imp
rove
me
nts
fro
m H
igh
er
Re
nt
-$
-
$
-$
-
$
Imp
rove
me
nts
fro
m H
igh
er
Occ
up
ancy
(in
cl. p
arki
ng)
-$
-
$
-$
-
$
Tota
l Re
nt
Imp
rove
me
nts
-$
-
$
-$
-
$
Co
st S
avin
gs
Ene
rgy
cost
sav
ings
, FO
REC
AST
-$
20
8,44
0$
218,
987
$
32
5,02
6$
Ene
rgy
cost
sav
ings
, AC
TUA
L-
$
208,
440
$
21
8,98
7$
325,
026
$
Up
fro
nt
cap
ital
co
sts
(1,2
02,4
30)
$
CF
imp
act
TOTA
L(1
,202
,430
)$
208,
440
$
21
8,98
7$
325,
026
$
NP
V T
OTA
L$3
19,9
81
Co
st o
f C
apit
al, O
wn
er
10%
OW
NER
ESA
(Le
ase
)
Imp
rove
me
nts
Re
nt
Re
ven
ue
-$
-
$
-$
-
$
Ene
rgy
cost
sav
ings
Ow
ner
's S
ha
re:
10%
-$
20
,844
$
21,8
99$
32
,503
$
Tota
l CF
fro
m O
ps
Imp
rove
me
nt
-$
20
,844
$
21,8
99$
32
,503
$
Up
fro
nt
cap
ital
co
sts
Ow
ner
's S
ha
re:
0%-
$
Pro
ject
Man
age
me
nt
Co
sts
(e.g
. DIY
)C
ost
/SF
0.50
$
-
$
-$
-
$
-$
De
bt
Serv
ice
(e
.g. D
IY D
eb
t, E
SCO
)In
tere
st r
ate
:N
/A-
$
-$
-
$
-$
De
bt
Re
pay
me
nt
(e.g
. DIY
De
bt,
ESC
O)
-$
-
$
-$
-
$
On
e-o
ff E
ne
rgy
Serv
ice
Fe
es
(e.g
. ESC
O)
-$
-
$
-$
-
$
Ene
rgy
fee
s (e
.g. s
har
ed
sav
ings
fro
m E
SA)
As
% o
f sa
vin
gs:
90%
-$
(1
8,76
0)$
(1
9,70
9)$
(2
9,25
2)$
Cas
h F
low
Imp
act,
Ow
ne
r-
$
2,08
4$
2,19
0$
3,25
0$
NP
V$1
4,13
1
Co
st o
f ca
pit
al,
Ow
ner
10%
PV
of
Pro
pe
rty
Val
ue
Imp
rove
me
nt*
156,
639
$
406,
282
$
* A
ssu
min
g sa
le in
ye
ar 1
0
TEN
AN
TS
Re
nt
incr
eas
e, t
en
ants
-$
-
$
-$
-
$
Ene
rgy
cost
sav
ings
, te
nan
ts-
$
187,
596
$
19
7,08
8$
292,
523
$
Ene
rgy
fee
s (e
.g. s
har
ed
sav
ings
fro
m E
SA)
As
% o
f sa
vin
gs:
90%
-$
(1
68,8
36)
$
(1
77,3
80)
$
(2
63,2
71)
$
CF
Imp
act
TEN
AN
TS-
$
18,7
60$
19
,709
$
29,2
52$
NP
V$1
27,1
79
Co
st o
f ca
pit
al,
Ten
an
ts10
%
THIR
D P
AR
TY:
Spe
cial
Pu
rpo
se E
nti
ty
Up
fro
nt
cap
ital
co
sts
3rd
Pa
rty
Sha
re:
100%
(1,2
02,4
30)
$
Re
ven
ue
s-
$
187,
596
$
19
7,08
8$
292,
523
$
Pe
rfo
rman
ce g
uar
ante
e p
aym
en
ts t
o o
wn
er
(e.g
. ESC
O)
-$
-
$
-$
-
$
CF
Imp
act
THIR
D P
AR
TY(1
,202
,430
)$
187,
596
$
19
7,08
8$
292,
523
$
NP
V$3
11,5
94
Co
st o
f ca
pit
al,
Thir
d P
art
y8%
This document is authorized for use only in Seminar with Corporate and Thought Leaders by Taner Senturk, Bogazici University from November 2016 to May 2017.
Edward Lundberg and the Rockville Building: Energy Efficiency Finance in Commercial Real Estate 212-067
23
Endnotes
1 ‘‘Obama Administration Launches New Energy Efficiency Efforts,’’ U.S. Department of Energy, June 29, 2009, http://www1.eere.energy.gov/buildings/m/news_detail.html?news_id=12607, accessed December 2011.
2 Ian Fischer, ‘‘Can New Financing Solutions Scale Up Energy Efficiency?’’ MIT Energy Finance Forum, Massachusetts Institute of Technology, Cambridge, MA, November 18, 2011.
3 World Economic Forum, ‘‘A Profitable and Resource Efficient Future: Catalyzing Retrofit Finance and Investing in Commercial Real Estate,’’ October 2011, http://www3.weforum.org/docs/WEF_IU_Catalysing RetrofitFinanceInvestingCommercialRealEstate_Report_2011.pdf, accessed January 2012.
4 Namrita Kapur, Jake Hiller, Robin Langdon, and Alan Abramson, ‘‘Show Me the Money------Energy Efficiency Financing Barriers and Opportunities,’’ Environmental Defense Fund, July 2011, http://www. edf.orsites/default/files/11860_EnergyEfficiencyFinancingBarriersandOpportunities_July%202011.pdf, accessed January 2012.
5 Bracken Hendricks, Benjamin Goldstein, Reid Detchon, and Kurt Shickman, ‘‘Rebuilding America: A National Policy Framework for Investment in Energy Efficiency Retrofits,’’ Center for American Progress, August 2009, http://www.americanprogress.org/issues/2009/08/pdf/rebuilding_america.pdf, accessed January 2012.
6 Harcourt Brown & Carey, Inc., ‘‘Energy Efficiency Financing in California Needs and Gaps,’’ July 8, 2011.
7 Dave Myers, ‘‘Johnson Controls,’’ presentation, Barclays Conference, February 2011, http://www.johnson controls.com/publish/etc/medialib/jci/corporate/investors/2011.Par.89530.File.tmp/Barclays%20presentation.pdf, accessed January 2012.
8 McKinsey & Company, ‘‘Unlocking Energy Efficiency in the U.S. Economy,’’ July 2009, http://www. mckinsey.com/Client_Service/Electric_Power_and_Natural_Gas/Latest_thinking/Unlocking_energy_efficiency_in_the_US_economy, accessed January 2012.
9 Greg Kats, Aaron Menkin, Jeremy Dommu, and Matthew DeBold, ‘‘Energy Efficiency Financing------Models and Strategies,’’ Capital E, September 2011, http://www.cap-e.com/Capital-E/Capital-E_files/EnergyEfficiency Financing------Models and Strategies.pdf, accessed January 2012.
10 World Economic Forum, ‘‘A Profitable and Resource Efficient Future.’’
11 Bob Hinkle and David Kenny, ‘‘Energy Efficiency Paying the Way: New Financing Strategies Remove First-Cost Hurdles,’’ CalCEF Innovations, February 2010, http://www.fypower.org/pdf/CALCEF-WP-EE-2010.pdf, accessed January 2012.
12 Justin Gills, ‘‘Tax Plan to Turn Old Buildings ‘Green’ Finds Favor,’’ New York Times, September 19, 2011, http://www.nytimes.com/2011/09/20/business/energy-environment/tax-plan-to-turn-old-buildings-green-finds-favor.html, accessed January 2012.
13 Sustainable Energy Research Group, ‘‘Creating a More Sustainable Urban Environment,’’ University of Southampton, http://www.energy.soton.ac.uk/buildings/buildings.html, accessed January 2012.
14 World Economic Forum, ‘‘A Profitable and Resource Efficient Future.’’
15 Kats et al., ‘‘Energy Efficiency Financing.’’
16 Harcourt Brown & Carey, Inc., ‘‘Energy Efficiency Financing in California Needs and Gaps.’’
17 Kapur et al., ‘‘Show Me the Money.’’
18 Harcourt Brown & Carey, Inc., ‘‘Energy Efficiency Financing in California Needs and Gaps.’’
19 Harcourt Brown & Carey, Inc., ‘‘Energy Efficiency Financing in California Needs and Gaps.’’
This document is authorized for use only in Seminar with Corporate and Thought Leaders by Taner Senturk, Bogazici University from November 2016 to May 2017.
212-067 Edward Lundberg and the Rockville Building: Energy Efficiency Finance in Commercial Real Estate
24
20 Harcourt Brown & Carey, Inc., ‘‘Energy Efficiency Financing in California Needs and Gaps.’’
21 World Economic Forum, ‘‘A Profitable and Resource Efficient Future.’’
22 Carbon War Room, ‘‘The Sector------Energy Efficiency,’’ http://www.carbonwarroom.com/sector/energy-efficiency, accessed February 2012.
23 Karen Kroll, ‘‘Clinton Climate Initiative Unveils Program To Boost Energy Efficiency,’’ Facilitiesnet, August 2008, http://www.facilitiesnet.com/energyefficiency/article/Clinton-Climate-Initiative-Unveals-Program-to-Boost-Energy-Efficiency------9397#, accessed February 2012.
24 World Economic Forum, ‘‘A Profitable and Resource Efficient Future.’’
25 Julie Satow, ‘‘Showing the Benefits of ‘Green’ Retrofits,’’ New York Times, June 1, 2010, http://www. nytimes.com/2010/06/02/realestate/commercial/02deutsche.html, accessed January 2012.
26 Justin Gills, ‘‘Tax Plan to Turn Old Buildings ‘Green’ Finds Favor,’’ New York Times, September 19, 2011, http://www.nytimes.com/2011/09/20/business/energy-environment/tax-plan-to-turn-old-buildings-green-finds-favor.html, accessed January 2012.
27 Brian A. Ciochetti and Jeffrey D. Fisher, ‘‘The Characteristics of Commercial Real Estate Holding Period Returns (IRRs),’’ University of North Carolina, Indiana University, http://www.reri.org/research/ article_pdf/wp104.pdf, accessed January 2012.
28 Scott R. Muldavin, ‘‘Value Beyond Cost Savings, How to Underwrite Sustainable Properties: Expanded Ch. IV Sustainable Property Performance,’’ Green Building Finance Consortium, http://www.greenbuilding fc.com/Documents/expanded_chapter_IV.pdf, accessed January 2012.
29 ‘‘Average Retail Price of Electricity to Ultimate Customers: Commercial Sector by State and Utility,’’ U.S. Energy Information Administration, http://205.254.135.7/electricity/data.cfm#sales, accessed January 2012.
30 ‘‘Detailed Average Price by State by Provider, Back to 1990 (Form EIA-861),’’ U.S. Energy Information Administration, November 15, 2011, http://www.eia.gov/electricity/data.cfm#sales, accessed January 2012.
31 Seth H. Holmes and Christoph F. Reinhart, ‘‘Climate Change Risks from a Building Owner’s Perspective: Assessing Future Climate and Energy Price Scenarios,’’ Harvard University Graduate School of Design, submitted to ‘‘Building Simulation 2011,’’ http://www.gsd.harvard.edu/research/gsdsquare/Publications/ Holmes_Reinhart_FuturePrices_Submitted.pdf, accessed January 2012.
32 Schneider Electric, ‘‘Trust but Verify------M&V: The Key to Monetizing Energy Efficiency Improvements,’’ http://www.institutebe.com/energy-policy/monetizing-energy-efficiency-improvements.aspx, accessed January 2012.
33 ‘‘Energy Savings Performance Contracting,’’ U.S. Department of Energy, March 15, 2011, http://www1. eere.energy.gov/wip/solutioncenter/financialproducts/espc.html, accessed January 2012.
34 ICF International, National Association of Energy Services Companies, ‘‘Introduction to Energy Performance Contracting,’’ October 2007, http://www.energystar.gov/ia/partners/spp_res/Introduction_ to_Performance_Contracting.pdf, accessed January 2012.
35 Nicole Hopper, Dave Birr, and Kate McMordie Stoughton, ‘‘Public and Institutional Markets for ESCO Services: Comparing Programs, Practices and Performance,’’ Ernest Orlando Lawrence Berkeley National Laboratory, March 2005, http://eetd.lbl.gov/EA/EMP/reports/55002.pdf, accessed January 2012.
36 Jeff Dominick, ‘‘Energy Service Company Overview,’’ National Renewable Energy Laboratory, August 25, 2011, http://apps1.eere.energy.gov/tribalenergy/pdfs/tribal_business/esco_0811.pdf, accessed January 2012.
37 ICF International, National Association of Energy Services Companies, ‘‘Introduction to Energy Performance Contracting.’’
This document is authorized for use only in Seminar with Corporate and Thought Leaders by Taner Senturk, Bogazici University from November 2016 to May 2017.

Edward Lundberg and the Rockville Building: Energy Efficiency Finance in Commercial Real Estate 212-067
25
38 Andrew Satchwell, Charles Goldman, Peter Larsen, Donald Gilligan, and Terry Singer, ‘‘A Survey of the U.S. ESCO Industry: Market Growth and Development from 2008 to 2011,’’ Ernest Orlando Lawrence Berkeley National Laboratory, June 2010, http://eetd.lbl.gov/ea/ems/reports/lbnl-3479e.pdf, accessed January 2012.
39 ICF International, National Association of Energy Services Companies, ‘‘Introduction to Energy Performance Contracting,’’
40 Dale Hahs and Donald Gilligan, ‘‘Financing Program Support for ARRA Recipients------Energy Savings Performance Contracting,’’ Webinar presentation, January 14, 2010, http://www1.eere.energy.gov/ wip/solutioncenter/pdfs/espc_webinar_011410.pdf, accessed January 2012.
41 National Association of Energy Services Company, ‘‘What is an ESCO?,’’ http://www.naesco.org/ resources/esco.htm, accessed January 2012.
42 ICF International, National Association of Energy Services Companies, ‘‘Introduction to Energy Performance Contracting.’’
43 Hinkle and Kenny, ‘‘Energy Efficiency Paying the Way.’’
44 Kats et al., ‘‘Energy Efficiency Financing.’’
This document is authorized for use only in Seminar with Corporate and Thought Leaders by Taner Senturk, Bogazici University from November 2016 to May 2017.