educational technology 1 lesson 13: teaching with visual symbols (plants vs. zombies theme)
TRANSCRIPT

Please click on the apple to start.

Educational TechnologySubmitted to:
Prof. James L. PaglinawanSubmitted by:
Ian Jay P. SaldoLarry J. Sultiz
Please click on the clock to continue.
EXIT

CLICK HERE TO START
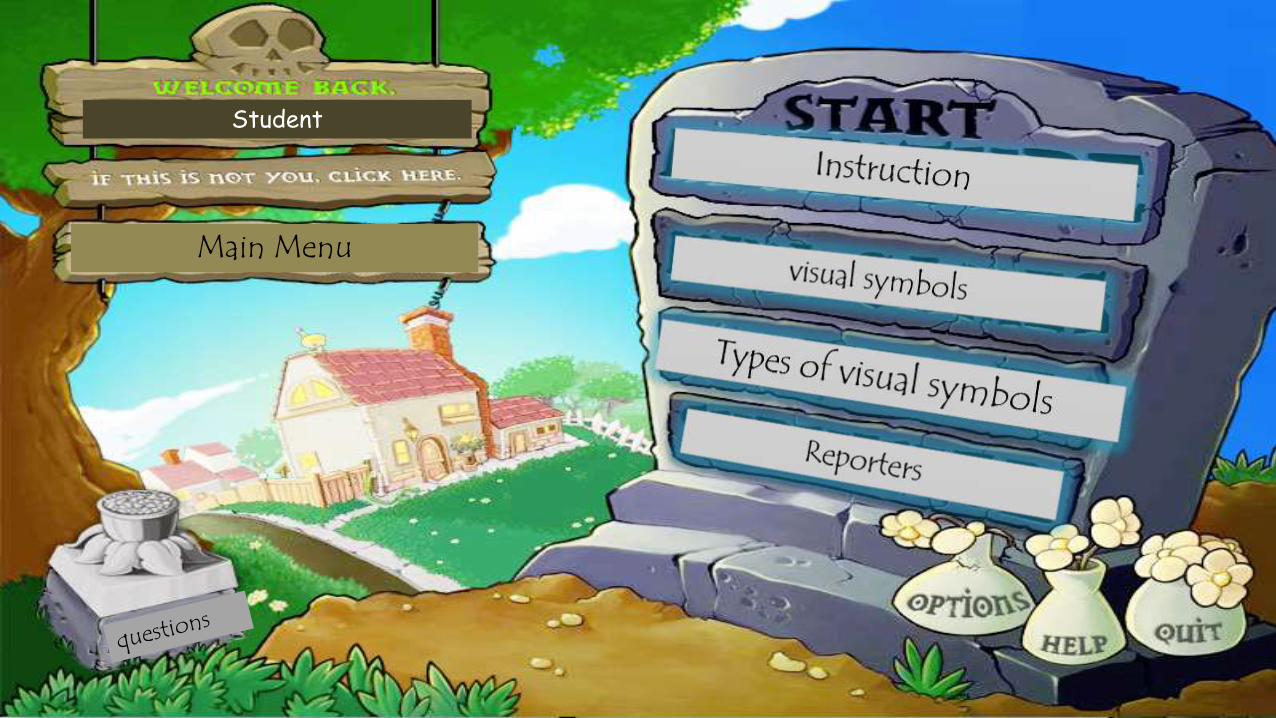
Student
Main Menu

Hi I’m intelligent Dave!
I badly need your HELP!!!

I am being threatened by Zombieswho wants to eat my precious brain!
I am the only one left who has the knowledge about:
Teaching with visual symbols!
I have developed a way on fighting the zombies.
I use extraordinary plants to kill them!

Help me to defeat them and I will teach you the knowledge about:
Teaching with visual symbols in every level!
The future of effective teaching depends on you…
Good luck!
- are representations of direct reality, which comes in the form of signs and
symbols.
Visual Symbols
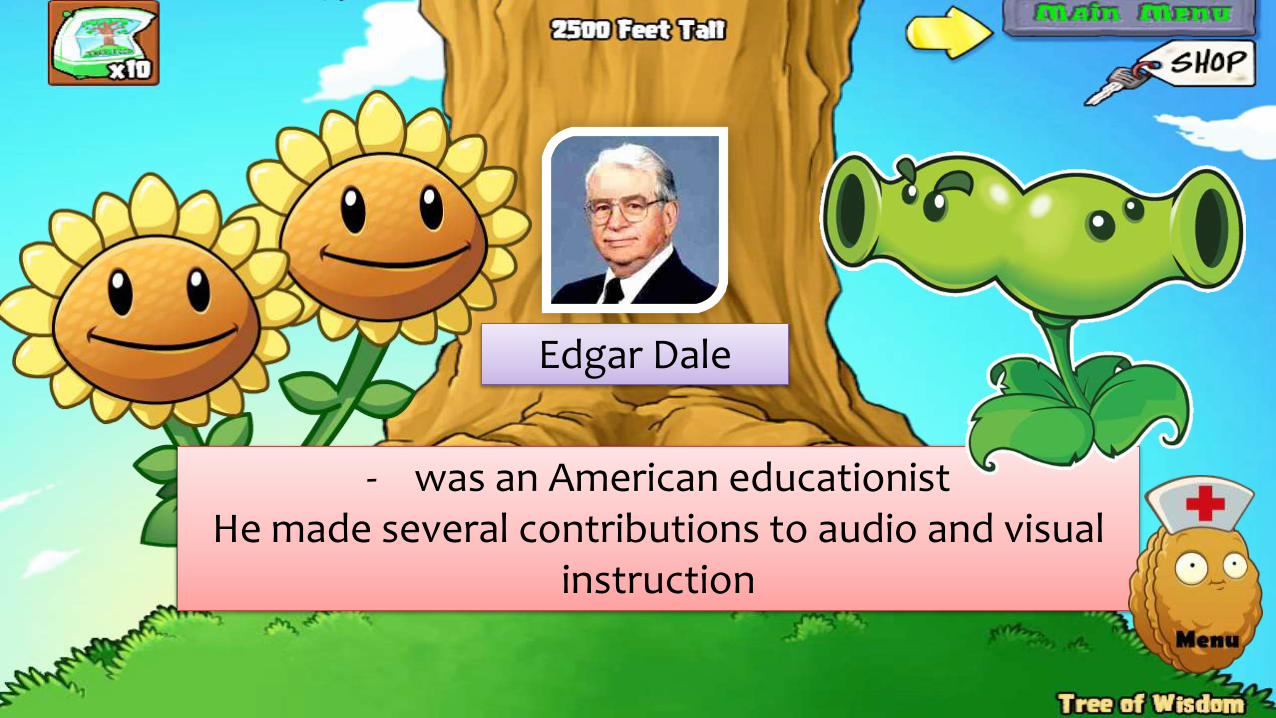
Edgar Dale
- was an American educationistHe made several contributions to audio and visual
instruction
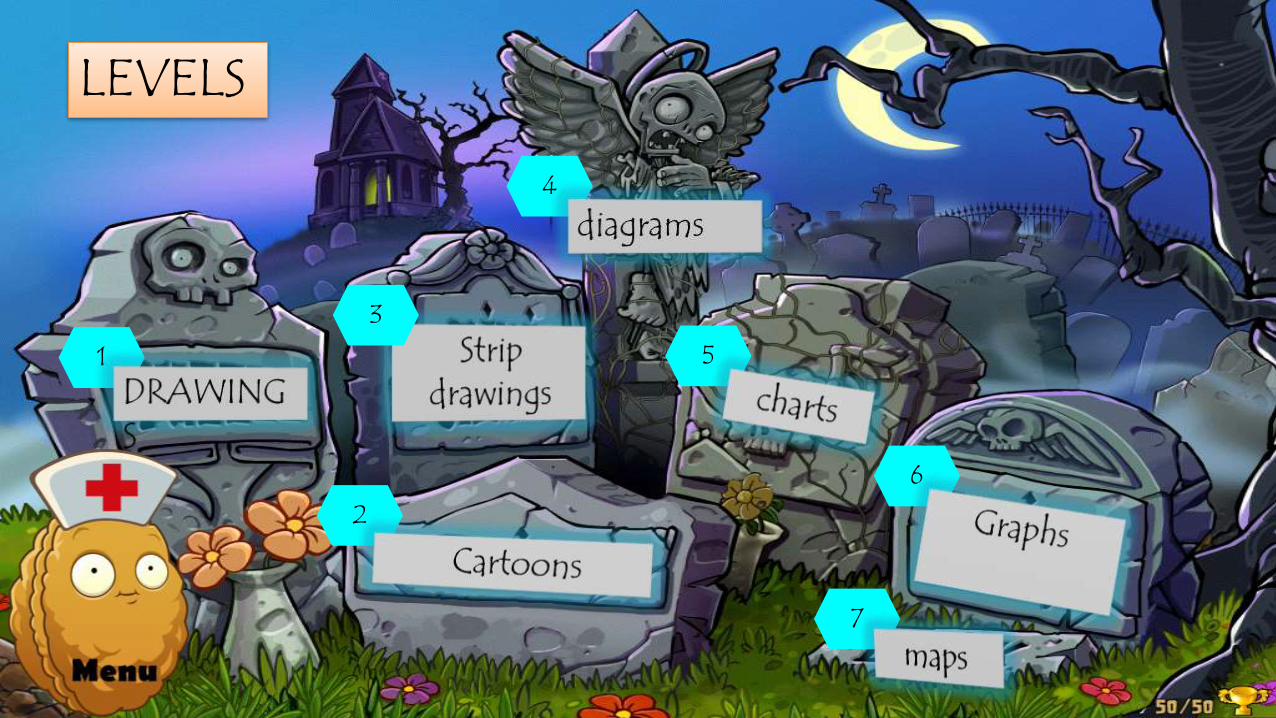
7
6
5
2
1
LEVELS
3
4
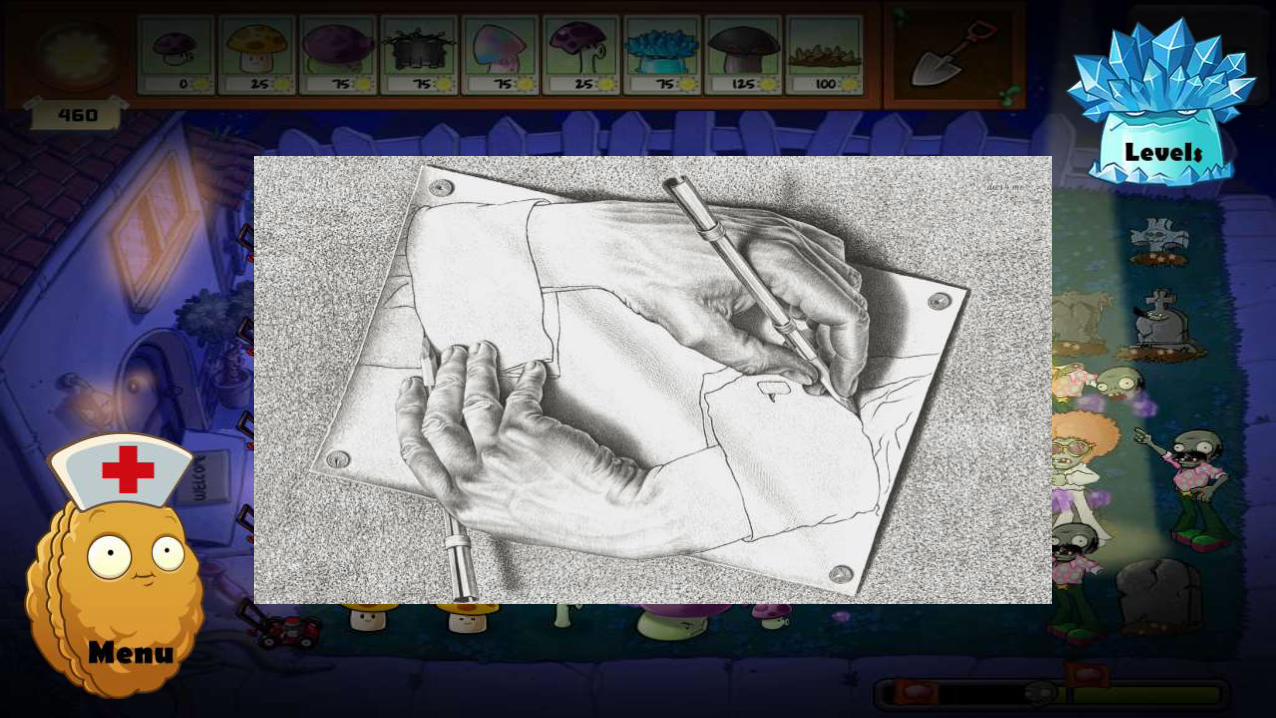
- helps in illustrating our lecture through freehand sketching in a chalkboard
DRAWINGS
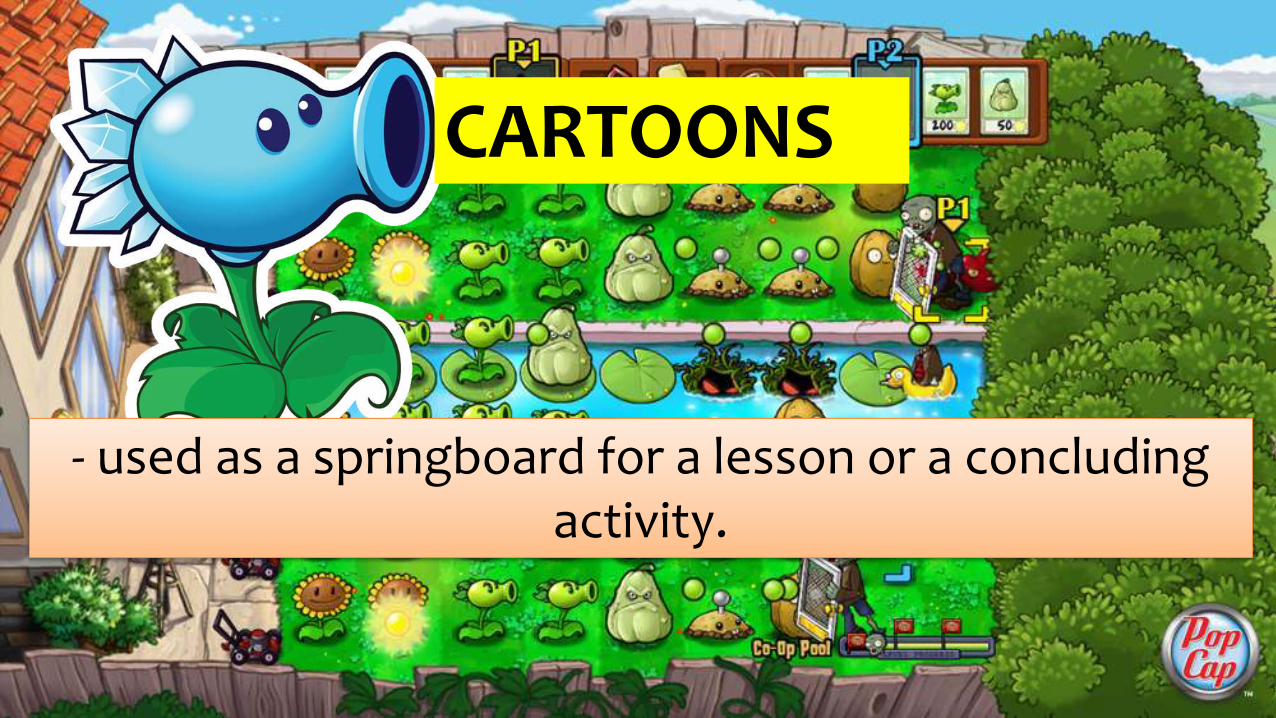
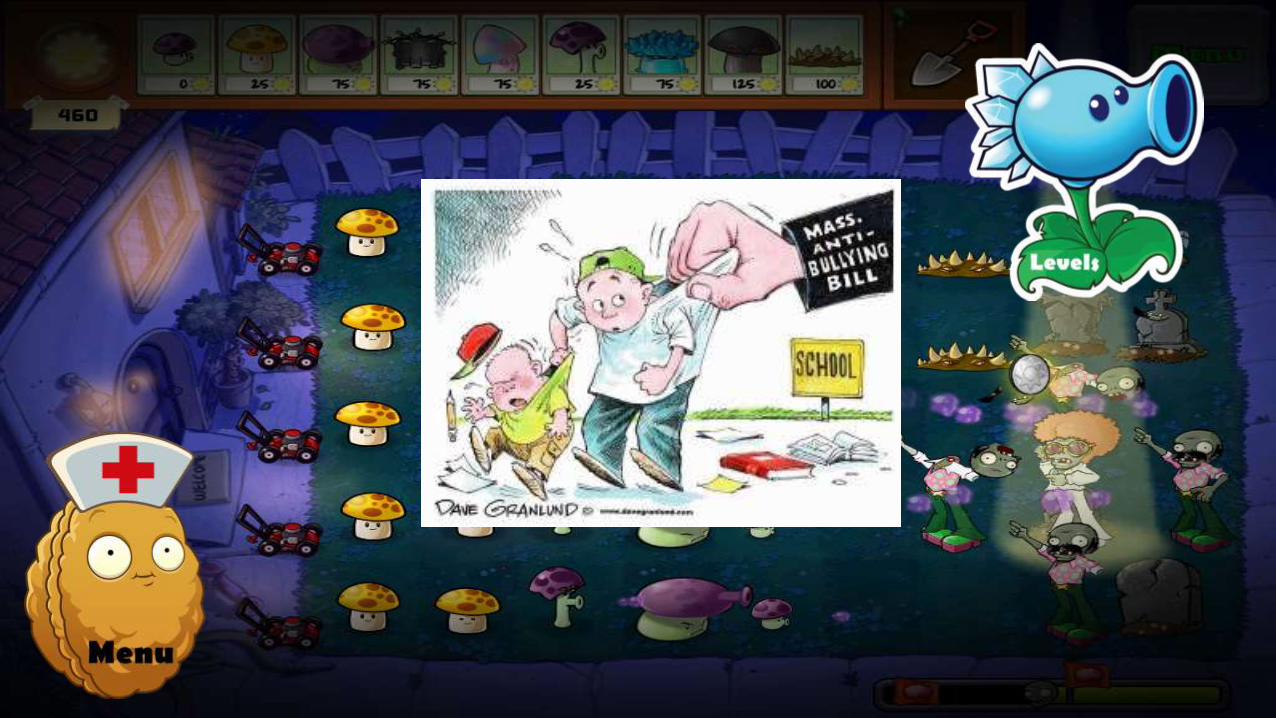
- used as a springboard for a lesson or a concluding activity.
CARTOONS
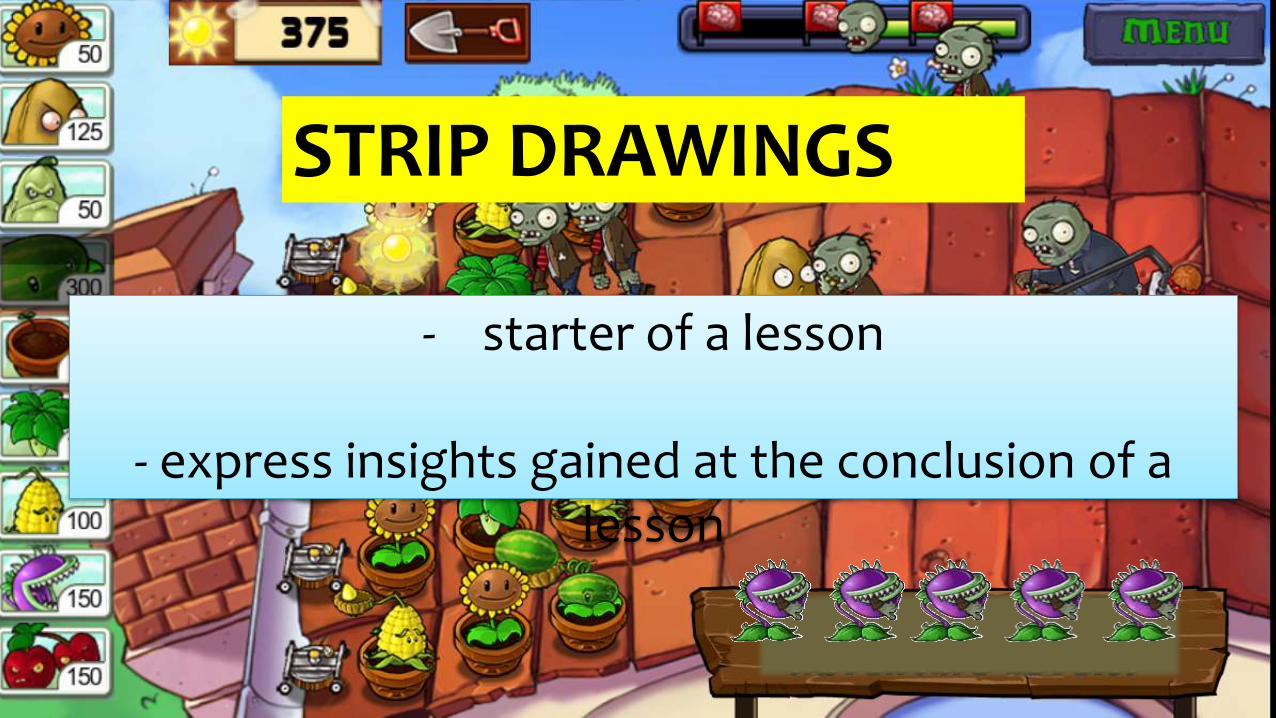
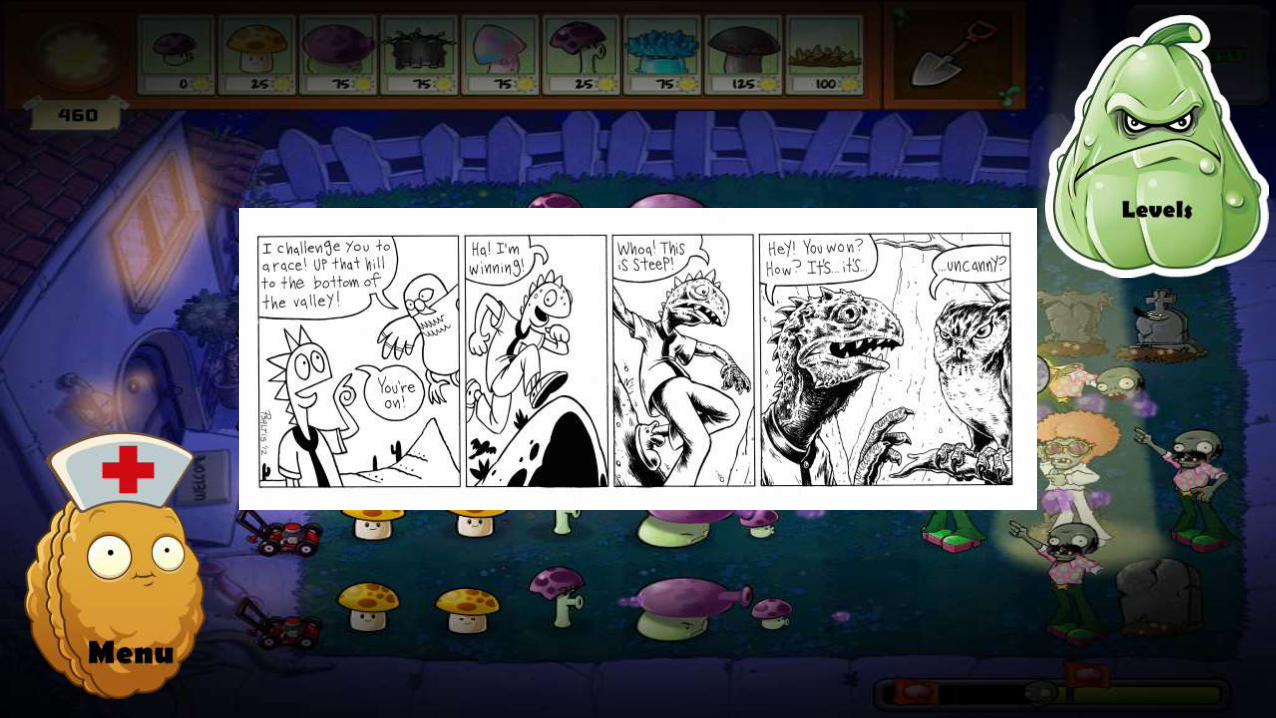
- starter of a lesson
- express insights gained at the conclusion of a lesson
STRIP DRAWINGS
- line drawing that shows arrangement and relations
DIAGRAMS
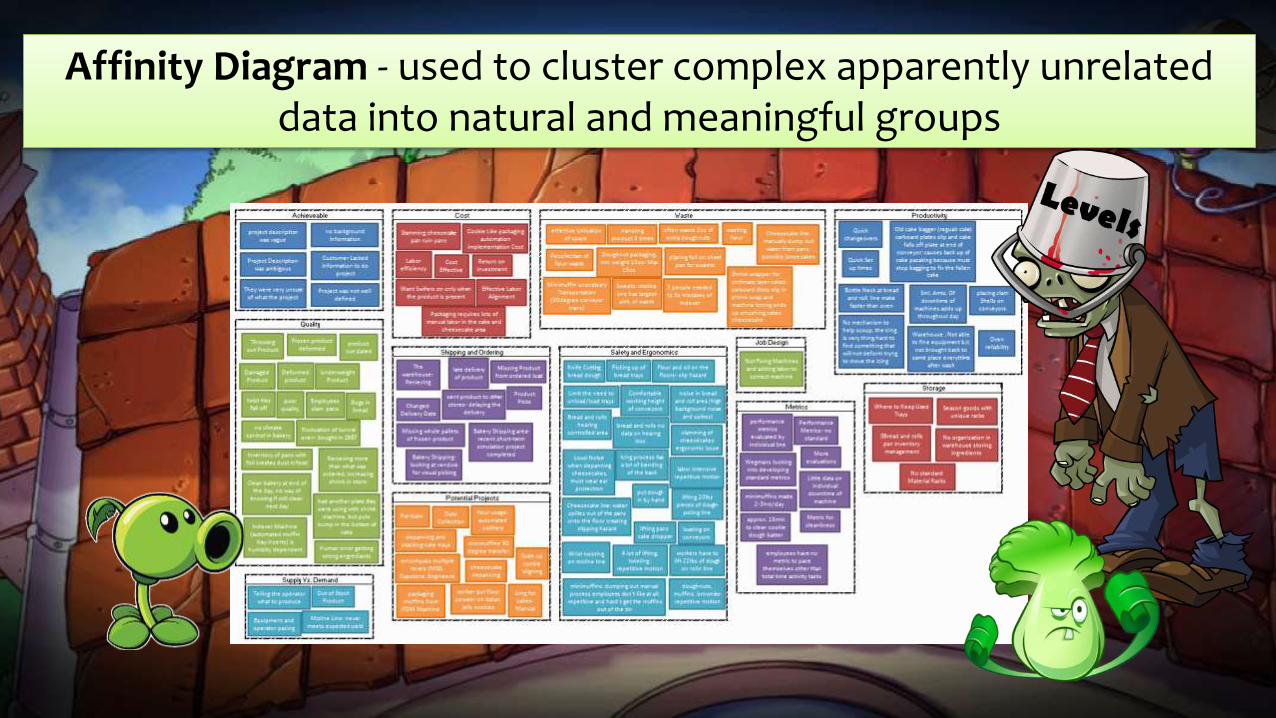
Affinity Diagram - used to cluster complex apparently unrelated data into natural and meaningful groups
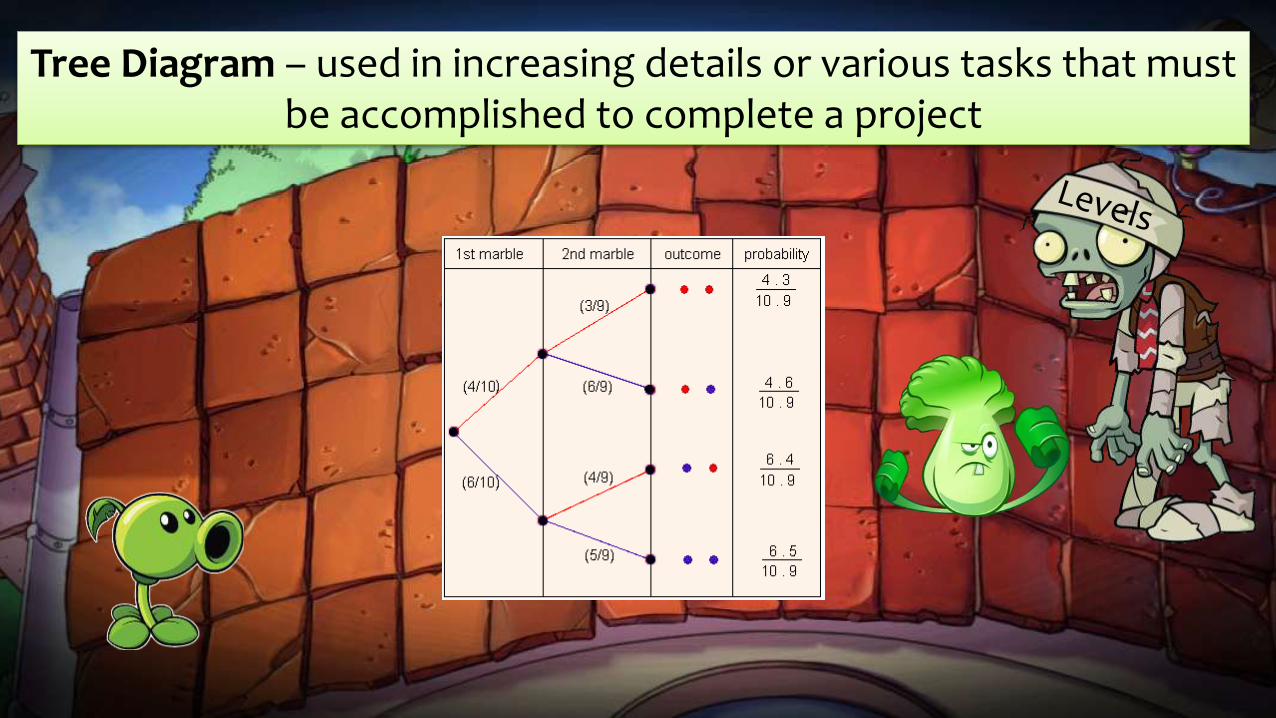
Tree Diagram – used in increasing details or various tasks that must be accomplished to complete a project
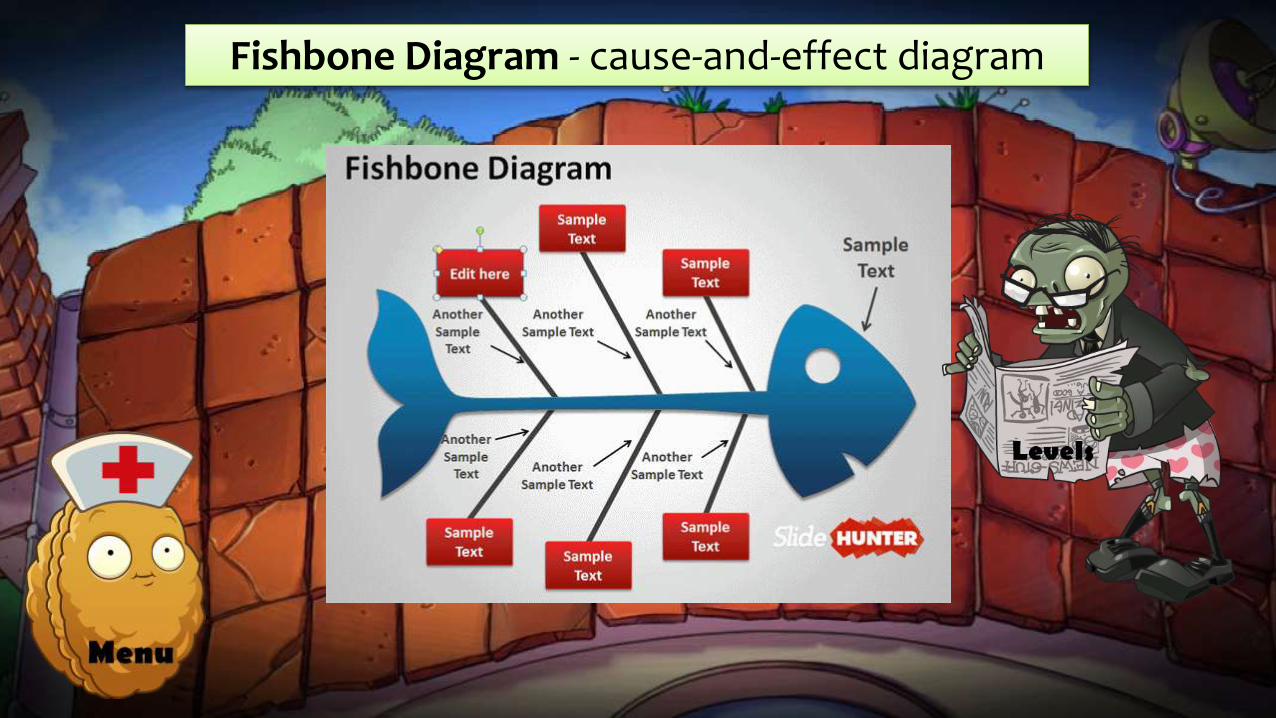
Fishbone Diagram - cause-and-effect diagram
- diagrammatic representation of relationships within an organizations.
CHARTS
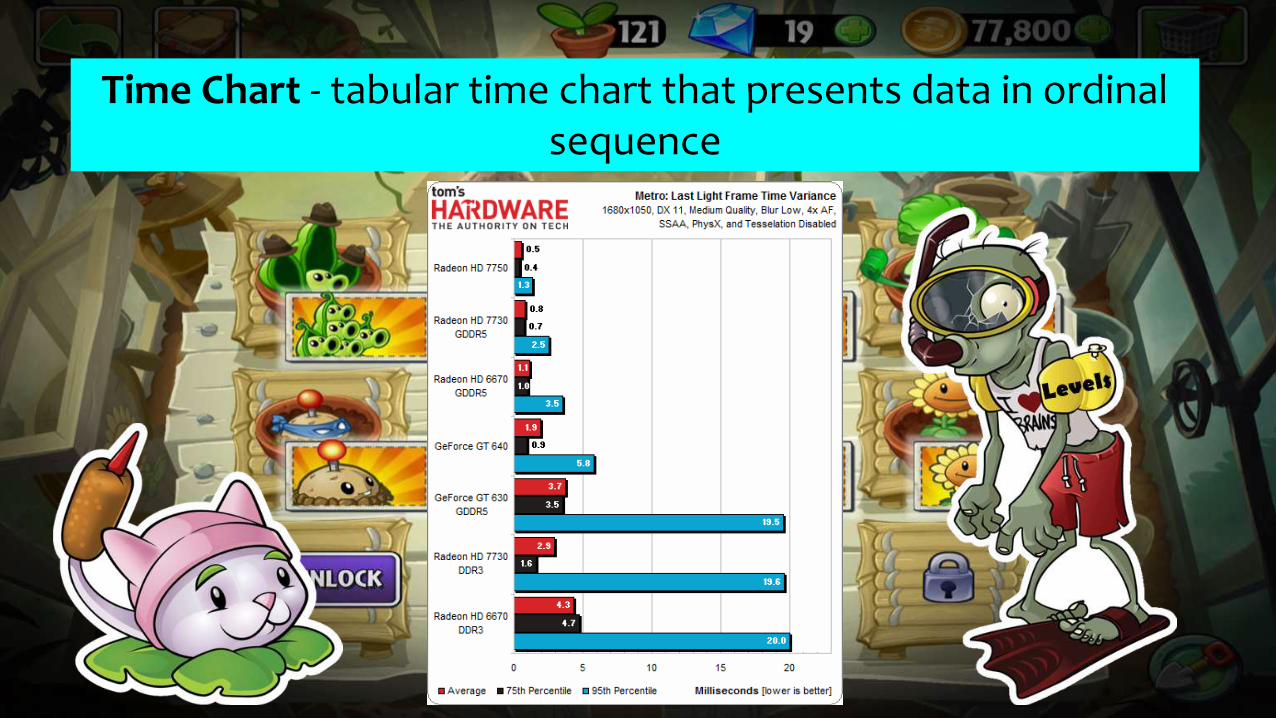
Time Chart - tabular time chart that presents data in ordinal sequence
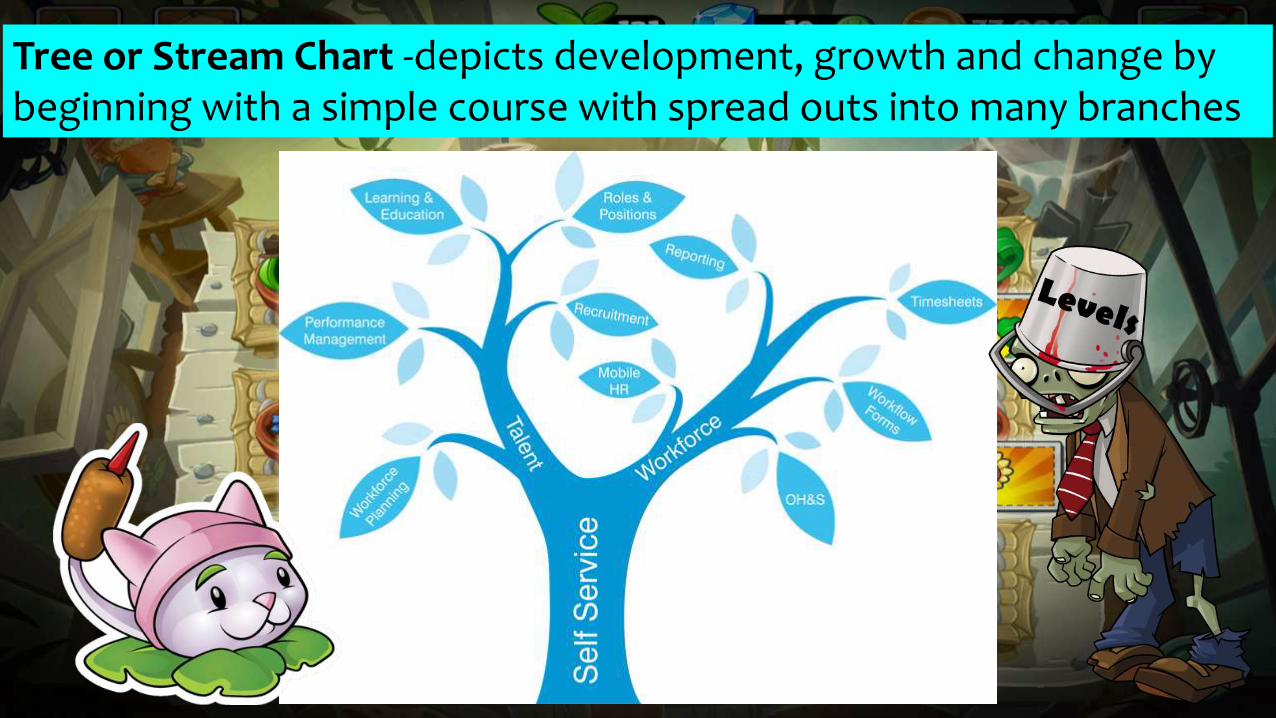
Tree or Stream Chart -depicts development, growth and change by beginning with a simple course with spread outs into many branches
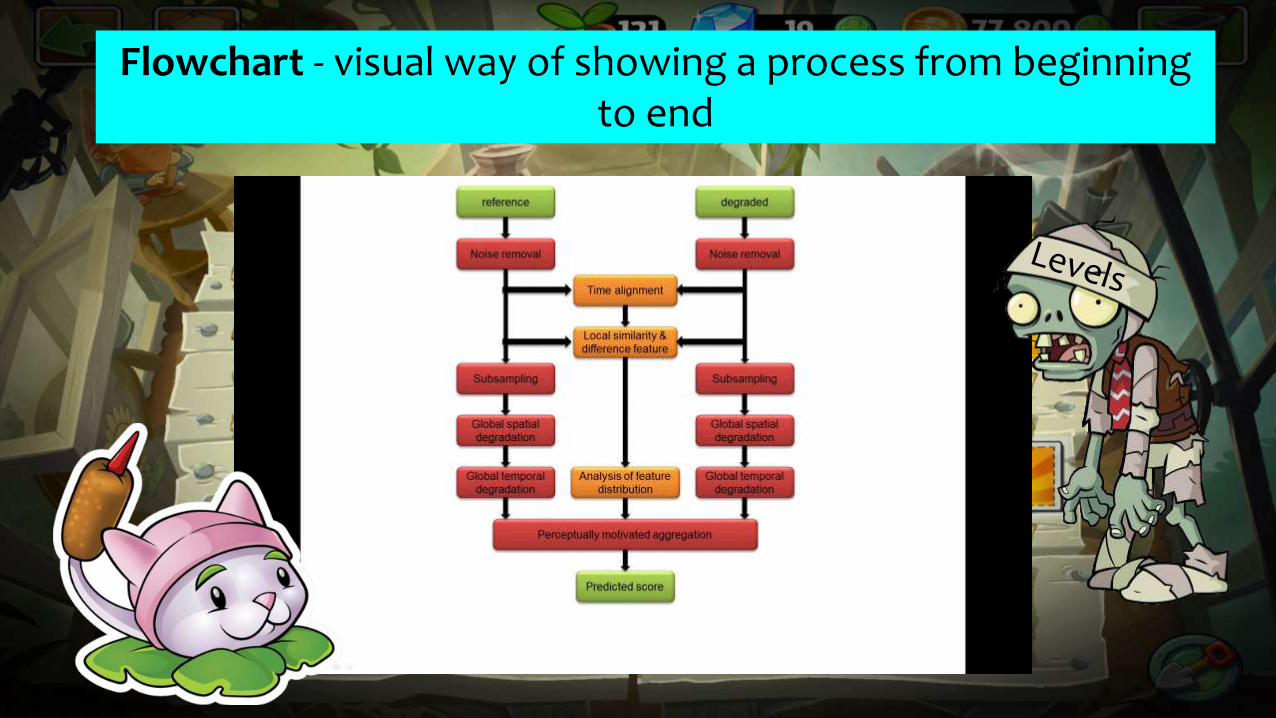
Flowchart - visual way of showing a process from beginning to end
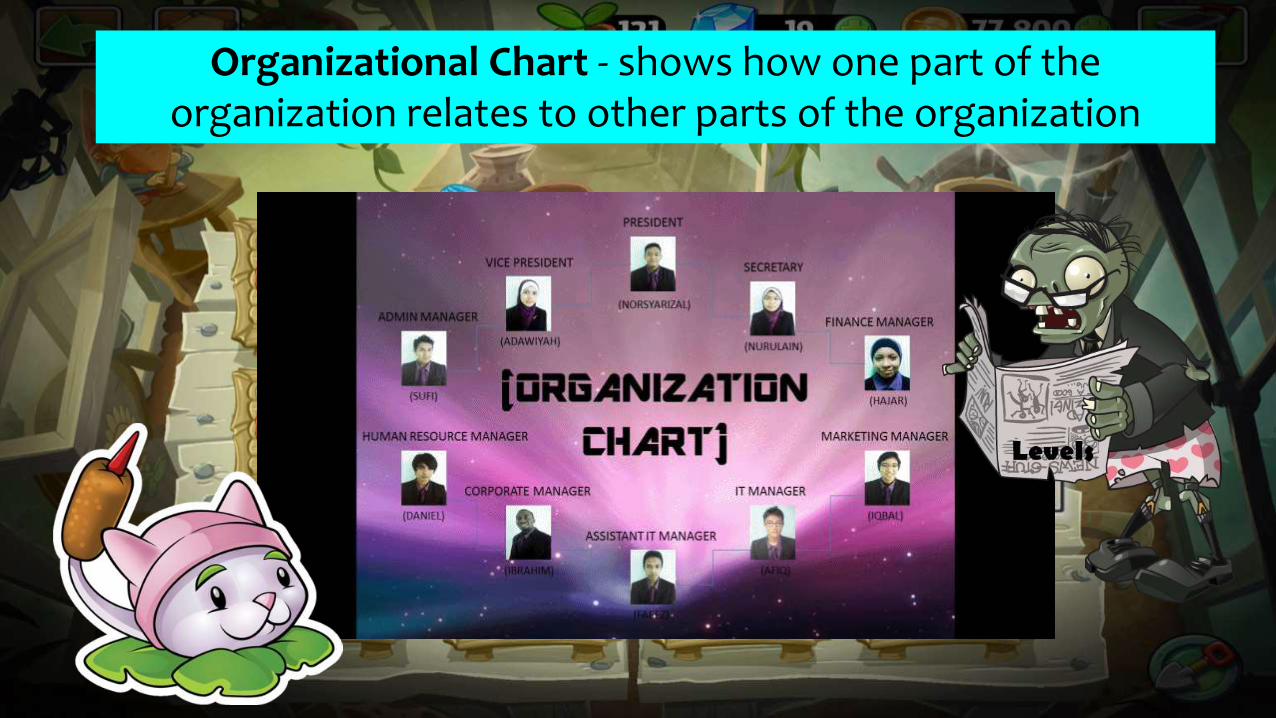
Organizational Chart - shows how one part of the organization relates to other parts of the organization
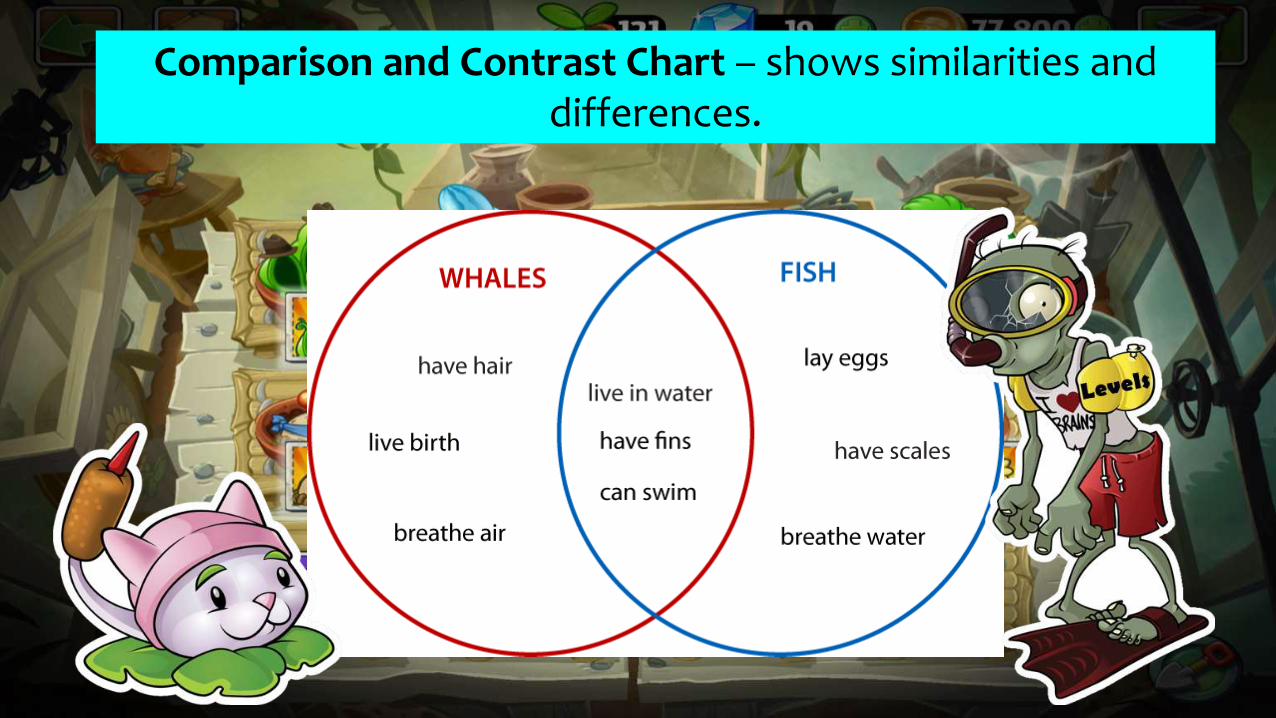
Comparison and Contrast Chart – shows similarities and differences.
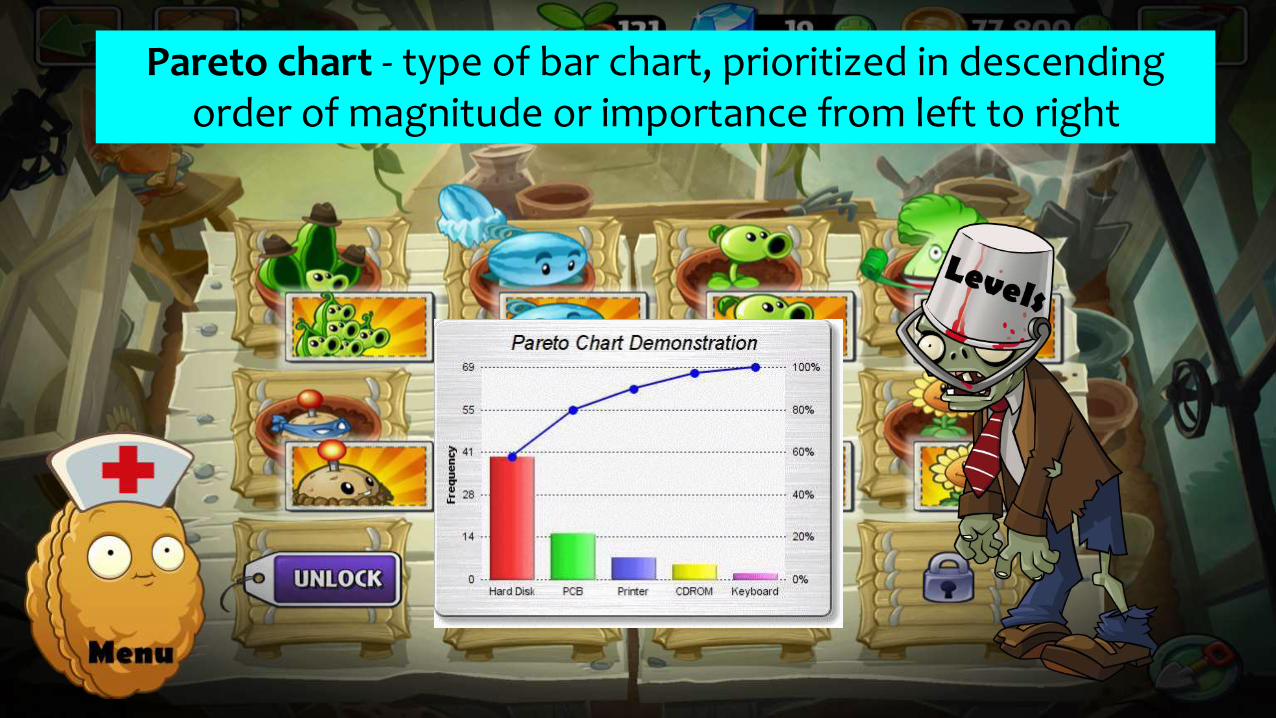
Pareto chart - type of bar chart, prioritized in descending order of magnitude or importance from left to right
- pictures that help us understand data
GRAPHS
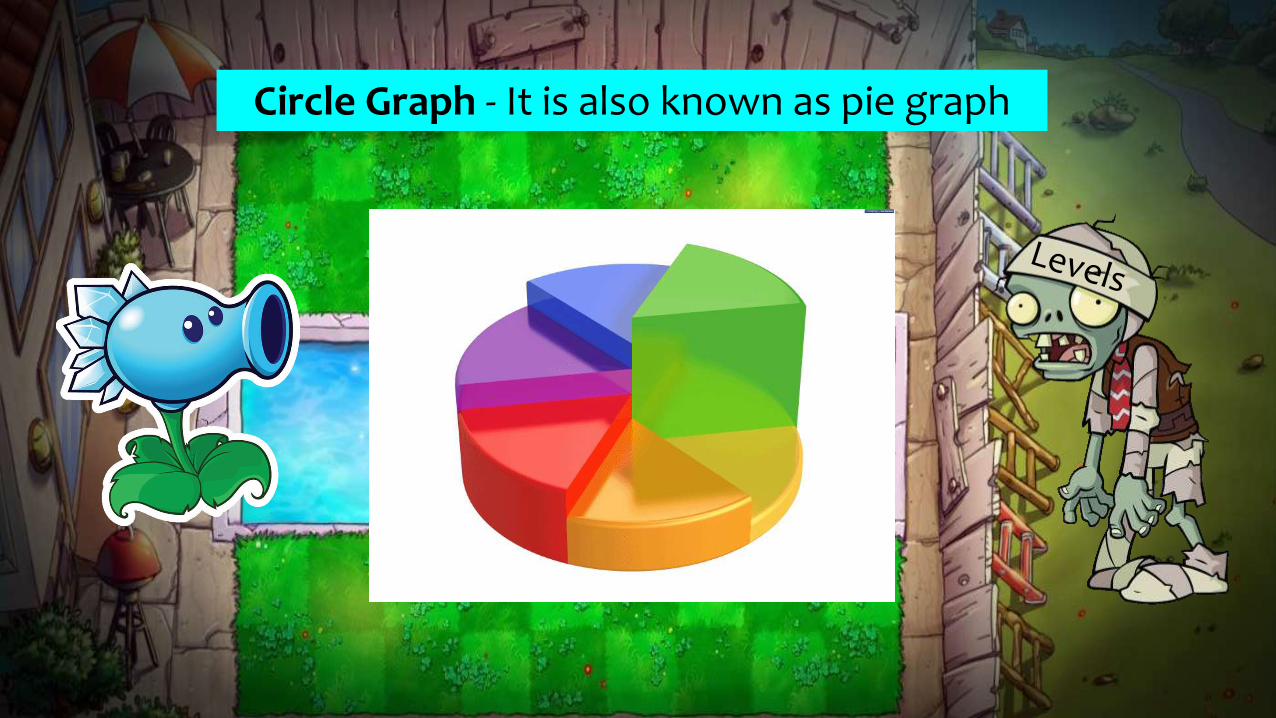
Circle Graph - It is also known as pie graph
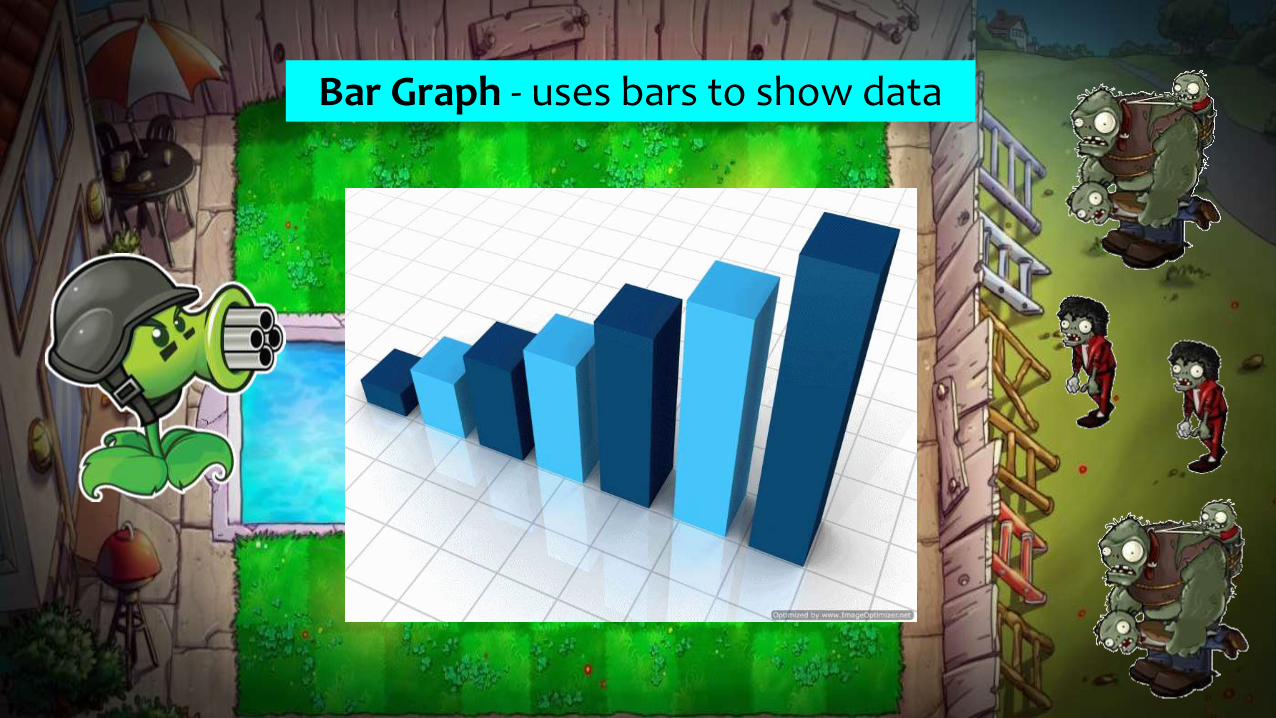
Bar Graph - uses bars to show data
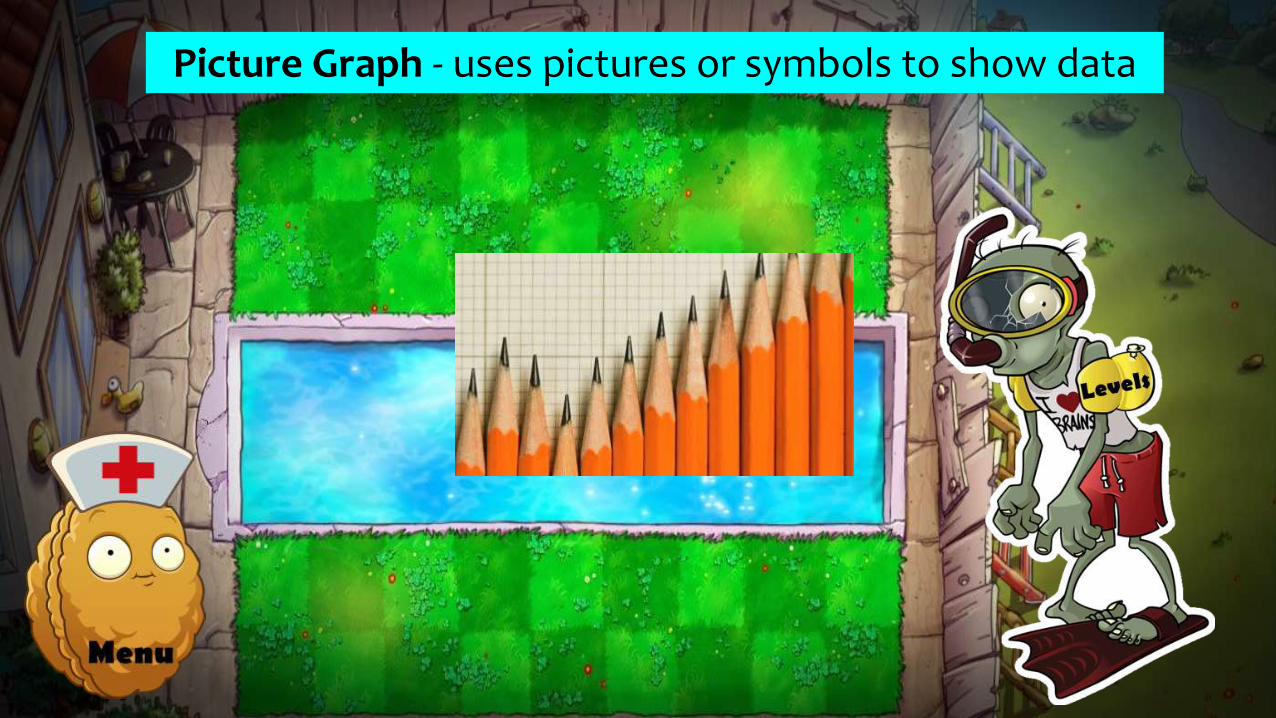
Picture Graph - uses pictures or symbols to show data
a visual representation of an area.
MAPS
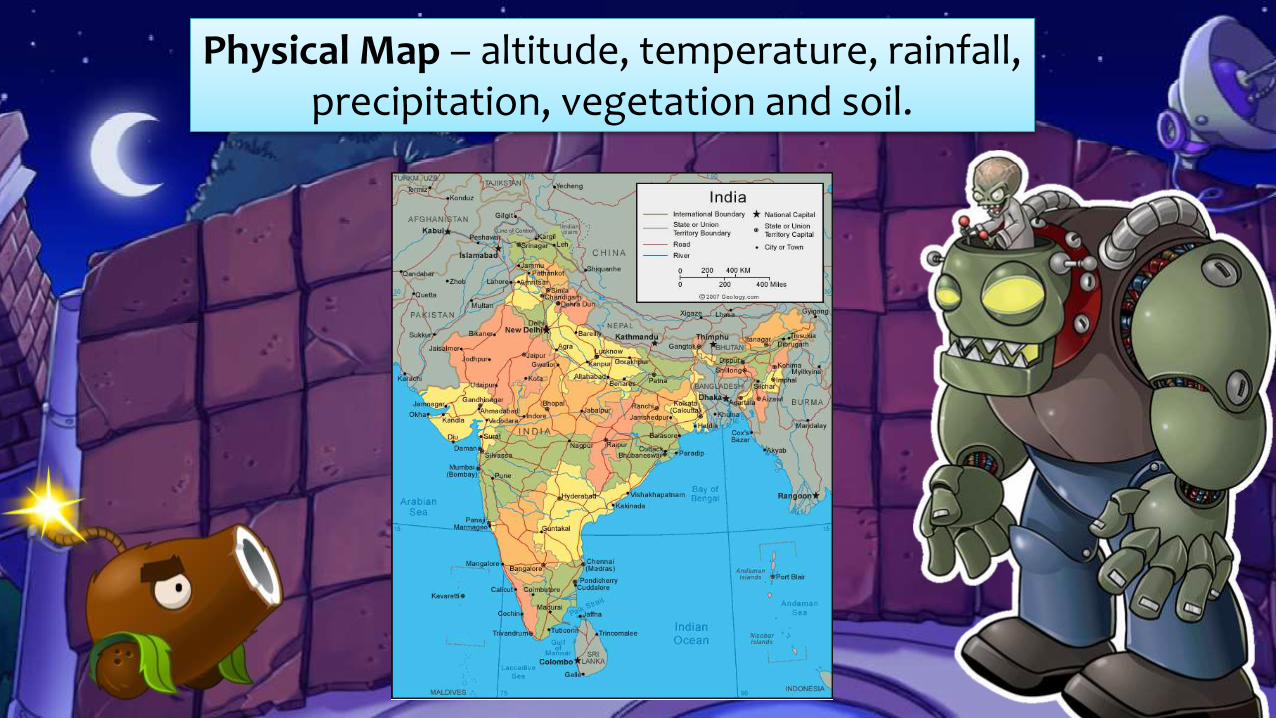
Physical Map – altitude, temperature, rainfall, precipitation, vegetation and soil.
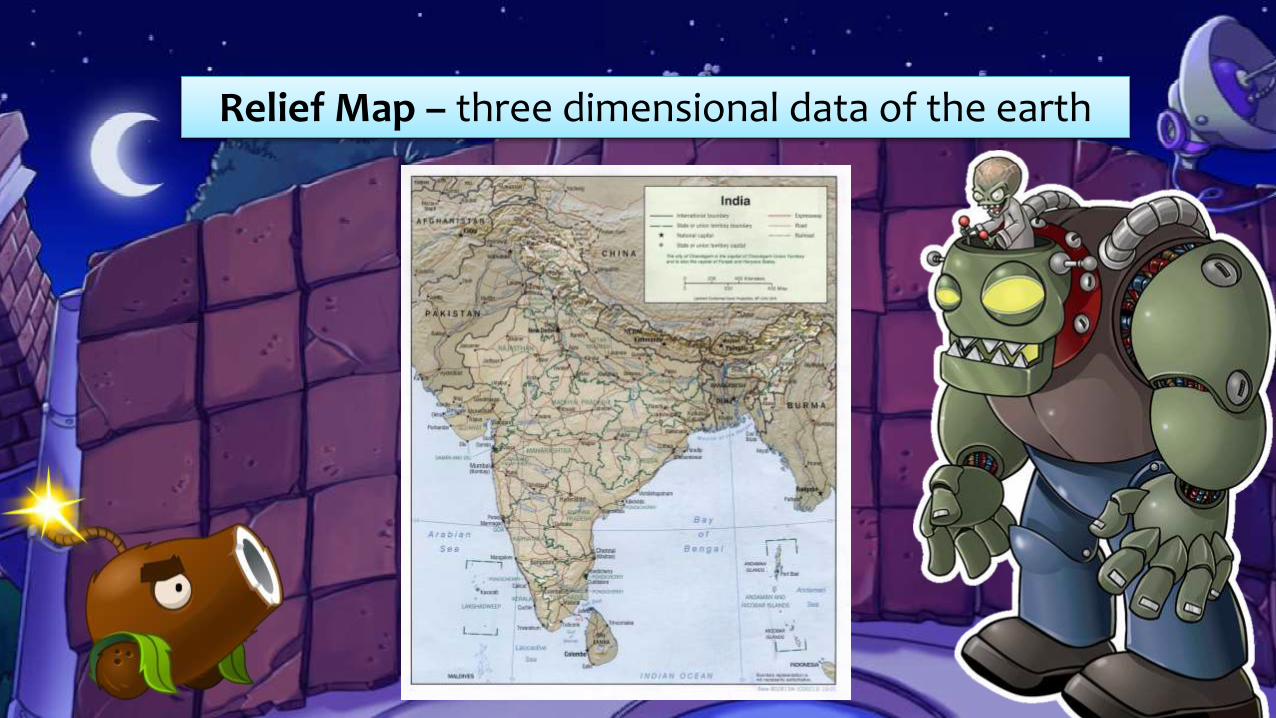
Relief Map – three dimensional data of the earth
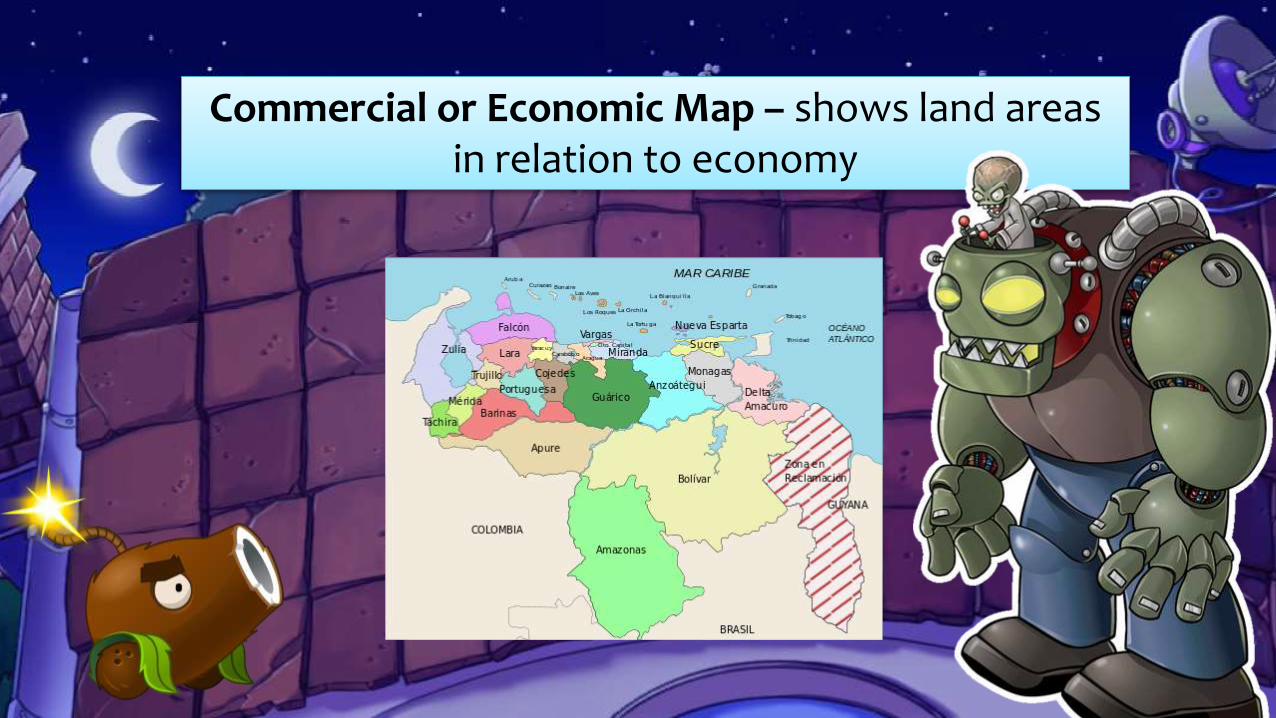
Commercial or Economic Map – shows land areas in relation to economy
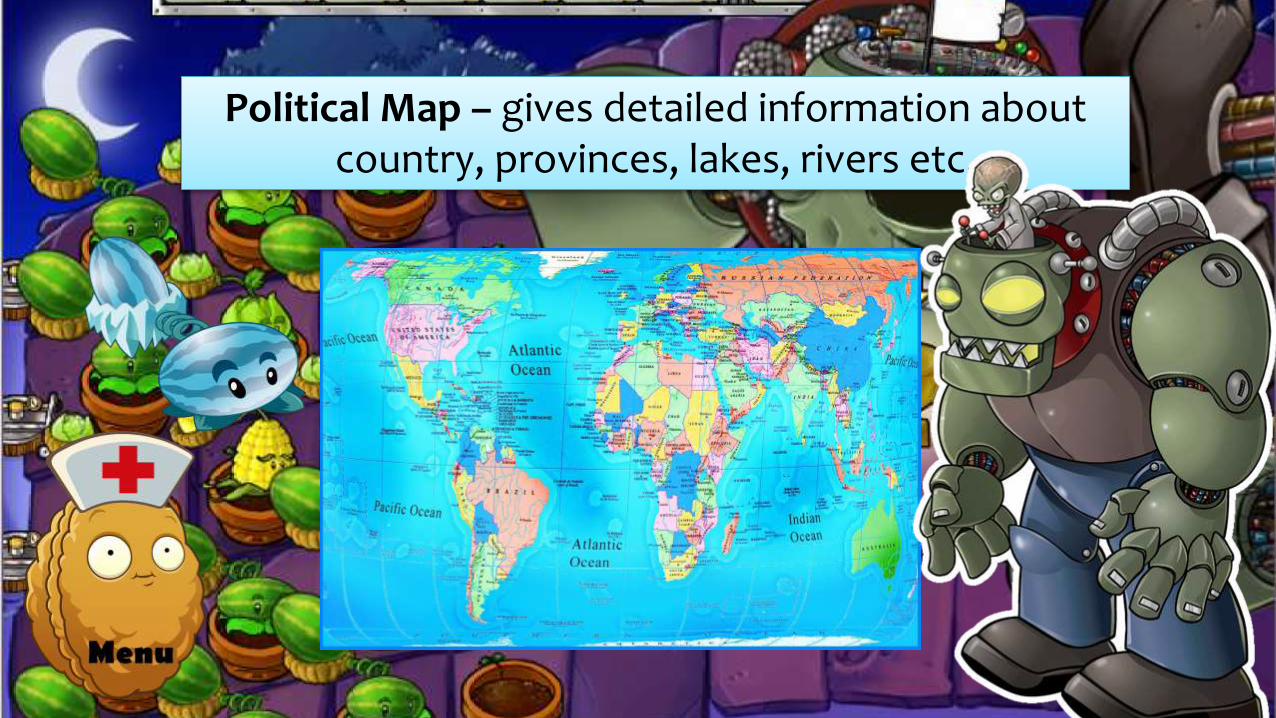
Political Map – gives detailed information about country, provinces, lakes, rivers etc.


Thank you for listening!
Larry J. SultizBSED BIOLOGY
Ian Jay P. SaldoBSED PHYSICS

Educational Technology 1
BSEDBIO3
TTh 7:00 – 8:30 A.M.
CLICK HERE TO play again
Prof. James L. Paglinawan