education, training and demand for labour in finland by …€¦ · education, training and demand...
TRANSCRIPT

Publications 2012:15
FINECVET AS A PIONEER
Ilpo Hanhijoki, Jukka Katajisto, Matti Kimari and Hannele Savioja
EDUCATION, TRAINING AND DEMAND FOR LABOUR IN FINLAND BY 2025
Publications 2012:16
Mikko Hartikainen, Maija-Liisa OjalaTässä on julkaisun otsikon mahdollinen alaotsikkotasaus vasemmalle
Publications 2012:16
Ilpo Hanhijoki, Jukka Katajisto, Matti Kimari and Hannele Savioja
EDUCATION, TRAINING AND DEMAND FOR LABOUR IN FINLAND BY 2025

© Finnish National Board of Education and the authors
Translation: Intertext, Katja Ranta-aho
Publications 2012:16
ISBN 978-952-13-5295-9 (pb)ISBN 978-952-13-5296-6 (pdf)
Layout: Edita Prima Oy/Timo Päivärinta/PSWFolders Oy
Juvenes Print - Suomen Yliopistopaino Oy, Tampere
www.oph.fi /publications

3
Contents
Preface ............................................................................................. 5
1 The steering and decision-making process for education and training provision in Finland................................................ 7 1.1 Background .......................................................................................... 7 1.2 The Finnish education system .......................................................... 10 1.3 Steering of education and training provision ................................... 12
2 Long-term anticipation of demand for labour and educational needs in Finland ..................................................... 16 2.1 Background to methodological choices ........................................... 16 2.2 The process of anticipating demand for labour and educational needs ...................................................................... 17
3 Development of Finland’s economic structure ........................... 25 3.1 Development of Finland’s economic structure since the 1990’s ..... 25 3.2 Alternative scenarios for development of the economic structure by 2025 ....................................................... 28
4 Change in occupational structures by 2025 ............................... 34 4.1 Factors of change in occupational structures of industries ............. 34 4.2 Alternative development trends for the occupational structure ...... 37
5 Demand for labour up until 2025 .............................................. 44 5.1 Natural wastage from the employed labour force ........................... 44 5.2 Job openings ...................................................................................... 47 5.3 From the total need for new labour to the educational needs of the world of work ......................................................................... 50
6 Intake needs by fi eld and level of education ............................. 54 6.1 Intake needs adjusted to the size of the young age group ............. 54 6.2 Targets for provision by 2016 ........................................................... 60
7 Development needs in anticipation of educational and skills needs ...................................................... 62
Further information ........................................................................... 65
Sources ............................................................................................... 66
Appendices ......................................................................................... 691 Concepts2 Statistical sources used in anticipation3 Classifi cation of fi elds, subfi elds and levels of education

4
4 Development trends in the number of employed people by industry (Number of employed people by industry in 2000, 2005 and 2007; basic scenario for 2015, 2020 and 2025; basic scenario change (%) for 2007–2025; target scenario for 2015, 2020 and 2025; and target scenario change (%) for 2007–2025)
5 Educational distributions of occupational groups by level of education used in the correspondence key
6 Demand for new labour (average age of employed people by major occupational group and occupational group, number of people emplo-yed in 2007, natural wastage), basic scenario (change in the number of employed people and job openings) and target scenario (change in the number of employed people and job openings)
7 Entrants in 2007–2009 by fi eld and level of education, average intake needs for 2014–2018 in the basic and target scenarios and Development Plan targets in 2016
5
Preface
This report provides a description of the Mitenna model for anticipation of long-term demand for labour and educational needs, complete with anticipa-tion data relating to demand for labour up until 2025 as well as intake needs for education and training in the latter part of the 2010’s based on this data. The report also describes the use of anticipation results in preparation of the Development Plan for Education and Research adopted by the Government. The purpose of the report is to offer a concise overview of long-term quantita-tive anticipation of demand for labour and educational needs for international experts in the fi eld and other people interested in anticipation of educational needs.
The anticipation results provided in this report on demand for labour and educational needs were produced by Counsellors of Education Ilpo Hanhijoki, Jukka Katajisto, Matti Kimari and Hannele Savioja. The report was compiled and fi nalised by Counsellor of Education Samuli Leveälahti. Secretary Riitta Siitonen was responsible for editing the anticipation data and technical prepar-ation of the report.
Pasi KankareDirector

6

7
1 The steering and decision-making process for education and training provision in Finland
1.1 BackgroundIncreasing educational services and developing educational contents have been key targets of social policies in Finland as well as elsewhere in the world over the last few decades. Society has a need to train its members, because human capital is considered to be an important factor of production. For a long time now, Finland has based its international competitiveness on a high standard of competence, both higher education and professional competence, the innovative capacity achieved through these and rapid production applica-tions of innovations.
The Development Plan for Education and Research for 2011–2016 adopted by the Government outlines education policy objectives for the Government term, which will be presented in this chapter at a general level (Opetus- ja kulttuuri-ministeriö [Ministry of Education and Culture] 2011a). The Development Plan aims to make Finland the most competent nation in the world by 2020, when Finland will be ranked among the leading group of OECD countries in key comparisons of competencies of young people and adults, in low school drop-out rates and in the proportion of young people and other people of working age with a higher education degree. Differences between genders in terms of learning outcomes, participation in and completion of education will be reduced, while the effects of young people’s socio-economic backgrounds on educational choices will be curtailed. Furthermore, the Government’s prior ities include reduction of poverty, inequality and social exclusion, consolidation of public fi nances and enhancing sustainable economic growth, employment and competitiveness.

8
The social guarantee The Government Programme envisages that at least 42% of 30-to-34-year-olds will hold a higher education degree and that more than 90% of 20-to-24-year-olds will hold a post-compulsory qualification by 2020. The Government also intends to implement a so-called social guarantee for young people as from the beginning of 2013. This means that each young person under 25 and recently graduated people under 30 will be offered a job, on-the-job training, a study place, or a period in a workshop or rehabilitation within three months of becoming unemployed. As part of the social guarantee, the Government will also implement the education guarantee: each young person finishing basic education will be guaranteed an opportunity to continue in general upper secondary education, vocational education and training, apprenticeship training, in a workshop, in rehabilita-tion, or in another way. These policy objectives also contribute to guiding the quantification of future provision of education and training.
During the last few decades, the level of education among the Finnish popu-lation has increased rapidly (Figure 1). The number of those without a post-compulsory certifi cate has decreased by more than 40 percentage points over the last four decades. Regardless, Finns aged 25 to 64 ranked 7th among OECD countries in terms of level of education in 2009, while 25-to-34-year-olds were only ranked 18th. In the European Union’s growth strategy (EU 2020), Finland commits itself to developing key sectors of its society and economy in order to strengthen Finnish and European competitiveness, improve welfare and safe-guard a sustainable public economy. Education and science policy plays a key role in the strategy. In its draft national programme, Finland commits itself to raising young people’s level of education and reducing the proportion of early school-leavers.

9
Figure 1. Education structure among population aged over 15 in Finland by level of education, 1970–2010 (Tilastokeskus [Statistics Finland] 2012a).
Recent challenges for the labour market include recovering from the 2009 eco-nomic recession and preparing for the decreasing supply of labour over the 2010’s. The effects of the economic recession on the national economy, the dwindling labour force and the unfavourable development in the dependency ratio due to the ageing population call for measures aiming to extend careers and to improve the match between the competencies of the labour force enter-ing the labour market and the skills needs of businesses and public bodies.
It is possible to improve the availability of skilled labour and compensate for the unfavourable development of the dependency ratio by making the educa-tion system operate more effectively and by targeting education and training provision. In terms of education, this means measures such as accelerating qualifi cation completion times, improving fl exibility at transition points between different levels of education, reducing educational overlaps and enhancing rec-ognition of prior learning. Furthermore, it is also possible to make use of quan-titative anticipation of educational needs to steer the volume of education and training provision so as to ensure that it matches developments in demand for labour as closely as possible. This report concentrates on the last-mentioned objective by presenting the model for anticipation of demand for and supply of labour over a long term (10 to 15 years into the future) and the results of anticipation.

10
1.2 The Finnish education systemBefore compulsory education, children have a subjective right to pre-primary education at the age of six. Participation in pre-primary education is volun-tary and is provided for 6-year-olds at day-care centres and in pre-primary classes operating in conjunction with comprehensive schools. In 2009, almost all 6-year-olds participated in pre-primary education.
Compulsory education begins at the age of seven. After nine years in basic education, it is possible to continue either to general upper secondary educa-tion or to vocational upper secondary education and training, and then to a polytechnic or university.
Basic education means general education provided for each age group as a whole. It is intended for children aged between seven and sixteen and comple-tion of its syllabus at comprehensive school takes nine years. Once they have completed basic education, pupils have fulfi lled their compulsory schooling.
Upper secondary education includes general upper secondary education and upper secondary vocational education and training. General upper secondary education is non-vocational education preparing for the matriculation examin-ation. The main objective of upper secondary vocational education and train-ing, in turn, is to provide vocational competence. In 2009, approximately 90% of comprehensive school leavers moved on to general or vocational upper secondary studies immediately after basic education. In 2009, 79.5% of the 25–64 age group had attained at least upper secondary education (Opetus- ja kulttuuriministeriö [Ministry of Education and Culture] 2011a).
Higher education is made available by universities and polytechnics. Both sectors have their own profi les; universities focus on scientifi c research and instruction, whereas polytechnics are professionally oriented higher education institutions adopting a more practical approach.
The Finnish education system is outlined in Figure 2.

11
6
5 4 5
Work exprience 3 years
4
3
2&1
0
ISCED classification 19970 Pre-primary education1–2 Primary education or lower secondary education3 Upper secondary education4 Post-secondary non-tertiary education5 First stage of tertiary education6 Second stage of tertiary education
Bachelor's degreesUniversities Polytechnic Bachelor's degrees
Polytechnics
ISCEDclassification
Durationin years
Doctoral degreesLicentiate degreesUniversities
Master's degreesPolytechnic Master's degreesPolytechnics
Basic education, 7 16-year-oldsComprehensive schools
Pre-primary education, 6-year-olds
Specialist vocationalqualifications*
Matriculaton examinationGeneral uppersecondary schools
Vocational qualifications*
Further vocationalqualifications*
Vocational institutions*Also available as apprenticeship training
3
Figure 2. The Finnish education system
1

12
1.3 Steering of education and training provisionAs part of Government, the Ministry of Education and Culture is responsible for developing education, science, cultural, sport and youth policies and for inter-national co-operation in these fi elds. Development of the Ministry’s administra-tive sector is outlined by means of strategic planning and various action and development programmes. The Ministry prepares legislation and Government Decisions relating to vocational education and training (VET) and steers and oversees the sector. Its work is guided by policies determined in the Govern-ment Programme, the Government Strategy Document and the Development Plan for Education and Research. (Opetus- ja kulttuuriministeriö [Ministry of Education and Culture] 2012a.)
The Ministry is responsible for quantifying and targeting education and training provision at a national level. The Finnish National Board of Education (FNBE), operating under the auspices of the Ministry, produces national anticipation data on demand for labour and educational needs in support of decision-mak-ing. In addition, the Board supports regional anticipation efforts carried out under the supervision of regional councils. It obtains statistics and produces tools required for anticipation as well as estimates of labour demand and edu-cational needs for regional councils in co-operation with regional councils, the Ministry of Employment and the Economy and the Government Institute for Economic Research (VATT). As Finland is a bilingual country, the Board also anticipates labour demand and educational needs for the Swedish-speaking population.
Responsibility for qualitative anticipation of educational contents rests with the Finnish National Board of Education, higher education institutions and education providers. The system of National Education and Training Commit-tees functions as the expert organisation in qualitative foresight of education, consisting of a steering group, the National Education and Training Committees and fi xed-term expert groups. (Valtioneuvoston asetus [Government Decree] 882/2010.)
Objectives concerning education and training provision are set in the Develop-ment Plans for Education and Research adopted every four years by the Gov-ernment, which specify the key qualitative, quantitative and structural policies for different educational sectors. According to the Decree issued on the Devel-opment Plans (987/1998), the Development Plans include, among other things, quantitative development targets for education and training. The Government adopted the most recent Development Plan for Education and Research for 2011–2016 in late 2011. Preparatory work in support of decision-making was carried out under the leadership of the Ministry of Education and Culture.

13
The responsibility of education providers for anticipating and responding to changes in the world of work has increased, as operational targeting and steer-ing powers have been devolved on universities, polytechnics and VET provi-ders since the 1990’s. Providers are required to play an active role in considering the competence needs of the world of work and in regional devel-opment. Education and training provision is also steered by means of perform-ance-based fi nancing systems, which will be developed for all the aforementioned forms of education. (Opetus- ja kulttuuriministeriö [Ministry of Education and Culture] 2008.)
In addition to national anticipation of educational and skills needs, a wide variety of other national and regional EU-funded anticipation and foresight projects are carried out in Finland by bodies such as research institutes, labour market and business and industry organisations, VET providers, universities and polytechnics. In particular, regional anticipation activities have developed rapidly in recent years. Key players in regional anticipation efforts include regional councils, Centres for Economic Development, Transport and the Envir-onment, VET providers and higher education institutions. At the same time, the number of national and regional anticipation portals has increased consider-ably over the last few years. EU-funded projects have also resulted in creation of new enterprises offering expert services in anticipation and foresight for both businesses and public-sector organisations.
Vocational education and training (VET)The national objectives of vocational education and training, the qualifi cations framework and the core subjects are decided by the Government, while the Ministry of Education and Culture decides on the specifi c details and scopes of qualifi cations. The Finnish National Board of Education is responsible for pre-paring the National Core Curricula for Upper Secondary Vocational Education and Training and the Requirements of Qualifi cations, which set the objectives and core contents of studies.
For the purposes of VET provision, the Ministry of Education and Culture grants authorisations to provide vocational education and training, including a specifi c educational mission. The authorisation to provide upper secondary VET specifi es the framework for the provider’s education and training activities. The authorisations include regulations on the types and scopes of education and training that providers may organise with fi nancing for the education and culture sector. Within the framework of its authorisation, each provider decides on the confi guration, names and educational missions of their educational institutions and on the forms of provision. The authorisations specify aspects such as fi elds and levels of education and, in certain cases, qualifi cations and

14
annual student numbers. (Opetus- ja kulttuuriministeriö [Ministry of Education and Culture] 2012b.)
Education providers may independently transfer intake quotas from one insti-tution and fi eld to another on a yearly basis within the limits of the maximum annual student numbers authorised. Provision of some qualifi cations has been restricted due to modest educational needs or high costs of provision, etc. Examples of such qualifi cations have included upper secondary vocational qualifi cations in the fi eld of Culture and qualifi cations for forest machine oper-ators within the fi eld of Natural Resources. A specifi c educational mission may also include obligations, such as an obligation to offer certain types of educa-tion and training or to maintain certain services. In 2011, there were about 140 providers of upper secondary VET in Finland.
Higher education institutionsThe Finnish higher education system consists of two sectors, where univer sities and polytechnics (universities of applied sciences) have different roles and profi les. Universities and polytechnics are developed with due consideration given to their different premises and objectives as different and complementary systems, which are based on different degrees and degree titles.
Polytechnics falling within the administrative sector of the Ministry of Educa-tion and Culture are either municipal or private institutions and their oper-ating licences are granted by the Government. A polytechnic operating licence includes provisions on the polytechnic’s educational mission, fi elds of edu-cation, number of students and unit locations. By nature, polytechnics are mostly multidisciplinary and regional higher education institutions with oper-ational focus on links with the world of work and regional development. Their degrees are higher education degrees with a professional emphasis. The statu-tory mission of polytechnics is to provide higher education for professional expert assignments based on the requirements of the world of work and its development as well as on research and artistic premises. Polytechnic-specifi c funding is mainly determined according to the number of degrees completed, the quality and effi ciency of study processes and graduate employment rates. (Opetus- ja kulttuuriministeriö [Ministry of Education and Culture] 2012c.)
The Ministry of Education and Culture is responsible for preparing matters concerning universities and appropriate operations and steering of universities. The key components of the system employed by the Ministry to steer univer-sities are funding, legislation and information-based guidance. The main steer-ing instruments include agreements, a feedback procedure and monitoring

15
systems. Regular negotiations between the Ministry and universities play a key role in the steering process. Legislation governing universities was reformed in 2010. (Opetus- ja kulttuuriministeriö [Ministry of Education and Culture] 2012d.)
The total funding for universities comprises appropriations allocated to uni-versities in the State Budget and supplementary funding (fee-charging oper-ations, donations, sponsorship). Core funding appropriations are allocated to universities by means of a core funding formula, which also includes strategic funding as well as funding intended for education and research. A consider-able proportion of supplementary funding consists of research funding that is competed for at a national level, which plays a special role in reinforcing quality and effectiveness. Basic university research is fi nanced and evaluated by the Academy of Finland within the administrative sector of the Ministry of Education and Culture. (Ibid.)
During the 21st century, the number of higher education institutions has decreased to 16 universities and 25 polytechnics. One of the key future chal-lenges for the higher education system is based on the fact that Finland’s network of higher education institutions is still too fragmented and that provision has not been targeted with suffi cient attention to changes in the skills needs of the world of work. Other areas for improvement for the higher education system include delayed placement in education, poor completion rates and multiple education. The 2005 university degree reform has, to date, failed to reduce the duration of studies or to bring about any signifi cant increases in national and international mobility. The factors slowing down studies include working while studying, inadequate student and career counselling, infl exible teaching arrangements and problems with study skills and motivation. In the future, the aim is to meet these challenges in such a way that university and poly technic graduates will enter the labour market one year earlier than at present. Fur-thermore, students’ progress and study motivation will be promoted such that specialisation options will be selected at a later stage of studies. (Opetus- ja kulttuuriministeriö [Ministry of Education and Culture] 2011a.)

16
2 Long-term anticipation of demand for labour and educational needs in Finland
2.1 Background to methodological choicesThe objective of anticipation of educational needs is, on the one hand, to promote the availability of skilled labour in keeping with developments in industrial and occupational structures and, on the other, to guarantee all young people an opportunity to apply for vocationally/professionally oriented edu-cation and training. Anticipation data is needed for planning and steering national, regional and provider-specifi c operations. Anticipation data is also used for guidance and employment counselling to provide information about future employment opportunities. (Opetus- ja kulttuuriministeriö [Ministry of Education and Culture] 2011b & 2008.)
The purpose of quantitative anticipation of educational needs is to offer justi-fi ed views on the future and its alternative development scenarios as a basis for educational planning, decision-making and operations. Anticipation of demand for labour and educational needs produces information about how the educa-tion system could support goal-oriented development of the economic struc-ture. Anticipation is about preparing for alternative future scenarios. However, anticipation results seldom become reality as such, but they can be used to esti-mate structural changes in demand for labour and corresponding educational needs. Examples of structural changes that have emerged from anticipation results in recent years include the increasing proportions of expert and service jobs and the decreasing proportion of worker-level jobs within the manufactur-ing industry.
Economic, societal, social, technological and other changes in the operating environment set both needs and challenges for anticipation and for the use of information obtained through anticipation. Recently identifi ed changes include a change in the population’s age structure, internationalisation, changes in the global economy, climate and environmental change, technological changes and social and cultural change. All these have effects on the world of work and the occupational structure of the labour force and, consequently, on edu-cational needs and the competencies that the world of work expects education and training to deliver. Over the last ten years, the anticipation issue that has gained emphasis in Finland is the demographic change; in other words, how to make the most of the competencies of diminishing young age groups to compensate for the retiring baby-boomer generation.

17
Anticipation of educational needs is also linked as part of anticipation of skills needs. Information obtained through anticipation of educational needs can be used for anticipation of skills needs to outline changes in the world of work at the level of the labour force as a whole. Anticipation of educational needs examines industries and occupations as integrated wholes which require people with qualifi cations from all levels of education or some other type of training to meet their skills needs. This brings focus to the borderlines between qualifi cations as well as the roles of different educational levels in the range of competencies within each specifi c fi eld. (Opetus- ja kulttuuriministeriö [Ministry of Education and Culture] 2008.) On the other hand, the process of anticipating skills needs often involves analysing changes in the competence structures of industries or clusters which, in turn, need to be taken into account in anticipation of educational needs.
In certain respects, anticipation of both skills needs and educational needs must use suffi ciently consistent methods and practices to enable national and regional efforts to support each other and bring added value to both levels. This becomes particularly evident in quantitative anticipation, which makes use of several classifi cations that must be at least roughly similar. A good example of connecting quantitative and qualitative anticipation is the National Project on Anticipation of Competences and Skills Needs (VOSE), co-ordinated by the Finnish National Board of Education, which has produced qualitative data in support of anticipation of changes in the occupational structures of different industries (Opetushallitus [Finnish National Board of Education] 2012b).
2.2 The process of anticipating demand for labour and educational needs
Quantitative anticipation of educational needs has long traditions in Finland, stretching all the way back to the 1960’s. For quite a long time, it has been carried out using the labour force method and its applications, where educa-tion and training provision is adjusted to meet the skills requirements for the labour force based on quantitative anticipation. Long-term quantitative antici-pation of educational needs was carried out at the Ministry of Education and Culture up until the mid-1990’s when practical anticipation work was assigned to the Finnish National Board of Education. At that point, the Board imple-mented a development project of anticipation of demand for labour and edu-cational needs between 1996 and 1999, with funding from the European Social Fund and the Finnish Ministry of Education and Culture. The project resulted in development of a model for quantitative anticipation of demand for labour and educational needs (the Mitenna model). The anticipation work in terms of

18
demand for labour and educational needs carried out by the Finnish National Board of Education is based on an application of the labour force method, which has been supplemented with components required for anticipation of educational needs.
The model is geared towards anticipating long-term educational needs (about 15 years) based on the needs of the labour market, which have been utilised specifi cally in preparation of the Ministry of Education and Culture’s Develop-ment Plans for Education and Research, drawn up for every Government term. The plans are updated as new industry forecasts, for example, are released, which makes it possible to produce continuous anticipation data. The model is not, however, just a calculation model only producing quantitative anticipation results, but it also contains an operating model based on co-operation with stakeholders. It is used to connect various forecasts, expert opinions and edu-cation policy objectives in order to anticipate future educational needs. This contributes to ensuring that the model’s results are not based on the hypoth-eses on economic development produced by a single research institute, for example, but that the anticipation process involves extensive debates on the national future.
The Mitenna model provides long-term data on changes in demand for labour, natural wastage of labour, demand for skilled labour and educational needs (further information about the concepts used in anticipation is available in Appendix 1). Practical anticipation work often involves making alternative cal-culations based on different development prospects on the labour market. The key is for the anticipation model to make use of a wide variety of methods and sources, such as econometric forecasts, statistics, expert consultations and industry- and occupation-specifi c anticipation surveys. Interpretation of antici-pation results also takes account of other research and survey data concerning industries, occupations and education. The model also makes use of education policy objectives for the effi ciency and effectiveness of the education system, which have a bearing on the relative weights assigned to different levels and fi elds of education.
The Mitenna model makes use of various classifi cations and statistical sources as baseline data. The classifi cations are based on the common industrial and
19
occupational classifi cations used in the European Union1. The Finnish National Board of Education has further refi ned the classifi cations to form groups that are more useful for the purposes of anticipating demand for labour and edu-cational needs. The industrial and occupational classifi cations used in anticipa-tion are presented in the tables in Appendices 4 and 6.
Development of the method has also involved extensive investigation into what types of statistical data are required by quantitative educational anticipa-tion, where and how to access such data and how it needs to be modifi ed. The comprehensive statistical database of Statistics Finland has created strong con-ditions to develop the model. Labour-market data is required about industries, occupations and occupational transitions. Occupations need to be grouped in a sensible way in terms of education, while it is also necessary to create a cor-respondence key between occupational groups and the classifi cation of educa-tion. Population forecasts are required for anticipation of the supply of labour and the total supply of new entrant places in education and training. Calcula-tions of natural wastage from the labour force call for occupation-specifi c age data and retirement data relating to occupations. In addition, anticipation of demand for vocationally trained labour also requires data on unemployment and labour force participation rates among qualifi cation-holders. Anticipation of the number of people to receive training, in turn, requires data on the per-formance of the education system: what the drop-out rates are for different fi elds and levels of education and how common it is to complete several quali-fi cations. Data on placement in employment is also important for estimating educational needs (the statistics used and data providers have been described in more detail in Appendix 2).
Quantitative anticipation of educational needs is used to provide information on quantitative needs for vocationally/professionally oriented education and training, which is based on long-term employment forecasts. The focus is on anticipating demand for labour over a period of about 15 years and using the results to derive educational needs. In terms of timing, this anticipation targets intake needs envisaged in 4 to 5 years’ time. The anticipation results for intake needs concern vocationally/professionally oriented education and train-ing intended for young people – i.e. upper secondary vocational education and training (VET), polytechnic education and university education – which mainly
1 Regulation (EC) No. 1893/2006 of the European Parliament and of the Council obliges Member States to use the common statistical classifi cation of economic activities in the European Community (NACE Rev. 2) or a corresponding national version with a structure conforming to the common classifi cation in their statistics production. The Finnish national Standard Industrial Classifi cation (TOL 2008) is this type of national version for Finland. Furthermore, Statistics Finland has in recent years produced a national application of the version of the International Standard Classifi cation of Occupations used in the European Union (ISCO 88-COM).

20
lasts from 3 to 8 years, depending on the level of education (the classifi cation of fi elds, subfi elds and levels of education is available in Appendix 3).
The anticipation process in the Mitenna model anticipates demand for and supply of labour in the target year and reconciles these factors. The anticipa-tion method is divided into two sections, the fi rst of which focuses on the needs of the world of work. This involves anticipation of demand for new labour, i.e. the amount of labour and the types of educational qualifi cations required by economic life over a certain anticipation period. The calculation consists of forecasts of changes in demand for labour and estimates of labour wastage.
The second section concerns the supply of labour. New labour is mainly sup-plied by new young age groups. The unemployed labour force also adds to supply. In addition, supply of labour is infl uenced by labour force participation rates, i.e. the proportion of graduates entering the labour force. The effects of net immigration and age group forecasts are also taken into account in antici-pation of the total supply of labour.
The Mitenna model makes it possible to trace the effects of different phases of the whole calculation process on intake needs. This enables interpretation of results and observation of different interdependencies. The model is suitable for both national and regional use and it allows regional differences in eco-nomic and occupational structures to be taken into account. The framework of the model is an Excel-based tool that supports management of statistical and forecast data. Figure 3 describes the main phases of the Mitenna anticipation process in more detail.
1. Industry forecasts
2. Change in occupational structures of
industries
3. Natural wastage
4. Total demand for new labour
5. Total need for new labour
6. Educational needs of the
world of work
7. Educational intake needs
adjusted to fit the size of the
young age group
Figure 3. Main phases of the anticipation process in the Mitenna model.

21
1 Industry forecasts. Responsibility for preparing long-term economic structure forecasts rests with the Government Institute for Economic Research (VATT). VATT produces employment forecasts for industries using a general equilibrium model called the VATTAGE model, which makes it possible to estimate the effects of various changes in the operating envir-onment on economic development and employment. This extensive and detailed model takes account of interactions between different sectors of the economy, which means that the effects caused by changes in policies or production technologies spread throughout the economy in the model.
Anticipation of educational needs as part of the latest Development Plan for Education and Research made use of two alternative development scen arios produced by VATT: a more moderate basic scenario empha sising prior development and a target scenario resting on a high standard of com-petence and the export industry2.
2 Change in occupational structures of industries. The next step is to anticipate the future occupational structure in each industry. This is done separately for each industry’s basic and target scenarios. Since education is more closely associated with occupations than industries, it is essential to establish a link between occupations and education. The Finnish National Board of Education produces a national vision of changes in the occupa-tional structure and regional co-operation groups run by regional councils provide regional visions. This exercise is based on development trends gleaned from statistics, making use of the views on changes expressed by experts in different fi elds and international and other comparisons and forecasts of occupational structure. The essential point is that forecasts for change in the occupational structure are not only based on calculations such as the shift-share analysis method, but that the change is anticipated making use of anticipation data on skills needs as well as statistics3. The anticipated occupational structure for the target year is derived by adding up the anticipated occupational structures of different industries. Finally, change in demand for labour by occupational group is calculated as the difference between the occupational structure forecasts for the target year and the occupational structure of the most recent reference year.
2 VATT has also prepared regional forecasts based on the national basic and target scenarios for the use of the regional councils and their anticipation teams. VATT has also produced an English-language report on the VATTAGE model (Valtion taloudellinen tutkimuskeskus [Government Institute for Economic Research] 2008).
3 The shift-share analysis method has been used internationally in various analyses of developments in regional economies, but in recent years it has also been used to prepare occupational structure forecasts by industry (such as the University of Warwick 2006, 38).

22
3 Natural wastage. In addition to anticipation of occupational structures, the model also calculates natural wastage from the labour force, i.e. the number of those permanently leaving the labour force from different occu-pational groups due to pensionable age, early retirement or death over the forecasting period. Natural wastage is calculated for both the employed and the unemployed labour force. In practical terms, natural wastage is calculated for each factor of natural wastage by making use of coeffi cients by occupational group formed by one-year age group from the most recent data available. Due to the signifi cant role of natural wastage, three alter-native natural wastage forecasts have been produced for the purposes of anticipating demand for labour and educational needs. Anticipation of edu-cational needs has made use of a natural wastage scenario where changes made to the pension scheme in 2005 are expected to lead to an increase in the retirement age by 1.7 years between 2008 and 2025. Both national and regional estimates of natural wastage are produced by the Finnish National Board of Education. The same natural wastage estimate is used in both the basic and the target scenario.
4 Total demand for new labour (job openings). The total demand for new labour forms the basis for long-term intake needs by subfi eld and level of education. It is derived by summing up the change in demand for labour and natural wastage from the labour force over the forecasting period. These results indicate the level of demand for labour during the anticipation period and the types of positions for which this labour force is needed.
In the next phase of anticipation, the data produced on changes in demand for labour and natural wastage from the labour force by occupational group is converted into data conforming to the classifi cation of fi elds, subfi elds and levels of education using the correspondence key between occupations and education specifi cally devised for this purpose. Each occupational group used in anticipation has a correspondence key which indicates the types of education and training expected to be required in the occupational group in question. In practical terms, the correspondence key consists of a percentage distribution by subfi eld and level of educa-tion, which totals 100% for each occupational group. There are 72 subfi elds and 3 levels of education. The correspondence key has been prepared for about 400 occupations and their results are compiled into correspondence keys for each of the 60 occupational groups, weighting the number of employed people in the relevant occupations. The correspondence key is produced in a centralised manner by the Finnish National Board of Educa-tion.

The correspondence key is devised making use of long time series supple-mented by the views of experts in educational contents and other antici-pation data on skills needs. The correspondence key makes it possible to convert the results of all the components of the anticipation process using the occupational classifi cation into data conforming to the classifi cation of fi elds, subfi elds and levels of education. The same correspondence key between occupations and education is used for both the basic and the target scenario.
5 Total need for new labour. In order to produce an overview of educa-tional needs of the world of work, it is important to take account of the total supply of labour as well as the mismatch between future demand for and supply of labour (unemployment). This is why the anticipation process takes account of the supply of labour by currently unemployed people over the forecasting period and the unemployment rate for the forecast year, which yields the total need for new labour as a provisional result. This makes it possible to establish the amounts of new labour and the types of qualifi cations that will be needed up until the forecast year. The basic and target scenarios use the unemployment rates at the end of the anticipation period according to industry forecasts. The Finnish National Board of Education has also produced alternative calculations, which have also estimated the effects of occupational transitions (career changes) on the total need for new labour and, consequently, on intake needs in edu-cation and training. Career change is diffi cult to anticipate over a longer term, which is why occupational transitions have not been included in the anticipation results, but they are used as a data source to supplement the results.
6 Educational needs of the world of work. In order for the world of work to have access to a suffi cient amount of labour with relevant educa-tional qualifi cations, intake numbers (new entrants and available places) in education and training should exceed the total need for new labour. It would be possible to use the results of the total need for labour produced in the previous phase directly to estimate educational needs if every new entrant completed a qualifi cation, if none of them completed any other qualifi cations and if everyone entered the labour market after graduation. However, this is not the case in reality. This is why we need effi ciency and effectiveness parameters for the education system, i.e. the completion rate, the proportion of multiple education and the labour force participation rate.
23

The Finnish National Board of Education anticipates educational needs using both targeted coeffi cients and coeffi cients describing the current situ-ation, which vary by fi eld and level of education. The Ministry of Education and Culture determines the coeffi cients to be used in anticipation, which contain education and social policy objectives. The objectives are based on the vision of extending careers and raising the employment rate. The targeted coeffi cients have been set so as to support the objectives of low-ering the average qualifi cation age and raising the employment rate. They change the educational needs of the world of work in quantitative and, fi rst and foremost, structural terms. The same coeffi cients are used in both the basic and the target scenario.
7 Educational intake needs adjusted to fi t the size of the young age group. The previous phases of the anticipation process have described the amount of labour and the types of educational qualifi cations that the world of work is expected to require over the forecasting period (total demand for new labour). In addition, they have involved estimating the number of new entrants required for different subfi elds and levels of education in order to satisfy those quantitative educational needs (educational needs of the world of work). When the relative structure of the educational needs of the world of work is combined with the average number of 16-to-21-year-olds over the forecasting period, the result is the intake needs for the forecasting period. Intake needs adjusted to the young age group mean the average intake anticipated per year that is required to guarantee edu-cational opportunities for the age group.
The anticipation results of the Mitenna model are generated by combining the size of the young age group, the distribution of educational needs based on demand for labour into different levels and subfi elds of education, and the effi ciency and effectiveness targets of the education system.
Chapters 3–6 provide a concise presentation of the most recent results of antici-pation of demand for labour and educational needs based on the anticipation model presented above. These results have been utilised to set the objectives concerning educational provision in the Development Plan for Education and Research for 2011–2016 of the Ministry of Education and Culture. The results have also been presented in more detail in a Finnish-language publication, which includes an English summary (Opetushallitus [Finnish National Board of Education] 2011).
24

3 Development of Finland’s economic structure
3.1 Development of Finland’s economic structure since the 1990’s
Since the early 1990’s, Finland’s economy has developed more strongly as part of international markets and the European economic area. In 2008, imports of goods and services accounted for slightly less than a third of total supply in the economy, while the fi gure had stood at 18% as recently as in 1991. The sig-nifi cant growth in imports does not mean that the pattern of foreign trade has become more one-sided; on the contrary, exports have also increased signifi -cantly over the same period. In 2008, exports accounted for about one third of total demand, while the fi gure was just under one fi fth in the early 1990’s. The largest share of demand comes from private consumption, which covers just under 40% of total demand; the proportion of public consumption expenditure stands at 16%4.
The manufacturing industry has increased its exports since the 1990’s in almost all branches with the exception of timber and paper products. However, the growth in exports has not rested exclusively on the manufacturing industry, but industries such as business activities, fi nancial and insurance activities, and letting and operation of dwellings have also increased exports. The pattern of exports within the manufacturing industry seems to have experienced a distinct change. Exports in the electronics industry stand more or less at the same level as in 1997, whereas other metal industry has increased its share considerably. On the other hand, the global structural change in the manufacture of wood and paper products is also refl ected in the exports of Finnish pulp and paper products. Over a period of ten years, their proportion has plummeted from just under a quarter of total exports in the manufacturing industry to less than 15%.
The most signifi cant long-term changes in Finland’s national economy have included the drop in the proportion of agriculture, forestry and hunting in value added to a quarter of the 1975 level by 2009 and the decline of the pro-portion of the manufacturing industry from about 26% to 18% over the same period. Admittedly, the last available reference year, 2009, does not give an entirely correct picture of development in terms of the manufacturing industry. In 2008, the industry accounted for more than 22% of output, while it was still 4 The fi gure is based on studies by the Government Institute for Economic Research on demand for
labour in the Finnish economy 2010–2025 and on the effects of policy measures on demand for labour in the Finnish economy 2010–2025 (Valtion taloudellinen tutkimuskeskus [Government Institute for Economic Research] 2010a & 2010b).
25

over 23% in 2005. Conversely, the industry that has clearly increased its propor-tion the most has been real estate and business activities: its proportion has gone up from about a tenth in 1975 to more than a quarter in 2009. The role of human health and social work activities as part of the national economy has also increased signifi cantly; the sector has doubled its proportion, currently producing about 10% of value added.
Long-term developments in employment follow the development in value added (Figure 4). The proportion of employed people within agriculture, hunting and fi shing has decreased signifi cantly over the last few decades. Con-versely, growth in employment within business activities has been considerable and has continued steadily up until the most recent reference year; between 1995 and 2007, its share of the total number of employed people has increased by 4.5 percentage points. The opposite has happened in employment in the manufacturing industry: in 1995, it employed one in fi ve Finns, whereas the fi gure was only about 17% in 2007. The declining employment in the manufac-turing industry and the considerable increase in employment in human health and social work activities have led to a situation where employment fi gures in these two industries account for equal shares of total employment.
26

Figure 4. Relative proportions of employed people by industry (%) in 1995 and 2007 (Tilastokeskus [Statistics Finland] 2009).
*) Management of real estate, combined facilities support activities, cleaning, sewage and refuse disposal, sanitation and similar activities
27

28
3.2 Alternative scenarios for development of the economic structure by 2025
The Government Institute for Economic Research (VATT) has prepared two scenarios in 2010–2011 for employment trends in different industries by 2025. The basic scenario included a minimum number of targets or assumptions on political or other choices that might have an effect on the economy and employment. It was very much about repeating the observed economic devel-opment using the model and continuing the trend into the future. Conversely, the target scenario’s vision for the Finnish national economy turns the declining trend in the manufacturing industry back to an upward trajectory. In practi-cal terms, this will happen in all sectors of the industry and will have ripple effects on fi nancial and business activities and education. The manufacturing industry’s international competitiveness will be safeguarded by means of highly customised products and a competence-intensive approach where innovations and R&D play a key role. In the target scenario, the Finnish export sector will be an even closer part of the global market area and exports will also include more services in addition to goods.
The basic scenario projects that the role of services in the industrial structure will continue to increase vigorously. In particular, this increasing service inten-sity applies to development of value added in the welfare society’s basic servi-ces and to the increase in the amount of labour involved in these services. At the same time, the manufacturing industry’s share of total value added shows a continuing downward trend and, consequently, the proportion of the busi-ness activities sector, supplying intermediate products to the export industry, will take a downward turn from its strong upward trajectory. In manufacturing industries, the number of employed people is reduced because of the possi-bility to replace labour by increasing capital inputs and faster development of productivity compared with service industries. As a result, it will be possible to produce more value added with smaller work contributions in the future. The increasing service intensity and its concentration mainly on basic public sector services will hamper development in other industries, representing a challeng-ing scenario in terms of overall development of the national economy. Domes-tic demand will, however, grow faster than export demand in relative terms, which is a clear change when compared with previous developments. Within the production structure, the share of services in the gross domestic product and the labour force will increase while the proportions of primary produc-tion and processing will diminish. This change in the production structure is evident in demand for labour in that the number of employed people in service industries will grow rapidly in the future.

29
The basic scenario’s assumptions of developments in the future structure of demand and the diminishing role of export demand may be overstated, if industries succeed in continuously creating new products and services with a higher level of price competitiveness when compared with existing products and services. In particular, developments in export demand within individ-ual industries may deviate even quite considerably from the decreasing trend assumed in the basic scenario. This will, however, require broad-based growth in productivity and utilisation of technological innovations.
The forecast suggests that the amount of labour force takes a downward turn during 2010, after which the labour force will decrease steadily throughout the forecasting period. The number of employed people peaked in 2008, after which it dropped rapidly due to the recession resulting from the fi nancial crisis. The forecast estimated that the number of employed people in 2010 would be 150,000 less than two years earlier. However, the unemployment rate would already start to decline the following year and the employment situation would gradually improve. In 2025, the number of employed people is expected to be about 2,350,000, which is 20,000 people less than just before the recession in 2007.
The target scenario draws a very different picture of Finland from the basic scenario. It estimates that global market demand for Finnish export products will continue to grow, while expecting to see productivity within human health and social work activities grow considerably more than before. In practical terms, this means that the manufacturing industry’s proportion of value added will take a new upward turn and that employment will not decline to the same extent as projected in the basic scenario. Correspondingly, employment within human health and social work activities will not increase as much as in the basic scenario. The target scenario suggests that macrolevel economic growth will be clearly faster than in the basic scenario, which projects that economic growth will remain at the level of about 1.7% in the 2020’s. The target scenario, in turn, forecasts that the real GDP will grow at an annual rate of 2.3% during the last few years of the forecasting period.
The target scenario draws a picture of Finland in 2025 as a national economy building on a high standard of competence, where GDP growth will also be strongly based on exports alongside private consumption. The scenario assumes that R&D activities will mostly remain in Finland, while the country will also be more open in terms of international trade than the basic scenario suggests. The positive effects of exports on GDP will exceed the negative effects of imports in the target scenario. Such a future will not, however, become reality by itself,

30
but it calls for reform both in the manufacturing industry and in services. In the future, exports in the manufacturing industry will not be based on mass production but on highly customised products, where customer relationship management and investment in a high standard of competence are key.
World market demand within Finland’s key export industries is expected to grow faster from 2011 onwards when compared with the basic scenario. The underlying assumption is that manufacturing industries will also be able to adapt to changes in the world markets over the coming decades. In addition to the growth assumptions on demand within manufacturing industries, some changes have also been made to growth in demand within service industries. Exports within business activities and research and development are expected to grow faster than in the basic scenario.
The target scenario assumes a lower growth rate in demand for public admin-istration than suggested in the basic scenario, because public consumption’s share of the GDP will decrease as a result of the central government’s product-ivity and effectiveness targets. Consumption within local administration is also expected to decline to some extent. A similar reduction is also projected in demand for human health and social work activities when compared with the basic scenario. The reason cited for the slower growth in demand is changes in the structures and provision methods of public services, which make it possible to enhance productivity. This will reduce the sector’s demand for labour, thus releasing more labour for the needs of export industries.
In addition to the assumptions relating to developments in demand, the target scenario has made a signifi cant change to the assumption on developments in employment fi gures and rates in the years to come. The employment rate among 15-to-64-year-olds is expected to reach 75% by 2025, whereas the fi gure envisaged in the basic scenario remains at just above 72%. In 2011, the employ-ment rate among those aged between 15 and 64 stood at about 69% (Tilas-tokeskus [Statistics Finland] 2012b).
The target scenario suggests that the Finnish economy will get closer to full employment, because the unemployment rate will drop to around 4% in the 2020’s as a result of growth in employment and the diminishing labour force. In the spring of 2012, the unemployment rate stood at about 8% (Työ- ja elinkeinoministeriö [Ministry of Employment and the Economy] 2012). Based on the results of the target scenario, the number of employed people decreases up until 2012 and will then increase rapidly for the next couple of years. The growth will then slow down but will continue through to 2025. The number of employed people in 2025 is expected to be 2,420,000.

31
Key differences between the basic scenario and the target scenario The target scenario assumes that the employment rate will reach 75% by 2025, whereas
the figure envisaged in the basic scenario remains at about 72%. The target scenario forecasts that the GDP will grow at an annual rate of 2.3% during the
last few years of the period, whereas it will remain at about 1.7% in the basic scenario. The target scenario projects that the unemployment rate will drop close to 4%, whereas it
will stand at about 6.8% in the basic scenario. The target scenario assumes that growth in export demand will continue in the future, be-
cause world market demand within key Finnish export industries is expected to grow faster than projected in the basic scenario. The target scenario emphasises increasing capital intensity and faster growth in productivity. The target scenario envisages more support for innovation activities than the basic scenario,
which will be manifested in growth in public demand within research and development and education. Demand for public administration has been reduced in the target scenario for reasons such
as the central government’s productivity and effectiveness targets; this will release more resources for use by (export) manufacturing industries than suggested in the basic scenario. The target scenario forecasts slower development for agriculture than the basic scenario, but
it envisages a more favourable development in domestic demand than the basic scenario. Demand within mining and quarrying, wood and paper industries, the electronics industry
and manufacture of metal products is estimated to be 2.5 to 3 percentage points higher in the target scenario than in the basic scenario. Alongside exports of goods, exports of services are also expected to be at a higher level in
the target scenario than in the basic scenario, which can be seen within business activities and research and development. The target scenario envisages lower growth in demand for human health and social work
activities than the basic scenario. This is due to better development in productivity within the sector and to the assumption that there will be structural changes in public services, such as a shift from institutional care to less intensive forms of care.
The basic scenario anticipates that the highest increases in employment fi gures during the 2008–2025 period will occur in human health activities, social work activities and retail trade. The highest decreases in employment fi gures are expected to occur in forestry and manufacture of forest industry products and in manufacture of electrical and electronic equipment. The target scenario also anticipates that the highest increases in employment fi gures during the 2008–2025 period will be seen in social work activities, human health activities and retail trade, but also in education and research and technical business activi-ties. Conversely, the highest decreases in employment fi gures are expected to

32
occur in agriculture, hunting and fi shing and manufacture of basic metals and fabricated metal products. The growth in the number of employed people in human health activities highlighted in both scenarios raises a question about the prerequisites for provision of extensive wellness services. Even if the health care and social services sector is able to increase its productivity and develop new, less labour-intensive therapeutic methods, the amount of labour required in the sector will show clear growth in the future.
When the levels of the number of employed people in the basic and target scenarios are compared with the situation at the turn of the millennium, atten-tion is drawn to the signifi cant growth in the number of employed people in social work activities and human health activities. The basic scenario suggests that the amount of labour involved in human health activities in 2025 will be as much as 1.57 times the 2000 level (Figure 5). When measured by the number of employed people, the sector would be clearly larger than the manufactur-ing industry. This is regardless of the fact that the scenario also includes an ambitious target for growth in productivity in wellness services. The suffi cient supply of labour for human health and social work activities will be the fore-most challenge for the Finnish labour market in the 2020’s and the sector will also need plenty of skilled workers from the immigrant population. The results of industry forecasts are presented in more detail in Appendix 4.

*) Management of real estate, combined facilities support activities, cleaning, sewage and refuse disposal, sanitation and similar activities
33
Figure 5. Number of employed people by industry (%) in 2000 and basic and target scenario forecasts for the number of employed people by 2025 (Tilastokeskus [Statistics Finland] 2009).

34
4 Change in occupational structures by 2025
4.1 Factors of change in occupational structures of industries
Changes in the occupational structure refer to changes in the relative propor-tions of employed people working in different occupational groups and to quantitative changes in the entire labour force over the forecasting period. Similar to the industry forecasts presented in Chapter 3, developments in the occupational structure by industry have been anticipated in two alternative ways. The alternative occupational structures are based on a structural analysis of industries and reports produced on this analysis (Valtion taloudellinen tut-kimuskeskus [Government Institute for Economic Research] 2010a & 2010b).
Background for preparing the occupational structure forecast was obtained through examining the most recent views and reports concerning the future and, in certain special cases, exploring the views of experts from different fi elds on the internal development characteristics of these fi elds that should be taken into account when preparing the forecast. As there are no unambiguous views or facts to form a basis for devising occupational structures, opinions and emphases must be chosen from several alternatives at different phases of the anticipation work.
Change in the occupational structure of an industry is related to changes in production methods and organisation of production. New methods and tech-nologies are constantly being introduced into production, requiring new com-petencies from workers. Such changes will often obliterate some tasks while also creating new ones. This is the case regardless of whether we are speaking about production of goods, services or R&D work. The aim when estimating the change in an industry’s occupational structure is to identify the factors underlying change in a production method and the consequent change in skills needs. An occupational structure forecast represents these long-term changes in skills needs in terms of change in the occupational structure. Preparation and interpretation of occupational structure forecasts are complicated by the classifi cations used in them. Anticipation efforts therefore use rougher clas-sifi cations than occupational titles – namely, a classifi cation of occupational groups. This means that anticipation results are not tied to current occupations but to occupational groups, within which new occupations may emerge and old ones may disappear. It is likely that skills requirements will increase and be emphasised in new ways in almost all occupational groups.

35
Changes in the industrial structure are also refl ected in the occupational struc-ture. They may be related to the reasons described above or to major changes in the operating environment, such as market deregulation and increasing inter-national competition. As a result, employment may increase in some industries and decrease in others. This is refl ected in employment fi gures in occupations typical of industries with different development trends, thus changing the occu-pational structure. A similar phenomenon can also be detected when examin-ing change in the occupational structure within each main industry. Different employment trends in different branches of industry also change the occupa-tional structure of the main industry. The occupational structure of an industry is also infl uenced by the fact that many companies focus on their core business by outsourcing other functions. In most cases, jobs are relocated to some other industry where companies specialise in selling services to other businesses. In such cases, internal occupational structures within industries will change, but the occupational structure of the entire labour force will not necessarily change all that much.
Similar to industry forecasts, forecasts of occupational structures have also been prepared using two alternative scenarios describing basic and target develop-ment.
The basic development scenario is based on the industry developments envisaged in the basic scenario described in Chapter 3. This scenario estimates that the occupational structures of industries will mainly change in line with prior developments. Efforts have also been made to take such known changes that have taken place but are not visible in the available historical data into account when preparing occupational structure forecasts. Examples of such changes include the major structural change that hit forestry and manufacture of forest industry products in the last few years of the previous decade as well as changes to occupational classifi cations.
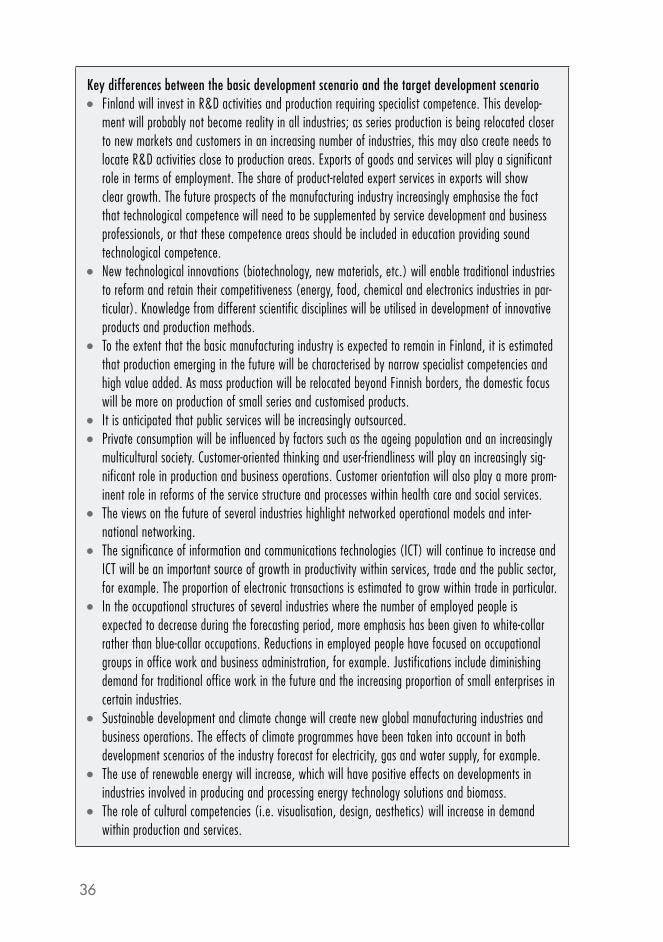
The target development scenario is based on a high standard of scientifi c, technological, business, environmental and service competence. Anticipation of industry-specifi c occupational structures in line with the target scenario has highlighted the following aspects in particular:
36
Key differences between the basic development scenario and the target development scenario Finland will invest in R&D activities and production requiring specialist competence. This develop-
ment will probably not become reality in all industries; as series production is being relocated closer to new markets and customers in an increasing number of industries, this may also create needs to locate R&D activities close to production areas. Exports of goods and services will play a significant role in terms of employment. The share of product-related expert services in exports will show clear growth. The future prospects of the manufacturing industry increasingly emphasise the fact that technological competence will need to be supplemented by service development and business professionals, or that these competence areas should be included in education providing sound technological competence. New technological innovations (biotechnology, new materials, etc.) will enable traditional industries
to reform and retain their competitiveness (energy, food, chemical and electronics industries in par-ticular). Knowledge from different scientific disciplines will be utilised in development of innovative products and production methods. To the extent that the basic manufacturing industry is expected to remain in Finland, it is estimated
that production emerging in the future will be characterised by narrow specialist competencies and high value added. As mass production will be relocated beyond Finnish borders, the domestic focus will be more on production of small series and customised products. It is anticipated that public services will be increasingly outsourced. Private consumption will be influenced by factors such as the ageing population and an increasingly
multicultural society. Customer-oriented thinking and user-friendliness will play an increasingly sig-nificant role in production and business operations. Customer orientation will also play a more prom-inent role in reforms of the service structure and processes within health care and social services. The views on the future of several industries highlight networked operational models and inter-
national networking. The significance of information and communications technologies (ICT) will continue to increase and
ICT will be an important source of growth in productivity within services, trade and the public sector, for example. The proportion of electronic transactions is estimated to grow within trade in particular. In the occupational structures of several industries where the number of employed people is
expected to decrease during the forecasting period, more emphasis has been given to white-collar rather than blue-collar occupations. Reductions in employed people have focused on occupational groups in office work and business administration, for example. Justifications include diminishing demand for traditional office work in the future and the increasing proportion of small enterprises in certain industries. Sustainable development and climate change will create new global manufacturing industries and
business operations. The effects of climate programmes have been taken into account in both development scenarios of the industry forecast for electricity, gas and water supply, for example. The use of renewable energy will increase, which will have positive effects on developments in
industries involved in producing and processing energy technology solutions and biomass. The role of cultural competencies (i.e. visualisation, design, aesthetics) will increase in demand
within production and services.
37
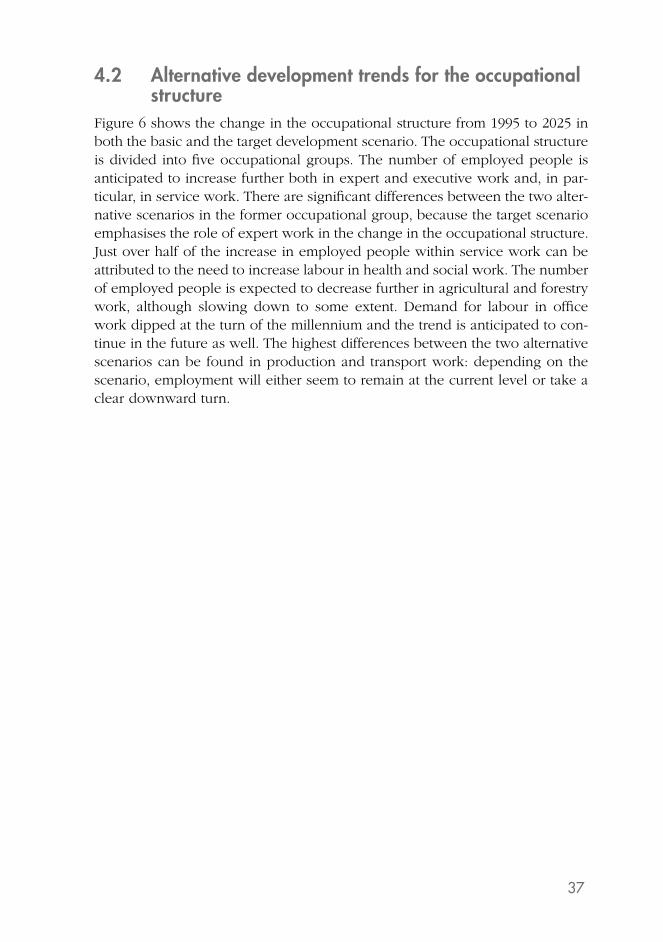
4.2 Alternative development trends for the occupational structure
Figure 6 shows the change in the occupational structure from 1995 to 2025 in both the basic and the target development scenario. The occupational structure is divided into fi ve occupational groups. The number of employed people is anticipated to increase further both in expert and executive work and, in par-ticular, in service work. There are signifi cant differences between the two alter-native scenarios in the former occupational group, because the target scenario emphasises the role of expert work in the change in the occupational structure. Just over half of the increase in employed people within service work can be attributed to the need to increase labour in health and social work. The number of employed people is expected to decrease further in agricultural and forestry work, although slowing down to some extent. Demand for labour in offi ce work dipped at the turn of the millennium and the trend is anticipated to con-tinue in the future as well. The highest differences between the two alternative scenarios can be found in production and transport work: depending on the scenario, employment will either seem to remain at the current level or take a clear downward turn.

38
Figure 6. Change in the occupational structure in 1995–2025.
Figure 7 shows comparisons of relative changes in jobs (%) by major occu-pational group in the basic and the target scenario in 2008–2025. The clear-est differences between the alternative scenarios can be found in two major occupational groups. The target scenario envisages more moderate growth in the number of jobs in health and social work than the basic scenario. Corres-pondingly, the target scenario anticipates considerably smaller reductions in manufacturing jobs than the basic scenario. The number of employed people in health and social work is smaller in the target scenario’s industry forecast, because it projects a slower rate of increase in demand for services than pro-jected in the basic scenario. It anticipates that services will be safeguarded with a smaller number of people, thus making more labour available for the needs of the manufacturing industry, for example. The number of employed people in offi ce work and agricultural and forestry work will also be smaller in the target scenario than in the basic scenario. As a result, there will be more labour available for service work, expert and executive work and manufacturing work.
The groups in the Figure have been formed from the following major occupational groups:Service work: service work, health and social work, rescue and security workProduction and transport work: manufacturing work, construction work, transport and logistics work, occupation unknownExpert and executive work: teaching and education, cultural and communications work, other executive and expert work.Office work: office workAgricultural and forestry work: agricultural and forestry work.

39
Traditional offi ce work is expected to decline further especially in the target scenario for the occupational structures of different industries, while the focus will shift to expert work. This can be seen in the target scenario in higher growth in the number of employed people in other executive and expert work and teaching and education than projected in the basic scenario and, in particu-lar, in their high relative growth. Relative growth is also signifi cant in cultural and communications work, because the target scenario places emphasis on cultural occupations alongside expert work. The target scenario anticipates that the number of employees in the major occupational group of agricultural and forestry work will decline almost at the same rate as during the fi rst decade of the 21st century. The basic scenario, in turn, forecasts reduction in agricultural employment to slow down, because the most considerable structural changes affecting employment have already taken place.
Figure 7. Change in jobs (%) in 2008–2025 by major occupational group according to the two alternative development scenarios.
Figure 8 simultaneously describes the average relative annual changes in jobs (%) by major occupational group in the basic and the target scenario and the number of employed people in 2007. The relative annual growth in the number of employed people in health and social work between 2007 and 2025

40
will be as high as 1.22% on average. Conversely, when measured in terms of the number of jobs in 2007, the average annual growth in the largest major occupational group of service work will only stand at 0.16%. The reduction in the number of manufacturing jobs by 0.5% per year is signifi cant in terms of the changes in the Finnish labour market. This results in a situation where the growth in the number of service jobs will play an increasingly prominent role in the economic structure in the 2020’s, while the relative proportion of manu-facturing jobs in the total number of jobs will decline.
Figure 8. Average relative annual changes in jobs (%) by major occupational group in the target scenario in 2008–2025 and the number of employed people in 2007.
Figure 9 describes the relationship between the industry forecasts produced by the Government Institute for Economic Research and the occupational struc-ture forecasts prepared by the Finnish National Board of Education and their effects on the anticipated job trends. The data has been presented by major occupational group for the entire anticipation period in keeping with the target scenario. The effects of changes in employment in different industries have

41
been calculated such that the internal occupational structures of industries have been retained at the level of the baseline situation for anticipation at the end of 2007 throughout the forecasting period. Deducting the resulting change in employment in different occupational groups from the anticipated change in total employment shows the effect of change in the internal occupational structures of industries on each occupational group’s employment trend.
Figure 9. Effects of changes in employment and internal occupational structures in different industries on developments in job numbers within the major occupational groups between 2008 and 2025 in the target scenario.
The highest growth in the number of employed people can be seen in health and social work and service work. The development forecast for the former major occupational group can be attributed to the effects of both occupational structures and industry forecasts. Figure 9 indicates that changes in internal occupational structures within industries have a considerable effect on employ-ment in service work, offi ce work as well as in other executive and expert work. Traditional offi ce work is estimated to decline clearly in all industries, because development of information and communications technologies and inclusion of offi ce routines in the job descriptions of almost all occupations reduces the need for specifi c offi ce work occupations. Most manufacturing industries are also expected to see a decline in the number of employed people, result-ing in a drastic reduction in manufacturing jobs. However, the change in the occupational structure will alleviate job reductions to some extent, because the proportion of expert occupations is anticipated to grow in many manufactur-ing industries.

42
When anticipating educational needs, the number of employed people by occupational group can be translated into the language of education by means of the so-called correspondence key between occupations and education (for further information, see Section 2.2). Figure 10 represents the level of educa-tion among employed people that can be expected in the long term if educa-tion is implemented in keeping with the correspondence key. The number of employed people anticipated for 2025 (employed people by occupational group in the target scenario) has been converted to match the classifi cation of fi elds, subfi elds and levels of education using the correspondence key and the data has then been summed up by level of education (‘Key 2025’). This result is infl uenced both by the occupational structure anticipated for 2025 and by the correspondence key. In addition, there is a corresponding conversion based on the number of employed people in 2007 (‘Key 2007’), indicating the types of education completed by employed people when compared with the current situation if education were in line with the targets of the correspondence key. Comparison of this result with the actual level of education among employed people in 2007 reveals the target levels included in the correspondence key when compared with the current situation. The ‘Employed 2007’ data set covers all people employed in 2007 by level of education.
Figure 10. People employed in 2007 by level of education and the educational distribution of employed people anticipated in the correspondence key according to the 2007 and 2025 occupational structures.

43
Figure 10 also outlines the educational distribution of employed people by age group in 2007. Bearing in mind that the proportion of unskilled people is highest in the oldest age groups and that the anticipation concerns the object-ives set for future employed people, the target levels of the correspondence key should be compared with the 30–34 age group, for example, with the highest proportion (35%) of higher education (university + polytechnic) degree holders.
The educational distribution of employed people is anticipated to change in the long term in such a way that the proportion of higher education degree holders (44%) will be clearly higher among new employees when compared with those employed in 2007. The proportion of upper secondary vocational qualifi cations will also be higher, because the proportion of people with only general education or without any education is expected to decline consider-ably. This can be seen, in particular, in the increasing proportion of upper secondary vocational education and training. The educational distributions in different occupational groups by level of education used in the correspond-ence key are described in more detail in Appendix 5.

44
5 Demand for labour up until 2025
Job openings refer to the sum of changes in the amount of natural wastage and in the number of jobs (employed people) during the anticipation period. Job openings are anticipated for each occupational group. If an occupational group is expected to see a growth in the number of employed people, the number of new employees required for the group equals the sum of the growth and natural wastage in the group. If an occupational group is declining, the number of jobs decreases through natural wastage and it is only necessary to replace part of the wastage with new labour, i.e. the change in the number of employed people will be deducted from the amount of natural wastage.
5.1 Natural wastage from the employed labour forceNatural wastage due to retirement plays a signifi cant role when anticipating future labour needs with a long-term view. The age structure of the Finnish population is characterised by the rapidly increasing proportion of those aged over 60 and, correspondingly, the declining proportion of those aged under 20. This is estimated to result in a shortage of labour as early as within the next few years, which is why political decision-makers have worked together with labour market organisations throughout the last decade in order to identify means to extend careers. A key way of extending careers is to delay retirement, which was pursued by the 2005 pension reform. After the reform, in 2009, the Government and labour market organisations agreed on an even higher target for raising the retirement age. The natural wastage forecast was based on cur-rently effective pension legislation. The Finnish Centre for Pensions estimates that the expected retirement age will increase from 59.4 years to 61.1 years during the period from 2008 to 2025 due to the 2005 pension reform. (Eläke-turvakeskus [Finnish Centre for Pensions] 2009 & 2010a.)
It is anticipated that a total of about 1,036,000 employees are retiring from the labour market during the period from 2008 to 2025, accounting for 44% of the number of employed people in 2007. The average amount of natural wastage per year is 57,600 employees. In practical terms, almost all those currently aged over 50 will retire by 2025, because they will reach the age of 68. In 2007, this group amounted to 725,000 people and accounted for 70% of natural wastage. A total of 313,000 employees aged under 50 are anticipated to retire from the labour market, accounting for 30% of natural wastage.

45
The fi rst baby-boomer age group (born in 1945) turned 63 in 2008. This means a clear growth in natural wastage from 2008 onwards, even in spite of the fact that many baby-boomer employees have already retired from working life. Natural wastage is anticipated to grow through to 2018, when it would be about 62,000 employees per year. Thereafter, natural wastage would start to decline and end up at 59,000 in 2025 (Figure 11).
Natural wastage is mostly infl uenced by the age of employed people. At the end of 2007, the median age of employed people was 41.7 years. Differences between occupational groups are considerable. The median ages among employed people in the major occupational groups vary between 37 and 47 years. The range of variation in the median age within the more detailed clas-sifi cation of 60 occupational groups is even higher, i.e. 28–47 years. Employees are generally younger in those occupational groups where employment has grown for a long time and new labour has been recruited.
Natural wastage is also infl uenced by the mental and physical strain of work as well as work-related risks, which vary considerably between different occu-pations. The strain and work-related risks are depicted by the proportion of disability pensions and mortality in natural wastage, whereas the proportion of those retiring due to old age describes the age of the labour force.
At the beginning of the forecasting period, retirement pensions accounted for 57% of natural wastage, whereas the fi gures for mortality and disability pen-sions were 5% and 38%, respectively (Figure 11). In the next few years, the number of those retiring due to old age will increase rapidly, accounting for 76% of natural wastage by the end of the forecasting period. Conversely, the number of people retiring due to disability will start to decline after 2012, while mortality will also decrease slightly from the 2007 level.

46
Figure 11. Natural wastage from the employed labour force between 2008 and 2025.
The numbers of retiring people are highest in the major occupational groups of service work, manufacturing work, health and social work and offi ce work, with high numbers of employed people. Figure 12 suggests that more than 200,000 employed people are retiring from service and manufacturing work, while the fi gure for health and social work and offi ce work is over 100,000. The total natural wastage from these groups amounts to 670,000 people, accounting for 65% of the total natural wastage from the employed labour force. In relative terms, however, the amount of natural wastage is most signifi cant in the major occupational group of agricultural and forestry work – as many as over one half of those employed in this fi eld will retire by 2025.
0
10 000
20 000
30 000
40 000
50 000
60 000
70 000
2008 2010 2012 2014 2016 2018 2020 2022 2024
Total natural wastage
Retirement pension
Disability pension
Mortality

47
Figure 12. Natural wastage from the employed labour force between 2008 and 2025 and proportion of natural wastage as a percentage of people employed in 2007.
5.2 Job openingsThe basic scenario projects that there will be 1,016,000 job openings during the forecasting period, while the fi gure for the target scenario is 1,085,000. In annual terms, this translates into an average of 56,000 and 60,000 new jobs in the basic and the target scenario, respectively. Natural wastage accounts for a signifi cant proportion of job openings, standing at 96% in the target scenario. In the basic scenario, natural wastage exceeds the number of job openings, because the number of employed people is declining (Figures 13 and 14).

48
Figure 13. Natural wastage, change in jobs and number of job openings in 2008–2025 in the industry and occupational structure forecasts according to the target development scenario.
-500 000 0 500 000 1 000 000 1 500 000 2 000 000 2 500 000
Number of employed people in 2007
Change 2008–2025
Natural wastage 2008–2025
Job openings 2008–2025
0 500 000 1 000 000 1 500 000 2 000 000 2 500 000
Number of employed people in 2007
Change 2008–2025
Natural wastage 2008–2025
Job openings 2008–2025
Figure 14. Natural wastage, change in jobs and number of job openings in 2008–2025 in the industry and occupational structure forecasts according to the basic development scenario.
Changes in job numbers in different occupational groups are infl uenced by the anticipated changes in jobs for different industries and changes in their internal occupational structures. The basic scenario projects that the number of jobs will decrease by 20,600, whereas the target scenario envisages the number of jobs to grow by 48,600. New jobs will be created in those of the 60 occupa-tional groups where job numbers will increase. The increase in job numbers in the growing occupational groups amounts to 132,000 and 170,000 jobs in the basic and the target scenario, respectively. The high number of job openings in the basic scenario is due to the fact that they will strongly focus on three occupational groups within health and social work, which account for as many as 100,000 of the new jobs.
The basic scenario projects the highest number of job openings in health and social work, service work and manufacturing work (Figure 15), accounting for 58% in total of all job openings. Natural wastage accounts for a signifi cant proportion of job openings in all major occupational groups, to the extent that it exceeds the number of job openings in more than half of all major occupa-tional groups. All major occupational groups include occupational groups with

49
both growing and declining occupations. The only exception is health and social work, as all of its occupational groups are anticipated to see a growth in the number of employed people.
-100 000 -50 000 0 50 000 100 000 150 000 200 000 250 000 300 000
Cultural and communications work
Rescue and security work
Agricultural and forestry work
Transport and logistics work
Construction work
Teaching and education
Other executive and expert work
Office work
Manufacturing work
Service work
Health and social work
Job openings
Natural wastage
Change
Figure 15. Number of jobs becoming available between 2008 and 2025 by major occupational group in the basic development scenario.
The target scenario (Figure 16) anticipates that more jobs will become available in service work than in health and social work. Combined, the three largest major occupational groups account for 57% of all job openings. Manufacturing work is projected to see 50,000 more job openings than estimated in the basic scenario. The target scenario projects that about 9,000–11,000 jobs will become available in construction, transport and logistics and service work occupations. About 10,500 jobs are expected to become available in teaching and educa-tion, while the fi gure for cultural and communications work is 8,500 jobs. In quantitative terms, a key difference when compared with the basic scenario is that there will be about 34,000 less jobs opening up in health and social work. Other signifi cant differences between the two scenarios are in the employment prospects in the occupational groups within cultural work and other executive and expert work. Changes in the number of employed people, natural wastage and the number of job openings by occupational group are described in more detail in Appendix 6.

50
Figure 16. Number of jobs becoming available between 2008 and 2025 by major occupational group in the target development scenario.
5.3 From the total need for new labour to the educational needs of the world of work
The total need for new labour is obtained, fi rstly, by taking account of the current supply of unemployed labour in addition to job openings, which reduces the total need for new labour. Secondly, a small proportion of the labour force will also remain unemployed during full employment, because even in the most ideal circumstances, there are mismatch problems and other barriers to employment on the labour market. This also means that at least a small proportion of those completing their education during the forecasting period will be unemployed at some point, which will increase the total need for new labour. The unemployment forecasts at the end of the forecasting period used in the anticipation calculations are based on estimates produced as part of industry forecasting work by the Government Institute for Economic Research. The unemployment rates set for the 2025 forecast year in the basic and the target scenario were 6.8% and 4%, respectively.
-100 000 -50 000 0 50 000 100 000 150 000 200 000 250 000 300 000
Rescue and security work
Cultural and communications work
Agricultural and forestry work
Transport and logistics work
Construction work
Teaching and education
Office work
Other executive and expert work
Manufacturing work
Health and social work
Service work
Job openings
Natural wastage
Change

51
In the basic scenario, the need for people with upper secondary vocational qualifi cations accounts for 51% of the total need for new labour. The needs for holders of polytechnic and university degrees account for 28% and 18% of the total need, respectively. The proportion of other education is 3%. When exam-ined by fi eld of education, the total need focuses on Social Services, Health and Sports (26% of the total need) and Technology, Communications and Transport (25%) (Figure 17). The forecast increase in the number of employed people accounts for 35% of the total need for new labour with qualifi cations in Social Services, Health and Sports and the total need for new labour in the fi eld is 12,000 more employed people than projected in the target scenario.
In the target scenario, the need for people with upper secondary vocational qualifi cations accounts for 49% of the total need for new labour. The need for holders of polytechnic degrees is the same as in the basic scenario, accounting for 28% of the total need, while the fi gure for university degree holders is 20%. The proportion of other education is 3%. When examined by fi eld of educa-tion, the total need focuses on Technology, Communications and Transport (31% of the total need) and Social Services, Health and Sports (21%) (Figure 17). The total need for new labour with qualifi cations in Technology, Commu-nications and Transport projected in the target scenario exceeds the estimate for the basic scenario by almost 110,000 employed people.
0 50 000 100 000 150 000 200 000 250 000 300 000 350 000
Other education
Natural Resources and the Environment
Natural Sciences
Culture
Humanities and Education
Tourism, Catering and Domestic Services
Social Sciences, Business and Administration
Social Services, Health and Sports
Technology, Communications and Transport
Target scenario Basic scenario
Figure 17. Total need for new labour in 2008–2025 by field of education in the basic and target scenarios.

52
The educational needs of the world of work are obtained by combining the total need for skilled labour and the effi ciency and effectiveness parameters set for education and training. The number of new students required for different levels of education is considerably higher than the anticipated number of job openings would suggest, because some students will drop out or continue their studies after completing their fi rst qualifi cation.
The average percentage targets set in anticipation calculations for completion of education at different levels as a whole are as follows: 78% for upper sec-ondary vocational education and training (VET), 75% for polytechnic educa-tion and 75% for university education. However, the percentage shares vary between 54% and 96% by subfi eld.
The proportion of further study tracks and multiple education indicates the percentage shares of those qualifi cation-holders who go on to complete another qualifi cation either at the same level but in a different subfi eld or at another level either in the same or in a different subfi eld. The following percentage shares have been used in estimates of educational needs: 23% for upper secondary VET, 7% for polytechnic education and 5% for university Mas-ter’s degrees. The Finnish education system makes it possible to move from vocational studies to higher education, which explains the high percentage set for upper secondary VET.
The labour force participation rate (proportions of employed and unemployed people as percentages of the population aged 15–64) has been determined on the basis of statistics on labour force participation rates in the 25–49 age group. The target set for the labour force participation rate is at least 85% for all levels and subfi elds. The labour force participation rates derived from subfi eld-spe-cifi c targets are 90.4% for upper secondary VET, 94.2% for polytechnic educa-tion and 93.9% for university education. The rates vary between 85% and 100% by subfi eld and level of education.
When examined by level of education, the effi ciency and effectiveness coeffi -cients increase the proportion of upper secondary VET in the total educational needs, in particular, while reducing the relative share of university education. The effi ciency and effectiveness coeffi cients increase the educational needs of the world of work for upper secondary VET by 41%. In other words, the number of entrants required for upper secondary VET is considerably higher than the number of relevant job openings, because a signifi cant proportion of students starting upper secondary vocational studies will later continue their studies either at the same or a higher level of education. Some students will also interrupt their studies. In university education, the corresponding effect

53
is only 27%. From the perspective of fi elds of education, the effi ciency and effectiveness coeffi cients have the highest relative effect on intake needs based on the need for labour with qualifi cations in Tourism, Catering and Domestic Services (Figure 18). This relative structure of intake needs in education and training based on labour needs forms the basis for determining the intake needs adjusted to the forecast size of the young age group by level and fi eld of education.
0 100 000 200 000 300 000 400 000 500 000 600 000
Other education
Natural Resources and the Environment
Culture
Natural Sciences
Humanities and Education
Tourism, Catering and Domestic Services
Social Sciences, Business and Administration
Social Services, Health and Sports
Technology, Communications and Transport
Educational needs of the world of work Total need for new labour
Figure 18. Total need for new labour and educational needs of the world of work by field of education according to the target development scenario.

54
6 Intake needs by fi eld and level of education
6.1 Intake needs adjusted to the size of the young age group
Anticipation of educational needs is based on the total need for labour. This is why anticipation also takes the supply of labour into account in addition to factors of demand for labour (anticipated change in the number of employed people, making up for natural wastage from the labour force). Alongside the labour force made available by training young people, unemployed people form an important source of labour.
The total intake required to satisfy demand for labour is obtained by taking account of the effi ciency and effectiveness coeffi cients in anticipation. The majority of the necessary labour force can be obtained from young qualifi cation-holders with the rest coming from outside the labour force and by extending employed people’s careers. The target development scenario anticipates that more labour will be required from sources other than training young people when compared with the basic scenario.
In order to anticipate the intake needs in education and training intended for young people, the intake needs based on the total need for new labour are adjusted to the size of the young age group on the principle that all young people fi nishing basic education or general upper secondary education will be provided with an opportunity to continue studies in vocationally/profession-ally oriented education and training. In anticipation estimates, the size of the age group to be trained is based on the number of young people obtained by taking the average size of 16–21 age groups for 2010–2025 in the 2009 popula-tion forecast produced by Statistics Finland and by then calculating the annual average from this fi gure. The resulting number of people to train is an average of 61,800 young people per year. The coeffi cients describing the effi ciency of the education system, defi ned by subfi eld and level of education, and the target values set for them allow calculation of the number of entrants required to train all young people (for completion of a qualifi cation). The required intake is 95,800 entrants, which means that 1.55 places are needed for every person to train. The same total number of student places has been applied to calculations in both basic and target scenarios.
There are considerable differences in the anticipated intake needs between the basic and the target scenario (Table 1). When examined by level of education,

55
intake needs projected in the basic scenario for upper secondary VET and university education are about 2,400 entrants higher and 2,200 entrants lower, respectively, when compared with the target scenario. Polytechnic intake needs are almost the same in both scenarios, amounting to about 3,000 entrants less than in 2009.
Table 1. Entrants and anticipated intake needs by level of education.
Level of educationEntrants in
2006–2009, average
Entrants in 2009
Basic scenario Target scenario
Antic
ipat
ed
inta
ke n
eeds
Diffe
renc
e fro
m 20
09
Diffe
renc
e, %
Antic
ipat
ed
inta
ke n
eeds
Diffe
renc
e fro
m 20
09
Diffe
renc
e, %
Upper secondary VET 48,901 50,553 54,220 3,667 7 51,840 1,287 3
Polytechnic degree 26,621 28,041 24,790 -3,251 -12 25,020 -3,021 -11
University degree 19,902 20,169 15,060 -5,109 -25 17,260 -2,909 -14
Other education or no qualification 1) 0 0 1,710 1,710 1,650 1,650
Total 95,424 98,763 95,780 -2,983 -3 95,780 -2,983 -3
1) Calculation results include those people whose jobs do not require qualification-oriented education and training.
In the basic scenario, the result is based on industry forecasts, which suggest that the manufacturing industry and industrial services will face a distinct decrease in the number of jobs, whereas the number of jobs will show clear growth in services and human health and social work activities. In addition, the occupational structure forecasts for different industries have been prepared mainly to represent a continuum of historical developments into the future, which is why changes in the industrial structure have a major bearing on intake needs. This places more emphasis on intake needs in upper secondary VET than for university education.
One of the key objectives in the target scenario, in turn, is for employment in the manufacturing industry to take a new upward turn after the reces-sion. Regardless, the target scenario anticipates decreases in the number of employed people from current levels in all manufacturing industries by the end of the forecasting period, with the exception of some small growth in mining and quarrying. Other characteristics of the target scenario include the favour-able employment trend in industries providing services for the manufacturing industry, increasing resources and employment in education and innovation

56
activities as well as growing employment in private services. The number of jobs in primary production will see a distinct decline, while human health and social work activities will manage with a clearly smaller amount of labour than projected in the basic scenario due to productivity targets. In the target scenario, the growth in employment in business activities and education and research and the occupational structure forecasts emphasising competence in all industries lead to an end result that places more emphasis on higher educa-tion – and, fi rst and foremost, university education – and less on upper second-ary VET than the basic scenario.
Employment priorities in different industries described above and related dif-ferences in occupational structures can also be seen in the analysis by subfi eld (Table 2). In the target scenario, the manufacturing industry and related serv-ices account for a larger relative proportion of employment while the propor-tion of natural resources is smaller when compared with the basic scenario, which is why intake needs in Technology, Communications and Transport, Natural Sciences and Culture are clearly higher than in the basic scenario. Cor-respondingly, intake needs in Social Services, Health and Sport, Social Sciences, Business and Administration, Tourism, Catering and Domestic Services, and Natural Resources and the Environment are smaller than in the basic scenario.
Table 2. Entrants and anticipated intake needs by field of education.
Field of education
Entrants in 2006–
2009, average
Entrants in 2009
Basic scenario Target scenario
Antic
ipat
ed
inta
ke n
eeds
Diffe
renc
e fro
m 2
009
Diffe
renc
e, %
Antic
ipat
ed
inta
ke n
eeds
Diffe
renc
e fro
m 2
009
Diffe
renc
e, %
1 Humanities and Education 5,770 5,774 5,160 -614 -11 5,410 -364 -62 Culture 7,642 7,707 3,110 -4,597 -60 3,760 -3,947 -513 Social Sciences, Business and Administration
15,342 16,059 16,390 331 2 15,250 -809 -5
4 Natural Sciences 6,507 6,353 3,280 -3,073 -48 4,180 -2,173 -345 Technology, Communications and Transport
32,019 32,997 26,440 -6,557 -20 31,340 -1,657 -5
6 Natural Resources and the Environment
3,916 4,056 4,900 844 21 3,910 -146 -4
7 Social Services, Health and Sport
15,665 17,073 22,790 5,717 33 19,180 2,107 12
8 Tourism, Catering and Domestic Services
8,090 8,361 11,050 2,689 32 10,400 2,039 24
9 Other education 1) 475 383 2,660 2,277 2,360 1,977 516Total 95,424 98,763 95,780 -2,983 -3 95,780 -2,983 -3
1) Statistical data on entrants does not include all entrants; statistics on education falling outside the educational administration sector are missing.
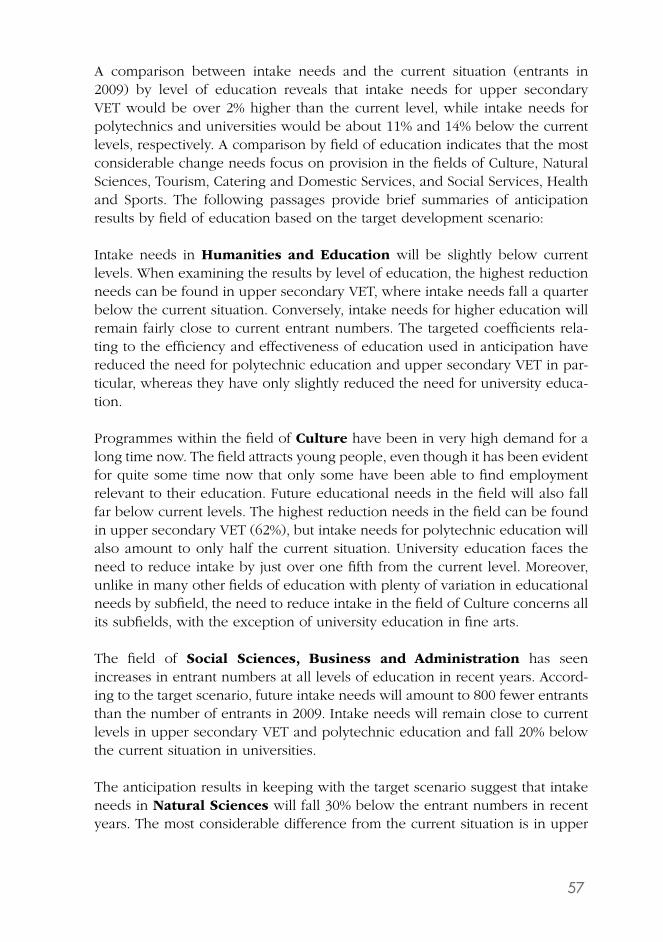
57
A comparison between intake needs and the current situation (entrants in 2009) by level of education reveals that intake needs for upper secondary VET would be over 2% higher than the current level, while intake needs for polytechnics and universities would be about 11% and 14% below the current levels, respectively. A comparison by fi eld of education indicates that the most considerable change needs focus on provision in the fi elds of Culture, Natural Sciences, Tourism, Catering and Domestic Services, and Social Services, Health and Sports. The following passages provide brief summaries of anticipation results by fi eld of education based on the target development scenario:
Intake needs in Humanities and Education will be slightly below current levels. When examining the results by level of education, the highest reduction needs can be found in upper secondary VET, where intake needs fall a quarter below the current situation. Conversely, intake needs for higher education will remain fairly close to current entrant numbers. The targeted coeffi cients rela-ting to the effi ciency and effectiveness of education used in anticipation have reduced the need for polytechnic education and upper secondary VET in par-ticular, whereas they have only slightly reduced the need for university educa-tion.
Programmes within the fi eld of Culture have been in very high demand for a long time now. The fi eld attracts young people, even though it has been evident for quite some time now that only some have been able to fi nd employment relevant to their education. Future educational needs in the fi eld will also fall far below current levels. The highest reduction needs in the fi eld can be found in upper secondary VET (62%), but intake needs for polytechnic education will also amount to only half the current situation. University education faces the need to reduce intake by just over one fi fth from the current level. Moreover, unlike in many other fi elds of education with plenty of variation in educational needs by subfi eld, the need to reduce intake in the fi eld of Culture concerns all its subfi elds, with the exception of university education in fi ne arts.
The fi eld of Social Sciences, Business and Administration has seen increases in entrant numbers at all levels of education in recent years. Accord-ing to the target scenario, future intake needs will amount to 800 fewer entrants than the number of entrants in 2009. Intake needs will remain close to current levels in upper secondary VET and polytechnic education and fall 20% below the current situation in universities.
The anticipation results in keeping with the target scenario suggest that intake needs in Natural Sciences will fall 30% below the entrant numbers in recent years. The most considerable difference from the current situation is in upper

58
secondary VET, where intake needs only equate to a third of the 2009 entrant numbers. Conversely, intake needs for polytechnics will exceed the current level. As upper secondary VET and polytechnic education in this fi eld are only provided in the subfi eld of Computing and Software, the results mean that intake needs in this subfi eld will shift from upper secondary VET to polytech-nic education. Intake needs for university education equate to 60% of entrant numbers in recent years.
Anticipated total intake needs in the fi eld of Technology, Communications and Transport will remain relatively close to the average number of entrants in 2006–2009. Conversely, a comparison with the most recent reference year (2009) reveals that intake needs will fall about 1,650 entrants below current levels. Polytechnic education is anticipated to face the need to reduce intake by one fi fth (1,600), while university intake needs fall 650 entrants below the current situation. Intake needs in upper secondary VET will be about 800 entrants higher, equating to about a 4% increase from the current level. Within the fi eld, there are quite considerable differences in intake needs between sub-fi elds. In particular, the anticipation results point to a need to increase intake numbers in upper secondary VET in the subfi elds of Automotive and Transport Engineering and Mechanical, Metal and Energy Engineering.
Entrant numbers in Natural Resources and the Environment have remained unchanged over the last few years. Not all subfi elds have attracted enough applicants. According to the target scenario, future intake needs will be slightly below the entrant numbers in recent years. Intake needs will correspond to current levels in upper secondary VET and polytechnic education but fall clearly below the current situation in universities.
Intake needs in Social Services, Health and Sports will be considerably higher than the current situation. Even though the fi eld’s entrant numbers have been increasing constantly over the last ten years, more entrants will be required especially in upper secondary VET, but also in university education. Polytechnic intake needs in this fi eld will correspond to the current number of entrants. Educational needs in Social Services, Health and Sports are funda-mentally infl uenced by the considerable increase anticipated in the number of employed people within human health and social work activities.
The estimate for intake needs in Tourism, Catering and Domestic Services indicates that the fi eld faces the need to increase intake by about a quarter from the current situation. The considerable increase in intake needs within Cleaning Services has a bearing on the entire fi eld’s total result. This subfi eld is not popular among young people, which is why the current number of entrants is very small. In addition, the high rate of natural wastage will also

59
increase the need for skilled labour. The results for intake needs in other subfi elds are fundamentally infl uenced by the fact that people working in the relevant occupations are young, which means that natural wastage falls below the average level and new jobs are not opening up at the same rate as in other occupational groups. When analysed by level of education, the results indicate that there are signifi cant needs to increase intake in both upper secondary VET and university education, whereas polytechnic education faces a considerable need to reduce intake. Similar to other fi elds of education, there are consider-able differences within Tourism, Catering and Domestic Services in the results for educational needs by subfi eld.
Other education falling outside the educational administration sector includes programmes in the Military and Border Guard, Fire and Rescue Services, Police Services and Correctional Services subfi elds. Furthermore, it includes a small number of programmes not leading to qualifi cations in fi elds where vocational competence can be achieved through more short-term pro-grammes than upper secondary vocational qualifi cations.
As mentioned earlier in this report, it is not expedient to transfer anticipa-tion results as such to decision-making concerning provision of education and training. In addition to anticipation results, national objectives of raising the population’s level of education and other education policy objectives have a bearing on the amount and structure of provision. Moreover, the following con-ditions must be taken into account when making use of the anticipation results:
Statistics on entrants include entrants of all ages, whereas the anticipation results adjusted to the age group forecast only cover education and training intended for young people. This has a bearing on university education, in particular, where entrants include plenty of students of different ages.
Entrant statistics do not give a correct idea of the number of entrants in uni-versity education in all respects, because some of those who have changed subfi elds within universities are not shown in the statistics. The real number of entrants exceeds statistical data in some fi elds.
The link between current entrant numbers and the needs of the world of work is not clear. In addition to the steering system of education, entrant numbers have been infl uenced over a long period of time by factors such as demand for education and training and possibly objectives relating to provi-sion of education and training and use of resources.
In small subfi elds in particular, comparison of results with a single refer-ence year may overstate the difference between the current situation and the calculated intake needs if the number of entrants varies annually. This is why it is also advisable to compare the results with average data covering several years.

60
6.2 Targets for provision by 2016The Government decided on the targets for provision of education and train-ing as part of the Development Plan for Education and Research for 2011–2016 in December 2011 (Opetus- ja kulttuuriministeriö [Ministry of Education and Culture] 2011a). The targets were prepared by a working committee and com-ments were submitted by an expert group of social partners. The preparatory committee’s proposal was a working document also drawing on other sources of information alongside anticipation results. The targets follow the trends out-lined in the anticipation results but have been adjusted to some extent, because of:
the desire to keep changes from the 2009 levels realistic and achievable; the aim to ensure prerequisites for high-quality education; the vision of a national economy based on solid competence, Finland’s aims
for the EU 2020 strategy and other aims relating to the level of education.
In the present decade, the targeting of educational provision will probably gain even more importance because the rate of exit from the labour force will clearly exceed the rate of entry. The annual size of the age groups entering the labour market will be 6,300 people smaller on average than the predicted labour needs. In some fi elds at least, the oversupply will probably turn into a labour shortage. The challenge will be to promote a balanced development of employment in industrial production and wellness services, among others. The targeting of provision must simultaneously promote both competitiveness and equitable availability of wellness services.
According to the Development Plan, the largest pressures for decreases in provision exist in Culture and in Tourism, Catering and Domestic Services. The need for education in Culture is 3,000 entrants smaller than current intakes (Table 3). At subfi eld level, the biggest single reduction needs are in upper secondary VET in Craft and Design and in upper secondary VET and poly-technic education in Information and Communication. The need for entrants in Tourism, Catering and Domestic Services is 1,300 smaller than the current intakes; the cuts will mostly be made in upper secondary VET and polytechnic education in Tourism and in upper secondary VET in Hotel and Catering. The largest needs for increases exist in upper secondary VET in Automotive and Transport Engineering and in Health Care and Social Services. With regard to levels of education, the overall volume of university education will remain unchanged. In terms of fi eld of education, the need for increases exists espe-cially in teacher education. The fi eld-specifi c increases will be made through retargeting existing provision. Conversely, the intakes in polytechnics will be

61
reduced by 2,200 entrants in 2013. The cuts will primarily be made in the fi elds of Culture, Tourism, Catering and Domestic Services, and Technology, Commu-nications and Transport. Conversely, a small increase is needed in Health Care and Social Services.
Table 3. Provision targets for 2016 in the Development Plan for Education and Research and anticipated intake needs by field of education.
Field of educationEntrants in
2009
Anticipated intake needsDevelop-
ment Plan’s intake
target in 2016
Basic scenario
Target scenario
1 Humanities and Education 5,774 5,160 5,410 5,830
2 Culture 7,707 3,110 3,760 4,750
3 Social Sciences, Business and Administration
16,059 16,390 15,250 15,960
4 Natural Sciences 6,353 3,280 4,180 5,310
5 Technology, Communications and Transport
32,997 26,440 31,340 32,190
6 Natural Resources and the Environment 4,056 4,900 3,910 3,770
7 Social Services, Health and Sport 17,073 22,800 19,180 18,590
8 Tourism, Catering and Domestic Services 8,361 11,050 10,400 7,310
As previously indicated in this report, it is not expedient for the targets of the Ministry of Education and Culture to be directly aligned with the anticipation results (Appendix 7). However, the starting point for utilisation of the results has been pursuit of a desirable future in line with the target scenario. The trends shown in the target scenario have especially been taken into account in intake targets for Natural Resources and the Environment and Social Services, Health and Sports. The only fi eld where the targets are closer to the anticipa-tion results of the basic scenario rather than the target scenario is Social Sci-ences, Business and Administration. Conversely, the intake targets for Culture and Tourism, Catering and Domestic Services differ signifi cantly from the antici pation results in line with the basic and target scenarios. Furthermore, the level-specifi c intake targets set by the Ministry of Education and Culture for uni-versity education are clearly higher than indicated by the anticipation results, because the targets of the Development Plan include student places intended for both young people and adults.

62
7 Development needs in anticipation of educational and skills needs
The declining supply of labour in Finland over the current decade will bring about signifi cant socio-political challenges. The most recent estimates for demand for labour and intake needs through to 2025 indicate that the supply of labour by young people will not be enough to satisfy the needs of the Finnish world of work even if the economy and employment were to grow according to the basic scenario, i.e. in keeping with historical trends. The labour force supplied by young age groups will not necessarily even be suffi cient to make up for the demand for labour due to natural wastage at the end of the forecast-ing period.
In order for economic and employment developments projected in the target scenario to become reality, it is necessary to introduce even more means to increase supply. These include increasing employment opportunities for unem-ployed people, bringing the economically inactive population available to the labour market and improving the standing of immigrants on the labour market. From the perspective of the education sector, these objectives increase the sig-nifi cance of and expectations set for adult education and training.
The emergence of new occupations and the rapid changes in the world of work also bring about new methodological development challenges. Foresight and anticipation of education and training have been developed vigorously in recent years and the results are utilised in targeting provision and developing educational contents. Quantitative anticipation has been part of the educational administration’s basic work for a long time now. Qualitative foresight of educa-tional contents has been developed as part of the process of preparing Quali-fi cation Requirements and programmes of study and in various projects with support from the European Social Fund. Although different forms of foresight and anticipation have been developed in parallel, they do not as yet support each other suffi ciently. The challenge is, therefore, to co-ordinate qualitative foresight and quantitative anticipation more effectively. The aim is for differ-ent perspectives of educational foresight and anticipation to complement each other. Establishing a closer connection between qualitative foresight and quan-titative anticipation is also required by the objective of increasing the fl exibility of the vocational qualifi cations system set by the Ministry of Education and Culture in its Development Plan for Education and Research for 2011–2016.

63
Medium- and long-term anticipation of adult education and training needs can also be seen as a further development challenge for anticipation. Anticipation should be used to form an overview of the types and amounts of provision that will be required in the future in adult education and training and the sectors in which it should be provided. There is no single method to cover the entire adult education and training sector available for this purpose (Opetus- ja kult-tuuriministeriö [Ministry of Education and Culture] 2011c). In the near future, it is therefore necessary to develop a more long-term anticipation model for adult provision, which would make it possible to anticipate changes in the operating environments of the worlds of education and work and assess their effects on the adult population’s lifelong skills and educational needs.
The increasingly global labour market calls for closer international co-operation to develop models for anticipation of educational and skills needs, but equally to communicate anticipation data on skills needs, especially between the Euro-pean Union and its Member States. The European Centre for the Development of Vocational Training (CEDEFOP), in particular, has done pioneering work to develop EU-level co-operation in foresight and anticipation, in which Finland has been actively involved alongside other Member States. In the future, it will also be increasingly important to make use of these international anticipation processes in order to develop national anticipation efforts.
By way of example, CEDEFOP’s online forecast data service (CEDEFOP 2012) presents the results of labour force and skills forecasts produced by experts from different EU countries on the EU 27, including Finland (Figure 19). As the CEDEFOP report’s forecasting period ran from 2010 to 2020, it is not pos-sible to make direct comparisons with the anticipation results produced by the Finnish National Board of Education for the 2008–2025 period. Furthermore, the differences between the classifi cations of industries, occupations and edu-cation used in the two projects complicate direct comparisons. In terms of the economic structure, the developments forecast by CEDEFOP for Finland are in line with those envisaged by the Government Institute for Economic Research (VATT), with the number of employed people declining in primary production, on the one hand, and growing in construction, on the other. This would also seem to be a broader trend throughout Europe. Conversely, CEDEFOP fore-casts that the number of employed people in the manufacturing industry will increase slightly in Finland between 2010 and 2020, whereas VATT’s forecast, used in this publication, suggests that the number will decline signifi cantly over the same period. Comparing and analysing the differences and similarities between anticipation results based on different hypotheses, such as those men-tioned above, will also allow utilisation of international alternative scenarios

64
in the future as background information for steering education and training provision at a national level.
-15
-10
-5
0
5
10
15
Primary sector & utilities
Manufacturing Construction Distribution & transport
Business & other services
Non-marketed services
All industries
% Finland EU 27
Figure 19. Changes in the number of employed people in Finland and the EU 27 in 2010–2020 (CEDE-FOP 2012).
Alongside quantitative educational needs, anticipation of skills needs also offers plenty of opportunities for international co-operation. By way of example, the Commission has put forward an initiative to establish EU-wide sector councils as part of implementation of the Europe 2020 strategy. The councils would be responsible for collecting and exchanging sector-specifi c information about skills needs forecasts produced by Member States and to produce summaries of these.
A challenge for the near future is to take an increasingly versatile part in inter-national anticipation processes of educational and skills needs such as those described above, which also offer signifi cant support for compiling national anticipation data needs and for drawing conclusions concerning development of education from these.

65
Further information
Further information is available on the Internet at:www.oph.fi
Contacts at the Finnish National Board of Education:
Mr. Ilpo Hanhijoki, Counsellor of Education Tel. +358 2953 31057E-mail: [email protected]
Mr. Samuli Leveälahti, Counsellor of Education Tel. + 358 2953 31302E-mail: [email protected]
Ms. Hannele Savioja, Counsellor of Education Tel. + 358 2953 31000E-mail: [email protected]
Address:Finnish National Board of EducationP.O. Box 380FI-00531 HelsinkiFINLANDTel. +358 2953 31000Fax +358 2953 31035

66
Sourc es
Asetus koulutuksen ja yliopistoissa harjoitettavan tutkimuksen kehittämissuunnitelmasta (987/1998) [Decree on the Development Plan for Education and University Research (987/1998). In Finnish.]
CEDEFOP (2012). Skills forecasts - Cedefop’s on-line tool http://www.cedefop.europa.eu/EN/about-cedefop/projects/forecasting-skill-demand-and-supply/skills-forecasts.aspx
Eläketurvakeskus (2009). Lakisääteiset Eläkkeet. Pitkän aikavälin laskelmat 2009.Eläketurvakeskuksen raportteja 2009:4. Helsinki 2009.
[Finnish Centre for Pensions (2009). Statutory Pensions in Finland. Long-term projections 2009. Finnish Centre for Pensions, Reports 2009:4. Helsinki 2009. English translation available.]
Eläketurvakeskus (2010). Eläkkeellesiirtymisikä työeläkejärjestelmässä 2009. Eläketurvakeskuksen tilastoraportteja 5. Helsinki 2010.
[Finnish Centre for Pensions (2010). Effective retirement age in the Finnish earnings-related pension scheme 2009. Finnish Centre for Pensions, Statistical Reports 2010:5. Helsinki 2010. English translation available.]
Euroopan parlamentin ja neuvoston asetus (EY) N:o 1893/2006. [Regulation (EC) No. 1893/2006 of the European Parliament and of the Council. English version available.]
Opetushallitus (2011). Koulutus ja työvoiman kysyntä 2025 – Ennakointituloksia tulevaisuuden työpaikoista ja koulutustarpeista.
http://www.oph.fi /download/138322_Koulutus_ja_tyovoiman_kysynta_2025_Ennakointituloksia_tulevaisuuden_tyopaikoista_ja_koulutustarpeista.pdf
[Finnish National Board of Education (2011). Education, training and demand for labour by 2025. Anticipation results on future jobs end education needs. English summary available.]
Opetushallitus (2012a). YRKE 2025.http://www.oph.fi /utvardering_och_statistik/prognostisering/kvantitativ_prognostisering[Finnish National Board of Education (2012a). Occupation 2025. In Swedish.]
Opetushallitus (2012b). Valtakunnallinen ammatillisten osaamistarpeiden ennakointi (VOSE) ESR–projekti.http://www.oph.fi /tietopalvelut/ennakointi/osaamistarpeiden_ennakointi/vose-projekti[Finnish National Board of Education (2012b). The National Project on Anticipation of Competences and Skills Needs (VOSE). Information available in English at: http://www.oph.fi /english/sources_of_information/projects/vose.]

67
Opetus- ja kulttuuriministeriö (2008) Selvitys koulutus- ja osaamistarpeiden kehittymisestä sekä ennakoinnin tilasta ja kehittämistarpeista. Opetusministeriön työryhmämuistioita ja selvityksiä 2007:17. [Ministry of Education and Culture (2008). Report on development of educational and skills needs and the status and development needs of foresight and anticipation. Reports of the Ministry of Education and Culture 2007:17. In Finnish.]
Opetus- ja kulttuuriministeriö (2011a). Koulutuksen ja tutkimuksen kehittämissuunnitelma 2011–2016http://www.minedu.fi /OPM/Koulutus/koulutuspolitiikka/asiakirjat/Kesu_2011_2016_fi .pdf[Ministry of Education and Culture (2011a). Education and Research 2011–2016. A development plan. English translation available at: http://www.minedu.fi /OPM/Julkaisut/2012/Kehittamissuunnitelma.html?lang=en.]
Opetus- ja kulttuuriministeriö (2011b). Selvitys koulutus- ja osaamistarpeiden kehittymisestä sekä ennakoinnin tilasta ja kehittämistarpeista 2010. Opetus- ja kulttuuriministeriön työryhmämuistioita ja selvityksiä 2011:11. [Ministry of Education and Culture (2011b). Report on development of educational and skills needs and the status and development needs of foresight and anticipation 2010. Reports of the Ministry of Education and Culture 2011:11. In Finnish.]
Opetus- ja kulttuuriministeriö (2012a). Ennakointihttp://www.minedu.fi /OPM/Koulutus/koulutuspolitiikka/ennakointi/?lang=fi [Ministry of Education and Culture (2012a). Anticipation. In Finnish.]
Opetus- ja kulttuuriministeriö (2012b). Ammatillinen koulutus http://www.minedu.fi /OPM/Koulutus/ammatillinen_koulutus/?lang=fi [Ministry of Education and Culture (2012b). Vocational education and training in Finland. Available in English at: http://www.minedu.fi /OPM/Koulutus/ammatillinen_koulutus/?lang=en.]
Opetus- ja kulttuuriministeriö (2012c). Ammattikorkeakoulutus http://www.minedu.fi /OPM/Koulutus/ammattikorkeakoulutus/?lang=fi [Ministry of Education and Culture (2012c). Polytechnic education in Finland. Available in English at: http://www.minedu.fi /OPM/Koulutus/ammattikorkeakoulutus/?lang=en.]
Opetus- ja kulttuuriministeriö (2012d). Yliopistokoulutus http://www.minedu.fi /OPM/Koulutus/yliopistokoulutus/?lang=fi [Ministry of Education and Culture (2012d). University Education in Finland. Available in English at: http://www.minedu.fi /OPM/Koulutus/yliopistokoulutus/?lang=en.]
Tilastokeskus (2009). Työssäkäyntitilasto. [Statistics Finland (2009). Employment Statistics. Data available in English.]
Tilastokeskus (2012a). Väestön koulutusrakenne. http://www.stat.fi /til/vkour/tau.html[Statistics Finland (2012a). Educational structure of population. Data available in English.]
Tilastokeskus (2012b). Tilastokeskuksen työvoimatutkimus vuonna 2011.http://www.stat.fi /til/tyti/2011/13/tyti_2011_13_2012-03-09_kat_001_fi .html[Statistics Finland (2012b). Labour force survey 2011. Data available in English.]

68
Työ- ja elinkeinoministeriö (2012). Työ- ja elinkeinoministeriön lyhyen aikavälin työmarkkinaennuste. Kevät 2012. http://www.tem.fi /fi les/32845/Ennuste_Kevat_2012.pdf[Ministry of Employment and the Economy (2012). Short-term labour market forecast by the Ministry of Employment and the Economy. Spring 2012. In Finnish.]
University of Warwick (2006). Working futures 2004–2014. Technical report.http://www2.warwick.ac.uk/fac/soc/ier/research/wf/
Valtion taloudellinen tutkimuskeskus [Government Institute for Economic Research] (2008). VATTAGE – a dynamic, applied general equilibrium model of the Finnish economy. http://www.vatt.fi /fi le/vatt_publication_pdf/t150.pdf
Valtion taloudellinen tutkimuskeskus (2010a). Työvoiman tarve Suomen taloudessa vuosina 2010–2025.
Honkatukia J, Ahokas J ja Marttila K. VATT-tutkimukset 154. Helsinki. [Government Institute for Economic Research (2010a). Demand for labour in the Finnish economy in 2010–2025. VATT Research Reports No. 154. Helsinki. In Finnish.]
Valtion taloudellinen tutkimuskeskus (2010b). Politiikkatoimien vaikutukset työvoiman tarpeeseen Suomen taloudessa 2010–2025. Ahokas J ja Honkatukia J. VATT-tutkimukset 161. Helsinki. [Government Institute for Economic Research (2010b). Effects of policy measures on demand for labour in the Finnish economy in 2010–2025. VATT Research Reports No. 161. Helsinki. In Finnish.]
Valtioneuvoston asetus koulutustoimikuntajärjestelmästä (882/2010). [Government Decree on the System of National Education and Training Committees (882/2010). In Finnish.]

69
Appendix 1. Concepts
Alternative scenarios for developments in the occupational structureIn national anticipation work, the basic development scenario for the occupa-tional structure is based on the equivalent basic scenario for industry develop-ments. The basic scenario estimates that changes in the occupational structure will take place in a relatively stable manner, following prior developments in different industries. The target development scenario for the occupational structure is based on the industry forecast in line with the equivalent target scenario. The starting point is that new jobs will be created for tasks requiring specialist competence in completely new industries and in traditional indus-tries by increasing business productivity within industries. In the occupational structure forecasts, increases in the numbers of employed people have been placed in key occupational groups requiring high-level and specialist compe-tence in each specifi c industry.
In regional anticipation work, occupational structure forecasts are based on industry developments in line with the basic and the target scenario prepared for each region, which include regional emphases. Regional industry forecasts are reconciled with national forecasts. They are based on regional development objectives.
Alternative scenarios for industry developmentsThe basic and target scenarios are based on industry forecasts produced by the Government Institute for Economic Research (Valtion taloudellinen tut-kimuskeskus 2010a & 2010b). The basic scenario largely describes economic development according to established trends. The target scenario is based on achievement of full employment in the long term.
Classifi cation of occupationsThe classifi cation of occupations is a tool for compiling statistics on the popu-lation’s occupational structure and it can also be used as a means for classify-ing the population by socio-economic group (Statistics Finland). The Finnish National Board of Education has prepared a classifi cation of occupations, con-sisting of 11 major occupational groups and 59 occupational groups, on the basis of Statistics Finland’s classifi cation from 2001 (Handbooks No. 14).
Completion rateThe completion rate of education and training refers to the proportion of those completing a qualifi cation as a percentage of entrants, i.e. completion of a

70
qualifi cation in the subfi eld where the student started studies or completion of a qualifi cation in some other subfi eld. The statistical indicator used for this purpose is the proportion of those who have completed a qualifi cation as a percentage of total exit rate, i.e. the sum of those who have completed a quali-fi cation and those who have dropped out. In the anticipation exercise, target fi gures have been set for completion rates by subfi eld and level of education.
Correspondence keyDescribes the competencies anticipated to be required in each occupational group in terms of percentage shares of subfi elds and levels of education.
Educational needs of the world of workEducational needs of the world of work refer to the amount of new labour that the world of work is anticipated to require during the forecasting period, presented by subfi eld and level of education. The needs have been estimated taking account of the number of job openings (change in the number of employed people and natural wastage), unemployment and the effi ciency and effectiveness coeffi cients of education.
Effi ciency and effectiveness coeffi cients of educationThe target fi gures used in calculation of intake needs, describing completion rates of education, multiple education (effi ciency) and further study tracks (effectiveness), as well as the labour force participation rates of qualifi cation-holders.
EntrantsEntrants refer to the number of students starting their education during the year in question. In university education, entrants refer to new students enrolled as being present. Entrants on Master’s programmes are not included in the entrant data used in this report.
Field of education Statistics Finland and the Ministry of Education and Culture have prepared a classifi cation and a code key which allow statistical data to be classifi ed accord-ing to the classifi cation of fi elds, subfi elds and levels of education used by the educational administration.
Intake needsIntake needs are obtained by anticipating the total number of entrants in voca-tionally/professionally oriented education and training. The aim is to provide such education for the entire age group. Anticipation is based on the size of the young age group fi nishing basic education and general upper secondary edu-

71
cation and on the objectives set for the performance of the education system. Intake needs are distributed over different subfi elds and levels of education on the basis of the anticipated educational needs of the world of work.
Job openingsThe sum of the change in the number of employed people and natural wastage during the forecasting period (2008–2025).
Labour force methodA method used to anticipate quantitative changes in demand for labour. The labour force method has been used in Finland to anticipate changes in the occupational structures of the labour force and educational needs based on the labour needs of the world of work. The method starts with industry fore-casts and then anticipates occupational structures for these. The result obtained reveals changes in demand for labour by occupational group over a certain period of time. When this is added to the anticipated natural wastage from the labour force, the result is the demand for new labour (= job openings) in the occupational group in question. This, in turn, can then be converted into educational needs using the correspondence key between occupations and education. Labour force participation rateIn this anticipation report, the labour force participation rate refers to the tar-geted subfi eld-specifi c indicator, which is the share of qualifi cation-holders in a specifi c subfi eld who are in the labour force as a percentage of all quali-fi cation-holders in the subfi eld. The target fi gure describes the proportion of qualifi cation-holders that will be available on the labour market in the future.
Level of educationThe levels of education used in this report are upper secondary vocational education and training (VET), polytechnic education and university education. University education includes university Bachelor’s and Master’s degrees and postgraduate licentiate and doctoral degrees.
Major occupational groupThe major occupational groups (11 in total) are made up of 59 occupational groups.
Mitenna calculation modelThe calculation model developed by the Finnish National Board of Education for the purposes of anticipating long-term labour and educational needs. An ESF project entitled Anticipation of quantitative needs for vocational/profes-

72
sional education and training was implemented in 1996–1999 and ‘Mitenna’ was the abbreviation used for the name of this project. The model has been described in a publication about the project (Opetushallitus [Finnish National Board of Education] 1999. Ammatillinen koulutus 2010 [Vocational education and training 2010].).
Multiple education/further study tracksMultiple education means that an individual has completed one or more other qualifi cations after his or her fi rst qualifi cation-oriented vocational programme. Multiple education is expressed in terms of the targeted percentage share of those qualifi cation-holders who go on to complete another qualifi cation either at the same level but in a different subfi eld or at another level either in the same or in a different subfi eld.
Natural wastageNatural wastage refers to the population retiring from the labour force perma-nently over a certain period of time. Natural wastage covers retirement due to old age and disability as well as mortality. Natural wastage has been estimated separately from the amount of labour in each occupational group in the base year.
OccupationAn occupation refers to the work the person performs irrespective of his/her education, professional status or economic activity (Statistics Finland. Classifi -cation of Occupations 2001. Handbooks No. 14. Helsinki 2001.).
Occupational groupThe occupational grouping (a total of 59 groups) used in the Mitenna calcula-tion model, which is based on Statistics Finland’s 2001 classifi cation of occupa-tions.
Occupational structureThe quantitative or percentage distribution of the employed labour force according to the occupational groups in each of the 27 industries in the year in question. The occupational structure also refers to the corresponding sum total of all industries.
Occupational transitionOccupational transitions refer to career changes over a certain period of time, where individuals have moved from one occupational group to another. This covers the fl ows of employees entering and exiting an occupational group. The difference between these fl ows reveals whether the occupational group is gaining or losing labour.

73
Standard Industrial Classifi cationThe Standard Industrial Classifi cation is used to group similar activities into classes. These classes are called industries. The Standard Industrial Classifi ca-tion is a system for grouping enterprises and equivalent units or establishments engaged in an economic activity (Statistics Finland). This survey has used the industrial classifi cation prepared by the Finnish National Board of Education on the basis of Statistics Finland’s 2002 Standard Industrial Classifi cation.
Subfi eld of educationStatistics Finland and the Ministry of Education and Culture have prepared a classifi cation and a code key which allow statistical data to be classifi ed accord-ing to the classifi cation of fi elds, subfi elds and levels of education used by the educational administration.
Vocationally/professionally oriented education and trainingCovers upper secondary vocational education and training (VET), polytechnic education and university Bachelor’s and Master’s degrees. This report focuses on vocationally/professionally oriented education and training intended for young people.
Young age group The average age group of those aged 16–21. This forecast has used the average one-year age group for 2010–2025 to adjust intake needs to the size of the young age group.
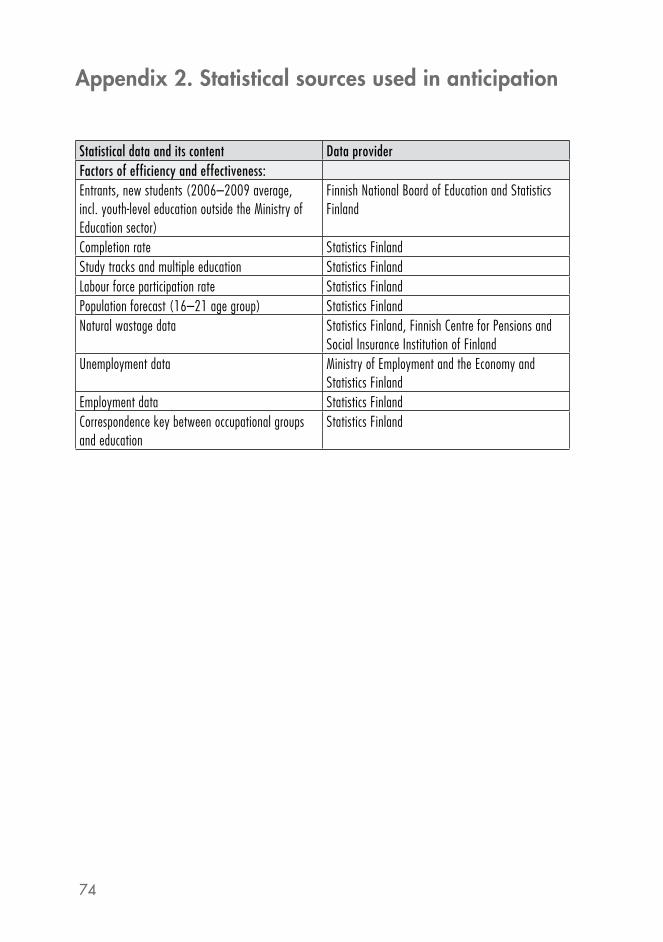
74
Appendix 2. Statistical sources used in anticipation
Statistical data and its content Data providerFactors of efficiency and effectiveness:Entrants, new students (2006–2009 average, incl. youth-level education outside the Ministry of Education sector)
Finnish National Board of Education and Statistics Finland
Completion rate Statistics FinlandStudy tracks and multiple education Statistics FinlandLabour force participation rate Statistics Finland Population forecast (16–21 age group) Statistics FinlandNatural wastage data Statistics Finland, Finnish Centre for Pensions and
Social Insurance Institution of FinlandUnemployment data Ministry of Employment and the Economy and
Statistics Finland Employment data Statistics FinlandCorrespondence key between occupational groups and education
Statistics Finland

75
Appendix 3. Classifi cation of fi elds, subfi elds and levels of education 1)
0 General Education 001 Pre-primary education 002 Basic education 003 General upper secondary education 099 Other general education
1 Humanities and Education 101 Leisure Activities and Youth Work 102 Languages 103 History and Archaeology 104 Philosophy 105 Educational Sciences and Psychology 106 Teaching and Education 107 Theology 199 Other education in Humanities and Education
2 Culture 201 Crafts and Design 202 Information and Communication 203 Literature 204 Theatre and Dance 205 Music 206 Visual Arts 207 Cultural and Arts Research 299 Other education in Culture
3 Social Sciences, Business and Administration 301 Business and Commerce 302 Economics 303 Administration 304 Statistics 305 Social Sciences 306 Political Sciences 307 Law 399 Other education in Social Sciences, Business and Administration

76
4 Natural Sciences 401 Mathematics 402 Computing and Software 403 Earth and Space Sciences and Astronomy 404 Physics 405 Chemistry 406 Biology 407 Geography 499 Other education in Natural Sciences
5 Technology, Communications and Transport 501 Architecture and Construction 502 Mechanical, Metal and Energy Engineering 503 Electrical and Automation Engineering 504 Information and Telecommunications Technology 505 Graphics and Communications Technology 506 Food Sciences, Food Industry and Biotechnology 507 Process, Chemical and Materials Engineering 508 Textiles and Clothing Technology 509 Automotive and Transport Engineering 510 Industrial Management 599 Other education in Technology, Communications and Transport
6 Natural Resources and the Environment 601 Agriculture 602 Horticulture 603 Fishery 604 Forestry 605 Nature and the Environment 699 Other education in Natural Resources and the Environment
7 Social Services, Health and Sports 701 Social Services 702 Health Care 703 Health Care and Social Services (common programmes) 704 Dentistry and Other Dental Services 705 Rehabilitation and Sports 706 Technical Health Services 707 Pharmacy and Other Pharmacological Services 708 Medicine 709 Veterinary Medicine 710 Beauty Care 799 Other education in Social Services, Health and Sports

77
8 Tourism, Catering and Domestic Services 801 Tourism 802 Hotel and Catering 804 Domestic and Consumer Services 805 Cleaning Services 899 Other education in Tourism, Catering and Domestic Services
9 Other Education 901 Military and Border Guard 902 Fire and Rescue Services 903 Police Services 904 Correctional Services 969 Other education outside the Ministry of Education sector 998 Other education in the Ministry of Education sector
Levels of education 00 Pre-primary education 20 Primary and lower secondary education 21 Basic education 22 Additional basic education 30 Upper secondary education 31 General upper secondary education 32 Vocational upper secondary education and training 50 Post-secondary non-higher vocational education 60 First-cycle higher education and professional tertiary education 61 Professional tertiary education 62 Polytechnic Bachelor’s degree 63 University Bachelor’s degree 70 Second-cycle higher education 71 Higher polytechnic degree (Master) 72 Higher university degree (Master) 73 Professional specialisation in Medicine, Veterinary Medicine and Dentistry 80 Third-cycle higher education 81 Licentiate’s degree 82 Doctoral degree 90 Level of education unknown
1) Ministry of Education Decision No. 19/400/2004 of 25th March 2004, Ministry of Education Amendment Decision No. 4/500/2006 of 11th April 2006

78
App
endi
x 4.
Dev
elop
men
t tre
nds
in th
e nu
mbe
r of
em
ploy
ed p
eopl
e by
indu
stry
Indu
stries
Num
ber o
f em
ploy
ed p
eopl
eBa
sic sc
enar
ioCh
ange
%
2007
–20
25
Targ
et sc
enar
ioCh
ange
%20
07–
2025
2000
2005
2007
2015
2020
2025
2015
2020
2025
1Ag
ricult
ure,
hun
ting
and
fishin
g97
,313
75,2
1575
,094
73,0
0071
,100
69,5
00-7
67,0
0060
,300
54,7
00-2
7
2Fo
restr
y an
d ma
nufa
cture
of f
ores
t ind
ustry
pro
ducts
80,3
0874
,866
72,8
9959
,700
51,0
0042
,600
-42
65,9
0063
,600
63,0
00-1
43
Manu
factu
re o
f foo
d pr
oduc
ts, b
ever
ages
and
toba
cco
40,7
7737
,156
36,5
2628
,900
23,9
0019
,700
-46
33,8
0030
,800
28,0
00-2
3
4Ma
nufa
cture
of b
asic
meta
ls an
d fa
brica
ted
meta
l pr
oduc
ts61
,974
62,0
0470
,447
64,2
0057
,800
51,2
00-2
767
,400
62,7
0057
,000
-19
5Ma
nufa
cture
of c
hemi
cal a
nd o
ther
such
pro
ducts
39,1
4834
,641
36,4
0536
,700
34,5
0031
,400
-14
36,8
0034
,600
31,8
00-1
3
6Ma
nufa
cture
of m
achin
ery,
equip
ment
and
tran
spor
t eq
uipme
nt82
,637
80,8
0088
,692
87,5
0082
,700
74,7
00-1
690
,500
87,7
0081
,400
-8
7Ma
nufa
cture
of e
lectri
cal a
nd o
ptica
l equ
ipmen
t67
,995
63,4
6660
,430
51,9
0040
,200
30,8
00-4
958
,100
54,5
0050
,900
-16
8Ot
her m
anuf
actu
ring
49,4
8845
,219
45,0
5838
,300
34,1
0030
,600
-32
39,5
0035
,900
32,8
00-2
79
Electr
icity,
gas
and
wat
er su
pply
18,9
0215
,703
15,5
2713
,600
12,7
0011
,600
-25
13,8
0013
,000
11,9
00-2
310
Cons
tructi
on13
4,47
414
1,42
815
6,74
714
7,90
015
3,60
015
9,90
02
149,
800
155,
200
160,
300
211
Who
lesale
trad
e an
d co
mmiss
ion tr
ade
94,7
0295
,140
97,1
2297
,200
99,6
0010
0,00
03
98,6
0010
0,20
099
,700
312
Reta
il tra
de15
1,78
116
0,49
116
7,08
116
3,80
017
3,10
018
3,00
010
167,
800
178,
700
190,
100
1413
Tour
ism, h
otels
and
resta
uran
ts71
,513
74,8
7581
,653
80,7
0082
,600
84,7
004
82,3
0084
,900
87,9
008
14Tra
nspo
rt11
3,70
411
7,32
712
3,67
512
4,90
012
3,80
012
1,70
0-2
128,
000
128,
600
129,
300
515
Post
and
telec
ommu
nicat
ions
47,6
9144
,651
40,2
7439
,800
38,2
0036
,500
-941
,400
41,1
0040
,900
216
Finan
cial a
nd in
sura
nce
activ
ities
44,6
4443
,502
46,1
7847
,300
48,1
0048
,200
447
,700
48,8
0049
,600
7
17Ma
nage
ment
of r
eal e
state
, com
bined
facil
ities
supp
ort
activ
ities
, clea
ning,
sewa
ge a
nd re
fuse
disp
osal,
sanit
ati-
on a
nd si
milar
acti
vities
57,2
2564
,666
69,0
9968
,100
68,0
0067
,400
-270
,900
74,2
0077
,800
13

79
Indu
stries
Num
ber o
f em
ploy
ed p
eopl
eBa
sic sc
enar
ioCh
ange
%
2007
–20
25
Targ
et sc
enar
ioCh
ange
%20
07–
2025
2000
2005
2007
2015
2020
2025
2015
2020
2025
18Te
chnic
al bu
sines
s acti
vities
97,5
5311
0,26
812
0,60
711
6,40
011
7,80
011
8,10
0-2
120,
900
126,
900
132,
200
1019
Comm
ercia
l and
adm
inistr
ative
bus
iness
acti
vities
81,6
0910
1,31
112
4,08
211
1,90
010
7,60
010
1,60
0-1
812
1,20
012
4,20
012
7,20
03
20Pu
blic a
dmini
strat
ion a
nd co
mpuls
ory s
ocial
secu
rity
76,9
3174
,426
75,1
4175
,100
76,2
0077
,300
370
,100
66,6
0063
,500
-15
21De
fenc
e ac
tiviti
es a
nd p
ublic
ord
er48
,526
49,2
1649
,581
49,7
0050
,600
51,4
004
46,0
0043
,400
41,2
00-1
722
Educ
ation
and
rese
arch
166,
111
175,
737
176,
960
168,
600
171,
500
174,
600
-118
3,50
019
0,60
019
9,50
013
23Hu
man
healt
h ac
tiviti
es15
4,28
517
0,72
917
5,20
220
2,10
022
2,10
024
2,30
038
178,
100
191,
100
204,
900
1724
Socia
l wor
k ac
tiviti
es15
1,17
416
5,11
017
7,58
820
2,50
021
9,00
024
0,70
036
188,
800
201,
800
216,
000
2225
Activ
ities
of m
embe
rship
orga
nisat
ions
35,7
1939
,139
38,4
2237
,800
38,1
0038
,800
138
,700
39,6
0040
,700
6
26Re
creat
ional,
cultu
ral a
nd sp
ortin
g ac
tiviti
es a
nd
publi
shing
75,2
9474
,649
78,1
3474
,400
72,0
0070
,200
-10
75,4
0073
,800
73,2
00-6
27Ot
her s
ervic
e ac
tiviti
es38
,243
46,5
8745
,995
44,5
0045
,000
45,8
000
45,1
0046
,000
47,3
003
28In
dustr
y unk
nown
48,8
3626
,889
24,4
4724
,000
24,1
0024
,200
-124
,300
24,6
0024
,900
2
Tota
l2,
228,
557
2,26
5,21
12,
369,
066
2,33
0,50
02,
339,
000
2,34
8,50
0-1
2,35
1,40
02,
383,
400
2,41
7,70
02

80
Appendix 5. Educational distributions of occupational groups by level of education used in the correspondence key

81
App
endi
x 6.
Dem
and
for
new
labo
ur
Occu
patio
nal g
roup
s Me
dian
age
Num
ber o
f em
ploy
ed
peop
le
Natu
ral
wasta
ge
Basic
scen
ario
Targ
et sc
enar
io
Chan
geJo
b op
enin
gsCh
ange
Job
open
ings
2007
2007
2008
–202
520
08–2
025
2008
–202
520
08–2
025
2008
–202
5
Agric
ultu
ral a
nd fo
restr
y wo
rk47
99,0
2054
,130
-13,
880
40,2
80-2
3,04
031
,110
1.1
Agric
ultur
al en
trepr
eneu
rs an
d wo
rker
s47
71,9
7041
,570
-7,8
9033
,680
-20,
680
20,9
001.
2Ho
rticu
ltura
l ent
repr
eneu
rs an
d wo
rker
s43
8,05
02,
880
120
3,01
076
03,
640
1.3
Fore
stry w
orke
rs45
11,3
105,
770
-4,5
701,
210
-2,4
503,
330
1.4
Agric
ultur
al an
d fo
restr
y pro
fess
ionals
457,
690
3,91
0-1
,540
2,38
0-6
703,
240
Manu
factu
ring
work
4146
5,57
019
7,11
0-8
7,70
010
9,40
0-3
7,88
015
9,26
02.
1Fo
od w
orke
rs39
20,6
208,
040
-7,1
7088
0-3
,280
4,76
02.
2Te
xtile
s, clo
thing
and
leat
her w
orke
rs46
16,1
008,
590
-3,0
805,
510
-3,8
104,
780
2.3
Meta
l wor
kers
4275
,270
33,7
80-1
5,70
018
,070
-11,
890
21,8
902.
4Ma
chine
ry m
echa
nics
4159
,390
25,1
00-7
,310
17,7
80-5
,250
19,8
502.
5Me
chan
ical e
ngine
ers
4332
,840
14,1
60-2
,410
11,7
403,
760
17,9
202.
6Co
nstru
ction
and
indu
strial
equ
ipmen
t ope
rato
rs44
30,5
6015
,180
-2,6
2012
,560
-2,2
7012
,910
2.7
Woo
d-pro
cess
ing w
orke
rs an
d te
chnic
ians
4226
,100
11,7
10-5
,780
5,93
01,
690
13,4
002.
8Ch
emica
l pro
cess
wor
kers
4145
,170
19,5
50-1
2,97
06,
580
-11,
630
7,93
02.
9Ch
emica
l pro
cess
eng
ineer
s42
10,2
104,
160
-2,1
502,
010
-60
4,10
02.
10Ele
ctrica
l and
elec
tronic
s wor
kers
4051
,410
19,9
30-6
,870
13,0
60-2
,610
17,3
202.
11Ele
ctrica
l and
elec
tronic
s eng
ineer
s38
35,8
209,
770
-8,6
601,
110
2,43
012
,210
2.12
Grap
hics w
orke
rs43
11,4
805,
210
-2,3
002,
910
-2,0
503,
160

82
Occu
patio
nal g
roup
s Me
dian
age
Num
ber o
f em
ploy
ed
peop
le
Natu
ral
wasta
ge
Basic
scen
ario
Targ
et sc
enar
io
Chan
geJo
b op
enin
gsCh
ange
Job
open
ings
2007
2007
2008
–202
520
08–2
025
2008
–202
520
08–2
025
2008
–202
5
2.13
Pack
aging
and
ass
embly
wor
kers
4014
,010
5,91
0-5
,610
300
-3,6
302,
290
2.14
Mana
gers
and
othe
r pro
fess
ionals
in m
anuf
actu
ring
4336
,590
16,0
20-5
,070
10,9
6072
016
,740
Cons
tructi
on w
ork
4314
3,61
066
,080
-4,1
4061
,940
5,88
071
,970
3.1
Cons
tructi
on w
orke
rs41
80,1
3034
,890
-4,3
9030
,500
130
35,0
203.
2He
ating
, plum
bing
and
vent
ilatio
n fit
ters
4216
,260
7,55
035
07,
890
970
8,52
03.
3Bu
ilding
pain
ters
436,
140
2,94
0-1
102,
830
302,
980
3.4
Mana
gers
and
prof
essio
nals
in co
nstru
ction
4641
,080
20,7
0010
20,7
204,
750
25,4
50Tr
ansp
ort a
nd lo
gisti
cs w
ork
4113
6,18
059
,400
-8,3
4051
,060
730
60,1
404.
1La
nd tr
ansp
ort w
orke
rs an
d en
trepr
eneu
rs44
81,6
2039
,500
-4,4
5035
,050
3,76
043
,260
4.2
Wat
er tr
affic
ope
rato
rs an
d of
ficer
s46
4,13
02,
660
380
3,04
080
2,74
04.
3Air
tran
spor
t man
ager
s and
pro
fess
ionals
401,
590
750
1076
0-8
067
04.
4W
areh
ouse
wor
kers
and
forw
ardin
g ag
ents
3548
,840
16,4
90-4
,280
12,2
10-3
,030
13,4
70Se
rvice
wor
k40
536,
180
213,
490
5,34
021
8,81
016
,070
229,
580
5.1
Prop
erty
man
ager
s and
buil
ding
care
take
rs47
28,5
0015
,910
-40
15,8
701,
600
17,5
105.
2Cle
aner
s45
84,9
3045
,540
-610
44,9
30-4
,140
41,4
105.
3Me
rchan
ts an
d sa
les w
orke
rs37
206,
720
69,0
707,
050
76,1
201,
390
70,4
705.
4Ma
nage
rs an
d pr
ofes
siona
ls in
trade
4367
,100
28,3
40-3
,700
24,6
408,
310
36,6
505.
5Re
staur
ant a
nd ca
terin
g wo
rker
s35
69,9
7024
,150
2,86
027
,010
4,91
029
,070
5.6
Hote
l, re
staur
ant a
nd ca
terin
g ma
nage
rs an
d pr
ofes
siona
ls43
22,8
9010
,260
1,47
011
,730
3,81
014
,070
5.7
Trave
l ser
vice
work
ers
396,
750
2,04
0-2
02,
010
630
2,66
05.
8Be
auty
care
wor
kers
3916
,600
5,71
021
05,
920
1,46
07,
170
5.9
Othe
r ser
vice
work
ers
3832
,720
12,4
70-1
,880
10,5
80-1
,900
10,5
70

83
Occu
patio
nal g
roup
s Me
dian
age
Num
ber o
f em
ploy
ed
peop
le
Natu
ral
wasta
ge
Basic
scen
ario
Targ
et sc
enar
io
Chan
geJo
b op
enin
gsCh
ange
Job
open
ings
2007
2007
2008
–202
520
08–2
025
2008
–202
520
08–2
025
2008
–202
5
Offic
e wo
rk44
232,
120
112,
270
-19,
640
92,6
30-3
6,81
075
,460
6.1
Offic
e wo
rker
s in
busin
ess a
dmini
strat
ion46
118,
360
63,4
80-1
1,35
052
,130
-23,
310
40,1
706.
2Ot
her o
ffice
wor
kers
4183
,510
33,9
40-5
,450
28,4
90-1
0,03
023
,910
6.3
Offic
e wo
rk m
anag
ers a
nd p
rofe
ssion
als45
30,2
5014
,850
-2,8
4012
,010
-3,4
7011
,380
Heal
th a
nd so
cial w
ork
4331
7,70
014
9,43
011
1,95
026
1,38
077
,510
226,
950
7.1
Prac
tical
nurse
s43
72,0
8034
,390
29,8
5064
,240
16,9
9051
,380
7.2
Nurse
s and
oth
er h
ealth
care
pro
fess
ionals
4288
,990
38,9
8036
,880
75,8
6024
,980
63,9
607.
3Me
dical
docto
rs an
d ot
her h
ealth
pro
fess
ionals
4424
,950
11,2
407,
130
18,3
705,
050
16,2
907.
4So
cial s
ervic
es w
orke
rs an
d ins
tructo
rs44
118,
300
57,4
0034
,050
91,4
5025
,740
83,1
507.
5So
cial w
ork
prof
essio
nals
448,
460
3,92
02,
580
6,50
04,
080
8,00
07.
6He
alth
and
socia
l ser
vices
man
ager
s50
4,92
03,
500
1,46
04,
960
670
4,17
0Te
achi
ng a
nd e
duca
tion
4412
7,88
060
,460
3,64
064
,090
14,1
0074
,560
8.1
Teac
hing
prof
essio
nals
4412
7,88
060
,460
3,64
064
,090
14,1
0074
,560
Cultu
ral a
nd co
mm
unica
tions
wor
k42
45,0
2017
,980
-3,1
7014
,810
5,38
023
,340
9.1
Craf
ts an
d de
sign
work
ers
451,
280
600
-170
430
510
1,10
09.
2Ar
tists
and
othe
r arti
stic p
rofe
ssion
als37
14,5
904,
270
-640
3,63
03,
370
7,64
09.
3Ar
tistic
and
cultu
ral s
ervic
es m
anag
ers a
nd p
rodu
cers
477,
560
4,11
010
04,
210
2,11
06,
220
9.4
Libra
rians
, arch
ivists
and
cura
tors
483,
740
2,09
0-3
401,
750
-60
2,03
09.
5Pu
blic r
elatio
ns p
rofe
ssion
als a
nd jo
urna
lists
4117
,850
6,91
0-2
,120
4,79
0-5
506,
350
Othe
r exe
cutiv
e an
d ex
pert
work
4315
8,61
068
,180
1,05
069
,240
28,9
2097
,100
10.1
Math
emat
ician
s and
nat
ural
scien
ce p
rofe
ssion
als40
6,50
02,
280
140
2,42
02,
410
4,70
0

84
Occu
patio
nal g
roup
s Me
dian
age
Num
ber o
f em
ploy
ed
peop
le
Natu
ral
wasta
ge
Basic
scen
ario
Targ
et sc
enar
io
Chan
geJo
b op
enin
gsCh
ange
Job
open
ings
2007
2007
2008
–202
520
08–2
025
2008
–202
520
08–2
025
2008
–202
5
10.2
Prof
essio
nals
in so
cial s
cienc
es, h
uman
ities
and
bu
sines
s47
50,2
5026
,090
2,42
028
,510
9,39
035
,480
10.3
Lega
l pro
fess
ionals
4610
,360
5,16
058
05,
740
2,18
07,
330
10.4
Publi
c adm
inistr
ation
man
ager
s and
pro
fess
ionals
4540
,960
19,3
60-1
,710
17,6
50-7
5018
,610
10.5
Comp
uting
man
ager
s and
pro
fess
ionals
3845
,010
12,8
1020
12,8
3012
,940
25,7
5010
.6Re
sear
ch a
nd d
evelo
pmen
t man
ager
s45
5,53
02,
480
-400
2,09
02,
750
5,23
0Re
scue
and
secu
rity
work
3739
,430
18,4
40-4
0018
,040
-2,8
6015
,580
11.1
Polic
e of
ficer
s, fir
e fig
hter
s and
pris
on g
uard
s40
19,6
509,
880
390
10,2
60-1
,650
8,23
011
.2Ar
med
force
s38
10,1
806,
350
206,
370
-2,1
804,
170
11.3
Othe
r res
cue
and
secu
rity w
orke
rs29
9,60
02,
210
-810
1,41
097
03,
180
Unkn
own
3167
,760
19,4
80-5
,250
14,2
3064
020
,120
12Un
know
n31
67,7
6019
,480
-5,2
5014
,230
640
20,1
20To
tal
422,
369,
080
1,03
6,45
0-2
0,54
01,
015,
910
48,6
401,
085,
170

85
App
endi
x 7.
Ent
rant
s in
200
7–20
09 b
y fi e
ld a
nd le
vel o
f edu
catio
n, a
vera
ge
inta
ke n
eeds
for
2014
–201
8 in
the
basi
c an
d ta
rget
sce
nari
os a
nd
Dev
elop
men
t Pla
n ta
rget
s in
201
6
Field
of e
duca
tion
Leve
l of e
duca
tion
Entra
nts i
n yo
uth-
level
prov
ision
Aver
age
inta
ke n
eeds
201
4–20
18 1)
Deve
lopm
ent P
lan
targ
et fo
r you
th-le
vel
prov
ision
in 2
016
Yout
h-lev
el pr
ovisi
onTo
tal n
eeds
2007
2008
2009
Basic
scen
ario
Targ
et sc
enar
ioBa
sic sc
enar
ioTa
rget
scen
ario
Huma
nities
and
Edu
catio
n5,
834
5,67
95,
774
5,14
05,
420
5,46
05,
790
5,83
0Up
per s
econ
dary
VET
861
840
947
800
720
870
790
840
Polyt
echn
ics28
531
932
537
034
039
036
036
0Un
iversi
ties
4,68
84,
520
4,50
23,
970
4,36
04,
200
4,64
04,
630
Cultu
re7,
615
7,46
57,
707
3,11
03,
780
3,51
04,
260
4,74
5Up
per s
econ
dary
VET
3,74
63,
665
3,65
01,
200
1,38
01,
400
1,60
01,
810
Polyt
echn
ics2,
291
2,26
82,
473
920
1,17
01,
020
1,31
01,
510
Unive
rsitie
s1,
578
1,53
21,
584
990
1,23
01,
090
1,35
01,
425
Socia
l Scie
nces
, Bus
iness
and
Adm
inistr
ation
14,7
2215
,252
16,0
5916
,380
15,2
6017
,500
16,3
6015
,960
Uppe
r sec
onda
ry V
ET4,
952
5,23
25,
575
6,53
05,
470
7,18
06,
040
5,55
0Po
lytec
hnics
5,19
45,
300
5,54
56,
350
5,89
06,
660
6,22
05,
540
Unive
rsitie
s4,
576
4,72
04,
939
3,50
03,
900
3,66
04,
100
4,87
0Na
tura
l Scie
nces
6,
524
6,23
56,
353
3,28
04,
170
3,47
04,
420
5,31
0Up
per s
econ
dary
VET
1,98
81,
827
1,73
466
057
073
063
01,
000
Polyt
echn
ics1,
363
1,27
31,
229
1,02
01,
460
1,05
01,
510
1,35
0Un
iversi
ties
3,17
33,
135
3,39
01,
600
2,14
01,
690
2,28
02,
960

86
Field
of e
duca
tion
Leve
l of e
duca
tion
Entra
nts i
n yo
uth-
level
prov
ision
Aver
age
inta
ke n
eeds
201
4–20
18 1)
Deve
lopm
ent P
lan
targ
et fo
r you
th-le
vel
prov
ision
in 2
016
Yout
h-lev
el pr
ovisi
onTo
tal n
eeds
2007
2008
2009
Basic
scen
ario
Targ
et sc
enar
ioBa
sic sc
enar
ioTa
rget
scen
ario
Tech
nolog
y, Co
mmun
icatio
ns a
nd Tr
ansp
ort
31,6
0631
,955
32,9
9726
,450
31,3
5027
,690
32,9
5032
,190
Uppe
r sec
onda
ry V
ET20
,149
20,3
6420
,868
19,2
6021
,500
20,3
9022
,910
21,0
00Po
lytec
hnics
7,73
27,
738
8,33
75,
010
6,70
05,
080
6,83
07,
520
Unive
rsitie
s3,
725
3,85
33,
792
2,18
03,
150
2,22
03,
210
3,67
0Na
tura
l Res
ource
s and
the
Envir
onme
nt3,
813
3,88
64,
056
4,91
03,
900
5,23
04,
210
3,77
0Up
per s
econ
dary
VET
2,64
72,
697
2,80
13,
560
2,79
03,
820
3,03
02,
670
Polyt
echn
ics74
779
283
11,
070
820
1,11
087
077
0Un
iversi
ties
419
397
424
280
290
300
310
330
Socia
l Ser
vices
, Hea
lth a
nd S
ports
15,2
2215
,561
17,0
7322
,780
19,1
9024
,630
20,8
5018
,590
Uppe
r sec
onda
ry V
ET7,
201
7,17
88,
050
11,6
009,
620
12,7
5010
,640
8,93
0Po
lytec
hnics
6,57
36,
946
7,55
28,
880
7,54
09,
480
8,09
07,
700
Unive
rsitie
s1,
448
1,43
71,
471
2,30
02,
030
2,40
02,
120
1,96
0To
urism
, Cat
ering
and
Dom
estic
Ser
vices
7,85
87,
728
8,36
111
,050
10,4
1012
,460
11,7
907,
305
Uppe
r sec
onda
ry V
ET6,
081
5,98
06,
545
10,0
509,
380
11,3
8010
,690
6,08
0Po
lytec
hnics
1,73
61,
703
1,74
990
092
096
098
01,
115
Unive
rsitie
s41
4567
100
110
120
120
110
1) Fi
gures
for i
ntake
need
s may
diffe
r from
othe
r pub
licati
on ta
bles d
ue to
roun
ding.

87
Opetushallitus on selvittänyt lukiodiplomien toteutu-mista lukioissa lukuvuosina 2008–2009 ja 2009–2010. Nyt raportoitavalla kyselyllä selvitettiin lukiodiplomin suorittamista lukioissa, yhteistyötä lukiodiplomin toteut-tamisessa, lukiodiplomin merkitystä lukion toimintakult-tuurissa ja kehittämistarpeita. Selvityksen aineisto koottiin Opetushallituksen sähköisellä kyselyllä keväällä 2010. Lukiodiplomin suorittaminen on lukion yleissivistävän koulutustehtävän mukaista lukion toimintaa. Lukiodiplo-mit antavat lukion opiskelijalle mahdollisuuden osoittaa erityisosaamistaan taito- ja taideaineissa. Lukiodiplomeita voi suorittaa kotitaloudessa, kuvataiteessa, käsityössä, liikunnassa, mediassa, musiikissa, tanssissa ja teatterissa.
PaperbackISBN 978-952-13-5295-9
OnlineISBN 978-952-13-5296-6
Finnish National Board of Educationwww.oph.fi /publications