education stat at a glance 2003 final
TRANSCRIPT

EducationStatistics
in South Africaat a Glance in
2003
Published by the Department of Education
May 2005

EducationStatistics
in South Africaat a Glance in
2003Published by the Department of Education
May 2005

Department of EducationSol Plaatje House123 Schoeman StreetPretoriaSouth Africa0002
Private Bag X895Pretoria0001
Tel: +27 12 312 5911Fax: +27 12 321 6770www.education.gov.za
© Department of Education
This publication may be used in part or as a whole, provided that the Department of Education is acknowledgedas the source of information.
ISBN: 1-77018-047-8
Design and layout: Formeset Digital Pretoria, Tel: (012) 324-0607Printed by the Government Printing Works, Pretoria

Foreword
FFOORREEWWOORRDDIt is again my pleasure to release the publication Education Statistics in South Africaat a Glance in 2003, the fifth report on education statistics produced by theDepartment of Education since 1999. Organisational effectiveness and quality canbe greatly enhanced by improving monitoring, evaluation and accountability. TheDepartment of Education is committed to making education statistics more accessi-ble to the public, statutory oversight bodies and education stakeholders and we willcontinue improving our reporting. This, we trust, will contribute towards improvingthe performance of the system and will give the public the opportunity to measurethe progress made towards achieving the redress and transformation goals of theeducation system.
I am confident that this report will serve as a source of useful information for educa-tors, learners and parents, administrators, managers, decision makers, analysts andother important role players within and outside the education system. This report isa partial fulfillment of the Minister of Education's responsibility to monitor and evalu-ate the performance of the education system, as required by the National Education Policy Act, 1996 (Act No. 27 of1996). I would like to encourage schools and other educational institutions to use this publication as a tool forimproving teaching and learning and for improving their knowledge about the education system.
In order for us to do the trend analysis, we have retained the format of the previous reports. Currently, the reportingis intended to provide a snapshot of the system in 2003. We are aware that quantitative information becomes lessusable with time (maintaining usefulness only with trend analysis). Our goal is to publish future reports during theyear in question, and we will continue improving their quality, in terms of both coverage and relevance.
The publication would not have been possible without the contribution of members of the nine provincial departments of education and all the public universities and technikons, who had the challenging task of setting up,managing and maintaining the management information systems that yielded the contents of this publication. Wealso remain deeply indebted to other partners in the education environment, whose ongoing feedback and recommendations will provide the basis for further development and improvement of statistical reporting on education in South Africa.
DB HindleDirector-General: Department of EducationPretoria, South Africa

Contents
CCOONNTTEENNTTSSPage
ACRONYMS......................................................................................................... 1
1. INTRODUCTION....................................................................................... 2
2. OVERVIEW OF THE EDUCATION SYSTEM IN SOUTH AFRICA......... 3
3. ORDINARY PUBLIC AND INDEPENDENT SCHOOLS.......................... 4
3.1 Basic school data............................................................................................. 4
3.1.1 Schools......................................................................................................................... 4
3.1.2 Learners........................................................................................................................ 4
3.1.3 Educators..................................................................................................................... 5
3.1.4 Distribution of learners, educators and schools...................................................... 5
3.1.5 Indicators...................................................................................................................... 6● Learner-to-educator ratio............................................................................................................ 6● Learner-to-school ratio................................................................................................................ 6● Gross Enrolment Ratio (GER).................................................................................................... 6● Gender Parity Index (GPI).......................................................................................................... 7
3.1.6 Learners, by grade and school phase....................................................................... 8
3.1.7 Comparison between 1999, 2000, 2001, 2002 and 2003.......................................... 13● Learners, educators and schools ............................................................................................... 13● Learners in independent schools as a percentage of all learners.............................................. 13● Learner-to-educator ratio............................................................................................................ 14● Learner-to-school ratio................................................................................................................ 14● Gross Enrolment Ratio (GER).................................................................................................... 14● Gender Parity Index (GPI).......................................................................................................... 15
3.2 Region and district data on learners, educators and schools.................... 15
3.3 Senior Certificate examination........................................................................ 20
3.3.1 Overall results.............................................................................................................. 20
3.3.2 Pass type results......................................................................................................... 21
3.3.3 Frequency interval results.......................................................................................... 22
3.3.4 Selected subject results............................................................................................. 23
3.3.5 Pass rate trend from 1994 to 2003............................................................................. 25
Contents
Page
4. PUBLIC HIGHER EDUCATION INSTITUTIONS..................................... 26
4.1 Headcount enrolments..................................................................................... 26
4.2 Headcount and graduation rates of graduates and diplomates.................. 31
4.3 Full-time equivalent (FTE) enrolments and undergraduate success rates 34
4.4 Permanent staff................................................................................................ 37
5. CONTACT DETAILS................................................................................. 39
5.1 Provincial EMIS units....................................................................................... 39
5.2 Department of Education ................................................................................ 40
ACKNOWLEDGEMENTS.................................................................................... 41

List of tables and figures
LLIISSTT OOFF TTAABBLLEESS AANNDD FFIIGGUURREESSSection Description
2 Figure 1 Percentage distribution of learners in the education system in 2003..............................
3.1 Table 1 Number of learners, educators and schools, and learner-to-educator and learner-to-school ratios in the ordinary public and independent school sector, by province andtype of school, in 2003.....................................................................................................
3.1.4 Figure 2 Percentage distribution of learners, educators and schools in the ordinary school sec-tor, by province, in 2003...................................................................................................
Figure 3 Distribution of learners, educators and schools in the independent school sector, aspercentage of the ordinary school sector, by province, in 2003........................................
3.1.5 Table 2 Gross Enrolment Ratio (GER) and Gender Parity Index (GPI) in the ordinary schoolsector, by province and gender, in 2003...........................................................................
3.1.6 Table 3 Number of learners in ordinary schools, by province, gender and grade, in 2003............Figure 4 Percentage distribution of learners in ordinary schools, by phase, in 2003....................Figure 5 Percentage distribution of learners in ordinary schools, by phase and gender, in
2003.................................................................................................................................Figure 6 Percentage distribution of female learners in ordinary schools, by grade, in 2003...........Figure 7 Distribution of learners in independent schools as percentage of ordinary school learn-
ers, by grade, in 2003......................................................................................................Figure 8 Number of learners in ordinary schools, by grade, compared with the appropriate age
group in the population, in 2003.......................................................................................Figure 9 Percentage distribution of learners in ordinary schools, by grade, Pre-Grade R and
LSEN, in 2003..................................................................................................................
3.1.7 Table 4 Comparing learners, educators and schools in the ordinary school sector, by province,from 1999 to 2003............................................................................................................
Table 5 Comparing the share of learners in independent schools, learner-to-educator ratio andlearner-to-school ratio in the ordinary school sector, by province, from 1999 to 2003......
Table 6 Comparing Gross Enrolment Ratio (GER) and Gender Parity Index (GPI) in the ordi-nary school sector, by province, from 1999 to 2003.........................................................
3.2 Table 7 Number of learners, educators and institutions in the ordinary school sector, byprovince, region and district, in 2003...............................................................................
EDUCATION IN SOUTH AFRICA: A GLOBAL PICTURE 2003
3.3.1 Table 8 Senior Certificate examination results for full-time candidates with six or more subjects,by province and gender, in 2003......................................................................................
Figure 10 Percentage distribution of Senior Certificate examination pass and failure rates, bygender, in 2003................................................................................................................
3.3.2 Table 9 Senior Certificate examination results, by province, gender and type of pass, in 2003.................................................................................................................................
Figure 11 Percentage distribution of Senior Certificate examination results, by type of pass andgender, in 2003................................................................................................................
3.3.3 Table 10 Senior Certificate examination percentage pass rates of schools within different per-centage groupings, by province, in 2002 and 2003..........................................................
Figure 12 Percentage distribution of Senior Certificate examination percentage pass rates ofschools within different percentage groupings in 2002 and 2003.....................................
3.3.4 Table 11 Senior Certificate examination results for selected subjects, by gender, in 2002 and2003.................................................................................................................................
Figure 13 Percentage distribution of Senior Certificate examination pass rates for selected sub-jects, by gender, in 2003..................................................................................................
3.3.5 Table 12 Comparison of pass rates of the Senior Certificate examination, by province, from 1994to 2003.............................................................................................................................
Figure 14 Comparison of national pass rates of the Senior Certificate examination from 1994 to2003.................................................................................................................................
Page
3
4
5
6
7
810
1011
11
12
12
13
13
14
15
18-19
20
21
21
22
22
23
24
24
25
25
List of tables and figures
Section Description
4.1 Table 13 Overview of South African public higher education institutions in 2003............................Table 14 Headcount enrolments in public higher education institutions, by major field of study
and formal qualification, in 2003......................................................................................Figure 15 Percentage distribution of headcount enrolments in public higher education institutions,
by major field of study, in 2003.........................................................................................Figure 16 Percentage distribution of headcount enrolments in public higher education institutions,
by qualification type, in 2003............................................................................................Table 15 Headcount enrolments of contact and distance mode students in public higher educa-
tion institutions, by race, in 2003......................................................................................Figure 17 Percentage distribution of headcount enrolments in public higher education institutions,
by contact/distance mode and race, in 2003....................................................................Figure 18 Percentage distribution of headcount enrolments in public higher education institutions,
by contact/distance mode and gender, in 2003................................................................
4.2 Table 16 Graduates/diplomates in public higher education institutions, by major field of studyand formal qualification, in 2003......................................................................................
Table 17 Summaries of key graduation rates in public higher education institutions in 2003..........Figure 19 Headcount totals of graduates/diplomates in public higher education institutions, by
qualification type, in 2003................................................................................................
4.3 Table 18 Full-time equivalent enrolments of contact and distance mode students in public high-er education institutions in 2003.......................................................................................
Table 19 Undergraduate success rates of contact and distance mode students in public highereducation institutions, by race, in 2003............................................................................
Figure 20 Full-time equivalent student enrolments in public higher education institutions, by con-tact/distance mode, in 2003.............................................................................................
Figure 21 Percentage distribution of average undergraduate success rates in public higher edu-cation institutions, by contact education programmes and race, in 2003.........................
4.4 Table 20 Overview of permanent staff in public higher education institutions in 2003.....................Figure 22 Percentage distribution of black and female staff in public higher education institutions,
as a percentage of total permanent staff, in 2003...........................................................
Page
26
27
28
28
29
30
30
3132
33
34
35
36
36
37
38

11
Acronyms
AACCRROONNYYMMSSABET Adult Basic Education and Training
DoE Department of Education
EC Eastern Cape Province
ECD Early Childhood Development
ELSEN Education for Learners with Special Education Needs
EMIS Education Management Information System
FET Further Education and Training
FS Free State Province
FTE Full-time Equivalent
GER Gross Enrolment Ratio
GET General Education and Training
GP Gauteng Province
GPI Gender Parity Index
Gr. R Grade R (Reception year or year prior to Grade 1)
HBT Historically Black Technikon
HBU Historically Black University
HE Higher Education
HEMIS Higher Education Management Information System
HG Higher Grade
HWT Historically White Technikon
HWU Historically White University
KZN KwaZulu-Natal Province
L:E Ratio Learner-to-Educator Ratio
LSEN Learners with Special Education Needs
L:S Ratio Learner-to-School Ratio
LG Lower Grade
LP Limpopo Province
MP Mpumalanga Province
NAT National
NC Northern Cape Province
NW North West Province
SET Science, Engineering and Technology
SG Standard Grade
SGB School Governing Body
WC Western Cape Province
Introduction
22
11.. IINNTTRROODDUUCCTTIIOONN The Department of Education (DoE) and the nine provincial departments of education have the task of collectinginformation on the education system as a whole in order to monitor and evaluate the performance of the system.Furthermore, information is collected for reasons of accountability and planning. The Education ManagementInformation System (EMIS) was set up to systematically collect and analyse data on learners, educators andresources throughout the education system, including the General Education and Training (GET), Further Educa-tion and Training (FET), Early Childhood Development (ECD), Education for Learners with Special EducationNeeds (ELSEN) (also referred to as learners who experience barriers to learning), Adult Basic Education andTraining (ABET), and Higher Education (HE) sectors. The collection of information has, for the past nine years,been facing serious developmental challenges as new systems were introduced and capacities of provincialdepartments varied according to whether a province had sufficient or inadequate resources. We can now say thatthese systems have stabilised and that the institutional capacity has improved, although the fact that the provincesdo not use uniform definitions and standards is still a challenge for the Department. The Education InformationPolicy, which the Minister of Education, Ms GNM Pandor, approved in August 2004, will assist in bringing aboutuniform standards and improving the accuracy and quality of data.
This publication covers data primarily for the 2003 reporting year. The Department is looking at making future edi-tions of this publication available during the year in question. It should be noted that the Department does have2004 school data that is usable, although it is not ready for publication. The sources of data used for the report arethe following: for ordinary public and independent schools (hereinafter collectively referred to as ordinary schools),the 2003 Snap Survey conducted on the 10th school day; for the public HE sector, the 2003 HEMIS1 Database; forthe public FET sector, the 2002 Survey by the National Business Initiative; for the ABET sector, the 2003 AnnualABET Survey; for the ELSEN sector, the 2003 Provincial Submissions; and for the ECD sector, the 2000 ECDAudit. Population figures are based on mid-year estimates provided by Statistics South Africa (published estimatesfor 2001 and 2002, and unpublished, provisional estimates for 1999, 2000 and 2003.) To obtain the percentages ofSGB-paid2 educators at provincial public schools, the 2002 Annual School Survey was used.
1 HEMIS = Higher Education Management Information System.2 SGB = School Governing Body.

Overview
333 Combined schools usually include Grades 1 to 12.4 Intermediate & middle schools usually include Grades 7 to 9.
22.. OOVVEERRVVIIEEWW OOFF TTHHEE EEDDUUCCAATTIIOONN SSYYSSTTEEMM IINN SSOOUUTTHHAAFFRRIICCAA
The centrefold shows that there were 32 751 established public and registered independent educational institu-tions in South Africa in 2003, of which 26 845 were ordinary schools and 5 906 were other education institutions,including ABET centres, ELSEN (special) schools and ECD sites, public FET institutions and public HE institutions(universities and technikons).
The 26 845 ordinary schools were made up of the following:
● 16 169 primary schools, with 6 361 430 learners and 173 211 educators;● 5 810 secondary schools, with 3 590 411 learners and 116 992 educators; and● 4 866 combined3, intermediate4 and middle schools, with 2 087 081 learners and 67 892 educators.
Figure 1 and the centrefold show that, of the 13 711 564 learners and students in all sectors of the education sys-tem in 2003, 11 744 013 (85.7%) were in public schools and 294 909 (2.2%) were in independent schools. Of thelearners in other institutions, 548 704 (4.0%) were in ABET centres, ELSEN (special) schools and ECD sites, 717 793 (5.2%) were in public HE institutions, and 406 145 (3.0%) were in public FET institutions.
There were 13 711 564 learners and students in the education system, who attended 32 751 educational institu-tions and were served by 411 792 educators and lecturers.
Figure 1: Percentage distribution of learners in the education system in 2003
Public Schools85.7
ELSEN (Special)Schools
0.6
ECD Sites1.5
ABET Centres1.9
Independent Schools2.2
Public FET Institutions3.0
Public HE Institutions5.2
Basic school data
44
33.. OORRDDIINNAARRYY PPUUBBLLIICC AANNDD IINNDDEEPPEENNDDEENNTT SSCCHHOOOOLLSS
33..11 BBaassiicc sscchhooooll ddaattaa
Source: 2003 SNAP Survey (conducted on the 10th school day).Note 1 Data are for ordinary public and independent schools only. Data on stand-alone ECD sites, ELSEN (special) schools, ABET centres and public FET institutions are
excluded. Note 2 Ordinary public and independent schools are the so-called mainstream schools.Note 3: Independent schools were previously known as private schools.
1) Including learners in Pre-Grade R, Grade R and LSEN at ordinary public and independent schools (collectively referred to as ordinary schools). 2) Public educators in EC, FS, KZN, MP and WC represent only State-paid educators, while those in GP, LP and NW represent both State- and SGB-paid educators. Public
educators in NC represent a combination of both. The percentages of SGB-paid educators at provincial public schools, as reflected in the 2002 Annual School Surveydatabase, are: EC:3.0%, FS:3.1%, GP:11.0%, KZN:4.8%, LP:1.5%, MP:3.7%, NW:2.4%, NC:5.5%, WC:12.9% and NAT:5.1%. (SGB = School Governing Body)
3) For 1999-2001 Gauteng reported on public schools in respect of both State- and SGB-paid educators, while for 2002 and 2003 the reporting was in respect of State-paideducators only. To bring 2003 on par with the reporting for 1999-2001, 11.0% as indicated in note 2), were added to the 40 934 public school educator numbers that hadbeen submitted. The submitted number is reflected in the centrefold.
4) L:E Ratio = Learner-to-Educator Ratio. 5) L:S Ratio = Learner-to-School Ratio.
3.1.1 Schools ((see TTable 11)
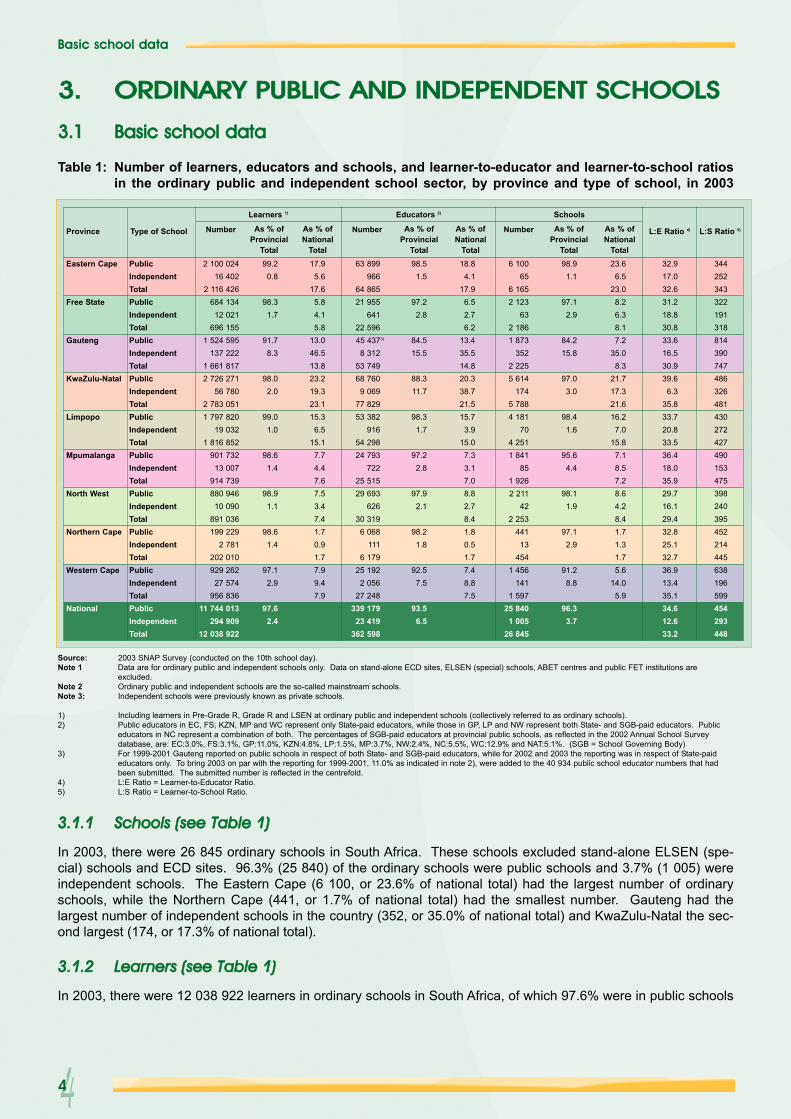
In 2003, there were 26 845 ordinary schools in South Africa. These schools excluded stand-alone ELSEN (spe-cial) schools and ECD sites. 96.3% (25 840) of the ordinary schools were public schools and 3.7% (1 005) wereindependent schools. The Eastern Cape (6 100, or 23.6% of national total) had the largest number of ordinaryschools, while the Northern Cape (441, or 1.7% of national total) had the smallest number. Gauteng had thelargest number of independent schools in the country (352, or 35.0% of national total) and KwaZulu-Natal the sec-ond largest (174, or 17.3% of national total).
3.1.2 Learners ((see TTable 11)
In 2003, there were 12 038 922 learners in ordinary schools in South Africa, of which 97.6% were in public schools
Table 1: Number of learners, educators and schools, and learner-to-educator and learner-to-school ratiosin the ordinary public and independent school sector, by province and type of school, in 2003
Province
Learners 1) Educators 2) Schools
Type of School Number As % ofProvincial
Total
As % ofNational
Total
Number As % ofProvincial
Total
As % ofNational
Total
Number L:E Ratio 4) L:S Ratio 5)As % ofProvincial
Total
As % ofNational
TotalEastern Cape
Free State
Gauteng
KwaZulu-Natal
Limpopo
Mpumalanga
North West
Northern Cape
Western Cape
National
PublicIndependentTotalPublicIndependentTotalPublicIndependentTotalPublicIndependentTotalPublicIndependentTotalPublicIndependentTotalPublicIndependentTotalPublicIndependentTotalPublicIndependentTotalPublicIndependentTotal
2 100 02416 402
2 116 426684 134
12 021696 155
1 524 595137 222
1 661 8172 726 271
56 7802 783 0511 797 820
19 0321 816 852
901 73213 007
914 739880 946
10 090891 036199 229
2 781202 010929 262
27 574956 836
11 744 013294 909
12 038 922
99.20.8
98.31.7
91.78.3
98.02.0
99.01.0
98.61.4
98.91.1
98.61.4
97.12.9
97.62.4
17.95.6
17.65.84.15.8
13.046.513.823.219.323.115.3
6.515.1
7.74.47.67.53.47.41.70.91.77.99.47.9
63 899966
64 86521 955
64122 59645 4373)
8 31253 74968 760
9 06977 82953 382
91654 29824 793
72225 51529 693
62630 319
6 068111
6 17925 192
2 05627 248
339 17923 419
362 598
98.51.5
97.22.8
84.515.5
88.311.7
98.31.7
97.22.8
97.92.1
98.21.8
92.57.5
93.56.5
18.84.1
17.96.52.76.2
13.435.514.820.338.721.515.7
3.915.0
7.33.17.08.82.78.41.80.51.77.48.87.5
6 10065
6 1652 123
632 1861 873
3522 2255 614
1745 7884 181
704 2511 841
851 9262 211
422 253
44113
4541 456
1411 597
25 8401 005
26 845
98.91.1
97.12.9
84.215.8
97.03.0
98.41.6
95.64.4
98.11.9
97.12.9
91.28.8
96.33.7
23.66.5
23.08.26.38.17.2
35.08.3
21.717.321.616.2
7.015.8
7.18.57.28.64.28.41.71.31.75.6
14.05.9
32.917.032.631.218.830.833.616.530.939.6
6.335.833.720.833.536.418.035.929.716.129.432.825.132.736.913.435.134.612.633.2
344252343322191318814390747486326481430272427490153475398240395452214445638196599454293448

Basic school data
55
and 2.4% were in independent schools. KwaZulu-Natal had the largest number of learners in ordinary schools (2 783 051, or 23.1% of national total) and the Eastern Cape the second largest (2 116 426, or 17.6% of nationaltotal).
Gauteng (137 222, or 46.5% of national total) had the largest number of learners in independent schools andKwaZulu-Natal (56 780, or 19.3% of national total) the second largest.
3.1.3 Educators ((see TTable 11)
There were 362 598 educators in ordinary schools in South Africa in 2003, of which 93.5% were in public schoolsand 6.5% were in independent schools. As indicated in footnote 3) below Table 1, the number of educatorsreported to be at public schools in Gauteng were increased by 11.0%. The raw data reported by Gauteng arereflected in the centrefold, indicating a national total of 358 095 educators. KwaZulu-Natal (77 829, or 21.5% ofnational total) had the largest number of educators in ordinary schools and the Eastern Cape (64 865, or 17.9% ofnational total) the second largest. The Northern Cape had the smallest number of educators in independentschools (111, or 0.5% of national total).
3.1.4 Distribution oof llearners, eeducators aand sschools
Figure 2: Percentage distribution of learners, educators and schools in the ordinary school sector, by province, in 2003
The mainly rural provinces tend to have proportionally more schools with fewer learners than the more urbanisedprovinces, which tend to have proportionally fewer schools with more learners, an indication of higher populationdensity. Figure 2 shows that, in 2003, the Eastern Cape, one of the more rural provinces, had 23.0% of thenational total of ordinary schools serving 17.6% of South Africa's learners, while Gauteng, the most urbanisedprovince, had 8.3% of the national total of ordinary schools serving 13.8% of the country's learners. This is alsoreflected in the learner-to-school ratio, Table 1, with the Eastern Cape having, on average, 343 learners to oneschool and Gauteng having, on average, 747 learners to one school.
0
5
10
15
20
25
Perc
ent
Learners
EC FS GP KZN LP MP NW NC WC
Educators Schools
17.6
17.9
23.0
5.8 6.2
8.1
13.8 14
.88.
3
23.1
21.5
21.6
15.1
15.0 15
.8
7.6
7.0 7.2
7.4 8.
48.
4
1.7
1.7
1.7
7.9
7.5
5.9
66
Basic school data
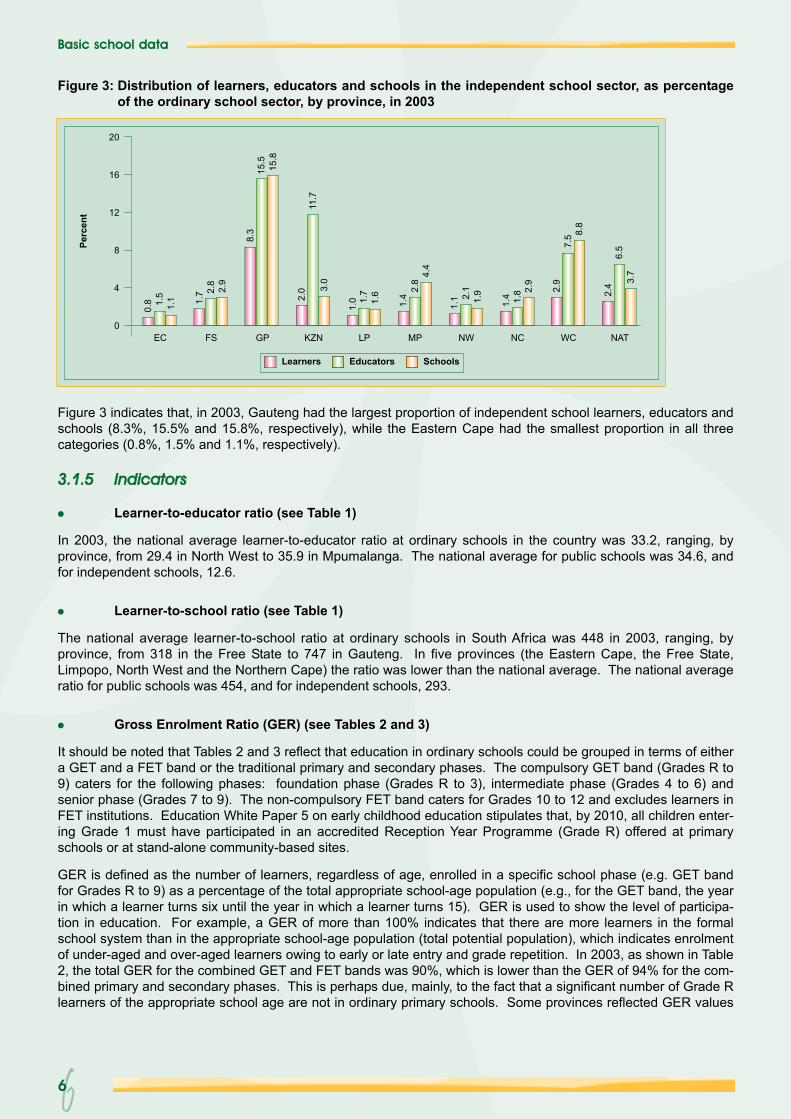
Figure 3 indicates that, in 2003, Gauteng had the largest proportion of independent school learners, educators andschools (8.3%, 15.5% and 15.8%, respectively), while the Eastern Cape had the smallest proportion in all threecategories (0.8%, 1.5% and 1.1%, respectively).
3.1.5 Indicators
● Learner-to-educator ratio (see Table 1)
In 2003, the national average learner-to-educator ratio at ordinary schools in the country was 33.2, ranging, byprovince, from 29.4 in North West to 35.9 in Mpumalanga. The national average for public schools was 34.6, andfor independent schools, 12.6.
● Learner-to-school ratio (see Table 1)
The national average learner-to-school ratio at ordinary schools in South Africa was 448 in 2003, ranging, byprovince, from 318 in the Free State to 747 in Gauteng. In five provinces (the Eastern Cape, the Free State,Limpopo, North West and the Northern Cape) the ratio was lower than the national average. The national averageratio for public schools was 454, and for independent schools, 293.
● Gross Enrolment Ratio (GER) (see Tables 2 and 3)
It should be noted that Tables 2 and 3 reflect that education in ordinary schools could be grouped in terms of eithera GET and a FET band or the traditional primary and secondary phases. The compulsory GET band (Grades R to9) caters for the following phases: foundation phase (Grades R to 3), intermediate phase (Grades 4 to 6) andsenior phase (Grades 7 to 9). The non-compulsory FET band caters for Grades 10 to 12 and excludes learners inFET institutions. Education White Paper 5 on early childhood education stipulates that, by 2010, all children enter-ing Grade 1 must have participated in an accredited Reception Year Programme (Grade R) offered at primaryschools or at stand-alone community-based sites.
GER is defined as the number of learners, regardless of age, enrolled in a specific school phase (e.g. GET bandfor Grades R to 9) as a percentage of the total appropriate school-age population (e.g., for the GET band, the yearin which a learner turns six until the year in which a learner turns 15). GER is used to show the level of participa-tion in education. For example, a GER of more than 100% indicates that there are more learners in the formalschool system than in the appropriate school-age population (total potential population), which indicates enrolmentof under-aged and over-aged learners owing to early or late entry and grade repetition. In 2003, as shown in Table2, the total GER for the combined GET and FET bands was 90%, which is lower than the GER of 94% for the com-bined primary and secondary phases. This is perhaps due, mainly, to the fact that a significant number of Grade Rlearners of the appropriate school age are not in ordinary primary schools. Some provinces reflected GER values
0
4
8
12
16
20
Perc
ent
Learners
EC FS GP KZN LP MP NCNW WC
Educators Schools
0.8 1.
51.
1 1.7 2.
82.
9
8.3
15.5
15.8
2.0
11.7
3.0
1.0 1.
71.
6
1.4
2.8
4.4
1.4 1.8 2.
9
1.1 1.
92.1 2.
97.
5 8.8
NAT
2.4
6.5
3.7
Figure 3: Distribution of learners, educators and schools in the independent school sector, as percentageof the ordinary school sector, by province, in 2003
Basic school data
77
of more than 100% for the different GER groupings. For the FET band and the secondary phase the GER washigher for females than for males, meaning that, relative to the appropriate school-age population, there were morefemale learners than male learners in the school system. It could also mean that, for a variety of reasons, femalelearners remain in the system longer than male learners.
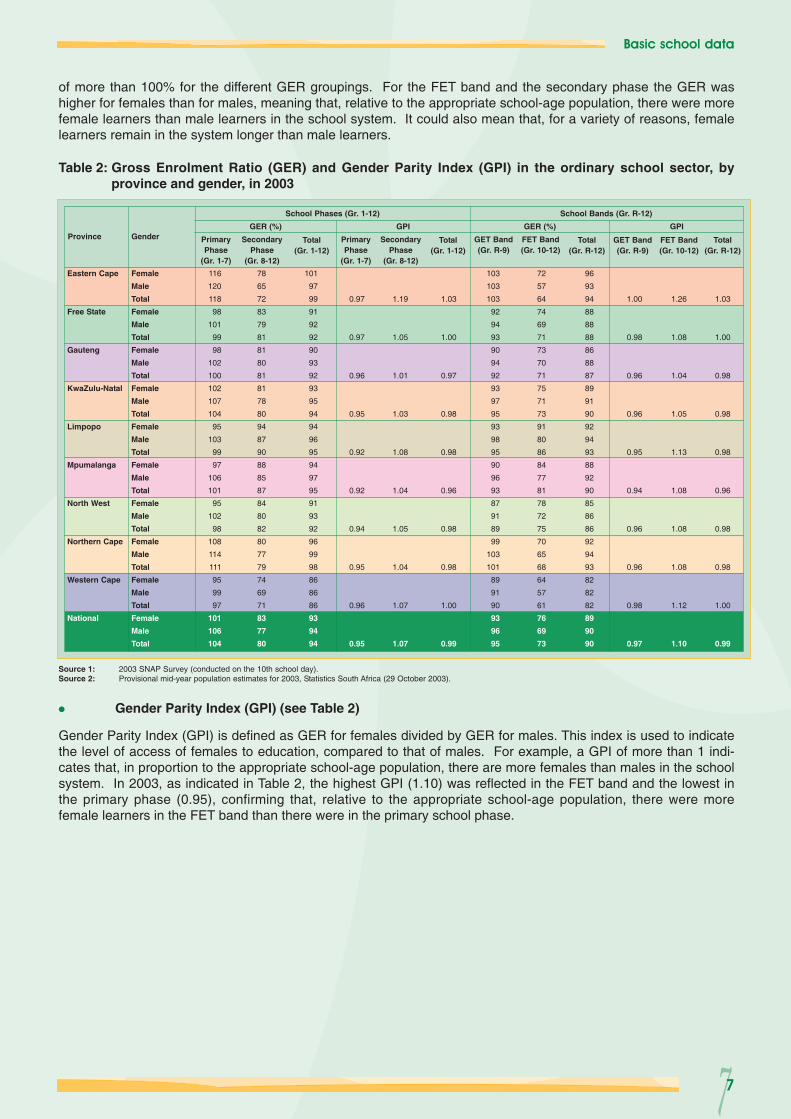
Table 2: Gross Enrolment Ratio (GER) and Gender Parity Index (GPI) in the ordinary school sector, byprovince and gender, in 2003
Source 1: 2003 SNAP Survey (conducted on the 10th school day).Source 2: Provisional mid-year population estimates for 2003, Statistics South Africa (29 October 2003).
Province Gender PrimaryPhase
(Gr. 1-7)
School Phases (Gr. 1-12)
GER (%) GPI GER (%) GPI
School Bands (Gr. R-12)
SecondaryPhase
(Gr. 8-12)
Total (Gr. 1-12)
PrimaryPhase
(Gr. 1-7)
SecondaryPhase
(Gr. 8-12)
Total (Gr. 1-12)
GET Band(Gr. R-9)
FET Band(Gr. 10-12)
Total (Gr. R-12)
GET Band(Gr. R-9)
FET Band(Gr. 10-12)
Total (Gr. R-12)
Eastern Cape
Free State
Gauteng
KwaZulu-Natal
Limpopo
Mpumalanga
North West
Northern Cape
Western Cape
National
Female
Male
Total
Female
Male
Total
Female
Male
Total
Female
Male
Total
Female
Male
Total
Female
Male
Total
Female
Male
Total
Female
Male
Total
Female
Male
Total
Female
Male
Total
116
120
118
98
101
99
98
102
100
102
107
104
95
103
99
97
106
101
95
102
98
108
114
111
95
99
97
101
106
104
78
65
72
83
79
81
81
80
81
81
78
80
94
87
90
88
85
87
84
80
82
80
77
79
74
69
71
83
77
80
101
97
99
91
92
92
90
93
92
93
95
94
94
96
95
94
97
95
91
93
92
96
99
98
86
86
86
93
94
94
0.97
0.97
0.96
0.95
0.92
0.92
0.94
0.95
0.96
0.95
1.19
1.05
1.01
1.03
1.08
1.04
1.05
1.04
1.07
1.07
1.03
1.00
0.97
0.98
0.98
0.96
0.98
0.98
1.00
0.99
103
103
103
92
94
93
90
94
92
93
97
95
93
98
95
90
96
93
87
91
89
99
103
101
89
91
90
93
96
95
72
57
64
74
69
71
73
70
71
75
71
73
91
80
86
84
77
81
78
72
75
70
65
68
64
57
61
76
69
73
96
93
94
88
88
88
86
88
87
89
91
90
92
94
93
88
92
90
85
86
86
92
94
93
82
82
82
89
90
90
1.00
0.98
0.96
0.96
0.95
0.94
0.96
0.96
0.98
0.97
1.26
1.08
1.04
1.05
1.13
1.08
1.08
1.08
1.12
1.10
1.03
1.00
0.98
0.98
0.98
0.96
0.98
0.98
1.00
0.99
● Gender Parity Index (GPI) (see Table 2)
Gender Parity Index (GPI) is defined as GER for females divided by GER for males. This index is used to indicatethe level of access of females to education, compared to that of males. For example, a GPI of more than 1 indi-cates that, in proportion to the appropriate school-age population, there are more females than males in the schoolsystem. In 2003, as indicated in Table 2, the highest GPI (1.10) was reflected in the FET band and the lowest inthe primary phase (0.95), confirming that, relative to the appropriate school-age population, there were morefemale learners in the FET band than there were in the primary school phase.

88
Basic school data
33..11..66 LLeeaarrnneerrss,, bbyy ggrraaddee aanndd sscchhooooll pphhaassee
Table 3: Number of learners in ordinary schools, by province, gender and grade, in 2003
Source: 2003 SNAP Survey (conducted on the 10th school day).Note 1: Data exclude learners at stand-alone ECD sites, ELSEN (special) schools, ABET centres and public FET institutions.Note 2: Owing to a shortage of space, the male enrolment figures for public and independent schools are intentionally omitted.
ProvinceType ofSchool
GenderPre-GradeR Phase
Pre-Gr. R Gr. R Gr. 1 Gr. 2 Gr. 3 Total Total TotalGr. 4 Gr. 5 Gr. 6 Gr. 7 Gr. 8 Gr. 9
Foundation Phase Intermediate Phase Senior Phase Total (GET Band)
General Education and Training (GET) Band
Eastern
Cape
Free State
Gauteng
KwaZulu-
Natal
Limpopo
Mpumalanga
North West
Northern
Cape
Western
Cape
National
Public
Independent
Both
Public
Independent
Both
Public
Independent
Both
Public
Independent
Both
Public
Independent
Both
Public
Independent
Both
Public
Independent
Both
Public
Independent
Both
Public
Independent
Both
Public
Independent
Both
Female
Total
Female
Total
Female
Male
Total
Female
Total
Female
Total
Female
Male
Total
Female
Total
Female
Total
Female
Male
Total
Female
Total
Female
Total
Female
Male
Total
Female
Total
Female
Total
Female
Male
Total
Female
Total
Female
Total
Female
Male
Total
Female
Total
Female
Total
Female
Male
Total
Female
Total
Female
Total
Female
Male
Total
Female
Total
Female
Total
Female
Male
Total
Female
Total
Female
Total
Female
Male
Total
2 195
4 190
280
504
2 475
2 219
4 694
1)
1)
1)
1)
1)
1)
1)
837
1 691
1 610
3 127
2 447
2 371
4 818
2 623
5 366
2 299
4 384
4 922
4 828
9 750
889
1 824
330
673
1 219
1 278
2 497
741
1 432
300
563
1 041
954
1 995
220
431
0
0
220
211
431
431
519
106
106
537
88
625
1 708
3 290
782
1 445
2 490
2 245
4 735
9 644
18 743
5 707
10 802
15 351
14 194
29 545
23 261
45 635
362
736
23 623
22 748
46 371
8 036
15 904
213
419
8 249
8 074
16 323
12 867
26 062
2 870
5 604
15 737
15 929
31 666
35 500
71 054
2 451
4 942
37 951
38 045
75 996
44 212
88 731
495
1 059
44 707
45 083
89 790
6 521
13 042
433
842
6 954
6 930
13 884
1 962
3 864
248
461
2 210
2 115
4 325
2 717
5 375
62
125
2 779
2 721
5 500
14 919
30 034
726
1 498
15 645
15 887
31 532
149 995
299 701
7 860
15 686
157 855
157 532
315 387
137 886
286 996
665
1 289
138 551
149 734
288 285
31 920
65 663
550
1 137
32 470
34 330
66 800
72 030
147 928
5 866
11 761
77 896
81 793
159 689
152 530
317 949
2 245
4 392
154 775
167 566
322 341
73 455
151 181
801
1 593
74 256
78 518
152 774
42 781
89 562
535
1 055
43 316
47 301
90 617
41 827
86 993
572
1 103
2 399
45 697
88 096
9 659
19 917
117
237
9 776
10 378
20 154
41 630
85 882
1 421
2 861
43 051
45 692
88 743
603 718
1 252 071
12 772
25 428
616 490
661 009
1 277 499
101 204
209 406
574
1 191
101 778
108 819
210 597
26 778
54 952
494
1 007
27 272
28 687
55 959
67 978
136 898
5 547
10 983
73 525
74 356
147 881
134 405
271 925
2 338
4 431
136 743
139 613
276 356
71 179
146 680
816
1 667
71 995
76 352
148 347
39 486
81 399
432
881
39 918
42 362
82 280
42 918
86 595
634
1 249
43 552
44 292
87 844
8 655
17 800
80
157
8 735
9 222
17 957
40 645
82 278
1 174
2 359
41 819
42 818
84 637
533 248
1 087 933
12 089
23 925
545 337
566 521
1 111 858
98 576
202 331
589
1 161
99 165
104 327
203 492
25 482
51 847
443
907
25 925
26 829
52 754
60 903
123 095
4 812
9 610
65 715
66 990
132 705
107 418
221 433
1 668
3 234
109 086
115 581
224 667
68 162
142 622
759
1 497
68 921
75 198
144 119
36 305
75 335
428
854
36 733
39 456
76 189
35 560
72 922
508
987
36 068
37 841
73 909
8 382
17 248
85
143
8 467
8 924
17 391
37 459
75 779
1 114
2 326
38 573
39 532
78 105
478 247
982 612
10 406
20 719
488 653
514 678
1 003 331
360 927
744 368
2 190
4 377
363 117
385 628
748 745
92 216
188 366
1 700
3 470
93 916
97 920
191 836
213 778
433 983
19 095
37 958
232 873
239 068
471 941
429 853
882 361
8 702
16 999
438 555
460 805
899 360
257 008
529 214
2 871
5 816
259 879
275 151
535 030
125 093
259 338
1 828
3 632
126 921
136 049
262 970
122 267
250 374
1 962
3 800
124 229
129 945
254 174
29 413
60 340
344
662
29 757
31 245
61 002
134 653
273 973
4 435
9 044
139 088
143 929
283 017
1 765 208
3 622 317
43 127
85 758
1 808 335
1 899 740
3 708 075
95 565
197 699
607
1 166
96 172
102 693
198 865
25 238
52 632
457
923
25 695
27 860
53 555
54 622
114 008
4 561
9 213
59 183
64 038
123 221
95 755
202 749
1 612
3 226
97 367
108 608
205 975
65 189
141 918
790
1 620
65 979
77 559
143 538
35 367
74 470
422
895
35 789
39 576
75 365
31 262
66 438
411
815
31 673
35 580
67 253
8 240
16 630
62
120
8 302
8 448
16 750
31 542
65 793
1 074
2 150
32 616
35 327
67 943
442 780
932 337
9 996
20 128
452 776
499 689
952 465
94 625
192 044
566
1 173
95 191
98 026
193 217
26 093
54 357
433
925
26 526
28 756
55 282
65 494
133 911
4 794
9 526
70 288
73 149
143 437
111 020
227 115
1 689
3 281
112 709
117 687
230 396
75 083
156 380
786
1 617
75 869
82 128
157 997
36 375
75 368
442
890
36 817
39 441
76 258
37 158
76 649
368
733
37 526
39 856
77 382
8 458
17 223
52
122
8 510
8 835
17 345
40 641
82 188
1 047
2 205
41 688
42 705
84 393
494 947
1 015 235
10 177
20 472
505 124
530 583
1 035 707
93 738
184 217
595
1 221
94 333
91 105
185 438
33 794
67 901
518
1 071
34 312
34 660
68 972
71 692
145 719
4 834
10 049
76 526
79 242
155 768
115 399
235 346
1 777
3 582
117 176
121 752
238 928
78 303
161 229
831
1 623
79 134
83 718
162 852
39 452
81 978
410
854
39 862
42 970
82 832
43 392
90 700
379
742
43 771
47 671
91 442
10 194
21 204
54
104
10 248
11 060
21 308
45 180
92 143
1 026
2 057
46 206
47 994
94 200
531 144
1 080 437
10 424
21 303
541 568
560 172
1 101 740
283 928
573 960
1 768
3 560
285 696
291 824
577 520
85 125
174 890
1 408
2 919
86 533
91 276
177 809
191 808
393 638
14 189
28 788
205 997
216 429
422 426
322 174
665 210
5 078
10 089
327 252
348 047
675 299
218 575
459 527
2 407
4 860
220 982
243 405
464 387
111 194
231 816
1 274
2 639
112 468
121 987
234 455
111 812
233 787
1 158
2 290
112 970
123 107
236 077
26 892
55 057
168
346
27 060
28 343
55 403
117 363
240 124
3 147
6 412
120 510
126 026
246 536
1 468 871
3 028 009
30 597
61 903
1 499 468
1 590 444
3 089 912
86 306
167 035
556
1 062
86 862
81 235
168 097
29 497
58 085
472
940
29 969
29 056
59 025
67 214
133 587
4 805
9 395
72 019
70 963
142 982
110 854
221 197
1 859
3 619
112 713
112 103
224 816
69 938
139 636
769
1 598
70 707
70 527
141 234
36 241
72 168
448
875
36 689
36 354
73 043
36 969
73 951
347
723
37 316
37 358
74 674
8 742
17 451
55
105
8 797
8 759
17 556
42 455
84 424
1 013
2 025
43 468
42 981
86 449
488 216
967 534
10 324
20 342
498 540
489 336
987 876
81 092
153 091
757
1 452
81 849
72 694
154 543
30 081
59 124
533
1 027
30 614
29 537
60 151
63 713
127 153
6 306
12 323
70 019
69 457
139 476
112 036
222 418
2 308
4 339
114 344
112 413
226 757
73 500
146 046
606
1 144
74 106
73 084
147 190
37 565
75 496
536
1 099
38 101
38 494
76 595
36 714
72 607
427
837
37 141
36 303
73 444
7 912
15 718
202
332
8 114
7 936
16 050
41 267
80 835
873
1 709
42 140
40 404
82 544
483 880
952 488
12 548
24 262
496 428
480 322
976 750
73 221
136 217
567
1 110
73 788
63 539
137 327
27 528
54 299
491
939
28 019
27 219
55 238
60 729
121 156
5 715
10 995
66 444
65 707
132 151
99 495
195 639
2 051
3 701
101 546
97 794
199 340
74 254
144 577
570
1 143
74 824
70 896
145 720
36 209
71 022
476
918
36 685
35 255
71 940
35 789
69 931
414
765
36 203
34 493
70 696
7 502
14 810
180
288
7 682
7 416
15 098
38 035
72 980
837
1 639
38 872
35 747
74 619
452 762
880 631
11 301
21 498
464 063
438 066
902 129
240 619
456 343
1 880
3 624
242 499
217 468
459 967
87 106
171 508
1 496
2 906
88 602
85 812
174 414
191 656
381 896
16 826
32 713
208 482
206 127
414 609
322 385
639 254
6 218
11 659
328 603
322 310
650 913
217 692
430 259
1 945
3 885
219 637
214 507
434 144
110 015
218 686
1 460
2 892
111 475
110 103
221 578
109 472
216 489
1 188
2 325
110 660
108 154
218 814
24 156
47 979
437
725
24 593
24 111
48 704
121 757
238 239
2 723
5 373
124 480
119 132
243 612
1 424 858
2 800 653
34 173
66 102
1 459 031
1 407 724
2 866 755
885 474
1 774 671
5 838
11 561
891 312
894 920
1 786 232
264 447
534 764
4 604
9 295
269 051
275 008
544 059
597 242
1 209 517
50 110
99 459
647 352
661 624
1 308 976
1 074 412
2 186 825
19 998
38 747
1 094 410
1 131 162
2 225 572
693 275
1 419 000
7 223
14 561
700 498
733 063
1 433 561
346 302
709 840
4 562
9 163
350 864
368 139
719 003
343 551
700 650
4 308
8 415
347 859
361 206
709 065
80 461
163 376
949
1 733
81 410
83 699
165 109
373 773
752 336
10 305
20 829
384 078
389 087
773 165
4 658 937
9 450 979
107 897
213 763
4 766 834
4 897 908
9 664 742

Basic school data
99
Table 3: Number of learners in ordinary schools, by province, gender and grade, in 2003 (concluded)
Basic school data
1) Free State: Pre-Grade R learners not included in the SNAP Survey.2) North West: LSEN are included in the different grades.
Province Type ofSchool Gender
Further Education and Training (FET) Band Other Total Primary (Gr. 1-7)
Total Secondary(Gr. 8-12) Total (Gr. 1-12) Grand Total
Gr. 10 Gr. 11 Gr. 12 Total LSEN Unspecified Total
EasternCape
Free State
Gauteng
KwaZulu-Natal
Limpopo
Mpumalanga
North West
NorthernCape
WesternCape
National
Public
Independent
Both
Public
Independent
Both
Public
Independent
Both
Public
Independent
Both
Public
Independent
Both
Public
Independent
Both
Public
Independent
Both
Public
Independent
Both
Public
Independent
Both
Public
Independent
Both
FemaleTotalFemaleTotalFemaleMaleTotalFemaleTotalFemaleTotalFemaleMaleTotalFemaleTotalFemaleTotalFemaleMaleTotalFemaleTotalFemaleTotalFemaleMaleTotalFemaleTotalFemaleTotalFemaleMaleTotalFemaleTotalFemaleTotalFemaleMaleTotalFemaleTotalFemaleTotalFemaleMaleTotalFemaleTotalFemaleTotalFemaleMaleTotalFemaleTotalFemaleTotalFemaleMaleTotalFemaleTotalFemaleTotalFemaleMaleTotal
82 349148 915
8271 549
83 17667 288
150 46435 80569 825
508958
36 31334 47070 78374 198
146 3956 079
11 63180 27777 749
158 026119 310236 683
2 2994 112
121 609119 186240 795102 156196 205
6611 259
102 81794 647
197 46445 09188 037
5531 035
45 64443 42889 07243 96086 882
370680
44 33043 23287 562
9 30718 539
251383
9 5589 364
18 92243 19281 528
7741 598
43 96639 16083 126
555 3681 073 009
12 32223 205
567 690528 524
1 096 214
58 294102 905
7361 327
59 03045 202
104 23221 30740 405
496920
21 80319 52241 32552 04597 577
6 01511 28658 06050 803
108 86396 974
183 2052 2393 985
99 21387 977
187 19060 911
111 457569
1 07461 48051 051
112 53132 60861 259
5781 036
33 18629 10962 29530 47356 825
320580
30 79326 61257 405
5 0419 417
186298
5 2274 4889 715
28 61251 588
7961 576
29 40823 75653 164
386 265714 638
11 93522 082
398 200338 520736 720
38 49168 460
7951 450
39 28630 62469 91012 53523 957
385795
12 92011 83224 75235 72765 707
5 94510 94641 67234 98176 65354 994
102 3572 6274 557
57 62149 293
106 91437 38968 637
7771 370
38 16631 84170 00722 09440 738
6831 204
22 77719 16541 94219 31836 158
247415
19 56517 00836 573
3 3436 378
137259
3 4803 1576 637
22 44339 656
9422 025
23 38518 29641 681
246 334452 048
12 53823 021
258 872216 197475 069
179 134320 280
2 3584 326
181 492143 114324 606
69 647134 187
1 3892 673
71 03665 824
136 860161 970309 679
18 03933 863
180 009163 533343 542271 278522 245
7 16512 654
278 443256 456534 899200 456376 299
2 0073 703
202 463177 539380 002
99 793190 034
1 8143 275
101 60791 702
193 30993 751
179 865937
1 67594 68886 852
181 54017 69134 334
574940
18 26517 00935 27494 247
172 7722 5125 199
96 75981 212
177 9711 187 9672 239 695
36 79568 308
1 224 7621 083 2412 308 003
299808
01
299510809
6 08515 183
1953
6 1049 132
15 2361 2003 527
150374
1 3502 5513 9014 361
11 652332926
4 6937 885
12 578135401
2035
155281436158426
06
158274432
2)2)2)2)2)2)2)
4511 000
22
453549
1 002270863
2 8
272599871
12 95933 860
5251 405
13 48421 781
35 265
3775
010374885
0000000
121181190399311269580
85183
2269
107145252172296
3660
208148356
00000000000000000000001
6193613394
415736309631724643
1 367
336883
011
336558894
6 08515 183
1953
6 1049 132
15 2361 3213 708
340773
1 6612 8204 4814 446
11 835354995
4 8008 030
12 830307697
5695
363429792158426
06
158274432
0000000
4511 000
22
453549
1 002270864
63101333632965
13 37434 596
8342 036
14 20822 42436 632
707 9001 439 728
4 1528 263
712 052735 939
1 447 991198 802405 437
3 3676 910
202 169210 178412 347459 933935 146
35 21970 537
495 152510 531
1 005 683827 381
1 697 71413 18825 765
840 569882 910
1 723 479501 309
1 039 6465 552
11 215506 861544 000
1 050 861266 007550 280
3 1176 304
269 124287 460556 584269 086554 248
3 2196 352
272 305288 295560 600
62 330127 473
505988
62 83565 626
128 461279 552568 487
7 86915 983
287 421297 049584 470
3 572 3007 318 159
76 188152 317
3 648 4883 821 9887 470 476
333 447609 588
3 6826 888
337 129279 347616 476127 256247 610
2 4134 639
129 669122 580252 249286 412557 988
30 06057 181
316 472298 697615 169482 809940 302
11 52420 694
494 333466 663960 996348 210666 922
3 1835 990
351 393321 519672 912173 567336 552
2 8265 292
176 393165 451341 844166 254322 403
1 7783 277
168 032157 648325 680
33 10564 862
9561 560
34 06132 36166 422
173 549326 587
4 2228 547
177 771157 363335 134
2 124 6094 072 814
60 644114 068
2 185 2532 001 6294 186 882
1 041 3472 049 316
7 83415 151
1 049 1811 015 2862 064 467
326 058653 047
5 78011 549
331 838332 758664 596746 345
1 493 13465 279
127 718811 624809 228
1 620 8521 310 1902 638 016
24 71246 459
1 334 9021 349 5732 684 475
849 5191 706 568
8 73517 205
858 254865 519
1 723 773439 574886 832
5 94311 596
445 517452 911898 428435 340876 651
4 9979 629
440 337445 943886 280
95 435192 335
1 4612 548
96 89697 987
194 883453 101895 074
12 09124 530
465 192454 412919 604
5 696 90911 390 973
136 832266 385
5 833 7415 823 617
11 657 358
1 067 1392 100 024
8 47616 402
1 075 6151 040 8112 116 426
340 179684 134
6 01212 021
346 191349 964696 155761 370
1 524 59570 099
137 222831 469830 348
1 661 8171 352 7592 726 271
29 81656 780
1 382 5751 400 4762 783 051
894 9271 797 820
9 61619 032
904 543912 309
1 816 852446 994901 732
6 67613 007
453 670461 069914 739437 522880 946
5 24510 090
442 767448 269891 036
99 034199 229
1 6312 781
100 665101 345202 010469 998929 262
13 66227 574
483 660473 176956 836
5 869 92211 744 013
151 233294 909
6 021 1556 017 767
12 038 922
Basic school data
1010
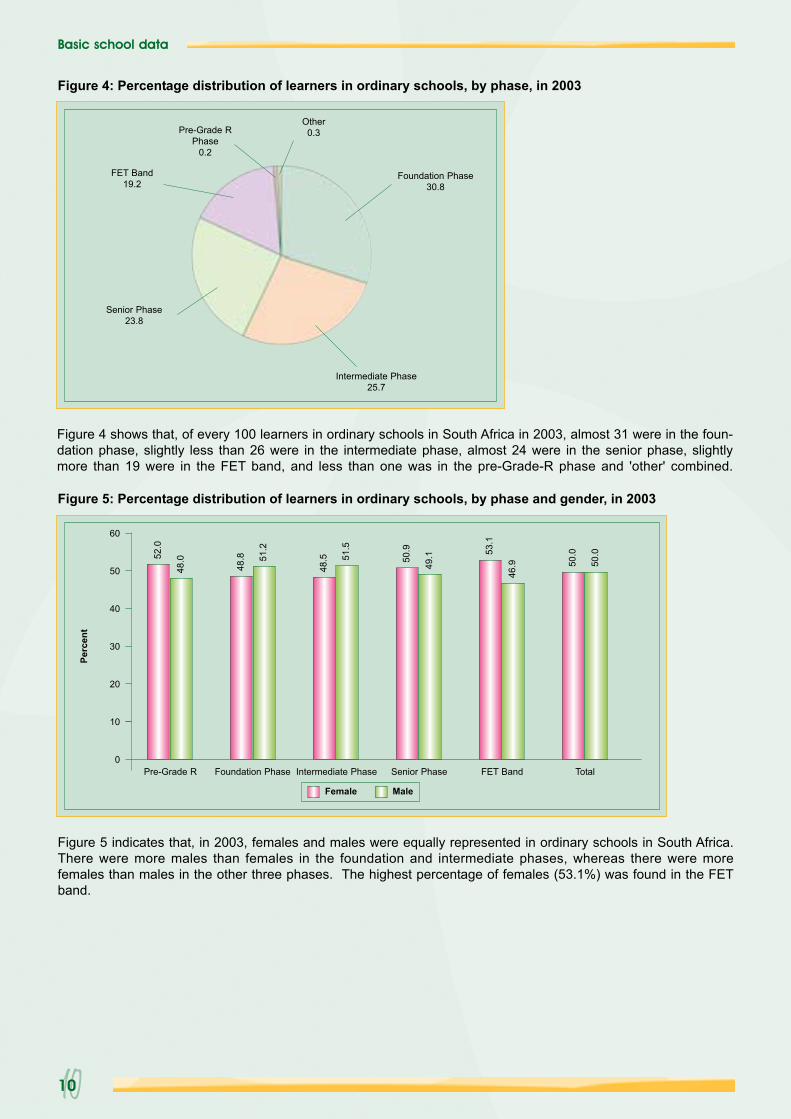
Figure 5 indicates that, in 2003, females and males were equally represented in ordinary schools in South Africa.There were more males than females in the foundation and intermediate phases, whereas there were morefemales than males in the other three phases. The highest percentage of females (53.1%) was found in the FETband.
Figure 4 shows that, of every 100 learners in ordinary schools in South Africa in 2003, almost 31 were in the foun-dation phase, slightly less than 26 were in the intermediate phase, almost 24 were in the senior phase, slightlymore than 19 were in the FET band, and less than one was in the pre-Grade-R phase and 'other' combined.
Intermediate Phase25.7
Foundation Phase30.8
Other0.3
FET Band19.2
Senior Phase23.8
Pre-Grade RPhase
0.2
Figure 4: Percentage distribution of learners in ordinary schools, by phase, in 2003
Figure 5: Percentage distribution of learners in ordinary schools, by phase and gender, in 2003
0
10
20
30
40
50
60
Perc
ent
Female
Pre-Grade R
Male
52.0
48.0
Foundation Phase
48.8 51
.2
Intermediate Phase
48.5 51
.5
Senior Phase
50.9
49.1
FET Band
53.1
46.9
Total
50.0
50.0

Basic school data
1111
Figure 6: Percentage distribution of female learners in ordinary schools, by grade, in 2003
0
10
20
30
40
50
60
Perc
ent
Pre-Gr. R
52.0
Gr. R
50.1
Gr. 1
48.3
Gr. 2
49.0
Gr. 3
48.7
Gr. 4
47.5
Gr. 548
.8Gr. 6
49.2
Gr. 7
50.5
Gr. 8
50.8
Gr. 9
51.4
Gr. 10
51.8
Gr. 11
54.1
Gr. 12
54.5
LSEN
38.2
0
5
10
15
20
25
40
35
30
Perc
ent
Pre-Gr. R
36.6
Gr. R
5.0
Gr. 1
2.0
Gr. 2
2.2
Gr. 3
2.1
Gr. 4
2.1
Gr. 5
2.0
Gr. 6
1.9
Gr. 7
2.1
Gr. 8
2.5
Gr. 9
2.4
Gr. 10
2.1
Gr. 11
3.0
Gr. 12
4.8
LSEN
4.0
Total
2.4
Figure 7: Distribution of learners in independent schools as percentage of ordinary school learners, by grade, in 2003
In 2003, as indicated in Figure 6, there were fewer females than males in Grades 1 to 6, whilst the opposite wastrue for Grades 7 to 12. Grade 12 females (54.5%) accounted for the highest female enrolment in all the grades.The lowest female enrolment was for LSEN (38.2%).
Figure 7 shows that, in 2003, the percentage of learners in independent schools in the ordinary school system wasthe highest for Pre-Grade R (36.6%), the second highest for Grade R (5.0%), and the lowest for Grade 6 (1.9%).The total national average of learners in independent schools was 2.4%. These independent Pre-Grade-R schoolscould include the community-based sites and privately owned ECD sites.

Basic school data
1212
0
200 000
400 000
600 000
800 000
1 000 000
1 200 000
1 400 000
Gr. R
315
387
935
008
Gr. 1
1 27
7 49
998
6 78
8
Gr. 2
1 11
1 85
895
9 89
6
Gr. 3
1 00
3 33
11
055
053
Gr. 4
952
465 1 09
9 09
0
Gr. 5
1 03
5 70
71
085
965
Gr. 61
101
740
1 00
3 69
1
Gr. 7
987
876
1 01
3 24
5
Gr. 8
976
750
991
744
Gr. 9
902
129 1 06
0 60
5
Gr. 10
1 09
6 21
41
076
947
Gr. 11
736
720
1 04
2 93
9
Gr. 12
475
069
1 05
9 41
7
Figure 8: Number of learners in ordinary schools, by grade, compared with the appropriate age group inthe population, in 2003
Figure 9: Percentage distribution of learners in ordinary schools, by grade, Pre-Grade R and LSEN, in 2003
PopulationLearners
Figure 8 shows that, when enrolment in 2003 is compared with the appropriate school-age population for eachgrade (taking the year in which a learner turns six as the appropriate age for entry into Grade R), four grades(Grades 1, 2, 6 and 10) were over-enrolled, which probably indicates enrolment of over-aged and under-agedlearners. This could also indicate that we are reaching universal access to education at compulsory school level.From Grade 11 to Grade 12 there was a steady increase in the degree of under-enrolment. The highest under-enrolment was experienced in Grades R and 12, which reflected an enrolment of 33.7% and 44.8%, respectively,of the appropriate school-age population. It must be noted that some learners who were at the FET band agewere also enrolled in the FET institutions and that others attended ABET classes, as this is not a compulsoryschooling phase. Therefore, the data in this case do not necessarily indicate under-enrolment but merely reflectthe fact that about half of the population of this age was not in the formal schooling system.
Pre-Gr. R0.2
LSEN0.3
Gr. R2.6
Gr. 110.6
Gr. 29.2
Gr. 38.3
Gr. 47.9
Gr. 58.6Gr. 6
9.2
Gr. 78.2
Gr. 88.1
Gr. 97.5
Gr. 109.1
Gr. 116.1
Gr. 123.9
Figure 9 shows that, of every 100 learners in ordinary schools in 2003, almost 11 were enrolled in Grade 1 andalmost four were enrolled in Grade 12.
Num
ber
Source: Provisional mid-year population estimates for 2003, Statistics South Africa (29 October 2003).

Basic school data
1313
3.1.7 Comparison between 1999, 2000, 2001, 2002 and 2003
● Learners, educators and schools (see Table 4)
Table 4: Comparing learners, educators and schools in the ordinary school sector, by province, from 1999to 2003
Source: 1999-2003 SNAP Surveys (conducted on the 10th school day).Note 1: Percentages with a negative sign denote a decrease.Note 2: Public educators - see footnote 2) below Table 1 for provinces that did not include SGB-paid public school educators for the period 1999 to 2003.
1) Data for Gauteng educators were adjusted as indicated in footnote 3) below Table 1.
Table 4 shows that, in comparing data for the years 1999 to 2003 in respect of learners, educators and schools, anet decrease of 2.2%, 0.8% and 2.2%, respectively, is reflected. The largest percentage decrease in respect oflearners, educators and schools occurred in the Free State (10.8%, 12.9% and 23.9%, respectively).
● Learners in independent schools as a percentage of all learners (see Table 5)
Table 5: Comparing the share of learners in independent schools, learner-to-educator ratio and learner-to-school ratio in the ordinary school sector, by province, from 1999 to 2003
Table 5 shows that, from 1999 to 2003, the number of independent learners in ordinary schools nationallyincreased from 1.8% to 2.4%, a net increase of 33.3%. The largest proportion of independent learners was in
Source: 1999-2003 SNAP Surveys (conducted on the 10th school day).Note 1: Percentages with a negative sign denote a decrease.
1) Data for Gauteng educators were adjusted as indicated in footnote 3) below Table 1.
Province
Eastern CapeFree StateGautengKwaZulu-NatalLimpopoMpumalangaNorth WestNorthern CapeWestern CapeNational
2 324 684780 170
1 569 4232 772 2251 823 017
930 624946 160204 238963 358
12 313 899
2 138 861764 755
1 554 4952 663 3601 845 265
911 779909 906198 650916 384
11 903 455
2 033 832716 021
1 561 3592 698 4531 816 189
903 997893 144197 101918 030
11 738 126
2 072 054705 368
1 617 0172 729 8341 839 079
914 353897 342196 731945 239
11 917 017
2 116 426696 155
1 661 8172 783 0511 816 852
914 739891 036202 010956 836
12 038 922
-9.0-10.8
5.90.4
-0.3-1.7-5.8-1.1-0.7-2.2
64 08025 94053 73974 71953 71225 85631 376
6 77329 252
365 447
66 81423 32050 25874 66955 13926 74130 024
6 55629 822
363 343
61 30122 95650 87674 24057 51124 51329 234
6 35927 211
354 201
65 35522 51752 60174 50056 26325 14130 035
6 48427 259
360 155
64 86522 59653 7491)
77 82954 29825 51530 319
6 17927 248
362 598
1.2-12.9
0.04.21.1
-1.3-3.4-8.8-6.9-0.8
6 1902 8722 2145 7164 0711 9272 325
4931 653
27 461
6 2172 5992 2705 8914 1982 1152 330
5101 630
27 760
6 0872 4592 2135 7514 6311 9262 311
4781 602
27 458
6 1912 3432 3315 7224 7631 9342 292
4761 595
27 647
6 1652 1862 2255 7884 2511 9262 253
4541 597
26 845
-0.4-23.9
0.51.34.4
-0.1-3.1-7.9-3.4-2.2
1999 2000 2001 2002 2003 % NetChange (99-03)
A B C D E (E-A)/A
1999 2000 2001 2002 2003 % NetChange (99-03)
F G H I J (J-F)/F
1999 2000 2001 2002 2003 % NetChange (99-03)
K L M N O (O-K)/K
Learners Educators Schools
Province
Eastern CapeFree StateGautengKwaZulu-NatalLimpopoMpumalangaNorth WestNorthern CapeWestern CapeNational
0.31.47.11.40.60.91.11.12.51.8
0.42.67.61.60.81.40.81.23.12.2
0.31.77.51.41.21.11.11.43.22.1
0.31.78.31.81.21.21.11.43.22.3
0.81.78.32.01.01.41.11.42.92.4
166.721.416.942.966.755.6
0.027.316.033.3
36.330.129.237.133.936.030.230.232.933.7
32.032.830.935.733.534.130.330.330.732.8
33.231.230.736.331.636.930.631.033.733.1
31.731.330.936.632.736.429.930.334.733.1
32.630.830.91)
35.833.535.929.432.735.133.2
-10.22.35.8
-3.5-1.2-0.3-2.68.36.7
-1.5
376272709485448483407414583448
344294685452440431391390562429
334291706469392469386412573427
335301694477386473392413593431
343318747481427475395445599448
-8.816.9
5.4-0.8-4.7-1.7-2.97.52.70.0
1999 2000 2001 2002 2003 % NetChange (99-03)
A B C D E (E-A)/A
1999 2000 2001 2002 2003 % NetChange (99-03)
F G H I J (J-F)/F
1999 2000 2001 2002 2003 % NetChange (99-03)
K L M N O (O-K)/K
Learners in independent schools as % of all learners Learner-to-Educator Ratio Learner-to-School Ratio

Basic school data
1414
Gauteng, increasing from 7.1% in 1999 to 8.3% in 2003, a net increase of 16.9%. The highest net increasebetween 1999 and 2003, namely 166.7%, occurred in the Eastern Cape.
● Learner-to-educator ratio (see Table 5)
As reflected in Table 5, from 1999 to 2003, the national average learner-to-educator ratio at ordinary schools inSouth Africa decreased from 33.7 to 33.2, a net decrease of 1.5%. Five provinces (the Eastern Cape, KwaZulu-Natal, Limpopo, Mpumalanga, and North West) showed a net decrease from 1999 to 2003, while the NorthernCape indicated the highest net increase, namely, 8.3%.
● Learner-to-school ratio (see Table 5)
Table 5 shows that, from 1999 to 2003, the national average learner-to-school ratio at ordinary schools in the coun-try remained at 448 learners per school. From 1999 to 2003, the Eastern Cape showed the highest net decrease(8.8%), followed by Limpopo (4.7%). The school backlogs were also higher in these two provinces than in otherprovinces. The Free State showed the highest increase from 1999 to 2003 (16.9%). This could be due to therationalisation of small schools and the closure of small farm schools in the province.
● Gross Enrolment Ratio (GER) (see Table 6)
Source 1: 1999-2003 SNAP Surveys (conducted on the 10th school day).Source 2: Published mid-year population estimates for 2001-2002 and, provisional, mid-year population estimates for 1999, 2000 and 2003, Statistics South Africa (29 October 2003).Note 1: Percentages with a negative sign denote a decrease.Note 2: Although two successive years might have the same value owing to rounding off, a net change could still have been reported.
Table 6: Comparing Gross Enrolment Ratio (GER) and Gender Parity Index (GPI) in the ordinary schoolsector, by province, from 1999 to 2003
117111114109108109101101101105107106103102103106107107102102102
929393969495
105105105
106102104102103102
959796979998
102102102101103102
979897929292929191999999
99969897989792949396989797989799
101100
949594939393898889969696
1019799949494919392949795969797979998939494949594878787959595
1019799919292909392939594949695949795919392969998868686939494
-13.7-12.6-13.2-16.5-14.8-15.6-10.9
-7.9-8.9
-11.4-11.2-11.3-8.7-5.9-7.8
-11.3-9.3
-11.2-10.8
-8.8-9.84.36.55.4
-10.4-8.5-9.5
-11.4-10.5-10.5
1.05
1.00
1.00
0.98
1.01
0.99
1.00
0.99
1.02
1.01
1.03
0.99
0.98
0.98
0.99
0.98
0.99
0.99
1.01
1.00
1.04
1.00
0.98
0.97
0.99
0.98
0.98
0.99
1.00
0.99
1.03
1.00
0.97
0.98
0.98
0.96
0.98
0.98
1.00
0.99
-1.9
0.0
-3.0
0.0
-3.0
-3.0
-2.0
-1.0
-2.0
-2.0
109103106103102103
93939398
10099979696
100101100
959595878787918990989898
969394888888868887899190929493889290858686929493828282899090
-11.9-9.7
-11.3-14.6-13.7-14.6
-7.5-5.4-6.5-9.2-9.0-9.1-5.2-2.1-3.1
-12.0-8.9
-10.0-10.5
-9.5-9.55.78.06.9
-9.9-7.9-8.9-9.2-8.2-8.2
1.06
1.01
1.00
0.98
1.01
0.99
1.00
1.00
1.02
1.00
1.03
1.00
0.98
0.98
0.98
0.96
0.98
0.98
1.00
0.99
-2.8
-1.0
-2.0
0.0
-3.0
-3.0
-2.0
-2.0
-2.0
-1.0
Eastern Cape
Free State
Gauteng
KwaZulu-Natal
Limpopo
Mpumalanga
North West
Northern Cape
Western Cape
National
FemaleMaleTotalFemaleMaleTotalFemaleMaleTotalFemaleMaleTotalFemaleMaleTotalFemaleMaleTotalFemaleMaleTotalFemaleMaleTotalFemaleMaleTotalFemaleMaleTotal
Province Gender 1999 2000 2001 2002 2003 % NetChange(1999-2003)
1999 2000 2001 2002 2003 % NetChange(1999-2003)
1999 2003 % NetChange(1999-2003)
1999 2003 % NetChange(1999-2003)
A B C D E (E-A)/A F G H I J (J-F)/F K L (L-K)/K M N (N-M)/M
Primary and Secondary (Gr. 1-12) School Bands (Gr. R-12)
GER (%) GPI GER (%) GPI
1.04
1.00
0.99
0.98
1.00
0.99
0.99
0.99
1.01
1.00

Region and district data
1515
Table 6 shows that the total national average GER (Grades R to 12) decreased from 98% to 90% between 1999and 2003, a net decrease of 8.2%. Although the inclusion of Grade R had a negative impact on the GER valuesfor these years, it is important that we start monitoring enrolment in Grade R, seeing that, according to EducationWhite Paper 5, the target year for universal access is 2010. If one were to consider only Grades 1 to 12, and ifone also used the latest mid-year population estimates, one would see that the total national average GERchanged to 105%, 99%, 96%, 95% and 94% for 1999, 2000, 2001, 2002 and 2003 respectively, which is, on aver-age, almost 6% per year higher than the GER (Grades R to 12). All the provinces except the Northern Capeshowed a decrease in both GER combinations from 1999 to 2003. The highest percentage net change for GER(Grades 1 to 12) was shown in the Free State, with a 15.6% decrease, followed by a 13.2% decrease in the East-ern Cape.
● Gender Parity Index (GPI) (see Table 6)
Table 6 shows that, from 1999 to 2003, the national average GPI in Grades 1 to 12 decreased from 1.01 to 0.99, anet decrease of 2.0%, while the net decrease in Grades R to 12 was 1.0%. Only three provinces (KwaZulu-Natal,Mpumalanga and the Northern Cape) showed GPI ratios of less than 1.00 for all five years in Grades 1 to 12, indi-cating that, in proportion to the appropriate school-age population, there were fewer female learners than malelearners in the ordinary school system.
33..22 RReeggiioonn aanndd ddiissttrriicctt ddaattaa oonn lleeaarrnneerrss,, eedduuccaattoorrss aanndd sscchhoooollss
Table 7: Number of learners, educators and schools in the ordinary school sector, by province, region anddistrict, in 2003
Source: 2003 SNAP Survey (conducted on the 10th school day).Note 1: Data are for ordinary schools only and include learners in Pre-Grade R, Grade R and LSEN at these schools. Data excludes learners, educators and institutions associated
with stand-alone ECD sites and ELSEN (special) schools.Note 2: n.a. = not applicable.Note 3: Owing to a shortage of space, the male figures for learners and educators are intentionally omitted.
1) Free State: Pre-grade R learners not included in the SNAP Survey.
Region DistrictPre-Gr. R Gr. R Primary
(Gr. 1-7)Secondary(Gr. 8-12) LSEN Unspecified Female
Total Total Female Total Public Independent Total
Learner Enrolment Educators Schools
Eastern Capen.a.n.a.n.a.n.a.n.a.n.a.n.a.n.a.n.a.n.a.n.a.n.a.n.a.n.a.n.a.n.a.n.a.n.a.n.a.n.a.n.a.n.a.n.a.n.a.n.a.TotalFree Staten.a.n.a.n.a.n.a.n.a.Total
BizanaButterworthCofimvabaCradockEast LondonEngcoboFort BeaufortGraaff-ReinetGrahamstownIdutywaKing William's Town Lady FrereLibodeLusikisikiMalutiMt FletcherMt FrerePort ElizabethQueenstownQumbuSterkspruitUitenhageUmtataUmzimkuluUnspecified
LjweleputswaMotheoNorthern Free StateThabo MofutsanyanaXhariep
81143280
15490140
730
143266
26111150512
67126414683
88167126
66421
6739
4 694
1)1)1)1)1)1)
2 2032 0911 5861 0472 9311 581
985724898
2 6341 5781 0253 4964 1661 1751 0911 5234 2781 2401 9231 6902 3912 6681 437
1046 371
2 1425 0901 2137 070
80816 323
78 56878 20355 01416 09082 41854 46329 43716 96018 92777 79372 53431 935
128 894112 99046 94238 76354 480
108 97541 11657 08543 51251 233
103 46347 772
4241 447 991
94 609110 95667 747
119 62919 406
412 347
21 11232 73421 343
8 96155 13717 54117 169
8 35712 19122 66746 34413 93136 08331 49317 97913 92920 73667 87523 64520 29920 72127 53042 20316 496
0616 476
54 76167 37145 96775 530
8 620252 249
00
235
1580
3016
10
3200000
21373
380
1094
080
809
4 5414 9082 4001 9961 391
15 236
051
000060
15010000000002
10000
85
000000
53 26057 55639 15812 94971 03438 23823 46012 87616 06554 09359 02923 13788 27578 08333 35427 17339 29691 48332 62039 53333 73240 47176 99733 514
2291 075 615
78 19993 38758 272
101 24215 091
346 191
101 964113 22278 24626 118
141 13473 72547 70026 05732 175
103 360120 515
47 002168 623149 161
66 16353 90977 174
182 18466 12779 47466 06181 324
148 75565 780
4732 116 426
156 053188 325117 327204 225
30 225696 155
1 8842 5901 742
6102 9921 4951 237
528859
2 1612 9581 0433 1772 8531 5581 2261 8023 9171 4321 7721 4131 7532 9631 357
1345 335
3 2663 6332 4514 168
67414 192
2 6203 7102 511
8964 2612 2011 875
8681 2563 0554 3591 6054 2933 7992 2121 7242 5285 6292 1222 4242 1912 6424 1801 876
2864 865
5 0795 8243 9846 6961 013
22 596
210396290101318228276107117353474179418351211197249268194258222177337169
6 100
483368428716128
2 123
0400
12100802010002
132134804
65
11201117
463
210400290101330229276107125353476179419351211197251281196259225181345169
46 165
494388439733132
2 186

1616
Region and district data
Table 7: Number of learners, educators and schools in the ordinary school sector, by province, region anddistrict, in 2003 (continued)
Region DistrictPre-Gr. R Gr. R Primary
(Gr. 1-7)Secondary(Gr. 8-12) LSEN Unspecified Female
Total Total Female Total Public Independent Total
Learner Enrolment Educators Schools
Gauteng 2)
n.a.n.a.n.a.n.a.n.a.n.a.n.a.n.a.n.a.n.a.n.a.n.a.TotalKwaZulu-NatalDurban South
Empangeni
Ladysmith
North Durban
Pietermaritzburg
Port Shepstone
Ulundi
Vryheid
TotalLimpopoBushbuckridge
Central
East Rand EastEast Rand WestGauteng North Gauteng WestJohannesburg East Johannesburg NorthJohannesburg SouthJohannesburg WestSedibeng East Sedibeng WestTshwane NorthTshwane South
CamperdownChatsworthPinetownUmbumbuluUmlazi NorthUmlazi SouthEshoweHlabisaLower TugelaLower UmfoloziMthunziniDannhauserEstcourtMnambithiMsingaNewcastleCity of DurbanInandaKwa MashuMaphumuloNdwedwePhoenixMidlandsPholelaPietermaritzburgUmvotiVulindlelaHardingIxopoSayidiScottburghIngwavumaMahlabathiniNkandlaNongomaPongolaUbomboBhekuzuluDundeeNquthuPaulpietersburg
AcornhoekBushbuckridgeMkhuhluBochumKonekwena
244537157324
1 013901448291103191150459
4 818
1081 260
636372
0181108
30233468
950
257291
42425
1 189352047
101205562
22433319161177
14243103330
70236
4692
103182158278118
9 750
8651198569
3 5395 3791 1312 1382 1573 1455 0452 1111 3301 4171 5782 696
31 666
1 7372 8982 3062 923
8881 2912 829
910787
42092 8811 4663 3932 1021 3941 8152 7931 5091 7421 1961 1502 4211 5511 0681 0762 437
951681997
1 3081 3064 8082 9453 1682 7071 5562 077
623262781
1 05475 996
3 7682 5183 9203 2792 050
116 573170 461
17 46773 26974 82169 082
153 36150 63535 53366 96779 73597 779
1 005 683
39 16642 97152 88354 41527 11127 82051 91156 38830 12276 13946 79835 35765 88259 09243 14937 93259 54338 13437 04235 73731 40836 17338 23427 49143 59949 21936 76938 17534 67053 22547 91359 32643 36542 34946 63323 92535 88437 56010 36046 73322 876
1 723 479
38 35726 01836 27243 899
2 434
68 396100 152
6 46542 03641 31044 909
100 07629 48720 93546 28750 83464 282
615 169
19 88528 91026 40931 35516 95421 19126 58428 84014 96240 98726 73720 70836 67833 99117 22425 96342 41118 89824 16920 04518 50925 75825 64813 47026 85025 07222 02816 97219 05030 15425 14922 03524 22617 64528 52114 08718 25119 574
6 55328 01210 531
960 996
24 66516 30721 84326 20618 108
304448
21371433349602126179270285513
3 901
45715433
431538
1440
123229
9081
135174
0886
2 2880
1210
60701746
01 045
111165465528673
1 9431272
105000
136146
0110
12 578
33
4330
003
1972
16955
0182
05525
580
2710
09000000
12800500
2700000
210
223000000000000000
252
730000
93 931139 602
12 62558 65960 57760 008
129 13940 81929 10057 60466 70582 700
831 469
29 33738 212
41 08744 35621 66124 91840 09142 62723 08060 64838 39228 12452 48247 77930 94233 16855 03228 93030 94428 36024 85933 01433 06120 75436 26538 37729 10028 63127 31043 13238 14443 12735 20031 93439 17519 64328 27228 825
8 62638 01016 946
1 382 575
33 67222 66531 08236 00721 839
189 056276 977
25 244118 157119 806118 555259 587
82 65058 262
115 132132 637165 754
1 661 817
60 96876 76482 66789 11744 96850 52181 57686 16846 227
122 03276 72957 612
106 34595 65561 80967 021
108 25158 57663 09457 02551 22865 25866 76242 05173 02577 16160 07456 47055 25985 60376 41486 51170 67863 50377 90739 66056 31558 07517 47975 80434 689
2 783 051
66 95244 89762 09773 47244 574
3 7865 701
5272 2463 3132 7445 1091 7541 2312 1032 6723 639
34 825
1 3411 4591 9731 698
824893
1 4371 454
8742 2281 313
9631 6571 630
9811 1712 7061 0361 0821 023
9461 1422 764
7052 0961 5961 1711 071
9581 5101 3381 2071 133
9841 025
5841 1691 101
3001 366
59252 501
1 0941 1081 0241 088
835
5 2757 848
7643 2654 4233 7517 5872 4151 7803 1433 8995 096
49 246
2 1852 1922 6522 3361 0941 2652 0902 0991 4213 0181 8541 4962 6422 4501 5831 6943 8831 4921 4961 5171 3331 7844 8641 0692 9792 3041 5931 5211 3792 1951 9521 8391 6851 5541 5571 0341 8371 540
4292 048
87477 829
1 9581 8531 7922 1001 480
194262
5113911013829911594
144151176
1 873
11111499
1935359
172185
80222134
98223211152
89124
7284
142135
90128113109222158130148154165184152174159
89166171
48175127
5 614
118108101195141
254313
95841631615
51945
352
31013
1013268206215
2621035
220
196260730000207000
174
20302
219305
64148168179362131109149170221
2 225
114124112194
5360
175187
86230136
98229213153
94150
7485
142138
95150113128228160136148161168184152174159
91166178
48175127
5 788
120108104195143
Source: 2003 SNAP Survey (conducted on the 10th school day).Note 1: Data are for ordinary schools only and include learners in Pre-Grade R, Grade R and LSEN at these schools. Data excludes learners, educators and institutions associated
with stand-alone ECD sites and ELSEN (special) schools.Note 2: n.a. = not applicable.Note 3: Owing to a shortage of space, the male figures for learners and educators are intentionally omitted.
2) The Gauteng public school educators do not tally with Table 1. See footnote 3) of Table 1.
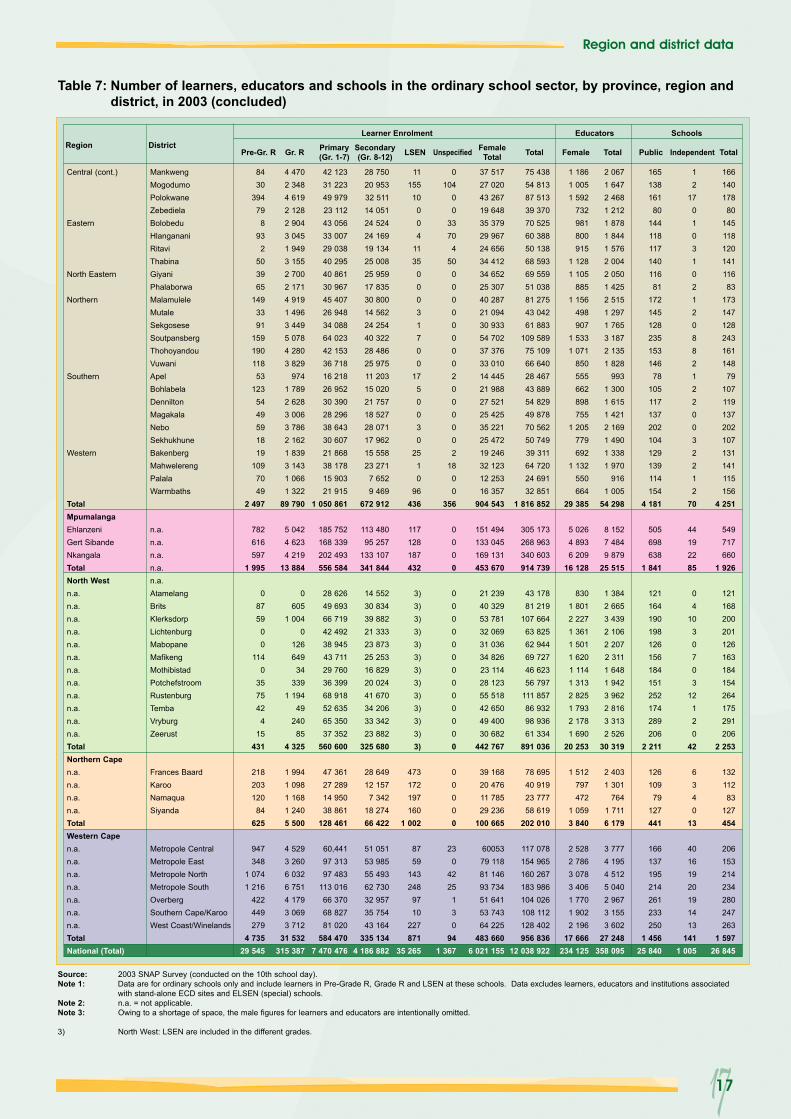
Region and district data
1717
Table 7: Number of learners, educators and schools in the ordinary school sector, by province, region anddistrict, in 2003 (concluded)
Region DistrictPre-Gr. R Gr. R Primary
(Gr. 1-7)Secondary(Gr. 8-12) LSEN Unspecified Female
Total Total Female Total Public Independent Total
Learner Enrolment Educators Schools
Central (cont.)
Eastern
North Eastern
Northern
Southern
Western
TotalMpumalangaEhlanzeniGert SibandeNkangalaTotalNorth Westn.a.n.a.n.a.n.a.n.a.n.a.n.a.n.a.n.a.n.a.n.a.n.a.TotalNorthern Capen.a.n.a.n.a.n.a.TotalWestern Capen.a.n.a.n.a.n.a.n.a.n.a.n.a.TotalNational (Total)
MankwengMogodumoPolokwaneZebedielaBolobeduHlangananiRitaviThabinaGiyaniPhalaborwaMalamuleleMutaleSekgoseseSoutpansbergThohoyandouVuwaniApelBohlabelaDenniltonMagakalaNeboSekhukhuneBakenbergMahwelerengPalalaWarmbaths
n.a.n.a.n.a.n.a.n.a.AtamelangBritsKlerksdorpLichtenburgMabopaneMafikengMothibistadPotchefstroomRustenburgTembaVryburgZeerust
Frances BaardKarooNamaquaSiyanda
Metropole CentralMetropole EastMetropole NorthMetropole SouthOverbergSouthern Cape/KarooWest Coast/Winelands
8430
39479
893
2503965
1493391
15919011853
1235449591819
1097049
2 497
782616597
1 995
08759
00
1140
357542
415
431
218203120
84625
947348
1 0741 216
422449279
4 73529 545
4 4702 3484 6192 1282 9043 0451 9493 1552 7002 1714 9191 4963 4495 0784 2803 829
9741 7892 6283 0063 7862 1621 8393 1431 0661 322
89 790
5 0424 6234 219
13 884
0605
1 0040
126649
34339
1 19449
24085
4 325
1 9941 0981 1681 2405 500
4 5293 2606 0326 7514 1793 0693 712
31 532315 387
42 12331 22349 97923 11243 05633 00729 03840 29540 86130 96745 40726 94834 08864 02342 15336 71816 21826 95230 39028 29638 64330 60721 86838 17815 90321 915
1 050 861
185 752168 339202 493556 584
28 62649 69366 71942 49238 94543 71129 76036 39968 91852 63565 35037 352
560 600
47 36127 28914 95038 861
128 461
60,44197 31397 483
113 01666 37068 82781 020
584 4707 470 476
28 75020 95332 51114 05124 52424 16919 13425 00825 95917 83530 80014 56224 25440 32228 48625 97511 20315 02021 75718 52728 07117 96215 55823 271
7 6529 469
672 912
113 48095 257
133 107341 844
14 55230 83439 88221 33323 87325 25316 82920 02441 67034 20633 34223 882
325 680
28 64912 157
7 34218 27466 422
51 05153 98555 49362 73032 95735 75443 164
335 1344 186 882
11155
10004
1135
00031700
1750030
2510
96436
117128187432
3)3)3)3)3)3)3)3)3)3)3)3)3)
473172197160
1 002
8759
143248
9710
227871
35 265
0104
00
3370
450
000000002000002
1800
356
0000
0000000000000
00000
230
4225
130
941 367
37 51727 02043 26719 64835 37929 96724 65634 41234 65225 30740 28721 09430 93354 70237 37633 01014 44521 98827 52125 42535 22125 47219 24632 12312 25316 357
904 543
151 494133 045169 131453 670
21 23940 32953 78132 06931 03634 82623 11428 12355 51842 65049 40030 682
442 767
39 16820 47611 78529 236
100 665
6005379 11881 14693 73451 64153 74364 225
483 6606 021 155
75 43854 81387 51339 37070 52560 38850 13868 59369 55951 03881 27543 04261 883
109 58975 10966 64028 46743 88954 82949 87870 56250 74939 31164 72024 69132 851
1 816 852
305 173268 963340 603914 739
43 17881 219
107 66463 82562 94469 72746 62356 797
111 85786 93298 93661 334
891 036
78 69540 91923 77758 619
202 010
117 078154 965160 267183 986104 026108 112128 402956 836
12 038 922
1 1861 0051 592
732981800915
1 1281 105
8851 156
498907
1 5331 071
850555662898755
1 205779692
1 132550664
29 385
5 0264 8936 209
16 128
8301 8012 2271 3611 5011 6201 1141 3132 8251 7932 1781 690
20 253
1 512797472
1 0593 840
2 5282 7863 0783 4061 7701 9022 196
17 666234 125
2 0671 6472 4681 2121 8781 8441 5762 0042 0501 4252 5151 2971 7653 1872 1351 828
9931 3001 6151 4212 1691 4901 3381 970
9161 005
54 298
8 1527 4849 879
25 515
1 3842 6653 4392 1062 2072 3111 6481 9423 9622 8163 3132 526
30 319
2 4031 301
7641 7116 179
3 7774 1954 5125 0402 9673 1553 602
27 248358 095
165138161
8014411811714011681
172145128235153146
78105117137202104129139114154
4 181
505698638
1 841
121164190198126156184151252174289206
2 211
126109
79127441
166137195214261233250
1 45625 840
12
1701031021208821220032212
70
44192285
04
1030703
12120
42
6340
13
40161920191413
1411 005
166140178
8014511812014111683
173147128243161148
79107119137202107131141115156
4 251
549717660
1 926
121168200201126163184154264175291206
2 253
13211283
127454
206153214234280247263
1 59726 845
Source: 2003 SNAP Survey (conducted on the 10th school day).Note 1: Data are for ordinary schools only and include learners in Pre-Grade R, Grade R and LSEN at these schools. Data excludes learners, educators and institutions associated
with stand-alone ECD sites and ELSEN (special) schools.Note 2: n.a. = not applicable.Note 3: Owing to a shortage of space, the male figures for learners and educators are intentionally omitted.
3) North West: LSEN are included in the different grades.

18
Eastern Cape Learners Educators InstitutionsPublic Schools 2) Primary 4)
Secondary Combined Intermediate & Middle Total (Public)
636 532416 935
1 046 5570
2 100 024
19 49714 23930 163
063 899
2 647905
2 5480
6 100Independent Schools 3) Primary 4)
Secondary Combined Intermediate & Middle Total (Independent)
3 7403 2199 443
016 402
144190632
0966
191531
065
Total (Public & Independent) 2 116 426 64 865 6 165Other Educational Programmes ABET
ELSEN Public FETECD 1)
Public HE 5)
Total (Other)
46 7868 023
34 85424 33058 994
172 987
2 537622845968
1 5286 500
14243
8461
7661
Grand Total 2 289 413 71 365 6 826
Free State Learners Educators InstitutionsPublic Schools 2) Primary 4)
Secondary Combined Intermediate & Middle Total (Public)
330 515204 987
44 534104 098684 134
10 4876 8541 4373 177
21 955
1 567263
92201
2 123Independent Schools 3) Primary 4)
Secondary Combined Intermediate & Middle Total (Independent)
2 0692 0805 2582 614
12 021
94107375
65641
156
339
63Total (Public & Independent) 696 155 22 596 2 186Other Educational Programmes ABET
ELSEN Public FETECD 1)
Public HE 5)
Total (Other)
33 4504 781
24 2918 488
30 867101 877
2 408444696468662
4 678
21921
4129
2375
Grand Total 798 032 27 274 2 561
Gauteng Learners Educators InstitutionsPublic Schools 2) Primary 4)
Secondary Combined Intermediate & Middle Total (Public)
908 330517 718
98 5470
1 524 595
23 23215 048
2 6540
40 934
1 266468139
01 873
Independent Schools 3) Primary 4)
Secondary Combined Intermediate & Middle Total (Independent)
30 68918 55787 976
0137 222
1 7401 0765 496
08 312
10059
1930
352Total (Public & Independent) 1 661 817 49 246 2 225Other Educational Programmes ABET
ELSEN Public FETECD 1)
Public HE 5)
Total (Other)
69 76030 631
135 22854 315
402 771692 705
3 0292 2722 1353 2655 981
16 682
224100
8768
111 111
Grand Total 2 354 522 65 928 3 336
KwaZulu-Natal Learners Educators InstitutionsPublic Schools 2) Primary 4)
Secondary Combined Intermediate & Middle Total (Public)
1 694 781885 673145 817
02 726 271
39 44224 379
4 9390
68 760
3 8181 470
3260
5 614Independent Schools 3) Primary 4)
Secondary Combined Intermediate & Middle Total (Independent)
11 32811 96133 491
056 780
1 3205 8701 879
09 069
493590
0174
Total (Public & Independent) 2 783 051 77 829 5 788Other Educational Programmes ABET 7)
ELSEN Public FETECD 1)
Public HE 5)
Total (Other)
12 00210 57865 07325 34281 352
183 769
943902
1 0951 1942 3366 470
13962
9471
5686
Grand Total 2 966 820 84 299 6 474
Limpopo Learners Educators InstitutionsPublic Schools 2) Primary 4)
Secondary Combined Intermediate & Middle Total (Public)
1 120 125660 624
17 0710
1 797 820
31 03821 757
5870
53 382
2 7111 416
540
4 181Independent Schools 3) Primary 4)
Secondary Combined Intermediate & Middle Total (Independent)
7 5274 2227 283
019 032
252196468
0916
261331
070
Total (Public & Independent) 18 16 852 54 298 4 251Other Educational Programmes ABET
ELSEN Public FETECD 1)
Public HE 5)
Total (Other)
23 2485 901
37 07124 36220 258
110 840
1 330745555944610
4 184
51623
7523
21 071
Grand Total 1 927 692 58 482 5 322
Mpumalanga Learners Educators InstitutionsPublic Schools 2) Primary 4)
Secondary Combined Intermediate & Middle Total (Public)
565 199290 202
46 3310
901 732
15 0098 5341 250
024 793
1 415362
640
1 841Independent Schools 3) Primary 4)
Secondary Combined Intermediate & Middle Total (Independent)
2 6601 0459 302
013 007
14850
5240
722
286
510
85Total (Public & Independent) 9 14 739 25 515 1 926Other Educational Programmes ABET
ELSEN Public FETECD 1)
Public HE 5)
Total (Other)
10 8832 926
24 0678 529
046 405
1 121180265382
01 948
11918
3120
0260
Grand Total 9 61 144 27 463 2 186

19
EEDDUUCCAATTIIOONN IINN SSOOUUTTHH AAFFRRIICCAA:: AA GGLLOOBBAALL PPIICCTTUURREE22000033
Sources:1. Ordinary public and independent schools: 2003 SNAP Survey (conducted
on the 10th school day); 2. ABET: 2003 Annual ABET Survey;3. ELSEN: 2003 Provincial Submissions; 4. FET: 2002 Survey by the National Business Initiative; 5. ECD: Attached to primary - submitted by provinces. Separated from
primary - 2000 ECD Audit; and6. Higher education: 2003 HEMIS database.
Footnotes:1) 2000 data for stand-alone ECD sites include only sites registered with
the DoE.2) and 3) Including Learners with Special Education Needs (LSEN) at ordinary
public and independent schools, respectively.4) Including learners and educators associated with pre-primary classes at
primary schools.5) Higher education institutions include universities and technikons.6) The Gauteng public school educators do not tally with Table 1. See
footnote 3) of Table 1.7) The KwaZulu-Natal ABET data are for 2002.
North West Learners Educators InstitutionsPublic Schools 2) Primary 4)
Secondary Combined Intermediate & Middle Total (Public)
492 592240 470
14 439133 445880 946
15 9628 583
5404 608
29 693
1 413400
37361
2 211Independent Schools 3) Primary 4)
Secondary Combined Intermediate & Middle Total (Independent)
4 0071 7152 9431 425
10 090
159205209
53626
159
144
42Total (Public & Independent) 8 91 036 30 319 2 253Other Educational Programmes ABET
ELSEN Public FETECD 1)
Public HE 5)
Total (Other)
36 3993 957
31 05822 07041 489
134 973
1 329374478
1 323822
4 326
18940
3482
3717
Grand Total 1 026 009 34 645 2 970
Northern Cape Learners Educators InstitutionsPublic Schools 2) Primary 4)
Secondary Combined Intermediate & Middle Total (Public)
20 69927 963
101 65248 915
199 229
657825
2 9711 6156 068
3461
27274
441Independent Schools 3) Primary 4)
Secondary Combined Intermediate & Middle Total (Independent)
799514264
1 2042 781
472
2042
111
6223
13Total (Public & Independent) 2 02 010 6 179 454Other Educational Programmes ABET
ELSEN Public FETECD 1)
Public HE 5)
Total (Other)
4 8311 4578 5816 994
021 863
279162127273
0841
13692
1230
270Grand Total 223 873 7 020 724
Western Cape Learners Educators InstitutionsPublic Schools 2) Primary 4)
Secondary Combined Intermediate & Middle Total (Public)
519 279300 562
21 51487 907
929 262
13 4088 839
6362 309
25 192
984300
41131
1 456Independent Schools 3) Primary 4)
Secondary Combined Intermediate & Middle Total (Independent)
10 5591 964
14 775276
27 574
575238
1 22023
2 056
562058
7141
Total (Public & Independent) 9 56 836 27 248 1 597Other Educational Programmes ABET
ELSEN Public FETECD 1)
Public HE 5)
Total (Other)
27 86713 77645 92227 01882 062
196 645
1 5211 438
8921 6222 5958 068
24986
6409
5755
Grand Total 1 153 481 35 316 2 352
National Learners Educators InstitutionsPublic Schools 2) Primary 4)
Secondary Combined Intermediate & Middle Total (Public)
6 288 0523 545 1341 536 462
374 36511 744 013
168 732109 058
45 17711 709
334 676
15 8555 6453 573
76725 840
Independent Schools 3) Primary 4)
Secondary Combined Intermediate & Middle Total (Independent)
73 37845 277
170 7355 519
294 909
4 4797 934
10 823183
23 419
314165503
231 005
Total (Public & Independent) 12 038 922 3 58 095 26 845Other Educational Programmes ABET
ELSEN Public FETECD 1)
Public HE 5)
Total (Other)
265 22682 030
406 145201 448717 793
1 672 642
14 4977 1397 088
10 43914 53453 697
1 933402
503 486
355 906
Grand Total 13 711 564 411 792 32 751
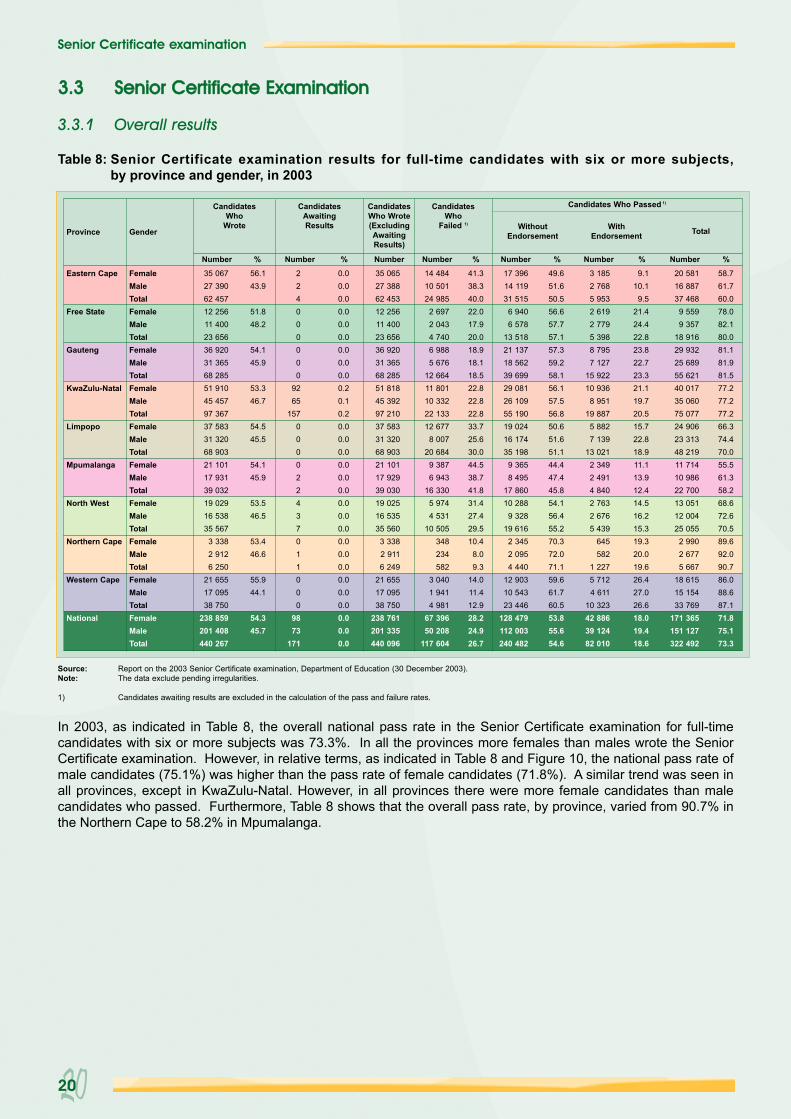
Senior Certificate examination
2020
Table 8: Senior Certificate examination results for full-time candidates with six or more subjects, by province and gender, in 2003
33..33 SSeenniioorr CCeerrttiiffiiccaattee EExxaammiinnaattiioonn
3.3.1 Overall results
Source: Report on the 2003 Senior Certificate examination, Department of Education (30 December 2003). Note: The data exclude pending irregularities.
1) Candidates awaiting results are excluded in the calculation of the pass and failure rates.
In 2003, as indicated in Table 8, the overall national pass rate in the Senior Certificate examination for full-timecandidates with six or more subjects was 73.3%. In all the provinces more females than males wrote the SeniorCertificate examination. However, in relative terms, as indicated in Table 8 and Figure 10, the national pass rate ofmale candidates (75.1%) was higher than the pass rate of female candidates (71.8%). A similar trend was seen inall provinces, except in KwaZulu-Natal. However, in all provinces there were more female candidates than malecandidates who passed. Furthermore, Table 8 shows that the overall pass rate, by province, varied from 90.7% inthe Northern Cape to 58.2% in Mpumalanga.
Province
Eastern Cape
Free State
Gauteng
KwaZulu-Natal
Limpopo
Mpumalanga
North West
Northern Cape
Western Cape
National
FemaleMaleTotalFemaleMaleTotalFemaleMaleTotalFemaleMaleTotalFemaleMaleTotalFemaleMaleTotalFemaleMaleTotalFemaleMaleTotalFemaleMaleTotalFemaleMaleTotal
35 06727 39062 45712 25611 40023 65636 92031 36568 28551 91045 45797 36737 58331 32068 90321 10117 93139 03219 02916 53835 567
3 3382 9126 250
21 65517 09538 750
238 859201 408440 267
56.143.9
51.848.2
54.145.9
53.346.7
54.545.5
54.145.9
53.546.5
53.446.6
55.944.1
54.345.7
224000000
9265
157000022437011000
9873
171
0.00.00.00.00.00.00.00.00.00.20.10.20.00.00.00.00.00.00.00.00.00.00.00.00.00.00.00.00.00.0
35 06527 38862 45312 25611 40023 65636 92031 36568 28551 81845 39297 21037 58331 32068 90321 10117 92939 03019 02516 53535 560
3 3382 9116 249
21 65517 09538 750
238 761201 335440 096
14 48410 50124 985
2 6972 0434 7406 9885 676
12 66411 80110 33222 13312 677
8 00720 684
9 3876 943
16 3305 9744 531
10 505348234582
3 0401 9414 981
67 39650 208
117 604
41.338.340.022.017.920.018.918.118.522.822.822.833.725.630.044.538.741.831.427.429.510.4
8.09.3
14.011.412.928.224.926.7
17 39614 11931 515
6 9406 578
13 51821 13718 56239 69929 08126 10955 19019 02416 17435 198
9 3658 495
17 86010 288
9 32819 616
2 3452 0954 440
12 90310 54323 446
128 479112 003240 482
49.651.650.556.657.757.157.359.258.156.157.556.850.651.651.144.447.445.854.156.455.270.372.071.159.661.760.553.855.654.6
3 1852 7685 9532 6192 7795 3988 7957 127
15 92210 936
8 95119 887
5 8827 139
13 0212 3492 4914 8402 7632 6765 439
645582
1 2275 7124 611
10 32342 88639 12482 010
9.110.1
9.521.424.422.823.822.723.321.119.720.515.722.818.911.113.912.414.516.215.319.320.019.626.427.026.618.019.418.6
20 58116 88737 468
9 5599 357
18 91629 93225 68955 62140 01735 06075 07724 90623 31348 21911 71410 98622 70013 05112 00425 055
2 9902 6775 667
18 61515 15433 769
171 365151 127322 492
58.761.760.078.082.180.081.181.981.577.277.277.266.374.470.055.561.358.268.672.670.589.692.090.786.088.687.171.875.173.3
Gender
Candidates Who
Wrote
Candidates Awaiting Results
Candidates Who Wrote(Excluding Awaiting Results)
Candidates Who
Failed 1) WithoutEndorsement
WithEndorsement Total
Number % % % % % %
Candidates Who Passed 1)
Number Number Number Number Number Number
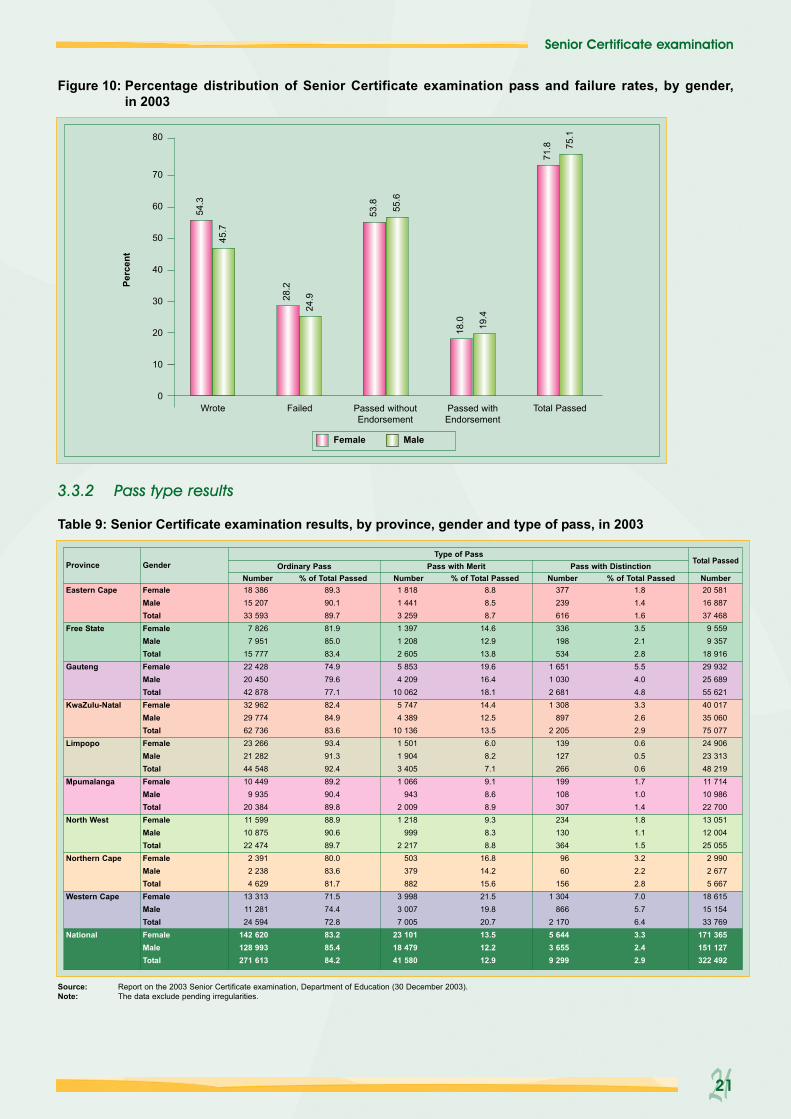
2121
Senior Certificate examination
Figure 10: Percentage distribution of Senior Certificate examination pass and failure rates, by gender, in 2003
0
10
20
30
40
50
60
70
80
Wrote
54.3
45.7
Failed
28.2
24.9
Passed withoutEndorsement
53.8 55.6
Passed withEndorsement
18.0 19.4
Total Passed
71.8 75
.1
MaleFemale
Perc
ent
3.3.2 Pass type results
Table 9: Senior Certificate examination results, by province, gender and type of pass, in 2003
Source: Report on the 2003 Senior Certificate examination, Department of Education (30 December 2003). Note: The data exclude pending irregularities.
Province GenderType of Pass
Ordinary Pass Pass with Merit Pass with DistinctionNumber Number Number Number% of Total Passed % of Total Passed % of Total Passed
Total Passed
Eastern Cape
Free State
Gauteng
KwaZulu-Natal
Limpopo
Mpumalanga
North West
Northern Cape
Western Cape
National
FemaleMaleTotalFemaleMaleTotalFemaleMaleTotalFemaleMaleTotalFemaleMaleTotalFemaleMaleTotalFemaleMaleTotalFemaleMaleTotalFemaleMaleTotalFemaleMaleTotal
18 38615 20733 593
7 8267 951
15 77722 42820 45042 87832 96229 77462 73623 26621 28244 54810 449
9 93520 38411 59910 87522 474
2 3912 2384 629
13 31311 28124 594
142 620128 993271 613
89.390.189.781.985.083.474.979.677.182.484.983.693.491.392.489.290.489.888.990.689.780.083.681.771.574.472.883.285.484.2
1 8181 4413 2591 3971 2082 6055 8534 209
10 0625 7474 389
10 1361 5011 9043 4051 066
9432 0091 218
9992 217
503379882
3 9983 0077 005
23 10118 47941 580
8.88.58.7
14.612.913.819.616.418.114.412.513.5
6.08.27.19.18.68.99.38.38.8
16.814.215.621.519.820.713.512.212.9
377239616336198534
1 6511 0302 6811 308
8972 205
139127266199108307234130364
9660
1561 304
8662 1705 6443 6559 299
1.81.41.63.52.12.85.54.04.83.32.62.90.60.50.61.71.01.41.81.11.53.22.22.87.05.76.43.32.42.9
20 58116 88737 468
9 5599 357
18 91629 93225 68955 62140 01735 06075 07724 90623 31348 21911 71410 98622 70013 05112 00425 055
2 9902 6775 667
18 61515 15433 769
171 365151 127322 492

Senior Certificate examination
2222
As of 2001, candidates can obtain a Senior Certificate graded with either an ordinary pass (equivalent to an aver-age score of less than 60%), a merit pass (equivalent to an average score of between 60% and 79%) or a distinc-tion pass (equivalent to an average score of 80% and more). In each pass type there are passes withendorsement and passes without endorsement.
Table 9 and Figure 11 show that, nationally, in 2003, 84.2%, 12.9% and 2.9% of all candidates passed with an ordi-nary pass, a merit pass and a distinction pass, respectively. Although Table 9 and Figure 11 show that, nationally,among candidates who passed with merit and distinction, the females performed better than the males, males per-formed better than females when one takes into account only the endorsement passes for each of the three passtypes (raw data for endorsement passes not shown in this report).
3.3.3 Frequency interval results
Figure 11: Percentage distribution of Senior Certificate examination results, by type of pass and gender, in 2003
0
20
40
60
80
100
Perc
ent
Female
Ordinary Pass Merit Pass Distinction Pass
Male Total
83.2 85.4
84.2
13.5
12.2
12.9
3.3
2.4
2.9
Table 10: Senior Certificate examination percentage pass rates of schools within different percentagegroupings, by province, in 2002 and 2003
Source: Report on the 2003 Senior Certificate examination, Department of Education (30 December 2003). Note: The data exclude pending irregularities.
Name
Province
Total Number ofSchools
2002 2003 2002%
2003%
2002%
2003%
2002%
2003%
2002%
2003%
2002%
2003%
2002%
2003%
2002%
2003%
0-20 % 21-40 % 41-60 % 61-80 % 81-100 % Exactly 0 % Exactly 100 %
Percentage Groupings of Pass Rates
Eastern Cape
Free State
Gauteng
KwaZulu-Natal
Limpopo
Mpumalanga
North West
Northern Cape
Western Cape
National
905
339
645
1 424
1 352
411
384
103
377
5 940
910
337
640
1 485
1 373
415
389
105
391
6 045
13.5
2.4
4.0
3.4
1.8
4.1
1.8
0.0
1.9
4.4
6.2
0.9
2.3
2.5
1.1
2.2
2.1
0.0
2.8
2.5
28.4
9.1
7.4
12.8
7.4
23.8
12.0
1.0
1.1
12.9
20.9
3.6
4.5
6.7
6.8
21.2
8.0
0.0
1.8
9.1
27.0
20.6
18.1
20.9
20.5
33.6
26.6
2.9
6.4
21.4
27.8
12.5
12.5
15.6
22.2
32.8
22.9
1.9
7.4
19.3
15.1
31.6
22.8
27.3
32.0
19.0
29.4
16.5
22.0
25.3
22.7
25.5
22.7
25.4
25.9
19.8
32.9
12.4
13.0
23.9
16.0
36.3
47.6
35.6
38.4
19.5
30.2
79.6
68.7
36.0
22.4
57.6
58.0
49.8
44.1
24.1
34.2
85.7
74.9
45.2
1.5
0.6
1.7
0.6
0.1
0.2
1.0
0.0
1.6
0.8
1.1
0.3
0.8
1.3
0.1
0.5
0.5
0.0
2.0
0.8
5.1
10.3
12.6
8.0
8.0
5.1
5.7
26.2
24.7
9.2
6.2
14.8
15.3
9.0
9.3
6.0
5.4
25.7
25.1
10.5
Note: Total refers to the weighted average between male and female.

Senior Certificate examination
2323
Figure 12: Percentage distribution of Senior Certificate examination percentage pass rates of schoolswithin different percentage groupings in 2002 and 2003
0
5
10
15
20
25
30
35
40
45
50
Exactly 0% 0 - 20% 21 - 40% 41 - 60% 61 - 80% 81 - 100% Exactly 100%
0.8
0.8
4.4
2.5
12.9
9.1
21.4
19.3
25.3
23.9
36.0
45.2
9.2 10
.5
20032002
Perc
ent
In 2003, as shown in Table 10 and Figure 12, 10.5% (approximately 635) of the 6 045 schools in South Africa thatoffered the Senior Certificate examination obtained 100% passes. This is higher than the 9.2% of 2002. The per-centage of schools that scored a pass rate of between 81% and 100% increased from 36.0% to 45.2%. As far asschools that performed poorly are concerned, 2.5% of them obtained a pass rate of between 0% and 20% in 2003,which is significantly lower than the 4.4% of 2002. Nationally, 0.8% of schools (approximately 48) scored a 0%pass rate, which is the same as in 2002.
3.3.4 Selected subject results
Table 11 shows that, concerning the selected six subjects, less candidates wrote Biology in the Senior Certificateexamination in 2003 (285 852) than in 2002 (298 089). The highest and second highest overall pass rates in 2003were for Accounting (91.1%) and History (85.5%), respectively. The lowest overall pass rate in 2003 was for Mathematics (58.8%), which is 2.7% higher than in 2002. However, the pass rate for Mathematics HG was 79.8%in 2003.
Table 11 and Figure 13 indicate that, except for Accounting, in both 2002 and 2003, males performed better overallthan females in all the selected subjects. However, in 2003, females performed better than males in AccountingSG, Biology HG and Business Economics HG.

Senior Certificate examination
2424
Table 11: Senior Certificate examination results for selected subjects, by gender, in 2002 and 2003
Source: Report on the 2003 Senior Certificate examination, Department of Education (30 December 2003). Note 1: The data exclude pending irregularities.Note 2: HG = Higher Grade, SG = Standard Grade and LG = Lower Grade.Note 3: Empty cells: not applicable.
Figure 13: Percentage distribution of Senior Certificate examination pass rates for selected subjects, by gender, in 2003
0
10
20
30
40
50
60
70
80
90
100
Perc
ent
Female
Accounting Biology Business Economics History Mathematics Physical Science
Male
91.5
90.4
71.7 75
.4 82.7
83.8
84.7
86.5
54.1
64.1
78.3 82
.2
Subject
Accounting HG
Accounting SG
Accounting Total
Biology HG
Biology SG
Biology Total
Business Economics HG
Business Economics SG
Business Economics Total
History HG
History SG
History Total
Mathematics HG
Mathematics SG
Mathematics Total
Physical Science HG
Physical Science SG
Physical Science Total
200220032002200320022003200220032002200320022003200220032002200320022003200220032002200320022003200220032002200320022003200220032002200320022003
24 08122 85261 82566 39085 90689 24255 54549 055
107 735106 924163 280155 979
24 18627 12379 53780 944
103 723108 067
12 91412 53337 13334 20450 04746 73716 59816 618
121 489120 011138 087136 629
22 71323 10550 72048 85873 43371 963
17 09916 65138 18340 06055 28256 71142 53737 60592 27292 268
134 809129 873
17 22719 55854 79355 41072 02074 96814 82614 55432 62230 57647 44845 13018 86719 338
104 035102 356122 902121 694
28 27928 97552 14350 85380 42279 828
41 18039 503
100 008106 450141 188145 953
98 08286 660
200 007199 192298 089285 852
41 41346 681
134 330136 354175 743183 035
27 74027 08769 75564 78097 49591 86735 46535 956
225 524222 367260 989258 323
50 99252 080
102 86399 711
153 855151 791
22 73625 880
22 73625 88041 03444 225
41 03444 22522 57925 592
22 57925 59215 58718 368
15 58718 36820 52823 412
20 52823 41224 88826 067
24 88826 067
9 2767 521
72 74287 92682 01895 44723 01718 549
104 156105 883127 173124 432
10 88111 75887 66595 21198 546
106 9695 8355 392
40 45544 46346 29049 855
4 9875 281
96 30299 426
101 289104 707
14 02213 93756 74161 75670 76375 693
14 79711 61714 79711 617
44 58541 09444 58541 094
22 18419 67122 18419 671
12 76510 36912 76510 369
24 62923 78624 62923 786
21 87820 18721 87820 187
18 39219 08854 87362 60873 26581 69636 50435 75677 80776 028
114 311111 78419 53521 74364 51367 66184 04889 404
9 84710 99527 12128 57736 96839 57211 88013 09659 72660 83971 60673 93516 99817 17737 53739 18054 53556 357
76.483.588.894.385.391.565.772.972.271.170.071.780.880.281.183.681.082.776.387.773.083.573.984.771.678.849.250.751.954.174.874.374.080.274.378.3
13 62014 31332 66636 93546 28651 24827 54727 01870 93470 94998 48197 96713 92515 60745 33647 22159 26162 82811 57512 76526 09926 25537 67439 02013 63515 59761 20562 37374 84077 97021 91222 82741 08242 76362 99465 590
79.786.085.692.283.790.464.871.876.976.973.175.480.879.882.785.282.383.878.187.780.085.979.486.572.380.758.860.960.964.177.578.878.884.178.382.2
32 01233 40187 53999 543
119 551132 944
64 05162 774
148 741146 977212 792209 751
33 46037 350
109 849114 882143 309152 232
21 42223 76053 22054 83274 64278 59225 51528 693
120 931123 212146 446151 905
38 91040 00478 61981 943
117 529121 947
77.784.687.593.584.791.165.372.474.473.871.473.480.880.081.884.381.583.277.287.776.384.676.685.571.979.853.655.456.158.876.376.876.482.276.480.3
YearNumber of Candidates
who Wrote
Female Female Female %Male Male Male %Total TotalHG SG LG Total Passed
Total Total (%)Total Total
Number and Percentages of Candidates who Passed

Senior Certificate examination
2525
3.3.5 Pass rate trend from 1994 to 2003
Table 12: Comparison of pass rates of the Senior Certificate examination, by province, from 1994 to 2003
Source: Report on the 2003 Senior Certificate examination, Department of Education (30 December 2003).Note: Percentages with a negative sign denote a decrease.
Figure 14: Comparison of national pass rates of the Senior Certificate examination from 1994 to 2003
0
20
40
60
80
Perc
ent
Pass Rates
58.0
47.4
48.9
73.3
1994 1995 1996 1997 1998 1999 2000 2001 2002 2003
Table 12 shows that the national pass rate of the Senior Certificate examination increased from 58.0% in 1994 to73.3% in 2003, indicating a net increase of 26.4%. From 1994 to 2003, the largest net increase in the pass rateoccurred in Limpopo (57.7%), followed by the Free State (43.4%).
Figure 14 shows that, from 1994, the national pass rate decreased by 10.6% (real value) to its lowest point in 1997(47.4%). It stayed almost the same from 1997 to 1999 and then increased by 24.4% (real value) to its highestpoint in 2003.
Table 12 shows that all nine provinces showed a higher pass rate in 2003 than in 1994, and that, in 2002, only twoprovinces showed a lower pass rate than in 1994. Between 1994 and 2003 the lowest and second lowest passrates occurred in Limpopo (31.9% in 1997 and 35.2% in 1998), respectively. In the same period, the highest andsecond highest pass rates occurred in the Northern Cape (90.7% in 2003) and the Western Cape (87.1% in 2003),respectively.
Province
Eastern Cape
Free State
Gauteng
KwaZulu-Natal
Limpopo
Mpumalanga
North West
Northern Cape
Western Cape
National
56.8
55.8
61.3
67.6
44.4
47.5
70.2
77.7
85.6
58.0
47.8
49.7
58.0
69.3
37.8
38.2
66.3
74.5
82.7
53.4
49.0
51.1
58.3
61.8
38.8
47.4
69.6
74.1
80.2
54.4
46.2
42.5
51.7
53.7
31.9
46.0
50.0
63.8
76.2
47.4
45.1
43.4
55.6
50.3
35.2
52.7
54.6
65.4
79.0
49.3
40.2
42.1
57.0
50.7
37.5
48.3
52.1
64.3
78.8
48.9
49.8
52.7
67.5
57.2
51.4
53.2
58.3
71.2
80.6
57.9
45.6
59.0
73.6
62.8
59.5
46.9
62.5
84.2
82.7
61.7
51.8
70.7
78.1
70.8
69.5
55.8
67.8
89.9
86.5
68.9
60.0
80.0
81.5
77.2
70.0
58.2
70.5
90.7
87.1
73.3
5.6
43.4
33.0
14.2
57.7
22.5
0.4
16.7
1.8
26.4
Pass Rates (%)
1994 1995 1996 1997 1998 1999 2000 2001 2002 2003
A B C D E F G H I J (J-A)/A
% Net Change (94-03)

Public HE institutions
2626
Table 13: Overview of South African public higher education institutions in 2003
44.. PPUUBBLLIICC HHIIGGHHEERR EEDDUUCCAATTIIOONN IINNSSTTIITTUUTTIIOONNSS
44..11 HHeeaaddccoouunntt eennrroollmmeennttss
Source: 2003 HEMIS database, November 2004.Abbreviations: HBU = historically black university, HWU = historically white university, HBT = historically black technikon, HWT = historically white technikon.Note 1: In a headcount enrolment, full-time as well as part-time students are counted as units; i.e. no account is taken of the course loads carried by students.Note 2: Contact students are those who are registered mainly for courses offered in contact mode.Note 3: Distance students are those who are registered mainly for courses offered in distance mode.Note 4: Black students, for the purpose of this summary table, include African, Coloured and Indian students.Note 5: SET majors = majors in science, engineering and technology. These include majors in engineering, health sciences, life sciences, physical sciences, computer sciences
and mathematical sciences.Note 6: Business majors include majors in accounting, management, and all other business-related majors, such as marketing. Note 7: Humanities majors include majors in education, languages and literary studies, fine arts, music and the social sciences. Note 8: Students from Qwa-Qwa are included in the University of the Free State totals.Note 9: Durban Institute of Technology is a new technikon, into which ML Sultan Technikon and Natal Technikon were merged in 2002. The new technikon has, for purposes of these
data, been classified as an HBT. Note 10: Numbers and percentages may not necessarily add up, owing to rounding off.Note 11: n.a. = not applicable.
Institution
HBUsDurban-WestvilleFort HareMedunsaNorthNorth WestTranskeiVendaVistaWestern CapeZululandTotal/Averages for HBUsHWUsCape TownFree StateNatalPort ElizabethPotchefstroomPretoriaRand AfrikaansRhodesStellenboschWitwatersrandTotal/averages for HWUs UNISATotal/Averages forUniversities
11 2704 5643 883
10 7747 7465 7719 484
12 71914 043
9 17889 432
20 53320 02922 797
7 65016 84134 74118 582
6 35020 44724 250
192 220514
282 166
01 841
00
921708
08 027
00
11 497
01 9559 1286 835
10 8887 2105 9161 176
9510
44 059150 019
205 575
11 2706 4053 883
10 7748 6676 4799 484
20 74614 043
9 178100 929
20 53321 98431 92514 48527 72941 95124 498
7 52621 39824 250
236 279150 533
487 741
97100
969999
100100
99969898
486475593635364824654860
64
n.a.100n.a.n.a.100100n.a.100n.a.n.a.100
n.a.4190997797969994
n.a.8865
72
5657525359624656576156
495752555952545751495381
54
n.a.87
n.a.n.a.7573
n.a.65
n.a.n.a.70
n.a.3764696572696983
n.a.6656
59
3717973026242415232226
392829151938161939473111
24
2110
01420151813151215
248
28121116251614161739
24
4173
35654615872636659
366443737046596547365250
52
Headcount Student Enrolments
Contact Distance Total Contact
1. Universities
HBTsBorderDurban Institute of Tech.Eastern CapeMangosuthuNorth WestNorthern GautengPeninsulaTotal/averages for HBTsHWTsCapeFree StatePort ElizabethPretoriaVaal TriangleWitwatersrandTotal/Averages for HWTsTechnikon SATotals/Averages forTechnikons
5 73120 952
8 5268 0275 093
13 0249 793
71 146
16 2658 4839 397
30 21115 94215 23495 532
0
166 678
00000000
30400445
11 62400
12 49950 875
63 374
5 73120 952
8 5268 0275 093
13 0249 793
71 146
16 2958 8839 842
41 83515 94215 234
108 03150 875
230 052
9992
100100100100
9797
64777275929078
n.a.
86
n.a.n.a.n.a.n.a.n.a.n.a.n.a.n.a.
9384
10098
n.a.n.a.9883
86
6150615063525454
50494548484748
n.a.
51
n.a.n.a.n.a.n.a.n.a.n.a.n.a.n.a.
50537253n/an/a5443
45
3348335634314942
5145433345464111
35
4534393645513339
3140362046463284
46
221828
822181919
18142247
97
265
19
2. Technikons
UniversitiesTechnikonsTotal/Averages for PublicInstitutions
282 166166 678
448 844
205 57563 374
268 949
487 741230 052
717 793
6486
72
7286
75
5451
53
5945
56
2435
27
2446
31
5219
42
3. Summary
Distance Contact Distance SET Business Humanities
Black Students asProportions of Head Count
Totals (%)
Female Students asProportions of Head Count
Totals (%)
Proportions of Contact & DistanceHeadcount Enrolments in Major Fields of
Study (%)

Public HE institutions
2727
Table 14: Headcount enrolments in public higher education institutions, by major field of study and formalqualification, in 2003
Source: 2003 HEMIS database, November 2004.Abbreviations: HBU = historically black university, HWU = historically white university, HBT = historically black technikon, HWT = historically white technikon.Note 1 Abbreviations and definitions of fields of study employed here are the same as those employed in Table 13, except that the field of education (which involves primarily
school teacher training) is separated from the broad humanities category.Note 2 Occasional students are students who are taking courses which form part of formally approved programmes, but who are not registered for a formal degree or diploma.Note 3: The category "three-year undergraduate degrees and diplomas" includes national diplomas offered by technikons as well as first bachelor's degrees offered by universities,
such as BA, BSc, BCom.(Notes 4 to 7 overleaf)
Institution
HBUsDurban-WestvilleFort HareMedunsaNorthNorth WestTranskeiVendaVistaWestern CapeZululandTotals for HBUs
HWUsCape TownFree StateNatalPort ElizabethPotchefstroomPretoriaRand AfrikaansRhodesStellenboschWitwatersrandTotals for HWUs
UNISA
Totals forUniversities
4 1841 0673 7773 1872 2791 5412 2563 1303 1632 058
26 64126%
8 0616 0779 3702 1705 397
15 8463 8731 4188 410
11 51872 140
31%15 901
11%114 682
24%
2 410647
01 5081 728
9711 7372 7532 0891 062
14 90515%
4 9811 7528 8391 6962 9856 6056 1031 1882 9143 965
41 02917%
58 73339%
114 66724%
6401 924
222 6701 9911 6501 6544 9161 5512 878
19 89620%
7434 5275 2977 696
10 86110 321
6 7811 8991 7032 339
52 16622%
18 81412%
90 87619%
4 0362 767
843 4102 6682 3173 8389 9477 2413 180
39 48839%
6 7499 6288 4192 9238 4859 1797 7403 0218 3716 429
70 94430%
57 08538%
167 51734%
11 2706 4053 883
10 7748 6676 4799 484
20 74614 043
9 178100 929
100%
20 53321 98431 92514 48527 72941 95124 498
7 52621 39824 250
236 279100%
150 533100%
487 741100%
457622
4831 223
2481 633
00
4 0544%
8271 2833 428
4300
484912101780
1 1639 408
4%21 824
14%35 286
7%
6 1773 292
5636 2395 0432 9376 564
13 1307 3874 890
56 22256%
7 5818 232
12 9337 805
11 21619 33014 071
4 6037 2928 433
101 49643%
91 63061%
249 34851%
2 5462 5512 5472 2791 7041 7931 9123 2043 7592 125
24 42024%
6 4103 3315 4493 4714 2249 8312 2991 4655 6567 231
49 36721%
16 73911%
90 52619%
741300195912836437351
2 4651 2711 6039 111
9%
1 9565 9075 9691 5459 6554 8704 818
6703 2422 637
41 26917%
14 2509%
64 63013%
1 022233512
1 267548
88382254
1 381432
6 1196%
2 9762 7023 5131 0512 1295 9071 820
4943 6714 166
28 42912%
5 2914%
39 8398%
32723647553
12760
245128
1 0031%
783529633183505
1 529578193757620
6 3103%7991%
8 1122%
11 2706 4053 883
10 7748 6676 4799 484
20 74614 043
9 178100 929
100%
20 53321 98431 92514 48527 72941 95124 498
7 52621 39824 250
236 279100%
150 533100%
487 741100%
Science,Engineering
&Technology
Business &Management
Education All OtherHumanities &
SocialSciences
Total OccasionalStudents
Three-YearUndergraduate
Degrees &Diplomas
ProfessionalUndergraduate
Degrees
Postgraduate,Below
Master's Level
Master'sDegrees
DoctoralDegrees
Total
Major Field of Study
1. Universities
HBTsBorderDurban Institute of Tech.Eastern CapeMangosuthuNorth WestNorthern GautengPeninsulaTotals for HBTs
HWTsCapeFree StatePort ElizabethPretoriaVaal TriangleWitwatersrandTotals for HWTs
Technikon SA
Totals Technikons
1 90810 144
2 7834 4991 7164 0534 753
29 85642%
8 2854 0324 189
13 9797 1057 042
44 63041%
5 65711%
80 14335%
2 5797 1143 3662 8732 2726 6763 192
28 07139%
4 9983 5873 5228 3857 3647 054
34 90932%
42 68384%
105 66446%
6172
1 7300
3351 145
8034 191
6%
1 539312754
9 1082444
11 78011%
340%
16 0047%
1 2383 522
647655771
1 1501 0459 02813%
1 474953
1 37810 363
1 4501 095
16 71215%
2 5015%
28 24112%
5 73120 952
8 5268 0275 093
13 0249 793
71 146100%
16 2958 8839 842
41 83515 94215 234
108 031100%
50 875100%
230 052100%
61495257
0222225
901 350
2%
180
347235
0678
1 2781%
00%
2 6281%
5 48917 675
7 7907 9024 771
11 5057 673
62 80588%
12 8796 5997 9371 809
14 78412 63856 646
52%43 111
85%162 562
71%
1812 492
317125
971 1901 8766 278
9%
2 8792 0621 083
37 4061 0551 631
46 11643%
7 51315%
59 90726%
036
162007
2050%
1427
35154
1218
3680%
00%5730%
0236
002
951434761%
351168394
2 15177
2473 388
3%2500%
4 1142%
018
0012
1132
0%
264746801422
2350%
10%2680%
5 73120 952
8 5268 0275 093
13 0249 793
71 146100%
16 2958 8839 842
41 83515 94215 234
108 031100%
50 875100%
230 052100%
2. Technikons
Universities
Technikons
Totals for PublicInstitutions
114 68224%
80 14335%
194 82527%
114 66724%
105 66446%
220 33031%
90 87619%
16 0047%
106 88015%
167 51734%
28 24112%
195 75827%
487 741100%
230 052100%
717 793100%
35 2867%
2 6281%
37 9145%
249 34851%
162 56271%
411 91057%
90 52619%
59 90726%
150 43321%
64 63013%5730%
65 2039%
39 8398%
4 1142%
43 9536%
8 1122%2680%
8 3801%
487 741100%
230 052100%
717 793100%
3. Summary
Formal Qualifications

Public HE institutions
2828
Figure 15 (see also Table 14) shows that, in 2003, the majority of students at universities (53% of all enrolments)were enrolled for programmes of study in either teacher education or the broad humanities and social sciences.The emphasis at technikons was to a far greater extent on programmes in business and management (46%) andin science, engineering and technology (35%). This means that, in 2003, 81% of all technikon students were fol-lowing programmes in these fields.
Figure 15: Percentage distribution of headcount enrolments in public higher education institutions, by major field of study, in 2003
0
10
20
30
40
50
Perc
ent
Universities Technikons Total
24 24
33
35
46
7
12
27
31
15
27
19
Education Humanities & Social SciencesBusiness & ManagementSET
0
20
10
40
30
60
50
70
80
Perc
ent
Universities Technikons Total
7
51
13
10
1
71
0 2
21
9 75
58
19
Professional Undergraduate
Postgraduate < Master’s Master’s & Doctoral
3-Year UndergraduateOccasional
Figure 16: Percentage distribution of headcount enrolments in public higher education institutions, by qualification type, in 2003
26
Figure 16 (see also Table 14) shows that the technikon sector remained primarily an undergraduate one. In 2003,97% of all students in this sector were following either three-year undergraduate diploma courses or professionalfirst bachelor's degree courses. In 2003, 77% of students in the university sector were enrolled for undergraduatequalifications, including occasional courses.
Notes to Table 14 (continued)Note 4: Professional bachelor's degrees are those that have an approved formal time of more that four years. Examples include degrees such as B Tech, BSc (engineering), MB
ChB, BFA.Note 5: The category "below master's level" includes postgraduate and post-diploma diplomas, postgraduate bachelor's degrees, and honours degrees.Note 6: The Unisa total of occasional students includes 5 943 coded as "other".Note 7: Numbers and percentages may not necessarily add up, owing to rounding off.

Public HE institutions
2929
Table 15: Headcount enrolments of contact and distance mode students in public higher education institutions, by race, in 2003
Source: 2003 HEMIS database, November 2004.Abbreviations: HBU = historically black university, HWU = historically white university, HBT = historically black technikon, HWT = historically white technikon.Note 1 Contact students are those who are registered mainly for courses offered in contact mode.Note 2: Distance students are those who are registered mainly for courses offered in distance mode.Note 3: The totals in the table = total male + total female. Because students coded as "race unknown" are not included in the table, African+Coloured+Indian+White may, therefore,
not = the total columns. Note 4: Numbers and percentages may not necessarily add up, owing to rounding off.
Institution
HBUsDurban-WestvilleFort HareMedunsaNorthNorth WestTranskeiVendaVistaWestern CapeZululandTotals for HBUs
HWUsCape TownFree StateNatalPort ElizabethPotchefstroomPretoriaRand AfrikaansRhodesStellenboschWitwatersrandTotals for HWUs
UNISA
Totals forUniversities
6 4324 5183 391
10 6967 6175 6229 467
12 2285 4208 849
74 24083%
5 48311 6708 3243 3155 0059 8744 4402 2491 884
11 42163 665
33%12
2%137 917
49%
1702328145517
1342
6 85235
7 5378%
2 923829715918804521694300
2 498612
10 8146%294
57%18 645
7%
4 3785
2951030
1243
211 245
1196 230
7%
1 477350
8 151260246
1 6411 545
472481
3 65118 274
10%2
0%24 506
9%
29018
1695444
813
125356175
1 2521%
10 5557 1805 5913 157
10 58822 70511 9033 329
15 5848 562
99 15452%206
40%100 612
36%
11 2704 5643 883
10 7747 7465 7719 484
12 71914 043
9 17889 432100%
20 53320 02922 797
7 65016 84134 74118 582
6 35020 44724 250
192 220100%
514100%
282 166100%
6 3262 5842 0065 7224 5703 5714 3247 1137 9555 630
49 80156%
10 14211 36811 8144 207
10 01918 18410 108
3 62310 36511 879
101 70953%417
81%151 927
53%
4 9441 9801 8775 0523 1762 2005 1605 6066 0883 548
39 63144%
10 3918 661
10 9833 4436 822
16 5578 4742 727
10 08212 37190 511
47%97
19%130 239
47%
01 838
00
919705
07 800
00
11 26298%
0578
6 7946 5598 1746 8405 5501 037
8410
36 37383%
70 61250%
118 24764%
0100210
5100
550%
086
371143189
6174
12644
01 094
2%8 325
5%9 474
4%
0000010
1800
190%
0132
1 01333499271
110
01 401
3%18 613
11%20 033
8%
0200010
12600
1291%
01 159
950100814217221
1256
03 529
8%52 469
34%56 127
24%
01 841
00
921708
08 027
00
11 497100%
01 9559 1286 835
10 8887 2105 9161 176
9510
44 059100%
150 019100%
205 575100%
01 608
00
692519
05 192
00
8 01170%
0725
5 8214 6937 0655 2174 066
812790
029 189
66%83 442
57%120 642
61%
0233
00
229189
02 835
00
3 48630%
01 2303 3072 1423 8231 9931 850
364161
014 870
34%66 577
43%84 933
39%
ContactAfrican
1. Universities
HBTsBorderDurban Institute of Tech.Eastern CapeMangosuthuNorth WestNorthern GautengPeninsulaTotals for HBTs
HWTsCapeFree StatePort ElizabethPretoriaVaal TriangleWitwatersrandTotals for HWTs
Technikon SA
Totals forTechnikons
5 63814 370
8 5008 0195 088
12 9016 100
60 61685%
5 5226 0625 277
21 93114 34612 78665 924
69%0
126 54076%
26390
820
553 3603 841
5%
4 633415
1 315385221333
7 3028%
0
11 1437%
54 592
5315
414 652
7%
27738
193426
87537
1 5582%
0
6 2104%
621 600
1334
16292
1 9903%
5 8331 9682 6027 4691 2881 578
20 73822%
0
22 72814%
5 73120 952
8 5268 0275 093
13 0249 793
71 146100%
16 2658 4839 397
30 21115 94215 23495 532100%
0
166 678100%
3 52110 580
5 2174 0003 2186 7465 307
38 58954%
8 1904 1874 267
14 4057 7287 208
45 98548%
0
84 57451%
2 21010 372
3 3094 0271 8756 2784 486
32 55746%
8 0754 2965 130
15 8068 2148 026
49 54752%
0
82 10449%
00000000
0%
25295357
11 01600
11 69396%
36 37972%
48 07275%
00000000
0%
33997
24300
3821%
3 9066%
4 2886%
00000000
0%
010
11500
1161%
2 0184%
2 1343%
00000000
0%
265
1250
00
3182%
8 56818%
8 88616%
00000000
0%
30400445
11 62400
12 499100%
50 875100%
63 374100%
00000000
0%
15212320
6 16700
6 71445%
22 00042%
28 71443%
000000
00%
15188125
5 45700
5 78555%
28 87558%
34 66057%
2. Technikons
Universities
Technikons
Totals for PublicInstitutions
137 91749%
126 54076%
264 45759%
18 6457%
11 1437%
29 7887%
24 5069%
6 2104%
30 7167%
100 61236%
22 72814%
123 34027%
282 166100%
166 678100%
448 844100%
151 92753%
84 57451%
236 50153%
130 23947%
82 10449%
212 34347%
118 24764%
48 07275%
166 31967%
9 4744%
4 2886%
13 7625%
20 0338%
2 1343%
22 1677%
56 12724%
8 88616%
65 01322%
205 575100%
63 374100%
268 949100%
120 64261%
28 71443%
149 35656%
84 93339%
34 66057%
119 59344%
3. Summary
Coloured Indian White Total Female Male African Coloured Indian White Total Female MaleDistance

Public HE institutions
3030
Figure 17 (see also Table 15) shows that, in 2003, 60% of all students in the public higher education system wereAfrican, 26% were White, 7% were Indian, and 6% were Coloured. The proportion of African students did howevervary by sector and instruction mode. For example, African students accounted for a 49% share of contact pro-grammes at universities and a 76% share of contact programmes at technikons. In 2003, African students had anoverall share of 59% of contact programme enrolments and 67% of distance programme enrolments.
Figure 17: Percentage distribution of headcount enrolments in public higher education institutions, by contact/distance mode and race, in 2003
0
10
20
30
40
50
60
70
80
African
60
Coloured
7 5
Indian7 7 7
White
27
22
26
Distance Mode TotalContact Mode
Perc
ent
6
59
67
Figure 18: Percentage distribution of headcount enrolments in public higher education institutions, bycontact/distance mode and gender, in 2003
0
10
20
30
40
50
60
Contact Mode
53
47
Distance Mode
56
44
Total
54
46
MaleFemale
Perc
ent
Figure 18 (see also Table 15) shows that, in 2003, female students were in the majority in both contact pro-grammes (53%) and distance programmes (56%) at universities and technikons. Overall, 54% of the students inthe system were female.
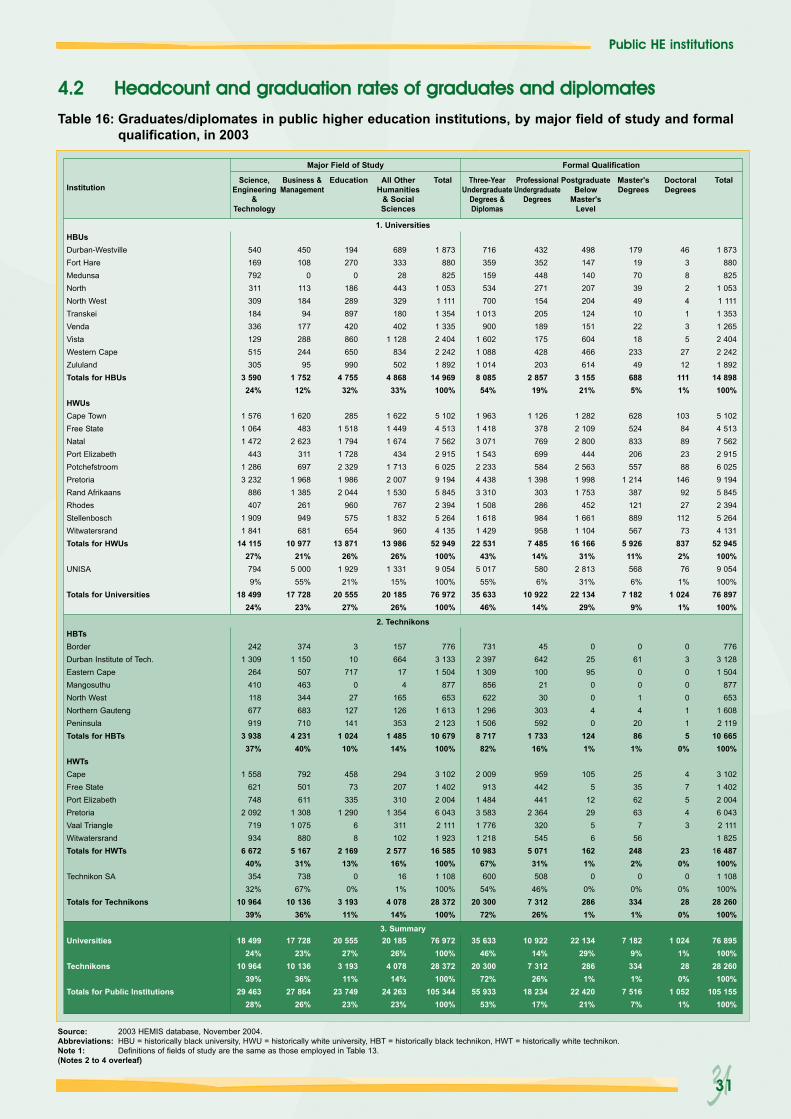
Public HE institutions
3131
44..22 HHeeaaddccoouunntt aanndd ggrraadduuaattiioonn rraatteess ooff ggrraadduuaatteess aanndd ddiipplloommaatteess
Table 16: Graduates/diplomates in public higher education institutions, by major field of study and formalqualification, in 2003
Source: 2003 HEMIS database, November 2004.Abbreviations: HBU = historically black university, HWU = historically white university, HBT = historically black technikon, HWT = historically white technikon.Note 1: Definitions of fields of study are the same as those employed in Table 13.(Notes 2 to 4 overleaf)
Institution
HBUsDurban-WestvilleFort HareMedunsaNorthNorth WestTranskeiVendaVistaWestern CapeZululandTotals for HBUs
HWUsCape TownFree StateNatalPort ElizabethPotchefstroomPretoriaRand AfrikaansRhodesStellenboschWitwatersrandTotals for HWUs
UNISA
Totals for Universities
540169792311309184336129515305
3 59024%
1 5761 0641 472
4431 2863 232
886407
1 9091 841
14 11527%7949%
18 49924%
450108
0113184
94177288244
951 75212%
1 620483
2 623311697
1 9681 385
261949681
10 97721%
5 00055%
17 72823%
194270
0186289897420860650990
4 75532%
2851 5181 7941 7282 3291 9862 044
960575654
13 87126%
1 92921%
20 55527%
689333
28443329180402
1 128834502
4 86833%
1 6221 4491 674
4341 7132 0071 530
7671 832
96013 986
26%1 33115%
20 18526%
1 873880825
1 0531 1111 3541 3352 4042 2421 892
14 969100%
5 1024 5137 5622 9156 0259 1945 8452 3945 2644 135
52 949100%9 054100%
76 972100%
716359159534700
1 013900
1 6021 0881 0148 08554%
1 9631 4183 0711 5432 2334 4383 3101 5081 6181 429
22 53143%
5 01755%
35 63346%
432352448271154205189175428203
2 85719%
1 126378769699584
1 398303286984958
7 48514%5806%
10 92214%
498147140207204124151604466614
3 15521%
1 2822 1092 800
4442 5631 9981 753
4521 6611 104
16 16631%
2 81331%
22 13429%
17919703949102218
23349
6885%
628524833206557
1 214387121889567
5 92611%5686%
7 1829%
463824135
2712
1111%
10384892388
1469227
11273
8372%76
1%1 024
1%
1 873880825
1 0531 1111 3531 2652 4042 2421 892
14 898100%
5 1024 5137 5622 9156 0259 1945 8452 3945 2644 131
52 945100%9 054100%
76 897100%
Science,Engineering
&Technology
Business &Management
Education All OtherHumanities
& SocialSciences
Total Three-YearUndergraduate
Degrees &Diplomas
ProfessionalUndergraduate
Degrees
PostgraduateBelow
Master'sLevel
Master'sDegrees
DoctoralDegrees
Total
Major Field of Study
1. Universities
HBTsBorderDurban Institute of Tech.Eastern CapeMangosuthuNorth WestNorthern GautengPeninsulaTotals for HBTs
HWTsCapeFree StatePort ElizabethPretoriaVaal TriangleWitwatersrandTotals for HWTs
Technikon SA
Totals for Technikons
2421 309
264410118677919
3 93837%
1 558621748
2 092719934
6 67240%354
32%10 964
39%
3741 150
507463344683710
4 23140%
792501611
1 3081 075
8805 16731%738
67%10 136
36%
310
7170
27127141
1 02410%
45873
3351 290
68
2 16913%
00%
3 19311%
157664
174
165126353
1 48514%
294207310
1 354311102
2 57716%
161%
4 07814%
7763 1331 504
877653
1 6132 123
10 679100%
3 1021 4022 0046 0432 1111 923
16 585100%1 108100%
28 372100%
7312 3971 309
856622
1 2961 5068 71782%
2 009913
1 4843 5831 7761 218
10 98367%600
54%20 300
72%
45642100
2130
303592
1 73316%
959442441
2 364320545
5 07131%508
46%7 31226%
02595
0040
1241%
1055
1229
56
1621%
00%2861%
061
0014
2086
1%
25356263
756
2482%
00%3341%
03000115
0%
47543
230%
00%28
0%
7763 1281 504
877653
1 6082 119
10 665100%
3 1021 4022 0046 0432 1111 825
16 487100%1 108100%
28 260100%
2. Technikons
Universities
Technikons
Totals for Public Institutions
18 49924%
10 96439%
29 46328%
17 72823%
10 13636%
27 86426%
20 55527%
3 19311%
23 74923%
20 18526%
4 07814%
24 26323%
76 972100%
28 372100%
105 344100%
35 63346%
20 30072%
55 93353%
10 92214%
7 31226%
18 23417%
22 13429%2861%
22 42021%
7 1829%3341%
7 5167%
1 0241%28
0%1 052
1%
76 895100%
28 260100%
105 155100%
3. Summary
Formal Qualification

Public HE institutions
3232
Table 17: Summaries of key graduation rates in public higher education institutions in 2003
Source: 2003 HEMIS database, November 2004.Abbreviations: HBU = historically black university, HWU = historically white university, HBT = historically black technikon, HWT = historically white technikon. Note 1: These graduation rates serve as proxies for throughput rates of cohorts of students. A detailed account of benchmarks related to these graduation rates can be seen in The
National Plan for Higher Education (Department of Education: 2001).Note 2: Different undergraduate percentages have been set for universities and technikons, because of problems encountered with the ways in which some technikons are reporting
their BTech enrolments. Note 3: The benchmarks in the National Plan were set on the basis that at least 75% of any cohort of students entering a programme should complete their degrees or diplomas.
When converted to graduation rates, the cohort throughput rates in the table above are equivalent to graduation rates of, broadly, the following kind:
Undergraduate Master's DoctoralContact programmes 25% 33% 20%Distance programmes 15% 25% 15%
Note 4: Numbers and percentages may not necessarily add up, owing to rounding off.Note 5: n.a. = not applicable.
Notes to Table 16 (continued)Note 2: Definitions of formal qualifications are the same as those employed in Table 14.Note 3: Numbers and percentages may not necessarily add up, owing to rounding off.Note 4: Some institutions have included occasional students in their graduation figures. These students were included in the Major Field of Study section but were excluded from the
Formal Qualification section, as they do not qualify for a formal qualification. This results in differences between the two sections for these institutions.
Institution
HBUsDurban-WestvilleFort HareMedunsaNorthNorth WestTranskeiVendaVistaWestern CapeZululandAverages for HBUsHWUsCape TownFree StateNatalPort ElizabethPotchefstroomPretoriaRand AfrikaansRhodesStellenboschWitwatersrandAverages for HWUs UNISAAverages for Universities
121128
914341412152114
2617242020232433221722
514
n.a.n.a.n.a.n.a.n.a.n.a.n.a.n.a.n.a.n.a.n.a.
n.a.n.a.n.a.n.a.n.a.n.a.n.a.n.a.n.a.n.a.n.a.n.a.n.a.
188
1439
1167
171111
21192420262121242414211118
141313
38
100118
119
11
13161413171016141512131013
Three-Year Undergraduate Degrees& Diplomas (%)
1. Universities
HBTsBorderDurban Institute of Tech.Eastern CapeMangosuthuNorth WestNorthern GautengPeninsulaAverages for HBTs HWTsCapeFree StatePort ElizabethPretoriaVaal TriangleWitwatersrandAverages for HWTs Technikon SAAverages for Technikons
n.a.n.a.n.a.n.a.n.a.n.a.n.a.n.a.
n.a.n.a.n.a.n.a.n.a.n.a.n.a.n.a.n.a.
1415171113132212
19162115131216
212
026
00
504
148
72116
39
23708
017
000
509
10
1515115
210
100
10
2. Technikons
Universities
Technikons
14
n.a.
n.a.
12
18
8
13
10
3. Summary
Undergraduate Diplomas & Btech(%)
Master's Degrees(%)
Doctoral Degrees(%)
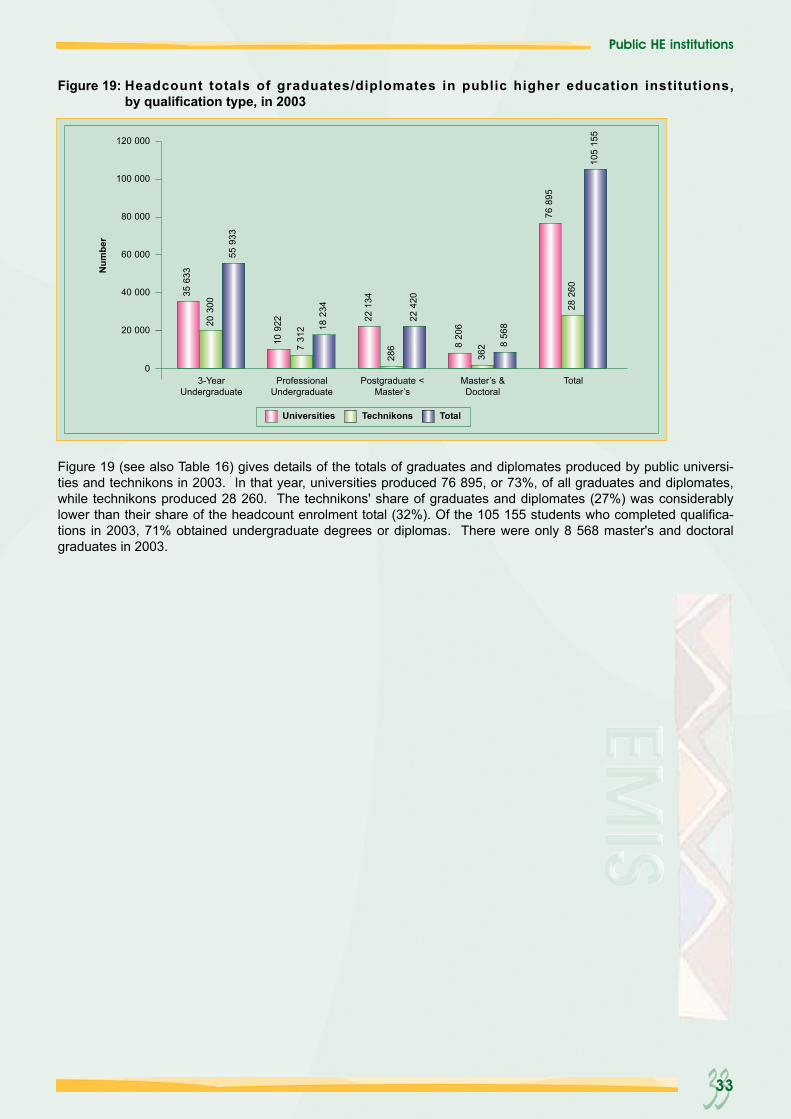
Public HE institutions
3333
Figure 19 (see also Table 16) gives details of the totals of graduates and diplomates produced by public universi-ties and technikons in 2003. In that year, universities produced 76 895, or 73%, of all graduates and diplomates,while technikons produced 28 260. The technikons' share of graduates and diplomates (27%) was considerablylower than their share of the headcount enrolment total (32%). Of the 105 155 students who completed qualifica-tions in 2003, 71% obtained undergraduate degrees or diplomas. There were only 8 568 master's and doctoralgraduates in 2003.
Figure 19: Headcount totals of graduates/diplomates in public higher education institutions, by qualification type, in 2003
0
20 000
40 000
60 000
80 000
100 000
120 000
3-YearUndergraduate
ProfessionalUndergraduate
Postgraduate <Master’s
Master’s &Doctoral
Total
35 6
33
20 3
00
55 9
33
10 9
22
7 31
2 18 2
34
22 1
34
22 4
20
8 20
6
76 8
95
28 2
60
105
155
362 8
568
Technikons TotalUniversities
Num
ber
286

Public HE institutions
3434
44..33 FFuullll-ttiimmee eeqquuiivvaalleenntt ((FFTTEE)) eennrroollmmeennttss aanndd uunnddeerrggrraadduuaattee ssuucccceessss rraatteess
Table 18: Full-time equivalent enrolments of contact and distance mode students in public higher education institutions in 2003
Source: 2003 HEMIS database, November 2004.Abbreviations: HBU = historically black university, HWU = historically white university, HBT = historically black technikon, HWT = historically white technikon. Note 1: Full-time equivalent (FTE) student enrolments are calculated (a) by assigning to each course a fraction representing the weighting it has in the curriculum of a qualification,
and (b) by multiplying the headcount enrolment of that course by this fraction.Note 2: FTE contact students are those who are registered mainly for courses offered in contact mode.Note 3: FTE distance students are those who are registered mainly for courses offered in distance mode.Note 4: Definitions for fields of study employed here are the same as those employed in Table 13. (Notes 5 to 8 next page)
Institution
HBUsDurban-WestvilleFort HareMedunsaNorthNorth WestTranskeiVendaVistaWestern CapeZululandTotals for HBUs
HWUsCape TownFree StateNatalPort ElizabethPotchefstroomPretoriaRand AfrikaansRhodesStellenboschWitwatersrandTotals for HWUs
UNISA
Totals for Universities
3 6041 0862 7022 7311 6791 3742 1422 5163 1501 960
22 94432%
6 6255 0306 3851 8564 086
11 3103 3201 2716 6188 451
54 95236%
0
77 89635%
1 384746
2775
1 035579754
2 1631 124
9009 46113%
2 7882 0733 597
9552 3025 5764 709
7912 8442 655
28 29119%
0
37 75217%
39174
91 448
714806598769754
1 7567 32010%
6382 521
870488
2 5072 227
942435617
1 15412 398
8%0
19 7199%
4 1762 563
2553 1012 3972 3163 4275 5655 8612 666
32 32745%
7 0495 4436 5812 6944 7298 5256 7022 8226 3356 158
57 03737%490
100%89 854
40%
9 5554 4682 9698 0555 8255 0766 920
11 01410 889
7 28272 052100%
17 10115 06617 433
5 99213 62227 63915 673
5 31916 41418 418
152 678100%
490100%
225 220100%
00000
1800
76600
94612%
035
83531
25630
171070
1 3666%
5 1698%
7 4818%
0000000
54400
5447%
0216
3 6590
1786710
000
4 13119%
22 37836%
27 05229%
0789
00
845560
02 112
00
4 30756%
00
7413 1713 5292 6932 751
648239
013 771
64%6 11310%
24 19126%
0000000
1 95500
1 95525%
0810315
4981
29124
000
2 26411%
29 17846%
33 39736%
0789
00
845740
05 377
00
7 752100%
01 0615 5493 2074 9452 8193 056
648246
021 531100%
62 838100%
92 121100%
Science,Engineering &
Technology
Contact
1. Universities
HBTsBorderDurban Institutte of Tech.Eastern CapeMangosuthuNorth WestNorthern GautengPeninsulaTotals for HBTs
HWTsCapeFree StatePort ElizabethPretoriaVaal TriangleWitwatersrandTotals for HWTs
Technikon SA
Totals for Technikons
1 3497 2972 3592 9581 4843 7893 484
22 72040%
5 8802 8892 8169 1904 4475 679
30 90243%
0
53 62242%
2 0774 9192 6521 6611 3383 4531 943
18 04332%
3 1262 1272 2755 2844 5883 919
21 32030%
0
39 36331%
065
1 26400
797355
2 4804%
1 035162269222
1123
1 7222%
0
4 2023%
1 3904 0681 0701 6301 4452 1241 497
13 22323%
2 6911 7341 5067 3142 4241 651
17 32024%
0
30 54324%
4 81616 348
7 3456 2494 268
10 1627 278
56 467100%
12 7326 9126 866
22 01111 47111 27271 264100%
0
127 730100%
00000000
0%
19761622
00
1332%
5 10120%
5 23416%
00000000
0%
0124
383
00
2103%
9 30936%
9 52029%
00000000
0%
01
3594 812
00
5 17273%
970%
5 27016%
00000000
0%
0103
21 434
00
1 53922%
11 22144%
12 76039%
00000000
0%
19304380
6 35100
7 055100%
25 728100%
32 783100%
1. Technikons
Universities
Technikons
Totals for PublicInstitutions
77 89635%
53 62242%
131 51837%
37 75217%
39 36331%
77 11422%
19 7199%
4 2023%
23 9217%
89 85440%
30 54324%
120 39734%
225 220100%
127 730100%
352 950100%
7 4818%
5 23416%
12 71510%
27 05229%
9 52029%
36 57229%
24 19126%
5 27016%
29 46124%
33 39736%
12 76039%
46 15737%
92 121100%
32 783100%
124 904100%
3. Summary
Distance
Business &Management
Education All OtherHumanities &
Social Sciences
Total Science,Engineering &
Technology
Business &Management
Education All OtherHumanities &
Social Sciences
Total

Public HE institutions
3535
Table 19: Undergraduate success rates of contact and distance mode students in public higher educationinstitutions, by race, in 2003
Source: 2003 HEMIS database, November 2004.Abbreviations: HBU = historically black university, HWU = historically white university, HBT = historically black technikon, HWT = historically white technikon. Note 1: For universities, undergraduate courses are those coded as lower undergraduate, intermediate undergraduate and higher undergraduate.Note 2: For technikons, undergraduate courses are those coded as lower prediplomate, intermediate prediplomate and higher undergraduate.Note 3: Success rates are determined as follows: a calculation is made of full-time equivalent (FTE) enrolled student totals for each category of courses. A further FTE calculation,
using the same credit values, is made for each category of courses for those students who passed the courses. The success rates are then determined as: FTE passesdivided by FTE enrolments. The success rates shown are, therefore, weighted averages for contact and distance courses for each population group.
Note 4: Numbers and percentages may not necessarily add up, owing to rounding off.Note 5: n.a. = not applicable.
Notes to Table 18 (continued)Note 5: The totals above include undergraduate and postgraduate courses.Note 6: Students from Qwa-Qwa are included in University of the Free State totals.Note 7: Adjustments have to be made to the 2003 distance totals for Unisa. The totals above are those for 2002.Note 8: Numbers and percentages may not necessarily add up, owing to rounding off.
Institution
HBUsDurban-WestvilleFort HareMedunsaNorthNorth WestTranskeiVendaVistaWestern CapeZululandAverages for HBUsHWUsCape TownFree StateNatalPort ElizabethPotchefstroomPretoriaRand AfrikaansRhodesStellenboschWitwatersrandAverages for HWUsUNISAAverages for Universities
7472907072647855627569
76657871657166816469716070
8073877465853156666766
80678373757869807070758171
7970907075915648707978
8566847184797483817680n/a80
8945947773646459847881
90819186858482908486859085
7772907072657855657570
84738478808178868276808376
n.a.57
n.a.n.a.4391
n.a.51
n.a.n.a.55
n.a.62697463727096
n.a.n.a.724855
n.a.100n.a.n.a.23
100n.a.51
n.a.n.a.52
n.a.705687807963
100n.a.n.a.764851
n.a.n.a.n.a.n.a.n.a.100n.a.55
n.a.n.a.58
n.a.835272768957
100n.a.n.a.625454
n.a.100n.a.n.a.n.a.100n.a.73
n.a.n.a.74
n.a.765696808863
100n.a.n.a.755960
n.a.58
n.a.n.a.4391
n.a.52
n.a.n.a.55
n.a.70677565737096
n.a.n.a.715356
Contact (%)African Coloured
1. Universities
HBTsBorderDurban Institute of Tech.Eastern CapeMangosuthuNorth WestNorthern GautengPeninsulaAverages for HBTsHWTsCapeFree StatePort ElizabethPretoriaVaal TriangleWitwatersrandAverages for HWTsTechnikon SAAverages for Technikons
6868707367667269
69696867697269
n.a.69
85747569
0847978
78677471697276
n.a.77
73769187
0938776
78767573658177
n.a.76
7782795065768782
85818279778382
n.a.82
6871707367667470
77727370707373
n.a.71
n.a.n.a.n.a.n.a.n.a.n.a.n.a.n.a.
94577244
n.a.n.a.463739
n.a.n.a.n.a.n.a.n.a.n.a.n.a.n.a.
100798941
n.a.n.a.624850
n.a.n.a.n.a.n.a.n.a.n.a.n.a.n.a.
0100
049
n.a.n.a.505858
n.a.n.a.n.a.n.a.n.a.n.a.n.a.n.a.
90849252
n.a.n.a.615757
n.a.n.a.n.a.n.a.n.a.n.a.n.a.n.a.
95637546
n.a.n.a.494243
2. Technikons
UniversitiesTechnikonsAverage for Public Institutions
706969
717773
807679
858285
767174
553949
515051
545854
605759
564352
3. Summary
Indian White Average African Coloured Indian White AverageDistance (%)

Public HE institutions
3636
Figure 20 (see also Table 18) shows that the full-time equivalent (FTE) student enrolment at universities and tech-nikons was 477 854 in 2003. The ratios with regard to distance and contact mode differed markedly between FTEand headcount totals. The contact FTE total of 352 950 was 79% of the corresponding headcount total, whichimplies that most contact students were studying full-time in that year. The ratio for distance students was 46%,which implies that, in 2003, distance students were, on average, following the equivalent of less than half of a full-time curriculum.
Figure 20: Full-time equivalent student enrolments in public higher education institutions, by contact/distance mode, in 2003
0
100 000
200 000
300 000
400 000
500 000
600 000
Num
ber
Contact Mode Distance Mode Total
225
220
127
730
352
950
92 1
21
32 7
83
124
904
317
341
160
513
477
854
Technikons TotalUniversities
Figure 21 (see also Table 19) shows that inequalities of outcome continue to exist in the higher education system.In 2003, the average success rate of African students in contact undergraduate programmes at universities wasonly 70%, compared to an average of 85% for White students. The success rate of African students in contactundergraduate programmes at technikons in 2003 was 69%, compared to an average of 82% for White students.
Figure 21: Percentage distribution of average undergraduate success rates in public higher educationinstitutions, by contact education programmes and race, in 2003
0
10
20
30
40
50
60
70
80
90
Perc
ent
African Coloured Indian White Total
70 69 71
77 80
76
85
82
76
71
TechnikonsUniversities

Public HE institutions
3737
44..44 PPeerrmmaanneenntt ssttaaffff
Table 20: Overview of permanent staff in public higher education institutions in 2003
Source: 2003 HEMIS database, November 2004.Abbreviations: HBU = historically black university, HWU = historically white university, HBT = historically black technikon, HWT = historically white technikon. Note 1: A permanent staff member is defined as an employee who contributes to an institutional pension or retirement fund.Note 2: Instruction/research staff (also referred to as academic staff) are those who spend more than 50% of their official time on duty on instruction and research activities.Note 3: The category "administrative staff" includes all executive and professional staff who spend less than 50% of their official time on duty on instruction and research activities,
as well as all technical and office staff.Note 4: The category "service staff" includes all staff, such as cleaners, gardeners, security guards and messengers, who are not engaged in supervisory or administrative functions
linked to an office.Note 5: Black staff, for the purpose of this summary table, includes all African, Coloured and Indian staff on permanent contracts.Note 6: Numbers and percentages may not necessarily add up, owing to rounding off.
Institution
HBUsDurban-WestvilleFort HareMedunsaNorthNorth WestTranskeiVendaVistaWestern CapeZululandTotals for HBUsHWUsCape TownFree StateNatalPort ElizabethPotchefstroomPretoriaRand AfrikaansRhodesStellenboschWitwatersrandTotals for HWUsUNISATotals for Universities
345190413342184170268430448242
3 032
779517
1 058267531
1 524432334809448
6 6991 090
10 821
539400389431228158271428589254
3 687
1 487558
1 747375705
1 285701541
1 319589
9 3071 906
14 900
14957
443135208189216
88109190
1 784
244298329128291587239353363109
2 941171
4 896
7766667690938849606570
1713
418
81113131160202334
9785638796989769947986
56166833102028452694424453
100100100100100100100
97100
99100
97969993918991
10099
10095
10097
3731383136462945453838
33403944394442363645405141
4252605054634460584653
65626762696964635958645660
3518433246475733283641
30532141503010432828331335
Total Permanent Staff
1. Universities
HBTsBorderDurban Institute of Tech.Eastern CapeMangosuthuNorth WestNorthern GautengPeninsulaTotals for HBTsHWTsCapeFree StatePort ElizabethPretoriaVaal TriangleWitwatersrandTotals for HWTsTechnikon SATotals for Technikons
146544173147107227214
1 558
345145248550308383
1 979176
3 71
117616165161189269341
1 858
411272334882374379
2 652860
5 370
21132
21151
69180
72646
119199
66244249244
1 12170
1 837
5258907889637168
201514153226213841
7984938898859689
523846345555455161
10099
100100100100100100
979094989899979798
4443413031363539
374238414643414440
6652524443474750
616258606154596056
2920105462632244
345227385939445945
2. Technikons
UniversitiesTechnikonsTotals/Averages for PublicInstitutions
10 8213 713
14 534
14 9005 370
20 270
4 8961 8376 733
344136
536155
979897
414041
605659
354538
3. Summary
Instruction &Research Staff
AdministrativeStaff Service Staff Instruction &
Research StaffAdministrative
Staff Service Staff Instruction &Research Staff
AdministrativeStaff Service Staff
% of Black Staff in Total % of Female Staff in Total

Public HE institutions
3838
Figure 22 (see also Table 20) points to the serious employment inequalities that existed in the higher educationsystem in 2003. Black (African, Coloured and Indian) staff had only a 34% share of permanently appointed aca-demic (instruction and research) staff posts at universities, and a 41% share of these posts at technikons. Femalestaff had a 41% share of permanently appointed academic staff posts at universities, and a 40% share of theseposts at technikons.
Figure 22: Percentage distribution of black and female staff in public higher education institutions, as a percentage of total permanent staff, in 2003
TechnikonsUniversities
0
20
10
40
30
60
50
70Pe
rcen
t
Black Academic Staff
34
41
FemaleAcademic Staff
41 40Black
Admin Staff
53
61
FemaleAdmin Staff
60
56

Contact details
3939
55.. CCOONNTTAACCTT DDEETTAAIILLSS
55..11 PPrroovviinncciiaall EEMMIISS uunniittss
Provincial and institutional information (contact details, etc.) may be requested (preferably by e-mail) fromthe following provincial Education Management Information Systems (EMIS) Units:
Eastern Cape Department of Education Free State Department of EducationMr Zolile Ngaba Mr Frans KokHead, EMIS Unit Head, EMIS UnitPrivate Bag X0032, Bisho, 5605 Private Bag X20565, Bloemfontein, 9300E-mail: [email protected] E-mail: [email protected].: 043-735 1820/1 or 040-608 4246 Tel.: 051-404 8089Fax: 043-735 1993 or 040-608 4239 Fax: 051-404 8094
Gauteng Department of Education KwaZulu-Natal Department of EducationMr Mohammad Sujee Mr Patrick ButheleziActing Head, EMIS Unit Head, EMIS Unit PO Box 7710, Johannesburg, 2000 Private Bag X05, Rossburg, 4072E-mail: [email protected] E-mail: [email protected].: 011-355 1783/1777 Tel.: 031-274 4920Fax: 011-355 0670 Fax: 031-205 1704
Limpopo Department of Education Mpumalanga Department of EducationMr Ngwako Mateta Mr Wimpie BarnardHead, EMIS Unit Head, EMIS UnitPrivate Bag X9489, Polokwane, 0700 Private Bag X11341, Nelspruit, 1200E-mail: [email protected] E-mail: [email protected].: 015-290 7941 Tel.: 013-766 5492Fax: 015-297 4452 Fax: 013-766 5592
North West Department of Education Northern Cape Department of EducationMr Bradley Page Mr Danny MothobiHead, EMIS Unit Head, EMIS UnitPrivate Bag X2044, Mafikeng, 2745 Private Bag X5020, Kimberley, 8301E-mail: [email protected] E-mail: [email protected].: 018-381 2017 Tel.: 053-839 6641Fax: 018-381 2015 Fax: 053-839 6580
Western Cape Department of EducationMr Kevin TabisherHead, EMIS UnitPrivate Bag X9114, Cape Town, 8000E-mail: [email protected].: 021-467 2289Fax: 021-425 7445

Contact details
4040
55..22 DDeeppaarrttmmeenntt ooff EEdduuccaattiioonn
Information on different sectors of the education system may be requested (preferably by e-mail) from thefollowing members of the Department of Education and the Directorate: Education Management Informa-tion Systems:
Director: EMISMr Siza ShongweDepartment of EducationWaterbron Building, 191 Schoeman Street, Pretoria, 0001 Postal Address: Private Bag X895, Pretoria, 0001Tel.: 012-312 6092Fax: 012-312 5983/5909E-mail: [email protected]
General EnquiriesMs Rose MoreTel.: 012-312 5958E-mail: [email protected]
Queries/Data Dissemination/Data Analysis/PublicationsMr Christo LombaardTel.: 012-312 5961E-mail: [email protected]
Mr Jacques AppelgrynTel: 012-312 5960E-mail: [email protected]
Public Higher EducationMr Hennie De BeerTel.: 012-312 5098E-mail: [email protected]
Senior Certificate Examination ResultsMs Khosi Malindi, Director: National Examinations and AssessmentTel.: 012-312 5860E-mail: [email protected]
Data on private Further Education and Training (FET) and Higher Education institutions are not included inthis publication and may be obtained from the following persons:
Private FETMr Steve Mommen, Director: Public FET CollegesTel.: 012-312 5520E-mail: [email protected]
Private Higher EducationMs Katjie MokobotoTel.: 012-312 5320E-mail: [email protected]

Acknowledgements
4141
AACCKKNNOOWWLLEEDDGGEEMMEENNTTSSThis publication has been produced with assistance and information from the following:
● Directorates within the Department of Education● Provincial Departments of Education (EMIS units)● Statistics South Africa


Scope of the publication:
● General Education and Training (GET) Band(including ordinary schools with foundation, interme-diate and senior phases. Stand-alone ABET centresand ELSEN (special) schools excluded)
● Further Education and Training (FET) Band (including mainstream schools with FET grades.Stand-alone ELSEN (special) schools excluded)
● Further Education and Training (FET) (2002)(including public FET institutions, previously knownas technical colleges)
● Early Childhood Development (ECD) (2000)(including stand-alone ECD sites)
● Adult Basic Education and Training (ABET)(including stand-alone public adult learning centres)
● Education for Learners with Special EducationNeeds (ELSEN)(including stand-alone schools)
● Higher Education (HE)(including public universities and technikons)
Did you know that in 2003...30 in every 100 people in South Africa were learnersin the education and training system?
32 751 institutions, comprising the following, wereregistered with the Department of Education:● 26 845 ordinary public and independent schools● 3 486 ECD sites● 1 933 ABET centres● 402 ELSEN (special) schools● 50 public FET institutions● 35 public HE institutions
Of every 1 000 learners in the education system inSouth Africa:● 857 were in ordinary public schools● 52 were in public HE institutions● 30 were in public FET institutions● 22 were in ordinary independent schools● 19 were in ABET centres● 15 were in ECD sites● 6 were in ELSEN (special) schools