education sector development program esdp i (2007-2010) · education sector development program i...
TRANSCRIPT

EDUCATION SECTOR DEVELOPMENT PROGRAM
ESDP I (2007-2010)
MAIN REPORT:
From Sub-Sectorwide to a Sectorwide Approach for Effective and Accountable Schools
August 2006
TA Number 4754 (NEP) : Preparing the Education Sector Development Program I

1
PREFACE In 2002, the Government of Nepal embarked on a broad-ranging program to reduce poverty and
develop the country along both economic and social dimensions. Human resource development, including education and training, was a critical component of the strategy presented in the 2002-2007 national development plan, the Tenth Plan /Poverty Reduction Strategy. By 2006, Nepal had registered some improvements in human resource development indicators: access to primary school was nearly 90%, secondary education opportunities were growing steadily, and the number of people with advanced training and skills was rising. These gains demonstrated a continued and growing commitment at the government and household levels to education and training as a means of raising living standards. Despite these gains, the Government recognized serious challenges ahead in terms of school quality, learning achievement, and greater equity in education attainment for disadvantaged groups from nursery through tertiary levels. Recent political events have placed pressure on the Government to formulate an education agenda that aligns sectoral priorities with the emerging political and development agendas.
In April 2006, mass social and political movements achieved an end to monarchic direct rule,
the restoration of Parliament under a multi-party system, and the re-entry of the Maoist party into the political process after ten years of armed insurgency. By July 2006, a new Constitution was being drafted which would likely be followed by new decentralization and sectoral laws including revisions to the current Education Act. Although the specifics of education sector reform are still under debate, several themes emerged during the run up to the events of April 2006 indicating areas for discussion and reflection. Among which are: education’s role in achieving a more equitable distribution of development benefits; education systems that prepare school graduates for an increasingly modern economy while assuring the maintenance of unique cultural traditions; and the targeting of education investments in view of scarce financial resources and persistent inequities.
. The Asian Development Bank was requested by the Government of Nepal to finance the
Education Sector Development Program I (ESDP I), an investment addressing both on-going and emerging issues; in response, a Program Preparatory Technical Assistance (PPTA) was approved in 2005. The PPTA team was mobilized in March and April 2006 and, despite general strikes, curfews, mass demonstrations, demobilization and remobilization, the team was able to prepare a series of technical papers, including this Main Report that provides an overall description of ESDP I, and five technical reports: Volume I: Preparation and Transition to a 1-12 School System; Volume II: Public Expenditure Review for the Education Sector; Volume III: Accountability for Teaching and Learning; Volume IV: School Finance and Governance; Volume V: Analysis of the Political, Social and Economic Dimensions of Inclusive Education in Nepal.
The PPTA team wishes to thank a large number of Government officials who assisted with the
preparation of these papers, primarily members of the Policy Analysis Core Group, comprised of personnel from the Ministry of Education and Sports (MoES) and the Department of Education (DoE) in Kathmandu. The team is also grateful for the leadership provided by the ESDP I Steering Committee, particularly by its chair, the officiating Secretary of Education, Mr. Ram Sarobar Dubey, and is appreciative of the guidance received from Committee members who represented the National Planning Commission, Ministry of Finance, National Women’s Commission, National Dalit Commission, MoES and DoE. As the civil turbulence caused many planned field consultations to be abbreviated or cancelled, the team is particularly appreciative of the help provided in the Banke, Kaski and Surkhet districts by representatives from District Offices of the DoE, school principals, and school management committees. The team would also like to extend its thanks to the many

2
officials from donor agencies and NGOs who assisted with the provision of data or critical review s of draft reports.
As Team Leader, I wish to thank Ms. Ayako Inagaki, Senior Education Specialist, Asian
Development Bank, for her patience and leadership and Mr. Krishna Panday, Program Specialist, for sharing his extensive knowledge with the PPTA team. Ms. Inagaki assembled an outstanding group of professionals who were able to work under highly unfavorable conditions, including general strikes, mass demonstrations involving tens then hundreds of thousands of people, de-mobilization and re-mobilization; despite these challenges, the team prepared high-quality analyses in a remarkably short period of time. My appreciation and admiration goes to my Co-Team Leader, Gajendra Man Shrestha and the policy specialists Ishwor Prasad Upadhyaya and Vishnu Karki who prepared ESDP I Support Volume I: Transition to a 1-12 School Sector. Sachiko Kataoka, education economist, who prepared Volume II: Public Expenditure Review for the Education Sector, merits special recognition as she undertook nearly all of the PPTA Team’s data analysis and prepared most of the tables and figures that appear in this Main Report. I am grateful to Simon Mendoza, finance expert, whose tasks not only included preparation of Volume IV: School Finance and Governance but also an analysis of the compatibility between EFA and ADB requirements and calculations cost estimates. Michele Moffat, poverty and gender specialist, who prepared Volume V: Analysis of the Political, Social and Economic Dimensions of Inclusive Education in Nepal, was instrumental in keeping the team on-track in terms of social issues and conflict prevention. I would also like to thank our principal researchers: Bishwa Nath Tiwari, Gyaneshwor Amatya, and Mona Wagle whose efforts and contributions greatly enriched the program preparation process.
Fredi Munger PPTA Team Leader August 2006
3
GLOSSARY ADB Asian Development Bank ADF Asian Development Fund ADTA Advisory Technical Assistance ASIP Annual Strategic Implementation Plan AWPB Annual Work Plan and Budget CBS Central Bureau of Statistics Dalit Any of the historically disadvantaged castes of low rank Danida Danish Agency for International Development DAP Development Action Plan DDC District Development Committee DEO District Education Office DfID Department for International Development, United Kingdom DoE Department of Education, Nepal DTCO District Treasury Comptroller's Office EFA Education for All ESDP I Education Sector Development Program I FAR Financial Administration Regulations FCGO Financial Controller General Office Finida Finish Agency for International Development FMR Financial Monitoring Reports GER Gross Enrolment Ratio GoN Government of Nepal HDI Human Development Index HSEB Higher Secondary Education Board Janajati Indigenous peoples JFA Joint Financing Agreement JICA Japan International Cooperation Agency JRM Joint Review Mission ICB International Competitive Bidding IDP Internally Displaced Persons INGOs International Non-Governmental Organizations LSGA Local Self Government Act MoES Ministry of Education and Sports MoF Ministry of Finance MolD Ministry of Local Development MTEF Medium Term Expenditure Framework MTR Mid-Term Report NER Net Enrolment Ratio NGOs Non-Government Organization NLSS National Living Standards Survey Norad Norwegian Agency for Development Cooperation NPC National Planning Commission OAG Office of the Auditor General PPTA Program Preparatory Technical Assistance PTA Parent Teacher Association PWD Public Works Directive PRSP Poverty Reduction Strategy Paper Red Book Government’s Official detailed budget

4
SESP Secondary Education Support Program SIP School Improvement Plan SMC School Management Committee SSA School Sector Approach SWAp Sectorwide Approach TEP Teacher Education Project TRSE Technical Review of School Education UNFPA United Nations Population Fund UNICEF United Nations Children’s Fund VDC Village Development Committee WFP World Food Program
5
TABLE OF CONTENTS Preface .............................................................................................................................1 Glossary............................................................................................................................3 Table of Contents .............................................................................................................5 Executive Summary..........................................................................................................7
Introduction ...................................................................................................................7 Policy and Action Framework........................................................................................8 Education Sector Overview...........................................................................................9 Issues and Opportunities ............................................................................................11
I. Economic Context.......................................................................................................16 Macroeconomic Context : Economic Structure, Trends and Performance ................16 The Labor Market ........................................................................................................19 Poverty ........................................................................................................................22 Conclusion ..................................................................................................................23
II Socio-Political Context .................................................................................................24 Demographic Context:.................................................................................................24 Poverty and Education ................................................................................................25 Gender ........................................................................................................................27 Ethnicity.......................................................................................................................29 Conflict ........................................................................................................................31 Legal and Policy Framework Relating to Inclusive Education.....................................32 Conclusions.................................................................................................................34
III. Education Context.....................................................................................................36 Introduction .................................................................................................................36 Education System Overview .......................................................................................38 School Finance ...........................................................................................................44 Policy Trends and Issues ............................................................................................46 Sub-Sector Strategies and Programs..........................................................................48 Cross-Cutting Issues...................................................................................................52 Conclusion ..................................................................................................................52
IV. Education Budget and Funding Gaps......................................................................54 Introduction .................................................................................................................54 Budget Trends.............................................................................................................54 Funding Gaps..............................................................................................................56 Fiduciary Risk Assessment .........................................................................................61
V. ESDP I Program Description.....................................................................................66 Introduction .................................................................................................................66 Component A: Supporting EFA..................................................................................66 Financial Arrangements for Component A ..................................................................69 Program Management.................................................................................................71 Component B: Preparation and Transition to a 1-12 School Sector ..........................75 Capacity Building in Policy Functions..........................................................................75 Preparation of Core Document for the SSA: ...............................................................76 Transition Program to 1-12 School Sector ..................................................................77 Preparation and Capacity Building Technical Assistance (TA) ...................................80 Financial Arrangements for Component B ..................................................................80 Component B - Overall Financing Plan......................................................................83
Documents in the Program File ......................................................................................84 Appendix 1: Program Design and Monitoring Framework ...........................................119

6
Appendix 2: Policy Matrix.............................................................................................125 Appendix 3: Vulnerable Communities Development Framework.................................127 List of Supplementary Appendices ...............................................................................135
Supplementary Appendix 1 : Components of Nepal’s EFA Program and Challenges from a Social and Economic Inclusion Perspective...................................................135 Supplementary Appendix 2: School Finance ............................................................135 Supplementary Appendix 3: Teacher Supply and Demand .....................................135 Supplementary Appendix 4: Assessment of JFA EFA .............................................135 Supplementary Appendix 5: Conceptual Model for Component B ............................135

7
EXECUTIVE SUMMARY
Introduction 1. A Priority: Consolidating gains and preparing a policy framework for
education in post-conflict Nepal. The prime purpose of this report is to assist the Government of Nepal (GoN) and its donor partners to devise effective and realistic education and training policies, strategies, and financing mechanisms for the post-conflict period while consolidating the very real gains made in access, equity, and quality of schooling, particularly since 2000. The mass social and political movements of April 2006 which culminated in the restoration of a multi-party system and the re-entry of the Maoist party into the political process also require policy makers to re-consider education’s potential for both addressing the causes of conflict and promoting social, economic, and political inclusion for disadvantaged groups such as the lowest castes (Dalit) and indigenous or tribal groups (Janajati). The Program Preparatory Technical Assistance team hopes that this sector analysis will contribute to these discussions.
2. A second purpose of the Main Report is to provide guidance to the Asian
Development Bank (ADB) regarding its education sector investments for the period 2007-2010 and beyond. In July 2004, the GoN launched its Education for All (EFA) program, a sub-sectorwide approach covering pre-school and grades 1-5 for the 2004-2009 period. The GoN simultaneously requested assistance from ADB in preparing a policy and program framework for a grades 1-12 sectorwide approach to begin after 2009. An Advisory Technical Assistance (ADTA) was mobilized to undertake a sector, policy, and capacity analysis in collaboration with GoN.1 Based on the ADTA, the GoN requested the ADB to finance the Education Sector Development Program I (ESDP I), a transition program for the 2007-2010 period that addresses both on-going and emerging issues. In March and April of 2006, a Program Preparatory Technical Assistance (PPTA) team was mobilized to undertake an appraisal of existing policies, strategies, and programs and to help the government prepare a policy, strategy, and program framework for transition to a 1-12 school sector. The design of ESDP I is based on the results of this analysis.
3. ESDP I Components: ESDP I will bridge immediate funding gaps in an on-going
intervention targeted at Millennium Development Goals and will also support preparation for and transition to a 1-12 school sector. Through ESDP I Component A, ADB will join with the Government of Nepal, five pooling partners,2 and seven non-pooling partners3 in a jointly financed investment in Nepal’s Education for All (EFA) Program covering the 2004-2009 period that supports basic, formal, and non-formal primary education through grade 5 nationwide. In 2009, Nepal plans to extend basic education through grade 8 and secondary education through grade 12. ESDP I Component B will support a geographically targeted transition to a re-structured and reformed school system. Component B will also help build GoN capacity to prepare a sectorwide policy, strategy, and investment framework for 2009 and beyond. Chapter VI of this report describes the components.
4. ESDP I Funding modalities: In terms of funding modalities, the Project
Preparatory Technical Assistance (PPTA) team recommends a program loan for Component 1 TA 4326-NEP: Preparation of the Education Sector Development Policy and Strategy. 2 World Bank, Denmark, United Kingdom, Norway and Finland 3 ADB, the World Bank, Japan, UNICEF, UNFPA, and the WFP as well as numerous NGOs and INGOs

8
A. This modality will permit ADB to join a pre-existing Joint Financing Arrangement (JFA). Discussions with Government and donor partners determined that joining the EFA donor pool is ADB’s most practical option for the present. In terms of Component B, the PPTA team recommends a program grant modality as ADB’s best strategic option. A program grant will enable GoN to pool resources with ADB and other donor partners in developing, piloting, and initiating a transition program for a restructured and reformed 1-12 education system. GoN has initiated discussions with other donor partners regarding their support for preparing and initiating a sectorwide restructuring and reform program. The PPTA team also recommends a TA Grant to provide continuous capacity building for EFA implementation, transition program preparation and implementation, and policy formulation and coordination. A more detailed description of proposed funding modalities and their compatibility with ADB requirements is available in Chapter VI and Appendix 6 of this report.
5. Main Report Structure: Following this Executive Summary, Chapters II, III and
IV of this Main Report provide general background information on Nepal’s macroeconomic, socio-political, and education context and provide the rationale for ESDP I’s program approach. Section V is an analysis of the education budget and funding gap, and VI describes the ESDP I program components and appraises their compatibility with ADB’s modalities and requirements. A program framework and a policy matrix are included as appendices and supplementary appendices can be found in a separate volume. The Main Report references the sector analysis which is presented in ESDP I Support Volumes I, II, III, IV and V. Unless otherwise noted, all data in these reports are PPTA team estimates derived from the Central Bureau of Statistics, MoES, DoE and the Ministry of Finance. All works referenced in this document can be found in the attached list of documents in the project library. Website references are included in the text and footnotes.
Policy and Action Framework
6. The Tenth Plan/ Poverty Reduction Strategy Paper (The Tenth Plan). Nepal’s overall national economic and sectoral policy framework is presented in the Tenth Plan. Prepared in the midst of accelerating conflict, the GoN’s 2002-2007 five-year development plan promoted poverty reduction as the sole overarching goal of the country.4 The four pillar strategies of the Plan are: i) high, sustainable, and broad-based economic growth, ii) social sector development including human development, iii) social inclusion and target programs, and iv) good governance. The Plan stresses strategic cross-cutting approaches to redefine the role of the state and limit public interventions, promote private sector development, support greater social diversity in the structure of governance at all levels, and accelerate the decentralization process
7. In June 2002, the Government adopted an Immediate Action Plan (IAP) to expedite reforms in three critical areas: i) the prioritization of public expenditure according to development importance, ii) improving service delivery, and iii) strengthening anti-corruption and accountability measures.5 More specifically, the current IAP 2005/06 suggests twenty-
4 National Planning Commission, 2003, The Tenth Plan (poverty reduction strategy paper) 2002–2007: summary, Kathmandu. 5 Including two education-related actions: i) initiate the process of integrating +2 education with higher secondary education, and ii) institutionalize the Poverty Monitoring and Analysis System (PMAS) by strengthening the Education Management Information System (EMIS) and Health Management Information System (HMIS).

9
one actions6 in the following development areas: i) women and child development, ii) improvement of the status of women, the lowest caste groups (Dalit), and indigenous peoples (Janajatis), iii) the efficient supply of petroleum products with price adjustments and the use of private suppliers, iv) providing the appropriate environment for the promotion of industry and commerce, v) civil service reform, vi) devolution, and vii) the institutionalization of poverty monitoring.
8. With regard to the education sector, the Tenth Plan aims at improving access to and the quality of primary education, developing and expanding secondary education, producing middle-level technical manpower through the expansion of vocational and technical education, and preparing highly skilled manpower through the development of higher education. The Tenth Plan also expresses the Government’s aim to extend primary education to grade 8 and secondary education to grade 12.
9. The Tenth Plan provides the overarching economic and education policy direction. Other policies pertaining to finance, social inclusion, and education are cited in Chapters II, III and IV and described in detail in the ESDP I Support Volumes. The next section provides a brief overview of Nepal’s education sector.
Education Sector Overview
10. The following paragraphs summarize the status and recent developments in the education sector. Almost by definition, a synopsis of this type creates a tendency to focus on the current limitations of the education and training system. While there are undoubtedly pressing issues to be addressed and parts of the system require revitalization and strengthening, the system’s overall expansion and improvement demonstrates the Nepali people’s continued commitment to the education of its children and young adults.
11. Schools: The school sector in Nepal consists of the following: pre-school and early childhood development (ages 3-5), primary school (grades 1-5), lower secondary school (grades 6-8), secondary school (grades 9-10), higher secondary school (grades 11-12), tertiary education, and adult literacy. There is also a vocational education stream. Non-formal and adult literacy programs provide out-of-school education services. Nepal’s strategic intention is to restructure the school system into a 1-12 sector that will likely consist of basic (grades 1-8) and secondary (grades (9-12) levels while simultaneously introducing reforms that will both further accelerate the participation of disadvantaged children and improve the quality and efficiency of the education system.
12. Budget Allocation: The sector is allocated 16.7 percent of the total budget (3.9
percent GDP per capita) for fiscal year 2006/07, up from 15 percent in 2002/2003. The proposed 2006/07 education budget allocates 62.1 percent to primary, 24 percent to secondary, 1.4 percent to technical and vocational, 9.3 percent to tertiary, and the balance to administration and development. Donor support for the sector in 2005/2006 is estimated at 28 percent, or $88.7 million, and includes budget support as well as investments in facilities, teacher training, scholarships, school grants, curriculum and examinations reform, capacity building in sector performance, and financial monitoring (see Table 4-1 for more budget details). During the first three years of the current national development plan, expenditure was
6 Including two education-related actions: i) initiate the process of integrating +2 education with higher secondary education, and ii) institutionalize the Poverty Monitoring and Analysis System (PMAS) by strengthening the Education Management Information System (EMIS) and Health Management Information System (HMIS).
10
not permitted to exceed about 19 percent of the GDP. Thus, revenue surplus did not deteriorate during this period in spite of the accelerated conflict and decrease in economic activities. Unless the GDP growth rate increases rapidly, GoN will not be able to spend significantly more on education than it currently spends unless expenditures in other sectors, such as security, can be reduced. With the end of the ten-year conflict in sight, and growing pressure to reduce the size of the military, the education sector could receive some benefit from the “peace dividend.”
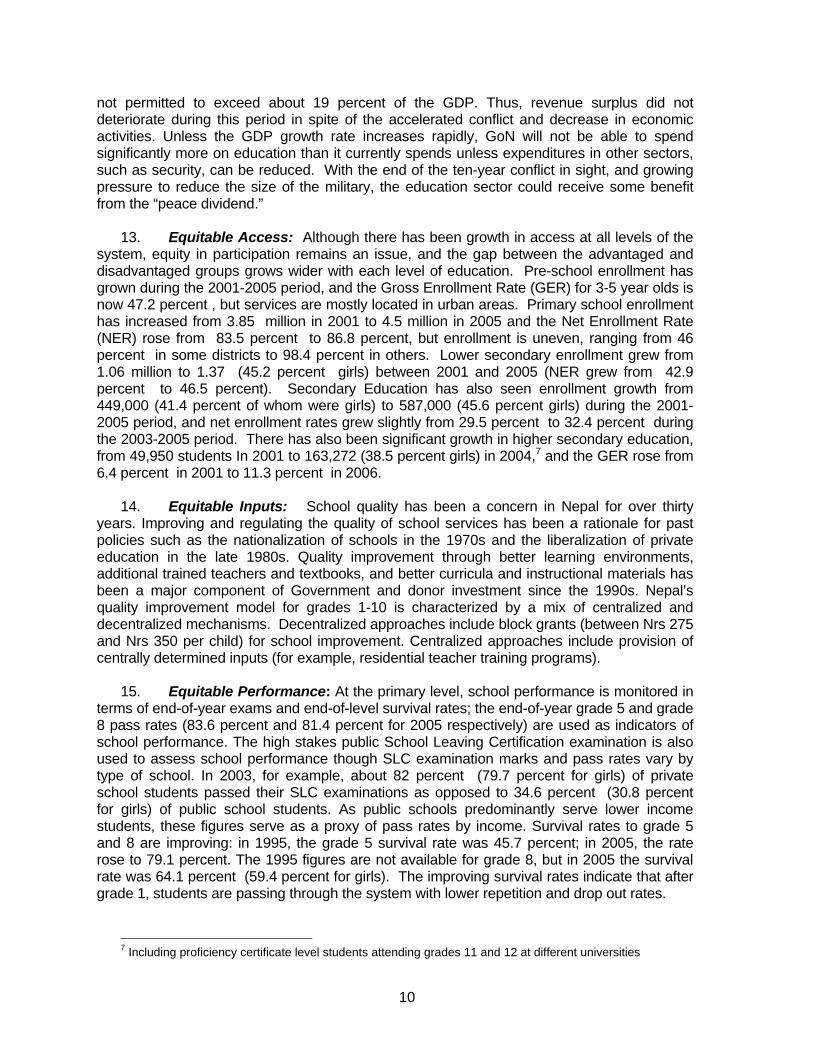
13. Equitable Access: Although there has been growth in access at all levels of the
system, equity in participation remains an issue, and the gap between the advantaged and disadvantaged groups grows wider with each level of education. Pre-school enrollment has grown during the 2001-2005 period, and the Gross Enrollment Rate (GER) for 3-5 year olds is now 47.2 percent , but services are mostly located in urban areas. Primary school enrollment has increased from 3.85 million in 2001 to 4.5 million in 2005 and the Net Enrollment Rate (NER) rose from 83.5 percent to 86.8 percent, but enrollment is uneven, ranging from 46 percent in some districts to 98.4 percent in others. Lower secondary enrollment grew from 1.06 million to 1.37 (45.2 percent girls) between 2001 and 2005 (NER grew from 42.9 percent to 46.5 percent). Secondary Education has also seen enrollment growth from 449,000 (41.4 percent of whom were girls) to 587,000 (45.6 percent girls) during the 2001-2005 period, and net enrollment rates grew slightly from 29.5 percent to 32.4 percent during the 2003-2005 period. There has also been significant growth in higher secondary education, from 49,950 students In 2001 to 163,272 (38.5 percent girls) in 2004,7 and the GER rose from 6.4 percent in 2001 to 11.3 percent in 2006.
14. Equitable Inputs: School quality has been a concern in Nepal for over thirty
years. Improving and regulating the quality of school services has been a rationale for past policies such as the nationalization of schools in the 1970s and the liberalization of private education in the late 1980s. Quality improvement through better learning environments, additional trained teachers and textbooks, and better curricula and instructional materials has been a major component of Government and donor investment since the 1990s. Nepal’s quality improvement model for grades 1-10 is characterized by a mix of centralized and decentralized mechanisms. Decentralized approaches include block grants (between Nrs 275 and Nrs 350 per child) for school improvement. Centralized approaches include provision of centrally determined inputs (for example, residential teacher training programs).
15. Equitable Performance: At the primary level, school performance is monitored in
terms of end-of-year exams and end-of-level survival rates; the end-of-year grade 5 and grade 8 pass rates (83.6 percent and 81.4 percent for 2005 respectively) are used as indicators of school performance. The high stakes public School Leaving Certification examination is also used to assess school performance though SLC examination marks and pass rates vary by type of school. In 2003, for example, about 82 percent (79.7 percent for girls) of private school students passed their SLC examinations as opposed to 34.6 percent (30.8 percent for girls) of public school students. As public schools predominantly serve lower income students, these figures serve as a proxy of pass rates by income. Survival rates to grade 5 and 8 are improving: in 1995, the grade 5 survival rate was 45.7 percent; in 2005, the rate rose to 79.1 percent. The 1995 figures are not available for grade 8, but in 2005 the survival rate was 64.1 percent (59.4 percent for girls). The improving survival rates indicate that after grade 1, students are passing through the system with lower repetition and drop out rates.
7 Including proficiency certificate level students attending grades 11 and 12 at different universities

11
16. Service Efficiency and Accountability: The Government has committed to continue strategies which focus on improving service efficiency and accountability at the school and institutional levels. The main strategies are: i) the transfer of school management to the community, ii) the decentralization of school improvement, iii) the implementation of capacity building plans, and iv) the improvement of monitoring school compliance with various regulations and supervision of teachers. About 2300 schools have transferred management to the community, and nearly all schools have established School Management Committees. The transfer of management has been slowed by opposition from teachers unions and Maoists.
17. Teacher Management: Since the 1990s, there have been some improvements in
managing teaching performance. For example, teacher absenteeism, a major problem in the past, was observed at only 10 percent in 2006.8 Additionally, the majority of teachers at all levels now have the minimum required qualifications. In 2005, the number of fully trained teachers at the primary level was about 44.8 percent , 41.9 percent at lower secondary, and 65.4 percent at the secondary level whereas five years earlier, in 2000, only 11.8 percent , 22.6 percent , and 43.1 percent of teachers were fully trained for the respective levels. However, using the current pupil-teacher ratios norms for primary and secondary levels, the PPTA team estimates a minimum shortfall of 15,000 teachers nationwide in 2006. Still, these national aggregate figures fail to address the problem of regional and inter-school imbalances. For example, while about half of the Mountain and Hill districts suffer from severe teacher shortages, the other districts face relatively minor shortages. While Valley districts are experiencing a surplus of teachers almost all Terai districts are short of teachers by 40-60 percent.
Issues and Opportunities
18. Based on the results of the sector analysis and appraisal of current programs, the PPTA team identified strategic issues and practical opportunities for ESDP I. The following paragraphs provide a summary of those issues and opportunities.
19. Education for All: Strategically, development assistance in Nepal has been
moving from a fragmented, project-based approach to a coordinated, program-based approach and from bi-lateral to pooled funding modalities in a move towards full budgetary support for the sector. In practical terms, ADB is the only major donor not participating in the EFA donor pool and, as EFA is considered a prime example of donor harmonization under a sub-sectorwide approach, ADB needs to join the donor pool if it is to provide credible assistance to the Government in shaping a 1-12 school sectorwide approach.
20. Education for All is a high priority program in Nepal. In 2003, The MOES
finalized a Core Document for EFA that serves as the policy, strategy, program, and financing framework for GoN and donor partners in the pre-school, adult literacy, and primary education sub-sectors. Guided by the international EFA movement and Nepal’s Tenth Plan, the EFA Core Document specifies the program’s components, principles, strategies for implementation, arrangements for program management, monitoring and evaluation indicators, and financing plans. Donor partners have used the Core Document as a basis for both appraisal and the joint financing arrangement since 2004. EFA is
8 Technical Review of Education 2005: A report
12
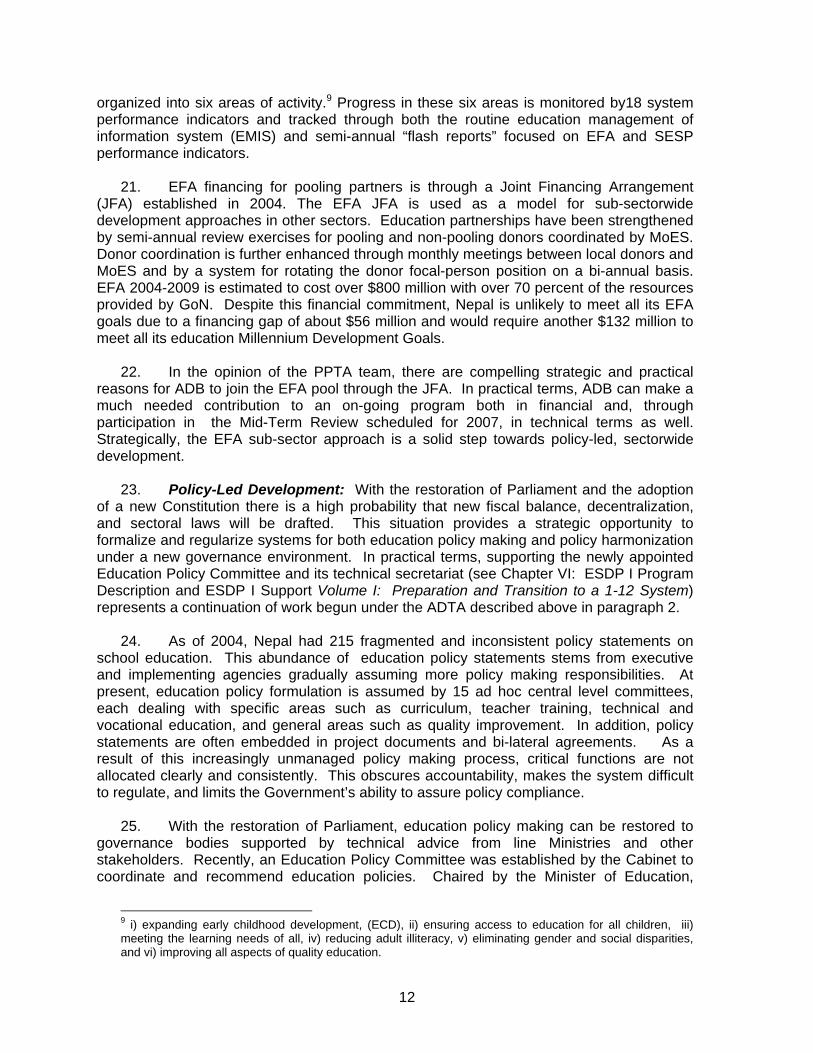
organized into six areas of activity.9 Progress in these six areas is monitored by18 system performance indicators and tracked through both the routine education management of information system (EMIS) and semi-annual “flash reports” focused on EFA and SESP performance indicators.
21. EFA financing for pooling partners is through a Joint Financing Arrangement
(JFA) established in 2004. The EFA JFA is used as a model for sub-sectorwide development approaches in other sectors. Education partnerships have been strengthened by semi-annual review exercises for pooling and non-pooling donors coordinated by MoES. Donor coordination is further enhanced through monthly meetings between local donors and MoES and by a system for rotating the donor focal-person position on a bi-annual basis. EFA 2004-2009 is estimated to cost over $800 million with over 70 percent of the resources provided by GoN. Despite this financial commitment, Nepal is unlikely to meet all its EFA goals due to a financing gap of about $56 million and would require another $132 million to meet all its education Millennium Development Goals.
22. In the opinion of the PPTA team, there are compelling strategic and practical
reasons for ADB to join the EFA pool through the JFA. In practical terms, ADB can make a much needed contribution to an on-going program both in financial and, through participation in the Mid-Term Review scheduled for 2007, in technical terms as well. Strategically, the EFA sub-sector approach is a solid step towards policy-led, sectorwide development.
23. Policy-Led Development: With the restoration of Parliament and the adoption
of a new Constitution there is a high probability that new fiscal balance, decentralization, and sectoral laws will be drafted. This situation provides a strategic opportunity to formalize and regularize systems for both education policy making and policy harmonization under a new governance environment. In practical terms, supporting the newly appointed Education Policy Committee and its technical secretariat (see Chapter VI: ESDP I Program Description and ESDP I Support Volume I: Preparation and Transition to a 1-12 System) represents a continuation of work begun under the ADTA described above in paragraph 2.
24. As of 2004, Nepal had 215 fragmented and inconsistent policy statements on
school education. This abundance of education policy statements stems from executive and implementing agencies gradually assuming more policy making responsibilities. At present, education policy formulation is assumed by 15 ad hoc central level committees, each dealing with specific areas such as curriculum, teacher training, technical and vocational education, and general areas such as quality improvement. In addition, policy statements are often embedded in project documents and bi-lateral agreements. As a result of this increasingly unmanaged policy making process, critical functions are not allocated clearly and consistently. This obscures accountability, makes the system difficult to regulate, and limits the Government’s ability to assure policy compliance.
25. With the restoration of Parliament, education policy making can be restored to governance bodies supported by technical advice from line Ministries and other stakeholders. Recently, an Education Policy Committee was established by the Cabinet to coordinate and recommend education policies. Chaired by the Minister of Education,
9 i) expanding early childhood development, (ECD), ii) ensuring access to education for all children, iii) meeting the learning needs of all, iv) reducing adult illiteracy, v) eliminating gender and social disparities, and vi) improving all aspects of quality education.
13
Committee members represent the National Planning Commission, line Ministries, civil society organizations, and co-opted members. One of the Education Policy Committee’s first tasks will likely be to recommend a policy direction for the 1-8, 9-12 school system. The Education Policy Committee is preparing a Terms of Reference to mobilize resource and guide preparation of a Core Document on the 1-12 school sector. The Policy Committee will oversee Core Document preparation, approve the final version, and advocate for any required changes to sector financing, governance, or management structures. Descriptions of the de jure and de facto policy making processes in Nepal, as well as recent and proposed changes to policy processes, can be found in and ESDP I Support Volume I: Preparation and Transition to a 1-12 System.
26. In the opinion of the PPTA team, ADB should provide continuous support to the capacity building in policy functions and sectorwide program development begun in 200410 as well as expand the scope of the technical assistance to include implementation of EFA and the transition program. This will include support for activities associated with Core Document preparation.
27. Transition to a 1-12 School Sector: Based on the successes and lessons
learned from the sub-sectorwide EFA program, SESP, and best practices from community schools, the Government has set policy priorities for the next phase of education reform. Recognizing that five years of school are insufficient to support Nepal’s human resource development requirements, the Government has long envisioned extending basic education to cover grades 1-8 and secondary education to cover grades 9-12. This restructuring will be the main focus for the next phase along with systemic and programmatic improvements. The Education Policy Committee will advise the Government on adjustments to the education governance, management, and financing structures needed to support an equitable and effective 1-12 school sector. The Government would like to begin full implementation of 1-12 sector after 2009. The Government has initiated the process of requesting other development partners to support the preparation and transition process to a 1-12 school sector.
28. One immediate effect of the “peoples movement” is to broaden the discourse on
education, both in terms of participants and issues. Changing the mix of who contributes to the discourse may also change the goals, priorities, and approaches to education sector development. By beginning the transition program in at least 4 districts while simultaneously conducting widespread consultations on the school sector policy and program framework, lessons learned from field experience can be linked to policy dialogue under the auspices of the Education Policy Committee. In practical terms, fifteen years of international experience with education sectorwide approaches in Africa, Asia, and Latin America demonstrate that a well developed transition program is a sine qua non for the success of restructuring and reform programs.
29. In the opinion of the PPTA team, ADB should provide assistance to support the
preparation and transition to a restructured and reformed school sector through a multi-donor, joint financing mechanism. This approach would ensure harmonization with all development partners and would provide a platform for coordinated donor participation from the very beginning.
10 TA 4326-NEP: Preparation of the Education Sector Development Policy and Strategy.

14
30. In Summary: Through ESDP I, ADB will accomplish three inter-related goals: i)it will demonstrate a commitment to donor harmonization by joining the EFA, an established sub-sectorwide program, ii) it will help define structural, governance, and financing reforms that address inequities and other causes of the ten year armed conflict and iii) it will enable the transition to a restructured and reformed school system in a considered manner. Following a textbox containing a brief political history of Nepal excerpted from the Government of Australia’s Country Briefs website, the next three chapters of this Main Report describe the economic, socio-political, and education context that provides the rationale for EDSP I.

15
Text Box A Brief Political History of Nepal Excerpted from: Nepal Country Brief, July 2006. Government of Australia Department of Foreign Affairs and Trade
In the late 18th century, the King of Gorkha, Prithvi Narayan Shah, unified a group of warring Himalayan principalities creating Nepal. The British, occupied with annexing the princely states of India, allowed Nepal to remain independent in return for a stream of mercenaries, the Gurkhas, to augment its military forces. In 1846, a general, Jung Bahadur Rana staged a coup d'etat, designated himself Prime Minister and made the office hereditary.
The increasing isolation and authoritarianism of the Ranas and the inspiration of the Chinese communist revolution and the Indian independence movement produced rising opposition. In 1951, the last Rana Prime Minister resigned and the monarchy was restored to absolute power which it retained until 1990, interrupted by a brief period of parliamentary rule in 1959-60.
A partly peaceful and partly violent revolution culminated in a decision by the King to relinquish absolute power, draft a new constitution and hold multi-party democratic elections in May 1991. After the elections, the government embarked on economic reforms which had a broad inflationary impact. This led to sporadic civil and political unrest. Shifting political alliances led to regular parliamentary dissolutions, early elections and frequent changes of government.
Nepal's political instability was compounded in February 1996, when the leaders of the Maoist United People's Front began a violent insurgency with the aim of overthrowing the monarch. In June 2001, several members of the Royal Family were killed. The massacre stunned the nation. As the Crown Prince died shortly after the attack, the King’s brother, became King.
In July 2001, following infighting in the ruling NC, a Prime Minister was appointed. The Prime Minister brokered a ceasefire with the insurgents. The Maoists broke the ceasefire, prompting the King to declare a State of Emergency and involve the military for the first time in the insurgency.
The King dissolved Parliament on 22 May 2002. Elections were to be held in November but the King postponed them and appointed an interim government pending an improvement in the security situation. However, the political parties were unable to agree on an interim government. In October, the King installed a new government that pressed ahead with negotiations with the Maoists to end the conflict and achieved a ceasefire agreement in January 2003.
Under continued pressure from the political parties the Prime Minister resigned on 30 May 2003. The King then appointed another Prime Minister on 4 June 2003. This Prime Minister faced the same issues as his predecessor, including negotiations with the insurgents. The ceasefire between the government and the Maoists ended on 27 August 2003, presaging a return to violence.
On 1 February 2005, the King dismissed the Prime Minister and Nepal's multiparty government, announcing that he would govern the country for a period of three years and appointed a ten-member Council of Ministers the following day. Following negotiations in November, the seven major political parties agreed on a 12 point plan with the Maoists to "end the autocratic monarchy". Local elections held in February were boycotted by the major political parties and voter participation was less than 20 percent.
Political agitation led to the King relinquishing direct rule and reinstating the Nepalese parliament which recommenced sitting on 28 April 2006. The King swore in the nominee of the seven major political parties, as Prime Minister on 29 April 2006. Following the announcement by the King that parliament would be reinstated, the Maoists announced a three month unilateral ceasefire
Source: Nepal Country Brief, July 2006. Government of Australia Department of Foreign Affairs and Trade. www.dfat.gov.au/geo/nepal/nepal_country_brief.html

16
I. ECONOMIC CONTEXT 1. The last chapter provided a summary of the education sector. This chapter
presents the macro economic context for education development beginning with a description of the macroeconomic environment and continuing with a general description of the labor market and trends in the depth and incidence of poverty. The chapter ends with a summary of the overall economic environment. A discussion of the education budget and funding gaps can be found in Chapter IV. The material in this chapter is drawn almost entirely from ESDP I Supporting Volume II: Public Expenditure Review for the Education Sector which contains the supporting data, tables and additional references. From this review, the PPTA team finds that the Government of Nepal has demonstrated strong commitment to increasing enrolment, particularly among socio-economically disadvantaged children, and to improving the quality of education at all levels, especially in recent years. The PPTA team also finds that despite economic challenges and setbacks, the Government and development partners have worked closely to improve the efficient, effective and equitable use of scarce resources. This chapter presents the economic background for these endeavors
Macroeconomic Context : Economic Structure, Trends and Performance
2. Economic growth and reforms since the 1990s: Nepal is the poorest country in South Asia. The GDP per capita was less than $200 during the three decades prior to 1990 when the economy was growing at a rate lower than one percent, and was still only $280 in 2004. The government’s inward looking economic policies, including import protection and heavy regulatory control of private sector activities, have been cited as the primary cause of slow economic growth until the late 1980s. Following the fiscal and external payment crisis in 1985, the Government introduced various reforms in almost all sectors, which gained momentum after the restoration of democracy in 1990. Both prior to and since the dissolution of Parliament in 2002, the Government passed ordinances relating to labor and employment, secured transaction, bankruptcy and liquidation to improve the investment climate, and devolved management of health, education, agriculture extension and rural infrastructures to district authorities to improve service delivery.
3. The reform measures adopted after 1985 and the successful stabilization of the economy in the mid 1990s helped create an environment for a more open and diversified economy. The economy grew at 4.7 percent on average between FY1991/92 and FY2000/01. This growth was mainly led by the non-agricultural sectors, which accounted for around two-thirds of growth: the industrial sector grew by 8 percent per year, the manufacturing sector by over 10 percent and the service sector by over 7 percent. Most of the export growth came from the clothing industry, carpets and pashmina, accounting for more than 50 percent of all export earnings. Thriving tourism also contributed to the growth until it fell off sharply after the Indian Airlines hijacking incident in 1999,11 and a general nervousness resulting from the violent and worsening Maoist insurgency.12 In addition, the
11 World Bank, 2002, Nepal Development Forum: Economic Update 2002, World Bank. Washington D.C. 12 Word Bank, 2005, State in Conflict – Resilient People: An Assessment of Changes in Poverty in Nepal between 1995/96 and 2003/04, Poverty Reduction and Economic Management Sector Unit, South Asia Region, World Bank, Washington, DC; and Nepal Rastra Bank, 2005, Macroeconomic Indicators of Nepal, Research Department, NRB, Kathmandu. Note that some other estimates show higher remittances: for instance, according to the Asian Development Bank, remittances have risen to $1.1 billion, 17.7 percent of GDP (ADB, 2005, Nepal Quarterly Economic Update, Kathmandu).

17
Box 1.1 Nepal’s Dualistic Economy
Nepal is still predominantly an agricultural country. About 40 percent of the Gross Domestic Product comes from agriculture and about 80 percent of the population lives from agricultural activities. Agricultural output in Nepal fluctuates as it is heavily influenced by the cycle of monsoon rains therefore people who depend on agriculture for their livelihood remain extremely vulnerable. Nepal’s agricultural development plans envisage raising productivity by providing farmers with modern technology and credit to purchase land, a policy that requires a rural population with more than simple literacy and numeracy skills; yet, school participation of rural children is affected by the agricultural cycle and poor rural children are the least likely cohort to finish 8 years of basic education. The non-agriculture sector contributes to a higher growth rate and education policies support growth in manufacturing and service sectors through an emphasis on wage employment oriented skills such as English and information technology. Within the non-agriculture sector, the manufacturing sector is fragile, and industrial development is not stable. The service sector has grown, but it is concentrated in Kathmandu valley and urban areas. Linkages between agriculture and non-agriculture sectors are tenuous deepening the dualistic nature of the economy.
growth of overseas employment—currently about 800,000 Nepalese are employed abroad—contributed to foreign currency earnings. Remittances increased four fold from $203 million in FY1995/96 to $794 million in FY2003/04, and further reached $920 million in FY2004/05, representing 12.3 percent of GDP.13
4. The agriculture industry grew somewhat during the second half of 1990s as liberal economic policies broadened the basis for overall economic growth. For instance, the entry of private firms into input marketing and distribution increased access to agricultural inputs. Improvements in infrastructure and services such as agricultural credit and irrigation facilities and the diversification and commercialization of agricultural products, helped improve agriculture productivity during this period. More effective implementation of the Agriculture Perspective Plan 1995-2015, accompanied by adequate resources and consistent policies, is considered essential for further agricultural and rural development.
5. After the steady economic growth in the 1990s, as the internal conflict accelerated in 2001, the growth rate plummeted to -0.6 percent in FY2001/02, mainly due to the negative growth rate (-1.9 percent) of the non-agriculture sectors. As the global economy slowed down, export growth declined from 13.5 percent of GDP in 2001 to only 11 percent of GDP. With the end of the Multi Fiber Agreement (2005) and increasing competition in international markets, growth prospects are grim. The GDP growth rate recovered to 3.2 percent in FY2002/03 and 3.5 percent in FY2003/04, lower than the Tenth Plan’s low target of 4.5 percent.14 The political crisis, armed conflict, destruction of the physical infrastructure and diminished future prospects depressed the investment climate leading to decreases in non-agricultural production. Based on the current production situation, it is estimated that the economy will grow by only 1.8 percent with 2 percent growth rate in the non-agriculture sector and 1.5 percent in the agriculture sector during the current fiscal year 2005/06, which is lower than the population growth rate of 2.26 percent.15
13 Word Bank, 2005, State in Conflict – Resilient People: An Assessment of Changes in Poverty in Nepal between 1995/96 and 2003/04, Poverty Reduction and Economic Management Sector Unit, South Asia Region, World Bank, Washington, DC; and Nepal Rastra Bank, 2005, Macroeconomic Indicators of Nepal, Research Department, NRB, Kathmandu. Note that some other estimates show higher remittance: for instance, according to the Asian Development Bank, remittance has risen to $1.1 billion, 17.7 percent of GDP (ADB, 2005, Nepal Quarterly Economic Update, Kathmandu 14 The 10th Plan has two target growth rates: 6.1 percent (normal conditions) and 4.3 percent (conflict conditions) 15 Source: Ministry of Finance, 2006, Current Situation of the Economy: White Paper 2063

18
Table 1-1: Selected Economic Indicators 1998/99-2004/05 Percentage of GDP unless otherwise noted
Description 1991/92-2000/01 1998/99 1999/00 2000/01 2001/02 2002/03 2003/04 2004/05
Growth Rate (percent) Real GDP 4.7 4.4 6.1 5.6 -0.6 3.3 3.8 2.7Population 2.4 2.4 2.4 2.5 2.2 2.2 2.2 2.3Real GDP per capita 2.4 1.9 3.6 3.0 -2.8 1.1 1.5 0.5
Saving and Investment Investment (including stocks) 23.3 20.5 24.3 24.1 24.2 25.8 26.4 25.7
Public Fixed Investment 7.0 7.0 7.0 7.6 7.6 6.8 6.5 6.0Private Fixed Investment 13.7 12.1 12.4 11.4 11.7 12.2 12.7 12.9
Gross Domestic Savings 12.8 13.6 15.2 15.1 12.1 12.0 12.6 12.6Fiscal Indicators
Government Revenue 9.8 10.9 11.3 11.9 11.9 12.3 12.5 13.3Government Expenditure 16.5 17.4 17.5 19.4 18.9 18.4 18.0 18.9
Recurrent Expenditure .. 9.3 9.4 11.1 11.6 11.4 11.2 11.8Capital Expenditure .. 6.7 6.7 6.9 5.9 4.9 4.6 4.7Principal Repayment .. 1.4 1.4 1.4 1.5 2.1 2.2 2.4
Government Revenue - Recurrent Expenditure .. 1.6 1.9 0.7 0.4 0.9 1.4 1.5Total Foreign Aid .. 4.7 4.6 4.6 3.4 3.5 3.8 3.7
Grant .. 1.3 1.5 1.6 1.6 2.5 2.3 2.1Loan .. 3.5 3.1 2.9 1.8 1.0 1.5 1.7
Total Domestic Borrowings .. 1.8 1.5 3.0 3.6 2.6 1.7 1.8Domestic Borrowing .. 1.4 1.4 1.7 1.9 1.9 1.1 1.7Cash Balance (Surplus) .. 0.4 0.1 1.3 1.7 0.7 0.5 0.1
Balance of Payments Export .. 10.4 13.1 13.5 11.1 10.9 10.9 10.9Import .. 25.6 28.6 28.1 25.4 27.2 27.4 24.8Current Account Deficit .. .. 4.5 4.9 4.3 2.5 2.9 5.5Balance of Payments (-deficit) .. .. 3.8 1.3 -0.8 1.0 4.0 1.1
Money and Credit Broad Money Supply (M2) 37.5 44.7 49.0 52.1 53.0 53.8 55.8 56.3Domestic Credit (net) 32.6 39.4 41.6 45.7 49.0 50.0 50.5 53.4Net Foreign Assets .. 19.0 21.2 21.3 20.9 20.0 21.9 20.2
Inflation (percent) 9.3 .. .. 2.2 2.9 4.5 4.0 Source: Ministry of Finance, 2005, Economic Survey 2004/2005, Kathmandu; Central Bureau of Statistics, 2005, National Income Accounts 2004/05, Kathmandu, Dec 2005; World Bank, 2004, Nepal Development Policy Review: Starting Growth and Poverty Reduction, REP No 29382-NP, Poverty Reduction and Economic Management, South Asia Region; and National Planning Commission, 2005, Fourth Medium Term Expenditure Framework (FY2005/06 - 2007/08), Singh Durbar, Kathmandu, July 2005.
6. Fiscal and Monetary Policies: In spite of the accelerating conflict and
decreasing economic activities, fiscal balance has significantly improved in recent years for two very different reasons. First, government revenue as a percentage of GDP increased consistently by slightly over two percent between FY1998/99 and FY2004/05, primarily as a result of tax and public expenditure reforms. Second, total expenditure was not permitted to exceed 19 percent of GDP during the first three years of the Tenth Plan (2002-2007), resulting in a low level of investment in development activities. Hence, high revenue and low expenditure has kept the fiscal deficit at a reasonable level for several years. The implication is that, unless the GDP growth rate increases rapidly, the Government will not be
19
able to spend significantly more on education than it currently spends unless expenditures in other sectors, such as security, can be reduced.
7. The tight monetary policy also helped sustain the inflation rate at around four percent per year after FY2002/03, although it recently went up to eight percent primarily due to the increased price of the petroleum products. Domestic credit increased from 39.4 percent in FY1998/99 to 53.4 percent in FY2004/05, mostly driven by the increase in demand for credit by the private sector. By contrast, the Government has not demanded credit because of the unspent balance of development expenditure. Hence, the Government has been able to limit the public debt, and domestic borrowing decreased from two percent in FY2002/03 to a little more than one percent in FY2003/04 before it slightly increased again.
8. Despite the recent progress in the fiscal balance, the Government is likely to face problems this year. In spite of the improvement in tax administration and tariff management, it is estimated that the Government will be able to collect only around 89 percent of the total revenue target for the current fiscal year. In addition, delays in budgetary support for program loans from the World Bank and the Asian Development Bank due to non-compliance with conditions are likely to further reduce the expected revenue. Also, there has been rising off-budget expenditure due to increased security spending, municipal elections, high level foreign visits, and investment in the Nepal Oil Corporation. Moreover, there is a possibility of a further increase in recurrent expenditure during the current fiscal year in order to carry out preparations for the election to the constituent assembly, political management after the peace talks with the Maoists, provision for economic support to the victims’ families and medical services to the people injured in the recent public demonstration. In sum, it is expected that here will be a large fiscal deficit in the current fiscal year and most likely in the next few years as well.16
The Labor Market
9. In 1998/99, 9.2 million people aged 15 and over (83 percent of the age group) were engaged in work activities in Nepal17 and about 300,000 new workers enter the labor market every year.18 Out of the 9.2 million employed persons, only 1.5 million (16 percent) were engaged in paid jobs; the remaining were self-employed. Of the paid employees, about 10 percent reported that they were paid irregularly on a piecework basis. Among those who were paid on the basis of time, craft and related trade and subsistence agriculture workers were paid daily, whereas professional and technicians were paid monthly.
10. Gender gap: There is a marked gender gap in earned income as illustrated in Table 1.2 below. Among the workers receiving cash earnings, the average monthly earning was Rs. 2,363 ($34.6) for males as opposed to Rs. 1,397 ($20.5) for females with a striking gender gap between agriculture workers, craft and related trade workers, and plant and machine operators. The gender gap was smaller among the workers receiving in-kind payment on average (Rs. 947 for male and Rs. 648 for female).
16 Source: Ministry of Finance, 2006, Current Situation of the Economy: White Paper 2063, A white paper presented at the House of Representatives, by the Minister of Finance on 15 May 2006. 17 Central Bureau of Statistics, Report on the Nepal Labour Force Survey 1998/99, CBS, Kathmandu 18 ILO, 2004, An overview Paper on Overseas Employment in Nepal, Decent Work for All Women and Men in Nepal, Series 4, ILO, Kathmandu, Nepal.

20
Table 1-2: Paid Employees Receiving Cash or In-kind Earnings, and Average Monthly Amounts received by occupation 1998/99
Rs.
Average monthly earnings (cash and in-kind)
by all paid employees
Average monthly cash earnings
by those receiving cash
Average monthly In-kind earnings
by those receiving in-kind Occupation All Male Female All Male Female All Male Female
Legislators, senior officials 8,037 8,068 7,525 8,463 8,525 7,525 1,004 1,004 - Professional 5,079 5,141 4,631 4,999 5,057 4,585 1,978 2,189 875 Technical 2,971 3,057 2,678 2,938 3,023 2,651 962 933 1,229 Clerks/clerical workers 2,832 2,836 2,805 2,782 2,786 2,747 662 688 456 Service workers 2,507 2,506 2,525 2,180 2,158 2,382 956 969 751 Agriculture workers 2,109 2,756 957 1,171 1,402 757 2,154 3,910 429 Craft & related trades 2,773 2,973 1,393 2,699 2,879 1,414 807 827 554 Plant & machine operators 2,981 2,995 2,037 2,580 2,590 1,938 1,186 1,197 295 Elementary occupations 1,491 1,692 1,054 1,477 1,681 972 765 824 663 Armed forces 3,306 3,258 4,250 2,613 2,578 3,300 1,119 1,133 950 All 2,143 2,389 1,368 2,155 2,363 1,397 855 947 648 Source: CBS (1999)
11. Foreign employment and remittances: In the Tenth Plan, the Government
recognized overseas employment as one of the strategies to alleviate poverty and unemployment in the country. The importance of foreign employment has increased because of: i) decreasing share of the agriculture sector in GDP to 40 percent, ii) 47 percent underemployment and 4.9 percent full unemployment, iii) an addition of about 300,000 new workers in the labor market annually, and iv) poor investment climate in industrial and service sectors owing to the decade-long internal conflict.
12. Many Nepalese have migrated abroad for employment opportunities. Migrant work was mostly limited to India before the 1980s, but since the 1990’s temporary and contract workers went to the Gulf states and then to other countries. The 1991 census recorded 660,000 Nepalese working abroad, which was equivalent to 3 percent of the country’s total population, or 6 percent of the workforce. Demand for Nepalese workers varies widely from skilled to unskilled labor in service, construction, and metal and machine operator occupations, but demand for skilled and semi-skilled manpower has been unfilled due to a lack of skilled manpower. For instance, in 2003, half of the requests for 100,000 Nepalese workers from international employers was unfilled due to insufficient numbers of qualified workers and more than two thirds of the Nepalese working abroad are unskilled domestic workers.19
13. Foreign employment has not only provided job opportunities for Nepalese, but also substantially raised household incomes. According to the Central Bank of Nepal, the amount of remittances increased four fold from $203 million in 1995/96 to $794 million in 2003/04, and further reached to $920 million in 2004/05, contributing more than 12 percent of GDP.20 Remittance incomes have increased in all but the Eastern Hill Region which is
19 Asian Development Bank, 2004, Report and recommendation of the president to the board of directors on a proposed loan to the Kingdom of Nepal for skills for employment project (RRP: NEP 36611), ADB, Manila. 20 Nepal Rastra Bank (The Central Bank of Nepal), 2005, Macroeconomic Indicators of Nepal, NRB, Research Department, Kathmandu, Nepal; Word Bank, 2005, State in conflict – resilient people: an assessment of changes in poverty in Nepal between 1995/96 and 2003/04, World Bank, Poverty Reduction and Economic Management Sector Unit, South Asia Region, Washington, DC. Note that there are
21
the only region where poverty incidence increased between 1995/06 and 2003/04.21 Between 1995/96 and 2003/04, the proportion of households receiving remittances increased from 23 percent to 32 percent.22 During the same period, the average amount of remittances per person per annum increased in real terms by 156 percent from Rs. 674 to Rs. 1,723 (at 1995/96 prices), benefiting all strata of the population—from poor to rich. As farm incomes and income from agricultural wages have declined, remittances have contributed to poverty reduction.
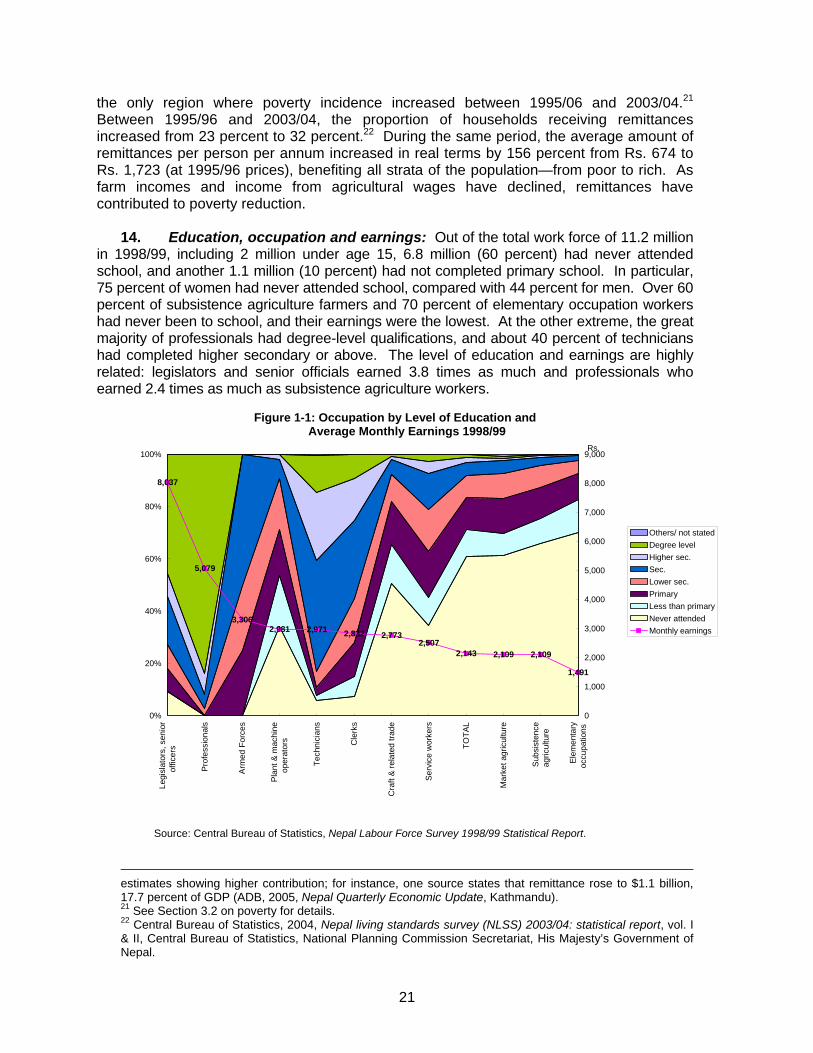
14. Education, occupation and earnings: Out of the total work force of 11.2 million in 1998/99, including 2 million under age 15, 6.8 million (60 percent) had never attended school, and another 1.1 million (10 percent) had not completed primary school. In particular, 75 percent of women had never attended school, compared with 44 percent for men. Over 60 percent of subsistence agriculture farmers and 70 percent of elementary occupation workers had never been to school, and their earnings were the lowest. At the other extreme, the great majority of professionals had degree-level qualifications, and about 40 percent of technicians had completed higher secondary or above. The level of education and earnings are highly related: legislators and senior officials earned 3.8 times as much and professionals who earned 2.4 times as much as subsistence agriculture workers.
Figure 1-1: Occupation by Level of Education and Average Monthly Earnings 1998/99
8,037
5,079
3,3062,981 2,971 2,832 2,773
2,5072,143 2,109 2,109
1,491
0%
20%
40%
60%
80%
100%
Le
gisl
ator
s, s
enio
rof
ficer
s
Pr
ofes
sion
als
A
rmed
For
ces
P
lant
& m
achi
neop
erat
ors
Te
chni
cian
s
C
lerk
s
C
raft
& re
late
d tra
de
S
ervi
ce w
orke
rs
TOTA
L
M
arke
t agr
icul
ture
S
ubsi
sten
ceag
ricul
ture
El
emen
tary
occu
patio
ns
0
1,000
2,000
3,000
4,000
5,000
6,000
7,000
8,000
9,000Rs.
Others/ not statedDegree levelHigher sec.Sec.Lower sec.PrimaryLess than primaryNever attendedMonthly earnings
Source: Central Bureau of Statistics, Nepal Labour Force Survey 1998/99 Statistical Report.
estimates showing higher contribution; for instance, one source states that remittance rose to $1.1 billion, 17.7 percent of GDP (ADB, 2005, Nepal Quarterly Economic Update, Kathmandu). 21 See Section 3.2 on poverty for details. 22 Central Bureau of Statistics, 2004, Nepal living standards survey (NLSS) 2003/04: statistical report, vol. I & II, Central Bureau of Statistics, National Planning Commission Secretariat, His Majesty’s Government of Nepal.

22
Note: As no separate figures are available for market and subsistence agriculture, and the average earnings cover both cash and in-kind earnings, the earnings of ‘agriculture workers’ (Rs. 2,109) was used for both market and subsistence agriculture formers, but it is likely that market agriculture farmers earn more than subsistence agriculture farmers.
Poverty:
15. Along with stable economic growth, the 1990s saw significant improvement in access to basic social and economic services. This increased access, in turn, contributed to a reduction in infant and child mortality, an increase in primary school enrolment, and a reduction in the gender gap in education, among other development indicators (see Text Box 1.1). According to the Nepal Living Standard Survey (NLSS) 2003/04,23 incidence of poverty decreased from 41.8 to 30.8 percent between 1995/96 and 2003/04, as shown in Table 1.2.24 The depth and severity of poverty, as measured by the poverty gap and squared poverty gap, also substantially decreased. Similarly, the Human Development Index for Nepal improved from 0.451 in 1995 to 0.526 in 2003.25 The Central Bureau of Statistics (2005) analysis shows that the major reasons for poverty reduction between 1995/96 and 2003/04 include increases in remittances and the real wage rate, urbanization, and decrease in the dependency ratio. In particular, about 20 percent of the total decline in poverty can be explained by the migration of the population from poorer to richer localities.
16. Even though the overall incidence of poverty
declined between 1995/96 and 2003/04, the degree of improvement varied considerably across the country, resulting in gender, caste, ethnic and geographic disparities and a decline in the Gini coefficient from 0.342 in 1995/96, to 0.414 in 2003/04. Whereas poverty in urban areas declined from 21.6 to 9.6 percent, by 56 percent, that in rural areas declined from 43.3 to 34.6 percent, by only 20 percent, indicating persistent poverty in the rural areas. Poverty in the Hills declined at a much lower rate than in the Mountains or Terai; poverty even increased in the Rural Eastern Hill Region. Among the development regions, it ranged from 27.1 percent in Central and Western Regions to 44.8 percent in the Mid-Western Region in 2003/04. Even though poverty in the Mid- and Far-Western Regions has gone down by 25 and 36 percent respectively, these regions still have a larger proportion of people (over 40 percent) below the poverty line than in the rest of the country.26
17. Given the stable economic growth in the 1990s, significant improvement in access
to basic social and economic services has been recorded, resulting in a reduction in infant
23 Central Bureau of Statistics, 2004, Nepal living standards survey (NLSS) 2003/04: statistical report, vol. I & II, Central Bureau of Statistics, National Planning Commission Secretariat, His Majesty’s Government of Nepal. 24 Central Bureau of Statistics, 2005, Poverty trends in Nepal (1995-96 and 2003-04), National Planning Commission, His Majesty’s Government of Nepal, Kathmandu. 25 The human development index (HDI) focuses on three measurable dimensions of human development: living a long and healthy life, being educated, and having a decent standard of living. Thus it combines measures of life expectancy, school enrolment, literacy and income to allow a broader view of a country’s development than does income alone. UNDP, 2005, Human Development Report 2005: International Cooperation at a Crossroads – Aid, Trade and Security in an Unequal World, UNDP, New York. 26 Thus, it is not a coincidence that the Maoist insurgency started from the Mid-Western Development Region.
Box-1.1 : NLSS Results Now and Then Percent of Households Reporting Less than Adequate NLSS-I NLSS-II (1995/96) (2003/04) Food consumption 50.9 31.2 Housing 64.1 40.6
Clothing 57.6 35.6 Health Care 58.7 28.3 Schooling 45.4 21.4 Total Income 72.6 67.0 ------------------------------------------------------------ Adult Literacy (15+) Total 35.6 48.0 Male 53.5 64.5 Female 19.4 33.8 Net Enrolment in Primary school Female 46.0 66.9 Children fully immunized 36.0 59.4 Access to electricity 14.1 37.2 Access to piped water 32.8 43.9 Access to toilet facility 21.6 38.7 ----------------------------------------------------------- Household access to facility within 30 minutes
Primary school 88.4 91.4 Health post/Hospital 44.8 61.8 Agriculture centre 24.5 31.9 Commercial Banks 20.7 27.8 Paved Road 24.2 37.2 Motorable road 58.0 67.6 Source: CBS, 1996 and 2004.

23
and child mortality, an increase in primary school enrolment, and reduction in the gender gap in education. The incidence of income poverty decreased by 11 percent from 42 percent in FY1995/96 to 31 percent in FY2003/04, and the human development index rose from 0.451 in 1995 to 0.499 in 2001. Although overall poverty incidence has decreased, the level of improvement has varied inequitably, resulting in gender, caste, ethnic and geographical disparities, thereby perpetuating inequity. Therefore, economic growth may not have relieved the root causes of poverty and low human development in Nepal—economic and social exclusion, powerlessness, vulnerability and risks deriving from the socio-political, environmental and topographical contexts.
Table 1-2: Poverty Measurement 1995/96 & 2003/04
Head Count Index Poverty Gap Index Squared Poverty Gap
1995/96 2003/04 Change % 1995/96 2003/04 Change
% 1995/96 2003/04 Change %
Nepal 41.8 30.8 -26 11.8 7.6 -36 4.7 2.7 -42 Urban 21.6 9.6 -56 6.5 2.2 -67 2.7 0.7 -73 Rural 43.3 34.6 -20 12.1 8.5 -30 4.8 3.1 -37
Source: CBS, 2005, Poverty Trends in Nepal (1995/96 and 2003/04).
Note: The Head Count Index measures the incidence of poverty, i.e., the proportion of the population below the national poverty line; the Poverty Gap Index measures the depth of poverty based on the aggregate poverty deficit of the poor relative to the poverty line; and the Squared Poverty Gap Index measures the severity of poverty by giving more weight to the poorest of the poor.
Conclusion 19. Education is highly regarded for both its intrinsic and instrumental value. Intrinsically, education is universally acknowledged as a basic human right; instrumentally, effective education is strongly correlated with economic development, increased productivity, and poverty reduction. ESDP I aims to help the Government provide schooling of improved quality to the children of Nepal and thereby put them on the road to better employment and income earning possibilities at home and abroad. Whether Nepal is able to achieve these benefits depends upon several concerns within the macro economic context. In particular, the benefits of poverty reduction have not been enjoyed equitably across caste and ethnic groups and have been uneven across geographical areas. Second, the decrease in the incidence of poverty has been linked to remittances from unskilled foreign employment, rather than productivity gains in agricultural, manufacturing or service industries. Thirdly, the conflict between the Government and Maoist insurgents impacts on productivity in rural areas and directs public spending towards security. The next chapter reviews the socio-political context for ESDP I.
24
II SOCIO-POLITICAL CONTEXT 1. The previous chapter noted that although the overall incidence of poverty in
Nepal has decreased, improvements have been uneven. This asymmetry can be understood in terms of social issues as deep rooted cultural practices have historically isolated women and other disadvantaged groups from the benefits of growth and development27. This chapter provides the socio-political context for education in Nepal and analyzes some of the challenges ahead in achieving education goals, particularly EFA goals, from the perspectives of demography poverty, gender, social inclusion and the 10 year conflict that has deeply influenced the course of development in Nepal. Material in this chapter is drawn almost exclusively from ESDP I Support Volume V: Analysis of the Political, Social and Economic Dimensions of Inclusive Education in Nepal. Some data and tables are excerpted from Support Volume II: Public Expenditure Review for the Education Sector. Other sources are referenced in the text.
Demographic Context:
2. Nepal’s total population in was 23.2 million in 2001 and grew to 25.3 million in 2005 at an estimated annual growth rate of 2.26 percent. According to the Household Consumption Survey of Rural Nepal 2000/01, about 83 percent (19.2 million in 2001) of the total population reside in rural areas; 9 percent (1.75 million) in the Mountain, 41 percent (7.96 million) in the Hill and 49 percent (9.47 million) in the Terai areas. In terms of the development regions,28 the largest number of households (32 percent) is located in the Central region, while the smallest number is in the Far-Western region (9 percent).
3. Migration is a significant demographic trend and influences education sector development. Internal migration takes place from the mountains and hills to the Terai and between rural areas. Since the elimination of malaria from the Terai, it has become a destination for mountain and hill migrants and now houses 48 percent of the population. Compared to mountain and hill areas, the Terai has higher land fertility, better infrastructure and easier communications with India. Migration requires substantial investment in reception area schools while investment in areas of origin is only marginally reduced. The expanding population in this region has put great pressure on social services including education and overcrowded classes are a common feature of schools. Internally displaced persons have intensified migration to the Terai. Dispersed throughout this large ecological zone, conflict affected children swell the population of the already overcrowded schools and many require special attention to address post traumatic stress. Table 2-1 below provides an overview of rural household distribution by development regions.29
27 ADB.2001. Poverty Reduction Partnership Agreement between the Government of Nepal and the ADB. Kathmandu. 28 Administratively, the country is divided into five development regions (Eastern, Central, Western, Mid-Western, and Far-Western), 14 zones, 75 districts, 3,912 village development committees and 58 municipalities. 29 Administratively, the country is divided into five development regions (Eastern, Central, Western, Mid-Western, and Far-Western), 14 zones, 75 districts, 3,912 village development committees and 58 municipalities.
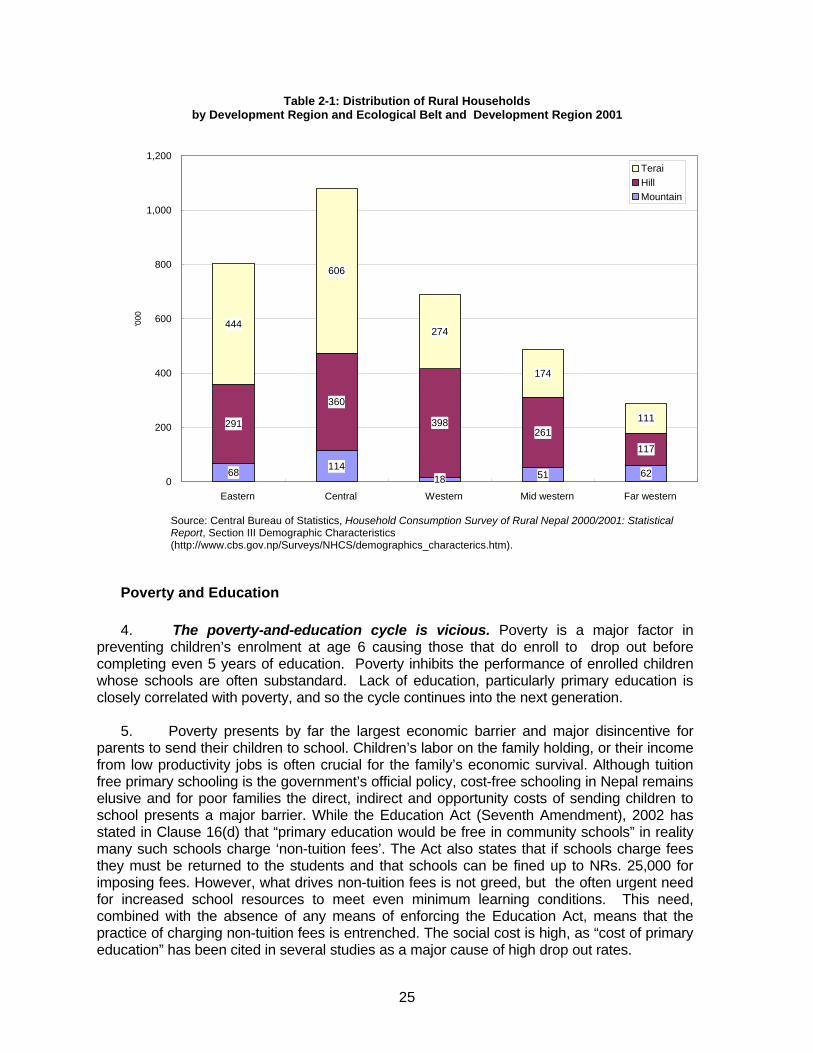
25
Table 2-1: Distribution of Rural Households by Development Region and Ecological Belt and Development Region 2001
68 11418 51 62
291
360
398261
117
444
606
274
174
111
0
200
400
600
800
1,000
1,200
Eastern Central Western Mid western Far western
'000
TeraiHillMountain
Source: Central Bureau of Statistics, Household Consumption Survey of Rural Nepal 2000/2001: Statistical Report, Section III Demographic Characteristics (http://www.cbs.gov.np/Surveys/NHCS/demographics_characterics.htm).
Poverty and Education
4. The poverty-and-education cycle is vicious. Poverty is a major factor in preventing children’s enrolment at age 6 causing those that do enroll to drop out before completing even 5 years of education. Poverty inhibits the performance of enrolled children whose schools are often substandard. Lack of education, particularly primary education is closely correlated with poverty, and so the cycle continues into the next generation.
5. Poverty presents by far the largest economic barrier and major disincentive for parents to send their children to school. Children’s labor on the family holding, or their income from low productivity jobs is often crucial for the family’s economic survival. Although tuition free primary schooling is the government’s official policy, cost-free schooling in Nepal remains elusive and for poor families the direct, indirect and opportunity costs of sending children to school presents a major barrier. While the Education Act (Seventh Amendment), 2002 has stated in Clause 16(d) that “primary education would be free in community schools” in reality many such schools charge ‘non-tuition fees’. The Act also states that if schools charge fees they must be returned to the students and that schools can be fined up to NRs. 25,000 for imposing fees. However, what drives non-tuition fees is not greed, but the often urgent need for increased school resources to meet even minimum learning conditions. This need, combined with the absence of any means of enforcing the Education Act, means that the practice of charging non-tuition fees is entrenched. The social cost is high, as “cost of primary education” has been cited in several studies as a major cause of high drop out rates.

26
6. Poverty prevents enrolment: A cost-sharing study30 carried out in four districts
in 2000 found that education expenditure accounted for about 7 percent of total household income in poor households and about 13 percent of household discretionary income (total income minus expenditure on food, fuel, water, health and shelter). Costs included direct payments to school (school fees, admission fees, examination and sports fees), spending on educational materials (textbooks, exercise books, stationery) and other indirect support costs (school uniform, school bag, lunch money). Private tuition was not affordable for poor families to make up for poor teaching/learning at school and for examination preparation. The study also found that poor parents had difficulty mobilizing cash at short notice to meet school fee requirements and textbooks. When schools open in July it is the plantation period when many poor rural families have a cash flow problem. The liquidity problem is a major reason why poor households with many children find it difficult to send them all to school.
7. Poor families have to make sacrifices for providing even a rudimentary education for their children. There is a tendency among poor families to withdraw an elder child, particularly girls, from school to enable a younger child to attend school. An elder child also has a vital economic value as s/he can be placed in paid work to support the family or take care of younger siblings and do household chores while parents are working. The high opportunity costs for poor families in keeping elder children in school should not be underestimated and is frequently deemed a major factor contributing to higher repetition and dropout rates as boys, but especially girls, become older. Poor families are also more vulnerable to the impacts of illness or the death of a family member which often results in children dropping out of school. In the cost-sharing study mentioned above, parents, teachers, and students stated the need for free education, poverty alleviation measures, scholarships, parental awareness, optional or free school uniform and child care centers to improve poor children’s access to school.
8. Lack of education perpetuates poverty: Parajuli (200131) has shown that education attainment and participation are negatively associated with poverty incidence and positively related to a more equitable distribution of income and consumption across households. Households with the highest poverty rate correlate with uneducated household heads, whereas the richest households correlate with completion of secondary and university level education. This relationship between education and income level is also confirmed by the data on the Net Enrollment Rate (NER). NER for the bottom quintile of households in Nepal is 39 percent , for the middle quintile it is 61 percent and for the richest quintile it is 77 percent . Table 2.2 below illustrates poverty incidence by education level.
Table 2-2: Poverty Incidence by Education Level of the Household Head 1995/96 & 2003/04
Poverty Headcount Rate Distribution of the Poor Distribution of Population Years of
Schooling 1995/96 2003/04 Change 1995/96 2003/04 Change 1995/96 2003/04 Change Illiterate 50.9 42.0 -17.5 72.9 70.9 -2.7 59.8 52.1 -12.9 5 or less years 35.7 28.2 -21.0 15.1 16.8 11.3 17.7 18.4 4.0
6-7 years 28.5 23.3 -18.2 6.7 8.1 20.9 9.8 10.7 9.2 8-10 years 19.8 8.4 -57.6 4.5 3.9 -13.3 9.6 14.5 51.0 11+ years 11.4 1.6 -86.0 0.9 0.2 -77.8 3.2 4.3 34.4
30 Kathmandu Education Foundation. Nepal Cost Sharing Research in Education. 2000. Kathmandu 31 Parajuli, D. 2001. External Efficiency and Equity in Education. Background paper for the working paper on finance for the World Bank Education Sector Review. Kathmandu

27
Total 41.8 30.8 -26.3 100 100 100 100 Source: CBS, 2005, Poverty Trends in Nepal (1995/96 and 2003/04).
In the next Chapter, Tables 4-2 and 4-2 illustrate the relationship between caste, ethnicity, education and poverty.
9. Poverty and examination performance: For secondary schooling, a major equity issue is the high stakes public examination taken after grade 10 (the SLC exam) as pointed out in an extensive study of the examination system undertaken in 2004. 32 In public schools, where the many poor are educated, only 20 percent of those that sit the School Leaving Certificate (SLC) examination achieve a pass. The pass rate for private schools is 80 percent. The outcome is that the majority of children struggle through the education system without any positive results. Reasons given for the failure of poor children to perform well on the SLC examination are associated with inadequacies in the public schools and the examination systems. Children in public schools have more barriers to achieving an SLC pass in comparison to better off children in private schools. Among these barriers are lack of public schools high failure rates in English because it is not used regularly in the classroom, unlike in the private schools where English is the medium of instruction. In terms of the examination system itself, if children fail in one SLC examination subject, they fail the whole SLC. Another issue raised by the recent SLC study is that there is no provision to waive SLC examination fees for very poor parents. The ‘send-up’ or mock SLC examination fee is set by individual schools and the final SLC examination fee is set by the government at Rps 350.
Gender
10. According to the DOE data for 2005, at the national level, gender parity has almost been achieved at primary level, with the share of girls in primary education having risen to 47.4 percent. This is a welcome achievement. But concerns about gender disparities amongst poor and disadvantaged groups at primary and secondary levels continues to concern the Government. Girls’ participation is lowest for the lowest caste (Dalit) girls at 34.5 percent. The proportion of indigenous (Janajati) girls in primary schools at 48.4 percent is higher than the national average, but the proportion of marginalized Janajati girls is not known. The share of girls in lower and secondary education follows the same pattern. This indicates that the proportion of girls from the Dalit community as compared with the other two groups is the lowest in all three levels of education. While girls lag behind boys in all aspects of educational attainment due to poverty and gender discrimination, the proportion varies between different economic and socio-cultural groups and location. A positive correlation is found between the socio-cultural, economic and educational status of households and girls participation in education. The National Living Standards Survey (NLSS) 2004 found that the NER of the poorest income quintile is only 51 percent compared to 87 percent among the richest quintile. The richest economic quintile has a narrow gender gap of 3 percent in favour of boys, which widens to 19 percent in the poorest quintile.33 An more detailed analysis of gender can be found in ESDP I Support Volume V: Analysis of the Political, Social and Economic Dimension of Inclusive Education in Nepal.
11. Gender is a major dimension of poverty. Women's active participation in paid employment is limited. Currently women constitute only a third of the total paid labour force.
32 MOES. 2005. Study on Student Performance in SLC. Kathmandu 33 Nepal living Standard Survey. 2004.

28
Moreover, when women enter the labor market, they earn less than men for the same type of work. A woman's share in household assets and income is far more uncertain than that of a man. Females of all age-groups have to work more hours than males in Nepal. This difference is more prominent in rural areas than in urban areas. Girls therefore have less time for homework and are more likely to miss school or drop-of of school altogether to support their families. Many younger males are also abandoning the rural areas to escape the possibility of forced recruitment as soldiers due to the conflict. These facs have led to the agricultural sector, which is dominated by small-scale subsistence farming, becoming increasingly feminized, with women and children, particularly girls, being left to operate most of the farms. Women contribute substantially to agriculture both in terms of labor input and decision making. Data from the Nepal Living Standard Survey shows that women-headed households are poorer than male-headed households and spend less on consumption. While women-headed households constitute 20 percent of all households at the national level, there are 13 districts, mostly in the mountains and hills where high male migration takes place and where the ratio is higher than 20 percent. The ongoing conflict has resulted in thousands of men being killed which has contributed to an increase in the vulnerability of female-headed households and their inability to afford to send their children to school.
12. The literacy rate for girls and women is lower than for men. Adult literacy for women (over 15 years of age) is only 34.9 percent compared to 62.7 percent for men, although this discrepancy includes historical as well as contemporary disadvantage. However, the literacy gap between boys and girls continues at every income quintile. As shown in Table 2-3 below. The percentage share of females in literacy varies between better off and poorer districts. It is highest in Kathmandu at 60.1 and lowest in Humla district at 4.834. Literacy rates for girls in rural areas are lower than in urban areas due to factors of poverty, distance from school, demands of household labour and early marriage.
Table 2-3: Literacy rates of population 6 -15 years by gender
Consumption Quintile Male Female Total Poorest 36.0 15.8 25.1 Second 52.7 27.2 39.2 Third 62.0 35.8 48.1 Fourth 73.0 48.5 60.1 Richest 87.1 63.6 75.2
Source: Nepal Living Standards Survey (NLSS), 2003/4
13. Gender and schooling: Girls domestic labour is considered to be a commodity vital to the household as girls are heavily involved in child minding, water and fuel collection and other household chores. The direct, indirect and opportunity costs of educating girls are therefore unaffordable for poor families, especially those living on or below the poverty line35. While scholarships are now made more widely available by the government for girls, it is widely cited that they are too small in value to offset the actual costs. The household responsibilities of girls cause irregular school attendance and a lack of time for homework.
14. Even if poor girls are given the opportunity to enrol in school through scholarships, they often do not have a supportive environment at home or at school. The SLC Study conducted in 200436 revealed that SLC exam performance and the time allocated for
34 Nepal Human Development Report, 2004 35 The poverty line used in Nepal is NRs 4,404 based on consumption of 2,124 calories and the ability to purchase a number of essential non-food items 36 MOES. 2005. Study on Student Performance in SLC. Kathmandu
29
Box 2-1 Janajatis Defined Janajatis are defined as people who have their own language and traditional culture, and who are not included under the conventional Hindu hierarchical caste structure. The Janajatis are for the most part indigenous people. Janajatis constitute 35.6 percent of the total population of Nepal and reside all over Nepal from the high mountains to the Terai. The situation of the Janajatis, economically and otherwise, varies widely from one community to another and depends on many factors, including physical isolation and historical loss of traditional community-owned land. The Janajatis that appear to be the poorest are those living in the Terai and mid-hill regions 1
household chores are significantly correlated. The study noted the equal performance of boys and girls at lower grades signifies the adverse affect of increased household responsibilities on girls’ performance at higher grades. Inside school, male school teachers have often been observed as being “gender biased” by paying less attention to girls or directing questions at boys only. Many schools do not have adequate toilet facilities, which is a barrier to attendance especially for teenage girls lacking the means for menstruation management. These factors are not conducive to learning and lead to low attendance, lower levels of academic attainment, retention and increased drop out levels.
15. A survey conducted by UNICEF in 200337 in four districts of the Terai found that little change has taken place in the reasons for girls’ exclusion from schools. Factors responsible for the dropout of girls are mostly related to the family and community, the school and the environment which perpetuates gender inequality and the low status of girls. The key domestic factors identified were poverty and health problems due to malnutrition; household chores; frequent absenteeism due to demands from the family; lack of proper clothes and educational materials and parents’ illiteracy. A significant barrier to a girl attending school is her low status and the negative attitude of her parents towards her education. She is often perceived as a financial burden to her family until she is married and her ownership is then transferred to her in-laws. Early marriage is illegal but still common in Nepal and parents therefore often do not perceive the investment in girls’ education as worthwhile as for boys. Boys on the other hand are of higher status since they are the parents’ insurance policy in old age. Boys stay with their parents, provide an income and bring their wives into the home. Hence parents perceive a boys education to be a priority investment. Despite these barriers the value of girls’ education is increasingly understood and is reflected in the increase in girls’ literacy rates in the past 10 years, though they still lag behind boys and there are disparities between better off and poor girls, rural and urban areas.
Ethnicity
16. Ethnic Dimensions of Social and Economic Inclusion: Poverty is closely linked to social identity i.e. caste and ethnic background. For every Human Development Indicator (HDI) Janajati groups (except Newar) fall below the national average and well below the dominant Brahmin, Chhetri and Newar groups. However there is considerable variation in the welfare status of different Janajati groups. Poverty incidence is highest among the marginalized Limbus, Tamangs, Magars, Tharus and Musahars, along with 14 other smaller population groups. Limbus have the highest poverty level (71 percent). Other disadvantaged groups such as the ex-Kamaiyas (former bonded labourers) are also poverty stricken.. Education and literacy levels are low among Janajati men and especially women, many of whom do not speak Nepali as their mother tongue. The education curriculum has until fairly recently only been offered in Nepali, which has presented barriers to Janajati’s access to education. However, provision of mother tongue teaching at primary level and translation
37 Community Based Action Research on Girls’ Education, UNICEF, 2003

30
Box 2-2 Dalit Defined The term “Dalit” has emerged as an identity recently in Nepal and originates from India where it gained currency in the caste Hindu riots in the early 1970s. The term Dalit , coined by the ex-untouchables themselves, is rooted in a rights perspective, claiming self respect and dignity as an entitlement. The constitution of Nepal 1990 banned untouchability, abolished discriminatory legal provisions and included in the Constitution statements ensuring equality for all citizens irrespective of caste, creed or gender. However, discrimination based on caste is still a fact of life in Nepal.1 Long marginalized by the rest of society, even today they are expected to earn their living by performing tasks the rest of society considers unclean and “impure”. Dalits sharing drinking water from a community tap stand with higher castes is still a source of conflict in many parts of rural Nepal. Given their limited income earning opportunities, lack of land ownership and limited access to education and other public resources, it is not surprising that two thirds of Dalits, who make up 15 percent of the population in Nepal (Census 2001), currently live below the poverty line.
of grade textbooks is in progress.
17. The 2005 Technical Review of Education 38 found a positive correlation of 0.6 between Janajatis teachers and enrolment from the corresponding community. The same study recorded that the majority of teachers belonged to the high caste groups of Brahmin and Chhetris. There is a significant need for effective measures through affirmative action and motivational packages to achieve a significant increase in men and women from Janajati groups in the teaching force, prioritising resources to serve districts particularly where poor Janajati population groups reside. There was a limited share of Janajatis in the total number of teachers – 23 percent Janajatis and only 2 percent from marginalized Janajati groups.
18. Dalit Dimensions of Social and Economic Inclusion: The lowest caste group, Dalits, also have a high incidence of poverty with an average per capita income of only US$ 39.60 (Nepal average is US $210 per year). Between 65-68 percent of Dalits fall below the poverty line compared to 34 percent of high caste Brahmins and 24 percent of Newars. Being landless or owning very small parcels of land, most Dalits rely on wage labour to sustain themselves. Similar to the findings regarding Janajatis, the 2005 Technical Review of Education39 found a positive correlation (.07) between teachers from Dalit and the number of students enrolled from the corresponding community. The same study recorded that the majority of teachers belonged to the high caste groups. There was a limited share of other caste groups in the composition of total teachers – only 2 percent Dalit. There is a significant need for effective measures through better targeting, affirmative action and motivational packages to achieve a significant increase of men and women from the Dalit group in the teaching force. As indicated in the Flash 1 report 2004, 16 percent of school aged children (500,000 children) throughout Nepal are yet to attend schools, the major proportion consisting of Dalits, girls and children of socio-economically disadvantaged groups. The participation of Dalits in the Terai regions in particular, is very low.
19. The Technical Review of School Education Survey, 2006 shows that the retention rates in primary schools surveyed for Dalits at grade 1 is 90 percent, which is almost the same as for all other students and is attributed largely to the availability of scholarships. However, at the regional level the retention rate of Dalits varies, with the Eastern region having the lowest
38 Technical Review of Education 2005: A report 39 Technical Review of Education 2005: A report

31
retention rate of 77 percent in comparison with the Western region which has 97 percent. The Terai region also has the lowest Dalit retention rate at grade 1 of 85 percent. There are also wide variations between districts.
Conflict 20. The Impact of Conflict on Education: Even during the height of the insurgency,
many children in affected areas continued to be educated on a daily basis despite the armed conflict, and there has been significant progress in increasing the number of children enrolling in primary school nationwide throughout the 10 year conflict period.40 The Government and communities have been maintaining the education system thereby ensuring a certain amount of stability for children despite the difficult and insecure environment. The Education For All (EFA) framework in particular includes a strong commitment to strengthening Government capacity to provide education services and contains specific strategies to address exclusion.41 Nevertheless, over the last ten years the escalation of the conflict has made discernable impacts on education provision. Consequences of the conflict include widely documented instances of damage to schools and attacks on District Education Offices; the use of school buildings by the Army and the Maoists; school closures and displacement of pupils and teachers; the abduction of pupils for political indoctrination and recruitment which has been widespread with around 5,000 reported to have been abducted between July and September 2004 alone42; beatings and in extreme cases, the killing of pupils, teachers and other personnel.43 The conflict has created an atmosphere of fear and suspicion, and consequently affected the education environment which should be for safe for the creative learning of children. Many children have migrated from the rural hills to overcrowded schools in district headquarters and beyond to where it is perceived to be safe. On average, schools have lost 13 percent of school days due to conflict or political reasons44.
21. Displacement and migration have led to severe overcrowding in schools. One of the most obvious impacts of the conflict on education in Nepal is the overcrowding in many schools especially in the Terai and areas with high numbers of Internally Displaced Persons. In Surkhet district which has been highly affected by inward migration for example, there were up to 120 pupils in Grade 6 observed in one school as part of a recent study. Displacement is due to the conflict and economic migration mainly from the hill areas. This has resulted in many schools in hill areas having very few pupils and overcrowding in the classrooms of the Districts to which people have moved. A recent study reports that ‘there is some frustration that “government has not been able to respond quickly enough to demographic changes.” The overall statistics suggest that there may be sufficient teachers overall, but they are inappropriately distributed.45.
22. From a conflict perspective the Government’s ability to respond to overcrowding is a major issue. It could be argued that a rapid response to this problem is needed, perhaps involving the recruitment of additional teachers in the overcrowded Districts. However, this may require a re-allocation of resources to fund new teaching posts or a redeployment of
40 The TRSE reported an overall increase of 12 percent in 2005 over the previous year, and an increase of 25 percent at Grade One in 2005 attributed mainly to the ‘Welcome to School’ enrolment campaign. 41 Vaux/Smith. 2006. EFA Nepal: Review from a Conflict Perspective (draft) 42 Ibid 43 Department of Education information indicates that 5 education personnel, 11 pupils and 182 teachers have been killed; 315 schools closed; 70 schools damaged up to the end of 2005. 44 Technical Review of School Education in Nepal, 2005: A report. DOE 45 EFA Nepal: Review from a conflict perspective. International Alert. 2006 (draft)

32
Box 2-3 Inequity, Education and Conflict The TRSE survey of (March) 2006, notes that of all the development regions, the Far Western Development Region, along with the Mid Western region has the lowest HDI indicators and the lowest mean years of schooling and is one of the most conflict affected, and has the lowest proportion of teachers supported by the central government: 75, 68 and 52 percent for primary, lower secondary and secondary levels respectively. In the Far Western Development Region, 30 and 41 percent of lower secondary and secondary teachers are supported through schools’ own resources whereas in the Eastern Development Region, 76 and 91 percent of teachers are supported by the government at lower secondary and secondary levels respectively. The TRSE report states ‘the survey findings thus show that disadvantaged regions get less support from the central government. This also indicates that the government subsidies do not proportionately reach those in most need’.
existing teachers for a period of time (though this presents the risk of large multi-grade classes in the districts teachers leave behind). The government is reluctant to create any new permanent teaching posts due to longer term funding implications, hence communities have had to recruit that are not on the government payroll on lower salaries. Despite these constraints, dealing with overcrowding in schools is a significant challenge that needs to be addressed in terms of maintaining confidence in the education system and ensuring a basic quality of education for children.
23. The Impact of Education on Conflict: The way education has been provided does not adequately address inequalities and apparent injustices. Education as a tool for removing the causes of resentment between the poor and better off caste and ethnic groups has been missed in many instances. The poor quality of schooling provided in many community schools, particularly in rural areas, erodes public confidence in the Government’s willingness to provide basic services making it easier to mobilize support for violent confrontation. In the current situation, with public confidence in a political solution growing there is a new opportunity to remedy long standing problems through better access, inclusion and greater equity in the schooling of the previously excluded and poor population groups. In addition, the Government can demonstrate its capacity to cope with long-standing problems by reaching out to include excluded groups in the teaching force and education management cadre.
24. How conflict impact issues are currently being planned to be addressed by EFA and SESP: Recently the Ministry of Education has produced a paper that indicates that a budget line of 4.6 million NRs has been created within the EFA to support a range of measures in response to the impact of the conflict on primary schools (for example, support for conflict-affected pupils and teachers through scholarships, counseling, deputing teachers to other schools). The paper suggests that a focal person at district level is required to monitor the impact of the conflict, but this is yet to be implemented. Likewise for lower secondary and secondary education the DOE has drafted a similar plan for providing emergency relief to conflict affected schools. While some of the measures identified will be funded under SESP, there are funding gaps for many other planned activities, significantly for the building of 600 additional classrooms and salaries for additional teachers to address overcrowding problems.
Legal and Policy Framework Relating to Inclusive Education
25. International Policies: The Dakar framework of Action in 2000 called for global commitment to achieve Education For All (EFA) goals, a core priority of which is inclusive education. It is committed to ensuring “that by 2015 all children, particularly girls, children in difficult circumstances and those belonging to ethnic minorities, have access to complete,

33
free and compulsory quality education”. The United Nation conventions and the Declaration of Human Rights have provided a global framework of rights and equity for all, especially women, children and other disadvantaged groups. Nepal is a signatory to all of these and has endorsed the Millennium Development goals of 2000 for achieving universal primary education for all boys and girls by 2015.
26. National Policies: In the last five decades, access to primary education increased considerably in quantitative terms. From 1952 onwards, foundations were also developed for secondary and tertiary education. The number of primary schools increased from 321 in 1952, to 25,927 in 2000, registering an annual growth rate of 9.58 percent per annum. In 1972, the number of students enrolled in primary schools was about 450,000, of which girls comprised only around 16 percent. The figure in 2000 stood at 3,881,118 of which girls comprised 44 percent.
27. Nepal’s Constitution of 1990 gives all communities the right to preserve and promote their language, writing forms, and culture and to educate their children in their mother tongue and to practice their own religion. It states that while the Nepali language in the Devanagari script is the official language, all languages spoken as mother tongue are included as the national languages of Nepal. Since 1990, a number of key reforms have been introduced to strengthen the focus on equity, inclusion and decentralisation. These include the Local self Governance Act, 1999, and Nepal’s Tenth Five Year National Plan (2002-2007). For the first time, the plan has social inclusion as one of its four pillars and emphasizes inclusive education as a central approach to reducing disparities related to gender, caste and ethnicity. The 7th amendment to the Education Act 2001 provides communities with formal rights, through School Management Committees, to the management of primary schools to improve equity of access and quality. This progressive and ambitious strategy requires careful analysis and improved modalities to enable the equal participation of women and children from poor and disadvantaged castes and ethnic groups, as well as children in especially difficult circumstances.
28. National Plans: Education for All (EFA 2004-2009) is the third in a series of partnerships between the Government of Nepal and development partners to improve access and the quality of basic and primary education in Nepal. It epitomizes the efforts towards donor harmonization in agreeing to common strategies and programs for the development of this sub-sector. It is a part of the National Plan of Action and draws on the goals of the Dakar Framework of action. The EFA program in Nepal has been further oriented towards the Millennium Development Goals as a ‘National Plan of Action’. It focuses on six components: Early Child Development (ECD); Access for disadvantaged groups to ‘free and compulsory’ education; Meeting the learning needs of all; Adult literacy; Eliminating gender disparities (achieving gender parity) and; Quality education. In the National Plan, education in ‘the mother tongue’ is included as a seventh issue but in most documents and reports, it is incorporated into the six priority areas listed above. The Secondary Education Support Program (SESP 2003-2007) is a similar partnership for secondary education. However, its modus operandi in matters of financial management is different from that of EFA. Donors have established an independent monitoring process called the Technical Review of School Education (TRSE) covering both EFA and SESP.
29. EFA Core Document from an inclusion perspective: The guiding principles of the EFA Core document emphasize gender mainstreaming and social inclusion as primary approaches. The strategies for implementation also refer to social equity and mitigating socio-cultural barriers. Specific measures to attract and retain girl students include: increased
34
recruitment of female teachers; scholarships for girls; the development of a more gender sensitive curriculum; incentive schemes and partnerships for social mobilisation and community awareness - raising. There is a commitment to following the recommendations of the gender audit carried out by the DOE in 2002 -the DOE Gender Equity and Development Unit reports that 8 out of 10 recommendations from the audit have subsequently been implemented.
30. The EFA Core Document suggests that the provision of scholarships for disadvantaged indigenous people will gradually become compulsory for schools; it supports an increase in special programs for disadvantaged groups and encourages mother tongue education. Meeting the learning needs of all children, including Dalit, Janajati and linguistic minorities, using locally available resources to produce educational materials, promoting alternative and flexible schooling to address the needs of marginalised children are other elements that support social inclusion.
31. A review of the EFA Core Document from a gender and social inclusion perspective carried out earlier46 reveals many strengths but also some challenges created by these strategies. The approach tends to reflect a welfare approach to girls and women rather than a rights-based approach. A rights-based approach recognises that women, who represent half the population, have equal rights in public and private life. In the context of Nepal, careful analysis and strategies need to be in place to enable the necessary strategic shifts in the status of women and girls e.g. relating to girls’ domestic roles and their negative impacts on attendance and attainment. A rights-based approach is also necessary for Dalit and marginalized indigenous groups and the particular gender needs of these different groups, along with specific strategies. The overall design of the EFA programme is directly aimed at issues of exclusion, which is a major cause of political crisis and conflict, therefore EFA is considered to be an appropriate response to some of the underlying causes of the conflict in Nepal. However, specific strategies for raising the social status of girls, Dalit, and other marginalized indigenous or disadvantaged groups are not mentioned. Strategies specifically to promote social inclusion within schools and wider society are also not mentioned within the EFA framework and hence have not been adequately addressed.
32. Another challenge which is not addressed in the EFA Core document is the inadequate attention given to women, Dalit and Janajati representation at all management levels, which is a form of political exclusion. School Management Committee (SMC) rules for example, only require one female parent as a member and there is no requirement for SMCs to have Dalits or Janajati group members from their schools. A DOE study in 200547 found the composition of SMCs was largely dominated by high castes (56 percent), with the participation of women a mere 2 percent. Lastly, there is strong evidence that primary education is not ‘free’ and that schools frequently charge for various school activities that poor families cannot afford, yet this is not acknowledged in the EFA Core Document.
Conclusions
33. Over the last ten years, Nepal has experienced a complex development setting characterized by conflict and political instability. The underlying causes of the conflict include poverty and regional, gender, ethnic and caste-related inequalities that are challenging. In the past, poverty alleviation efforts have been hampered by inadequate governance and the
46 Bhatia.K./Turin.M. 2004. Vulnerable Communities Development Plan. Submitted to MOES/World Bank/DANIDA 47 Technical Review of School Education (TRSE) in Nepal. 2005. DOE

35
failure to deliver adequate social services and essential facilities to rural communities and marginalised groups. Given the recent political developments in Nepal with the Maoist insurgents engaging in peace talks with an interim government, a move towards more inclusive education is likely to be high on the political agenda. It is therefore opportune for ADB to support Nepal’s education sector in the provision of more equitable education which, in turn, may contribute to preventing future conflict
34. Some of the tools that can address these persistent challenges may already be at hand. For example. the guiding principles of the EFA Core document emphasize gender mainstreaming and social inclusion as primary approaches. The design of the EFA program is directly aimed at the issues of the social and economic exclusion of girls, Dalit and marginalized ethnic groups and therefore is considered to be an appropriate instrument for increasing equity of access to education and responding to the underlying causes and consequences of the conflict. However, there are a number of significant issues that require consideration for future planning and implementation relating to political, social and economic inclusion. The four main suggestions are:
1. Incorporating a gender and inclusion ‘lens’ in reviewing and planning policies
and strategies, budget allocation and monitoring processes, and ensuring that all six central MoES departments can be mobilized to ensure the objectives of full access for women, girls, Dalits, Janajatis and other vulnerable groups are met;
2. Establishing a Gender Equity and Social Inclusion thematic working group/task force to ensure the effective coordination of policies and to conduct a systematic analysis of current and proposed policies to identify barriers to access for women, Dalits, Janajatis and other vulnerable groups and propose specific mechanisms and incentives to overcome these barriers.
3. Initiating a dialogue with the National Civil Service Commission to set targets and establish quotas to increase the number of women gazetted staff in MOES and DOE at central and district levels, including an increase in the representation of marginalized Janajati and Dalit groups.
4. Clarifying the mandate for, developing the capacity of, and providing adequate resources for the MOES gender focal point.
35. ESDP I will support the country’s efforts to reduce poverty and ease social tensions by supporting the goals of the Tenth Plan (the Government’s poverty reduction strategy) and the education sector to address the issue of poverty through human development measures, particularly the social and economic inclusion of girls and disadvantaged groups. The next chapter examines the education context of ESDP I.

36
III. EDUCATION CONTEXT
Introduction 1. Education in Nepal developed in the context of its unique history, topography, and
cultures. Although politically unified in the 1780s by the military conquest of small and fragmented kingdoms, the people of Nepal retained their separate linguistic, ethnic, and cultural identities. Under the 100-year rule of hereditary prime ministers, the country was a closed Kingdom, and Nepal’s difficult terrain assured internal as well as external isolation. Until the 1950s, an oppressive political regime as well as a feudal social and economic structure kept the illiterate, agrarian population in disenfranchised poverty. The dominant classes encouraged formal instruction for their own sons, but viewed education for the general population as an anathema to their privileged position. Out of these social, geographical, political, and economic conditions emerged the broad educational agenda that has persisted from the 1951 revolution until today: encourage national unity, aid rural development, provide skills for employment, and foster academic opportunities for disadvantaged groups”. In the late 1990s, poverty reduction was added to the national development agenda. After 2000, good governance issues—such as accountability, transparency, and participation as well as technical issues, such as school effectiveness—were added to the education agenda.
2. Geography: Bordered by India (south, east, and west) and China (north), Nepal packs enormous diversity into its 147,181 square kilometers.. There are three ecological regions, (mountain, hill, and Terai) each with vastly different patterns of human settlement, land distribution, population density, productive resources, infrastructure, and levels of economic development. The Terai in the south is a fertile plain, covering 23 percent of the landmass of the country. The mountains, with their harsh environmental conditions, support a sparse population who eek out a living at altitudes above 4,877 meters. Set between the Terai and mountains, the hills, are a complex zone of intermingling hills, spurs, valleys, and river basins which account for 42 percent of Nepal’s landmass. About 13 percent of the population live in the 22 districts now classified as remote.48 Here, sparsely distributed populations have poor access to any government services, including schools. Although the situation of primary schools has improved, good quality secondary schooling is not readily accessible in these areas.
3. Diversity: Diversity is a hallmark of Nepal’s social context. Social classification is influenced by political as well as sociological considerations, and the numbers of ethnic, caste, and language groups vary depending upon who is counting. According to the 1991 census, there are at least 26 ethnic and 29 caste groups, speaking 36 different languages and dialects. Other official tallies49 count 59 languages spoken among the 8.4 million people classified as “indigenous.” The Nepali language is used both as the lingua franca of the country and the state language. It is the mother tongue of 50 percent of the population and a second language for many others. Given that debates about language policy50 are often proxies for debates about exclusion, issues concerning diversity and national identity will likely be discussed widely during the preparation of the education policy framework.
48 In Nepal, remote areas are defined as having difficult terrain, poor accessibility, few roads, and sparse telecommunications services. 49 National Federation of Disadvantaged and Indigenous Nationalities 50 Efforts to promote instruction in eleven local languages and local curriculum are underway but implementation is slow due to teacher recruitment, curriculum, and materials development challenges.

37
4. School-Aged Population: Nepal’s population is generally young, with children under 15 constituting about 40 percent of the population. As shown in Table 3.1 below, the official school-age group (6-15 year olds) represents about 24 percent of the population. In 2001, there were about 608,000 children, on average, per single age cohort in the 5-9 age group, and 578,000 in the 10-14 age group. The figure for the higher secondary school-age group of 15-19 year olds is 497,000. Projections indicate that these numbers will have increased to 622,000, 604,000, and 574,000 respectively, in 2006. The natural increases in the school-aged population have contributed to increasing demand for more teachers and classrooms. The growth rate for the 0-4 age group is expected to slow between 2006 and 2011, reducing pressures on primary schools and classrooms towards the EFA goal year, 2015.
Table 3-1: Population Projection by Age Group 2001-2016
(‘000) 2001 est. 2006 proj. 2011 proj. 2016 proj.
Age Group Total
Avg. Per
Single Age
% of Total Pop.
Total Avg. Per
Single Age
% of Total Pop.
Total Avg. Per
Single Age
% of Total Pop.
Total Avg. Per
Single Age
% of Total Pop.
0-4 3,169 634 13.7 3,569 714 13.8 3,555 711 12.4 3,644 729 11.6 5-9 3,038 608 13.1 3,112 622 12.0 3,518 704 12.3 3,513 703 11.2 10-14 2,892 578 12.5 3,018 604 11.7 3,095 619 10.8 3,502 700 11.2 15-19 2,484 497 10.7 2,869 574 11.1 2,999 600 10.5 3,079 616 9.8 Total 23,151 50 25,887 48.6 28,585 46 31,327 43.7
Source: Central Bureau of Statistics, 2001, Population Projection 2001 - 2021 (Medium Fertility Decline Variant).
5. Poverty: Chapters II and III of this Main Report describe the relationship between
caste, ethnicity, education, and poverty. The following Tables illustrate two relationships— Table 3-2 between poverty incidence and caste and ethnicity and Table 3-3 between poverty and education attainment. These tables and a more comprehensive analysis can be found in ESDP I Support Volume II: Public Expenditure Review of the Education Sector.
Table 3-2: Incidence of Poverty by Caste and Ethnicity
11.714.2
19.0
26.5
30.833.0
41.442.8
45.747.6
0.0
5.0
10.0
15.0
20.0
25.0
30.0
35.0
40.0
45.0
50.0
Terai Brahmin/Chhetri
Newar Hill Brahmin/Chhetri
TeraiMiddleCastes
NEPAL Terai Janajatis
Muslims Hill Janajatis
Terai Dalit
Hill Dalit
Per
cent
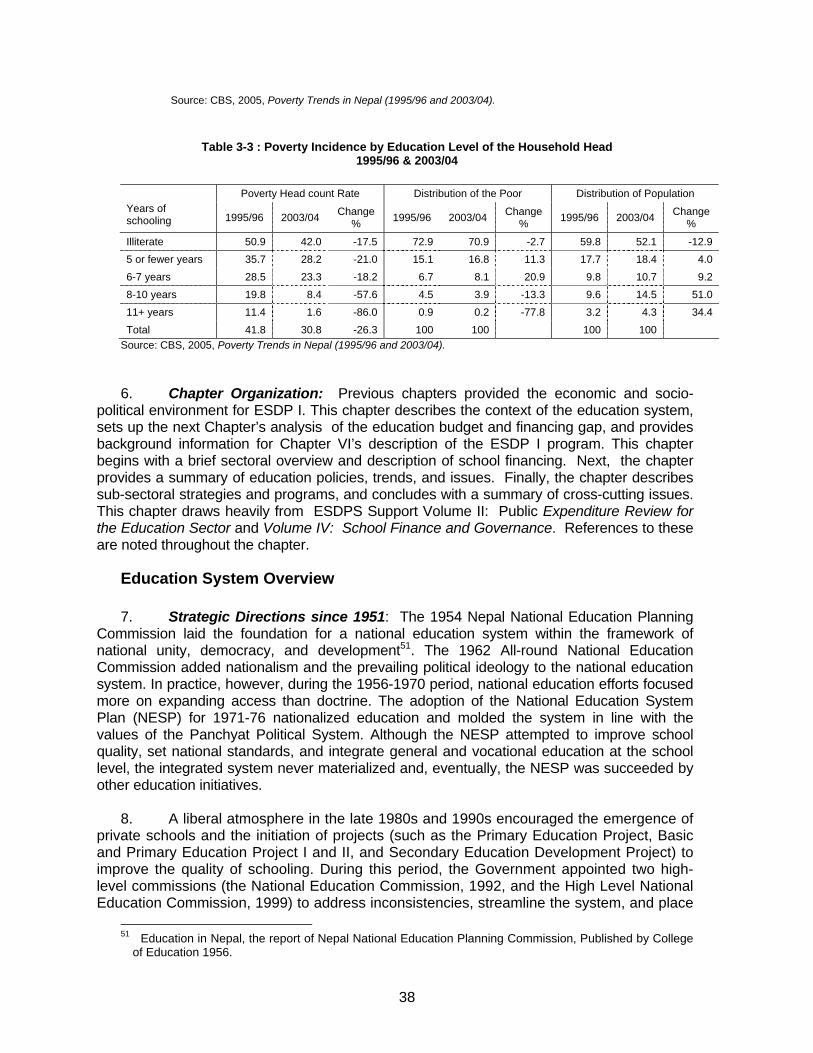
38
Source: CBS, 2005, Poverty Trends in Nepal (1995/96 and 2003/04).
Table 3-3 : Poverty Incidence by Education Level of the Household Head 1995/96 & 2003/04
Poverty Head count Rate Distribution of the Poor Distribution of Population
Years of schooling 1995/96 2003/04 Change
% 1995/96 2003/04 Change% 1995/96 2003/04 Change
%
Illiterate 50.9 42.0 -17.5 72.9 70.9 -2.7 59.8 52.1 -12.9 5 or fewer years 35.7 28.2 -21.0 15.1 16.8 11.3 17.7 18.4 4.0 6-7 years 28.5 23.3 -18.2 6.7 8.1 20.9 9.8 10.7 9.2 8-10 years 19.8 8.4 -57.6 4.5 3.9 -13.3 9.6 14.5 51.0 11+ years 11.4 1.6 -86.0 0.9 0.2 -77.8 3.2 4.3 34.4 Total 41.8 30.8 -26.3 100 100 100 100
Source: CBS, 2005, Poverty Trends in Nepal (1995/96 and 2003/04).
6. Chapter Organization: Previous chapters provided the economic and socio-political environment for ESDP I. This chapter describes the context of the education system, sets up the next Chapter’s analysis of the education budget and financing gap, and provides background information for Chapter VI’s description of the ESDP I program. This chapter begins with a brief sectoral overview and description of school financing. Next, the chapter provides a summary of education policies, trends, and issues. Finally, the chapter describes sub-sectoral strategies and programs, and concludes with a summary of cross-cutting issues. This chapter draws heavily from ESDPS Support Volume II: Public Expenditure Review for the Education Sector and Volume IV: School Finance and Governance. References to these are noted throughout the chapter.
Education System Overview 7. Strategic Directions since 1951: The 1954 Nepal National Education Planning
Commission laid the foundation for a national education system within the framework of national unity, democracy, and development51. The 1962 All-round National Education Commission added nationalism and the prevailing political ideology to the national education system. In practice, however, during the 1956-1970 period, national education efforts focused more on expanding access than doctrine. The adoption of the National Education System Plan (NESP) for 1971-76 nationalized education and molded the system in line with the values of the Panchyat Political System. Although the NESP attempted to improve school quality, set national standards, and integrate general and vocational education at the school level, the integrated system never materialized and, eventually, the NESP was succeeded by other education initiatives.
8. A liberal atmosphere in the late 1980s and 1990s encouraged the emergence of
private schools and the initiation of projects (such as the Primary Education Project, Basic and Primary Education Project I and II, and Secondary Education Development Project) to improve the quality of schooling. During this period, the Government appointed two high-level commissions (the National Education Commission, 1992, and the High Level National Education Commission, 1999) to address inconsistencies, streamline the system, and place
51 Education in Nepal, the report of Nepal National Education Planning Commission, Published by College
of Education 1956.

39
education on a path of improvement. However, the commissions failed to produce a consistent and effective policy framework to guide development of the education system. After 2000, the government policies shifted towards "fundamental reforms" such as decentralization and community involvement to improve school performance mainly through projects. This projectized approach led to a proliferation of scattered, uncoordinated, and sometimes contradictory policy statements. A policy mapping activity completed in 2004 by a Core Group in the MoES reviewed eight, key policy documents and culled over 215 policies statements relating to management, finance, standards, and programs.52 This result is not surprising given the absence of both an established structure and a systematic process for policy analysis and policy formulation. A description of the current policy context can be found in this chapter in the section on Policy Trends and Issues.
9. Structure: The school system in Nepal is comprised of 5-year primary, 3-year lower secondary, 2-year secondary, and 2-year higher secondary levels for grades 1-12. The current policy foresees moving to an 8-year basic and 4-year secondary system starting in 2009.
10. Management and Governance: Most governance functions (policy making, finance, strategy, standards setting, and appraisal) are allocated to the national level, and the bulk of resources are transferred to schools via the Ministry of Education’s (MoES) Department of Education’s (DoE) de-concentrated district level offices. The DoE also monitors school performance and acts as fiduciary. In the absence of elected representatives at the national or district levels, there is no independent public accountability for school system governance, except where communities are able to mobilize social audits. In this manner, public opinion is expressed through choice and voice. Choice is exercised by privileged groups who send their children abroad or to private schools. Voice is exercised through parental representation on the School Management Committee (SMC), Village Education Committee (VEC), and District Education Committee (DEC).
11. Schools are managed by four lines of authority: 75 district education offices that report to the central level, 75 district education committees, 3,973 village/municipal education committees that, in theory, report to local governments, and 26,000 school management committees that report to their communities. The overall school system is managed by the DoE through de-concentrated District Education Offices (DEOs) in each of the 75 districts. Responsible for all levels of public education, DEOs are supported by resource persons in Resource Centers which provide both monitoring (quality control) and professional support (quality improvement) services to a cluster of 10-25 primary schools. However, many studies find that in practice schools are visited infrequently, if at all. DEOs are also responsible for ensuring accurate and timely flow of funds to schools (currently earmarked, block, and incentive grants) for salaries as well as the distribution of provisions such as teacher training activities, etc. The DEO is also responsible for preparing expenditure and output reports every four months and Education Management of Information Systems (EMIS) reports twice
52 The documents are
I) The Tenth Plan (2002/03 – 2006/07) II) Mid-Term Expenditure Framework (July, 2004) III) Education Act, 7th Amendment (2028, 1971) IV) Local Self Government Act (2055) V) Teacher Training Policy, NCED (2005) VI) Strategic Implementation Plan for Education Policy (2005-2006) VII) Secondary Education Support Project (July, 2006) VIII) Education For All Core Document (2004-2009)
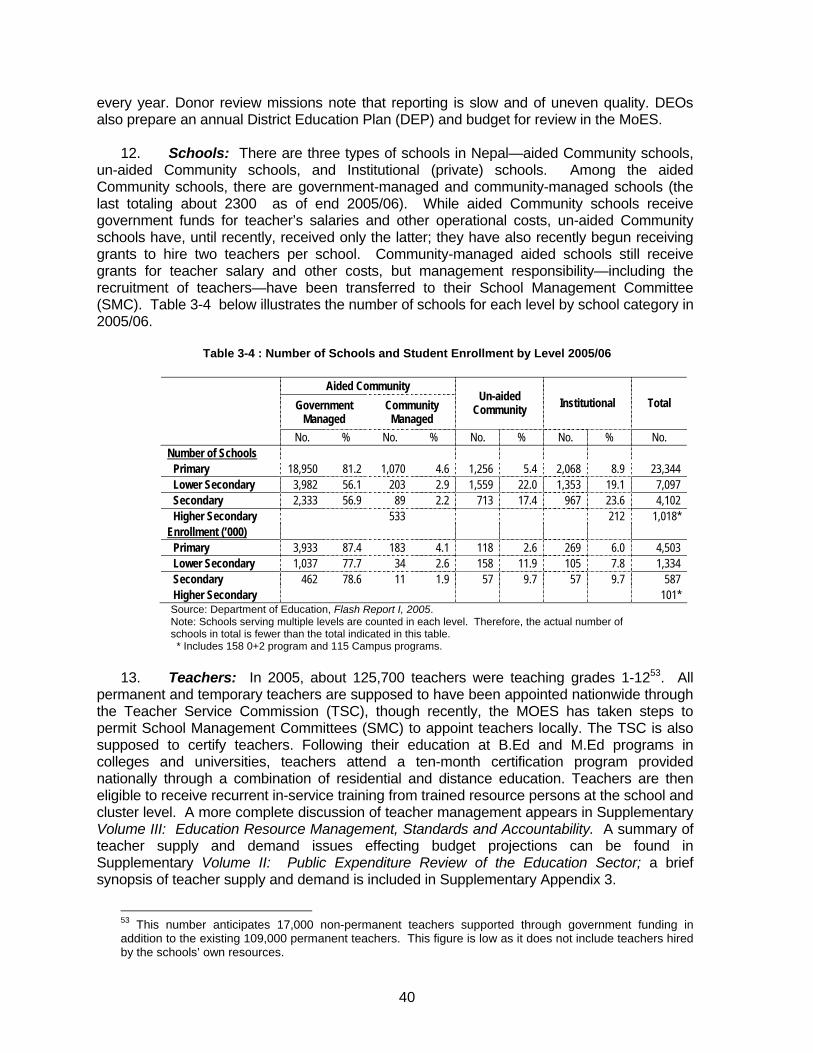
40
every year. Donor review missions note that reporting is slow and of uneven quality. DEOs also prepare an annual District Education Plan (DEP) and budget for review in the MoES.
12. Schools: There are three types of schools in Nepal—aided Community schools, un-aided Community schools, and Institutional (private) schools. Among the aided Community schools, there are government-managed and community-managed schools (the last totaling about 2300 as of end 2005/06). While aided Community schools receive government funds for teacher’s salaries and other operational costs, un-aided Community schools have, until recently, received only the latter; they have also recently begun receiving grants to hire two teachers per school. Community-managed aided schools still receive grants for teacher salary and other costs, but management responsibility—including the recruitment of teachers—have been transferred to their School Management Committee (SMC). Table 3-4 below illustrates the number of schools for each level by school category in 2005/06.
Table 3-4 : Number of Schools and Student Enrollment by Level 2005/06
Aided Community
Government Managed
Community Managed
Un-aided Community Institutional Total
No. % No. % No. % No. % No. Number of Schools
Primary 18,950 81.2 1,070 4.6 1,256 5.4 2,068 8.9 23,344 Lower Secondary 3,982 56.1 203 2.9 1,559 22.0 1,353 19.1 7,097 Secondary 2,333 56.9 89 2.2 713 17.4 967 23.6 4,102 Higher Secondary 533 212 1,018*
Enrollment (’000)
Primary 3,933 87.4 183 4.1 118 2.6 269 6.0 4,503 Lower Secondary 1,037 77.7 34 2.6 158 11.9 105 7.8 1,334 Secondary 462 78.6 11 1.9 57 9.7 57 9.7 587 Higher Secondary 101* Source: Department of Education, Flash Report I, 2005. Note: Schools serving multiple levels are counted in each level. Therefore, the actual number of schools in total is fewer than the total indicated in this table.
* Includes 158 0+2 program and 115 Campus programs. 13. Teachers: In 2005, about 125,700 teachers were teaching grades 1-1253. All
permanent and temporary teachers are supposed to have been appointed nationwide through the Teacher Service Commission (TSC), though recently, the MOES has taken steps to permit School Management Committees (SMC) to appoint teachers locally. The TSC is also supposed to certify teachers. Following their education at B.Ed and M.Ed programs in colleges and universities, teachers attend a ten-month certification program provided nationally through a combination of residential and distance education. Teachers are then eligible to receive recurrent in-service training from trained resource persons at the school and cluster level. A more complete discussion of teacher management appears in Supplementary Volume III: Education Resource Management, Standards and Accountability. A summary of teacher supply and demand issues effecting budget projections can be found in Supplementary Volume II: Public Expenditure Review of the Education Sector; a brief synopsis of teacher supply and demand is included in Supplementary Appendix 3.
53 This number anticipates 17,000 non-permanent teachers supported through government funding in addition to the existing 109,000 permanent teachers. This figure is low as it does not include teachers hired by the schools’ own resources.
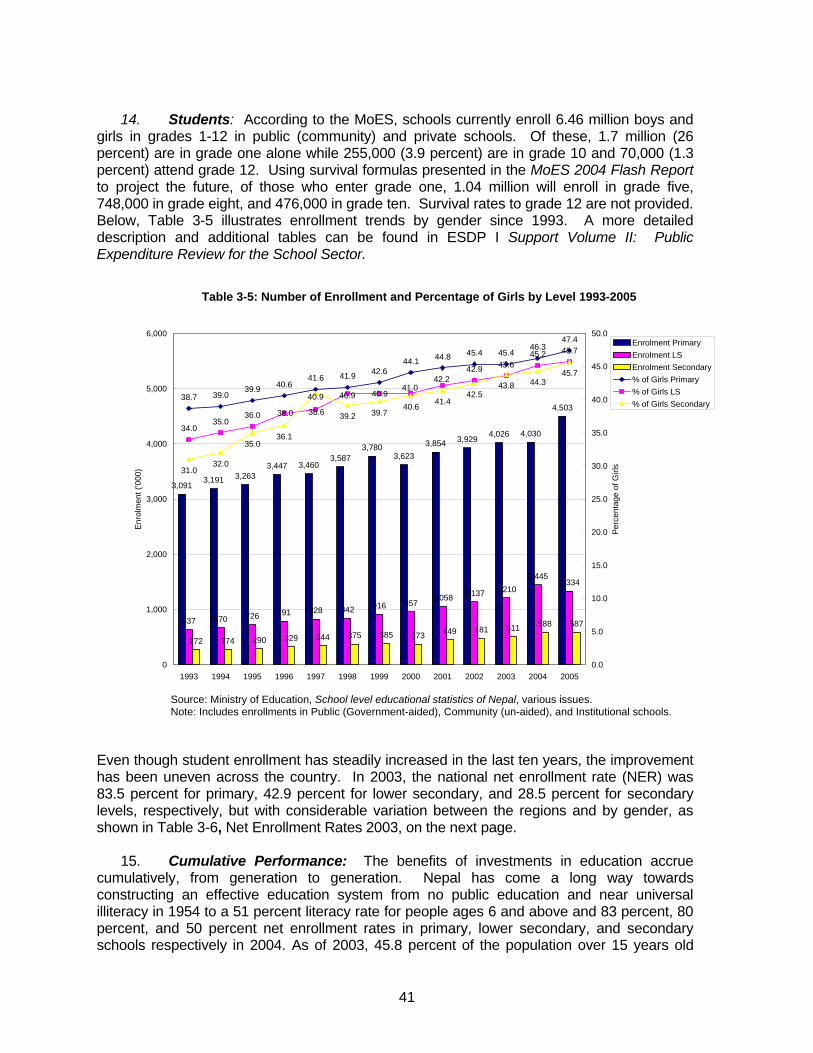
41
14. Students: According to the MoES, schools currently enroll 6.46 million boys and
girls in grades 1-12 in public (community) and private schools. Of these, 1.7 million (26 percent) are in grade one alone while 255,000 (3.9 percent) are in grade 10 and 70,000 (1.3 percent) attend grade 12. Using survival formulas presented in the MoES 2004 Flash Report to project the future, of those who enter grade one, 1.04 million will enroll in grade five, 748,000 in grade eight, and 476,000 in grade ten. Survival rates to grade 12 are not provided. Below, Table 3-5 illustrates enrollment trends by gender since 1993. A more detailed description and additional tables can be found in ESDP I Support Volume II: Public Expenditure Review for the School Sector.
Table 3-5: Number of Enrollment and Percentage of Girls by Level 1993-2005
3,0913,191 3,263
3,447 3,4603,587
3,7803,623
3,854 3,929 4,026 4,030
4,503
637 670 726 791 828 842 916 9571,058 1,137 1,210
1,4451,334
272 274 290 329 344 375 385 373 449 481 511 588 587
38.7 39.039.9 40.6
41.6 41.9 42.644.1 44.8 45.4 45.4
46.347.4
34.035.0
36.0
42.9 43.645.2 45.7
31.032.0
35.036.1
39.2 39.740.6 41.4
42.543.8 44.3
45.7
38.6
42.241.0
40.940.9
38.0
40.9
0
1,000
2,000
3,000
4,000
5,000
6,000
1993 1994 1995 1996 1997 1998 1999 2000 2001 2002 2003 2004 2005
Enro
lmen
t ('0
00)
0.0
5.0
10.0
15.0
20.0
25.0
30.0
35.0
40.0
45.0
50.0
Perc
enta
ge o
f Girl
s
Enrolment PrimaryEnrolment LSEnrolment Secondary% of Girls Primary% of Girls LS% of Girls Secondary
Source: Ministry of Education, School level educational statistics of Nepal, various issues. Note: Includes enrollments in Public (Government-aided), Community (un-aided), and Institutional schools.
Even though student enrollment has steadily increased in the last ten years, the improvement has been uneven across the country. In 2003, the national net enrollment rate (NER) was 83.5 percent for primary, 42.9 percent for lower secondary, and 28.5 percent for secondary levels, respectively, but with considerable variation between the regions and by gender, as shown in Table 3-6, Net Enrollment Rates 2003, on the next page.
15. Cumulative Performance: The benefits of investments in education accrue cumulatively, from generation to generation. Nepal has come a long way towards constructing an effective education system from no public education and near universal illiteracy in 1954 to a 51 percent literacy rate for people ages 6 and above and 83 percent, 80 percent, and 50 percent net enrollment rates in primary, lower secondary, and secondary schools respectively in 2004. As of 2003, 45.8 percent of the population over 15 years old

42
have attended school at some point, and the mean years of schooling for this group is 7.5 years. These statistics are worse for women, the poor, and rural populations, but the data incorporates historical disadvantages, and trends over the past 10 years show improving gender, regional, and poverty balances. A table illustrating comparative literacy rates can be found in Chapter III, paragraph 15.
Table 3-6: Net Enrollment Rates 2003 By Level, Region, and Gender
83.5
42.9
29.5
0.0
10.0
20.0
30.0
40.0
50.0
60.0
70.0
80.0
90.0
100.0
Mou
ntai
n
Tera
i
Mou
ntai
n
Mou
ntai
n
Tera
i
Hill
Tera
i
Tera
i
Hill
Hill
Mou
ntai
n
NE
PAL
Tera
i
Mou
ntai
n
Hill
Hill
Valle
y(MW) (C) (FW) (W) (W) (FW) (MW) (FW) (MW) (C) (C) (E) (E) (E) (W) (C)
Primary Boys
Primary Total
Primary Girls
Lower Secondary Boys
Lower Secondary Total
Lower Secondary Girls
Secondary Boys
Secondary Total
Secondary Girls
Source: DOE, School Level Educational Statistics of Nepal, 2003
16. Finance: In 2005/06, Education absorbed 16.7 percent (US$ 287.2 million) of the
national budget, a portion of the district block grant set aside for social services (a share of about US$ 85.6 million). According to the Nepal Living Standards Survey, education consumes an aggregated 2.8 percent of household expenditure. Using these figures, households spend an estimated US$ 32 each, or about US$ 110 million aggregated on education-related expenses. Table 3-7 shows the breakdown of household expenditures as reported in the Nepal Living Standards Survey, 2003/2004.
Table 3-7: Share of Education in Household Expenditures
Total Share (percentage) Education1
Rs. $2 Food Rent Non-food Education Rs. $2 Urban 183,709 2,483 39.1 18.5 36.8 5.6 10,288 139.0 Kathmandu Valley 278,699 3,766 28.8 24.2 39.7 7.4 20,624 278.7 Other 131,502 1,777 44.7 15.3 35.3 4.6 6,049 81.7 Rural 63,875 863 62.9 7.7 27.1 2.3 1,469 19.9 East Mts./Hills 63,645 860 66.2 8.6 22.9 2.3 1,464 19.8 West Mts./Hills 61,923 837 64.1 8.6 25.3 2.0 1,238 16.7 East Terai 60,003 811 62.4 5.1 30.5 2.1 1,260 17.0 West Terai 75,172 1,016 57.0 10.0 29.7 3.2 2,406 32.5 Consumption Quintile

43
Table 3-8: Number of Enrolment by Grade 1990-2005
-
200,000
400,000
600,000
800,000
1,000,000
1,200,000
1,400,000
1,600,000
1,800,000
G1 G2 G3 G4 G5 G6 G7 G8 G9 G10
20051999199620041997200119952003200020021992199019931991
Poorest 32,028 433 73.0 5.8 19.9 1.3 416 5.6 Second 44,679 604 66.9 6.8 24.5 1.8 804 10.9 Third 51,524 696 64.8 7.4 25.4 2.3 1,185 16.0 Fourth 73,005 987 58.1 9.4 29.3 3.2 2,336 31.6 Richest 181,064 2,447 40.1 15.5 39.6 4.8 8,691 117.4 Nepal 83,953 1,135 59.0 9.5 28.7 2.8 2,351 31.8
Source: NLSS 2003/04, Vol. 2, p. 28, Table 10.4 1 Calculated based on the amount of total consumption and share of education. 2 Exchange rate at $1 = Rs. 74. 17. Current financial transfers from the central government are inadequate to pay all
working teachers, cover basic operating expenses, and permit school improvement at the any level. Local governments can not levy taxes to support schools, and primary schools are forbidden to charge tuition fees. Fees charged by secondary schools are regulated, and children from families below the poverty line are exempt from tuition fees. Detailed discussions on household expenditures and school sources of revenue can be found in ESDP I Support Volume II: Public Expenditure Review for the Education Sector and ESDP I Support Volume IV: School Finance and Governance.
18. Achievement: In terms of achievement, the effectiveness of public education also needs improvement, with many students getting less than half of the answers correct on grade 3 and grade 5 achievement tests. The pass rate for students from public schools on the grade 10 school-leaving exam have ranged from 25 to 35 percent over the past decade; private school students do more than twice as well. Causes of low achievement at the primary level are generally attributed to lack of inputs: inadequately trained teachers, high levels of student and teacher absenteeism, long delays in the delivery of textbooks and learning materials, and delayed provision of inadequate funding to schools. School effectiveness, however, is also closely connected with input utilization. Use of resources—human and material—at the school level has a profound impact on school effectiveness (in terms of learning and the participation of disadvantaged groups) and efficiency (in terms of completion and promotion rates).
19. Efficiency: The public primary school system is relatively inefficient. Fifteen percent of students enrolled in grade 1 are under-aged, and 24 percent of the grade repeats the year. The survival rate to grade 5 is 79 percent. Less than half of the students who begin primary school enter lower secondary school, and even fewer enter higher secondary school. Gender, caste, and ethnic disparities in enrollments increase with the level of education, and poverty plays a key role. Only 5 percent of secondary students are from the lowest income quintile; at the university level, less than 1 percent are drawn from the poorest fifth of the population. Lower efficiency is linked to school effectiveness.

44
Figure 3-1 School GrantsSource: Disbursement of Block Grants Study, SERID 2005
School Grants
Earmarked Grants Block Grants• Teacher Salaries General• Free Textbooks • Administrative• Scholarships • School Improvement
• Educational Materials• Support to local schools run by the community
SIP Grants Performance Grants• SIP Implementation • Reward Grants based on• School performance indicators
20. Retention: Of those who enroll in grade ten, 328,400 will appear for their school-leaving examination and, of those regular students who appear, 151,000 will pass the examination and receive a 10th grade school-leaving certificate.54 Of the 1.36 children currently in grade one, only 11 percent may receive a 10th grade school-completion certificate and less than one-half of one percent a 12th grade completion diploma. Girls, poor children, and children from deprived groups are underrepresented among SLC and diploma holders. The actual survival figures may be better than the above projections indicate, as the actual enrollment figures for each class may be inflated as repeaters are often counted twice, according to the Technical Reviews of the Education For All Monitoring System (2004). Table 3-8 (above) from ESDPS Support Volume II: Public Expenditure Review for the Education Sector illustrates the sharp drop in enrollments between grades 1 and 2 and the relatively smooth decline thereafter.
Source: DOE, School-level educational statistics of Nepal, various issues.
School Finance 21. A 2005 study of community schools funded by the World Bank confirmed that the
major source of funding for the operation of community schools in Nepal is government grants55. Most of the grants (about 97%) come from the central government while a small amount (about 3%) come from local government. The grants may be earmarked for teachers’ salaries, free textbooks for primary level students, and scholarships. There are also block grants, which may be spent according to the decisions of the SMCs and based on the SIP. A major category of the block grant system is the SIP grant provided to schools for implementing school improvement plans. It is allocated per student, subject to variation by geographical region. There is also the Performance grant, a reward grant based on performance indicators, which encourages schools to raise their standards. There are also General block grants for administrative costs, such as the salaries and allowances of non-teaching staff. Figure 3-1 illustrates the various school grants available. ESDP I Support Volume IV: School Finance and Governance gives a more detailed description of the school financing model in Nepal.
54 There is more than one path to a SLC. In addition to the regular students, there are exempted students and compartmentalized exams. In 2002, there were 170,000 regular, 60,000 exempted, and 74,000 compartmentalized exam takers (total 305,082). Passes were 54,630, 3,801, and 38,500 respectively (total 96,930) yielding an overall pass rate of 31.7 percent. 55 World Bank. Baseline Survey of Selected Schools in Selected Districts, June 2005, unpublished paper.

45
22. Non-government sources include the school’s own resources which basically amount to the fees paid by parents to the school. These can include school fees, admission fees, examination fees, and sports fees. The Education Act Seventh Amendment states that no fees should be charged until after the primary level. At the lower secondary and secondary levels, free education is also mandatory for girls, Dalit children, and children from families living below the poverty line. All other students pay fees.
23. Some schools receive rental income from school property while others conduct
fund-raising activities to supplement the grants received. One such fund-raising activity is a religious ceremony where a religious leader is invited to preside over a religious event; the participants donate money for attending it. The other sources are community contributions and miscellaneous sources. Table 3-9 below shows the percentage of revenue from the different sources by level of education: primary level receives 88 percent of its revenue from central and local government grants, lower secondary level, 72 percent, secondary level, 65 percent, and higher secondary level, 57 percent.
Table 3-9
Primary Lower S. Second. Higher S. TotalRevenues % % % % %
1. Total government grant 86.6 71.4 60.3 55.9 76.22. Local government grant 1.7 0.8 4.6 1.9 2.13. School's own resoureces 2.3 9.7 23.8 7.6 7.64. Community contribution-cash 1.0 1.9 3.1 0.0 1.45. Miscellaneous 8.4 16.2 8.2 34.6 12.8Total Revenues 100.0 100.0 100.0 100.0 100.0
Source: Baseline Survey of Selected Community Schools in Selected Districts, June 2005
Average Revenues of Selected Schools in 2004/05 (%)
The findings in the Technical Review of School Education were close to the above findings and showed that 84 percent of school funding sources came from the central government through the District Education Office in the fiscal year 2004/05 compared to 86 percent in two trimesters in the fiscal year 2005/06.56 Table 3-10 shows the school sources of funds from the TRSE reports.
Table 3-10 Average Revenue of Selected Schools in TRSE Report
Source FY 2004/05 FY 2005/06*DEO Salaries 65 73 Textbook 2 2 Construction 3 2 Scholarship 2 3 Block Grants 9 5 Others 3 1
Sub-total 84 86Others Student Fee 7 5 DDC/VDC 2 2 NGO 2 3 Own Sources 3 2 Others 2 2
Sub-total 16 14Total (A+B) 100 100Sources: TRSE Reports * Two trimesters only
Sources of Funds in %
56 The figure is close to the percentage to primary level 86.6% in Table 4-4 because 71 percent of the 1000 sample schools were primary level.

46
Policy Trends and Issues 24. This section provides an overview of the policy context. An analysis of the policy-
making structures and processes can be found in ESDP I Support Volume I: Preparation and Transition to a 1-12 School System. Excerpts from that volume also appear in Chapter VI of this Main Report.
25. Trends: Education commissions, formed at different times since 1954, have all emphasized the need to provide basic and primary education for all citizens. Since 1954, the policy focus has remained virtually the same: universalized access to quality basic and primary education, vocational and work-oriented secondary education, and academically competent and development-oriented tertiary education. After 1990, Nepal has placed more programming emphasis on the needs of girls and disadvantaged communities. As mentioned above, Nepal has experimented with community-owned and -managed schools (1950-1970), state-managed schools (1970-2001), and privatized schools (1990-present); in 2001, the Government of Nepal decided to return schools to community management in a gradual and voluntary basis with the hopes of improving school quality and sharing their cost.
26. Since 2000, some important international thrusts were added to the program, namely Nepal’s commitment to the global campaign for Education for All. The current plan, the Tenth Plan, argues that to reduce poverty levels, education must be widespread and effective—widespread because the social benefits from education accelerate after a certain threshold is reached, and effective because the benefits of education are not currently accruing equitably to poorer households.
27. More-of-the-Same Model: For the past 50 years, Nepal has anchored education policy on the principle that expanding human capital (skills, knowledge, and capacities of individuals) is the key to economic progress and raising living standards. Because schooling plays such an integral role in the expansion of human capital, each development plan has set explicit expansion targets: higher enrollments, greater budget share, higher teacher qualifications, more teacher training, etc. This “more of the same” model was successful in expanding the supply of schools as indicated by the growth in enrollment rates57. However, along with her successes, Nepal has learned there is a significant gap between student attendance and an increase in human capital. While Nepal has achieved significant growth in access and demand for education, many public schools (primary through higher secondary) are not effective and, as a consequence, there is increasing skepticism about the standard of education offered in public schools.
28. Fundamental Reform Model: After 2000, some of Nepal’s education policies shifted towards “fundamental reforms” such as decentralization, community involvement, etc. These fundamental reforms seek to change the relationships of authority and accountability among stakeholders. However, upon implementation, some of these policies have met resistance from various groups within and outside the education bureaucracy. The fundamental reforms have often failed because the transition program did not accurately address the financial, social, and political backing required for the proposed reform to gain real traction at the school and bureaucratic levels.
57 NER in 2005/2006 reported as: primary 85 percent, lower secondary 45 percent, and secondary 32 percent (MOES 2006).

47
29. Policy Goals: The current national education policy in Nepal is guided by the
overarching national goal of poverty reduction as reflected in the Tenth Plan (2002–07). Within the broad spectrum of education for poverty alleviation, the national education goal is to develop an effective and equitable public education system for grades 1-12. The major strategy adopted by the Tenth Plan is the decentralization of school governance by handing over school management responsibility to School Management Committee (SMC) and, accordingly, to change the role of district- and central-level agencies from that of controller to facilitator. Core Documents for the primary and secondary sub-sectors interpret macro-policies and specify goals, operational policies, strategies, and programs at the sub-sector level. Quality improvement projects for teacher training, curriculum improvement, and examination reform also produce agreements specifying service level policies, strategies, goals, targets, and action plans.
30. Despite policies, programs, and projects based on local and international good practices, many of the ambitious targets set in macro, sub-sector, and project documents are unlikely to be met, according to the Nepal Business Plan for the Education Sector (NPC 2005). On-going challenges at the system level include both inefficiencies that drain resources and the absence of a holistic approach to the entire school education sector. At the school level, policies aimed at improving efficiency are often un-enforced, and coordination of quality improvement programs remains weak. Although part of the achievement gap is attributable to financing gaps, the key challenges to education development in Nepal involve resolving fundamental policy issues and implementation inefficiencies.
31. Issues: Three broad categories of policy issues need to be addressed pertaining to: (i) a focus on effective schools, (ii) a focus on accountability, and (iii) an integrated policy framework.
• Effective Schools: Quality improvement has been a concern in Nepal for the past 20 years; during the 1980s and 1990s, several large-scale projects were launched to improve the inputs to and performance of public schools. These efforts, though somewhat successful in meeting their targets, have proven to be less successful in ultimately creating an effective school system; in 2005, many schools remained unable to provide minimally acceptable service. This said, minimum conditions for learning and minimum expected learning outcomes need to be defined in terms that are practical and realistic for Nepal’s diverse schools.
• Accountability: The defined obligations of government, teachers, schools, and communities are not enforced, and there are no consequences for failure to perform to expected minimum standards. This lack of accountability undermines efforts to improve school quality.
• Sector-wide Policy Framework: The Tenth Plan articulates a human resources
development plan that includes an integrated 1-12 school system with multiple exit points. At this juncture, however, MOES does not have a policy framework that addresses the 1-12 school sector as an integrated whole. As a result, differences of interpretation at the sub-sector programming level combine with ambiguity in the macro level to send confusing messages to stakeholders. This hampers implementation and prevents the efficient use of resources. Examples of policy areas that warrant additional consolidation include teacher management, minimum
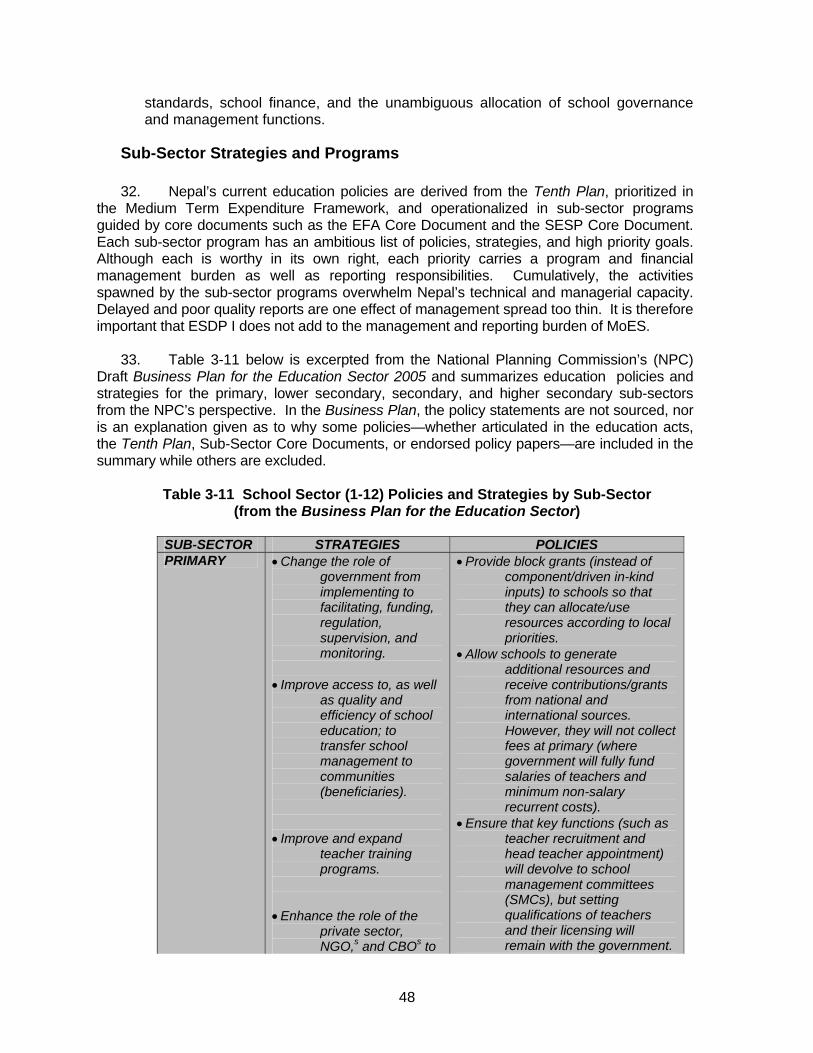
48
standards, school finance, and the unambiguous allocation of school governance and management functions.
Sub-Sector Strategies and Programs 32. Nepal’s current education policies are derived from the Tenth Plan, prioritized in
the Medium Term Expenditure Framework, and operationalized in sub-sector programs guided by core documents such as the EFA Core Document and the SESP Core Document. Each sub-sector program has an ambitious list of policies, strategies, and high priority goals. Although each is worthy in its own right, each priority carries a program and financial management burden as well as reporting responsibilities. Cumulatively, the activities spawned by the sub-sector programs overwhelm Nepal’s technical and managerial capacity. Delayed and poor quality reports are one effect of management spread too thin. It is therefore important that ESDP I does not add to the management and reporting burden of MoES.
33. Table 3-11 below is excerpted from the National Planning Commission’s (NPC) Draft Business Plan for the Education Sector 2005 and summarizes education policies and strategies for the primary, lower secondary, secondary, and higher secondary sub-sectors from the NPC’s perspective. In the Business Plan, the policy statements are not sourced, nor is an explanation given as to why some policies—whether articulated in the education acts, the Tenth Plan, Sub-Sector Core Documents, or endorsed policy papers—are included in the summary while others are excluded.
Table 3-11 School Sector (1-12) Policies and Strategies by Sub-Sector (from the Business Plan for the Education Sector)
SUB-SECTOR STRATEGIES POLICIES PRIMARY • Change the role of
government from implementing to facilitating, funding, regulation, supervision, and monitoring.
• Improve access to, as well
as quality and efficiency of school education; to transfer school management to communities (beneficiaries).
• Improve and expand
teacher training programs.
• Enhance the role of the
private sector, NGO,s and CBOs to
• Provide block grants (instead of component/driven in-kind inputs) to schools so that they can allocate/use resources according to local priorities.
• Allow schools to generate additional resources and receive contributions/grants from national and international sources. However, they will not collect fees at primary (where government will fully fund salaries of teachers and minimum non-salary recurrent costs).
• Ensure that key functions (such as teacher recruitment and head teacher appointment) will devolve to school management committees (SMCs), but setting qualifications of teachers and their licensing will remain with the government.

49
SUB-SECTOR STRATEGIES POLICIES help improve delivery of school education.
• Strengthen the school management, monitoring, and supervision system.
• At primary level, raise qualifications of teachers to higher secondary education certificate level and provide all teachers with prescribed training.
• Stop supplying Government teachers to permitted (proposed) community schools; instead, provide block grants to cover recurrent costs.
• Expand physical infrastructure and financial incentives to encourage school attendance (see above).
• Increase equitable access and financial assistance to poor students.
• Provide block grants to schools, (instead of scholarships to individual students) based on the number of students eligible for financial assistance.
• Encourage public private partnership to reduce the gap between public and private provision.
• Improve regulation and accountability of institutional schools, and frame a separate set of regulations for such schools.
• Tie the funding to schools and districts to expected outputs/outcomes.
• Require that the government assist institutional schools to improve access of qualified students from poor households.
LOWER- SECONDARY
• Transfer schools to community management.
• Provide grants for salary costs, facility upgrading, and recurrent costs.
• Improve and expand teachers training.
• Increase access for girls/Dalits/disadvanta
• (See above, under primary education policies.)

50
SUB-SECTOR STRATEGIES POLICIES ed children;
SECONDARY • Transfer schools community management.
• Provide grants for salary costs, facility upgrading, and recurrent costs.
• Improve and expand teachers training.
• Increase access for girls/Dalits/disadvantaged children.
• Allow vocational schools to be attached to existing secondary schools.
• Increasingly focus on providing skills for livelihood improvement.
• Establish a system for accreditation of schools.
.
HIGHER SECONDARY
• Phase out HSE from universities, and integrate them with schools.
• Improve access for students from low income, rural households by:
o Expanding enrollment capacity of public HSEs with a good track record of performance and accountability, and
o Upgrading public, secondary schools with a good track record to HSEs.
• Create a new Secondary Education Board by merging the existing School Level Certificate Examination Board with the Higher Secondary Education Board (HSEB). Other HSEB functions (curriculum development, supervision, and school approval) will be transferred to the Curriculum Development Center (CDC) and DOE.
• Provide block grants for quality improvement and enrollment expansion.
General Sectorwide Approach
• Adopt sectorwide approach to help improve coordination between various levels of schools, and to harness synergies of initiatives undertaken at various levels for ensuring all-round development of the sector.
• Base new government programs on the needs of the whole school sector. Accordingly, pooled funding or budget support for the school sector will be preferred to individual donor programs; component-driven programs and those focused on specific levels of schools will be discouraged. Only government framework and procedures will be used for implementing donor-supported programs.
Source: Nepal Business Plan for the Education Sector, 2005.

51
34. In line with the policy goal to develop grades 1-8 as basic education and grades 9-12 as secondary level education after 2009, the Government currently has three sub-sector development programs.
• Education for All (EFA) - Primary: Nepal has made significant strides in moving
towards a sectorwide approach (SWAp) to education development rather than a projectized and sub-sector approach. Based upon decades of experience with education projects which had been implemented under a basket-funding modality, Nepal is now working with several development partners in a sub-sectorwide approach for EFA. This sub-sectorwide approach is financed through budgetary support under a joint financing arrangement with five donors wherein disbursements are made on the basis of agreed outcome and achievement indicators. The overall program design is presented in EFA Core Document (MoES 2003). According to this program plan, most of the investment goes to schools in the shape of formula-based grants (block, earmarked, and incentive). Programming emphasis is placed particularly on the developing schools by setting minimum standards for inputs (for both human and physical resources) and outcomes such as academic achievement and cycle completion rates. These standards were to provide the basis for school accreditation and performance grants. School development is managed by school improvement plans (SIP) that establish performance and management indicators as well as access and quality targets. Schools manage their own resources, including teachers, under the governance of an elected School Management Committee. EFA is described in detail in Chapter VI – ESDP I Program Description.
• Secondary Education Support Program (SESP) - Lower Secondary and
Secondary: Although the provision of public secondary education has expanded over the past decades, quality continues to remain low in public schools. Given the likely increased demand for schooling resulting from recent gains in primary school enrollment and completion rates, it was clear that secondary education in Nepal needed improvement. To address such need, the Government initiated the Secondary Education Support Program (SESP) with assistance from the Asian Development Bank and Denmark. SESP has three intermediate objectives: i) to improve the quality and relevance of public secondary schooling, ii) to improve access to public secondary schooling especially for girls, students with disabilities, and students from poor and disadvantaged groups and districts, and iii) to develop the institutional capacity and management of central and district educational institutions and public secondary schools based upon a decentralized system of planning and management.
• Higher Secondary: In order to: i) develop the school system as a complete and
integrated system, ii) expand the educational opportunities to larger groups of children, and iii) de-congest higher education institutes, the government has adopted the policy of considering the higher secondary level (grades 11-12) as a part of the school system. As such, the program will gradually phase out the proficiency certificate level (grades 11-12) from the university system and merge it with the school system. This is one component of the World Bank’s Higher Education Program.
As is to be expected with such ambitious programs in each sub-sector, several issues pertaining to the policies, strategies, and investments warrant attention.

52
Cross-Cutting Issues 35. Decentralization: One policy shift across all sub-sectors is towards
decentralization. Nepal’s decentralization policies—the community management of schools, block and earmarked grants for school financing, school recruitment and the hiring of teachers—will make it one of the most decentralized school systems in the world, once the policies are operational. However, there are several unresolved issues around school governance and management functions under decentralization. Among these are: (a) assigning functions (e.g. teacher management) to both schools and districts, (b) unclear, ambiguous, or misallocated functions (e.g. who is responsible for monitoring implementation, schools, NGOs, communities, or supervisors?), (c) assigning responsibility but not authority or resources (e.g. making SMCs responsible for school improvement planning but not providing them the resources to implement the plans), and (d) the absence of consequences for not fulfilling functions (e.g. teachers who do not attend school regularly are not disciplined).
36. Equity and Inclusion: Despite mandates to include women in political parties and in local bodies, women continue to be poorly represented in the government and civil service at all levels, including the education sector. Moreover, women’s low self-esteem inhibits their participation, while their low social status leaves them vulnerable to abuse within their households and communities. Given that the causes of poverty and low status of rural women are multiple and interrelated, a holistic approach is needed to improve women’s well-being. A cross-sectoral approach has the potential to fully address the multiple constraints and deprivations of poor, rural women in Nepal. The education sector plays a vital role in raising the status of all women through not only increasing the enrollment and the academic attainment of girls, but also by promoting girls as boys’ equals, thus challenging traditional gender-biased norms and values. Likewise, the education sector can play a key role in raising the low status and economic position of marginalized Janajati and Dalit men and women. The government recognizes the need for increased equity in educational opportunities to achieve its development goals. The EFA program directly addresses the social and economic exclusion of girls and Dalit children through the provision of school scholarships and other incentive measures.
37. Structural Integration: The Tenth Plan envisions the link between the school
system and its human resource development program. Accordingly, the Government has adopted the policy of merging the higher secondary level (grades 11-12) into an integrated school system. This 1-12 policy horizon entails the challenging task of phasing out the proficiency certificate level from the university system while integrating it with the school system; it also requires that autonomous agencies merge their functions into the general management structure. However, the responsibility for planning a rational expansion of a 1-12 system is not clear. Currently, as a general practice, schools grow one grade at a time as local resources permit, only requesting assistance from the Government ex post facto. Transforming the current sub-sectors into an integrated 1-12 school system also requires integration of school support services such as teacher training, monitoring and supervision, financing, management support, and other quality improvement efforts both vertically (between levels of government and the community) and horizontally (between various inputs at the school level).
Conclusion

53
38. Education is not only a technical and administrative process, but a political and social one. Therefore, changes in the broad socio-cultural, economic, or public administration contexts impact deeply on policy, program, and implementation. With the dramatic change in the political landscape following the successful “people’s movement” of April 2006, issues are now voiced that challenge the current model of education provision. If “business as usual” continues, these issues will only be addressed on an ad hoc and piecemeal basis, thereby missing a once-in-a-generation opportunity for education reform. In terms of development trends, education development in Nepal lies on a continuum from projectized and fragmented approaches to harmonized and jointly funded approaches. The policy direction clearly is towards budgetary support for sectorwide programs managed by the government. EDSP I’s Component A will support a sub-sectorwide approach to providing improved, basic and primary education to all children by bridging funding gaps in its on-going Education for All program. The following chapter will estimate the funding gap and appraise the fit between this program and ADB’s modalities and requirements.

54
IV. EDUCATION BUDGET AND FUNDING GAPS
Introduction 1. The previous chapters emphasized education’s role in human and economic
development. It is noteworthy that, in Nepal, the Government recognizes that education is not only an important tool for economic and social development, but is also a fundamental human right. The Government seems strongly committed to providing education opportunities for the whole population, particularly primary education for young children. The 8th Amendment to the Education Act of 2002 clearly states that public primary education is to be provided free, while lower secondary and secondary education are to be provided on a cost-sharing basis between the Government and beneficiaries. Given the economic context and limited Government resources described in Chapter II, how can Nepal manage its finances to improve the social conditions described in Chapter III by adopting the education programs described in Chapter IV? This chapter examines current government education financing policies and practice while reviewing how the Government and parents have shared the cost of education. The first section reviews the overall education budget and financing policies—including government and non-government funds—and analyzes the demand for education. The second section estimates the funding gap for each school education sub-sector (i.e., primary, secondary, higher secondary, and technical education and vocational training) by comparing the available and required funds needed to implement already planned and newly proposed programs and activities.
Budget Trends
2. Budget Trends: An analysis of the overall education budgets over the past fifteen years (Table 4-1) shows that allocations to the education sector, particularly to primary education, have increased significantly in terms of the percentage of GDP as well as total government budget. The education budget was only 1.4 percent of GDP and 9.6 percent of the total budget in FY1989/90, but it increased to 2.5 percent and 13.0 percent in FY1994/95, 2.5 percent and 14.0 percent in FY1999/00, 3.1 percent and 16.4 percent in FY2001/02, and 3.9 percent and 16.7 percent in FY2005/06, respectively. The percentage of government expenditure allocated to education in Nepal is relatively high in comparison with other developing countries: it is higher than India (by 3 percent) and Indonesia (6 percent), Sri Lanka (10 percent), Bangladesh (11 percent), or the average for all developing countries (11 percent); however, it is lower than the Philippines (by 19 percent), Thailand (22 percent), and Malaysia (23 percent).58
3. During this same fifteen-year period, the Government demonstrated its commitment to providing primary education for all by making budget allocations to primary education a growing priority. However, while it is critical to continue increasing the budget for primary education to both reach marginalized children and to improve the quality of public school education, the Government is aware it must balance the distribution of limited resources, particularly between the primary and secondary education sub-sectors, as more and more children complete the primary education cycle and wish to move on to secondary school.
58 UNICEF, 2003, The state of the world’s children 2004, UNICEF, New York. It should be noted, however, that these figures are not necessarily comparable to each other—as they tend to include only the central government budget; state/provincial budgets are not included in some countries’ figures, for instance, India. The data refer to the most recent year available between 1992 and 2001 for each country.
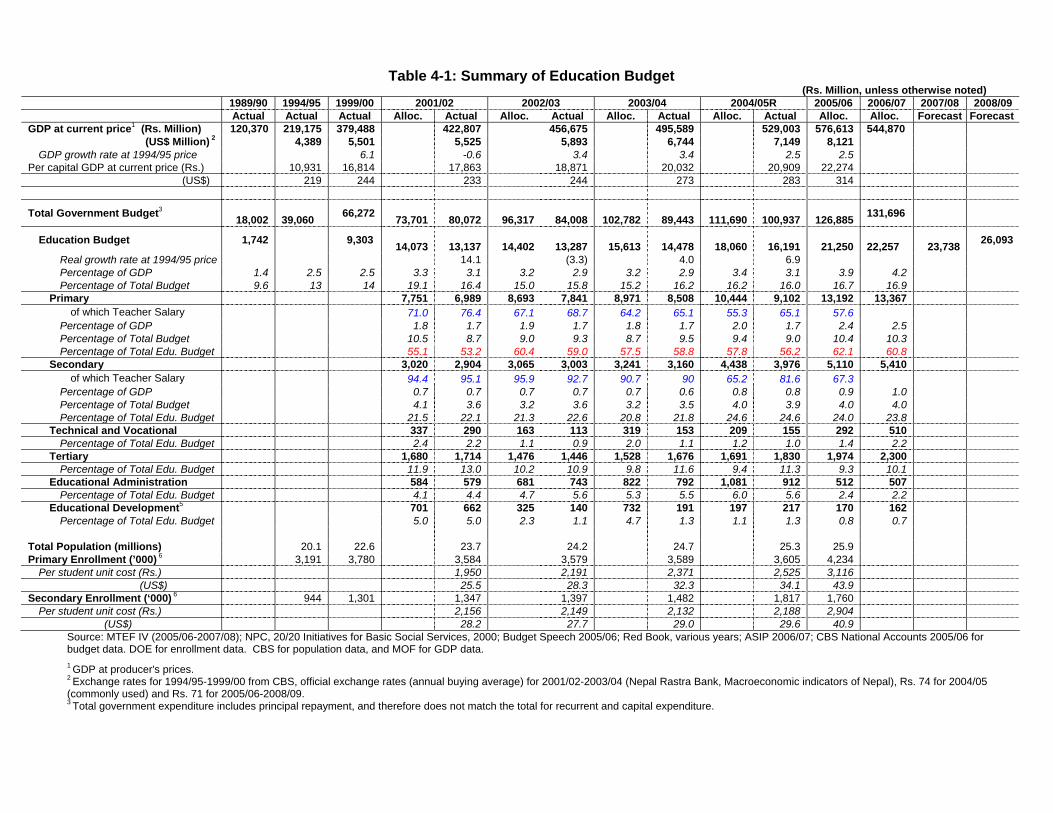
Table 4-1: Summary of Education Budget
(Rs. Million, unless otherwise noted) 1989/90 1994/95 1999/00 2001/02 2002/03 2003/04 2004/05R 2005/06 2006/07 2007/08 2008/09 Actual Actual Actual Alloc. Actual Alloc. Actual Alloc. Actual Alloc. Actual Alloc. Alloc. Forecast Forecast GDP at current price1 (Rs. Million) 120,370 219,175 379,488 422,807 456,675 495,589 529,003 576,613 544,870
(US$ Million) 2 4,389 5,501 5,525 5,893 6,744 7,149 8,121 GDP growth rate at 1994/95 price 6.1 -0.6 3.4 3.4 2.5 2.5
Per capital GDP at current price (Rs.) 10,931 16,814 17,863 18,871 20,032 20,909 22,274 (US$) 219 244 233 244 273 283 314
Total Government Budget3 18,002
39,060 66,272 73,701 80,072 96,317 84,008 102,782 89,443 111,690 100,937 126,885 131,696
Education Budget 1,742 9,303 14,073 13,137 14,402 13,287 15,613 14,478 18,060 16,191 21,250 22,257 23,738 26,093
Real growth rate at 1994/95 price 14.1 (3.3) 4.0 6.9 Percentage of GDP 1.4 2.5 2.5 3.3 3.1 3.2 2.9 3.2 2.9 3.4 3.1 3.9 4.2 Percentage of Total Budget 9.6 13 14 19.1 16.4 15.0 15.8 15.2 16.2 16.2 16.0 16.7 16.9
Primary 7,751 6,989 8,693 7,841 8,971 8,508 10,444 9,102 13,192 13,367 of which Teacher Salary 71.0 76.4 67.1 68.7 64.2 65.1 55.3 65.1 57.6
Percentage of GDP 1.8 1.7 1.9 1.7 1.8 1.7 2.0 1.7 2.4 2.5 Percentage of Total Budget 10.5 8.7 9.0 9.3 8.7 9.5 9.4 9.0 10.4 10.3 Percentage of Total Edu. Budget 55.1 53.2 60.4 59.0 57.5 58.8 57.8 56.2 62.1 60.8
Secondary 3,020 2,904 3,065 3,003 3,241 3,160 4,438 3,976 5,110 5,410 of which Teacher Salary 94.4 95.1 95.9 92.7 90.7 90 65.2 81.6 67.3
Percentage of GDP 0.7 0.7 0.7 0.7 0.7 0.6 0.8 0.8 0.9 1.0 Percentage of Total Budget 4.1 3.6 3.2 3.6 3.2 3.5 4.0 3.9 4.0 4.0 Percentage of Total Edu. Budget 21.5 22.1 21.3 22.6 20.8 21.8 24.6 24.6 24.0 23.8
Technical and Vocational 337 290 163 113 319 153 209 155 292 510 Percentage of Total Edu. Budget 2.4 2.2 1.1 0.9 2.0 1.1 1.2 1.0 1.4 2.2
Tertiary 1,680 1,714 1,476 1,446 1,528 1,676 1,691 1,830 1,974 2,300 Percentage of Total Edu. Budget 11.9 13.0 10.2 10.9 9.8 11.6 9.4 11.3 9.3 10.1
Educational Administration 584 579 681 743 822 792 1,081 912 512 507 Percentage of Total Edu. Budget 4.1 4.4 4.7 5.6 5.3 5.5 6.0 5.6 2.4 2.2
Educational Development5 701 662 325 140 732 191 197 217 170 162 Percentage of Total Edu. Budget 5.0 5.0 2.3 1.1 4.7 1.3 1.1 1.3 0.8 0.7
Total Population (millions) 20.1 22.6 23.7 24.2 24.7 25.3 25.9 Primary Enrollment (’000) 6 3,191 3,780 3,584 3,579 3,589 3,605 4,234
Per student unit cost (Rs.) 1,950 2,191 2,371 2,525 3,116 (US$) 25.5 28.3 32.3 34.1 43.9
Secondary Enrollment (‘000) 6 944 1,301 1,347 1,397 1,482 1,817 1,760 Per student unit cost (Rs.) 2,156 2,149 2,132 2,188 2,904
(US$) 28.2 27.7 29.0 29.6 40.9 Source: MTEF IV (2005/06-2007/08); NPC, 20/20 Initiatives for Basic Social Services, 2000; Budget Speech 2005/06; Red Book, various years; ASIP 2006/07; CBS National Accounts 2005/06 for budget data. DOE for enrollment data. CBS for population data, and MOF for GDP data.
1 GDP at producer's prices. 2 Exchange rates for 1994/95-1999/00 from CBS, official exchange rates (annual buying average) for 2001/02-2003/04 (Nepal Rastra Bank, Macroeconomic indicators of Nepal), Rs. 74 for 2004/05 (commonly used) and Rs. 71 for 2005/06-2008/09. 3 Total government expenditure includes principal repayment, and therefore does not match the total for recurrent and capital expenditure.

4. The gradual increase in the education budget in the 1990s was largely due to
foreign assistance, such as the Basic and Primary Education Projects I and II (1992/93-2003/04), Primary Education Development Project (1994-2000), and Secondary Education Development Project (1992-2000). The proportion of external assistance in total education expenditure increased from 7 percent in FY1992/93 to 25 percent in FY1995/96.59
5. In the past few years, there has been a substantial increase in the education
budget for two reasons. First, the Government has substantially increased its contribution by 31.7 percent from Rs. 6,264 million ($84.6 million) in FY2004/05 to Rs. 7,911 million ($111.4 million) in FY2005/06, primarily to respond to the 20 percent raise in teacher salaries in FY2004/05. Second, donors have increased their contribution to primary education through the EFA program—40 percent of the total primary education budget in FY2004/05 and 35.8 percent in FY2005/06—and to secondary education through the Secondary Education Support Program (SESP)—26.3 percent of the total secondary education budget in FY2004/05 and 23.3 percent in FY2005/06. While the government contributed around 80 percent of the total education budget between FY2001/02 and FY2003/04, the contribution fluctuated between 69.9 percent in FY2004/05 and 72.8 percent in FY2005/06.
6. As mentioned in Chapter IV’s section on school finance, while the central
Government is the primary source of education funding in Nepal, schools receive funds from various other sources as well. For instance, based on a survey of 1,000 sample schools60 in 20 districts, the Technical Review of School Education (TRSE)61 found that in FY2004/05, schools received about 18 percent of their school budget from non-central government sources such as DDC/Municipality/VDC (3.6 percent), school fees (7.3 percent), INGO/NGOs (2.6 percent), and its own resources (4.5 percent). In contrast, a public expenditure tracking survey for FY1999/00-2001/02 (PETS Survey)62 found that 65 sample schools received between 63.7 and 72.3 percent of their total budget from the Government, the rest of the budget coming from other sources including school fees (12.3 to 15.9 percent), their own resources (5.5 to 11.0 percent), grants from sources such as Members of Parliament, NGOs, and Local User Committees (0.8 to 2.3 percent), and other miscellaneous sources (6.5 to 8.0 percent). Although the proportion of government and non-government funds differed between these two studies, it is clear that schools receive their incomes from various sources besides the central government.
7. Despite its strong commitment to educational development, the Government
alone has not been able to provide sufficient resources to cope with the rapid growth of the primary and secondary sub-sectors. Given this situation, increasing dependence on donor support for the 5-10 year, medium term may be inevitable, particularly under the current, slow economic growth rate. The next section describes funding gaps at each level of schooling.
Funding Gaps
59 Cambridge Education Consultants in association with METCON of Kathmandu, 2001, Secondary education development plan, Second Secondary Education Sector Project Preparation Technical Assistance (SSESP PPTA), Asian Development Bank TA-3526-NEP. 60 Of the 1,000 schools, 70 percent are primary, 14 percent lower secondary, and 15 percent secondary schools. 61 Technical Review of School Education, December 2005, Technical Review of School Education in Nepal – 2005: A Report. 62 Office of the Financial Comptroller General, 2003, Report of Expenditure Tracking Survey of Primary, Lower Secondary and Secondary Schools, Ministry of Finance, Kathmandu. It tracked the grant aid budget for primary education (budget head 6-3-140), lower secondary and secondary education (6-3-150), and student scholarships (65-3-190) for FY1999/00-01/02.

57
8. Primary education (EFA): The five-year EFA program supported by pooling and non-pooling donors commenced in FY2004/05. The pooling donors are Denmark, Finland, Norway, the DfID, and the World Bank; the non-pooling donors include the ADB, JICA, UNFPA, UNICEF, WB, and WFP. The total cost of the five-year program was originally estimated to be $814.5 million, but at the time of planning, only $789.5 million was committed from the Government and donors, leaving a baseline funding gap of $25 million. In March/April 2006, the DOE re-estimated the gap to be $55.4 million in total for the next three years (FY2006/07-08/09) without changing the originally agreed EFA activities and targets. The gap increased primarily due to general inflation, rapid increases in enrollment, and a 20 percent salary rise for teachers in FY2004/05.
9. To understand how the funding gap widened, it is important to understand the implications of an informal agreement on the pro-rata share for the pooling funds between the Government and pooling donors; presently, this share has been set at 75.56 percent (Government) to 24.44 percent (donors) based on the first-year budgetary allocations. The significant increase in the overall government contribution—primarily due to the 20 percent increase in teachers’ salaries and the rapid increase in enrollment—led the Government to expect a proportionate increase in donor contribution from the original $30.0 million to $38.8 million in FY2005/06. Similarly, the Government has asked donors to allocate $40 million at the 75.56:24.44 pro-rata share for FY2006/07.63 Hence, the donor contribution has been and will be spent at a much faster rate than originally planned, leaving almost no donor funds for the last year of the program.64
10. In addition to the original—or baseline—gap, an additional $132.2 million will be required if the Government is willing and able to implement the additional activities required to achieve other goals outside the EFA agreement such as the Tenth Plan, Business Plan, and MDGs, among others. For instance, during the preparation of the EFA program, the DOE estimated a need of 6,000 refurbished and 19,934 newly constructed classrooms to enroll 3,423 thousand students at that time. As the number enrolled in public primary school rapidly increased to 4,234 thousand in 2005, an increase of 24 percent, demand for new classrooms has also gone up to 40,216, which would ultimately cost Rs. 14,075 million ($198 million). However, while it is critical for the Government to provide the immediately needed minimum infrastructure for the increasing number of students, because the total enrollment in primary schools is likely to gradually diminish after 2009/10 (as the over-crowded students in the grade 1 cohort in 2005/06 leave the primary cycle), the number of required classrooms should not be calculated based solely on the current enrollment level. Long-term enrollment estimates are needed at district and village levels to refine the calculation of classroom requirements.
11. Finally, it must be noted that while the Government has increased its contribution to the pooling fund, this contribution is considerably reduced compared to that of the non-pooling fund. This is primarily because many activities—such as free textbooks, scholarship programs, and women’s education— which were originally non-pooling, Government-financed activities were moved to pooling activities. The proportion of government contribution to development activities was thereby decreased, which raises a concern regarding the sustainability of the overall education budget.
63 The pooling donors formally agreed to provide the Government with a maximum of $40 million for FY2006/07 during the Joint Review Mission held in the mid-June. 64 Some of the pooling donors are unable to reschedule their share early but need to disburse it according to their 5-year schedule, while others are able to disburse their share at a faster rate. What is critical here is that there will be only $41.3 million left for the last two years of the EFA program.
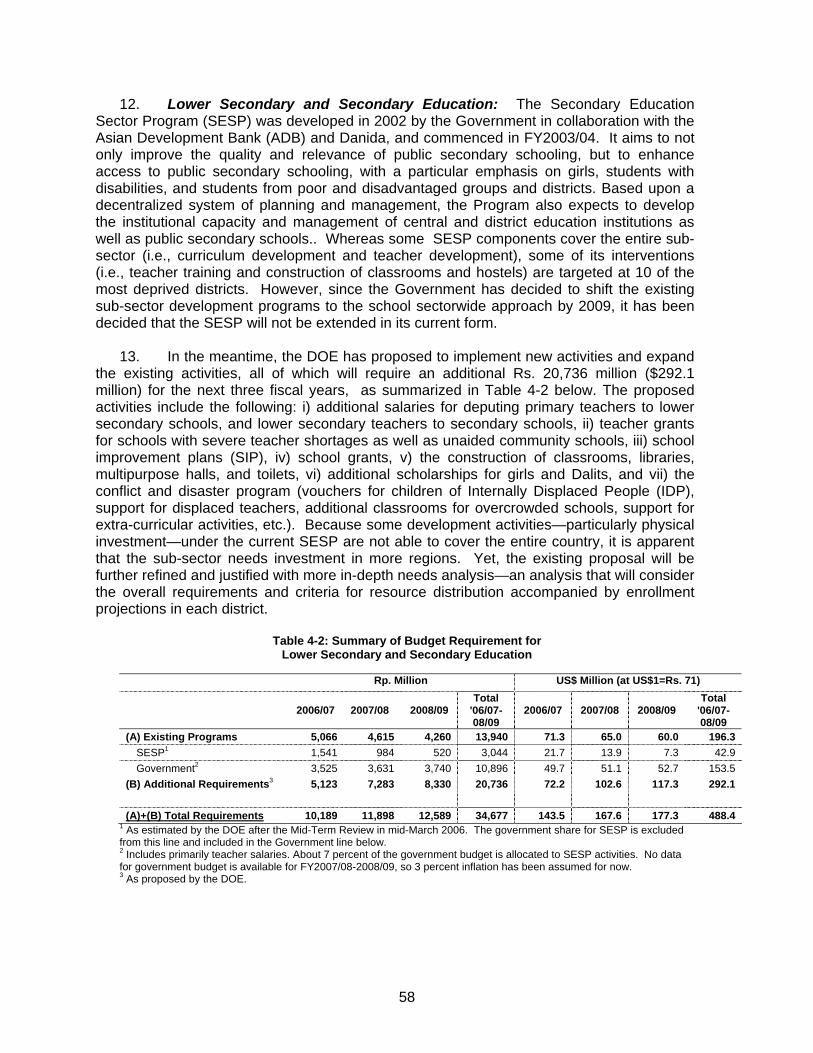
58
12. Lower Secondary and Secondary Education: The Secondary Education Sector Program (SESP) was developed in 2002 by the Government in collaboration with the Asian Development Bank (ADB) and Danida, and commenced in FY2003/04. It aims to not only improve the quality and relevance of public secondary schooling, but to enhance access to public secondary schooling, with a particular emphasis on girls, students with disabilities, and students from poor and disadvantaged groups and districts. Based upon a decentralized system of planning and management, the Program also expects to develop the institutional capacity and management of central and district education institutions as well as public secondary schools.. Whereas some SESP components cover the entire sub-sector (i.e., curriculum development and teacher development), some of its interventions (i.e., teacher training and construction of classrooms and hostels) are targeted at 10 of the most deprived districts. However, since the Government has decided to shift the existing sub-sector development programs to the school sectorwide approach by 2009, it has been decided that the SESP will not be extended in its current form.
13. In the meantime, the DOE has proposed to implement new activities and expand the existing activities, all of which will require an additional Rs. 20,736 million ($292.1 million) for the next three fiscal years, as summarized in Table 4-2 below. The proposed activities include the following: i) additional salaries for deputing primary teachers to lower secondary schools, and lower secondary teachers to secondary schools, ii) teacher grants for schools with severe teacher shortages as well as unaided community schools, iii) school improvement plans (SIP), iv) school grants, v) the construction of classrooms, libraries, multipurpose halls, and toilets, vi) additional scholarships for girls and Dalits, and vii) the conflict and disaster program (vouchers for children of Internally Displaced People (IDP), support for displaced teachers, additional classrooms for overcrowded schools, support for extra-curricular activities, etc.). Because some development activities—particularly physical investment—under the current SESP are not able to cover the entire country, it is apparent that the sub-sector needs investment in more regions. Yet, the existing proposal will be further refined and justified with more in-depth needs analysis—an analysis that will consider the overall requirements and criteria for resource distribution accompanied by enrollment projections in each district.
Table 4-2: Summary of Budget Requirement for
Lower Secondary and Secondary Education Rp. Million US$ Million (at US$1=Rs. 71)
2006/07 2007/08 2008/09 Total
'06/07-08/09
2006/07 2007/08 2008/09 Total
'06/07- 08/09
(A) Existing Programs 5,066 4,615 4,260 13,940 71.3 65.0 60.0 196.3 SESP1 1,541 984 520 3,044 21.7 13.9 7.3 42.9 Government2 3,525 3,631 3,740 10,896 49.7 51.1 52.7 153.5
(B) Additional Requirements3 5,123 7,283 8,330 20,736 72.2 102.6 117.3 292.1
(A)+(B) Total Requirements 10,189 11,898 12,589 34,677 143.5 167.6 177.3 488.4 1 As estimated by the DOE after the Mid-Term Review in mid-March 2006. The government share for SESP is excluded from this line and included in the Government line below. 2 Includes primarily teacher salaries. About 7 percent of the government budget is allocated to SESP activities. No data for government budget is available for FY2007/08-2008/09, so 3 percent inflation has been assumed for now.
3 As proposed by the DOE.

59
14. Higher Secondary Education: In Nepal, higher secondary education (grades 11-12) is currently provided by higher secondary schools and universities.65 Certification of passing the Higher Secondary Education Examination is considered equivalent to passing the Proficiency Certificate level offered by universities. The Higher Secondary Education Board (HSEB), established under the Higher Secondary Education Act 2046 (1989), grants approval for higher secondary schools that meet the specified conditions relating to physical facilities, qualified teachers, adequate number of students, financial provision, etc. The Board also awards certificates to higher secondary school graduates, , develops and revises curricula and textbook materials, supervises and monitors higher secondary school programs, conducts examinations and publishes the results, and lastly, recruits technical, professional, and administrative staff. In the process of transition to the 1-8/9-12 school education system, the Government plans to establish a Secondary Education Board by merging the existing School Level Certificate Examination Board with the HSEB. Other HSEB functions—such as curriculum development, supervision, and school approval—will be transferred to the Curriculum Development Center (CDC) and DOE.
15. In Nepal, there are 533 public higher secondary schools, and this number is expected to grow gradually in the coming years. At present, public higher secondary schools are attached to public schools, but in practice, the former operate as private institutions separate from the latter, except that they receive grants from the Government to employ two teachers. Due to the poor quality of education offered by these schools, the HSEB proposes to gradually increase the number of teachers supported by the Government from the current two to five by 2008/09; this will cost an additional $6.3 million for FY2006/07-2008/9. The HSEB also proposes to provide one-time institutional capacity building grants to build one Model School in each of 75 districts. The total cost of the grants is estimated to be $2.6 million for the next three years. Furthermore, the HSEB proposes a new scholarship program for girls in 22 remote districts which will cost $6.7 million over the three years (see ESDP I Support Volume II: Public Expenditure Review for the Education Sector for more detailed cost estimates).
16. The World Bank is currently in the process of approving a $79.6 million Higher Education Project (consisting of $60 million from IDA, $19.36 million from communities, and $0.25 million from the Government). The Project will allocate $16 million to support higher secondary education and will provide basic grants at the rate of Rs. 10,000 ($135) per graduate to all existing higher secondary schools meeting basic accountability requirements. In addition, all higher secondary schools are eligible to receive matching grants at a ratio, on average, of 1:2 (one unit of community contribution to be matched by two units from the Project). Furthermore, up to 200 schools with a good performance record and potential for sustainable growth will be eligible for performance grants.
17. Technical Education and Vocational Training: Greater access to relevant technical education and vocational training is critical for the numerous youths who leave school with neither an SLC or marketable skills to obtain jobs available locally and abroad, and subsequently cannot engage in self-employment activities. The Council for Technical Education and Vocational Training (CTEVT), established in 1989 under the Technical and Vocational Education Act of 1988, is responsible for managing a limited number of public technical schools across the country.66 There are also private technical schools, operating in affiliation with the CTEVT, but their very high fees limit their access to the relatively wealthier segment of the population. The CTEVT recognizes the urgent need to develop
65 The University Grants Commission (UGC), a statutory body established by an act of parliament [Act No 25 (1993)], coordinates universities, allocates and disburses government grants to universities and higher educational institutions and takes appropriate steps for the promotion and maintenance of standards of higher education in Nepal.

60
cost-effective skill development schemes for the wider population, particularly students from deprived groups and poor backgrounds, and unemployed youths who have little access to the existing technical education or vocational training opportunities.
18. In order to achieve this objective, the CTEVT has begun developing an Annex Program attached to general secondary schools to run along side the four training institutions that the CTEVT operates.67 Using the secondary schools’ existing physical and human resources, the Program is managed and operated by the School Management Committee of that particular school; it then offers mainly technical education programs, including civil engineering, electrical engineering, mechanical engineering, and agriculture. Successful trainees will be awarded a technical school-leaving certificate (TSLC). In addition to long-term courses, each school will conduct short-term or modular training courses of 1 to 6 months' duration according to local employment demands. As suggested in the Tenth Plan, the CTEVT aims to develop one program in each of the 75 districts, but it has so far established 15 and is planning to develop 15 per annum between FY2007/08 and FY2010/11. To establish the 60 new programs and operate the entire project for the next four years, it is estimated to cost $4.4 million (see ESDP I Support Volume II: Public Expenditure Review for the Education Sector detailed cost estimates).
19. An ADB-funded Skills for Employment Project began in 2005 to support the TEVT sub-sector. Its project appraisal document68 points out that the poor, disadvantaged, and women in remote villages have had little access to TSLC skills-training programs run by the CTEVT not only because the programs are typically located in urban areas, but because these people are often unable to achieve high marks over 10 years of schooling and thus do not meet the entry requirement for the TSLC programs. If access is the fundamental issue in the provision of skills-training for the poor and disadvantaged, establishing an Annex Program in every district might not help mitigate the problem because the Programs will most likely be located in district headquarters. Unless the proposed Annex Program has a unique advantage in providing access for the poor in rural areas and is different from other skills-training programs, it might create yet another program only for urban youths. It is therefore necessary to examine the effectiveness of the existing 15 Annex Programs in terms of their providing access to marketable skills-training for the poor before investing in the remaining 60 districts.
20. Funding Gap Summary: This section compared the budget envelope and required budget to implement the existing programs/projects and the newly proposed activities; this section also estimated the potential funding gap for each school education sub-sector. First, as for the primary education sub-sector, detailed activities have already been identified under the EFA pooling program, making it relatively easy to estimate a funding gap in implementing these activities. However, if the Government wants to achieve the goals of the Tenth Plan and MDG by 2015, resource requirements substantially rise from the baseline gap. Second, the SESP is not a sub-sector-wide program because it intensively invests only in selected districts. There is no baseline analysis of budget requirements for the entire secondary sub-sector, and therefore, unlike the primary sub-sector, , a funding gap was estimated based on the proposed activities of the DOE alone. However, in the process of transitioning to the 1-8/9-12 system, the proposal needs to be carefully reviewed by the Core Group responsible for planning the School Sector Approach (SSA). This Core Group will need to develop a comprehensive investment plan, including one for the secondary sub-sector. Third, given the budget allocation from the new higher
67 The four institutions include the Training Institute for Technical Instruction, polytechnic institutes, vocational training and community development institutions, and technical schools. 68 Asian Development Bank, 2004, Report and recommendation of the President to the Board of Directors on a proposed loan to the Kingdom of Nepal for Skills for Employment Project (NEP-36611).

61
education project, increasing teacher salaries for higher secondary schools or providing more scholarships may not be justifiable, and there is a risk of creating overlap and/or inconsistency. Fourth, similarly, given the on-going Skills for Employment Project and many other technical education and vocational training programs, a decision to establish more Annex Programs needs to carefully consider its advantages over other programs.
Fiduciary Risk Assessment
21. Fiduciary risk is defined as the risk that development aid expenditure i) will not be used for the intended purposes, ii) will not be accounted for accurately and in a timely basis (proper management of resources), and iii) will fail to represent value for money (efficiency and effectiveness of the use of public funds). This section reviews first the overall fiduciary risk assessment conducted by the Government and some donors, then follows with an initial risk assessment of the EFA program and its progress, and lastly assesses the fiduciary risk of investing in the school education sector in Nepal in terms of the above three dimensions. A more thorough assessment of fiduciary risk can be found in Section 5 of Volume II: Public Expenditure Review for the Education Sector.
22. Overall Fiduciary Risk Assessment In 2002, the GoN/World Bank’s joint Country Financial Accountability Assessment (CFAA) concluded that fiduciary risk in Nepal remained high because its advanced public financial management system had not been vigorously implemented. It then suggested that improvement in the public financial management systems—prioritization, accountability, and efficiency in the management of public resources and delivery of services—was critical for the Government to achieve its public policy objectives.69 In May 2005, a review of the Development Action Plan (DAP) of the CFAA70 observed that while all the concerned government institutions had undertaken serious and continuous assessment of their capabilities to fulfill their responsibilities specified under the 2002 CFAA and made extensive efforts to implement the DAP, there was still an urgent need to support capacity building and improvement in all the relevant areas. Subsequently, the DfID prepared the ‘Fiduciary Risk Assessment – Stock Taking Exercise (Draft)’ in March 2006.71 This points out that after 1 February 2005 when the King took direct control of the government, there has been little decrease in corruption, raising the concern that new fiduciary risks might have emerged because there have neither been elected central and district bodies nor Public Accounts Committee (PAC). It also observed that, compared to the original budget allocation of FY2004/05, there has been significant overspending on security and under-spending on many development sectors.
23. Nepal’s political unrest has increased fiduciary risk by reducing revenue collection, disturbing fund flows, delaying implementation, and damaging the human and physical resources of educational institutions. As of early June 2006, the political situation in Nepal is still fragile and uncertain, but as Parliament has been restored, the country is likely to move towards full democracy which will hopefully restore peace and improve the public financial management system and capacity, both at the central and local levels. Not only must donors keep monitoring and supporting the Government’s commitment to reducing fiduciary risk, they must use development assistance more effectively and in a more transparent manner for pro-poor development activities.
69 Prior to the CFAA, several other assessment activities—including a joint GON/ADB/WB Country Portfolio Performance Review in FY1999/00 and FY2000/01 (also joined by JBIC), intensive work by both Financial Controller General’s Office (FCGO) and Office of the Auditor General (OAG), and a financial management audit by the WB’s Internal Audit Department—had been conducted which identified various problems in the implementation process. 70 Nepal: Financial Accountability Review Mission (A Joint HMGN/DFID and World Bank Assessment Update), May 9–24, 2005, Aide Memoire. 71 Note that the March, 2006 draft might have been revised later.
62
24. Initial Risk Assessment of the EFA Pooling Program: At the time of its
preparation, the program’s risk assessment was conducted by the World Bank in collaboration with the other donors as a collective assessment.72 Under the Joint Financing Arrangement (JFA),73 the pooling partners agreed to the use of the existing government system for disbursement and accounting for pooled government and donor funds. Thus, to assess the fiduciary risk of investing in the EFA program, there must first be an assessment of the financial management and program implementation systems of the implementing agencies—in this case, MoF/FCGO was responsible for financial management and MoES/DoE for program implementation and reporting.
25. While the overall country risk was rated as discussed above, the overall program risk was rated as medium, and some risk mitigation measures were suggested. First, core staff of MOF/FCGO and MOES/DOE were well trained, having worked for the EFA’s predecessor project—i.e., Basic and Primary Education Project (BPEP)—which had a similar financial management system. In order to maintain the financial management capacity, the Government committed not to transfer these personnel during the first two years; it also included reviews of financial management and expenditure in the annual review program. Second, funds flow should be well-defined, and close monitoring mechanisms by pooling donors were introduced to mitigate possible delays in fund flows to schools. Third, according to the Government’s Financial and Administrative Regulations, internal control of accounting policies and procedures were considered adequate. The government monitoring formats for financial and procurement reports were to be used for financial monitoring and reporting as well as semi-annual flash reports to measure outputs. Fourth, external audit arrangements by the Supreme Audit Entity, Office of the Auditor General (OAG) were assessed satisfactory, but internal audits were assessed as inadequate with respect to timeliness and quality in general. Therefore, the program included capacity building for internal audits.
26. The next sections, therefore, assess the fiduciary risk of investing in the EFA program after two years of implementation by examining the present financial management and program implementation systems and practices. Next, the sections ask to what extent the potential risks, identified during the program preparation period, have already been mitigated as well as how likely they will become mitigated towards the second half of the program.
27. The Use of Public Funds for the Intended Purposes in Priority Areas: The introduction of Medium Term Expenditure Framework (MTEF) has helped the Government prioritize budget allocations to development activities according to the goals and objectives of the Government. The introduction of the MTEF and Annual Strategic Implementation Plan (ASIP) for the education sector has also helped the MoES, DoE, and DEOs prepare activity plans and identify priorities among them. However, because they are prepared within the budget ceiling (which only increases incrementally every year) provided by the National Planning Commission (NPC) and MOF, the planning exercise tends to simply follow activities from the previous year without sufficiently taking into account enrollment changes and/or policy changes. A comparison between budgeted and actual expenditures reveals that actual budget allocations to some activities—such as school construction and EFA (district)—are much lower than the original plan in the ASIP. This comparison suggests that
72 Note that the World Bank provides a project loan, not a program loan, for the EFA program (Project appraisal document on a proposed credit in the amount of SDR {AMT} million (US$50.0 million equivalent) to the Kingdom of Nepal for the Nepal Education for All Project (April 20, 2004)). 73 See Section V. EFA program description in the Main Report for a detailed description of financial management and disbursement arrangements for the EFA.

63
only around 90-93 percent of the total allocations are actually spent. In particular, budget spending on capital investment and at the district level has been weaker than planned. Finally, at the school level, a public expenditure tracking survey suggests that the flow of school budgets can be improved in terms of the time taken to channel funds and eliminate possible leakages before the school budgets reach schools. As schools actually receive more and more school grants, a stronger expenditure tracking and monitoring system needs to be in place to ensure the effective use of school budgets.
28. There is room for the DoE to improve the quality and timeliness of monitoring and reporting on the EFA, SESP, and other programs and projects. Also, the MoES/DoE and schools need to improve the quality of their financial management by developing more detailed budget headings and expenditure codes and by revising the existing operational manual on school grants. It seems that the existing audit system does not function as an effective tool to prevent possible misappropriation. The level of fiduciary risk may be higher at the local level due to the weak internal audit capacity of DDCs. Schools are required to have formal and social audits completed, but for various reasons, many schools remain unaudited. As schools receive an increasing amount of grants from the Government, it becomes crucial that they are properly audited.
29. Financial Management Capacity: Typically, financial management capacity is assessed in terms of timely and accurate expenditure reporting and independence of the budget process (e.g., external audit, public accountability). In terms of report preparation, the DoE is responsible for monitoring both the 10 budget heads74 financed by the EFA pooling fund as well as the key output progress of core EFA activities. The DoE produces Financial Monitoring Reports (FMRs) trimesterly. A review of the FMR for the Third Trimester, FY2004/05 raises concerns about the late submission and incomplete content of the FMR. The pooling donors have expressed their concerns formally and informally to the Department, but there has been little improvement in its financial management practices. The First Trimester, FY2005/06 was submitted again with a four-month delay—tardy submission of reports is a consequence of some weaknesses in the financial management system at the central and school levels. Persistent problems, such as inconsistency and incomplete coverage, were also observed. The World Bank currently plans to provide financial management capacity building training for the DoE. At the school level, standardized accounting formats, combined with training, would help schools prepare more accurate statements in a timely manner.
30. In terms of accountability, at district level, all Line Ministries are internally audited by the DTCO, then externally audited by the Office of the Auditor General (OAG). DfID’s fiduciary risk assessment raised two issues of concern in the existing audit system. First, the present practice of the internal transfer of staff between DTCO audit and accountancy functions creates a potential conflict of interest; a specialist/separate cadre for both areas might be preferable (and is being considered by FCGO). Also, due to the distance between most DTCO and the central level of FCGO, poor performers are rarely held accountable. Second, OAG queries are, in reality, not aggressively pursued. The AGO (Auditor General’s Office) Report75 reveals various issues such as large numbers—though relatively small amounts—of misappropriations,76 misuse of funds, lack of monitoring and supervision of
74 It consists of three capital and seven recurrent budget items. The former includes 65-3-140 (teacher salaries), 65-3-167 (non-formal education), 65-3-169 (office of school teacher records), 65-3-170 (Special Education), 65-3-176 (teacher pension service), 65-3-417 (Education for All (central level)), 65-3-804 (Education for All (district level)), while the latter includes 65-4-167 (non-formal education), 65-4-417 (Education for All (central level)) and 65-4-804 (Education for All (district level)). 75 AGO Report FY2060/61 (2003/04), 27. Ministry of Education and Sports, June 1, 2005. 76 The TRSE team is currently working on a detailed analysis of misappropriation by district.

64
scholarships, weak internal control of the disbursement of funds to schools, excess payments, and so on. However, it seems there is no mechanism to correct these issues.
31. Two types of audits are conducted at the school level. Schools are required to submit a monthly statement of expenditures (SOE) to the DEO. The Education Regulation also requires all schools to be annually audited by a certified auditor appointed by the DEO. However, according to the Technical Review of School Education (TRSE), while 78 percent of the sample schools prepared the monthly SOE, only 20 percent had completed the financial audit. Similarly, the PETS Survey77 found that only 53.8 percent of the 65 schools had their accounts audited. The poor compliance with financial regulations is partly due to a lack of resources: schools are unwilling/unable to pay the auditors fee, which is Rs. 500 for primary schools and between Rs. 1,000 and 3,000 for lower secondary and secondary schools.78 In addition to the formal audit, schools are expected to receive a social audit in which their SMC and PTA offer some degree of pressure for the appropriate use of resources. Even though the social audit has been introduced as part of the school grants operation guidelines, its concept and process have not been clearly understood by many schools. As a result, according to the TRSE Report, only 38 percent of the sample schools—ranging from 11 percent in Banke District to 80 percent in Dadeldhura District—completed a social audit report.79
32. Effectiveness and Efficiency of Resource Use: The third question of fiduciary risk assessment asks whether government policies and programs are designed to use public funds effectively and efficiently. The next few paragraphs examine the effectiveness of the EFA Joint Financing Arrangement (JFA)—given that some major donors are yet to participate. It also examines how equitably resources are distributed under the EFA pooling program, as well as the effectiveness of the provision of scholarships and school construction grants. In this Main Report, the JFA arrangement is appraised in greater detail in Chapter III Education Budget and School Finance. Deeper analysis can also be found in supporting Volume II and Volume IV of this series.
33. EFA is supported by both pooled and non-pooled funds. The EFA pooling program consists of pro-poor activities (such as scholarships for disadvantaged children and alternative education programs for out-of-school children) and aims at distributing resources to all schools more equitably across the country, based on the number of students. Under the EFA program, there is wide regional variation in resource allocation in terms of unit costs, but there is no clearly identifiable tendency to either favor or disfavor certain regions, except for generally higher Pupil Teacher Ratios in mountain areas. This may imply that the EFA pooling funds are not allocated based on systematic pro-poor policies except for the provision of scholarships for disadvantaged children. Moreover, the effectiveness of some activities may be questionable. For instance, potential impacts of the scholarship program may have been diluted because the current criteria for scholarship beneficiaries seem to have failed to identify the most needy children or to provide them with a sufficient amount of support. Additionally, investment of public funds in classroom construction has not successfully mobilized community participation as intended in many areas. Also, high drop-out and repetition rates have lowered internal efficiency. In short, while it is still too early to
77 Office of the Financial Comptroller General, 2003, Report of Expenditure Tracking Survey of Primary, Lower Secondary and Secondary Schools, Ministry of Finance, Kathmandu. It tracked the grant aid budget for primary education (budget head 6-3-140), lower secondary and secondary education (6-3-150) and student scholarships (65-3-190) for FY1999/00-01/02. 78 Ministry of Education and Sports and Department of Education, 2004, Support to Development of Financial Management in the Education Sector, Nepal (Final Report), Technical Assistance to Improve Financial Management of Support Programs for the Education Sector of Nepal. 79 The Report notes that more schools in Western, Mid-Western and Far-Western Regions completed it than the national average.
65
assess the effectiveness and efficiency of the EFA pooling program—it has not completed its second year yet—a brief review of the program suggests that the existing criteria for resource distribution need to be improved for more efficient, effective, and equitable use of the limited resources.
34. The JFA has the benefit of enabling the Government to use its own financial management and reporting procedures and thus reduce the transaction costs for all the parties concerned. However, despite agreeing that using the Government’s existing system should be their ultimate goal for development, non-pooling agencies do not join the JFA because the JFA does not allow them to clearly track the outputs and outcomes of their investment. While this reasoning may be important from the perspective of non-pooling partners, it may be counterproductive from the overall development point of view because parallel funding structures are unlikely to strengthen the Government’s management capacity in the long run. In fact, they may overburden the Government by requiring more reporting. The only way for the Government to convince the non-pooling donors to participate in the JFA is to demonstrate that the Government has sufficient capacity to achieve development objectives and goals under the JFA. That said, and considering the Government’s aim to shift to the School Sector Wide Approach (SSWAp) by 2009, if the Government can demonstrate a visible improvement in financial management as well as monitoring and evaluation functions under the JFA—and thus reassure donors of its effectiveness—non-pooling donors may need to consider harmonizing their assistance in the medium term, as aimed at in the Paris Declaration on Aid Effectiveness.80
35. Summary: Overall, fiduciary risk in Nepal has been assessed as high due to the slow implementation of the CFAA Development Action Plan, weak budget execution and financial management capacity, and possible misuse of public funds for unintended purposes. Nevertheless, donors have recognized a strong potential for improvement in these areas in the foreseeable future. In particular, following the restoration of the democratic government in April 2006 and the subsequent Government’s desire to prove its ability to lead the country there may be significant improvement soon.
36. In the meantime, since the Government adopted the PRSP in 2002, more funds
have been allocated to pro-poor activities, including primary education. The introduction of MTEF has helped the MOES/DOE prioritize activities according to their development objectives and strategies. Despite visible improvements, many weaknesses have been identified as follows. The MOES/DOE need to strengthen their planning and budgeting capacity by linking objectives, activities, and expected outcomes. The three-year budget projections under ASIP and MTEF are still weak as they tend to reflect incremental increases based on the first year budget without taking into consideration possible changes in enrollment or education policy. In terms of budget execution, only around 90-93 percent of the total allocation has been spent, and it has been particularly low for capital investment and at the district level. Financial management capacity is also weak at all the MOES/DOE, DEOs, and school levels, particularly the latter two, where the existing audit system is not working properly. DOEs also need to prepare financial monitoring reports on time and with more accuracy. Finally, the effectiveness of the EFA program—in terms of distributing resources equitably and improving the retention of students—is still to be evaluated, but the existing criteria for resource distribution may need to be improved for more efficient, effective, and equitable use of the limited resources. In short, the overall direction of fiduciary risk of investing in Nepal’s school education sector seems to be dropping, but there is still room for improvement to mitigate fiduciary risk.
80 Joint Progress toward Enhanced Aid Effectiveness, High Level Forum, Paris, February 28-March 2, 2005, Paris Declaration on Aid Effectiveness.

66
V. ESDP I PROGRAM DESCRIPTION
Introduction 1. The Government of Nepal has demonstrated a commitment to pro-poor
education reform over the past decade, supported by a broad and coordinated external assistance program. The formulation of the Secondary Education Support Program (SESP) and Nepal’s Education for All (EFA) program continued the shift begun in the early 1990s from “basket-funded” projects (Basic and Primary Education Projects I and II) to policy-led education development programs and sub-sectorwide approaches (SWAps). The Asian Development Bank’s (ADB) assistance to education is aligned with this commitment, and the proposed Education Sector Development Program I (ESDP I) is designed to increase the momentum towards a full education SWAp.
2. The proposed ESDP I will have two components. Through ESDP I Component A, ADB will join with the Government of Nepal (GoN) and five pooling partners81 in a jointly financed investment in Nepal’s Education for All (EFA) Program covering the 2004-2009 period that supports basic, formal, and non-formal primary education through grade 5 nationwide.82 Beginning in 2009, Nepal plans to extend basic education through grade 8 and secondary education through grade 12. ESDP I Component B will support a geographically targeted transition to the re-structured school system. Component B will also help build GoN capacity to prepare a sectorwide policy, strategy, and investment framework for 2009 and beyond.
3. Previous chapters provided the economic, social, and educational background information as well as the rationale for ESDP I. This Chapter provides the program description, institutional, and financing arrangements for Components A and B.
Component A: Supporting EFA 4. Education for All is a high-priority program in Nepal with the long-term
development objective of improving access to and benefit from literacy programs for poor adults as well as basic and primary education for children, especially girls and children from disadvantaged groups. As the EFA program addresses both Global EFA and Millennium Development Goals (MDG) and targets, is considered an MDG Targeted Intervention. In 2003, The MOES finalized a Core Document for EFA that serves as the policy, strategy, program, and financing framework for GoN and donor partners in the pre-school, adult literacy, and primary education sub-sectors. Guided by the international EFA movement and Nepal’s Tenth Plan, the EFA Core Document83 specifies the program’s components, principles, strategies for implementation, arrangements for program management, monitoring and evaluation indicators, and financing plans. Donor partners have used the Core Document as a basis for both appraisal and the joint financing arrangement since 2004.
81 World Bank, Denmark, United Kingdom, Norway, and Finland 82 ADB currently supports EFA through its Teacher Education Project as one of seven non-pooling partners along with the World Bank, Japan, UNICEF, UNFPA, the WFP, and numerous NGOs and INGOs. 83 MOES Education for All Core Document: November, 2004.
67
5. EFA Program Principles and Strategies: The Core Document emphasized four program implementation principles and strategies: decentralization, improving access and equity, enhancing quality and relevance, and improving efficiency and institutional capacity. These are made operational as follows:
• Decentralization: Operations under EFA have included formation of School Management Committees (SMC), the handover of schools to communities, and block grant financing of some schools. As of December 2005, about 1700 schools have transferred management to communities, and about 30 percent of those had received block grants. About 51 percent of schools (11,920) report that they had prepared and implemented their own School Improvement Plans. Some training and other capacity building activities in planning and financial management have taken place at the school and district level.
• Access and equity: Nepal’s strategy involves both increasing the supply of schools,
particularly in under-served areas, and removing demand-side barriers to participation by providing scholarships to girls, Dalits, and vulnerable communities. As of December 2005, there are over 28,000 primary schools (including private schools) serving over 4.5 million children. To date, 521,064 scholarships have been distributed to Dalit children and 574,196 to girls. However, there are management issues to be resolved regarding scholarship tracking and distribution.
• Enhancing quality and relevance: In addition to school improvement planning,
quality inputs include teacher training, curriculum revision, textbook dissemination, and training resource people. In spite of progress made providing these inputs to schools, many schools reportedly still lack minimum conditions of learning.
• Institutional capacity: Progress can be seen in functions at the central level such
as Education Management of Information Systems (EMIS), planning financial management, and some technical areas such as teacher training and curriculum development. However, challenges remain in other central functions such as policy analysis and information technology; at the district and school level, there also exist planning and financial management issues.
6. EFA areas of activity: EFA is organized into six areas of activity: (i) expanding
early childhood development (ECD), (ii) ensuring access to education for all children, (iii) meeting the learning needs of all, (iv) reducing adult illiteracy, (v) eliminating gender and social disparities, and (vi) improving all aspects of quality education.
• Expanding early childhood development (ECD) EFA addresses the problem that
under-age enrollment in grade one leads to high repetition rates with significant negative impact on both learning outcomes and system efficiency. EFA aims at increasing the percentage of new entrants to grade one with ECD experience from 8 percent in 2001 to 60 percent in 2009. Actions include establishment of ECD centers in poor areas, development of ECD programs, training of facilitators, and partnership building with non-governmental organizations.
• Ensuring access to education for all children The second thrust of the EFA is to
ensure that all children—particularly girls, children in difficult circumstances, and ethnic minorities—have access to and complete good quality, primary education. A specific objective is to increase the NER from 81 percent in 2001 to 96 percent in 2009. Enrollment opportunities are improved through construction and furnishing of

68
new classrooms, rehabilitation of classrooms, and improving site services in schools with special focus on toilets for girls and safe drinking water. Schools that have not qualified for new permanent classrooms but have high demand for access are provided with temporary classrooms. EFA also finances construction of District Education Offices and Resource Centers (RCs). As part of the inclusive education strategy, EFA supports special needs education that caters to children with learning difficulties.
• Meeting the Learning Needs of all Children: Home to school transition support to
non-Nepali speaking children, who constitute about 50 percent of children in Nepal, are developed and piloted in schools serving predominantly non-Nepali speaking populations in five districts. In addition, support is provided for activities aiming at: i) promotion of primary education in the child’s native language, ii) incorporation of life skills and local content in the school curriculum, and iii) communication of program objectives and strategies.
• Improving Adult Literacy: A primary EFA goal is to increase the adult literacy rate
(ages 15 and older) from 48 percent in 2001 to 66 percent in 2009. At the same time, the literacy gender parity index will be raised from 0.6 in 2001 to 0.9 in 2009. To achieve these goals, EFA provides financial support to the on-going Women’s Literacy Program and National Literacy Campaign. It also supports community learning centers that cater to out-of-school children and neo-literates—this includes Out-of-School Programs targeted towards school dropouts with the primary purpose of redirecting them to schools. At the end of EFA, 250,000 children will benefit from these programs.
• Eliminating Gender Disparity: The Government’s strategy is to provide
scholarships to girls, Dalits, and children from other disadvantaged groups. These scholarships are funded through the School Grants Program (SGP) and benefit about 650,000 students per year.
• Improving All Aspects of Quality Education: The major focus of the EFA is to
enable School Management Committees (SMCs) to take initiative for school improvement in partnership with the community. School improvement planning is supported through various types of earmarked and block grants to schools, covering quality and physical improvement needs, non-salary recurrent costs, capacity building needs, and support for children’s access to and retention in schools. Capacity building for SMC members, head teachers, and community organizations is provided to enable them to effectively access and use resources. Key elements of the SGP include awards of performance bonuses to schools, incentive grants to community-managed schools, and free textbooks and basic learning materials to all children. Additionally, support is provided for the purchase of materials for book corners in classrooms, research and development activities at the center and districts—including school-based action research—and piloting of computer education. Recurrent training for teachers is strengthened to make it more relevant to local contexts. A ten-month certificate-training course to enable teachers to qualify for certification is also being strengthened and expanded by the ADB-supported Teacher Education Project. The EMIS is streamlined and strengthened as well to enable rapid monitoring of key outputs and outcomes at the school and district level.
7. Planning and Adapting EFA: EFA is a continuously evolving program. While
the Core Document sets the policy framework and overall strategy for EFA, the Annual
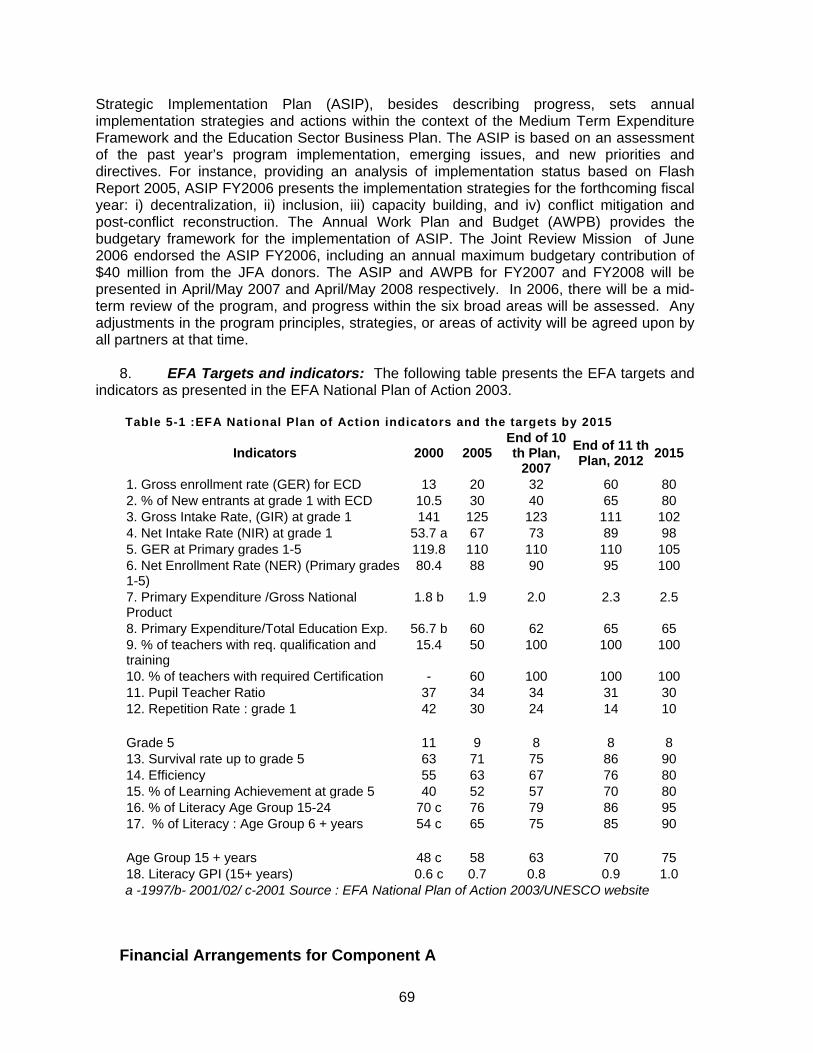
69
Strategic Implementation Plan (ASIP), besides describing progress, sets annual implementation strategies and actions within the context of the Medium Term Expenditure Framework and the Education Sector Business Plan. The ASIP is based on an assessment of the past year’s program implementation, emerging issues, and new priorities and directives. For instance, providing an analysis of implementation status based on Flash Report 2005, ASIP FY2006 presents the implementation strategies for the forthcoming fiscal year: i) decentralization, ii) inclusion, iii) capacity building, and iv) conflict mitigation and post-conflict reconstruction. The Annual Work Plan and Budget (AWPB) provides the budgetary framework for the implementation of ASIP. The Joint Review Mission of June 2006 endorsed the ASIP FY2006, including an annual maximum budgetary contribution of $40 million from the JFA donors. The ASIP and AWPB for FY2007 and FY2008 will be presented in April/May 2007 and April/May 2008 respectively. In 2006, there will be a mid-term review of the program, and progress within the six broad areas will be assessed. Any adjustments in the program principles, strategies, or areas of activity will be agreed upon by all partners at that time.
8. EFA Targets and indicators: The following table presents the EFA targets and indicators as presented in the EFA National Plan of Action 2003.
Table 5-1 :EFA National Plan of Action indicators and the targets by 2015
Indicators 2000 2005 End of 10 th Plan,
2007 End of 11 th Plan, 2012 2015
1. Gross enrollment rate (GER) for ECD 13 20 32 60 80 2. % of New entrants at grade 1 with ECD 10.5 30 40 65 80 3. Gross Intake Rate, (GIR) at grade 1 141 125 123 111 102 4. Net Intake Rate (NIR) at grade 1 53.7 a 67 73 89 98 5. GER at Primary grades 1-5 119.8 110 110 110 105 6. Net Enrollment Rate (NER) (Primary grades 1-5)
80.4 88 90 95 100
7. Primary Expenditure /Gross National Product
1.8 b 1.9 2.0 2.3 2.5
8. Primary Expenditure/Total Education Exp. 56.7 b 60 62 65 65 9. % of teachers with req. qualification and training
15.4 50 100 100 100
10. % of teachers with required Certification - 60 100 100 100 11. Pupil Teacher Ratio 37 34 34 31 30 12. Repetition Rate : grade 1
Grade 5
42
11
30
9
24
8
14
8
10
8 13. Survival rate up to grade 5 63 71 75 86 90 14. Efficiency 55 63 67 76 80 15. % of Learning Achievement at grade 5 40 52 57 70 80 16. % of Literacy Age Group 15-24 70 c 76 79 86 95 17. % of Literacy : Age Group 6 + years
Age Group 15 + years
54 c
48 c
65
58
75
63
85
70
90
75 18. Literacy GPI (15+ years) 0.6 c 0.7 0.8 0.9 1.0 a -1997/b- 2001/02/ c-2001 Source : EFA National Plan of Action 2003/UNESCO website
Financial Arrangements for Component A

70
9. EFA Program Funding: The Government has requested a program loan of $30 million equivalent from ADB’s special fund sources (ADF) for Component A.
10. As described in Chapter V: Education Budgets and Funding Gaps, EFA 2004-2009 is estimated to cost over $800 million with over 70 percent of the resources provided by the Government. This figure includes development budget costs associated with the six main EFA thrusts (originally estimated at US $182 million), recurrent costs (such as salaries and benefits of teachers and managerial staff, which are estimated to be around US $482 million), and parallel funding provided through projects outside the pooled financing arrangement. These projects, contributing about US $125 million, include: i) Primary School Construction Project (JICA), ii) Primary School Nutrition Food Program (WFP), iii) School Transfer and Incentive Program (World Bank), iv) Teacher Education Project (ADB), v) Basic and Primary Education, including the ECD Project (UNICEF), and vi) UNESCO Support to Community Learning Centers/ECD. The sub-sector program that GoN and donor partners are jointly financing is the total public expenditure on basic and primary education, including both development and regular expenditures. As such, the program incorporates planning and monitoring of the contributions of GoN, pooling donors, and donors providing parallel project financing outside the pool. The pooling donors have committed to harmonization principles, as reflected in the Joint Financing Arrangement described in the next section, for providing financial support to the EFA program. A description of EFA financing requirements can be found in Chapter V of this report.
11. Joint Financing Arrangement: The Joint Financing Arrangement (JFA) between the government and five pooling donor partners – Denmark, Finland, Norway, DfID/UK, World Bank – enables the use of the Government’s financial management and reporting procedures for the EFA program. This has the benefit of reducing transaction costs for all the parties concerned. The JFA sets forth the agreements to be reached between the Government and signatory partners for the creation and management of pooled donor funding arrangements in support of the EFA program. The EFA JFA is considered a landmark in GoN donor relations, and is used as a benchmark for other sectors. A detailed discussion of the EFA Joint Financing Arrangement and compatibility between EFA financing, managing, and reporting arrangements with ADB requirements can be found in Supplementary Appendix 3 of this report.
12. Tranching and Disbursement: Government has requested that ADB will join the existing EFA’s JFA and provide $30 million of funding through a program loan modality. ADB will release funds in 3 tranches over the remaining period of the EFA in amounts determined by ADB’s share of the MOES’s annual EFA budget for the fiscal year,84 as described in the Annual Work Plan and Budget. Each tranche will be released to the MOF who will then disburse the funds to the Foreign Exchange Account upon MOES’s fulfillment of the existing EFA JFA conditions85.
84 The first tranche can be released upon loan effectiveness, which is anticipated in December, 2006. As this is near the end of the MOES’s fiscal year, this tranche will fund ADB’s share of the cash requirement for the next 2 trimesters of the MOES’s annual EFA budget. The second and third tranches can be released in May/June of 2007 and 2008, and will fund ADB’s share of the full fiscal year of the MOES’s annual EFA budget. 85 Other donors’ funding modalities are more flexible and efficient, allowing them to fund the Foreign Exchange Account quickly and more frequently. As ADB will only be able to disburse in 3 tranches, the MOF will essentially act as ADB’s agent —holding ADB’s tranches and disbursing to the Foreign Exchange Account upon MOES’s fulfillment of the EFA JFA conditions.
71
13. Procurement: The loan proceeds will be used to finance the full foreign exchange costs (excluding local duties and taxes) of items produced and procured in ADB-member countries, excluding ineligible items and imports financed by other bilateral and multilateral sources. In accordance with the provisions of ADB’s Simplification of Disbursement Procedures and Related Requirements for Program Loan, the proceeds of the program loan will be disbursed to the MOF as the Borrower. No supporting import documentation will be required if, during each year that loan proceeds are expected to be disbursed, the value of total imports minus imports from non-member countries, ineligible imports, and imports financed under other official development assistance is equal to or greater than the amount of the loan expected to be disbursed during such year. The Government will certify its compliance with this formula with each withdrawal request. Otherwise, import documentation under existing procedures will be required. ADB reserves the right to audit the use of loan proceeds and verify the accuracy of the Government’s certification.
14. Counterpart Funds: Any counterpart funds generated from the proceeds of the program loan will be used by the MOF to fund the EFA.
Program Management 15. ADB will be joining the existing pooling donors in the EFA’s JFA. The JFA
details the goals of the EFA program, the responsibilities of the Government and pooling donors, the funding mechanism, and the fiduciary requirements including procurement, reporting, monitoring and auditing as well as other administrative requirements. The pooling donors meet regularly to review the financial and operational status and progress of the EFA and to commit and disburse funds to the program. The Borrower will be the Ministry of Finance (MOF) and the executing agency will be Ministry of Education and Sports (MOES).
16. Accounting, Reporting and Auditing: The budgeting procedures for preparation, approval, implementation, and monitoring are elaborated in the Financial Administration Regulations (FAR). At the beginning of the fiscal year, the NPC and MOF set budget ceilings for all line ministries based on the overall development policy of GoN and the availability of financial resources. These agencies also issue budget preparation guidelines which are passed on through the ministries to subordinate units. Work programs and budgets are then prepared by these units and consolidated for submission to the NPC and MOF.
17. For EFA planning, GoN and pooling donors review the Annual Work Plan and Budget (AWPB) and Annual Strategic Implementation Plan (ASIP) at an annual meeting held in April. Based on the outcome of the review, they commit resources and agree on the shares of pooled donor funding in the program budget for the next fiscal year. After the budget is approved, the MOF releases spending authorization to the MOES which, in turn, releases expenditure authorization to DOE and, thereafter, to spending units. Given that the EFA is a priority program, funds are promptly released as soon as the DOE receives authorization from the MOES accompanied by the AWPB. The District Treasurer Controller’s Office (DTCO) also receives a copy of this documentation. Separate and identifiable budget codes are provided by the MOF to enable monitoring and reporting on EFA program expenditures funded through the pooling arrangement. Public expenditures that are jointly financed by the Government and pooling donors are tracked to those associated budget heads and sub-heads for basic and primary education under the EFA program. Program
72
support from donors outside the JFA are subject to separate agreements and monitoring arrangements.
18. In addition to the April Annual Review, a consultative meeting is held in December of each year between pooling donors and the Government. In accordance with JFA provisions, this meeting reviews the preliminary consolidated financial statements for the previous fiscal year as well as financial and output reports for the first trimester of the current year. Both the Annual Review and the consultative meeting are preceded by independent technical reviews (financed outside the pooling arrangement) which provide additional information to pooling partners on financial and overall implementation progress. The technical reviews include site visits to a sample of districts and schools in those districts.
19. Pooling donors including ADB, through the EFA’s JFA, monitor and evaluate program performance. The EFA’s JFA details a number of performance reports to be produced and submitted to the pooling donors. These include periodic and annual progress reports detailing expenditures, outputs, outcomes, and processes for the period. These reports are prepared and submitted to the pooling donors including ADB annually and/or semi-annually. Key program monitoring reports are:
(i) Annual Strategic Implementation Plan (ASIP) and Annual Work Plan and
Budget (AWPB): prepared annually and submitted to the pooling donors at the beginning of each fiscal year. Upon review of this report, pooling donors commit to their annual contributions.
(ii) Financial Management Report (FMR): a set of financial reports detailing
actual expenditures, cash balances, and cash requirements, prepared and submitted to the pooling donors within 45 days of the end of each trimester. Upon review of this report, pooling donors disburse based on actual expenditures and the forecasted cash requirement.
(iii) Un-audited Annual Financial Statement: prepared, certified by the Financial
Comptroller General, and submitted to the pooling donors no later than 6 months after the end of the fiscal year.
(iv) Annual Audit of the Annual FMR: performed by OAG/N and submitted to the
pooling donors no later than 8 months after the end of the fiscal year
20. Program Review: Pooling donors, including ADB, review the program on a semi-annual basis through a technical review to assess past performance and future financial needs. Additionally, the pooling donors will conduct a mid-term review after 2 years of the EFA implementation (2007).
21. In addition to the regular MoES Education Management of Information System
(EMIS), EFA uses a system of Flash Reports to convey information on key indicators to government and donors in a timely fashion. Flash Report I is based on a survey conducted at the beginning of the school year—the Flash Report II is based on a survey conducted at the school year’s end—to assess progress on program and performance indicators. Additionally, an independent Technical Review is conducted annually, based on a survey of 1000 schools. At the community and school level, social audits are to be conducted to

73
monitor absenteeism and drop outs, discriminatory practices, and targeted children’s access to scholarships and other incentives funded through school grants.
.
22. Compatibility Between EFA, JFA, and ADB requirements: This section is
excerpted from the conclusion of Supplementary Appendix 5, Assessment of JFA for EFA. 23. The disbursement procedure by ADB may have to be slightly modified since the
amount is released in tranches, as required by a program-based loan. Assuming that there will be three tranches, one release per year over the three remaining years of the EFA program, disbursement will be about $10.0 million annually. The pooling donors deposit their share in the Foreign Exchange Account, based on the request of GoN which, in turn, bases its request on the Financial Monitoring Report (FMR), supposedly submitted on a trimester—or 4-month—basis. ADB funds may have to be deposited in an intermediate account (not the Foreign Exchange Account) and releases to the GoN Consolidated fund can be made based on GoN request. Once the funds are in the Consolidated account, they can no longer be tracked on a per donor basis. Monitoring is based on agreed outcomes being accomplished. The diagram below shows a possible scheme of disbursement.
Box 5-1 EFA Monitoring through Flash Reports (From Core Document) Indicators for assessing long-term outcomes:
• Net enrollment rates • Survival rates to grade 5 • Learning achievement
Results indicators:
• Number of out-of-school girls, Dalits and children from disadvantaged janajati and other socially disadvantaged groups
• Number/share of schools with required number of classrooms of acceptable standard • Number/share of schools with safe drinking water • Number/share of schools with toilet(s) for girls • Percentage of entrants to grade one with Early Childhood Development (ECD) experience • Percentage of fully trained teachers • Number/share of accredited schools • Number of schools providing transitional language support to non-Nepali speaking students • Share of sub-sector budget transferred to schools as grants • Share of non-salary allocations in school grants • Share/Number of schools: (a) completing School Improvement Plans
(SIP); (b) receiving block grants on time; (c) receiving textbooks on time; and (d) completing social audits
• Number of schools transferred to community management

74
Figure 5-1
Transfer of funds onTwo trimesters cash trimester basis based
forecast advance on actual expenditures GoNPooling Donors Consolidated
Fund
Transfer of funds ontrimester basis based onfulfillment of conditionalitiesas determined by Projects
ADB 1st Tranche(Say $10 million)
GoN CounterpartFund Account
Disbursement from Pooling Donors to GoN Consolidated Fund
Foreign ExchangeUSD Account in
Nepal Rastra Bank
24. The procurement procedure developed by GoN is incorporated in the Public Works Directives (PWD). Consultant services for the development of the PWD were provided under the Asian Development Bank Technical Assistance No. 3306-NEP Strengthening of Project Implementation Practices. It is not surprising to see the ADB Procurement Guidelines incorporated in PWD, together with World Bank Guidelines. The only area for concern is that in International Competitive Bidding (ICB), eligible bidders must come from ADB member countries per ADB Guidelines. There are World Bank members who are not ADB member countries and therefore not eligible under ADB rules. However, The Procurement Plan doesn’t have any procurement under ICB and there are no plans to use ICB during the remaining duration of the EFA program.
25. For use of consultants, the Quality and Cost Based Selection (QCBS) method—as explained in ADB’s Guidelines for the Use of Consultants, April 2006—is the one in use by the Physical Services Section of DOE for both EFA and SESP. The Physical Services Section is in charge of procurement of works, goods, and services, and they have prepared the Procurement Plan 2005/06.
26. The Financial Reporting and Monitoring system needs improvement, both in timely submission and accuracy. However, capacity building seems to be in place through technical assistance from the donors, specifically the World Bank. The donors think that GoN has the capacity to improve.
27. The audit report for FY2004/05 was submitted on time, although the two-month grace period was used. The need for improvements in the presentation of financial statements was noted. Additionally, concerns were raised not only over a few cases of over-disbursement of teachers’ salaries but on ensuring the audit of schools, which is not within the scope of the Office of the Auditor General. The donors seem to be satisfied with the audit thus far.
75
28. Conclusion: In the opinion of the PPTA Team, there are compelling strategic and practical reasons for ADB to join the EFA pool through the JFA. In practical terms, ADB can make a much needed contribution to an on-going program both in financial and, through participation in the MTR, in technical terms as well. Strategically, the EFA sub-sector approach is a solid step towards policy-led, sectorwide development.
Component B: Preparation and Transition to a 1-12 School Sector 29. Component B is about continuity. First, the Component will consolidate gains and
extend the EFA principles and strategies mentioned above (paragraph 5) through grade 8. Second, the consultative and participatory processes that have become the norm for sub-sector and project planning will be the basis for planning the school sector transition program. Finally, the close cooperation and joint financing mechanisms established between Government and donors under EFA will be continued under Component B. The conceptual model for Component B can be found in Supplementary Appendix 6. ESDP I Component B will help build the MoES’s capacity to manage, but not direct, the public discourse on education as well as construct a responsive education policy framework that is aligned with a new Constitution. The new Constitution will necessitate drafting new governance, finance, and sectoral laws, and ESDP I Component B will also help MoES participate in shaping a governance and finance structure for education appropriate for a restructured, reformed, and more inclusive school system.
30. Component B will support the preparation of and the transition to a 1-12 school sector. The government is presently deliberating the establishment of a more equitable and effective 1-12 school sector, and is considering governance, management, and financing structures that will foster this reform. To support this school sector approach (SSA), Component B will provide continuous capacity building and technical support through a TA grant. Part of this grant will be used to help the Government prepare a Core Document to guide the transition to the 1-12 school sector. The Core Document will serve as the policy framework for this component. To validate these reforms, the Government will pilot test the transition program in selected districts. By the end of the transition program, the Government will have prepared a program for full SSA to be financed by itself with donor assistance through a pooled funding arrangement. In anticipation, the Government has requested multi-donor support for the transition program through a joint financing arrangement. Component B will participate in this arrangement through a program grant. Specifically, this component will support: i) developing MoES capabilities in policy review, formulation, coordination, and follow-up functions, ii) the MoES’s preparing the Core Document, and iii) piloting the transition program in selected districts.
Capacity Building in Policy Functions
31. In the context of ESDP I, capacity building has 3 dimensions: structural, institutional, and individual.
32. Policy Making and Coordinating Structures: As mentioned in the introductory chapter, Nepal has many inconsistent policy statements on school education. At present, education policy formulation is assumed by 15 ad hoc central level committees, each dealing with specific areas such as curriculum, teacher training, technical and vocational education, and general areas such as quality improvement. In addition, policy statements are often embedded in project documents and bilateral agreements. As a result of this increasingly unmanaged policy-making process, critical functions were not

76
allocated clearly and consistently. This obscured accountability, made the system difficult to regulate, and limited the Government’s ability to enforce policies. With the restoration of Parliament, education policy making can be restored to governance bodies supported by technical advice from line Ministries and other stakeholders.
33. Recognizing inadequacies and inconsistencies in the policy development process as well as being aware of the emerging challenges, particularly in the school sector front, the MOES took the initiative to form an Education Policy Committee (EPC). under the chairpersonship of the Minister of Education and Sports. The EPC was approved by the Cabinet in June 2006, and held its first meeting in July 2006. The functions of the EPC include: i) formulation of education policies, ii) coordination of policies in education and other related sectors, iii) follow up on the implementation and impact of policies and feedback from the stakeholders, and iv) policy review, based on findings of research, study, and consultative sessions with various stakeholders. EPC membership includes key partners in the educational policy and program development process, the Ministry of Finance (MOF), the Ministry of Local Development, the National Planning Commission (NPC), and the Ministry of Women, Children, and Social Welfare. The representation from the marginalized groups of the society, such as Women and Dalit Commissions, will ensure that social inclusion remains a key aspect in education policy formulations. Academia and professional organizations are also represented. Detailed discussion can be found in ESDP I Support Volume I: Component B: Preparation and Transition to a 1-12 School System.
34. Institutional Capacity: The Policy Analysis and Programming Section (PAPS) of the MOES will serve as the Technical Secretariat of the EPC. Accordingly, the PAPS will be upgraded in terms of physical and human resources. A policy resource room with modern equipment will be established, allowing the EPC members and their advisors easy access to research materials and other documents. Appropriate technical personnel will be deployed to make this resource room functional. Technical support will also be provided to the EPC to facilitate the decision-making process by a Core Group of senior officials from MOES and DOE. This Core Group will continuously reflect on policy issues from the perspectives of MOES. The Core Group will identify emerging issues resulting from policy actions, analyze possible options to address the issues identified, and organize broad stakeholders consultation. The Core Group will be assisted by a resource pool of educational experts who will prepare briefing notes for the EPC meetings.
35. Individual Capacity Building: Other capacity building activities include staff development program such as coaching programs for the secretariat officials to upgrade their knowledge and skills. Similarly, a peer review program for Core Group members in the region will permit them to share experiences with counterparts in the region.
36. The expected outcomes of this sub-component are: i) the EPC is institutionalized within MOES system, ii) an effective technical support structure is established within the MOES, thus facilitating the task of the EPC, iii) a participatory democratic process and environment for the policy development is established, and iv) skilled and knowledgeable human resources are built up within the MOES for policy functions.
Preparation of Core Document for the SSA:
37. As an initial step towards moving to an integrated 1-12 school sector, MOES will prepare a Core Document through a participatory approach under the guidance of the EPC. The Core Document will serve as a policy and planning guide for gradual introduction of 1-

77
12 integrated school sector. The Core Document will clarify Government commitments with respect to the provision, promotion, and appraisal of educational services within the framework of 1-12 school sector. The Document will explain an elaborate major strategies such as management, financing, and legal and regulatory framework relating to the standards of services and performance. The Core Document will also describe operational procedure for ensuring the delivery of school education which meets acceptable quality standards in partnership with the community and civil society. Essential details of the programs, resource envelopes, and implementation modalities will be included in the Core Document. Component B will provide technical support to SSA Core Document preparation.
38. Major steps and activities involved in the preparation of the Core Document are listed below and briefly described in detail in ESDP I Support Volume I: Component B: Preparation and Transition to 1-12 School System.
(i) Directional Policy Framework The EPC will provide a directional policy
framework for the preparation of the Core Document. The Core Group, mentioned in paragraph 21 above, has drafted a School Sector Approach Concept Paper. Following internal MoES discussions and wider consultations stakeholders, the EPC will finalize a policy direction for the Core Document based on the Concept Paper.
(ii) Core Document Preparation Terms of Reference (TOR) The Technical Secretariat will mobilize Core Document preparation. Within the directional policy framework provided by the EPC, the Technical Secretariat will prepare a TOR for the Core Document preparation with the help or the Core Group.
(iii) Appointment of Core Document Preparation Team EPC will appoint the coordinator and members of the Core Document preparation team. It is advisable that the team be multidisciplinary and include the participation of practitioners and beneficiaries.
(iv) Mechanism for Multi-Donor Support The Technical Secretariat will devise a mechanism for multi-donor cooperation and support for the preparation of the Core Document.
(v) Core Document Preparation Process The process of preparing the Core Document will include: (a) wide consultation with stakeholders in different contexts, (b) public hearing, (c) small-scale thematic studies on such areas as management, financing, legal, programmatic, and implementation concerns, (d) round-table discussion on the design and details of the Core Document, (e) technical and professional consultation at various stages of Core Document preparation, and (f) peer review of Core Document by counterparts in the region.
Transition Program to 1-12 School Sector
39. In July 2006, the MoES prepared a draft School Sector Approach Concept
Paper86 describing the overall framework for the 1-12 school sector approach. Following widespread discussions and revisions, the Concept Paper will serve as the basis for a SSA Core Document and a Transition Program Plan. The transition program will specifically focus on identifying locally relevant and effective ways of i) transitioning to a 1-12 structure through surveys, planning, and consultation with stakeholders and ii) transitioning to integrated functions for school-based management, financing, and quality assurance. In
86 MoES. School Sector Approach Concept Paper. Draft July, 2006.

78
order to cover a cross-section of districts representing topography, ethnicity, and educational development stages, the following considerations be given in the selection of districts for piloting an integrated 1-12 school sector.
40. Geographic Targeting: At present, the transition program is focused on the four following districts:
• One district in the Karnali region: Karnali region is one of the most undeveloped regions in Nepal and is also the most adversely impacted by the decade-long conflict. The needs and aspirations among the region’s people are entirely different than most people in other regions. A successful program piloting in the region anticipates a successful program in the rest of Nepal. Moreover, piloting in the Karnali region will help determine, in particular, the needs and aspirations of disadvantaged communities such that these needs can be incorporated appropriately in the education policy and priorities. One district that is representative of Karnali region will be selected for program piloting.
• One western Terai district: Terai district is the most populated region of Nepal and
also supports a diverse population. Most importantly, Dalits, ex-Kamaiyas, and other under-served populations live in large numbers in the Terai districts. Schools are commonly overcrowded, have meager resources, and offer low-quality education. Consequently, the people’s educational needs are different than the people living in the hills, mountain, and remote districts. One typical Terai district will be selected for program piloting.
• One urban district: Urban areas exhibit yet another characteristic of education
status in the country. Given the concentration of private schools and colleges, along with generally better opportunities for economic and social well-being, a competitive learning environment has become prevalent. Consequently, the urban population’s educational needs and aspirations differ from the previous two districts.
• One district from eastern hills: The Eastern region exhibits relatively better
conditions in terms of economic, social, and political capital than the other development regions. Thus, their needs are different, as will be their educational aspirations and needs. One district in the eastern hill region will be selected for program piloting.
41. Consultation and Surveys Planning for an integrated school system should
take into account regional variations in terms of population characteristics, such as the social, economic, and political capital. Because population in those regions aspire for different choices, strategic choices concerning school structure, policy options, legal provisions, management concerns, financing, and quality assurance may vary in terms of priority from one region to the other. The piloting will assess such differences and will lead to building consensus upon strategic choice for each district. At the initial stage of the pilot program, a baseline survey and school mapping will be conducted in the piloting districts.
42. It will not be feasible to integrate all of the existing schools in one attempt as some schools may need upgrading and some may need to be downsized. Some may also need to be merged with existing schools. A transitional plan for smooth integration will need a demand analysis with adequate reflection upon the needs and readiness of the community. The program piloting will assess, in particular, the demand and implications of expanding primary level to grade 8.

79
43. Assessing planning tools Considered the most commonly used planning tool at
the school and community level, SIP contributes to the bottom-up planning process in the national-level planning and budgeting. However, the efforts should also focus on developing capacity at the community and district level planning and management.
44. In order to embark upon an integrated school system, it is imperative that the planning tools and strategies are relevant and that stakeholders are competent enough to use it. The pilot program will focus on refining currently existing planning tools and planning processes. It will also build the capacity at the local level to ensure that the planning process is participatory, part of the district and national level planning and budgeting, and reflective of the needs of different populations (including disadvantaged groups).,
45. Meeting conditions for piloting In order to pilot the program successfully, schools in the pilot districts should meet the minimum learning conditions. This means that schools should have in place all the resources and infrastructure stipulated in the education act and according to the education regulation. Many schools, however, lack very basic infrastructure and support, such as necessary classroom space, teachers, textbooks, furniture, drinking water, and toilet facilities. The integrated school system will require not only the minimum stipulated norms but additional support and infrastructure to accommodate more students and more teachers. In order to ensure that the minimum conditions for successful piloting is in place, the following inputs will be provided for the transition to the integrated school sector.
• Teacher management—such as employment, deployment, transfer, and teacher development—has remained the most critical and complex aspect of education in Nepal. Some districts have an acute shortage of teachers while other districts have a surplus. Even within districts, some schools have more teachers than the norms would allow while others are always in short supply. The pilot program, with its provision of temporary teacher grants, will aid the short supply of teachers in these schools. The draft Core Document is expected to provide a more detailed plan on the teacher grant.
Teacher management is complicated, partly because of conflicting laws and regulations, and partly because of the gap between policies and practices contributing to preferential treatment. The pilot program will assess the gaps and opportunities in the current teacher management and will develop a plan for efficient teacher management for an integrated school system. The following key areas of the teacher management will be explored during the program piloting: teacher qualification, training, deployment, the role of the Teacher Service Commission, and other service conditions that are pertinent for an integrated school system.
• Schools are currently in short supply of classroom spaces. Integrating to 1-8 and 9-
12 school sector would require yet additional classroom room spaces. The pilot program will support expansion of classrooms and other necessary civil works in schools to support the effective functioning of an integrated school structure. The piloting will also support small-scale physical improvements at the DEO to build the necessary infrastructure to manage the integrated school system. While the draft Core Document will determine in detail what kind of civil works will be required in schools and at the DEO, in broader terms, the civil works will include construction of classrooms, toilets, offices, compound walls, and so forth.

80
• Program management In order to pilot a 1-12 school sector in the district, necessary policy backstops and technical support at different levels are required. The EPC will constitute a Steering Committee to oversee the piloting as well as the overall implementation and management of the 1-12 school sector in selected districts. The secretariat of the EPC will function as an overall coordinating body for the Steering Committee activities. The committee will, in particular, conduct the following: i) oversee the entire piloting activities in the districts, ii) constitute the district team in each pilot district, iii) provide the necessary technical backstop and resource support to the district team, iv) access TA support (both national and international) as and when needed, and v) offer necessary policy/strategy support to the pilot district.
A team of professionals, inclusive of members from different segments of the society, will be constituted in each district. The team will oversee the implementation of the integrated school sector approach at the district level, and will: i) implement piloting in the district, ii) provide technical and resource support to schools and communities, iii) conduct supervision and monitoring, iv) provide capacity building, v) receive TA support, and vi) conduct necessary surveys. The team will also map school conditions throughout the district to determine a school’s needs and demands.
Preparation and Capacity Building Technical Assistance (TA) 46. ESDP I will provide support through PBA to both EFA and the preparation and
transition to an integrated 1-12 school sector. Additionally, ESDP I will provide TA to support the implementation of these components. The proposed objectives and scope of the Preparation and Capacity Building TA are: i) to both support MOES capacity in policy functions and contribute to developing a sectorwide policy framework, ii) to support thematic groups in areas such as quality, governance, management, and finance, iii) to build capacity in management at the central and district levels in preparation for transition, iv) to validate and refine the Core Document design for an integrated 1-12 school sector through pilot tests, and v) to strengthen management and financial monitoring activities under EFA.
47. Areas of capacity building include: education policy analysis; education planning and management; education financing; education law, monitoring, and evaluation; classroom assessment and examinations; EMIS; school-based management; and civil work. The overall capacity building supported by ESDP I will be coordinated and harmonized with assistance provided by other donors. The TA will essentially finance the following: i) international and domestic consultancy services, seminars, and workshops, ii) regional study tours and peer reviews, iii) surveys and school mapping, and iv) office equipment.
48. Terms of Reference for TA are included in ESDP I Support Volume I: Preparation and Transition to a 1-12 School System.
Financial Arrangements for Component B
49. The Government has requested a program grant of $8 million, and a TA grant of $2 million, both from ADF, to finance the preparation and transition activities. Table 6-1 provides the indicative cost estimates for Component B.

81
Table 6-1 Indicative Cost Estimates and Financing Plan for Component B
Transition Program and Financial Management
50. Financial Management: The MOES will develop another multi-donor financing mechanism (MDFM) for the preparation and transition to the 1-12 school sector that will have an appropriate fiduciary environment. This will be developed in conjunction with the other interested donors. MOF will be the grant’s recipient, and MOES will be the grant’s executing agency.
51. Implementation Period: The new MDFM will be established by December 2006, and will support the 1-12 preparation and transition program through 2009. The grant will be released in 3 tranches—in line with the tranche releases for the Component A—in December 2006, June 2007, and June 2008 in amounts determined by the implementation plan for pilot testing and transition.
52. Procurement and Disbursement: The grant will be used to finance the full foreign exchange costs (excluding local duties and taxes) of items produced and procured in ADB-member countries, excluding ineligible items and imports financed by other bilateral and multilateral sources. In accordance with the provisions of ADB’s Simplification of Disbursement Procedures and Related Requirements for Program Loan, the proceeds of the
Foreign Local TotalItem Exchange Currency Cost
A. ADB Financing1. Consultants
a. Remuneration and Per Diemi. International Consultants 180 0 180ii. Domestic Consultants 0 357 357
b. International and Local Travel 15 10 25c. Reports and Communications 1 4 5
2. Seminars, Workshops and Meetings 0 680 6803. Study Visits 0 56 564. Surveys, Research and Data Collection 0 70 705. Miscellaneous Administration and Support Costs 0 50 506. Piloting grants a. Infrastructure support 0 3,600 3,600 b. Additional teachers' salary 0 2,808 2,808 c. Program support 0 22 22 d. CEMIS equipment support 39 26 657. Contingencies (5% of base cost) 12 384 396
Subtotal (A) 247 8,067 8,314
B. Government of Nepal 1. Office Accommodation and Utilities 0 80 802. Secretarial Office Support 0 40 403. Translation Services 0 5 54. GoN Share in Additional Teachers' salaries 0 1,872 1,8725. Contingencies (5% of base cost) 0 100 100
Subtotal (B) 0 2,097 2,097
Total 247 10,164 10,411
($ '000)
82
grant will be disbursed to the MOF as the recipient. No supporting import documentation will be required if, during each year that loan proceeds are expected to be disbursed, the value of total imports minus imports from nonmember countries, ineligible imports, and imports financed under other official development assistance is equal to or greater than the amount of the loan expected to be disbursed during such year. The Government will certify its compliance with this formula with each withdrawal request. Otherwise, import documentation under existing procedures will be required. ADB reserves the right to audit the use of loan proceeds and verify the accuracy of the Government’s certification.
53. Tranching and Disbursement: The grant of $8 million will be available upon the establishment of the MDFM that meets with ADB’s conditions for an appropriate fiduciary environment and approval of a pilot testing implementation plan. ADB will release funds in 3 tranches, the amounts of which will be based on the implementation plan. Similar to the arrangement for the EFA JFA, tranches will be released to an MOF counterpart fund. The MOF will then disburse to the agreed upon account upon MOES’s fulfillment of the MDMF conditions.
54. Accounting, Reporting, and Auditing: The MDMF will have similar accounting, reporting, and auditing arrangements to the EFA’s JFA. It will follow Government accounting systems. Reporting requirements should include, but not be limited to: i) preparation of an annual budget and work plan on which annual commitments can be determined, ii) submission of periodic reports of actual expenditures, iii) submission of annual reports of expenditures, and iv) submission to an annual audit. These reports and annual audits should be submitted to ADB and any pooling donors for review on a timely basis.
55. Program Performance, Monitoring, and Evaluation: The MDMF will have mechanisms to monitor and evaluate program performance similar to the EFA’ s JFA. These should include, but not be limited to, periodic and annual progress reports detailing expenditures, outputs, outcomes, and processes for the period. These reports should be prepared and submitted to ADB and any pooling donors annually and/or semi-annually.
56. Program Review: The MOES, ADB, and any pooling partners will periodically review program implementation. The reviews will include: i) preparation of the Core Document for the 1-12 school sector, ii) review of the outcome of pilot initiatives, implementation arrangements, and progress in legislative, executive, and financial actions, and iii) review of capacity building measures. Capacity Building TA Financing and Management
57. Implementation arrangements: The Preparation and Capacity Building TA will support MOES’s capacity in policy functions, assist in the transition to a 1-12 school sector, and build technical capacity, particularly in pilot areas. The TA will also support capacity building as required to implement, manage, monitor, and report on the EFA program. The MOES will be the executing agency and will specify monitoring and guidance mechanisms.
58. Procurement: The TA grant will support preparation and transition to an integrated 1-12 school sector by 2009. The TA will: i) build the capacity of the MOES in formulating and coordinating policy and strategy, ii) support the development of a Core Document for a 1-12 school sector, iii) support the piloting of the transition program in selected districts, and iv) support capacity building for the EFA implementation as required. International and domestic consultants will be recruited according to ADB’s Guidelines on the Use of Consultants as well

83
as other arrangements satisfactory to ADB for the engagement of domestic consultants.87 The consultants will be selected and engaged as individuals by the executing agency.88 The procurement of all goods and services under the TA grant will be undertaken in accordance with ADB’s Guidelines for Procurement. The TA grant will run concurrently during the whole ESDP I implementation period.
59. Monitoring and Reporting: The TA grant should submit quarterly progress and financial reports to ADB through an agreed upon mechanism. An audit of the TA grant should also be conducted annually and submitted to ADB within 9 months of the fiscal year’s end. ADB, through an agreed upon mechanism, will review the progress and performance of the TA grant semi-annually.
Component B - Overall Financing Plan
60. The Government has requested a program loan of $30 million equivalent from ADB’s special fund sources (ADF) as well as a grant of $8 million and a TA grant of $2 million, both from ADF. The program loan will finance Component A. The first grant will finance Component B while the TA grant will support capacity building for both components.
Table 1: Financing Plan
($ million)
Source Purpose Amount
A. ADF Program Loan To support EFA through JFA 30.0 B. ADF Grant To support preparation and transition to
1-12 sector 8.0 C. ADF TA Grant Capacity building for Component A & B 2.0 Total 40.0 ADF = Asian Development Fund, EFA = Education for All, TA = Technical Assistance Source: Asian Development Bank estimates
87 Outlines Terms of Reference for Consultants is in Supplementary Appendix 4.
88 The Government will further explore harmonizing use of TA resources among donors.

DOCUMENTS IN THE PROGRAM FILE ECD (Early Childhood Development) Title Project Agency Author Date An Assessment of progress towards education for all in Nepal
National Resource Centre for Non Formal Education (NRC-NFE) and Centre for Education for all (CEFA)
UNESCO / EFA Assessment 2000
T. M. Shakya 2002
ECD Mandala A framework for early childhood development curriculum
Seto Gurans National Child Development Services
Agatha Thapa 2002
What’s the difference? The Impact of Early Childhood Development Programs A study of the Effects for Children, their Families and Communities
Save the Children March 2003
Bringing up Children in a changing world Who’s right? Whose rights? Conversations with Families in Nepal
Save the Children / Unicef
Caroline Arnold / Sheridan Barlett / Joanna Hill / Chandrika Khatiwada / Pashupati Sapkota
2000
What’s the Difference An ECD Impact Study from Nepal
Save the Children 2003
What’s the Difference? The Impact of Early Childhood Development Programs A study from Nepal of the Effects fro Children, their Families and Communities
Save the Children 2003
Journal of Early Childhood Development TU CERID
2002
Seminar on Early Childhood Development TU CERID / UNICEF
May 29-30, 1997
Suggestion Action Steps Journal of Early Childhood Development Volume II
CERID
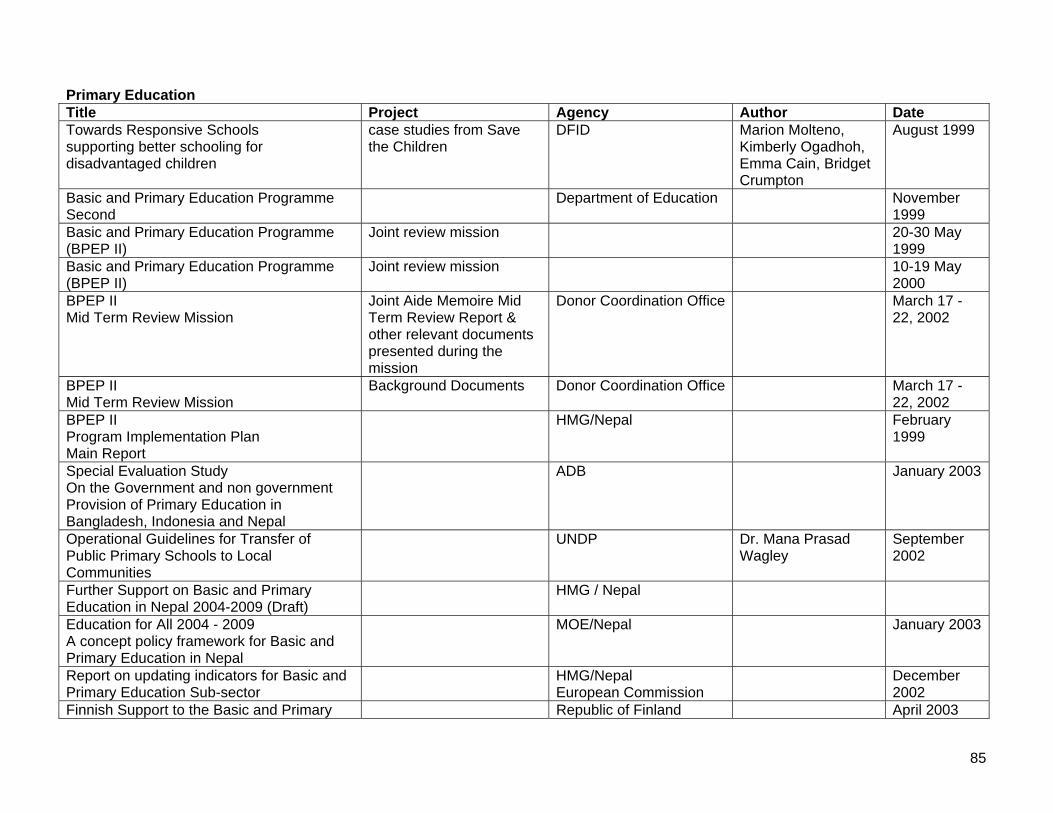
85
Primary Education Title Project Agency Author Date Towards Responsive Schools supporting better schooling for disadvantaged children
case studies from Save the Children
DFID Marion Molteno, Kimberly Ogadhoh, Emma Cain, Bridget Crumpton
August 1999
Basic and Primary Education Programme Second
Department of Education November 1999
Basic and Primary Education Programme (BPEP II)
Joint review mission 20-30 May 1999
Basic and Primary Education Programme (BPEP II)
Joint review mission 10-19 May 2000
BPEP II Mid Term Review Mission
Joint Aide Memoire Mid Term Review Report & other relevant documents presented during the mission
Donor Coordination Office March 17 - 22, 2002
BPEP II Mid Term Review Mission
Background Documents Donor Coordination Office March 17 - 22, 2002
BPEP II Program Implementation Plan Main Report
HMG/Nepal February 1999
Special Evaluation Study On the Government and non government Provision of Primary Education in Bangladesh, Indonesia and Nepal
ADB January 2003
Operational Guidelines for Transfer of Public Primary Schools to Local Communities
UNDP Dr. Mana Prasad Wagley
September 2002
Further Support on Basic and Primary Education in Nepal 2004-2009 (Draft)
HMG / Nepal
Education for All 2004 - 2009 A concept policy framework for Basic and Primary Education in Nepal
MOE/Nepal January 2003
Report on updating indicators for Basic and Primary Education Sub-sector
HMG/Nepal European Commission
December 2002
Finnish Support to the Basic and Primary Republic of Finland April 2003
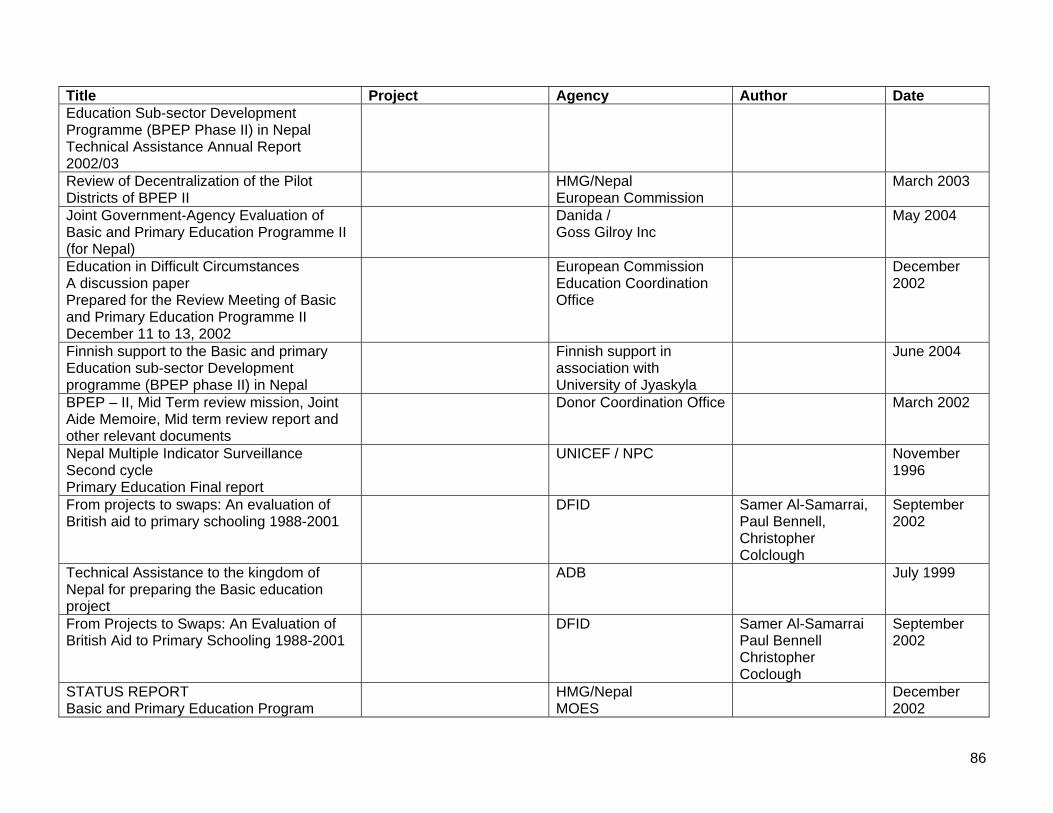
86
Title Project Agency Author Date Education Sub-sector Development Programme (BPEP Phase II) in Nepal Technical Assistance Annual Report 2002/03 Review of Decentralization of the Pilot Districts of BPEP II
HMG/Nepal European Commission
March 2003
Joint Government-Agency Evaluation of Basic and Primary Education Programme II (for Nepal)
Danida / Goss Gilroy Inc
May 2004
Education in Difficult Circumstances A discussion paper Prepared for the Review Meeting of Basic and Primary Education Programme II December 11 to 13, 2002
European Commission Education Coordination Office
December 2002
Finnish support to the Basic and primary Education sub-sector Development programme (BPEP phase II) in Nepal
Finnish support in association with University of Jyaskyla
June 2004
BPEP – II, Mid Term review mission, Joint Aide Memoire, Mid term review report and other relevant documents
Donor Coordination Office March 2002
Nepal Multiple Indicator Surveillance Second cycle Primary Education Final report
UNICEF / NPC November 1996
From projects to swaps: An evaluation of British aid to primary schooling 1988-2001
DFID Samer Al-Samarrai, Paul Bennell, Christopher Colclough
September 2002
Technical Assistance to the kingdom of Nepal for preparing the Basic education project
ADB July 1999
From Projects to Swaps: An Evaluation of British Aid to Primary Schooling 1988-2001
DFID Samer Al-Samarrai Paul Bennell Christopher Coclough
September 2002
STATUS REPORT Basic and Primary Education Program
HMG/Nepal MOES
December 2002
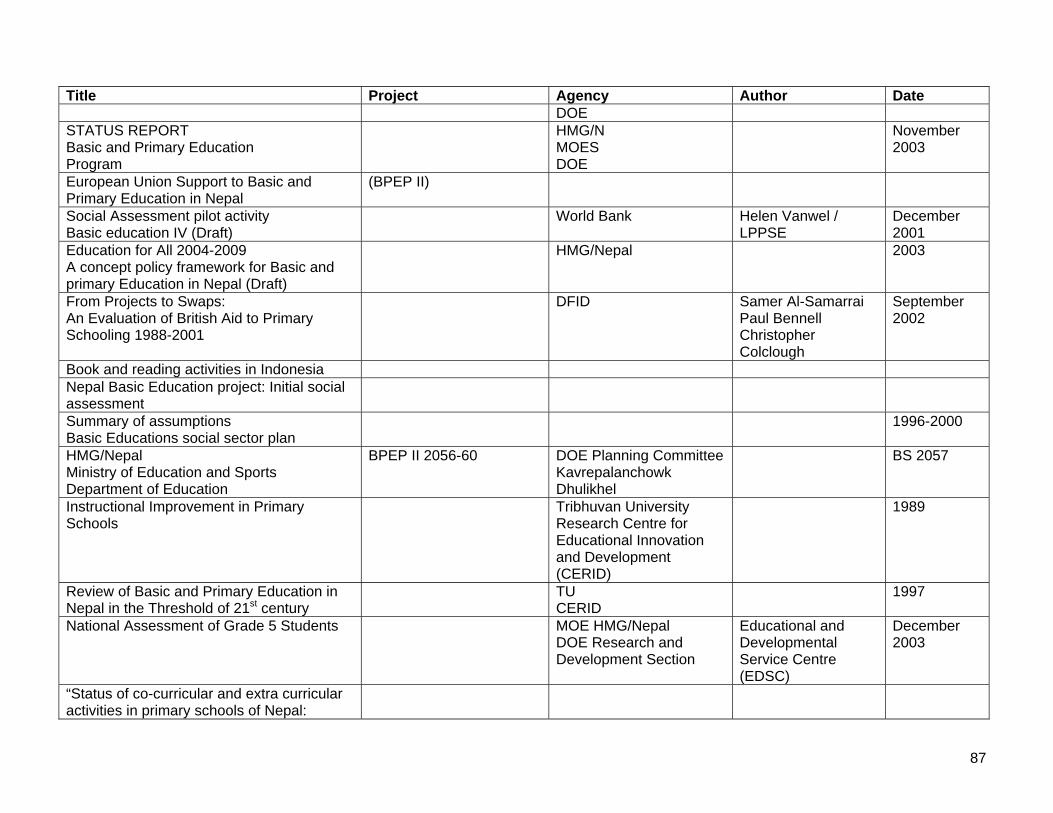
87
Title Project Agency Author Date DOE
STATUS REPORT Basic and Primary Education Program
HMG/N MOES DOE
November 2003
European Union Support to Basic and Primary Education in Nepal
(BPEP II)
Social Assessment pilot activity Basic education IV (Draft)
World Bank Helen Vanwel / LPPSE
December 2001
Education for All 2004-2009 A concept policy framework for Basic and primary Education in Nepal (Draft)
HMG/Nepal 2003
From Projects to Swaps: An Evaluation of British Aid to Primary Schooling 1988-2001
DFID Samer Al-Samarrai Paul Bennell Christopher Colclough
September 2002
Book and reading activities in Indonesia Nepal Basic Education project: Initial social assessment
Summary of assumptions Basic Educations social sector plan
1996-2000
HMG/Nepal Ministry of Education and Sports Department of Education
BPEP II 2056-60
DOE Planning Committee Kavrepalanchowk Dhulikhel
BS 2057
Instructional Improvement in Primary Schools
Tribhuvan University Research Centre for Educational Innovation and Development (CERID)
1989
Review of Basic and Primary Education in Nepal in the Threshold of 21st century
TU CERID
1997
National Assessment of Grade 5 Students MOE HMG/Nepal DOE Research and Development Section
Educational and Developmental Service Centre (EDSC)
December 2003
“Status of co-curricular and extra curricular activities in primary schools of Nepal:

88
Title Project Agency Author Date problem and prospects” Formulae for allocating public resources to primary school in Nepal
International Institute of Educational Planning
Shailendra P Sigdel June 2005
Secondary Primary Education Development Program Pre-appraisal working paper Volume 5
PEDP II 2003-2009
Secondary Primary Education Development Program Background paper Volume 1
PEDP II 2003-2008
Secondary / Lower Secondary Title Project Agency Author Date Secondary Education Support Programme Core Document
HMG/Nepal ADB / DANIDA
July 2002
Report and Recommendation of the President to the Board of Directors on a Proposed loan to the kingdom of Nepal for the Secondary Education Support Project
ADB August 2002
Report and recommendation of the president to the Board of Directors on a proposed loan to the Peoples republic of Bangladesh for the Second Primary Education Development Program (Sector Loan)
ADB October 2003
Secondary Education: Lessons and Strategies for improvement (Draft)
The World Bank November 1994
Secondary Education in Developing Countries
The World Bank
How to raise the effectiveness of secondary schools? Universal and Locally Tailored Investment Strategies
IBRD Bruce Fuller / Prema Clarke Harvard University
October 1993
Secondary Teacher Education Task Force Final Report
Secondary Education Sector Improvement Project
ADB April 2002
Secondary Education Development Plan Second Secondary HMG/Nepal / Cambridge November
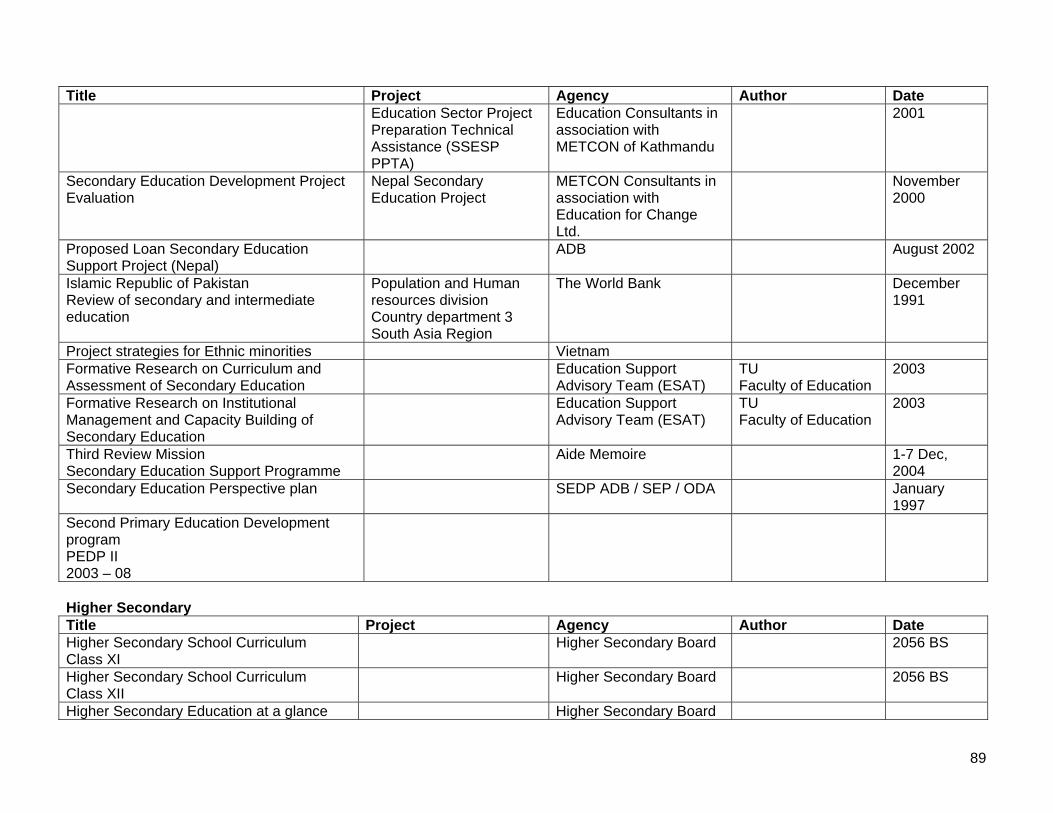
89
Title Project Agency Author Date Education Sector Project Preparation Technical Assistance (SSESP PPTA)
Education Consultants in association with METCON of Kathmandu
2001
Secondary Education Development Project Evaluation
Nepal Secondary Education Project
METCON Consultants in association with Education for Change Ltd.
November 2000
Proposed Loan Secondary Education Support Project (Nepal)
ADB August 2002
Islamic Republic of Pakistan Review of secondary and intermediate education
Population and Human resources division Country department 3 South Asia Region
The World Bank December 1991
Project strategies for Ethnic minorities Vietnam Formative Research on Curriculum and Assessment of Secondary Education
Education Support Advisory Team (ESAT)
TU Faculty of Education
2003
Formative Research on Institutional Management and Capacity Building of Secondary Education
Education Support Advisory Team (ESAT)
TU Faculty of Education
2003
Third Review Mission Secondary Education Support Programme
Aide Memoire 1-7 Dec, 2004
Secondary Education Perspective plan SEDP ADB / SEP / ODA January 1997
Second Primary Education Development program PEDP II 2003 – 08
Higher Secondary Title Project Agency Author Date Higher Secondary School Curriculum Class XI
Higher Secondary Board 2056 BS
Higher Secondary School Curriculum Class XII
Higher Secondary Board 2056 BS
Higher Secondary Education at a glance Higher Secondary Board

90
Education in Nepal, From rhetoric to reality Sampeshan (Newsletter) Higher Secondary Board January
2004 Higher Secondary Education Perspective Plan
MOE Secondary Education Development Project
Higher Secondary April 1999
Higher and Higher Secondary Education in Nepal – some facts and figure
The World Bank Dr. Mohan Pd Aryal March 2005
Tertiary (Higher Education) Title Project Agency Author Date Strategic issues in higher education development
Director General of Higher Education Ministry of National Education, Indonesia
Skilled Training (Vocational) Title Project Agency Author Date Technical assistance to the Kingdom of Nepal for preparing the Skills for Employment project
ADB December 2002
Tuvalu Education and Training sector report Draft
ADB April 2004
Non Formal Education Title Project Agency Author Date Non Formal Education Project preparatory
technical assistance ADB / Hawthorn Institute of Education, Australia / Cambridge Education Consultants Ltd / Ard Planning system Dhaka
October 1994
Socioeconomic profile Cross Cutting Teacher Education

91
Title Project Agency Author Date Research Teacher Education: New perspectives on Practice, Performance and Policy
Multi-site Teacher Education Research Project (MUSTER) Synthesis report
DFID Keith M Lewin and Janet S Stuart
March 2003
Loan 1840-NEP Teacher Education Project Loan Review Mission ADB The Mission comprised Ayako Inagaki, Education Specialist/Mission Leader, and Krishna Pandey, Senior Project Implementation Officer, Nepal Resident Mission
November 2004
Bangladesh: Initial Poverty and Social Analysis Secondary Education Teacher Training Project
Resources on Effective Schools and Teachers
World Bank Resource 2000
Report and recommendation of the president to the Board of Directors on a proposed loan to the Kingdom of Nepal for the Teacher Education Project
ADB August 2001
Monitoring of Teacher Training activities A report
HMG/Nepal MOES NCED
2004
Teacher Education HMG/Nepal MOES NCED
2061
Newsletter Primary Teacher Education Centre
Dhulikhel Kavre
Formative Research on Teacher Development of Secondary Education
Education Support Advisory Team (ESAT)
TU Faculty of Education
2003
Teacher Service Commission Examination paper for Teacher Service School Effectiveness: Head-teachers’ Leadership Suggested Action steps

92
Title Project Agency Author Date An analytical study of existing multi-grade and multi-class teaching practices in Nepal
Effective classroom teaching learning: School based assessment suggested action steps
Female Teachers in Primary Schools: Distribution pattern training and transfer suggested steps
Teacher Supply, Training and professional Development
1999
Education Acts and Regulations Title Project Agency Author Date Policy on Education ADB August 2002 Seventh Amendment of the Education Act, 1971 An Assessment
School of Education KU Dr. Kedar Nath Shrestha
December 2001
Education Act, 2028 (1971) HMG (Royal Seal) 9 August, 1971)
Education law and Act 2057 Education law and Act 2062 Communication Campaign and Advocacy Strategy 2002 Addressing the 7 Amendment to the Education Act, 2028 and Education Regulation 2059 Final Report March 15-Jan 15, 2003
Thompson Nepal Pvt Ltd Feb 2003
The Constitution of the Kingdom of Nepal 2047
1990
A step towards victim justice system Nepalese perspective
Dr. Shanker kumar Shrestha
Education strategy Title Project Agency Author Date Education Sector Strategy The World Bank 1999

93
Nepal Priorities and Strategies for Education Reform
The World Bank July 18, 2001
Finance Title Project Agency Author Date Human Development Reports Indicator Human Development Report
2003 UNDP 2003
Funding Scenarios for EFA 2004-09 Development Expenditure
The Ministry of Education and Sports
November 2003
Education Financing in a Decentralized Indonesia
Jennica Larrison and Ali Subandoro
February 2003
School Block Grant Principle Organization Structure and System Title Project Agency Author Date Promoting Institutional & Organizational Development
DFID March 2003
Education in Nepal HMG/Nepal 2003 Curriculum and Assessment Reform Institutional Framework and Technical Assistance Consultancy Report
Vic Zbar July 2001
Formative Research on Construction and Reconstruction of Learning Environment
Education Support Advisory Team (ESAT)
TU Faculty of Education
2003
EMIS (Education Management Information System) Title Project Agency Author Date Inception Report of Technical Assistance for Support for Decentralized Education Management
TA No. 3701-INO SAGRIC International June 2002
School-Based Management Education Information of Nepal 2001 MOE / Planning Division 2001 HMG/Nepal Ministry of Education and Sports Department of Education School Educational Statistics Form 2061 (2004) Research Title Project Agency Author Date

94
Title Project Agency Author Date Summary of HRP Project Hill Agriculture Research
Project (HARP) DFID July 2003
Reaching the Poor The ‘costs’ of sending children to school a six country comparative study
DFID Siobhan Boyle, Andy Brock, John Mace & Mo Sibbons
August 2002
Education for all Policy and Planning Lessons from Sri Lanka
DFID Angela W. Little January 2003
Poverty Reduction Outcomes in Education and Health, Public Expenditure and Aid
Result of ODI research presented in preliminary form for discussion and critical comment
ODI (Overseas Development Institute)
John Roberts April 2003
Education Research Evaluating Impact
DFID Veronica M’Kay & Carew Treffgarne
1999
Education Research Monitoring The performance of Educational programmes in Developing Countries
DFID Roy Carr-Hill with Mike Hopkins, Abby Riddell, John Lintott
1999
Education Research Educational Cost-Benefit Analysis
Overseas Development Administration
Professor J R Hough
Education Research Sector Wide Approaches to Education
A strategic analysis DFID Mike Ratcliffe and Murray Macrae (Ratcliffe and Macrae Association)
August 1999
Nepal cost sharing research in Education Cambridge Education consultants / Kathmandu Education Foundation
Technical Review of School Education in Nepal
November 2005
Policy Analysis
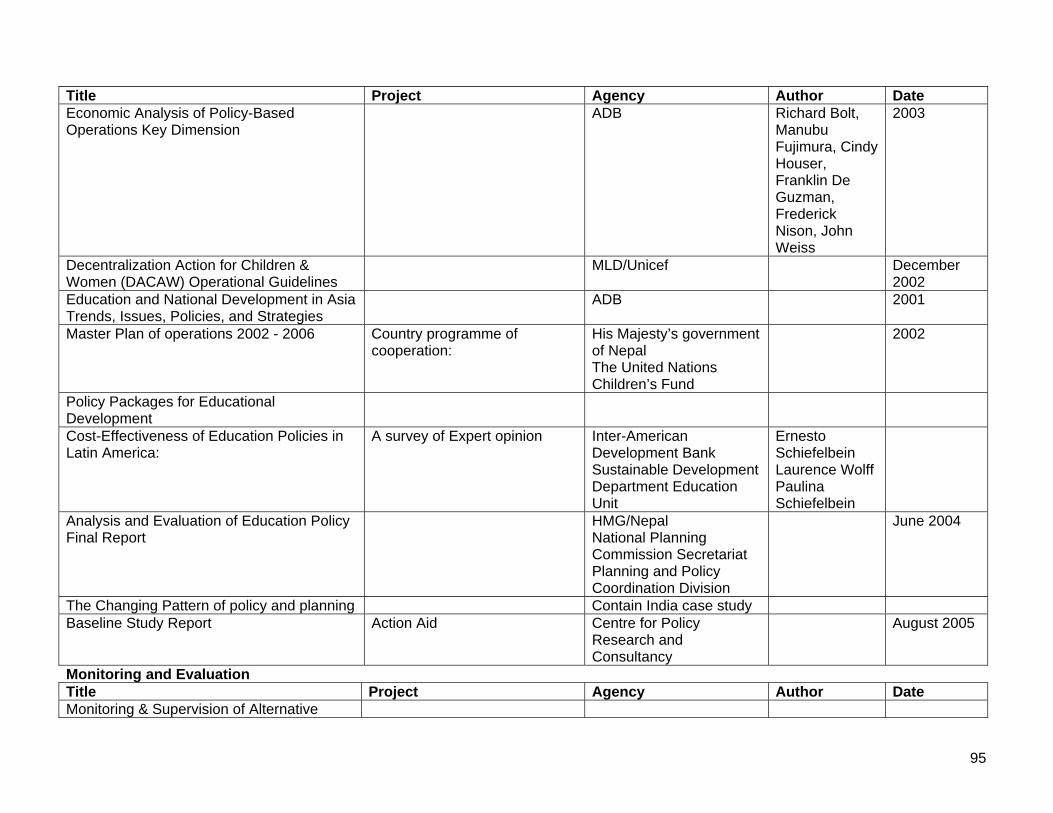
95
Title Project Agency Author Date Economic Analysis of Policy-Based Operations Key Dimension
ADB Richard Bolt, Manubu Fujimura, Cindy Houser, Franklin De Guzman, Frederick Nison, John Weiss
2003
Decentralization Action for Children & Women (DACAW) Operational Guidelines
MLD/Unicef December 2002
Education and National Development in Asia Trends, Issues, Policies, and Strategies
ADB 2001
Master Plan of operations 2002 - 2006 Country programme of cooperation:
His Majesty’s government of Nepal The United Nations Children’s Fund
2002
Policy Packages for Educational Development
Cost-Effectiveness of Education Policies in Latin America:
A survey of Expert opinion Inter-American Development Bank Sustainable Development Department Education Unit
Ernesto Schiefelbein Laurence Wolff Paulina Schiefelbein
Analysis and Evaluation of Education Policy Final Report
HMG/Nepal National Planning Commission Secretariat Planning and Policy Coordination Division
June 2004
The Changing Pattern of policy and planning Contain India case study Baseline Study Report Action Aid Centre for Policy
Research and Consultancy
August 2005
Monitoring and Evaluation Title Project Agency Author Date Monitoring & Supervision of Alternative

96
schooling program HIV/AIDS Title Project Agency Author Date An Assessment of the Impact of HIV/AIDS on the Education Sector in Nepal
Unicef / European Commission / Denmark
February 2003
Community School Support Project Title Project Agency Author Date Project Appraisal Document on a proposed credit in the amount of SDR 3.6 million (US$5.0 Million Equivalent)
Community School Support Project
World Bank June 2003
Community School Support Project Learning Innovation Loan Proposal
South Asia Region Human Development Sector
March 2003
Management Transfer of Community Schools Suggested Action Steps
Community Schools in the transformation Dr. Gajendra man Shrestha
Baseline survey of selected community managed and government managed public schools in selected districts
Volume – I Main report
The world bank New Era June 2005
Baseline survey of selected community managed and government managed public schools in selected districts
Volume – II Main report
The world bank New Era June 2005
Community Managed Schools (CMSs) Nepal Survey Report – 2005
Community School National Network (CSNN)
The World bank 2005
Community School Support Project Supervision Mission Aide-Memoir
16-21 July, 2004
Transfer of School Governance to Communities
A survey of Unaided Community Primary School
World Band Dr. Arbinda Lal Bhomi
Education for All Title Project Agency Author Date
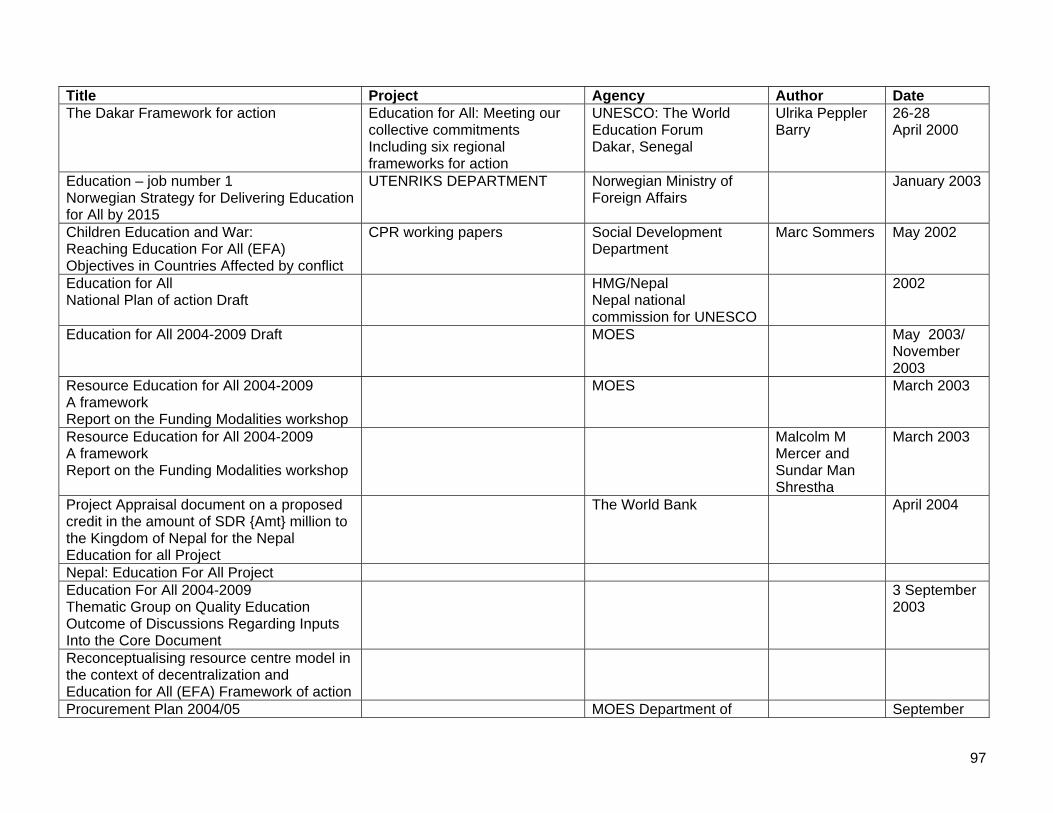
97
Title Project Agency Author Date The Dakar Framework for action
Education for All: Meeting our collective commitments Including six regional frameworks for action
UNESCO: The World Education Forum Dakar, Senegal
Ulrika Peppler Barry
26-28 April 2000
Education – job number 1 Norwegian Strategy for Delivering Education for All by 2015
UTENRIKS DEPARTMENT Norwegian Ministry of Foreign Affairs
January 2003
Children Education and War: Reaching Education For All (EFA) Objectives in Countries Affected by conflict
CPR working papers Social Development Department
Marc Sommers May 2002
Education for All National Plan of action Draft
HMG/Nepal Nepal national commission for UNESCO
2002
Education for All 2004-2009 Draft MOES May 2003/ November 2003
Resource Education for All 2004-2009 A framework Report on the Funding Modalities workshop
MOES March 2003
Resource Education for All 2004-2009 A framework Report on the Funding Modalities workshop
Malcolm M Mercer and Sundar Man Shrestha
March 2003
Project Appraisal document on a proposed credit in the amount of SDR {Amt} million to the Kingdom of Nepal for the Nepal Education for all Project
The World Bank April 2004
Nepal: Education For All Project Education For All 2004-2009 Thematic Group on Quality Education Outcome of Discussions Regarding Inputs Into the Core Document
3 September 2003
Reconceptualising resource centre model in the context of decentralization and Education for All (EFA) Framework of action
Procurement Plan 2004/05 MOES Department of September

98
Title Project Agency Author Date (Goods/Works/Services) Education (EFA) 2004 Final Report for Technical Review of the Education For All Monitoring System
Metcon consultants
Dr. Lekh Nath Belbase Dr. Badri Dev Pande Dr. Subarna lal Bajracharya
December 2004
Royal Danish Embassy EFA 2004-09
19 Oct, 2004
EFA Joint Review Mission • Monitoring, Evaluation and Supervision
Division • Physical Services Section EFA program • Technical Review of EFA Monitoring
System • Department of Education • Audit Report (Basic and Primary
Education Program) • Guidelines for the Distribution of
Scholarships • Financial Management
April 2005
EFA Global monitoring report UNESCO EFA EFA Status report 2005 MOES & DOE 2005 Vulnerable Community Development Plan for EFA 2004-2009
Kiran Bhatia Mark Turin
Feb 2004
Education for All 2004-09 Aide Memoire 2nd Consultative meeting
5-7 Dec 2005
Education for all Nepal Review from a conflict perspectives International Alert
March 2006
Agencies
Title Author Date
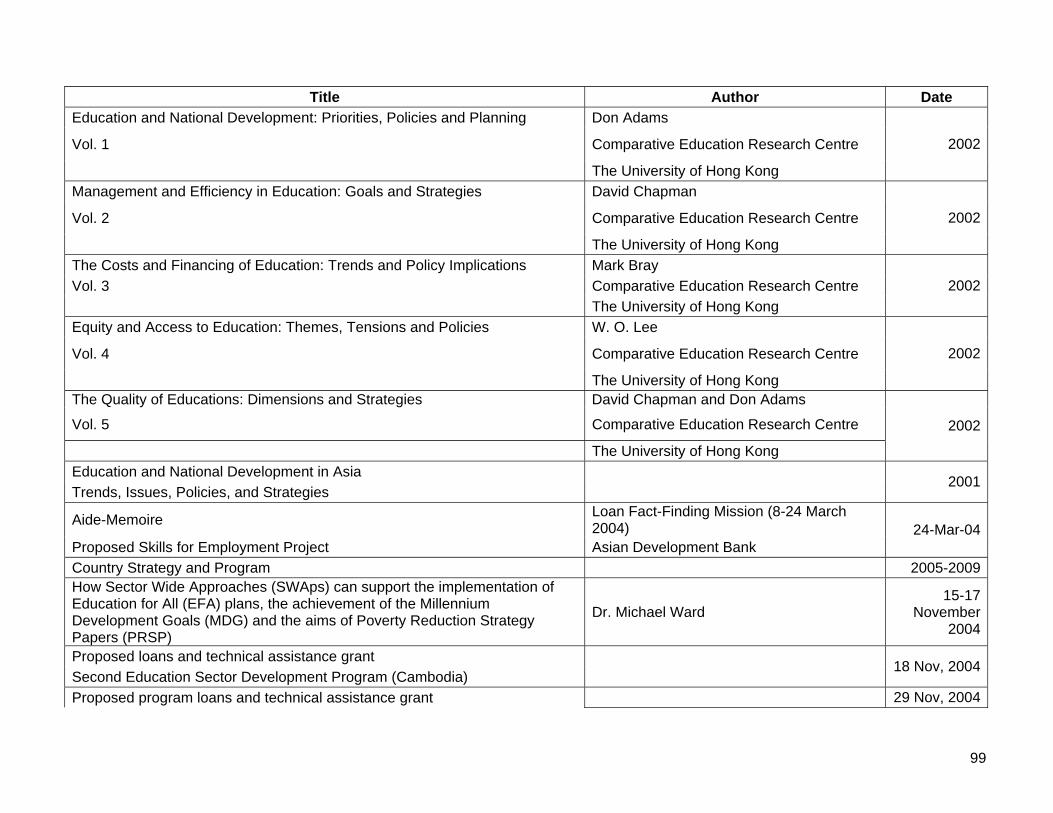
99
Title Author Date Education and National Development: Priorities, Policies and Planning Don Adams
Vol. 1 Comparative Education Research Centre
The University of Hong Kong
2002
Management and Efficiency in Education: Goals and Strategies David Chapman
Vol. 2 Comparative Education Research Centre
The University of Hong Kong
2002
The Costs and Financing of Education: Trends and Policy Implications Mark Bray Vol. 3 Comparative Education Research Centre The University of Hong Kong
2002
Equity and Access to Education: Themes, Tensions and Policies W. O. Lee
Vol. 4 Comparative Education Research Centre
The University of Hong Kong
2002
The Quality of Educations: Dimensions and Strategies David Chapman and Don Adams
Vol. 5 Comparative Education Research Centre
The University of Hong Kong
2002
Education and National Development in Asia Trends, Issues, Policies, and Strategies
2001
Aide-Memoire Loan Fact-Finding Mission (8-24 March 2004)
Proposed Skills for Employment Project Asian Development Bank 24-Mar-04
Country Strategy and Program 2005-2009 How Sector Wide Approaches (SWAps) can support the implementation of Education for All (EFA) plans, the achievement of the Millennium Development Goals (MDG) and the aims of Poverty Reduction Strategy Papers (PRSP)
Dr. Michael Ward 15-17
November 2004
Proposed loans and technical assistance grant Second Education Sector Development Program (Cambodia)
18 Nov, 2004
Proposed program loans and technical assistance grant 29 Nov, 2004

100
Title Author Date Punjab devolved social services program (Pakistan) Cambodia Education Sector Strategy Study 1996 Report and recommendation of the president to the board of directors on a proposed loan to the kingdom of Nepal for the SESP Aug-02
Proposed program loans, technical assistance loan, and Asian Development Fund Grand Islamic republic of Pakistan: Balochistan Devolved Social Services Program
Nov-05
Education Sector Strategy Study Cambodia
Asian Development Bank 1996
Final report: Asian Development Bank The Academy for Educational Development
Bangladesh: primary education sector Washington, DC &
Improvement project (PESIP) Data international Ltd., Dhaka Bangladesh
31-May-03
Technical Assistance to the kingdom of Nepal for preparing the Basic Education Project Jul-99
Capacity for Results Management A Guide for conducting a rapid assessment of the capacity of Developing member countries to manage for results
2006
An Introduction to results management Principles, Implications and Applications 2006
Juliet Hunt Shireen Lateef Gender Equality Results in ADB project Ava Shrestha
Apr-05
Report and Recommendation of the President to the Board of Directors on a Proposed Loan to the Kingdom of Nepal for the Secondary Education Support Project
Aug-02
Report and Recommendation of the President to the Board of Directors on a Proposed Loan to the People's Republic of Bangladesh for the Second Primary Education Development Program (Sector Loan)
Oct-03
Report and Recommendation of the President to the Board of Directors on Proposed Loan to the Kingdom of Nepal for Skills for Employment Project Oct-04
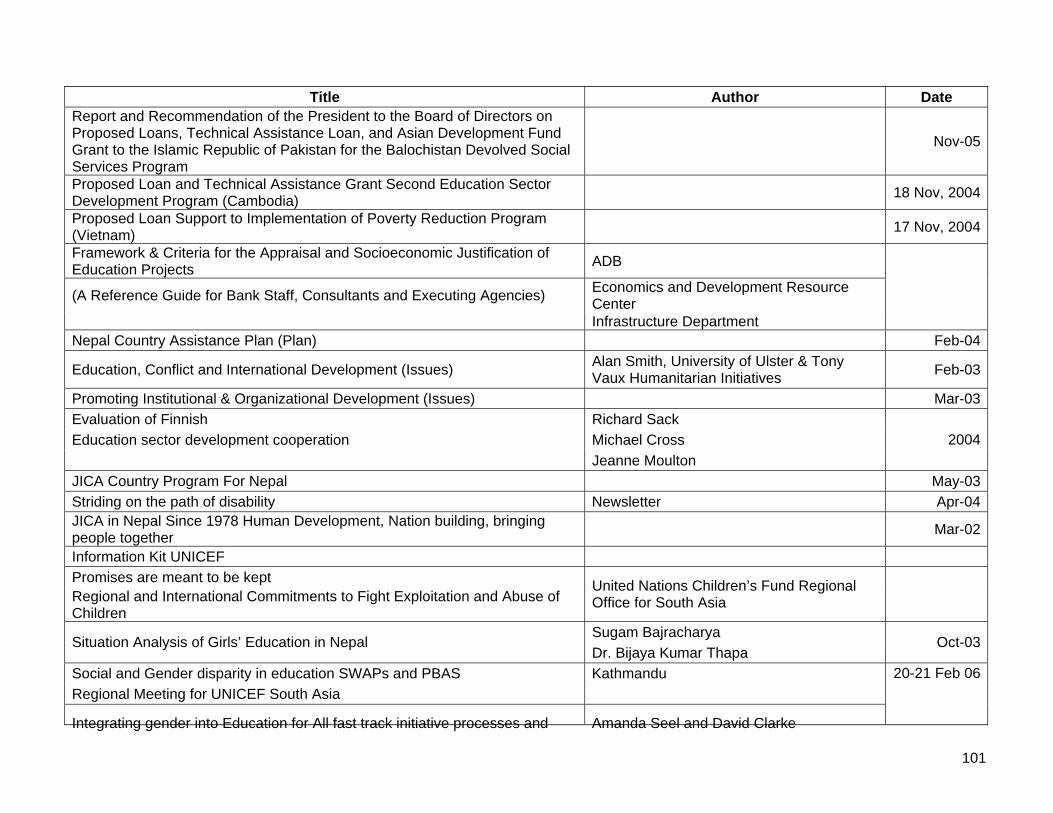
101
Title Author Date Report and Recommendation of the President to the Board of Directors on Proposed Loans, Technical Assistance Loan, and Asian Development Fund Grant to the Islamic Republic of Pakistan for the Balochistan Devolved Social Services Program
Nov-05
Proposed Loan and Technical Assistance Grant Second Education Sector Development Program (Cambodia) 18 Nov, 2004
Proposed Loan Support to Implementation of Poverty Reduction Program (Vietnam) 17 Nov, 2004
Framework & Criteria for the Appraisal and Socioeconomic Justification of Education Projects ADB
(A Reference Guide for Bank Staff, Consultants and Executing Agencies) Economics and Development Resource Center
Infrastructure Department
Nepal Country Assistance Plan (Plan) Feb-04
Education, Conflict and International Development (Issues) Alan Smith, University of Ulster & Tony Vaux Humanitarian Initiatives Feb-03
Promoting Institutional & Organizational Development (Issues) Mar-03 Evaluation of Finnish Richard Sack Education sector development cooperation Michael Cross Jeanne Moulton
2004
JICA Country Program For Nepal May-03 Striding on the path of disability Newsletter Apr-04 JICA in Nepal Since 1978 Human Development, Nation building, bringing people together Mar-02
Information Kit UNICEF Promises are meant to be kept Regional and International Commitments to Fight Exploitation and Abuse of Children
United Nations Children’s Fund Regional Office for South Asia
Sugam Bajracharya Situation Analysis of Girls’ Education in Nepal
Dr. Bijaya Kumar Thapa Oct-03
Social and Gender disparity in education SWAPs and PBAS Kathmandu Regional Meeting for UNICEF South Asia
Integrating gender into Education for All fast track initiative processes and Amanda Seel and David Clarke
20-21 Feb 06
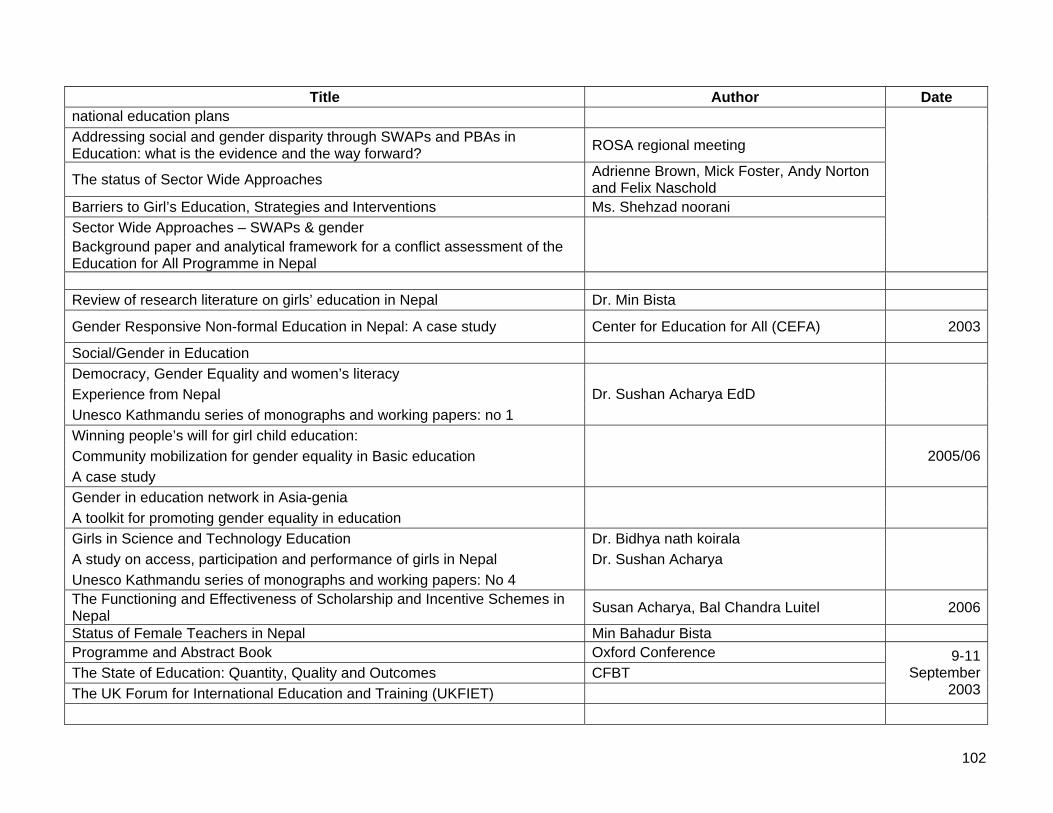
102
Title Author Date national education plans Addressing social and gender disparity through SWAPs and PBAs in Education: what is the evidence and the way forward? ROSA regional meeting
The status of Sector Wide Approaches Adrienne Brown, Mick Foster, Andy Norton and Felix Naschold
Barriers to Girl’s Education, Strategies and Interventions Ms. Shehzad noorani Sector Wide Approaches – SWAPs & gender Background paper and analytical framework for a conflict assessment of the Education for All Programme in Nepal
Review of research literature on girls’ education in Nepal Dr. Min Bista
Gender Responsive Non-formal Education in Nepal: A case study Center for Education for All (CEFA) 2003
Social/Gender in Education Democracy, Gender Equality and women’s literacy Experience from Nepal Unesco Kathmandu series of monographs and working papers: no 1
Dr. Sushan Acharya EdD
Winning people’s will for girl child education: Community mobilization for gender equality in Basic education A case study
2005/06
Gender in education network in Asia-genia A toolkit for promoting gender equality in education
Girls in Science and Technology Education Dr. Bidhya nath koirala A study on access, participation and performance of girls in Nepal Dr. Sushan Acharya Unesco Kathmandu series of monographs and working papers: No 4
The Functioning and Effectiveness of Scholarship and Incentive Schemes in Nepal Susan Acharya, Bal Chandra Luitel 2006
Status of Female Teachers in Nepal Min Bahadur Bista Programme and Abstract Book Oxford Conference The State of Education: Quantity, Quality and Outcomes CFBT The UK Forum for International Education and Training (UKFIET)
9-11 September
2003

103
Title Author Date VSO Nepal Country Strategic Plan Executive Summary VSO Nepal Education Programme Area Plan Minimum Standards: A conceptual introduction and country examples Bangladesh Education Sector Review I Bangladesh Education Sector Review II Colombia’s Targeted Education Voucher Program: Elizabeth King Features, Coverage, and participation Laura Rawlings Marybell Gutierrea Carlos Pardo Carlos Torres
Sep-97
Nepal Public Expenditure Review (In Five Volumes) Volume I: Per Overview – The Main Report
11-Apr-00
Higher Education Project II Draft project concept note
18-Oct-04
Jennie Litvack Junaid Ahmad Rethinking decentralization in Developing countries Richard Bird
The British council Development of Strategies for Educational Finance
Indonesia 18-Mar-02
Learning outcomes and school cost-effectiveness in Mexico: Gladys Lopex Acevedo The Pare Program The world Bank
Deon Filmer Development Research Group If you build it, will they come? School Availability and School Enrolments in 21
poor countries The World Bank Jun-04
World development report 2006-03-20 Equity and Development The World Bank 2006
Report from the seminar on sector wide approaches in Education, held at the Ministry of Education, Youth and sports (MoES) of Cambodia, Phnom Penth Sep-00
Sector wise approaches [email protected]
The “SWAP”: one financial strategy for educational development in Nepal Mary Ann Maslak May-01

104
Title Author Date St. John’s University
Sector Wide Approaches to Education A Strategic Analysis (Draft) Ratcliffe Macrae Associates Mar-99
Preparing fro SWAP
The Status of sector wide approaches Adrienne Brown, Mick Foster, Andy Norton and Felex Naschold
Ministry of Education, Youth and sports Sector Wide Approach Kingdom of Cambodia
2001
Rethinking Education AID From project to program to sector-wide support Lene Buchert Dec-00
Sector Wide Approaches Jan-02 Education Sector Support Program 2001/5 A descriptive analysis of the disparities in school performance in the SLC exam 1 MOES/ESAT
A comparative study of school leaving examination in SAARC countries 2 Financial Analysis of SLC examination system 3 Institutional Analysis of the office of the controller of examination (OCE) 4 An analysis of the processes involved in preparation and execution of SLC 5 An analysis of technical quality of the test materials in SLC 6 Public perceptions of the school leaving certificate (SLC) examination in Nepal: A study based on print media coverage 7
Historical genealogy of the office of the controller of the examination system 8 An analysis of assessment and examination practices at the school level 9 Tracer study of secondary school leavers 10 Equity analysis of SLC examination 11 Case study of “Effective and ineffective schools” 12 Determinations of student performance in SLC examination 13 Formative Research on Teacher Development of Secondary Education
Mr. Tirtha Raj Parajuli, Ph.D Bharat Bilas Pant Curriculum Development Centre National Curriculum Framework for School Education (K-12) in Nepal
MOES
15 July, 2004
Bidhya Nath Koirala Around Contemporary Educational Issues: The opinion of School Teachers of Nepal Sushan Acharya
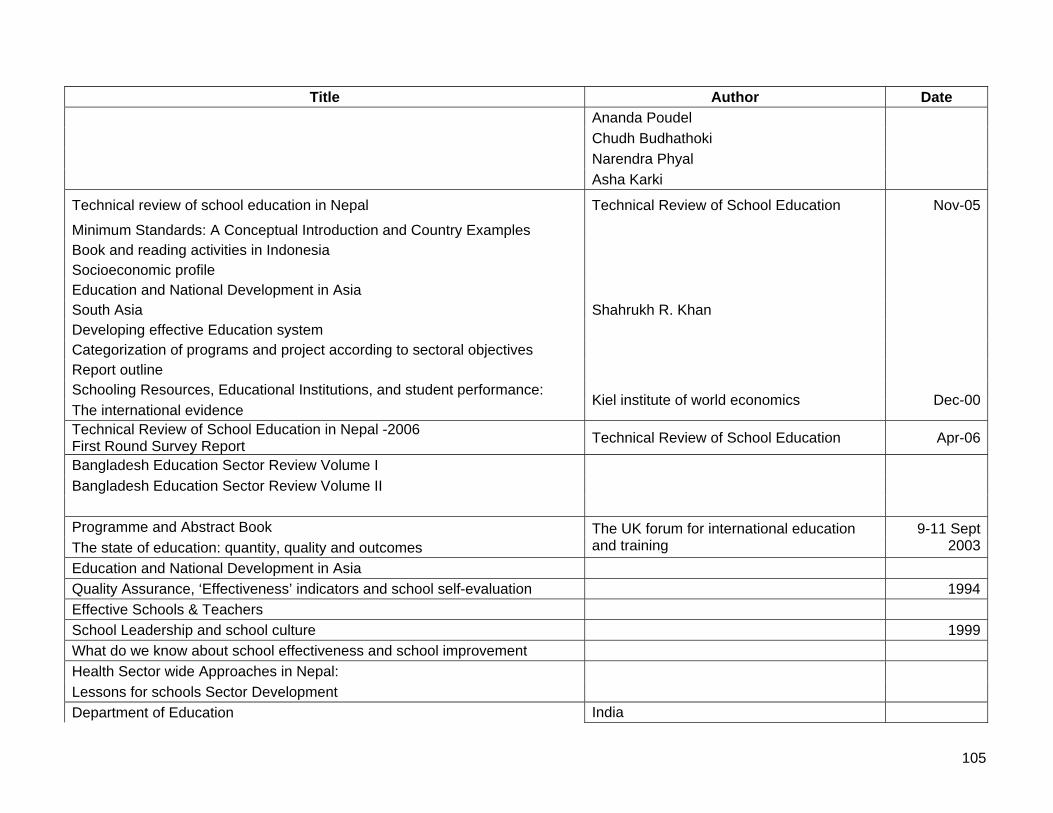
105
Title Author Date Ananda Poudel Chudh Budhathoki Narendra Phyal Asha Karki
Technical review of school education in Nepal Technical Review of School Education Nov-05
Minimum Standards: A Conceptual Introduction and Country Examples Book and reading activities in Indonesia Socioeconomic profile Education and National Development in Asia South Asia Shahrukh R. Khan Developing effective Education system Categorization of programs and project according to sectoral objectives Report outline Schooling Resources, Educational Institutions, and student performance: The international evidence
Kiel institute of world economics Dec-00
Technical Review of School Education in Nepal -2006 First Round Survey Report Technical Review of School Education Apr-06
Bangladesh Education Sector Review Volume I Bangladesh Education Sector Review Volume II
Programme and Abstract Book The state of education: quantity, quality and outcomes
The UK forum for international education and training
9-11 Sept 2003
Education and National Development in Asia Quality Assurance, ‘Effectiveness’ indicators and school self-evaluation 1994 Effective Schools & Teachers School Leadership and school culture 1999 What do we know about school effectiveness and school improvement Health Sector wide Approaches in Nepal: Lessons for schools Sector Development
Department of Education India
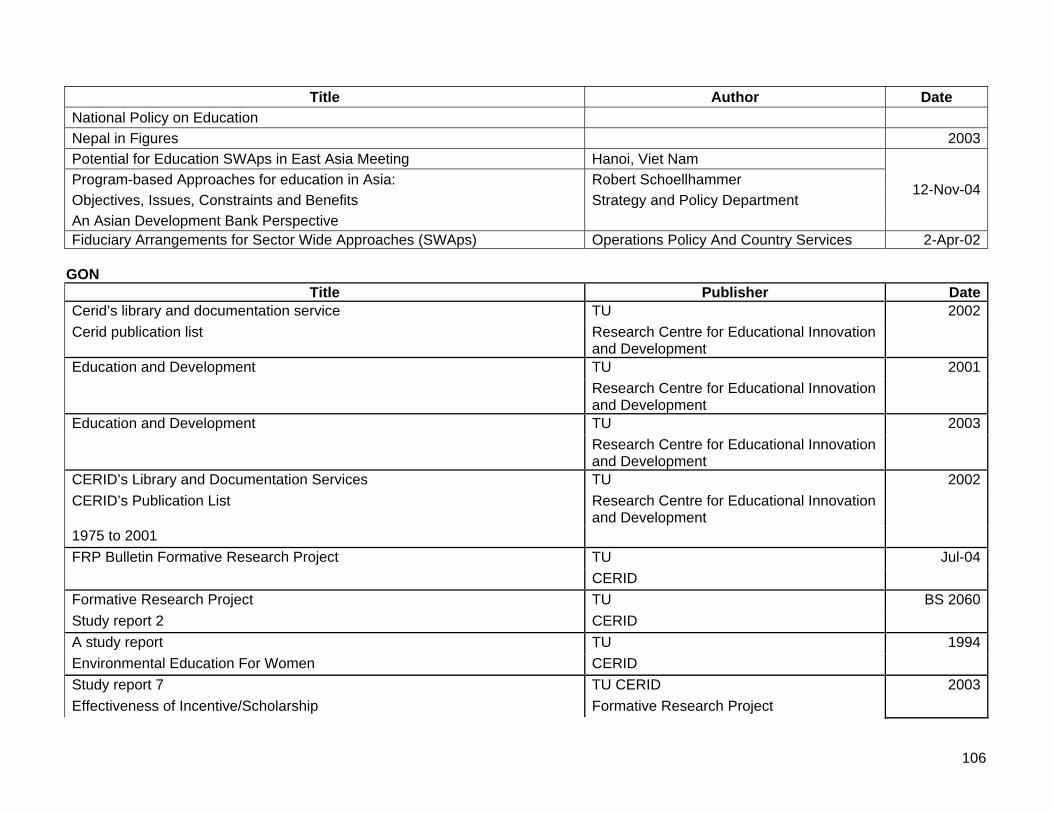
106
Title Author Date National Policy on Education Nepal in Figures 2003 Potential for Education SWAps in East Asia Meeting Hanoi, Viet Nam Program-based Approaches for education in Asia: Robert Schoellhammer Objectives, Issues, Constraints and Benefits Strategy and Policy Department An Asian Development Bank Perspective
12-Nov-04
Fiduciary Arrangements for Sector Wide Approaches (SWAps) Operations Policy And Country Services 2-Apr-02 GON
Title Publisher Date Cerid’s library and documentation service TU Cerid publication list Research Centre for Educational Innovation
and Development
2002
TU Education and Development Research Centre for Educational Innovation and Development
2001
TU Education and Development Research Centre for Educational Innovation and Development
2003
CERID’s Library and Documentation Services TU CERID’s Publication List Research Centre for Educational Innovation
and Development 1975 to 2001
2002
TU FRP Bulletin Formative Research Project CERID
Jul-04
Formative Research Project TU Study report 2 CERID
BS 2060
A study report TU Environmental Education For Women CERID
1994
Study report 7 TU CERID Effectiveness of Incentive/Scholarship Formative Research Project
2003
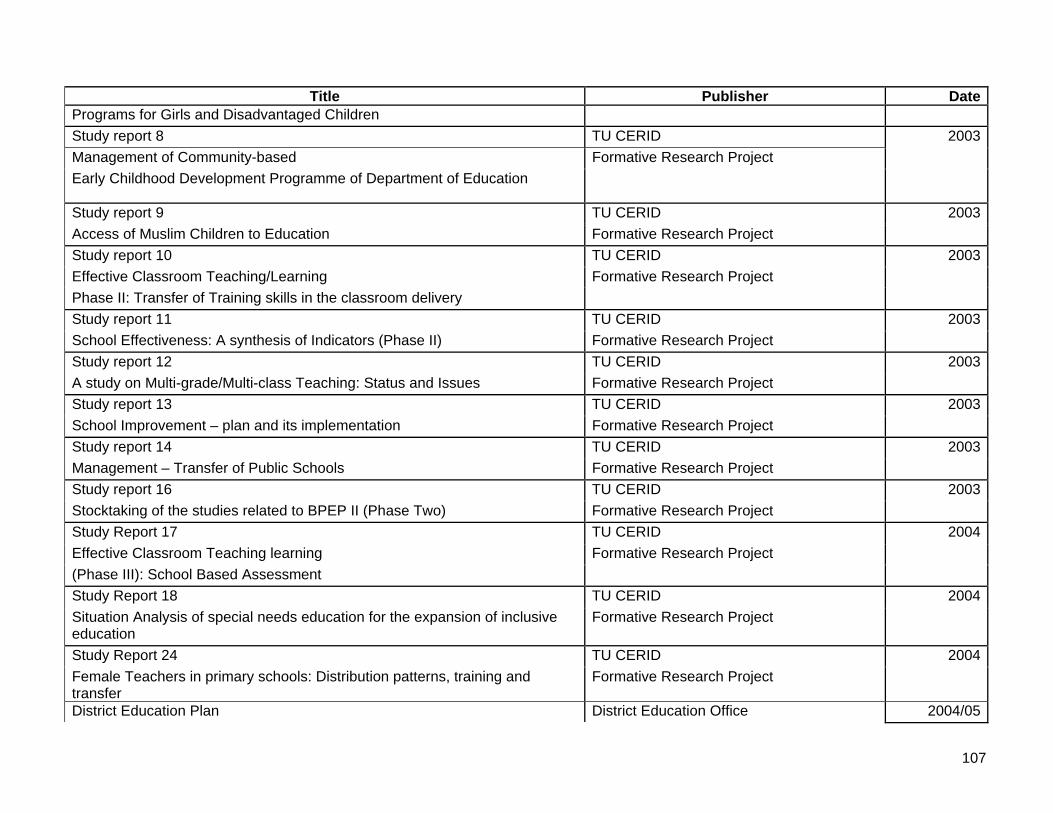
107
Title Publisher Date Programs for Girls and Disadvantaged Children Study report 8 TU CERID Management of Community-based Formative Research Project Early Childhood Development Programme of Department of Education
2003
Study report 9 TU CERID Access of Muslim Children to Education Formative Research Project
2003
Study report 10 TU CERID Effective Classroom Teaching/Learning Formative Research Project Phase II: Transfer of Training skills in the classroom delivery
2003
Study report 11 TU CERID School Effectiveness: A synthesis of Indicators (Phase II) Formative Research Project
2003
Study report 12 TU CERID A study on Multi-grade/Multi-class Teaching: Status and Issues Formative Research Project
2003
Study report 13 TU CERID School Improvement – plan and its implementation Formative Research Project
2003
Study report 14 TU CERID Management – Transfer of Public Schools Formative Research Project
2003
Study report 16 TU CERID Stocktaking of the studies related to BPEP II (Phase Two) Formative Research Project
2003
Study Report 17 TU CERID Effective Classroom Teaching learning Formative Research Project (Phase III): School Based Assessment
2004
Study Report 18 TU CERID Situation Analysis of special needs education for the expansion of inclusive education
Formative Research Project 2004
Study Report 24 TU CERID Female Teachers in primary schools: Distribution patterns, training and transfer
Formative Research Project 2004
District Education Plan District Education Office 2004/05

108
Title Publisher Date NIEPA – Nepal Project Dadeldhura District Development Council, Dadeldhura HMG/Nepal Status Report Department of Education Secondary Education Support Program Monitoring and Supervision Section Sanothimi, Bhaktapur
Nov-04
Procurement Plan 2004/05 Department of Education (Goods/Works/Services) Secondary Education Support Program
(SESP) MOES/DOE/NCED/OEC
Nov-04
Procurement Plan 2004/05 Department of Education (Goods/Works/Services) Secondary Education Support Program
(SESP) MOES/DOE/NCED/OEC
Nov-04
Department of Education Research and Education Management Information Section
School Level Educational Statistics of Nepal Flash Report I
Sanothimi, Bhaktapur
Nov-04
Ministry of Education and Sports Department of Education Programme and Budget Section Sanothimi, Bhaktapur
Annual Strategic Implementation Plan 2005-2006
12-Apr-05
Programme Implementation Manual EFA 2061 SESP CSSP
2005
Ministry of Education and Sports Department of Education Programme and Budget Section
Annual Strategic Implementation Plan 2003-04
Sanothimi, Bhaktapur
Mar-03
Flash report I Ministry of Education and Sports 2005 (2062)

109
Title Publisher Date Department of Education Statistics Section Sanothimi, Bhaktapur
Secondary Education Support program Ministry of Education and Sports Status report 2005 Department of Education Statistics Section Sanothimi, Bhaktapur
5-Nov
National Assessment of Grade 5 students, 2003 2003 Ministry of Education and Sports Department of Education Budget and Programme Section
Annual Strategic Implementation Plan (ASIP)
Sanothimi, Bhaktapur
2006-2007
District wise Program in FY 2062/063 (In Nepali Version) Department of Education
Annual Strategic Implementation Plan 2006-2007 Ministry of Education and Sports Department of Education Programme and Budget Section Sanothimi, Bhaktapur
Flash report II Ministry of Education and Sports 2061 Department of Education (2004-06) Sanothimi, Bhaktapur
Dec-05
School Grants Operation Guidelines Situation Analysis of special needs education program for the Expansion of inclusive education (Action Step)
Department of Education Statistics Section
School Level Educational Statistics of Nepal
Sanothimi, Bhaktapur
2002 (2059 BS)
Annual Strategic Implementation Plan for School Level Education (Draft)
2003/04
Department of Education Planning and Monitoring Section
Annual Strategic Implementation Plan
Sanothimi, Bhaktapur
2004-2005
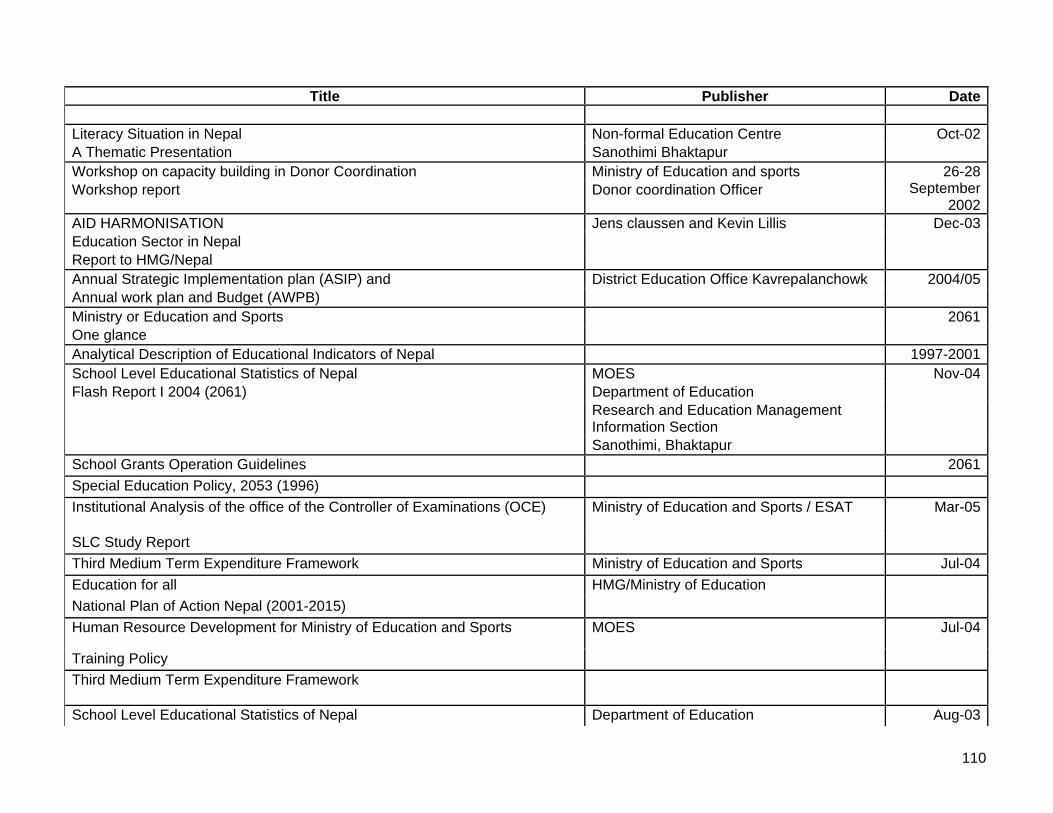
110
Title Publisher Date
Literacy Situation in Nepal Non-formal Education Centre A Thematic Presentation Sanothimi Bhaktapur
Oct-02
Workshop on capacity building in Donor Coordination Ministry of Education and sports Workshop report Donor coordination Officer
26-28 September
2002 AID HARMONISATION Education Sector in Nepal Report to HMG/Nepal
Jens claussen and Kevin Lillis Dec-03
Annual Strategic Implementation plan (ASIP) and Annual work plan and Budget (AWPB)
District Education Office Kavrepalanchowk 2004/05
Ministry or Education and Sports One glance
2061
Analytical Description of Educational Indicators of Nepal 1997-2001 School Level Educational Statistics of Nepal MOES Flash Report I 2004 (2061) Department of Education Research and Education Management
Information Section Sanothimi, Bhaktapur
Nov-04
School Grants Operation Guidelines 2061 Special Education Policy, 2053 (1996) Institutional Analysis of the office of the Controller of Examinations (OCE)
SLC Study Report
Ministry of Education and Sports / ESAT Mar-05
Third Medium Term Expenditure Framework Ministry of Education and Sports Jul-04 Education for all National Plan of Action Nepal (2001-2015)
HMG/Ministry of Education
Human Resource Development for Ministry of Education and Sports
Training Policy
MOES Jul-04
Third Medium Term Expenditure Framework
School Level Educational Statistics of Nepal Department of Education Aug-03
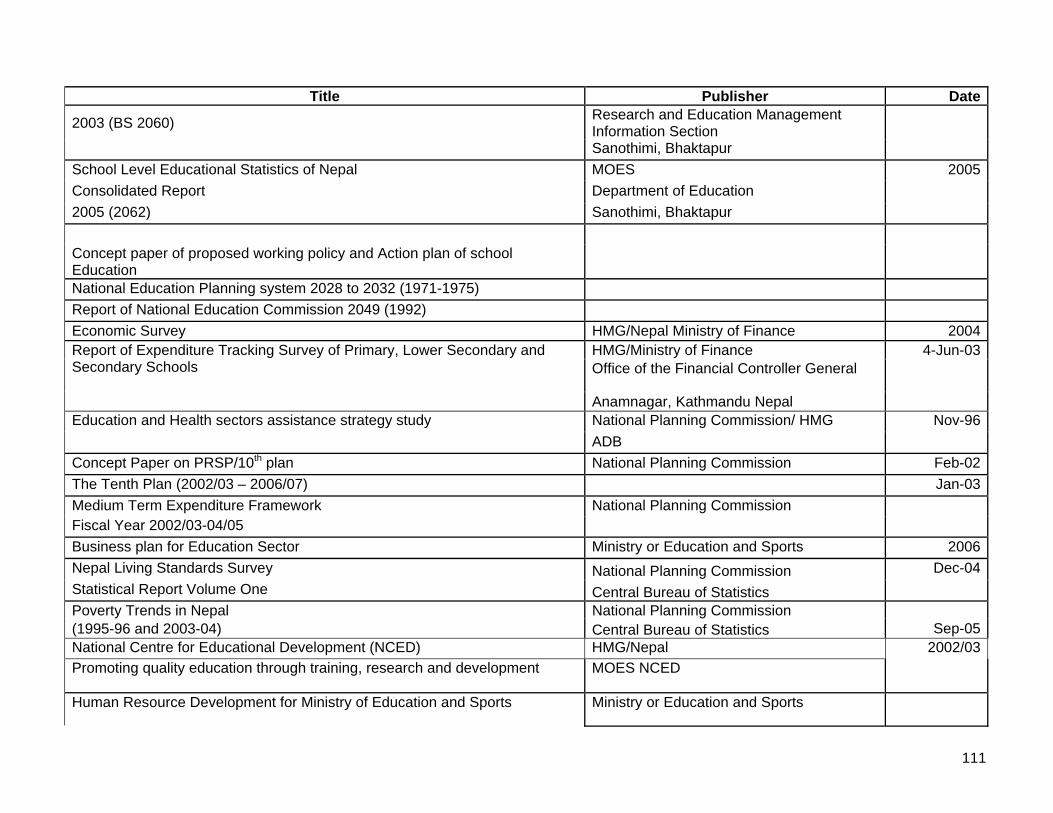
111
Title Publisher Date
2003 (BS 2060) Research and Education Management Information Section
Sanothimi, Bhaktapur School Level Educational Statistics of Nepal MOES Consolidated Report Department of Education 2005 (2062) Sanothimi, Bhaktapur
2005
Concept paper of proposed working policy and Action plan of school Education
National Education Planning system 2028 to 2032 (1971-1975) Report of National Education Commission 2049 (1992) Economic Survey HMG/Nepal Ministry of Finance 2004
HMG/Ministry of Finance Office of the Financial Controller General
Report of Expenditure Tracking Survey of Primary, Lower Secondary and Secondary Schools
Anamnagar, Kathmandu Nepal
4-Jun-03
National Planning Commission/ HMG Education and Health sectors assistance strategy study ADB
Nov-96
Concept Paper on PRSP/10th plan National Planning Commission Feb-02 The Tenth Plan (2002/03 – 2006/07) Jan-03 Medium Term Expenditure Framework Fiscal Year 2002/03-04/05
National Planning Commission
Business plan for Education Sector Ministry or Education and Sports 2006 Nepal Living Standards Survey National Planning Commission Statistical Report Volume One Central Bureau of Statistics
Dec-04
Poverty Trends in Nepal National Planning Commission (1995-96 and 2003-04) Central Bureau of Statistics Sep-05 National Centre for Educational Development (NCED) HMG/Nepal Promoting quality education through training, research and development MOES NCED
2002/03
Human Resource Development for Ministry of Education and Sports Ministry or Education and Sports

112
Title Publisher Date Training Policy Ministry of Education and Sports National Centre for Education Development (NCED)
Institutional Capacity Building Plan (ICBP) of NCED
Aug-05
New Era Annual Report New Era 2003 Secondary Education Support Program (Teacher Development & Management Training for HT) Status report
NCED 29-Nov-05
A Thematic Paper-1 on Project Design, Scope and Execution Prepared for Mid-term Review Mission (June/July 2006)
NCED Apr-06
A Thematic Paper-2 on Training Implementation Arrangement, Strategies and Remedies Prepared for Mid-term Review Mission (June/July 2006)
NCED Apr-06
A Thematic Paper-3 on Assessment of Project Strategies and Programs on Promoting Female/DAG Prepared for Mid-term Review Mission (June/July 2006)
NCED Apr-06
Institutional Capacity Building Plan (ICVP) of NCED (2nd Draft) NCED Aug-05 Secondary Education Support Program (SESP) (Teacher Development and Management Training for HT) Status Report
NCED 29th Nov, 2005
Resource requirement for Effective Schools Realities of effective as well as ineffective schools Effective Schools and Teachers What do we know about school effectiveness and school improvement
Concept paper on PRSP/10th Plan
10/16/2058
Action Steps Situation Analysis of special needs education program for the Expansion of inclusive Education
Concept paper of proposed working policy and Action plan of school education
2001

113
Title Publisher Date Nepal Development forum Education
2004
Conflict Research Consortium Article summary “Overcoming Barriers to Principled negotiation”
William Ury 1990
Higher Secondary Education Board (HSEB) Higher Secondary Education Perspective Plan Framework (2006-2020)
Sanothimi, Bhaktapur
2005
Audit Report Office of the Auditor General Mar-06 Expenditure Tracking Survey of Primary, Lower Secondary and Secondary Schools Office of the Financial Comptroller General
Documents Title Publisher Date Appraisal Aide Memoire March 2004 EFA Joint Appraisal Preparation Education Thematic Group Preparation Thematic Groups Joint Local Donor Group (JLDG) Donor Harmonization Evaluation BPEP/EFA Joint Review Mission
March 2004
Godavari Workshop on Donor coordination 26-28 September 2002
JTR December 2002
Education for All 2004-2009 A concept policy framework for Basic and Primary Education in Nepal
Ministry of Education & Sports 2003
HIV/AIDs UNESCO EFA National plan for action Modalities workshop 25-
26February

114
Title Publisher Date 2003
Joint Field Monitoring visit March mission 2003 BPEP II Joint Aide Memoire 2003 UNICEF Concept paper core document Draft 1 Education for All 2004-2009
April 2003
BPEP II JTR November 2003
Appraisal 26 Nov - 5 Dec 2003
Technical Mission January 2004
SESP JRM November 2003
Higher Education Project II Education in Nepal Nepal National Education Commission, 2011 B.S. (1954)
National Education Planning System 2028 to 2032 (1971 – 1975) Report of National Education Commission 2049 (1992)
The Failure of input-based schooling policies Eric A Hanushek Developing a Policy Framework For Effective Schools Overview of Process and Preliminary Findings
Mr. Ram Sarobar Dubey 9-Feb-06
School financing System for Effective Schools Mr. Ram Balak Singh Agreement
Title Author Date
Development Credit Agreement Kingdom of Nepal and International Development Association Aug-04
Joint Financing Agreement
Education for All
DFID, MOFA of Finland, Norway, Denmark IDA and collectively referred to as the "Pooling Donors"
2004-2009
Education for All Program MOF British 12-Oct-04

115
Embassy
Bhanu Prasad Acharya Keith Bloomfield
Education for All Program (Cr. 3956-NEP): The World Bank DOE
Comments on Audit Report for FY 2004/05 Isak Froumin Janardan Nepal
19-May-06
MOF Royal Danish Embassy Subject about Agreed Minutes between HMG and Government of the
Kingdom of Denmark Bhanu Prasad Acharya Gert Meinecke 24-Sep-04
Electronic documents
Education Act
Child Labour (Prohibition and Regulation) Act_ 2056 Children Act_2048 CIVIL SERVICE ACT 2049 (1992) Education Act 2028-1971 Higher Secondary Education Act_2046 Local Self Governance Act_ 2055 Pokhara University Act_ 2053 Scholarship Act_ 2021 The Administrative Procedures (Regulation) Act_ 2013 The National Education Committee Act. 2028 The University Grants Commission Act_ 2050 By Law Janak Education Material Centre Limited Financial Administration Circular Auditing of Primary Schools Deputation_ Leave and Salary and Allowances to Teachers Direction Direction 2060 Directives Grant of approval of school operation Implementation of Decisions Information Management of Community Schools
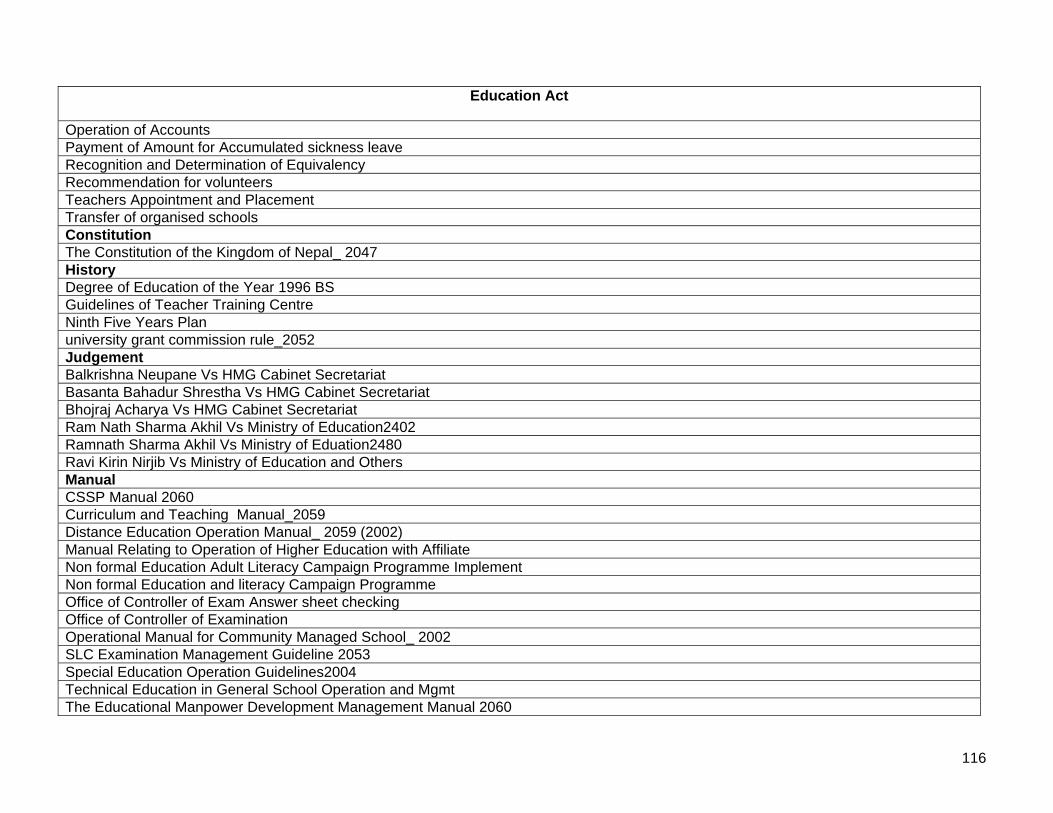
116
Education Act
Operation of Accounts Payment of Amount for Accumulated sickness leave Recognition and Determination of Equivalency Recommendation for volunteers Teachers Appointment and Placement Transfer of organised schools Constitution The Constitution of the Kingdom of Nepal_ 2047 History Degree of Education of the Year 1996 BS Guidelines of Teacher Training Centre Ninth Five Years Plan university grant commission rule_2052 Judgement Balkrishna Neupane Vs HMG Cabinet Secretariat Basanta Bahadur Shrestha Vs HMG Cabinet Secretariat Bhojraj Acharya Vs HMG Cabinet Secretariat Ram Nath Sharma Akhil Vs Ministry of Education2402 Ramnath Sharma Akhil Vs Ministry of Eduation2480 Ravi Kirin Nirjib Vs Ministry of Education and Others Manual CSSP Manual 2060 Curriculum and Teaching Manual_2059 Distance Education Operation Manual_ 2059 (2002) Manual Relating to Operation of Higher Education with Affiliate Non formal Education Adult Literacy Campaign Programme Implement Non formal Education and literacy Campaign Programme Office of Controller of Exam Answer sheet checking Office of Controller of Examination Operational Manual for Community Managed School_ 2002 SLC Examination Management Guideline 2053 Special Education Operation Guidelines2004 Technical Education in General School Operation and Mgmt The Educational Manpower Development Management Manual 2060

117
Education Act
The Teachers Service Commission Work Procedure2059(2001) Order Dream Garden establishment Order Others JEMC Article Of Association Others Folder Law Making Process in Nepal Mandates English Policy Special Education Policy Regulation Administrative Court Rule_ 2051 Civil Service Regulation 2050 (1993) Education Regulation 2059 (2002 A.D.) JEMC Memorandum Local Self Governance Rules_ 2056 National Education Committee Rules_ 2029 (1972) Nepal Education Services (Formation_ Groups and Class Division Scholarship Rules_ 2060 Teachers Service Commission Rules_ 2057 The Children Rules_ 2051 (1994) The Higher Secondary Education Rules_ 2052 (1996) University Grant Commission Work Management Regulation 2060 Reports Advisory Committee for Determination of Fee and Reformation Management of Private sector School Report_ 2055 National Education Planning System_ 2028-32 Nepal National Education Commission_ 2011 Overall National Education Committee 2018 Report of High Level Working Committee on Education_ 2058 Report of National Education Commission 2049 Report of the High level National Education Commission_ 2055 Royal Higher Education Report_ 2040 Convention on the Elimination of All Forms of Discrimination
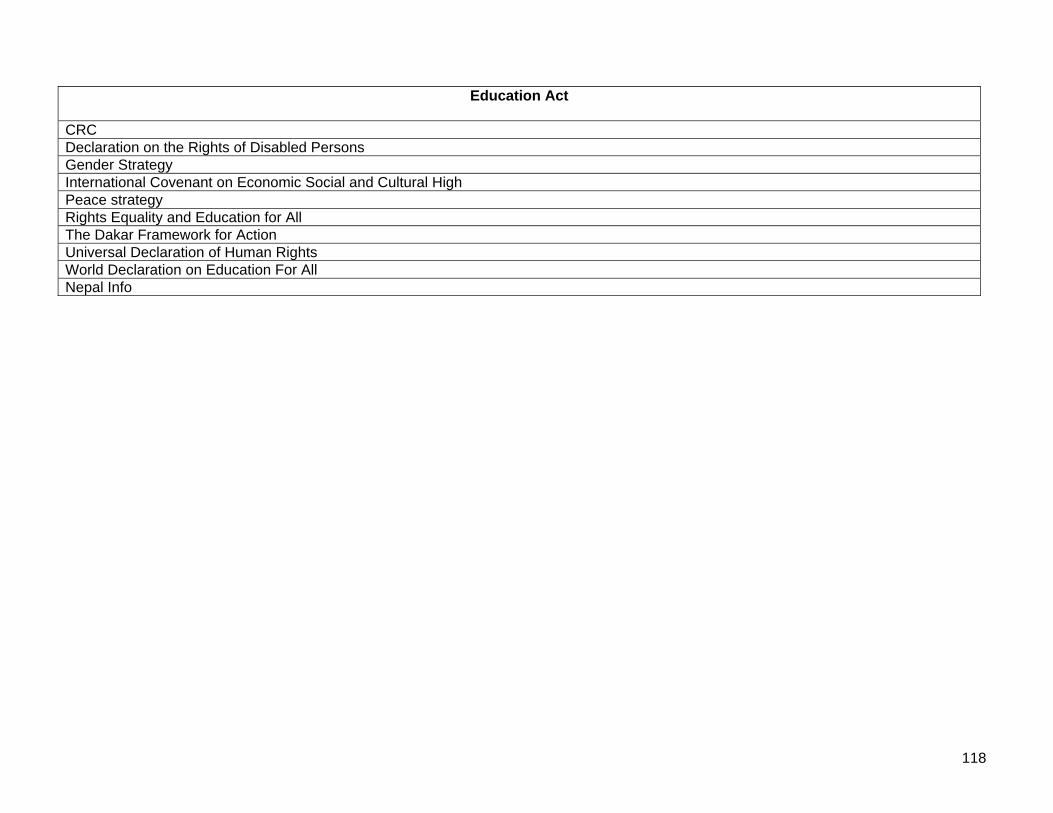
118
Education Act
CRC Declaration on the Rights of Disabled Persons Gender Strategy International Covenant on Economic Social and Cultural High Peace strategy Rights Equality and Education for All The Dakar Framework for Action Universal Declaration of Human Rights World Declaration on Education For All Nepal Info

119
APPENDIX 1: PROGRAM DESIGN AND MONITORING FRAMEWORK Design Summary Performance Targets/ Indicators Data Sources/
Monitoring Mechanisms
Assumptions
and Risks
1. Impact
Poverty reduction through increased level of
education attainment, particularly for girls and disadvantaged groups
• Improved HDI
• Increased average household income of school completers
• Living Standards Surveys
• Labor force surveys
• Population census
Assumptions
• Political and socioeconomic conditions improve and remain
stable • Economy continues to create jobs
and require more educated participants
• Government commitment to education reform is firm.
• Donors will continue their support for the education sector
2. Outcomes:
2.1 To increase access to basic and post-basic
education services and improve education quality
and efficiency
A. EFA
Expanding ECD and PPC services to poor and disadvantaged children
• GER for ECD/PPC to 51% by 2009 • New entrants in Grade 1 with ECD 60%
Ensuring access to education for all children
• NER 96% by 2009 for grades 1-5 • Gross intake rate Grade 1 110%
• Net intake rate Grade 1 95% • GER primary 104%
• EMIS data • Project reports
• Flash Reports • National Budgets • National redbook
Assumptions
• Government allocates sufficient recurrent budget to education
• MOES is effective in leading and coordinating the development of
the school system • Government commitment to 1-12
sector continues • Adequate number of trained teachers available at each level
• Relevant personnel trained under ESDP I continue to be employed by MOES in the subsector and in
their areas of training and expertise

120
Design Summary Performance Targets/ Indicators Data Sources/
Monitoring Mechanisms
Assumptions
and Risks
• NER 96%
Meeting the learning needs of all children
• Repetition rate Grade 1 at 10% • Survival rate to grade 5 86%
• Repetition rate Grade 5 at 3%
Reducing adult illiteracy
• Literacy rate 15+ 66% • Literacy rate age group 15-24 82%
• Literacy rate 6+ 76
• Literacy gender parity index .9
Eliminating gender disparity
• Gender parity for grades 1-5 at .9
Improving all aspects of quality education
• Pupil Teacher Ratio at primary 37:1 • Percentage of teachers with required qualification and training
99% • Percentage of teachers with required certification 99%
• Percentage of learning achievement at grade 5 average at 60% • Percentage of GNP channeled to education 2.3
B. Preparation and Transition to 1-12 School Sector
• Sectoral legal and regulatory framework adjusted for 1-12 by 2009
• Sector and school financing system adjusted for 1-12 by 2009
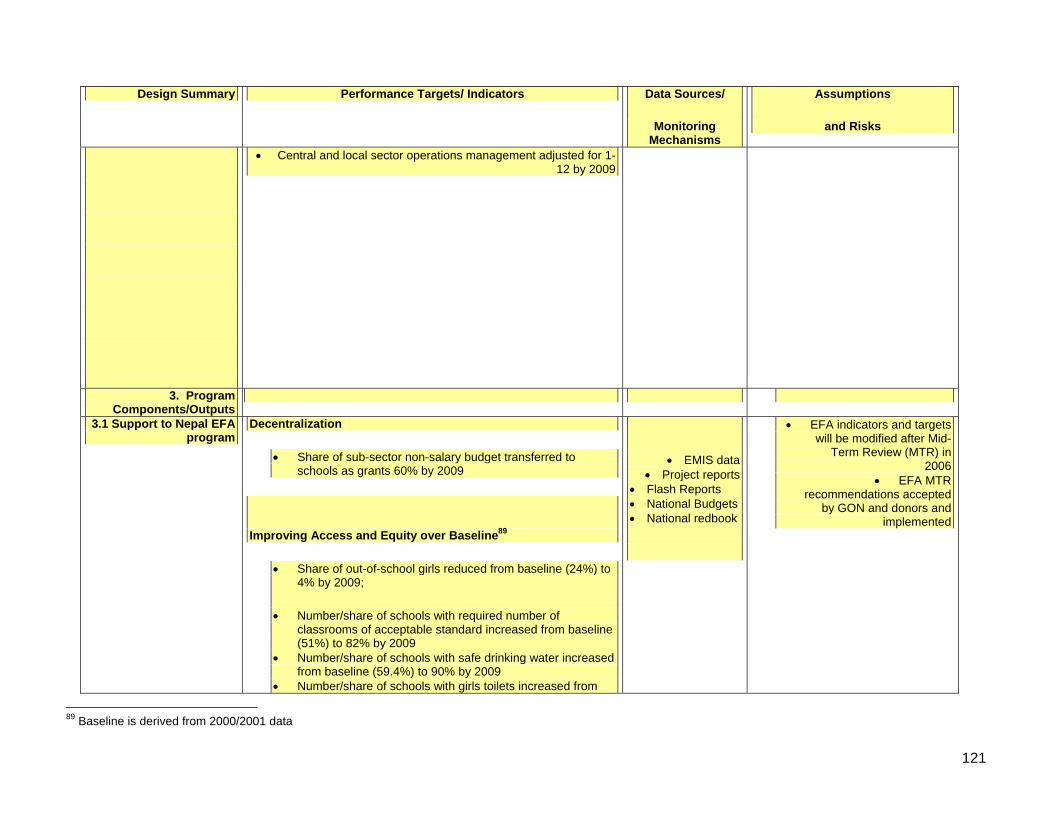
121
Design Summary Performance Targets/ Indicators Data Sources/
Monitoring Mechanisms
Assumptions
and Risks
• Central and local sector operations management adjusted for 1-12 by 2009
3. Program Components/Outputs
3.1 Support to Nepal EFA program
Decentralization
• Share of sub-sector non-salary budget transferred to schools as grants 60% by 2009
Improving Access and Equity over Baseline89
• Share of out-of-school girls reduced from baseline (24%) to 4% by 2009;
• Number/share of schools with required number of classrooms of acceptable standard increased from baseline (51%) to 82% by 2009
• Number/share of schools with safe drinking water increased from baseline (59.4%) to 90% by 2009
• Number/share of schools with girls toilets increased from
• EMIS data • Project reports
• Flash Reports • National Budgets • National redbook
• EFA indicators and targets will be modified after Mid-
Term Review (MTR) in 2006
• EFA MTR recommendations accepted
by GON and donors and implemented
89 Baseline is derived from 2000/2001 data

122
Design Summary Performance Targets/ Indicators Data Sources/
Monitoring Mechanisms
Assumptions
and Risks
baseline (37.5%) to 80% by 2009
Enhancing Quality and Relevance
School environments become more conducive to learning
• Number/share of accredited schools at 50% for grade 1 and 10% for grade 2 by 2009
• Number of schools providing transitional language support to non-Nepali speaking students increased to 300 by 2009
• Share of schools conducing social audits 75% (cumulative) by 2009
Improving Efficiency & Institutional Capacity
• Share of sub-sector non-salary allocations in school grants increased from baseline (2%) to 20% by 2009
• Number of schools completing School Improvement Plans increased from baseline (8,000) to 18,000 by 2009
• Share of schools receiving grants on time to 75% by 2009 • Schools receiving textbooks on time 18,000
3.2 Preparation and Transition to a 1-12
school sector program
Capacity in policy functions strengthened
• Policy Committee mobilized 2006 • Technical Secretariat established by 2006 • Thematic Group briefing papers on governance, finance,
equity, quality issues prepared by 2007 • Policy Committee position papers on system governance,
finance, equity, quality prepared,
• Government reaches consensus on 1-12 school
sector policy framework • Thematic groups develop
position papers in an inclusive and participatory
manner

123
Design Summary Performance Targets/ Indicators Data Sources/
Monitoring Mechanisms
Assumptions
and Risks
• Policy Committee position papers disseminated by MOES, discussed in public forums by 2007
• Framework for 1-12 system finalized by 2007
Core document for 1-12 sector prepared
• Core document group mobilized by 2006 • Draft Core Document prepared by 2006
• Consultation with stakeholders at national level and in (25) districts, completed by 2007
• CD finalized by 2008
• Policy Committee provides active guidance to CD
group • Policy Committee members
participate in stakeholder consultations
Transition program for 1-12 sector piloted
• Strategy for transition approved by Policy Committee 2007 • Pilot Test approved by MOES 2007 • Pilot Test Completed and results circulated 2008 • Core Document finalization 2008
• Progress and impact monitoring completed by 2009
• Districts agree to participate in pilot program
3.3 Capacity Building TA Support for ESDP I
• TA support for building management and financial management capacity for EFA implementation
• TA support for building MOES, District and school level planning, management and financial management capacity
for transition to 1-12 system
• Additional input from ADB required to improve
management of EFA • Decentralization remains
MOES education sector policy
4. Program Inputs 4.3 Capacity Building TA
Grant
Category Total
• TA can be harmonized with other donors
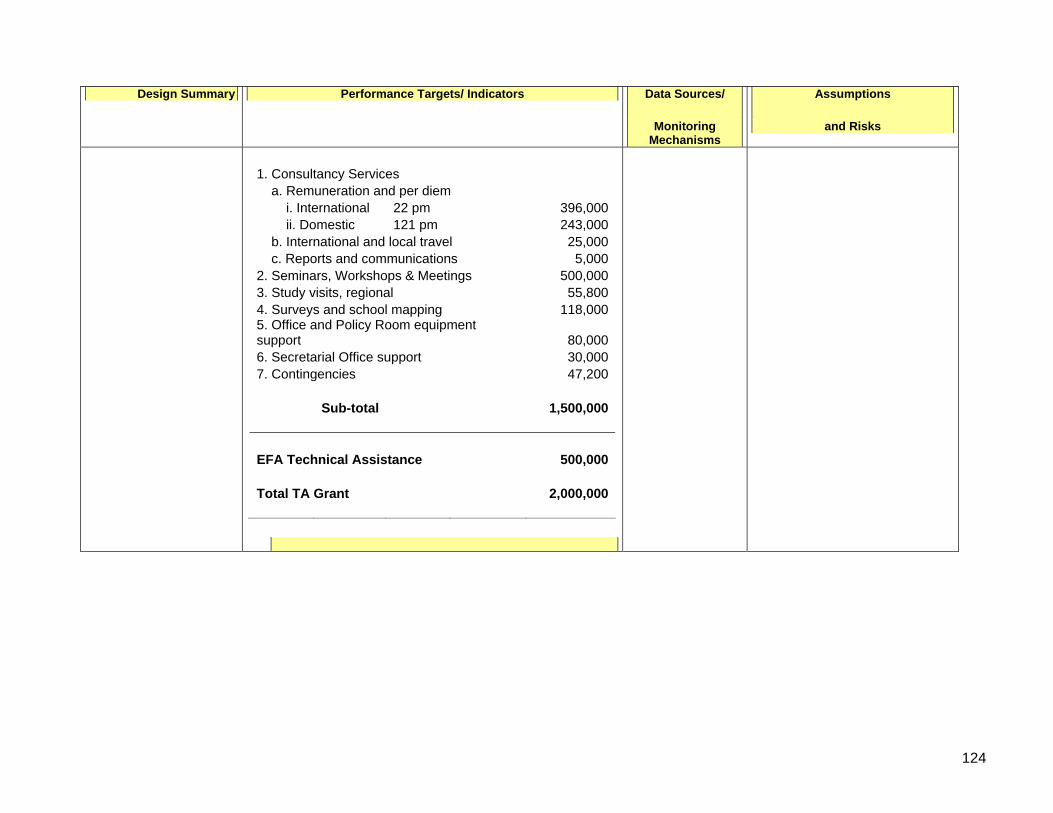
124
Design Summary Performance Targets/ Indicators Data Sources/
Monitoring Mechanisms
Assumptions
and Risks
1. Consultancy Services a. Remuneration and per diem i. International 22 pm 396,000 ii. Domestic 121 pm 243,000 b. International and local travel 25,000 c. Reports and communications 5,0002. Seminars, Workshops & Meetings 500,0003. Study visits, regional 55,8004. Surveys and school mapping 118,0005. Office and Policy Room equipment support 80,0006. Secretarial Office support 30,0007. Contingencies 47,200 Sub-total 1,500,000 EFA Technical Assistance 500,000 Total TA Grant 2,000,000

APPENDIX 2: POLICY MATRIX (Underlined bullet points are tranche release conditions)
Policy Area and Medium Term Objectives
Actions by December 2006
Actions by Mid-May 2007
Actions by Mid-May 2008
1. Support to Nepal Education for All (EFA) 2004-2009 In accordance with EFA principles presented in the EFA Core Document: 1. Apply principles of decentralization to school, village, and district education planning and management. 2. Improve access and equity for disadvantaged groups through removing demand side barriers to education and through improving the environment and supply of schools and teachers. 3. Improve all aspects of education quality. 4. Develop institutional capacity and improve efficiency
• Loan Signing • Legal Opinion • Withdrawal Application • Assurance from MOF
regarding mechanism and triggers for fund release to pooled fund
• Endorsement of EFA
Annual Strategic Implementation Plan for FY 2006/2007 by pooling partners
• Approval of Annual
Workplan and Budget for FY 2006/2007 by GON
• MoF performance in releasing funds to pooled fund
• Approval of EFA Annual Strategic Implementation Plan for FY 2007/2008 by pooling partners
• Endorsement
of Annual Work Plan and Budget for 2007/2008 pertaining to EFA by pooling donors
• MoF performance in releasing funds to MOES
• Endorsement of EFA Annual Strategic Implementation Plan for FY 2008/2009 by pooling partners
• Endorsement of Annual
Work Plan and Budget for 2008/2009 pertaining to EFA by pooling donors
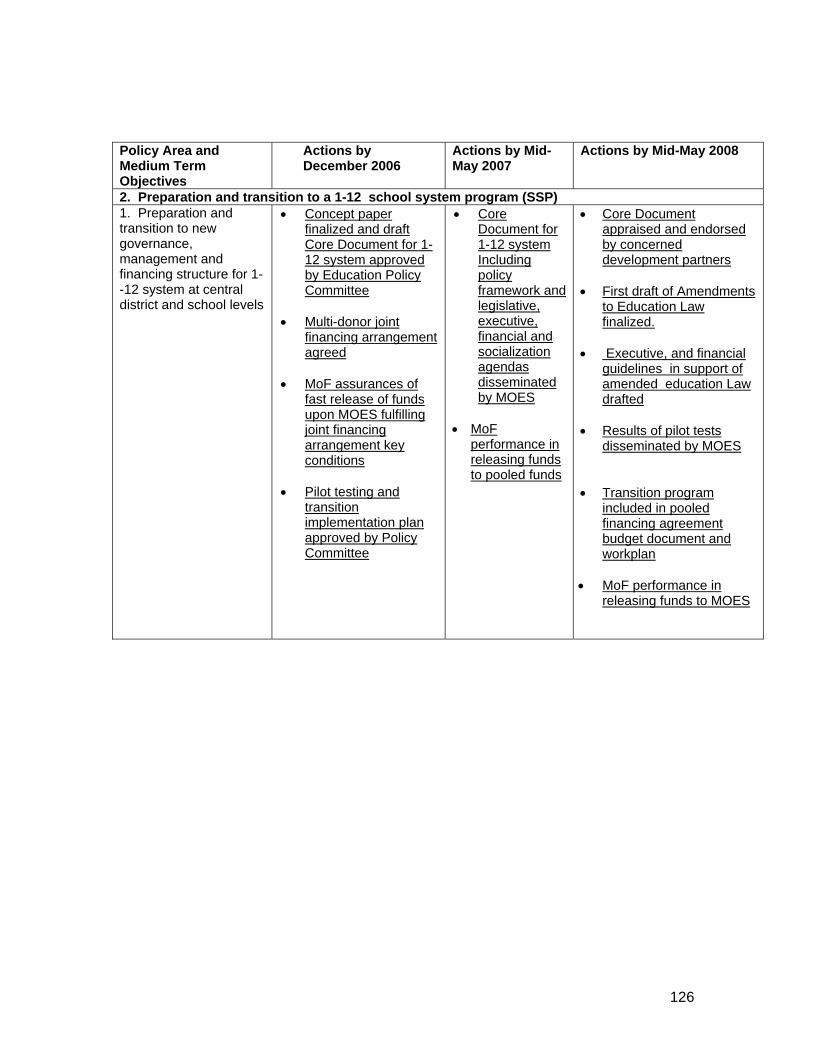
126
Policy Area and Medium Term Objectives
Actions by December 2006
Actions by Mid-May 2007
Actions by Mid-May 2008
2. Preparation and transition to a 1-12 school system program (SSP) 1. Preparation and transition to new governance, management and financing structure for 1--12 system at central district and school levels
• Concept paper finalized and draft Core Document for 1-12 system approved by Education Policy Committee
• Multi-donor joint
financing arrangement agreed
• MoF assurances of
fast release of funds upon MOES fulfilling joint financing arrangement key conditions
• Pilot testing and
transition implementation plan approved by Policy Committee
• Core Document for 1-12 system Including policy framework and legislative, executive, financial and socialization agendas disseminated by MOES
• MoF
performance in releasing funds to pooled funds
• Core Document appraised and endorsed by concerned development partners
• First draft of Amendments
to Education Law finalized.
• Executive, and financial
guidelines in support of amended education Law drafted
• Results of pilot tests
disseminated by MOES • Transition program
included in pooled financing agreement budget document and workplan
• MoF performance in
releasing funds to MOES

127
APPENDIX 3: VULNERABLE COMMUNITIES DEVELOPMENT FRAMEWORK
Program
The guiding principles of the Nepal Education for All (EFA) Core document 2004 – 2007 emphasize gender mainstreaming and social inclusion as primary approaches. The strategies for implementation also refer to social equity and mitigating socio-cultural barriers. ESDP I will directly support EFA in achieving these strategies.
Background
The unresponsive nature of the political system has until recently reinforced many of the problems of exclusion of women, indigenous people and other vulnerable groups. Political government has been dominated by an elite and economic decision-making at all levels has not been representative of the overall population, particularly women, marginalized indigenous groups and Dalit. The system has taken little account of the interests of the poor and excluded and has been too focused on the Kathmandu valley. A culture of impunity has allowed large-scale corruption and in the past few years conflict-related human rights abuses to go unchecked. Progress with decentralization has been slow . In April 2006 the people of Nepal brought down the imposed autocratic government of the King through nation-wide protests. There is great hope among the Nepali people that peace will prevail through a newly elected inclusive government which brings the CPM (Maoist) into the political mainstream, and which will ensure decision-making which is representative of the overall population, including women, marginalized indigenous, Dalit and other vulnerable groups.
The guiding principles of the Nepal EFA Core document 2004 – 2007 emphasize gender mainstreaming and social inclusion as primary approaches. The strategies for implementation also refer to social equity and mitigating socio-cultural barriers. The way in which education has been provided in the past and more recently as part of the EFA plan, may not sufficiently address inequalities and apparent injustices, so that resentments between the poor Dalit and marginalized Janajati groups and better off groups of the population are increased. In such a situation, it could be argued that there is a need to improve some educational provisions and administration modalities to enable mitigation of negative effects that perpetuate the underlying causes of conflict, erodes confidence in government’s capacity to provide basic services and creates an environment where it may be easier to mobilize future support for violent conflict. Hence it is very important for ESDP I to support EFA to ensure positive effects on access, inclusion and greater equity in school of previously excluded and poor population groups as well as representation of these groups in the education sector. Some of these issues are listed for consideration in Annex A.
Legal Framework
In Nepal, the indigenous population is popularly known as ‘Janajati’, which is also
128
recognized by the government and constitutes about 37.2% (8.4 million) of Nepal's total
population. Some of the key characteristics of these ethnic groups are defined as: distinct collective identity; own language (other than Nepali), religion, tradition, culture and civilization; own traditional egalitarian social structure (which is distinct from mainstream varna or caste system); traditional homeland and geographical area; written or oral history that traces their line of descent back to the occupants of the territories before their annexation to the present Nepali frontiers. Based on these traits, the Government has declared 61 (later reduced to 59) groups as Janajatis.
The constitution of Nepal 1990 banned untouchability, abolished discriminatory legal provisions and enshrined in the Constitution statements ensuring equality for all citizens irrespective of caste, creed or gender. However, discrimination based on caste is still a fact of life in Nepal.90
Long marginalized by the rest of society, even today Dalits are expected to earn their living by performing tasks the rest of society considers unclean and “impure”. Dalits sharing drinking water from a community tapstand with higher castes is still a source of conflict in many parts of rural Nepal, since higher castes are concerned with Dalits “polluting” their water. Given their limited income earning opportunities, lack of land ownership and limited access to education and other public resources, it is not surprising that two thirds of Dalits, who make up 15% of the population in Nepal (Census 2001), currently live below the poverty line.
Objective of ESDP I Vulnerable Community Development Framework (VCDF)
The ESDP I Vulnerable Communities Development Framework (VCDF) is to ensure that the ESDP I program will not have any negative impact on women, girls, vulnerable groups, indigenous peoples i.e. marginalised ethnic groups and castes i.e. Dalits, in Nepal. The VCDF ensures that the requirements of ADB’s policy on gender, Indigenous, Dalit and other vulnerable people are met.
This VCDF for ESDP I supports implementation and monitoring of the Ministry of Education’s EFA Program Vulnerable Community Development Plan (VCDP) which is under implementation. The Ministry’s VCDP was developed in 2004 for the EFA program with the assistance of the World Bank as part of the Bank’s process of social assessment and social safeguards assurance. All pooling donors put forward their suggestions for areas for program improvement during the EFA bi-annual reviews. A VCDP working group has been established comprised of pooling donors and the Department of Education. The working group is currently in the process of assessing the status of implementation of the EFA program’s VCDP recommendations and it is expected that ESDPI will participate in the VCDP working group upon joining the pool of donors
90 ADB ‘Poverty Reduction in Nepal – Issues, Findings and Approaches’ March 2002

129
This VCDF is to be used to support implementation of ESDPI relating to gender, caste, ethnicity, social inclusion and equity issues within the ongoing EFA program. It should be applied in conjunction with the Ministry’s VCDP and EFA program indicators. This VCDF provides additional suggestions of issues that need to be considered and addressed which were identified during the PPTA, to enable continued improvements to be made in the EFA program and beyond that benefits the poor, women, girls, marginalized indigenous and Dalit men and women. Through working group and other processes the ESDP I program, along with other pooling donors, will promote and support greater representation of women and marginalized groups in decision-making bodies at policy, district and community levels and build capacity at all levels for greater social, economic and political inclusion of girls and women, Dalits, Janajatis and other marginalized groups.
The Ministry of Education’s VCDP focuses on language-based social exclusion in primary education and assesses the capacity of the EFA program to meet the learning needs of girls, indigenous people (IPs) and linguistic minorities. It lays out a number of steps that should be taken to comply with the World Bank’s social safeguards requirements on women, girls, indigenous people and other vulnerable groups. It provides measures to ensure that vulnerable groups obtain equal access to program benefits. A summary of measures include:
• Introducing home to school language transition program in areas where do not speak Nepali
• Incentives for recruitment of local bilingual women as teachers • Segregation of EMIS data by gender, caste and ethnicity and tracking of
inclusive education objectives • Social mapping to identify out-of-school children from poor
households/vulnerable communities • Lobby for SMC membership to better reflect gender, caste and ethnic groups • Social audits to track allocation of funds from school block grants, particularly
to ensure that scholarships go to most needy Dalits and girls.
Proposed Strategies for Supporting Nepal’s EFA Program
This Vulnerable Communities Development Framework (VCDF) has been developed for ESDP I to essentially support implementation and monitoring of the stated objectives and outputs of the government’s EFA action plan and VCDP, but also contains suggestions on areas for improvement for the ESDP I to put forward for consideration at the EFA bi-annual review meetings with MOES and the EFA pooling donors. The four main suggestions are:
The Ministry’s Policy Committee to consider incorporating a gender and inclusion ‘lens’ in reviewing and planning policies and strategies, budget allocation and monitoring processes and ensure that all six central departments can be mobilized to ensure objectives to ensure full access for women, girls, Dalits, janajatis and other vulnerable

130
groups are met. To achieve this the proposed Education Policy Committee could consider–
Establishing a Gender Equity and Social Inclusion thematic working group/task force to ensure effective coordination of policies and to conduct a systematic analysis of the EFA program and future proposed policies to identify barriers to access for women, Dalits, Janajatis and other vulnerable groups and propose specific mechanisms and incentives to overcome barriers. One suggestion proposed is to develop a mechanism to involve locally elected bodies and CBOs in planning for enrolling excluded groups.
At leadership levels, the MOES could initiate dialogue with the National Civil Service Commission to set targets and establish quotas to increase the number of women gazetted staff in MOES and DOE at central and district levels, including an increase in representation of marginalized Janajati and Dalit groups.
The MOES gender focal point requires additional capacity building and resourcing. Also, the post requires a clear mandate for institutional and sector capacity building for greater gender equality and social inclusion. Finally, adequate resources should be allocated to implement the above (e.g. make the gender focal point post a full time position and provide personal development skills training and IT support).
Equity and inclusion issues which present barriers to achieving related EFA objectives identified in the PPTA analysis which ESDP I will encourage the Ministry to address include:
• Reducing overcrowding in schools (teacher/student ratios) caused by conflict and economic migration and prioritise districts/schools most badly affected and which was not anticipated under NEFAP.
• Inequities in scholarship allocation and distribution.
• Address delays in distribution of scholarship funds from NPC to MOES; MOES to Districts; DEOs to schools; to ensure children receive scholarships on time
• Ensure DEOs have sufficient budgets to meet scholarship requirements to prevent schools from having to reduce the number of eligible students or reduce scholarship amounts
• Explore mechanisms to ensure schools submit scholarship requirements on time in budgetary process and cross verify schools’ scholarship requirement requests to prevent inflated requests by schools.

131
• Consider establishing classification of marginalized Janajati groups and allocate scholarships to those marginalized groups which are currently excluded under EFA
• Consider role of PTAs in identifying eligible scholarship candidates for increased equity and transparency
• Identify inequities and solutions in student scholarship application process e.g. problems of Dalit students competing student data forms which present barriers to access and requirement by some schools to have birth registration to apply. In some cases birth registration is still being demanded by schools for enrolment in school. Also the current classification for Dalits does not include all Dalit groups and hence Dalit children from these groups are reported to be excluded . A revised classification of Dalit groups is recommended in consultation with all DEOs to prevent barriers to access to scholarships by those groups not in the list
• Increasing recruitment and distribution of female, Dalit and marginalized Janajati teachers to increase retention of children from these groups
• Propose how to ensure female trained primary teachers have access to teacher employment. Consider raising the targets for recruitment of more female teachers at primary level and explore how to ensure current regulations for numbers of female teachers in schools are enforced by DEOs and SMCs (strong policy directives and incentives are also needed in lower secondary and secondary schools which have an acute shortage of female teachers)
• Propose targets, strong policy directives and incentives to ensure an increase in Dalit and marginalized Janajati female and male trained teachers, including bilingual and multi-lingual, are recruited.
Make Codes of Conduct Effective.
Consider revising codes of conduct for head teachers, teachers, students, SMCs and PTAs to promote non-discriminatory behaviour and practices on grounds of gender, caste, ethnicity, disability and other disadvantaged groups. Consider possible mechanisms which address how discriminators should be held accountable and to whom. Stakeholders (including Teachers’ Unions, head teachers, teachers, SMCs, PTAs, legal forums) should be involved in such a review to ensure codes of conduct and processes are not imposed and impractical to implement, monitor and evaluate. ESAT is also planning to meet with Teachers’ Unions on this issue with a view to establishing a working group, hence inclusion of this working group is necessary.
Advocacy and awareness raising for inclusive school and classroom environments.
• Initiate dialogue with the Faculty of Education for developing gender and social inclusion sensitivity training and related skills for all pre-service teacher training (BEd and IEd) courses. Revised codes of conduct and related revised regulations could also be incorporated into future training courses.

132
• Liaise with NCED to ensure in-service teacher and head teacher training, as well as training for DEOs and SMCs addresses issues of discriminatory behaviour and practice in schools and promotes girl-friendly and culture-friendly environments in all districts.
• Review training packages already under implementation. Under the TEP project NCED has already conducted training to stakeholders in 12 districts. Inclusive Education Section also runs an innovative but small-scale training program under EFA for primary schools and stakeholders with training materials which it developed in close consultation with the Gender Equity and Development unit. Demand for this training package is growing and this could be substantially scaled up to cover many more schools and districts. Future training content could include dissemination of revised codes of conduct and any related revised regulations.
• With NCED consider developing an appropriate related two day awareness training to be delivered to staff in MOES and DOE six central level departments.
• 5.4 Consider how to evaluate impact of training to all groups.
Committee representation by gender, caste and ethnicity
• Consider how SMC membership could become more representative of school communities by gender, caste and ethnicity and review roles/responsibilities and capacity building needs of SMCs and PTAs in consultation with them from a social and economic inclusion perspective.
• Consider how DEO scholarship committees could become more transparent and representative by gender, caste and ethnicity and inclusive of stakeholders relating to equitable allocation and distribution of scholarships. Case studies of good practice could be disseminated.
Rational distribution of ECDs
Review distribution and impacts of ECDs on poor families, with a focus on targeting conflict-affected/poor and deprived areas including access by marginalized Janajati, Dalit and other disadvantaged groups to 1) relieve overcrowding by under-aged children in grade 1, 2) provide vital child care support for poor families and 3) release girls from child-minding to enable them to attend schools
Equity issues in examination system
Initiate dialogue with OCE on findings of the 2005 SLC study and all representative groups on gender, poverty and equity issues relating to examination failure in schools and to consider strong affirmative action of SLC study recommendations to reduce disparities and increase equitable outcomes.
Respecting cultural diversity in curriculum development
133
• Ensure curriculum development and revision informs and reflects the diverse cultures of Nepal.
• Ensure the current process of translating existing curriculum into indigenous languages places equal emphasis on amending the curriculum content to reflect the culture of the language and not just the ‘dominant culture’ from which the original curriculum originates. Involvement of stakeholders will ensure appropriate curriculum content.
Inclusion of children in especially difficult circumstances
• Conduct a review of the current program and budgetary gaps in providing access to education for the identified groups in this category and propose improvements. Budget allocations for those groups who are being addressed under EFA are currently inadequate to meet demand e.g. disabled and street children.
• In the event of an end to armed conflict a program could be considered to reintegrate child/youth soldiers back into mainstream education. Provision of scholarships and the ability to accommodate over-age children/youths wishing to re-enter mainstream education as well as prospects for skills for employment need to be considered to avoid frustration and disappointment, factors which contributed to the armed conflict.
• Consider how to teachers could assess and address psycho-social impacts of armed conflict, natural disasters, family bereavement and other inflicted trauma on children. Consider integrating basic training for teachers in existing pre-service and in-service training courses to enable them to identify trauma in children and develop listening/counselling skills
• Safe drinking water and separate toilets for girls and boys
• Consider liaising with DWSS to conduct up to date district level assessments and prioritization of schools for safe drinking water and separate toilet provision for girls/boys/teachers, particularly for girls’ menstruation management. This will contribute to reducing lost school days, particularly for girls.
Roles for monitoring and research
For the above interventions monitoring and evaluation will play an essential role. The Flash reports and the TRSE process initiated by the donors have already brought to light a range of important issues and provide reliable data on which decisions and discussions can be based. Additional monitoring indicators could be incorporated into these existing mechanisms. Areas for focus in the future could also include:
• Monitor reduction in overcrowding by district

134
• Establishment of ECD/PPC provision in targeted needy districts and impacts on poor children and families
• Causes of repetition and drop-out of girls and boys by caste, ethnic and socio-economic group at primary level, particularly after grade 5 when scholarships are very limited
• Equitable distribution and amounts/impact of scholarship on retention/achievement for target groups
• Monitor possible negative impacts in terms of exclusion. Within the EFA programme, scholarships for Dalits are an important element.
• Female, Dalit and Janjati teachers (ratios and distribution by district) • Exam success/failure of boys/girls by caste and ethnicity • Fee-charging in all types of government school primary/lower secondary and
secondary and trends/impacts on poor/girls retention/drop out

135
LIST OF SUPPLEMENTARY APPENDICES
Supplementary Appendix 1 : Components of Nepal’s EFA Program and Challenges from a Social and Economic Inclusion Perspective
Supplementary Appendix 2: School Finance
Supplementary Appendix 3: Teacher Supply and Demand
Supplementary Appendix 4: Assessment of JFA EFA
Supplementary Appendix 5: Conceptual Model for Component B