education quality in the oic member countries
TRANSCRIPT

Education Quality in the OIC Member Countries
COMCEC COORDINATION OFFICE March 2018
Standing Committee for Economic and Commercial Cooperation of the Organization of Islamic Cooperation (COMCEC )

Education Quality in the OIC Member Countries
COMCEC COORDINATION OFFICE March 2018
Standing Committee for Economic and Commercial Cooperation of the Organization of Islamic Cooperation (COMCEC )
Standing Committee for Economic and Commercial Cooperation of the Organization of Islamic Cooperation (COMCEC )

This report has been commissioned by the COMCEC Coordination Office to Dr. M Niaz ASADULLAH who is also the Principal Author of the report. Contributors for country case study chapters are Husaina Banu Kenayathulla (Malaysia), Monazza Aslam, Sehar Saeed and Baela Jamil (Pakistan) and Chidi Ezegwu (Nigeria). Saizi Xiao provided research support while Farihah Fahmy of Teach for Malaysia provided valuable feedback on draft report. Views and opinions expressed in the report are solely those of the authors and do not represent the official views of the COMCEC Coordination Office or the Member Countries of the Organization of Islamic Cooperation. Excerpts from the report can be made as long as references are provided. All intellectual and industrial property rights for the report belong to the COMCEC Coordination Office. This report is for individual use and it shall not be used for commercial purposes. Except for purposes of individual use, this report shall not be reproduced in any form or by any means, electronic or mechanical, including printing, photocopying, CD recording, or by any physical or electronic reproduction system, or translated and provided to the access of any subscriber through electronic means for commercial purposes without the permission of the COMCEC Coordination Office. For further information please contact: COMCEC Coordination Office Necatibey Caddesi No:110/A 06100 Yücetepe Ankara/TURKEY Phone: 90 312 294 57 10 Fax: 90 312 294 57 77 Web: www.comcec.org *E-book: http://ebook.comcec.org ISBN: 978-605-2270-15-8


i
TABLE OF CONTENTS
LIST OF TABLES ........................................................................................................................................................................ III
LIST OF FIGURES....................................................................................................................................................................... IV
LIST OF ABBREVIATIONS ..................................................................................................................................................... VI
EXECUTIVE SUMMARY ......................................................................................................................................... 1
INTRODUCTION ...................................................................................................................................................... 5
1. CONCEPTUAL FRAMEWORK ..................................................................................................................... 8
GLOBAL TARGETS: EFA, MDGS AND SDGS ......................................................................................... 8 CONCEPTUALIZING QUALITY EDUCATION ..................................................................................... 12 MEASURING EDUCATION QUALITY ................................................................................................... 14 DATA AND METHODOLOGICAL FRAMEWORK............................................................................... 16
2. EDUCATION QUALITY IN THE OIC MEMBER COUNTRIES ............................................................. 20
THE STATE OF EDUCATION QUALITY IN THE OIC MEMBER COUNTRIES ............................. 20 2.1.1. LEVEL OF STUDENT LEARNING ............................................................................................................... 20 2.1.2. INPUT QUALITY AND EXPENDITURE ON EDUCATION ................................................................. 25 2.1.3. TRENDS IN LEARNING OUTCOMES ........................................................................................................ 29 2.1.4. EQUITY IN EDUCATIONAL OUTCOMES AND OPPORTUNITIES ................................................. 37 2.1.5. STUDENT ACHIEVEMENT IN LOW INCOME OIC COUNTRIES .................................................... 46 2.1.6. THE DETERMINANTS OF STUDENT ACHIEVEMENT ..................................................................... 47
MAIN FACTORS DETERMINING THE QUALITY OF EDUCATION ............................................... 52 POLICY EFFORTS TO IMPROVE EDUCATION QUALITY IN THE OIC COUNTRIES ................ 58 CONCLUSION .............................................................................................................................................. 60
3. CASE STUDIES ............................................................................................................................................... 62
JORDAN ........................................................................................................................................................ 66 3.1.1. THE EDUCATIONAL LANDSCAPE OF THE COUNTRY ..................................................................... 66 3.1.2. MAJOR EDUCATION REFORMS IN JORDAN: 1990-2017 ............................................................... 68 3.1.3. ASSESSMENT OF LEARNING OUTCOMES ............................................................................................ 71 3.1.4. MAJOR TRENDS IN EDUCATION STATISTICS .................................................................................... 72 3.1.5. REGRESSION ANALYSIS OF THE DETERMINANTS OF LEARNING OUTCOMES ................. 84 3.1.6. STAKEHOLDER PERCEPTIONS ................................................................................................................. 87 3.1.7. CONCLUSION ..................................................................................................................................................... 92 3.1.8. RECOMMENDATIONS .................................................................................................................................... 92
MALAYSIA ................................................................................................................................................... 93 3.2.1. THE EDUCATIONAL LANDSCAPE OF THE COUNTRY ..................................................................... 93 3.2.2. MAJOR EDUCATION REFORMS AND POLICIES .................................................................................. 94 3.2.3. ASSESSMENT OF LEARNING OUTCOMES ............................................................................................ 98 3.2.4. MAJOR TRENDS IN EDUCATION STATISTICS .................................................................................... 98 3.2.5. REVIEW OF THE EXISTING EVIDENCE ............................................................................................... 107 3.2.6. REGRESSION ANALYSIS OF THE DETERMINANTS OF LEARNING OUTCOMES .............. 109 3.2.7. STAKEHOLDER PERCEPTIONS IN MALAYSIA................................................................................. 113 3.2.8. CONCLUSION .................................................................................................................................................. 117 3.2.9. RECOMMENDATIONS ................................................................................................................................. 118
PAKISTAN ................................................................................................................................................ 120 3.3.1. THE EDUCATIONAL LANDSCAPE OF THE COUNTRY .................................................................. 120

ii
3.3.2. ASSESSMENT OF LEARNING OUTCOMES ......................................................................................... 130 3.3.3. MAJOR TRENDS IN EDUCATION STATISTICS ................................................................................. 131 3.3.4. REGRESSION ANALYSIS OF THE DETERMINANTS OF LEARNING OUTCOMES .............. 139 3.3.5. STAKEHOLDER PERCEPTIONS OF EDUCATION QUALITY ........................................................ 148 3.3.6. CONCLUSION .................................................................................................................................................. 149 3.3.7. RECOMMENDATIONS ................................................................................................................................. 149
NIGERIA .................................................................................................................................................... 152 3.4.1. THE EDUCATIONAL LANDSCAPE OF THE COUNTRY .................................................................. 152 3.4.2. MAJOR EDUCATION REFORMS .............................................................................................................. 153 3.4.3. ASSESSMENT OF LEARNING OUTCOMES ......................................................................................... 164 3.4.4. MAJOR TRENDS IN EDUCATION STATISTICS ................................................................................. 164 3.4.5. REGRESSION ANALYSIS OF THE DETERMINANTS OF LEARNING OUTCOMES .............. 179 3.4.6. STAKEHOLDER PERCEPTIONS .............................................................................................................. 183 3.4.7. CONCLUSIONS................................................................................................................................................ 187 3.4.8. RECOMMENDATIONS ................................................................................................................................. 188
4. CONCLUSIONS AND RECOMMENDATIONS ...................................................................................... 192
REFERENCES ....................................................................................................................................................... 198
ANNEXES ............................................................................................................................................................... 218

iii
List of Tables
Table 1.1: SDG 4 targets ....................................................................................................................................................... 10 Table 2.1: OLS estimates of the determinants of student achievement PISA 2012 in the OIC, OECD and non-OECD countries ..................................................................................................................................................... 48 Table 2.2: OLS estimates of the determinants of student achievement in the OIC .................................... 51 Table 3.1.1: Selected Indicators of Access, Input Quality, Literacy and Expenditure............................... 73 Table 3.1.2: Determinants of Student Achievement in Math, Reading and Science, PISA 2012 .......... 84 Table 3.1.3: Determinants of Student Achievement in Math, Reading and Science by family wealth, PISA 2012 ................................................................................................................................................................................... 86 Table 3.2.1: Student Performance in Primary School Achievement Test (UPSR), 2013-2015 ......... 101 Table 3.2.2: Student Performance in Secdondary School Certificate Test (SPM), 2013-2015 .......... 101 Table 3.2.3: Malaysia Certificate of Education (STPM), 2013-2015 ............................................................. 102 Table 3.2.4: Determinants of Student Achievement in Math, Reading and Science, PISA 2012 ....... 110 Table 3.2.5: Determinants of Student Achievement in Math, Reading and Science by family wealth, PISA 2012 ................................................................................................................................................................................ 111 Table 3.3.1: Key determinants of ‘higher order’ numeracy skills (children aged 5-16), full sample and by quartile (poorest and richest) – ASER (rural) 2013 (Marginal effects from probit model) 141 Table 3.3.2: Key determinants of ‘higher order’ numeracy skills (children aged 5-16), full sample and by quartile (poorest and richest) – ASER (rural) 2016 (Marginal effects from probit model) 143 Table 3.3.3: Key determinants of ‘higher order’ reading skills (children aged 5-16), full sample and by quartile (poorest and richest) – ASER (rural) 2013 (Marginal effects from probit model)......... 145 Table 3.3.4: Key determinants of ‘higher order’ reading skills (children aged 5-16), full sample and by quartile (poorest and richest) – ASER (rural) 2016 (Marginal effects from probit model)......... 147 Table 3.4.1: Enrolment by level of school for the years 2012 to 2016 and % change in the enrolment ............................................................................................................................................................................... 165 Table 3.4.2: OLS Regression estimates of competencies in EGRA (Hausa) 2014 .................................... 180 Table 3.4.3: Probit Regression estimates of zero scores in EGRA (Hausa sub-tasks) 2014 ............... 182

iv
List of Figures
Figure 1.1: The concept of quality education ............................................................................................................. 13 Figure 2.1: Average math and science score in TIMSS ........................................................................................... 21 Figure 2.2: Average math, reading and science scores in PISA and reading score in PIRLS ................. 22 Figure 2.3: Readings score in SACMEQ 2012 ............................................................................................................. 23 Figure 2.4: Readings score in EGRA ................................................................................................................................ 23 Figure 2.5: Youth Literacy Data ........................................................................................................................................ 23 Figure 2.6: Grade-learning profiles by subject, PISA 2012 .................................................................................. 24 Figure 2.7: Pupil-teacher ratio in primary and secondary education ............................................................. 26 Figure 2.8: Percentage of trained teachers, primary and secondary education ......................................... 27 Figure 2.9: Government expenditure as a percentage of GDP, primary and secondary education ... 28 Figure 2.10: Absenteeism from School (%) ................................................................................................................ 29 Figure 2.11: Grade 4 TIMSS (Mathematics & Science) and PIRLS (Reading) Scores by Region, 1999-2015 .............................................................................................................................................................................................. 30 Figure 2.12: Grade 8 TIMSS (Mathematics & Science) Scores by Region, 1999-2015 ............................. 31 Figure 2.13: PISA (Mathematics, Reading & Science) Scores by Region, 2000-2015 .............................. 32 Figure 2.14: Grade 4 TIMSS (Mathematics & Science) and PIRLS (Reading) Scores by Country, 1999-2015 .............................................................................................................................................................................................. 33 Figure 2.15: Grade 8 TIMSS Scores in Mathematics and Science by Country, 1999-2015..................... 34 Figure 2.16: Grade 4 TIMSS Scores in Mathematics and Science by Gender, 1999-2015 ...................... 35 Figure 2.17: Grade 8 TIMSS Scores in Mathematics and Science by Gender, 1999-2015 ...................... 35 Figure 2.18: PISA Scores in Mathematics, Reading and Science by country, 2000-2015 ....................... 36 Figure 2.19: Wealth-learning profile in the OIC, TIMSS 1999 and 2011 ........................................................ 38 Figure 2.20: Wealth-learning profile, PISA 2000 and 2012 ................................................................................. 39 Figure 2.21: Learning levels of children from top and bottom wealth groups in urban OIC vs rural OECD and non-OECD, TIMSS 2011 .................................................................................................................................. 39 Figure 2.22: Learning levels of children from top and bottom wealth groups in urban OIC vs rural OECD and non-OECD, PISA 2012 ..................................................................................................................................... 40 Figure 2.23: Top-bottom wealth quintile learning gaps in OIC countries, PISA 2012 ............................. 41 Figure 2.24: Wealth gradient of learning levels in urban OIC vs rural OECD and non-OECD, TIMSS 2011 .............................................................................................................................................................................................. 42 Figure 2.25: Wealth gradient of learning levels in urban OIC vs rural OECD and non-OECD, PISA 2012 .............................................................................................................................................................................................. 43 Figure 2.26: Inequality in school completion (educational gini coefficient) in OIC countries ............. 44 Figure 2.27: Share of resilient students in PISA 2012 ............................................................................................ 45 Figure 2.28: Learning shortfalls in OIC and non-OECD vs. OECD countries, PISA 201 ............................ 50 Figure 2.29: Learning shortfalls in OIC vs. OECD countries, PISA 2012 ......................................................... 50 Figure 3.1.1: Percentage of zero scores in EGRA: Jordan vs. other OIC countries ..................................... 74 Figure 3.1.2: Percentage of 2 Grade Students Who Could Not Read a Single Word of Connected Text ............................................................................................................................................................................................... 74 Figure 3.1.3: Trends in TIMSS and PISA, 1999-2015 (Jordan) ........................................................................... 75 Figure 3.1.4: Trends in subject-specific competencies in TIMSS and PISA, 1999-2012 (Jordan) ....... 76 Figure 3.1.5: Trends in level-1 competency in Math and Science in TIMSS by family wealth, 1999-2011 (Jordan) ........................................................................................................................................................................... 77 Figure 3.1.6: Trends in level-2 competency in Math and Science in TIMSS by family wealth, 1999-2011 (Malaysia) ....................................................................................................................................................................... 78 Figure 3.1.7: Trends in level-3 competency in Math and Science in TIMSS by family wealth, 1999-2011 (Malaysia) ....................................................................................................................................................................... 78 Figure 3.1.8: Trends in level-1 competency in Math, Reading and Science in PISA by family wealth, 2009-2012 (Jordan) ............................................................................................................................................................... 79

v
Figure 3.1.9: Trends in level-4 competency in Math, Reading and Science in PISA by family wealth, 2009-2012 (Jordan) ............................................................................................................................................................... 80 Figure 3.1.10: Important features of effective principal and teachers ........................................................... 88 Figure 3.1.11: Main barriers to quality education in primary and secondry education in Jordan ..... 89 Figure 3.1.12: Main priorities for investment to improve quality of primary and secondary education in Jordan ................................................................................................................................................................ 90 Figure 3.2.1: School enrollment by levels of education, 1984-2016 ................................................................ 99 Figure 3.2.2: Pupil teacher ratio by school type, 2010-2016 ........................................................................... 100 Figure 3.2.3: Percentage of graduate teachers by secondary schools type, 2014-2016 ...................... 100 Figure 3.2.4: Malaysia’s Achievement in TIMSS 1999 - 2015 .......................................................................... 102 Figure 3.2.5: Trends in level-1 competency in Math and Science in TIMSS by family wealth, 1999-2011 (Malaysia) .................................................................................................................................................................... 103 Figure 3.2.6: Trends in level-2 competency in Math and Science in TIMSS by family wealth, 1999-2011 (Malaysia) .................................................................................................................................................................... 104 Figure 3.2.7: Trends in level-3 competency in Math and Science in TIMSS by family wealth, 1999-2011 (Malaysia) .................................................................................................................................................................... 105 Figure 3.2.8: Trends in level-1 competency in Math, Reading and Science in PISA by family wealth, 2009-2012 (Malaysia) ....................................................................................................................................................... 105 Figure 3.2.9: Trends in level-4 competency in Math, Reading and Science in PISA by family wealth, 2009-2012 (Malaysia) ....................................................................................................................................................... 106 Figure 3.2.10: Important features of an effective school principal and teacher ...................................... 114 Figure 3.2.11: Main barriers to quality education at the primary and secodnary level ....................... 115 Figure 3.2.12: Main priorities for investment to improve quality education at the primary and secondary level ..................................................................................................................................................................... 116 Figure 3.3.1: Distribution of institutions by sector (2015-16) ........................................................................ 126 Figure 3.3.2: Enrolment by province/region, 2012-2016 (children aged 6-10 years) ........................ 132 Figure 3.3.3: Enrolment in government schools by province/region, 2012-2016 (children aged 6-16 years .......................................................................................................................................................................................... 133 Figure 3.3.4: Enrolment by gender and socio-economic status ...................................................................... 134 Figure 3.3.5: Enrolment by school type and socio-economic status ............................................................. 134 Figure 3.3.6: Availability of Drinking water (%), by province/region and schooling level ................ 135 Figure 3.3.7: Availability of toilets (%), by province/region and schooling level .................................. 136 Figure 3.3.8: Literacy rates (%) for individuals aged 10 and above by province and location ........ 137 Figure 3.3.9: Grade 5 learning levels in language, by province/region ....................................................... 138 Figure 3.3.10: Grade 5 learning levels in mathematics, by province/region ............................................ 138 Figure 3.4.1: Gross and net attendance in primary and secondary school by household wealth, 2011 ........................................................................................................................................................................................... 166 Figure 3.4.2: Primary school completion rates and transition rate to secondary school by parental schooling and household wealth, 2011...................................................................................................................... 167 Figure 3.4.3: National Examination Council Final Senior Secondary Schools Examination, 2013-2016 ........................................................................................................................................................................................... 171 Figure 3.4.4: FME Primary MLA Literacy and Numeracy Percentage Mean Scores 1996-2011 (grades 4 and 6) ................................................................................................................................................................... 172 Figure 3.4.5: Children's Numeracy Skills by Household Wealth (children ages 5-16 able to read)173 Figure 3.4.6: Children’s Numeracy Skill by Household Wealth ....................................................................... 174 Figure 3.4.7: Children's Literacy Skills by Household Wealth (children ages 5-16 able to read) ... 174 Figure 3.4.8: Children’s Numeracy Skill by Mother's Schooling ..................................................................... 175 Figure 3.4.9: Percentage of 2 grade students who could not read a single word of connected text in EGRA, by region and gender ........................................................................................................................................... 177 Figure 3.4.10: Zero scores in 5 Hausa sub-tasks in EGRA 2014 ...................................................................... 178

vi
Figure 3.4.11: Mean scores in correct letters per minute, non-word decoding and oral fluency, EGRA 2014 ........................................................................................................................................................................................... 180 Figure 3.4.12: Important features of an effective school principal and teacher ...................................... 184 Figure 3.4.13: Main barriers to quality education at the primary and secodnary level ....................... 185 Figure 3.4.14: Main priorities for investment to improve quality education at the primary and secodnary level ..................................................................................................................................................................... 186
List of Abbreviations
ALECSO Arab League Education, Culture and Science Organization APECD Arab Program for Early Childhood Development ARAIEQ Arab Regional Agenda for Improving Education Quality ASC Annual School Census ASER Annual Status of Education Report B.Ed Bachelor in Education BECE Basic Education Certificate Examination BM Bahasa Melayu CATI Community Accountability and Transparency Initiative CATI Community Accountability and Transparency Initiative CECO China Economic and Commercial Office CLSPM Correct Non-Word Decoding Per Minute CNWPM Correct Non-Word Decoding Per Minute CSO Civil Society Organization DFID Department for International Development DFID United Kingdom Department for International Development DLP Dual Language Programme ECE Early Childhood Education ECED Early Childhood Education and Development EdData Education Data for Decision Making EDOREN DFID's Education, Data Research and Evaluation in Nigeria EFA Education for All EGMA Early Grade Mathematics Assessment EGRA Early Grade Reading Assessment EGRMA Early Grade Reading and Mathematics Assessments EMIS Education Management Information System EMOs Education Management Organizations ERfKE Education Reform for the Knowledge Economy ESP Education Sector Plan ESSPIN Education Sector Support Programme in Nigeria EU European Union EYS Expected Years of Schooling FATA Federally Administered Tribal Area FCT Federal Capital Territory FME Federal Ministry of Education FTTSS Female Teacher Trainee Scholarship Scheme GAR Gross Enrolment Ratio GCSE General Certificate of Secondary Education GDP Gross Domestic Product

vii
GEP Girls Education Programme GPE Global Partnership for Education GTP Government Transformation Programme HOTS Higher Order Thinking Skills ICT Information and Communication Technology IDP International Development Partners IDPs Internally Displaced Persons ILO International Labor Organization INGO International Non-Governmental Organization IoP Inequality of Opportunity IPs Implementing Partners IQTE Islamiyya Quranic and Tsangaya Education ISESCO Islamic Education, Science and Culture Organization JICA Japan International Cooperation Agency JSS Junior Secondary School KICA Korea International Cooperation Agency KP Khyber Pakhtunkhwa LFPS Low Fee Private School LGEA Local government Education Authority LINUS Literacy and Numeracy Programme MDGs Millennium Development Goals MENA Middle East and North Africa MICS 2015 Multiple Indicator Cluster Survey MLA Monitoring of Learning Achievements MoE Ministry of Education MoFEPT Ministry of Federal Education and Professional Training MOU Memorandum of Understanding MYS Mean Years of Schooling NALABE National Assessment of Learning Achievements in Basic Education NAR Net Attendance Ratio NBS National Bureau of Statistics NCE Nigeria Certificate in Education NCERD National Center for Education Research NCHRD National Center for Human Resources Development NCNE National Commission on Nomadic Education NDHS Nigerian Demographic and Health Survey NEC National Education Census NECO National Examination Council NEDS Nigeria Education Data Survey NEI Northern Education Initiative NEP National Education Policy NER Net Enrolment Ratio NGO Non-Governmental Organization NIPEP Nigeria Partnership for Education Project NKRA National Key Results Areas NPC National Population Commission NPE National Policy on Education OLS Ordinary Least Square OOSC Out-of-School Children

viii
OOSCI Global Out-of-School Children Initiative ORF Oral Reading Fluency PBS Pakistan Bureau of Statistics PEMANDU Malaysia Performance Management and Delivery Unit PIRLS Progress in International Reading Literacy Study PISA Programme for International Student Assessment PPAF Pakistan Poverty Alleviation Fund PPDP Pre-service Professional Diploma Program PPP Public Private Partnerships PSLM Pakistan Social Living Standard Measurement PTA Parent Teachers Association PTR Student Teacher Ratio QRF Queen Rania Foundation QRTA Queen Rania Teacher Academy RCT Randomized Control Trail RSPs Rural Support Programs RTI Research Triangle Institute SACMEQ Southern and Eastern Africa Consortium for Monitoring Educational Quality SBMC School-Based Management Committees SDGs Sustainable Development Goals SMoE State Ministry of Education SPM Secondary School Certificate Test SSCE Senior Secondary Certificate Examination SSS Senior Secondary School STEM Science, Technology, Engineering and Mathematics STPM Malaysia Certificate of Education (STPM) SUBEB State Universal Basic Education Board TALIS Teaching and Learning International Survey TDP Teacher Development Programme TIMSS Trends in International Mathematics and Science Study TPR Teacher-Pupils Ratio TVET Technical Vocational Training UAE United Arab Emirates UBE Universal Basic Education UBEC Universal Basic Education Commission UN United Nations UNESCO United National Education Scientific Cultural Organization UNESS National Education Support Strategy UNICEF United Nations Children's Emergency Fund UPE Universal Primary Education UPSR Primary School Achievement Test USAID United States Agency for International Development USAID United States Agency for International Development WAEC West African Examination Council WDI World Data Indicators WIDE World Inequality Database on Education

Education Quality in the OIC Member Countries
1
EXECUTIVE SUMMARY
The study aims to document the state of education quality in member countries of the Organisation of Islamic Cooperation (OIC), with a focus on the relationship between student learning and poverty, and understand what policy measures can be adapted to improve education quality. The study established a conceptual framework based on secondary literature review, and used that to guide statistical analysis to describe the general trends in education quality and, in particular, the relationship between student performance and poverty in OIC countries. It also presents an overview of global, regional and national policies to improve learning outcomes.
The study also selected four OIC member states for in-depth country case studies: Jordan, Malaysia, Nigeria and Pakistan. The countries were chosen to ensure broad geographical representation as well as to capture OIC member states that are in different stages of economic and educational development. In each country, a combination of secondary literature review, quantitative and qualitative data analysis were used to study the relationship between student performance and household poverty in empirical and policy perspectives. Qualitative data was gathered following a series of stakeholder interviews.
The recently announced Sustainable Development Goals (SDGs) has shifted the focus of education policy from access to quality at the national and international level. During the MDGs era (1990-2015), rapid growth in school participation occurred -- rates of out-of-school children dropped significantly, in line with the MGDs 4 target of universal primary school enrolment. However, the MDGs were too focused on enrollment, and ignored the most fundamental of aspect of schooling i.e. what children learn in the classroom. The challenges to ensure learning for all were not insufficiently recognized in the process expanding school participation. The post-2015 SDGs framework include more clear targets focusing on learning outcomes.
The prevalence of out-of-school population and illiteracy appears to be declining in countries with the rise in per capita income or economic development. Among the report’s case studies, Malaysia and Jordan brought all children in school as they graduated from low income to upper middle income countries. Literacy rates have also increased substantially reduced stunting in conjunction with robust growth performance of their economy and steady decline of poverty rates. There is a two-way relationship between improved educational participation and poverty rate so that early investment in the former has also aided poverty reduction in OIC member states like Malaysia.
However, OIC Countries are still disproportionately affected by the problem of out-of-school children problem than non-OIC countries. Two case study countries, Nigeria and Pakistan, have seen less satisfactory progress in terms of increase in school enrolment, let alone improvement in literacy rates and learning outcomes. Low income member countries also face the challenge of overcrowded classrooms, poorly trained teachers and poor physical conditions in which children attend school.
Economically advanced members of the OIC from Middle East and North Africa (MENA), Central and South-East Asia tend to participate more in international assessments of learning outcomes. The relatively wealthier Arab countries (from MENA) have a growing presence in international assessment facilitating in-depth, independent investigation into the state of education quality. In contrast, African member states of the OIC and those from South Asia are under-represented in terms of data and evidence on education quality.

2
A worrisome trend is the lack of progress in improving education quality in OIC countries in the last two decades among member countries in international assessments. The performance of OIC countries as a group in PISA and TIMSS does not suggest long-term improvements in education quality. If anything, the gap between OIC and participating non-OIC countries has widened over time. A large proportion of children in OIC countries do not attain the baseline level of proficiency in mathematics and science.
Only a small group of OIC member states show some signs of progress in terms of performance in international assessments. These include Indonesia, Malaysia, Jordan, Turkey and Kazakhstan. However, in most cases, the progress has not been sustained over time. After an impressive performance in the early rounds of PISA, Jordan has seen a slide in student performance. In case of Turkey, after a decade-long positive trend in PISA, there has been a decline though it is largely owing to a fall in the share of top performers; the percentage of students performing below proficiency levels performance of students has remained reasonably stable since 2006. In case of Indonesia and Malaysia, there are signs of recovery in the most recent round of PISA. It remains to be seen whether this trend will be sustained in the coming years. The next section discusses in details the case of Jordan and Malaysia.
There is also a sizable wealth gap in student performance in OIC countries. In some countries, urban children from the wealthiest quintile rank behind those from the poorest quintiles in rural parts of the OECD countries.
At the same time, in higher order competencies, there is also an absence of improvement across wealth groups. Even when a comparison is made among children in OIC and OECD sample countries who are similar in terms of observed socio-economics, those from OIC lag behind by the equivalent of more than one year of schooling. The learning shortfall is greatest in the case of Qatar.
In addition, the analysis of learning outcomes vis-à-vis the level of economic development (i.e. GDP per capita) shows that the strength of this association between the two outcomes is weaker in OIC than elsewhere. Some of the wealthiest OIC countries perform very poorly.
The majority of the member states where children have poor access to education remain outside the scrutiny as they do not participate in any of the major international assessments. However, growing country specific evidence for these countries, based on national assessments and sample surveys of student performance, also confirm low level of learning. The review of the available evidence from these countries based on country-specific survey data reveals that the learning crisis in the OIC countries is likely to be more severe.
Learning, instead of enrolment and school completion, should be the primary goal of education in the OIC countries. Most of the non-participating countries are income poor and have been found to be challenged by resource-strapped education systems. Schools have unfavorable teacher-student ratio and classrooms are overcrowded. There is a shortage of trained teachers. At the same time, among countries that participate in international assessments and allow independent scrutiny of their education systems, student performance does not show a systematic correlation with resources.
Improving the performance of government schools is therefore the key challenge. In most OIC member countries, the quality of education is low across the board –Islamic, private and government schools. In some instances, evidence shows a learning advantage associated with

3
government non-religious school attendance relative to madrasahs and private non-religious schools. However, these gaps are not large. While in some countries there is a rising trend in the provision of private school, access is still limited for children from poor families. The multivariate analysis of the determinants of student achievement among middle-income OIC countries shows a positive “private school effect”. However, a systematic effect is not present in all OIC countries.
A blueprint for madrasah education that caters to cultural and religious preferences without compromising on numeracy and literacy skills necessary for a modern economy needs to be developed. Many Muslim parents value religious education and opt for madrasah education for their children. Millions of children in the populous and economically poor OIC countries rely on Islamic schools or madrasahs. This non-state education provider can be an important partner in advancing education in Muslim communities. Yet a majority of these schools are left out of the reform programs. While many operate with state mandate, the level and nature of student learning is not regularly monitored. There is an OIC-wide evidence gap on madrasah education. Efforts to develop ‘model madrasahs’ offering quality religious and secular education as well as regulate existing seminaries have met with limited success.
Relying on greater fiscal allocations and poverty reduction is necessary for educational development – it helps to enroll and retain children in school. However, it is not sufficient to ensure access to quality education. Structural barriers to learning in school need to be identified. In all four case studies, strong evidence was found on the positive role played by pre-school attendance. One traditional source of learning disadvantage, gender, was absent in Jordan and Malaysia. This implies that some of the common factors may not be directly caused by poverty. Thus, poverty-specific policies need to be accompanied with teaching and learning-sensitive policies.
Starting early by investing in childhood (pre-primary) education and care is a key area for intervention. The relationship between attending pre-primary education and student performance in PISA 2012 is positive and significant in OIC countries. This shows that 15-year-olds who attended a pre-primary education programme tended to perform better than students who did not attend pre-primary education even after accounting for students’ socio-economic background.
However, equalizing access to quality early childhood education is a major challenge. Despite the sizable benefits associated with pre-primary education, however, children from a lower socio-economic background in OIC countries were less likely to have participated in pre-primary education.
Most OIC countries face the double burden of rising inequality of educational opportunity and declining educational standards despite making forward strides in terms of reducing in inequality in educational participation and completion. The problem is likely to be much more severe in countries where changes in learning outcomes are not documented using international benchmarks.
In most member countries, the national examination systems lack credibility and does not generate the appropriate incentives for students to acquire core competencies. In many countries, pass rate in terminal examinations are very poor indicators of numeracy and literacy skills. While participation in international assessments should be encouraged as a means to inform and aid government education reforms, equally important is to maintain the quality and credibility of

4
high-stake national examinations so that they truly capture the state of basic competencies and critical thinking skills.
A culture of evidence based reforms and ‘deliverology’ for results is lacking in OIC countries. Learning outcomes need to be measured regularly, disaggregated and sensitive to the most vulnerable. Data also needs to be made freely accessible to citizens to improve accountability through independent evaluation of performance outcomes. This evidence must drive interventions for high performance on what works for quality and what does not. Public policy and planning driven by evidence based culture to drive performance, innovations, inclusion, and right level of financing for results at the school, district, sub-national and national levels will make ‘learning’ everyone’s business.
Given the enormous diversity among countries in terms of culture, history and the stage of economic development, reform plans must be country specific and it is unlikely that a single model will apply to all OIC countries. Nonetheless, the OIC should revitalize regional organizations such as ALECSO and ISESCO and leverage the existing institutional set up to develop a wider research programs in partnerships with member country governments. But such collaboration will go a long way in addressing shared challenges such as gender disparity and social inequalities in education, low returns to investment in education and the engagement of the non-state sector.
The OIC should set up a Centre of Excellence to coordinate research and development in the field of education among member countries. This will help strengthen cooperation among members to facilitate dialogue and exchange of good practices. Initiatives such as this can help develop an OIC-wide learning metric to track progress in student achievement as a group of countries.

5
INTRODUCTION
Education is a key pathway for poverty reduction and sustainable development worldwide. At the individual level, lack of schooling lowers productivity, undermines voice and agency. Globally, a relatively small share of primary-school graduates is living in poverty (World Bank 2016). More schooling reduces child mortality and positively impacts on life expectancy, women’s empowerment and civic engagement. School education is also critical for transmitting social knowledge, building trust and increasing tolerance (Asadullah, 2016; Asadullah, Amin and Chaudhury, 2018). At the national level, education is one of the fundamental determinants of economic productivity. The accumulation of human capital through investment in education is a key factor for long-run growth performance (Lucas 1988). Education in the form of advancing knowledge and skills is necessary for adopting, attaining, and spreading new and improved technologies and production processes (Benhabib and Spiegel 2005).
Therefore, in addition to the fact that education is a fundamental human right, the economic case for investment in schooling is clear. According to the International Commission on Financing Global Education Opportunity, “a dollar invested in an additional year of schooling generates earnings and health benefits of $10 in low-income countries” and “a dollar invested in a one-year increase in the mean years of schooling generates more than US$5 in additional gross earnings in low-income countries” (Global Commission 2016). Sustained investments in human capital reduced poverty rapidly without substantive rise in inequality and delivering inclusive growth in East Asia (World Bank 2018a). Other instrumental non-economic benefits of a literate and educated society include greater support for democracy and tolerance for others.
Most countries around the world have seen an expansion in schooling opportunities in the past four decades. Following the global commitments to universalize education such as the UN Declaration of Human Rights in 1948, EFA, MDGs and more recently, the SDGs, there is a clear political consensus on education for all. Today, more children are in school and completing more years of schooling. This is also true for many OIC countries which have successfully expanded access to primary school education, encouraged by global initiatives such as the MDGs target of achieving universal primary education by 2015.
Today more children have access to basic education in the OIC countries than at the start of the MDG campaign. However, millions have been left behind when it comes to learning in school. The latest World Development Report (WDR) of the World Bank echoes UNESCO GMR 2014 and warns that there is a global learning crisis – schooling is not translating into learning. This implies that a large proportion of uneducated child today can be find in school. This is worrying because a primary channel through which schooling accelerates economic growth appears to be through boosting learning and skills. UNESCO (2014) estimates that learning crisis is costing $129 billion a year. This cost is particularly higher for developing countries in Sub-saharan Africa and South Asia which has a higher proportion of children out of school. Equally, poor quality education, especially in the early years in life, can undermine later achievements and reduce the equalizing power of education. The learning crisis also has intergenerational consequences. Educated mothers play a critical role in improving children’s health and cognitive development. Lack of basic numeracy and literacy skills among women implies low level of human capital in the next generation.
An illiterate population also imposes significant social and economic costs while an educated workforce is a valuable resource in today’s globalized economy. The double burden of low level of school enrollment and learning often coexists and contribute to unemployment, economic

6
stagnation and mass poverty. To the extent illiteracy adversely affects the lives and productivity of individuals, these deficits in education have political implications.
The poor quality of education therefore poses a serious policy challenge in many OIC countries where in general, the level of human development is already low. Member countries are significantly poorer and suffer from lower levels of education compared to non-OIC countries. They also lag behind the rest of the world in health indicators such as the high prevalence of open defecation, the lack of community health workers, the number of hospital beds and spend less on health as a share of GDP.
While the OIC comprises 57 member states across four continents, there is significant variation in terms of differences in economic opportunities. Extreme income poverty is very high in Sub-Saharan African member states and South Asia but low in most member countries in the MENA region, Central and East Asia.1 Income inequality is highest in African member states though the OIC average is lower when compared to other developing regions such as Latin America. However, compared to other regions, youth unemployment is high in most MENA countries (e.g. Egypt, Jordan, Tunisia and Yemen). In addition, labor market opportunities are limited for women in most OIC countries. Therefore pre-market investments in education and equalizing opportunities to learn are critical to reducing socio-economic inequalities in market opportunities in the OIC.
Taking into account the importance of quality education for social and economic development, the recently announced SDGs set a clear target to deliver quality education for all by 2030. According to UN (2017), education matters because it is “…..the key that will allow many other Sustainable Development Goals (SDGs) to be achieved. When people are able to get quality education they can break from the cycle of poverty. Education therefore helps to reduce inequalities and to reach gender equality. It also empowers people everywhere to live more healthy and sustainable lives. Education is also crucial to fostering tolerance between people and contributes to more peaceful societies”2 The importance of quality education is not only recognized in SDG 4, educational progress by 2030 is also critical for meeting other SDGs targets.
The renewed emphasis on quality education in the SDG campaign and the global efforts to tackle the challenge of delivering quality education for all is an important development for the OIC.
Objectives and Methodology of the Study
The aim of the study is to analyse the current status and causes of school attainment and student learning as well as efforts addressing student achievement in OIC countries, with a focus on poverty and maternal education. Given these objectives, the study aims to answer the following research questions:
1. What is the current quality of education in the OIC member states? How has it changed over time?
2. What are the main factors that determine the quality of education, particularly student learning?
3. What are the existing policy efforts to increase quality of education and the critical success factors?
1 Only in 3 Arab countries poverty rate (based on 2 dollar a day cut-off) is above 20%. These are Egypt, Djibouti, and Yemen. 2 http://www.un.org/sustainabledevelopment/wp-content/uploads/2017/02/ENGLISH_Why_it_Matters_Goal_4_QualityEducation.pdf

7
The report has three main segments: first section is conceptual discussions on education quality with reference to key global policy initiatives. This discussion also takes into account the relationships between school participation, student learning and poverty and between parental education and children’s literacy and numeracy skills. Section 3 answers questions 1 -3 above and is based on a comprehensive review of the international literature as well as primary data
analysis.
In the second part, secondary data on school participation and student achievement is compiled and analyzed for OIC member states to describe in detail the general state of education quality in OIC countries. This information was combined with indicators of economic development and public spending in order to generate knowledge on the relationship between development and educational outcomes. Furthermore, international and regional policy documents were consulted to understand the state of global policies regarding education quality in OIC countries.
Finally, the study presents in-depth case studies of 4 OIC countries: Pakistan, Malaysia, Jordan and Nigeria. These countries represent different geographic regions and level of educational development. For each of these countries, a statistical analysis of the determinants of learning outcomes is presented. In some instances, this also includes a statistical analysis of the intergenerational transmission of educational capital. For each of these four countries, Key stakeholder interviews and a comprehensive review of the secondary literature on the correlates of student learning were also conducted. Attention has been given to key drivers of learning outcomes such as household poverty.
Main policy recommendations are presented in the 4 part. Throughout the report the focus is on learning outcomes among children in secondary grades, as most student assessments are at the secondary level. School completion and literacy levels are also reviewed as data on these indicators are widely available.

8
1. CONCEPTUAL FRAMEWORK
This section reviews major international publications to summarize the current thinking around education quality internationally. On that basis, a conceptual framework laid out to organize the empirical analysis on education quality in OIC countries. International goals and targets relating to education and how this has changed are also briefly discussed. Towards the end of the section, measures and determinants of education quality are discuss. The role of poverty in shaping educational outcomes in the literature is also discussed.
Global Targets: EFA, MDGs and SDGs
The international agenda governing and monitoring educational development has changed considerably over the last two decades. In 2000, the World Education Forum launched the Dakar Framework for Action.3 The Framework comprised two key elements: 6 goals (and associated targets) to be achieved by 2015 and 12 strategies to which all stakeholders would contribute. This called for better access to early childhood care as well as compulsory and free education. It also emphasizes on gender equality and improvements in education quality. EFA goal 3 (ensuring that the learning needs of all young people and adults are met through equitable access to appropriate learning and life skills programmes) and goal 6 (Improving all aspects of the quality of education and ensuring excellence of all so that recognized and measurable learning outcomes are achieved by all, especially in literacy, numeracy and essential life skills) were explicitly focused on education quality.
The same year, the Millennium Development Goals (MDGs) were launched which overshadowed the Dakar-based EFA agenda. In contrast to the ambitious EFA targets which focused on early childhood, primary, secondary and adult education, the MDG focus on education was narrow. Of the eight development goals, only one (goal 2) focused on education and set the target of “universal primary education” for every child in the world by 2015. Another related target is to “eliminate gender disparity in primary and secondary education, preferably by 2005, and in all levels of education no later than 2015.” Given the single-focus of MDGs on universal primary education, the more holistic targets of EFA were ignored.
Progress towards these two targets has been assessed in terms of the number of children enrolled in primary education, the number completing the primary schooling cycle, and the number of 15- to 24-year-olds attaining reading and writing skills. During the MDG era, access to basic education increased significantly. Between 2001 and 2011, the gross enrollment ratio in primary education rose by about 28 percentage points, reaching about 80 percent (World Bank 2016). An assessment of trends for the period 2000-2015 confirms impressive gains4:
a) The primary school net enrolment rate in the developing regions has increased by 8 percentage points (from 83% in 2000 to 91% in 2015).
b) The number of out-of-school children of primary school age worldwide has fallen to an estimated 57 million in 2015 (against 100 million in 2000). c) The literacy rate among youth aged 15-24 has also increased from 83% to 91%. The gender gap in literacy has narrowed.
3UNESCO (2015) EDUCATION FOR ALL 2000-2015: achievements and challenges http://unesdoc.unesco.org/images/0023/002322/232205e.pdf 4The 2015 Millennium Development Goals Report http://www.un.org/millenniumgoals/2015_MDG_Report/pdf/MDG%202015%20rev%20(July%201).pdf

9
In sum, notable progress has been made in access to primary school during the MDG era. The number of out-of-school children has fallen while literacy rates for children and adults have increased. In many countries, gender disparity in primary school enrolment and completion has also been addressed. However, progress has been slow in other aspects, particularly those identified in the Dakar-framework. Children from marginalized socio-economic groups are not yet reached by 2015. As discussed later in this section, the rich-poor gap in access to primary education remains sizable. Factors such as household economic status and geographic location (e.g. rural vs urban) continue to decide student learning level.
The 2015 MDG report also notes a rise in the proportion of out-of-school children – from 30% in 1999 to 36% in 2012 – in conflict-affected countries in Northern Africa and Southern Asia. Most importantly, according to GMR 2015, the focus on universal primary enrolment reduced attention to other areas critical for educational development --education quality, early childhood care and cognitive development, and adult literacy. The single-focus on access and primary education has often led to pursuit of strategies that overlooking a silent learning crisis. These concerns were taken into account when various national and international stakeholders met to set new global targets for post-2015 years.
The MDG campaign is widely regarded a success when assessed in terms of the goal of halving global poverty by 2015 (“The Millennium Development Goals Report,” 2015). Poverty is one of the major barriers to children’s schooling. Therefore the progress in poverty reduction also led to income-mediated progress in school enrolment in many parts of the world. At the same time, not all countries benefited or responded equally to the MDG campaign. A number of external and internal factors combined to undermine progress in poverty reduction, ending hunger and bringing all children to schools. This is particularly true in the case of Sub-Saharan Africa where high unemployment rate, growth slowdown, climate change and natural disasters, political instabilities and numerous humanitarian crises limited the capacity of the progress to advance the cause of education (“The Millennium Development Goals Report,” 2015).
Moreover, there are however concerns over the limitations of the MDG framework in terms of the formulation of the MDGs, their structure, content and implementation. Only two out of the three time-bound education goals identified at the Dakar World Education Forum in 2000 were included in the MDGs (Fehling, Nelson, & Venkatapuram, 2013). Most importantly, because of the limited focus of MDG 2 on primary education, the importance of secondary education was ignored (Mekonen, 2010). The absence of a target pupil–teacher ratio in the MDG agenda meant that universal primary education could be achieved with a worsening of PTR. This led to abnormally high PTR in some OIC countries (e.g. 69 pupils per teacher in Chad) (Mekonen 2010). Overall, MDG 2 failed to ensure quality issues such as availability of quality teachers, adequate school infrastructure and maintenance (Barrett, 2011; Lay, 2012).
At the end of the MDG area, it is acknowledged that schooling without learning is a tremendous waste of resources and opportunities. There is a global consensus that the focus on primary education in the MDGs was inadequate. Moreover, exclusion of quality-specific indicators and targets led to a focus on quantity at the cost of progress in literacy and numeracy. The other lesson from the MDG era is the importance of system-wide approach instead of the uni-sectoral approach to deliver quality as well as quantity. The focus on primary education caused huge challenges in countries that successfully met the MDG goal of universal primary education. However with no target relating to post-primary education, these countries did not expand the secondary education to absorb primary school graduates. The focus on enrolment instead of

10
learning at the primary level meant that many entrants to the secondary education cycle didn’t acquire the basic competencies to cope with secondary school curriculum.
Over the past decades, the UN agencies such as the UNESCO and UNICEF, together with other multilateral bodies such as the World Bank, have played a key role in drawing attention to global education challenges and developing common frameworks to guide national policy planning and formulation as well as setting goals and targets to monitor progress. These along with various bilateral government agencies (e.g. DFID, USAID) and international non-government organizations (INGOs) have also contributed in terms of providing technical assistance and external aid to various OIC and non-OIC member states. In conflict affected countries, these supports are often motivated by humanitarian concerns.
This long-term collaboration among international and national stakeholders culminated in the World Education Forum 2015. Held in Incheon, Republic of Korea and organized by UNESCO together with UNICEF, the World Bank, UNFPA, UNDP, UN Women and UNHCR, the event was attended by senior education officials, officials of multilateral and bilateral organizations, and representatives of civil society from 160 countries (UNESCO 2015). The Forum adopted the Incheon Declaration for Education 2030, which put together a road map and a new vision for educational development worldwide for the next fifteen years – “Towards 2030”. This coincided with the United Nations’ Sustainable Development Goals (SDGs) which aim to ensure inclusive, equitable, good-quality education and lifelong learning for all by 2030. Table 1.1 below presents the SDGs targets specific to the delivery of quality education for all by 2030.
Table 1.1: SDG 4 Targets
Target 4.1: By 2030, ensure that all girls and boys complete free, equitable and quality primary and secondary education leading to relevant and Goal-4 effective learning outcomes Target 4.2: Early childhood - By 2030, ensure that all girls and boys have access to quality early childhood development, care and preprimary education so that they are ready for primary education Target 4.3: Technical, Vocational education - By 2030, ensure equal access for all women and men to affordable and quality technical, vocational and tertiary education, including university Target 4.4: skills for work - By 2030, substantially increase the number of youth and adults who have relevant skills, including technical and vocational skills, for employment, decent jobs and entrepreneurship Target 4.5: Equity - By 2030, eliminate gender disparities in education and ensure equal access to all levels of education and vocational training for the vulnerable, including persons with disabilities, indigenous peoples and children in vulnerable situations Target 4.6: Literacy and Numeracy - By 2030, ensure that all youth and a substantial proportion of adults, both men and women, achieve literacy and numeracy Target 4.7: Sustainable development - By 2030, ensure that all learners acquire the knowledge and skills needed to promote sustainable development, including, among others, through education for sustainable development and sustainable lifestyles, human rights, gender equality, promotion of a culture of peace and non-violence, global citizenship and appreciation of cultural diversity and of culture’s contribution to sustainable development Target 4.A: Education facilities and learning environment - Build and upgrade education facilities that are child, disability and gender sensitive and provide safe, nonviolent, inclusive and effective learning environments for all

11
Target 4.B: Scholarships - By 2020, substantially expand globally the number of scholarships available to developing countries, in particular least developed countries, small island developing States and African countries, for enrolment in higher education, including vocational training and information and communications technology, technical, engineering and scientific programmes, in developed countries and other developing countries Target 4.C: Teachers - By 2030, substantially increase the supply of qualified teachers, including through international cooperation for teacher training in developing countries, especially least developed countries and small island developing states
Quality education is also central to achieving SDG 3 (Ensure healthy lives and promote well-being for all at all ages) and SDG 5 (Achieve gender equality and empower all women and girls).
The latest GMR of UNESCO proposes an accountability-focused framework to deliver quality education.
Accountability is defined as “a process aimed at helping individuals or institutions meet their responsibilities and reach their goals” with three key elements: (a) Clearly defined responsibilities; (b) Obligation to provide an account of how responsibilities have been met; (c) Legal, political, social or moral justification for the obligation to account. The delivery of equitable quality education is described as a shared responsibility whereby different stakeholders -- governments, schools, teachers, parents, students, international organizations and the private sector – work together and depend on each other. The success of the accountability approach hinges on an enabling environment, which is defined in terms of four characteristics:
Information - Provisions of transparent information and relevant data relating to responsibilities of different actors.
Resources - Access to necessary financial resources Capacity - the necessary administrative and institutional capacity to meet respective
responsibilities. Motivation -- confidence in the governance process, as well as the political commitment
and will While any single actor is not responsible, accountability starts with government. Accounting for system-wide problems such as teacher absenteeism in government schools in the primary and secondary sector is critical. This is also a key reason for the poor returns to public spending in education. Lack of accountability among teachers in low-income countries creates a bigger challenge given the limited public budget and insufficient provision of infrastructure and human resources (e.g. teachers). Investments in health and education infrastructure in low income countries largely depend on donor funding. In spite of some increase in public education spending during the decade, education expenditures as a percentage of GDP is still low by international standards (World Bank 2016). The lack of accountability disproportionately affects children in poor countries and communities. Globally children’s access to quality services still depends on the economic and social circumstances into which they are born. This implies that educational opportunities are not equal, particularly in low-income countries. The quality and coverage of educational services remains an important source of income inequality. Therefore holding school authorities and teachers accountable is necessary to deliver inclusive quality education.

12
Conceptualizing Quality Education
There is significant disagreement among scholars on the determinants of student achievement. Existing factors influencing student performance can be organized in three main categories: (1) supply-side interventions and inputs such as better physical and human resources, and learning materials; (2) policies that shape incentives and influences behaviour and preferences of teachers, parents, and students; (3) participatory management interventions such as decentralisation reforms, information provision, and community participation in the management of schools (Masino and Niño-Zarazúa 2016).
An additional reason for unsatisfactory progress is the implementation failure. Many developing countries, particularly those affected by conflicts, lack administrative capabilities to effectively deliver education services (Pritchett, Woolcock and Andrews 2013). According to the WDR 2018, governments have to think beyond piecemeal policies and programs. Therefore, entire education systems need to be organized around the goal of progress in learning. Children are being deprived of learning opportunities not only because of problems in the classroom. There are other factors limiting their learning experience at the school and community level. Equally, school principals may be constrained by the scarcity of inputs at the school level as much as by the lack of say over how inputs are to be used to boost learning among children. Therefore, it is not sufficient to study the proximate determinants of student learning with a focus on child, family and classroom specific factors. A clear understanding of the system-wide determinants of learning outcome is equally important. This is true not just for generating evidence on what works in the delivery of quality education. A system-wide approach is also critical in identifying potential cases of implementation failure. A program with clear scientific evidence may fail, when scaled up, because the community and political leaders are not aligned with the goal of prioritizing learning.
The WDR 2018 organizes the correlates of low learning into four groups: (a) lack of good teachers (b) lack of school readiness among children (c) school inputs that don’t affect teaching and learning and (d) unsupportive school management. However, many of these correlates also affect learning indirectly by determining the time spent in school. Indeed the battle for achieving SDG 4 for many developing countries is being fought in three fonts: Intake, completion and learning. In many countries, the opportunities to learning are limited for children are not often in school. Elsewhere, those in school are forced to prematurely leave the system before mastering basic literacy skills. Therefore, according to UNICEF (2015), the probability that a child will have the full benefits of her or his education is equal to the multiplicative product of intake (the % of children who enter school), completion (the proportion among entrants who reach the end of primary or lower secondary education) and learning (the probability of receiving a full learning experience). For instance, children from poor families suffer in all three aspects: they are less likely to enroll, more likely to drop out early and less likely to attain basic competencies when in school because they are deprived of critical pre-school inputs. Therefore, in this study, these two conceptual frameworks to guide the analysis of trends in education quality in the OIC countries are combined.

13
Figure 1.1: The Concept of Quality Education
Equitable Quality Education
High
intake
High completion
rate
Full learning experience
Teacher quality
School
readiness
School management
& leadership
Physical facilities
in school
Source: Author, based on OECD-UNICEF (2016) and WDR 2018 Following the above framework, a quality education system is defined as one that achieves inclusive education by ensuring intake, completion and learning as a function of teacher quality, school readiness and household poverty, school management and leadership, physical environment in school. Teacher quality refers to having formal qualifications as well as motivation. School readiness factors include child health, early childhood development and learning environment at home. It is assumed that these factors are determined by household poverty and parental capability (particularly maternal education). Child’s gender, age, disability, language, location and citizenship status (migrants) can also affect school readiness and these are recognized as important sources of inequality in learning opportunities5. Social customs can dictate outside movement and interaction at a certain age different for boys and girls causing gender gaps. Customs such as female genital mutilation and child marriage are other examples of gender specific hurdles.
The OECD-UNICEF (2016) proposes an integrated “school as learning organisation” model where “a school as learning organisation has the capacity to change and adapt routinely to new environments and circumstances as its members, individually and together, learn their way to realizing their vision”. The model focuses on:
1. developing and sharing a vision centred on the learning of all students 2. creating and supporting continuous learning opportunities for all staff 3. promoting team learning and collaboration among all staff 4. establishing a culture of inquiry, innovation and exploration 5. embedding systems for collecting and exchanging knowledge and learning 6. learning with and from the external environment and larger learning system 7. modelling and growing learning leadership.
5 Balcazar, Narayan, and Tiwari (2015)

14
These seven action-oriented “dimensions” are critical to the delivery of student learning and highlights the processes the school goes through as it transforms itself into a learning organisation.
Measuring Education Quality
Education quality is a slippery concept and is interpreted in different ways. Measuring education quality is complicated by the fact that (a) the outcomes of education is multidimensional, (b) countries vary in terms of length of compulsory education , (c) quality is observed only for enrolled students and (d) the participation rate across the compulsory and post-compulsory education levels vary greatly across countries. An effective education system teaches civic and moral values, builds basic literacy and numeracy skills as well as higher order cognitive skills. One can also evaluate quality from two perspectives: (i) fundamental quality; (ii) excellence (World Bank 2008). The former refers to proportion of students who have attained the basic competencies to complete the schooling cycle and participate in the labor market. The latter relates to the proportion of students who belong to the global top 10% of learners or have entered into “world-class” research universities. Fundamental quality also requires a shift from memorization and rote learning to greater focus on communication, analytical and critical thinking skills. In this report, the analysis focuses on two measures of fundamental quality: (a) literacy rates in the adult population and (b) international test scores for math, reading and science.
In the context of SDGs, ‘quality education’ is best reflected in terms of fundamental quality -- how much children learn in school. However, there is no global metric to measure education quality defined in terms of student learning. Compared to data on other aspect of children’s development (e.g. malnutrition), measuring learning outcome is much more challenging. There are many domains as well as levels of learning. Education systems around the world also have different curriculum standards and often have unique set of basic competencies that students are required to master. In contrast to health outcomes data on which is routinely gathered by national governments following standard measurement standards and made available through international bodies such as WHO, the production of statistics on education quality is not well-coordinated. Countries vary in terms of national assessments as well participation in international exercise that evaluates student performance. Data on input quality also varies across OIC countries.
The SDGs focus on lifelong learning and early childhood development raises another measurement issue. There is an emerging consensus on the importance of early childhood development (ECD) and non- cognitive (i.e. soft) skills in acquiring cognitive skills as well as equalizing opportunities in learning in school age. However, comparable data on soft skills is unavailable. Equally there is no international assessment of pre-school education quality.
While PISA assesses “representative” samples of students in secondary schools in three different subjects, mathematics, science and reading, they do not capture early life learning. This is also true for PIRLS and TIMSS grade 4 which cover math, science and reading proficiency in later part of the primary schooling cycle. Moreover, participation of OIC countries in these two assessment exercise is limited. A globally recognized assessment of early grade numeracy and literacy skills is EGRA and EGMA.6 The United States Agency for International Development (USAID) ran a project entitled “Education Data for Decision Making (EdData II)” between 2004
6 For details on EGRA assessment, see Dubeck and Gove (2015).

15
and 2016 which covered 35 countries in total (23 in EMGA and 9 in EGRA). A number of OIC countries participated in EdData II though very few participated in both EGRA and EGMA.7 However, many countries have implemented EGRA and EGMA in the context of other national projects.
In contrast to TIMSS, PIRLS, PISA, EGRA and EGMA, data on literacy rate is readily available for a wide range of countries though it is only a crude measure of quality of learning outcome. Since literacy information is regularly collected by OIC member countries, it is available for almost all countries and provides a broad measure of the learning outcomes of a country’s education system. However, being self-assessed, this may not align with trends in learning outcomes. Input-based quality indicators such as are STR and proportion of trained teachers are also widely available for OIC countries. A school or education system is considered to be high-quality if it has more resources per child.
Another useful source of information on the input quality is the OECD’s Teaching and Learning International Survey (TALIS) which contains detailed data on the quality of lower secondary (mainstream) school teachers and leaders. In each country, about 200 schools were sampled and in each school, 20 teachers and 1 school leader were interviewed. However, OIC countries are poorly represented in this survey. In TALIS 2013, the 34 countries and economies covered included only 2 OIC member states -- Malaysia and UAE.8 While the number of countries covered in TALIS 2018 increased to 50, the share of OIC member states among participating countries remained largely the same. While Saudi Arabia and Kazakhstan joined United Arab Emirates and Turkey, Malaysia dropped out after participating in 2008 and 2013 rounds9. Therefore, TALIS data has not been used for statistical analysis.
Since the OIC and most other developing countries face a multitude of problems in education service delivery, particularly in terms of access as well as quality, it is difficult to compare achievements across countries. One solution is to develop a unified measurement framework that integrates schooling and learning shortfalls. Such integrated framework encompasses a range of schooling, learning and education deprivation measures (Datt and Wang 2017). Equally, one can use a composite statistical measure of “access to literacy” and “access to numeracy” by combining information on educational quantity and educational quality. Some attempts have been made to combine household data (e.g. Demographic and Health Survey) on grade completion with survey data (e.g. Southern and Eastern African Consortium for Monitoring Educational Quality or SACMEQ) on learning outcomes for 11 African countries: Kenya, Lesotho, Malawi, Mozambique, Namibia, South Africa, Swaziland, Tanzania, Uganda, Zambia, and Zimbabwe (Spaull and Taylor, 2015). However, such measurement framework and composite indicators are yet to be fully standardized, tested and adopted by international bodies
7 There is also a school based survey called the “Snapshot of School Management Effectiveness” (SSME), developed with support from the USAID. The SSME was designed to capture indicators of effective schools that have been identified by researchers as important for student learning. The SSME also collects information on student and household characteristics, basic school inputs (e.g., school infrastructure, pedagogical materials, teacher and head teacher characteristics), and classroom teaching and learning processes (e.g., instructional content, student teacher interaction, and assessment techniques). In addition, selected EGRA and EGMA components are often combined with the SSME to produce information on learning outcomes in reading, writing, and arithmetic (Mulcahy-Dunn, Dick, Crouch, and Newton, 2016). 8 Turkey only participated in 2008 round; see http://www.oecd.org/edu/school/talis-about.htm 9 http://www.oecd.org/edu/school/participantsinthetalissurvey2018.htm

16
such as the OECD and UNESCO. This report too does not use a fully integrated measurement framework.
Data and Methodological Framework
While centralized global development database such as WDI includes a rich set of indicators of child health (e.g. stunting, wasting, under-weight and under-nourishment), education related outcome indicators only relate to self-reported literacy rates. However, one exception is the WIDE dataset which does not contain country-level information on poverty and income level. To this end, a hybrid dataset that contains student learning data for a wide range of countries in the world along with information on educational and economic development of the country has been constructed. This data set is used primarily to describe OIC wide trends in learning outcomes and input quality. In specific cases (e.g. for measures of accountability among teachers), this has been complemented by data used in published studies.
Trend analysis of learning outcomes is primarily based on performance in PISA, TIMSS, SACMEQ, PIRLS and EGRA and has a greater emphasis on secondary school students who participated in TIMSS and PISA. In the absence of comparable data on learning outcomes for primary and pre-primary education, EGRA and EGMA data is used to comment on learning levels in early grade. This is completed by analysis based on PIRLS and TIMSS grade 4 which help assess learning level among children in upper primary grades. For the vast majority of OIC countries, internationally comparable data is not available. Discussion on these countries is based on input specific indicators of quality such as PTR and proportion of trained teachers. Desk review of national assessment of student performance is used to comment on education quality in these countries. Since majority of the OIC countries don’t participate in any major international assessment of learning outcomes, additionally data on youth literacy is used which is widely available for most OIC countries. For these reasons, the measures of quality vary throughout the report based on the underlying data source.
The following issues need to be kept in mind when interpreting findings of our descriptive trend analysis at the country or region level.
First, most OIC countries with no comparable data on learning outcomes are low or lower middle income. Therefore, the report does not draw comparison of participating countries by income groups. Instead, for comparison purposes, other non-OIC countries are grouped into OECD and non-OCED countries. While the majority in the OIC sample has a high poverty rate, those participating in TIMSS and PISA are middle or high income countries or aspiring to be high income countries in the near future.
Many OIC countries have explicit targets to achieve OECD average scores in international student assessments. Major national policy documents of OIC member states such as Saudi Arabia’s Vision 2030, Jordan’s NCHRD 2016 report and Egypt’s Sustainable Development Strategy have adopted indictors relating to achieving a certain performance benchmark in international assessments such as TIMSS and PISA. For these reasons, despite some differences in income, a comparison of OIC with OECD and non-OECD countries is meaningful.
Second, participation in TIMSS and PISA among OIC countries vary over time – some countries joined late while some have withdrawn from the recent round of assessment. This again affects trend analysis. Given the variation in participation rate, no attempt has been made to restrict comparison to the same group of OIC countries in the analysis based on TIMSS and PISA.

17
Third, not all student assessment exercises are conducted in the same year. Countries also vary in terms of participation in a particular assessment round. The availability of data on input quality indicators is also often specific to certain years. For these reasons, the composition of countries for a given indicator for each given year can vary dramatically. Wherever possible, five-year averages have bene used to ensure that comparisons of indicator averages are made using the largest possible sample of countries.
In addition to looking at levels of learning outcomes, the analysis also comment on education quality with reference to distributional concerns such as the extent of inequality in school completion, inequality of opportunity in learning outcomes and the share of disadvantaged students (i.e. those in the lowest 25% of socioeconomic status) who score among the top 25% of students internationally, among students of similar socio-economic status. Detailed country-level description analysis is performed with a focus on wealth groups. The wealth-learning gradients are also compared over time and across countries.
Alongside using WIDE database of UNESCO and the World Bank’s World Data Indicators (WDI) database of the World Bank, student level data has been used to study the determinants of learning outcomes. Student level analysis of learning outcomes is primarily based on the fifth (i.e. 2012) round of PISA survey where each student assessed had finished at least six years of school. The methodological approach involves estimation of child-level educational production motivated by factors recognized in the conceptual framework (Figure 1.1) which explain how learners, educators and the schooling environment combine to produce learning outcomes. Child specific factors also include pre-determined circumstances (e.g. early childhood schooling) which predate current schooling choices. System-wide factors are recognized along with those that relate to resources and accountability; subject to the underlying data set used, the model specification accounts for governance issues.
For i-th student achievement score in a given subject (j) and country (k), the relationship between inputs and output can be summarized in an achievement function as follows:
Student Achievementijk = f (C, F, S, I) + eijk where C, F, S and I are vectors of child, family/parent, school and institution specific characteristics while e is the random error term. The regression function is estimated using the ordinary least squares (OLS) technique. Vector C includes demographic factors such as the student’s gender, whether the child has attended preschool or not. Vector F includes family background variables used are also recognized as important circumstances factors and characteristics over which adolescents have no control such as presence of parents at home, education level of the most educated parent/guardian, immigration status, quintile in the distribution of wealth, and city size.10
The regression model is estimated using the ordinary least square (OLS) regression method. PISA is used in lieu of TIMSS for two reasons. First, it assess student performance in three domains whereas TIMSS is only limited to mathematics and science. Second, TIMSS data set
10 Balcazar, Narayan, and Tiwari (2015) employ the following factors to define the circumstances vector in their research on inequality of educational opportunities using PISA data: (i) gender, (ii) whether the child has attended preschool or not, (iii) presence of parents at home, (iv) education level of the most educated parent/guardian, (v) immigration status, (vi) quintile in the distribution of economic, social and cultural status, and (vii) city size.

18
doesn’t have detailed information of family backgrounds. While this is available for grade 4 students, Jordan doesn’t participate in that version of TIMSS. In contrast, PISA data set includes a wide range of indicators capturing household socio-economic status. The preferred socio-economic status measure is the wealth index which is also used in the country-level descriptive analysis.11
Two sets of estimates are presented. First, using PISA data, OIC-wide analysis is undertaken. For the sample of participating OIC countries as a group and contrasted with the same for the groups of OECD and non-OECD non-OIC countries, to be presented in section 2 as part of the macro analysis of education quality issues in the OIC. Second, country-specific regression analysis is undertaken following the same approach in section 3 for Jordan and Malaysia as the underlying data also comes from PISA 2012. The estimation strategy accounts for multiple plausible values of the dependent variable.
In case of Nigeria and Pakistan, child level available assessment data corresponds to the primary school level competency and come from two different sources which are not directly comparable. Children tested also differ in terms of age group. Given differences in the sample and underlying data set, it was not possible to maintain a fixed set of explanatory variables for several reasons. Therefore, the full set of explanatory variables is not described here. Nonetheless, certain variables have been included to ensure comparability (subject to availability) in all country-specific analysis. These variables are described below.
Poverty: to describe poverty, the wealth quintiles generated by the authors have been used.
School readiness: pre-school attendance Other child-specific variable: the age and sex of the child, urban-rural residence, age and
sex of the household head. Measure of intergenerational influence: Since none of the available data sets for study
countries have information on literacy outcomes for parents as well as children, it is not possible to directly examine the extent of intergenerational transmission of illiteracy. Nonetheless, it remains a serious issue in Nigeria and Pakistan where a large proportion of children are first-generation learners and at-risk of remaining functionally illiterate despite access to schooling. Therefore, in all cases, multivariate regression models at least include parental schooling.
Given the stratifications in EGRA Nigeria survey, analysis of the raw data accounts use -svy- command in STATA to account for the sample weighting. All regression models are estimated using student final weight (i.e. wt_final) to scale to the population of males/females enrolled in grades 2 and 3 for each State. Since students were tested in five subtests to measure foundational to higher order literacy skills (letter sound identification, non-word coding, Oral reading fluency (ORF), reading comprehension, listening comprehension) as part of the EGRA assessment, multiple dependant variables are considered. The determinants of total scores are 11 However, sensitive check has been also performed using the index of Economic, Social and Cultural Status (ESCS) constructed by the OECD. The index is constructed using information on a basket of 10 household items that are common across participating countries: (i) a dishwasher; (ii) a DVD player; (iii) number of cellular phones, televisions, computers, cars, rooms with a bath or shower; (iv) a room of their own; (iv) a computer that can be used for schoolwork; (v) educational software; (vi) Internet; (vii) a desk; (viii) a quiet place to study; (ix) books to help with school work and (x) reading materials and books. In addition, it includes three country specific items. In order to document the extent of inequality in the level of student achievement, we use a number of alternative proxy measures of household SES.

19
studied using OLS regression model while the determinants of zero scores in subtasks are studied using Probit model. The analysis is primarily based on student performance in Hausa since English assessment was only carried out on government school children.
In sum, while the analysis in this report defines quality primarily in terms of learning outcomes, it is not possible to comparable all countries in all domains of learning. Some measures of student learning focus on grade-specific sample (TIMSS and PIRLS) while others sample students based on their age (PISA). These international assessments are sample-based and only reflect quality based on children who participate in the assessment exercise. Moreover, not all countries participate in these surveys, creating a missing data problem. While most non-participating countries have national assessment system, the data is neither released in public domain nor comparable to student performance from other countries. Analysis of learning outcomes in this study therefore primarily relies on TIMSS and PISA. This provides measures of education quality in terms of student performance in math, science and language. In spite of the sample-based nature of the assessments, they offer important insights into the relative capacity of participating countries to transmit basic cognitive skills to students. Lastly, only a handful of OIC member states has conducted early (primary) grade evaluation of student learning. The number of OIC countries which participated in internationally coordinated assessment of primary school children is very small (2 in SACMEQ and 8 in EGRA). Therefore the analysis of trends in learning outcomes is primarily based on children enrolled in upper-primary and/or secondary grades.

20
2. EDUCATION QUALITY IN THE OIC MEMBER COUNTRIES
This section provides a broad overview of the OIC member states. The primary objective here is to document (a) the current quality of education level in OIC and how has it changed over time; (b) identify the main factors that determine the quality of education and how they differ between OIC countries and over time and (c) identify policy efforts to increase quality of education and the critical success factors.
In terms of statistical analysis, data is organized and presented both at the region level (OIC vs other regions) as well as individual country level. The latter approach facilitates a within OIC analysis. In all cases, the status of quality of education in the OIC countries (as a group as well as individually) is compared with global level and trends. A wide range of international student learning assessment data sets is used, wherever they cover OIC countries, to perform a global analysis of educational achievement. Since internationally comparable data is available only for a sub-sample of OIC member states, mostly upper-middle income countries, the comparison is not adjusted to non-OIC countries by income level. The analysis is primarily descriptive (trends analysis, based on secondary sources). Cases of "positive deviations" are highlighted wherever appropriate. The discussion also highlights the experience of specific countries for which high quality evidence and publicly accessible data on education quality is available.
The selection of measures of education quality as well as variables explaining it is motivated by the conceptual framework explained in section 1. Accordingly, the discussion is organized around four pillars of indicators: (a) access and participation; (b) education system output; (c) financial and human resources; and (d) learning environments. For interpretation of major national and regional trends in education indicators (as well as later policy recommendation purposes), policy documents produced by sub-regional forums involving OIC countries such as E-9 are also consulted.1 For the Middle East and North Africa region, the policy documents produced by the Arab Regional Agenda for Improving Education Quality (ARAIEQ) and the Arab League’s Educational, Cultural, and Scientific Organization (ALECSO) are consulted.
The State of Education Quality in the OIC Member Countries
2.1.1. Level of Student Learning
Figure 2.1 presents country level TIMSS scores in math and science by per capita GDP. Given that the small number of participating countries and relatively wealthy OIC countries are well-represented in TIMSS, high-income OECD countries are retained for comparison purposes. Students from Kazakhstan and Turkey perform around the OECD average despite their much lower income relative to OECD countries. These two OIC countries also outrank other participating wealthy OIC member states such as Qatar, UAE, Kuwait and Saudi Arabia. Turkey also outperforms Qatar and UAE in the latest round of PISA assessment. However, the performance of OIC countries in PISA is in general is less satisfactory when compared to OECD countries. Mean math and science scores in the majority of OECD countries are above 500 points while in case of OIC countries except Turkey, the scores are below 450 mark.
1 Forums such as Developing-8 are ignored as education is not one of the priority areas; see http://developing8.org/

21
Figure 2.1: Average Math and Science Score in TIMSS
Source: Authors’ calculations based on WIDE and the WDI data.
Figure 2.2 presents country level PISA and PIRLS scores by per capita GDP. Students from Kazakhstan and Turkey perform favorably with respect to the OECD average despite their much lower income relative to OECD countries. In the OECD sample, the average PISA score for each subject is about 490 points. Scoring 30 points above that is roughly equivalent to completing an extra year of schooling. Using that yardstick, children in Qatar are several years of schooling behind their counterparts in the OECD in science, reading and mathematics.
AREBHR
IDN
IRN
JOR
KAZ
KWT
MAR
OMNQAT
SAU
TUR
30
04
00
50
06
00
Mat
hs
sco
re in
TIM
SS, 2
01
5
0 20000 40000 60000 80000GDP per capita, 2006-2010
OIC OECD
NON-OECD
AREBHR
IDN
IRN
KAZ
KWT
MAR
OMN QAT
SAU
TUR
30
04
00
50
06
00
Scie
nce
sco
re in
TIM
SS, 2
01
5
0 20000 40000 60000 80000GDP per capita, 2006-2010
OIC OECD
NON-OECD
AREBHRIRN
KAZ
KWTMAR
OMN
QATSAU
TUR
35
04
00
45
05
00
55
06
00
Mat
hs
sco
re in
TIM
SS, 2
01
1
0 20000 40000 60000 80000GDP per capita, 2006-2010
OIC OECD
NON-OECD
AREBHRIRN
KAZ
KWT
MAR
OMNQAT
SAU
TUR
20
03
00
40
05
00
60
0
Scie
nce
sco
re in
TIM
SS, 2
01
1
0 20000 40000 60000 80000GDP per capita, 2006-2010
OIC OECD
NON-OECD

22
Figure 2.2: Average Math, Reading and Science Scores in PISA and Reading Score in PIRLS
Source: Authors’ calculations based on WIDE and the WDI data.
Since African countries are poorly represented in TIMSS and PISA, Figures 2.3 and 2.4 plot data on student performance in reading in SACMEQ and EGRA assessments respectively. In case of SACMEQ 2012, of the two participating OIC countries, Mozambique is in the bottom quartile while Uganda is behind five other non-OIC participating countries. Uganda also performs poorly in EGRA assessments in terms of % share of students with zero scores in elementary standard reading tests. The underperformance of African countries such as Uganda could be partly owing to mass poverty. For instance, in the case of the EGRA assessment, the OIC country with the best outcome is Jordan which has a much higher income compared to other participating OIC countries. The country with the worst performance record in EGRA, Nigeria, also has a high level of poverty.
ALB
ARE
IDNJOR
KAZMYS
QAT
TUN
TUR
35
04
00
45
05
00
55
0
Mat
hs
sco
re in
PIS
A, 2
01
2
0 20000 40000 60000 80000GDP per capita, 2006-2010
OIC OECD
NON-OECD
ALB
ARE
IDNJORKAZMYS
QAT
TUN
TUR
35
04
00
45
05
00
55
0
Rea
din
g sc
ore
in P
ISA
, 20
12
0 20000 40000 60000 80000GDP per capita, 2006-2010
OIC OECD
NON-OECD
ALB
ARE
IDN
JOR
KAZMYS
QAT
TUN
TUR
35
04
00
45
05
00
55
0
Scie
nce
sco
re in
PIS
A, 2
01
2
0 20000 40000 60000 80000GDP per capita, 2006-2010
OIC OECD
NON-OECD
ARE
AZE
IDN
IRN
MAR
OMN
QATSAU
30
04
00
50
06
00
Rea
din
g sc
ore
in P
IRL
S, 2
01
1
0 20000 40000 60000 80000GDP per capita, 2006-2010
OIC OECD
NON-OECD

23
Figure 2.3: Readings Score in SACMEQ 2012 Figure 2.4: Readings Score in EGRA
Source: Authors’ calculations based on WIDE and the WDI data.
Another broad measure of the quality of educational output is youth literacy rate. Once again, comparable assessment of literacy is unavailable for OIC countries. Therefore, self-reported literacy data which is available for a wide range of OIC and other non-OIC countries has been used. Figure 2.5 presents the average data for youths for the period 2011-2015 against the average per capita income of sample countries for the period 2006-2010). Figure 2.5: Youth Literacy Data
MOZ
UGA
50
05
20
54
05
60
58
06
00
Rea
din
g sc
ore
in S
AC
ME
Q, 2
01
2
0 1000 2000 3000 4000 5000GDP per capita, 1996-2000
OIC NON-OECD
IRQ
JOR
MAR
MLI
NGA
PSE
UGA
YEM
.2.4
.6.8
1
% s
tud
ents
wit
h 0
sco
re in
EG
RA
0 2000 4000 6000 8000 10000GDP per capita, 2006-2010
OIC NON-OECD
0
10
20
30
40
50
60
70
80
90
100
UZ
B
AZ
E
IDN
BR
N
PSE
MD
V
SAU
TU
R
JOR
OM
N
KW
T
AL
B
QA
T
IRN
SUR
TU
N
GU
Y
EG
Y
GA
B
MA
R
UG
A
TG
O
PA
K
CO
M
BG
D
SEN
GM
B
GN
B
SLE
BE
N
IRQ
CIV
BF
A
ML
I
AF
G
GIN
TC
D
NE
R
Youth literacy rate in OIC countries, 2011-15

24
Source: Author’s calculations based on WDI data.
Niger has the worst literacy rate among OIC member states where every one out of 4 youths is reportedly literate. On the other hand, Arab states such as Qatar, Kuwait, Bahrain, Jordan and Turkey all report very high levels of youth literacy (i.e. close to 100%). However, self-assessed literacy data is a poor indicator of education quality as evidenced from the poor ranking of most participating “high literacy” OIC countries in PISA and TIMSS. This is also evidenced from the fact that nearly 60% students from Uganda scores zero in EGRA assessment (Figure 2.4) despite high self-reported literacy rate (80%) in Figure 2.5. This suggests that the actual extent of illiteracy is likely to be much severe in African member states of OIC.
Figure 2.6: Grade-Learning Profiles by Subject, PISA 2012
Source: Author’s calculations based on PISA 2012 data.
0
10
20
30
40
50
60
70
80
90
100
Youth literacy rate in non-OIC countries, 2011-15
200
300
400
500
600
7 8 9 10 11 12
Maths
OIC_math OECD_math
NOECD_math
200
300
400
500
600
7 8 9 10 11 12
Reading
OIC_read OECD_read
NOECD_read
200
300
400
500
600
7 8 9 10 11 12
Science
OIC_sci OECD_sci NOECD_sci

25
Inefficiency in the education system means schooling is not learning. Assessment of learning crises requires value-added estimates using repeated data on a nationally representative sample of children of each of the member countries. At present, such estimates are available only for a handful of OIC countries such as Pakistan, Afghanistan and Bangladesh (Asadullah and Chaudhury 2015; Asadullah, Alim and Hossain 2018; Asim and Asadullah 2018). This involves cross-sectional data to construct learning profile, an empirical relationship between years of schooling completed and basic competencies. Although many OIC countries today participate in international assessments such as EGRA, TIMSS, PISA, PIRLS and SACMEQ, these surveys assess students at a point in the school cycle. While TIMSS test children in grades 4 and 8, very few OIC countries participate in grade 4 version. In case of PISA, the survey population is 15 year old adolescents. However countries differ in terms of schooling cycle and age at first enrolment. This causes variation among participating children in terms of grade enrolled at the time of the assessment. In PISA 2012 data, sample children are reported to be enrolled in grades 7 – 12 at the time of the test. Figure 2.6 takes advantage of this and constructs the grade-learning profile. Again, these are far from ideal as the sample size corresponding to lower and upper grades is very small and lacks representation. However, this is true for OIC as well as non-OIC and OECD sample. There is a noticeable learning gap between OIC and non-OIC countries at all grades. In other words, children from participating OIC countries are behind their peers from OECD countries at all points in the secondary schooling cycle. An average OIC child from grade 7 sample is 50 points behind a child from the participating OECD sample. Interestingly, a similar gap prevail vis-à-vis non-OECD countries though it is more systematic up to grade 10.OIC countries are behind their peers from OECD countries at all points in the secondary schooling cycle. An average OIC child from grade 7 sample is 50 points behind a child from the participating OECD sample. Interestingly, a similar gap prevails vis-à-vis non-OECD countries though it is more systematic up to grade 10.
2.1.2. Input Quality and Expenditure on Education
This section analyzes data on education quality in terms of inputs such as student teacher ratio (PTR), proportion of certified teachers and government expenditure. Figure 2.7 plots data on PTR by average per capita income level of OIC, OECD and other non-OECD countries for whom data is available. In the case of most OECD countries, there are around 20 students per teacher in primary as well as secondary education. In contrast, only a small proportion of OIC countries maintains a PTR below 20. The relatively high PTR in the majority of OIC countries reflect the lack of resources (shortage of schools, classrooms as well as teachers). There is a poverty connection in the sense that income-rich countries such as Qatar, Kuwait, Saudi Arabia and Bahrain have favorable PTR compared to economically poor member states, particularly African member countries. Similarly, upper-middle income countries such as Turkey, Malaysia and Kazakhstan also have a PTR of around 20. This pattern is most pronounced in the case of PTR in primary schools. At the same time, the part of the variation also reflects demographic differences. Older OIC countries are seeing a decline in the country’s youth population because of early demographic transition which has led to a dramatic reduction in class size. In some OIC countries, their youthful population along with the inflow of refugees has put pressure on classrooms and teachers.
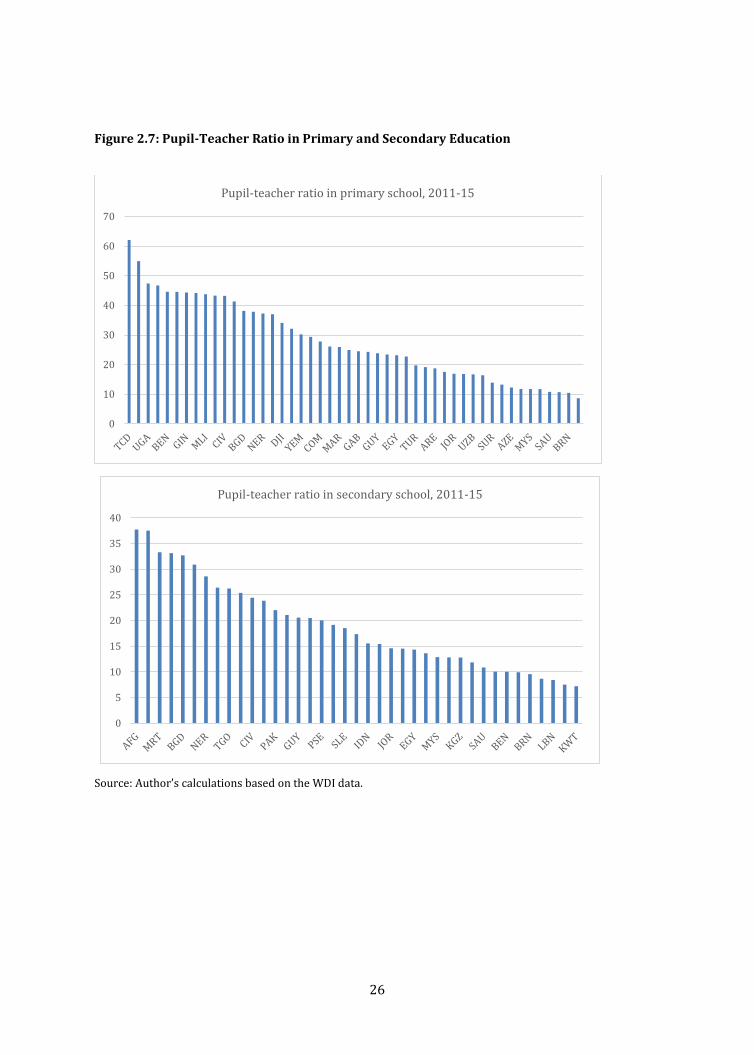
26
Figure 2.7: Pupil-Teacher Ratio in Primary and Secondary Education
Source: Author’s calculations based on the WDI data.
0
10
20
30
40
50
60
70
Pupil-teacher ratio in primary school, 2011-15
0
5
10
15
20
25
30
35
40
Pupil-teacher ratio in secondary school, 2011-15

27
Figure 2.8: Percentage of Trained Teachers, Primary and Secondary Education
Source: Authors’ calculations based on the WDI data.
A large proportion of OIC countries also lack qualified teachers (Figure 2.8). High income Arab countries such as Saudi Arabia along with upper-middle income countries such as Malaysia, Lebanon, and Kazakhstan have favorable PTR compared to economically poor member states such as Bangladesh. One exception is Qatar, which despite being the richest in terms of GDP per capita has a low percentage of trained teachers in secondary education. To formally explore the positive link between resources and expenditure, Figure 2.9 plots data on government expenditure on education as a % of GDP. The majority of the OIC countries spend well below 20% of the GDP per capita on education compared to OECD countries. Upper middle (or high) income member countries such as Kuwait, Oman and Malaysia spend between 15%-20% while expenditure share is very low in income poor countries such as Afghanistan.
0
10
20
30
40
50
60
70
80
90
100
% of trained teachers in primary education
0102030405060708090
100
% of trained teachers in secondary education

28
Figure 2.9: Government Expenditure as a Percentage Of GDP, Primary and Secondary Education
Source: Authors’ calculations based on the WDI data.
However, countries that allocate a smaller share of available funds to education also spend it poorly. Inefficiency in public education expenditure is a serious issue. It arises because of misallocation, leakage as well as lack of accountability among key stakeholders. A survey of primary schools in 17 low- and middle-income countries, for instance, found that on average nearly 20 percent of teaching time is lost every year due to factors resulting in teachers being away from school (GEC 2016). Nearly half of the sample for whom such data is available are OIC countries -- Bangladesh, Indonesia, Nigeria, Pakistan, Senegal, Tanzania, Tunisia, Morocco, Mozambique, and Uganda (see Figure 2.10). In a small number of cases, however, progress has been made in improving accountability among teachers. For instance, Indonesia has succeeded in reducing the absence of teachers from schools from 19 percent in 2003 to 9.8 percent in 2014 (Mckenzie et al 2014).
0
5
10
15
20
25
Government Expenditure As A Percentage Of GDP pc on Primary Education
0
10
20
30
40
50
60
Government Expenditure As A Percentage Of GDP pc on Secondary Education

29
Figure 2.10: Absenteeism from School (%)
Source: Author’s calculation based on data presented in Brixi, Lust and Woolcock (2015)
2.1.3. Trends in Learning Outcomes
This section summarizes the trends in key measures of student learning in math, science and reading in OIC countries and the rest of the world. The x-axis presents the year of assessment while the y-axis shows the level of student achievement. In addition to total scores, the discussion also focuses on specific levels of competencies achieved for illustrative purposes. The analysis is strictly based on participating countries. It should be also noted that participation rate increases over time so that part of the long-term trend is driven by the change in sample composition of OIC countries represented in these assessment exercises. Figure 2.11 shows aggregate trends in OIC countries that participated in TIMSS grade 4 assessments. Since OIC member states only joined grade 4 assessment in 2011, long-term trends cannot be analyzed. For comparison purposes, other participating countries have been categorized into five groups - high performing East Asian economies (HPEAs), other Asian countries (OTHER ASIAN), Europe & North America (ERUPE-NA) and Latin American countries (LATIN AMERICA). For HPEAs, there is a clear long-term increasing trend in average TIMSS score in grade 4 mathematics. This is also true for European and Northern American countries though the trend is weaker. While there is an increasing trend in the OIC score, the group average is way below the average for HPEAHPEAs as well as other Asian countries (e.g. Estonia). In 2015, the OIC group average score was below the 450 mark while the group average of HPEAs was above 600 points.
0
5
10
15
20
25
30
35
40
45
50

30
Figure 2.11: Grade 4 TIMSS (Mathematics & Science) and PIRLS (Reading) Scores by Region, 1995-2015
Source: Author’s calculation based on WIDE data. African and Latin American countries have been excluded.
The same pattern prevails in TIMSS science scores as well as PIRLS reading scores. In case of PIRLS, the gap is striking because all other country groups – HPEAs, Other Asian and Europe and
300
350
400
450
500
550
600
1995 1997 1999 2001 2003 2005 2007 2009 2011 2013 2015
Science scores in TIMSS (grade 4)
OIC Science HPEAs Science OTHER ASIAN Science EUROPE-NA Science
300
350
400
450
500
550
600
1995 1997 1999 2001 2003 2005 2007 2009 2011 2013 2015
Reading scores in PIRLS (grade 4)
OIC Reading HPEAs Reading OTHER ASIAN Reading EUROPE-NA Reading
300
350
400
450
500
550
600
650
1995 2000 2005 2010 2015
Math scores in TIMSS (grade 4)
OIC Math HPEAs Math OTHER ASIAN Math EUROPE-NA Math

31
North America – have scores above the 500 mark while the average for OIC is around 400 points. This suggests that OIC as a group is behind other major groups in terms of student achievement in the early (i.e. primary) cycle of the education system. Figure 2.12 repeats the analysis plotting aggregate data for OIC countries that participated in TIMSS grade 8 assessments. Compared to grade 4, two OIC member states (Malaysia and Jordan) participated in the early rounds of grade 8 assessments so that long-term trend analysis is possible. Since OIC member states only joined grade 4 assessment in 2011, long-term trends cannot be analyzed. Once again, the average for HPEAs consistently dominates other groups and even shows an increasing trend in mathematics. In contrast, the OIC average declines sharply between 1999 and 2006. Although there is a slight upward recovery by 2011, it is still far below the 1999 average score. Therefore, in 2015, participating OIC countries on average only outperforms their economically poorer African counterparts. While there is an increasing trend in the OIC score, the group average is way below the average for HPEAs as well as other Asian countries. The pattern in case of science scores is almost identical.
Figure 2.12: Grade 8 TIMSS (Mathematics & Science) Scores by Region, 1995-2015
Source: Author’s calculation based on WIDE data. African and Latin American countries have been excluded.
300
350
400
450
500
550
600
650
1995 2000 2005 2010 2015
Math scores in TIMSS (grade 8)
OIC Math HPEAs Math OTHER ASIAN Math EUROPE-NA Math
300
350
400
450
500
550
600
1995 2000 2005 2010 2015
Science scores in TIMSS (grade 8)
OIC Science HPEAs Science OTHER ASIAN Math EUROPE-NA Science

32
Figure 2.13: PISA (Mathematics, Reading & Science) Scores by Region, 2000-2015
Source: Author’s calculation based on WIDE data
300
350
400
450
500
550
600
2000 2002 2004 2006 2008 2010 2012 2014
Math scores in PISA (grade 8)
OIC Math HPEAs Math OTHER ASIAN Math
LATIN AMERCIA Math EUROPE-NA Math
300
350
400
450
500
550
2000 2002 2004 2006 2008 2010 2012 2014
Reading scores in PISA (grade 8)
OIC Reading HPEAs Reading OTHER ASIAN Reading
LATIN AMERCIA Reading EUROPE-NA Reading
300
350
400
450
500
550
600
2000 2002 2004 2006 2008 2010 2012 2014
Science scores in PISA (grade 8)
OIC Science HPEAs Science OTHER ASIAN Science
LATIN AMERCIA Science EUROPE-NA Science

33
Figure 2.13 shows aggregate trends in OIC countries that participated in PISA assessment. Two OIC member states (Albania and Indonesia) joined PISA assessment in 2000 and three in 2003 round (Indonesia, Turkey and Tunisia) so that long-term analysis is possible. The HPEAs group once again dominates others in all rounds of PISA assessment regardless of the test subject. In contrast, the average for the OIC is below all other country groups during 2000-2015. However, compared to performance in TIMSS, there is a rising tendency in the OIC average scores in mathematics, science and reading in PISA assessment. Nonetheless, even by 2015, the average score for the participating OIC countries is only slightly above 400 PISA points.
Overall, the evidence presented in Figures 2.11-2.13 indicate that among participating countries, OIC as a group is behind others such as the HPEAHPEAs, European and North American countries regardless of subjects (e.g. mathematics, reading and science) and assessments (e.g. TIMSS, PIRLS and PISA). Moreover, while the patterns in the case of TIMSS suggest a worsening situation over time, there is an encouraging positive trend in the case of PISA. Part of the variation in OIC average scores is owing to changing compositions of the sample as more member states participated in the recent rounds of TIMSS and PISA. Therefore, the analysis at the country level are repeated to better understand cases of positive and negative deviations within the OIC.
Figure 2.14: Grade 4 TIMSS (Mathematics & Science) and PIRLS (Reading) Scores by Country, 1999-2015
Source: Author’s calculation based on WIDE data
BHRBHR
IDNJOR
KAZ
KAZ
KWTKWT
MAR
MAROMN
OMNQAT
QAT
SAU
SAU
TURTUR
ARE
ARE
30
04
00
50
06
00
Mea
n m
ath
sco
re in
TIM
SS
1995 2000 2005 2010 2015year
OIC OECD
NON-OECD Maths score in TIMSS
BHRBHR
IDN
KAZ
KAZ
KWT
KWT
MAR
MAR
OMN
OMN
QAT
QATSAU
SAU
TURTUR
ARE
ARE
20
03
00
40
05
00
60
0
Mea
n S
cien
ce s
core
in T
IMSS
1995 2000 2005 2010 2015year
OIC OECD
NON-OECD Science score in TIMSS
IDN
MAR
OMN
QATSAUARE
AZE
IDN
300
400
500
600
Mea
n re
adin
g sc
ore
in P
IRLS
1995 2000 2005 2010 2015year
OIC OECD
NON-OECD Reading score in PIRLS

34
As pointed out earlier, compared to OECD countries, different OIC countries participated in different international assessments and different rounds of a given assessment. This makes it difficult to generalize OIC-wide trends vis-à-vis rest of the world. Therefore, specific country experiences are zoomed into and group-specific aggregate trends are avoided. Figure 2.14 plots country-level data for OIC countries that participated in TIMSS and PIRLS grade 4 assessments. Although the temporal evolutions of test scores in Figure 2.11 suggest divergence between OIC and other groups of countries, a detailed country-level inspection reveals important cases of positive deviations in the OIC sample countries. Nine OIC member states participated in grade 4 assessment in 2011. For comparison purpose, non-OIC countries are organized in two groups – OECD and non-OECD. However, country labels are only used for OIC countries.
There is considerable variation within the OIC in terms of performance in grade 4 mathematics and science in TIMSS. Kazakhstan is the leading performer in math and science, with an average country score of above 500 points. Turkey, also a member of the OECD, is ranked second among OIC states. Both countries also register progress between 2011 and 2015. On the other hand, laggards include Kuwait for whom the average score also experienced a sharp fall between 2011 and 2015. The gap in country average scores between Kazakhstan and Kuwait is more than 200 points in math and science. The country-specific trend is not known in case of PIRLS as the participation of OIC countries is not balanced across rounds.
Figure 2.15: Grade 8 TIMSS Scores in Mathematics and Science by Country, 1999-2015
Source: Author’s calculation based on OECD data Figure 2.15 repeats the country-level analysis plotting average scores for OIC countries that participated in TIMSS grade 8 assessments. Compared to grade 4, two OIC member states (Malaysia and Jordan) participated in the early rounds of grade 8 assessments so that long-term trend analysis is possible. Malaysia as one of the two participation OIC countries in 1999 round enjoyed a high average score while Jordan was nearly 100 points behind. However, both countries saw a slide in their absolute score as well as relative rank in the next four rounds of PISA assessment. In the latest round, Malaysia has recovered somewhat though the score still remains below the average for the 2000s. Two member states that defied the overall negative time trend are Kazakhstan and Turkey.
BHR BHRBHR
BHR
JOR JOR JOR
JOR
JOR
KAZ
KAZ
KWT
KWT
LBN
LBN LBNLBN
MYSMYS
MYS
MYS
MYS
MARMAR
OMNOMN
OMNQAT
QAT
SAU
SAU
TURTURAREARE
35
04
00
45
05
00
55
06
00
Mea
n m
ath
sco
re in
TIM
SS
1995 2000 2005 2010 2015year
OIC OECD
NON-OECD Maths score in TIMSS
BHR
BHRBHR
BHR
JOR
JORJOR
JOR
JOR
KAZ
KAZ
KWT
KWTLBN
LBNLBN
LBN
MYS
MYS
MYS
MYS
MYS
MAR
MAR
OMN OMN
OMN
QAT
QAT
SAU
SAU
TURTUR
AREARE
30
04
00
50
06
00
Mea
n s
cien
ce s
core
in T
IMSS
1995 2000 2005 2010 2015year
OIC OECD
NON-OECD Science score in TIMSS

35
Figure 2.16: Grade 4 TIMSS Scores in Mathematics and Science by Gender, 1999-2015
Source: Author’s calculation based on TIMSS data.
Figure 2.17: Grade 8 TIMSS Scores in Mathematics and Science by Gender, 1999-2015
Source: Author’s calculation based on TIMSS data.
Figures 2.16 and 2.17 depict the country-level trends in TIMSS grades 4 and 8 scores by gender. The boy-girl difference is small or non-existent in case of Kazakhstan and Lebanon. In most MENA countries (e.g. Oman, Qatar, Bahrain), however, there is a large gender gap in favor of girls. Between 1999 and 2015, Jordan’s performance decline is much more striking when assessed in terms of data on boys. To some extent, it is also true for Malaysia. In both countries, girls outrank boys in all rounds of grade 8 TIMSS assessment though the performance of boys in Malaysia has improved significantly in the 2015 round. In case of Oman, boys scored below the 350 mark in 2007 and 2011 rounds in math while the respective scores for girls didn’t dip below the 400 mark. In the latest round of TIMSS, boys have improved their performance significantly though the score has also increased for girls. In case of Saudi Arabia, which joined TIMSS in 2011, performance has declined equally for boys and girls in the latest assessment round so much so that Saudi girls ranked below their peers from all other participating OIC countries in 2015.
BHR
BHR
IDNJOR
KAZ
KAZ
KWT
KWTMAR
MAR
OMN
OMNQAT
QAT
SAUSAU
TURTUR
AREARE
30
04
00
50
06
00
Mea
n m
ath
sco
re in
TIM
SS, g
irls
1995 2000 2005 2010 2015year
OIC OECD
NON-OECD Maths score in TIMSS, girls
BHRBHR
IDNJOR
KAZ
KAZ
KWT KWTMAR
MAROMN
OMNQAT
QAT
SAU
SAU
TURTUR
ARE
ARE
30
04
00
50
06
00
Mea
n m
ath
sco
re in
TIM
SS, b
oy
s
1995 2000 2005 2010 2015year
OIC OECD
NON-OECD Maths score in TIMSS, boys
BHR BHRBHR
BHR
JORJOR JOR
JOR
JOR
KAZ
KAZ
KWT
KWT
LBNLBN LBN LBN
MYSMYS
MYS
MYS
MYS
MARMAR
OMN OMN
OMNQAT
QAT
SAU
SAU
TUR TURARE ARE
30
04
00
50
06
00
Mea
n m
ath
sco
re in
TIM
SS, g
irls
1995 2000 2005 2010 2015year
OIC OECD
NON-OECD Maths score in TIMSS, girls
BHR BHRBHR
BHR
JORJOR JOR
JOR
JOR
KAZ
KAZ
KWT
KWT
LBN
LBN LBNLBN
MYSMYS
MYS
MYS
MYS
MARMAR
OMNOMN
OMN
QAT
QAT
SAU
SAU
TURTUR
AREARE
35
04
00
45
05
00
55
06
00
Mea
n m
ath
sco
re in
TIM
SS, b
oy
s
1995 2000 2005 2010 2015year
OIC OECD
NON-OECD Maths score in TIMSS, boys

36
Figure 2.18: PISA Scores in Mathematics, Reading and Science by Country, 2000-2015
Source: Author’s calculation based on PISA 2012 data
ALB
ALBALB
ALB
AREARE
AZE DZA
IDNIDN
IDNIDN
IDNIDNJOR JOR
JORJORKAZ
KAZ
KAZ
LBN
MYS
MYS
MYS
QAT
QAT
QAT
QAT
TUN
TUN TUN
TUNTUN
TURTUR
TUR
TURTUR
300
350
400
450
500
550
Mea
n re
adin
g sc
ore
in P
ISA
2000 2005 2010 2015year
OIC OECD
NON-OECD Reading score in PISA
ALB
ALBALB
ALB
AREARE
AZEDZA
IDNIDN
IDN IDNIDN
IDN
JORJORJOR
JOR
KAZ
KAZ
KAZ
LBN
MYS
MYS
MYS
QAT QAT
QAT
QAT
TUN
TUN TUNTUNTUN
TURTURTUR
TURTUR
300
350
400
450
500
550
Mea
n sc
ienc
e sc
ore
in P
ISA
2000 2005 2010 2015year
OIC OECD
NON-OECD Science score in PISA
ALBALB
ALB
ALB
ARE
ARE
AZE
DZA
IDN
IDNIDNIDN
IDNIDN
JORJOR
JORJOR
KAZ
KAZ
KAZ
LBNMYS
MYS
MYS
QATQAT
QAT
QAT
TUNTUN
TUN
TUNTUN
TUR TURTUR
TURTUR
300
350
400
450
500
550
Mea
n m
ath
scor
e in
PIS
A
2000 2005 2010 2015year
OIC OECD
NON-OECD Math score in PISA

37
Lastly, Figure 2.18 depicts the evolution of PISA country average scores achieved by 15-year-olds in Mathematics, Reading and Science since 2000. OIC representation in PISA increased from 2 countries in 2000 to 3 in 2003, 6 in 2006 to 8 in 2009 round. In addition to a steady increase in participation rate, Indonesia is the only OIC country that has participated in all rounds of PISA. However, by 2015, the country average scores was below 400 PISA points by 2015 though in the cases of mathematics and reading, there has been some progress since 2000. A similar trend is noticeable in the case of Jordan during the 2006 and 2015 rounds. In 2006, it enjoyed a 30point gap in science vis-à-vis Indonesia which almost closed by 2015. One member state that has enjoyed a steady increase in student performance for the first four rounds is Turkey. Between 2003 and 2012, PISA scores rose steadily in all three subjects. However, performance in 2015 suffered a significant decline, returning to the 2006 level. In case of Tunisia, performance improved between 2003 and 2009 but declined significantly in science by 2015. Only in case of Kazakhstan is the rising trend is sustained even in 2015 results -- compared to 2012, the Kazakhstani students achieved more in math (28 points), reading (34 points) and science (31 points).2 This is attributed to the National Action Plan on development of functional literacy of school children launched in 2012 to update the content of secondary education.3 The contrasting stories of Turkey and Jordan highlight the challenge for other OIC countries. Some member countries such as Turkey has enjoyed a period of sustained increase in student learning but suffered a sharp decline by 2015. The most dramatic improvement occurred in case of Malaysia – in 2015, it ranked second among all participating OIC countries in math and science, though still below most OECD countries.
2.1.4. Equity in Educational Outcomes and Opportunities
Since the majority of economically poor member countries (e.g. 27 African member states) do not participate in TIMSS, PIRLS and PISA, it is not possible to explore the association between difference indicators of poverty (poverty gap, different poverty lines) and learning outcomes vis-à-vis other non-OIC countries. Nonetheless, one can explore the wealth gap in performance among children in participating countries. Figure 2.19 presents data on percentage of children achieving specific level of competency in TIMSS math and science by family wealth. In order to describe the evolution of wealth-learning connection (i.e. how the level of student achievement across wealth groups changes over time), data is presented for 1999 and 2011. The averages for participating OIC countries in 1999 show that the majority of children (i.e. over 50% attained basic competencies in math and science regardless of their wealth groups. There is a wealth gap with children from highest wealth quintiles performing better but it widens by 2011 in basic competencies (level 1), in both math and science. In other words, the wealth gradient became much steeper by 2011. In level 2 competency, students severally lag behind in math in 1999 as well as 2011 rounds; this is true for children of low and high wealth groups. The majority in the participating OIC sample countries by 2011 did not demonstrate level-2 competencies regardless of the wealth group. The percentage of students achieving level 3 competency is even lower. There was a large wealth gap in 1999 data. While this has narrowed by 2011, it is because of a fall in top performing student population. Only 4 percent of children from the top wealth group had attained level 3 competencies in science and math.
2 https://www.oecd.org/edu/school/ECECDCN-Kazakhstan.pdf 3 http://www.kt.kz/eng/government/kazakhstan_adopted_the_national_action_plan_on_improvement_of_the_functional_literacy_of_school_students_for_2012_2016_1153556802.html

38
Figure 2.19: Wealth-Learning Profile in the OIC, TIMSS 1999 and 2011
Source: Author’s calculation based on WIDE data Similar patterns are obtained for PISA 2012 data. The average for participating OIC countries in 2000 show levels of attainment in terms of basic proficiency (level 1) in science, math and reading.4 While there is a wealth gap with children from highest wealth quintiles performing better, also noticeable is an across wealth group increase in level 1 proficiency by 2012. This is also noticeable in case of level-4 proficiency. In 2000 round, the majority in the participating OIC sample countries had very low level of competencies achieved regardless of the wealth group. In 2012, there has been a sharp rise in proficiency though the wealth gap has also widened.
4 There are in total six levels of proficiency in PISA data. The improvement required for an education system to progress from one level to another approximately equivalent to 38 points or one school year equivalent. For the construction of proficiency scales, see: https://www.oecd.org/pisa/pisaproducts/PISA%202012%20Technical%20Report_Chapter%2015.pdf
0.2
.4.6
.8
1 2 3 4 5 1 2 3 4 5
Country Wealth Index Quintiles, 1999 Country Wealth Index Quintiles, 2011
Maths Science
% o
f child
ren
passin
g leve
l-1
th
resh
old
Graphs by category and year
0.2
.4.6
.8
1 2 3 4 5 1 2 3 4 5
Country Wealth Index Quintiles, 1999 Country Wealth Index Quintiles, 2011
Maths Science
% o
f child
ren
passin
g leve
l-2
th
resh
old
Graphs by category and year
0
.02
.04
.06
1 2 3 4 5 1 2 3 4 5
Country Wealth Index Quintiles, 1999 Country Wealth Index Quintiles, 2011
Maths Science
% o
f child
ren
passin
g leve
l-3
th
resh
old
Graphs by category and year

39
Figure 2.20: Wealth-Learning Profile, PISA 2000 and 2012
Overall, Figures 2.19 and 2.20 document widening wealth gaps in student achievement among OIC countries participating in TIMSS. Similar gaps are also noticeable in PISA data though the rich-poor gaps are narrower compared to TIMSS. But how large are these gaps relative to participating OECD and non-OECD countries? This issue is addressed next in Figure 2.21. Figure 2.21: Learning Levels of Children from Top and Bottom Wealth Groups in Urban OIC vs. Rural OECD and Non-OECD, TIMSS 2011
Source: Author’s calculation based on WIDE database
Since OECD and some participating non-OECD countries are wealthier, comparison to the latter is based on students from rural locations. On the other hand, data on OIC children are restricted to those living in urban locations. Figure 2.21 plots TIMSS 2011 performance data for urban OIC against rural children from OECD and non-OECD countries. A number of patterns are noteworthy. First, the top-bottom wealth gap there is very large among urban children in OIC countries even in basic mathematics competency. Over 40% children from the bottom wealth quintile attain basic competency in math against more than 80% from top wealth quintile. There is also a large gap in science though it’s slightly narrower compared to math. Second, wealth gap is also present in non-OIC countries. However, the gap is much smaller in the OECD as well as non-OECD countries. Considering the fact that the non-OIC sample corresponds to rural population, this suggests that families in OIC countries suffer from the double burden of poor
0.2
.4.6
.8
1 2 3 4 5 1 2 3 4 5
Country Wealth Index Quintiles, 2000 Country Wealth Index Quintiles, 2012
Maths Reading
Science
% o
f child
ren
passin
g leve
l-1
th
resh
old
Graphs by category and year
0
.02
.04
.06
.08
.1
1 2 3 4 5 1 2 3 4 5
Country Wealth Index Quintiles, 2000 Country Wealth Index Quintiles, 2012
Maths Reading
Science
% o
f child
ren
passin
g leve
l-4
th
resh
old
Graphs by category and year
0
0,1
0,2
0,3
0,4
0,5
0,6
0,7
0,8
0,9
1
math, level1 math, level3 science, level1 science, level3
OIC, urban q1
OIC, urban q5
OECD, rural q1
OECD, rural q5
NOECD, rural q1
NOECD, rural q5
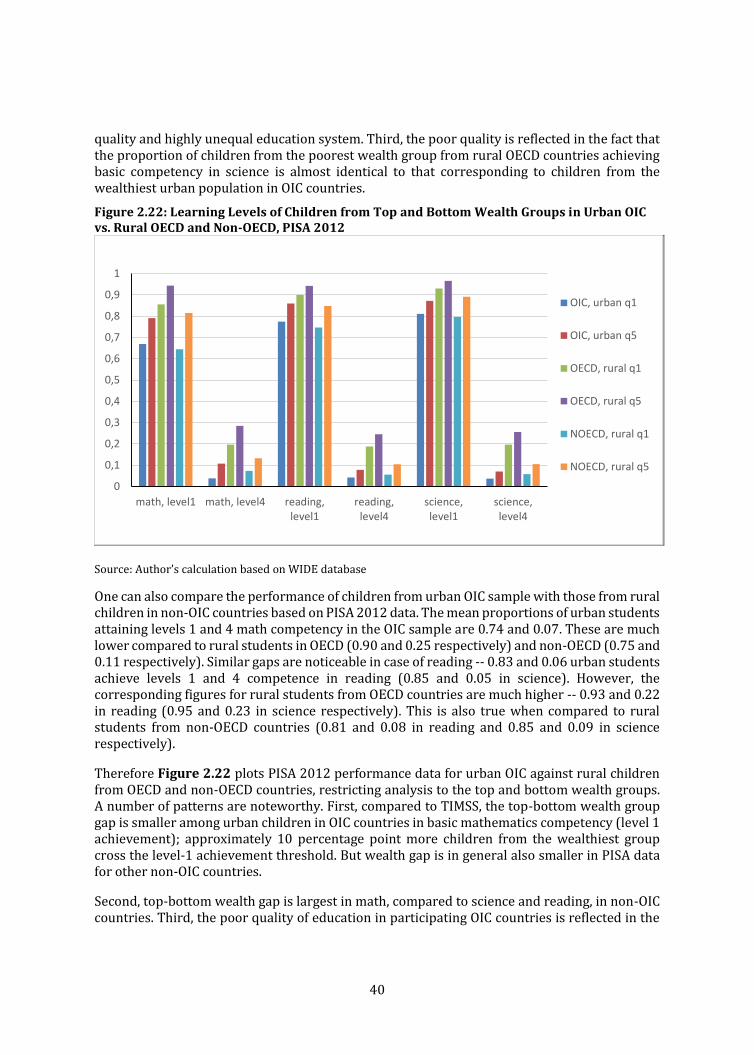
40
quality and highly unequal education system. Third, the poor quality is reflected in the fact that the proportion of children from the poorest wealth group from rural OECD countries achieving basic competency in science is almost identical to that corresponding to children from the wealthiest urban population in OIC countries.
Figure 2.22: Learning Levels of Children from Top and Bottom Wealth Groups in Urban OIC vs. Rural OECD and Non-OECD, PISA 2012
Source: Author’s calculation based on WIDE database
One can also compare the performance of children from urban OIC sample with those from rural children in non-OIC countries based on PISA 2012 data. The mean proportions of urban students attaining levels 1 and 4 math competency in the OIC sample are 0.74 and 0.07. These are much lower compared to rural students in OECD (0.90 and 0.25 respectively) and non-OECD (0.75 and 0.11 respectively). Similar gaps are noticeable in case of reading -- 0.83 and 0.06 urban students achieve levels 1 and 4 competence in reading (0.85 and 0.05 in science). However, the corresponding figures for rural students from OECD countries are much higher -- 0.93 and 0.22 in reading (0.95 and 0.23 in science respectively). This is also true when compared to rural students from non-OECD countries (0.81 and 0.08 in reading and 0.85 and 0.09 in science respectively).
Therefore Figure 2.22 plots PISA 2012 performance data for urban OIC against rural children from OECD and non-OECD countries, restricting analysis to the top and bottom wealth groups. A number of patterns are noteworthy. First, compared to TIMSS, the top-bottom wealth group gap is smaller among urban children in OIC countries in basic mathematics competency (level 1 achievement); approximately 10 percentage point more children from the wealthiest group cross the level-1 achievement threshold. But wealth gap is in general also smaller in PISA data for other non-OIC countries.
Second, top-bottom wealth gap is largest in math, compared to science and reading, in non-OIC countries. Third, the poor quality of education in participating OIC countries is reflected in the
0
0,1
0,2
0,3
0,4
0,5
0,6
0,7
0,8
0,9
1
math, level1 math, level4 reading,level1
reading,level4
science,level1
science,level4
OIC, urban q1
OIC, urban q5
OECD, rural q1
OECD, rural q5
NOECD, rural q1
NOECD, rural q5

41
fact that the proportion of children from the poorest wealth group from rural OECD countries achieving basic competency in science is much higher when compared to the proportion of children from the wealthiest urban population in OIC countries.
Figure 2.23: Top-Bottom Wealth Quintile Learning Gaps in OIC Countries, PISA 2012
Source: Author’s calculation based on WIDE data.
The top-bottom wealth gaps in OIC countries described in Figures 2.21 and 2.22 are striking. Therefore, it is useful to unpack the country specific patterns. For illustrative purposes, Figure 2.23 reports estimates of bottom-top quintile absolute gaps for OIC countries that participated in PISA 2012. In all countries, the gap narrows in higher level of competency level 4). One exception is mathematics achievement in Indonesia where the top-bottom gap is the largest among all participating OIC countries and that too in case of level 4. Two countries where there is a reversal of the wealth advantage are Qatar and UAE. Achievement gap is widens monotonically across wealth groups to the disadvantage of children from wealthier quintile, a result which merits further investigation.
-0,30
-0,20
-0,10
0,00
0,10
0,20
0,30
0,40
0,50
0,60
0,70
math, level1
math, level4
reading, level1
reading, level4
science, level1
science, level4

42
Figure 2.24: Wealth Gradient of Learning Levels in Urban OIC vs Rural OECD and Non-OECD, TIMSS 2011
Source: Author’s calculation. Wealth quintiles are country specific.
Figures 2.21-2.23 together highlight enormous disparities in learning opportunities within the OIC. At the same time, country-wise analysis reveals some powerful patterns. Figure 2.24 presents data on the proportion of children crossing specific achievement threshold across the full-range of wealth quintiles in OIC countries in TIMSS 2011. For comparison, non-OIC countries are highlighted though without country labels. The wealth gap in OIC countries is quite large. In Morocco, around 30% children from the poorest quintile pass the level-1 threshold in science compared to over 60% children from the wealthiest quintile. At the same time, within OIC disparity in performance of children from a given wealth group is also very large. In terms of basic proficiency in math, Kazakh children from the poorest wealth quintile outperform children from the wealthiest group in Jordan and Qatar. The proportion of children in the bottom wealth group in Kazakhstan achieving basic proficiency in math and science is also twice that of Malaysia. However, in the case of advanced knowledge in math, children underperform across all wealth groups, both in Kazakhstan and Qatar. Similarly, children from the wealthiest group in Kazakhstan outperform those from Qatar in basic reading proficiency though the gap disappears in case of advanced reading skills. Only children from Turkey demonstrate a systematic wealth advantage in case of advanced reading skills in PISA 2012. The contrasting gap between wealth groups in a country and children of member states within the same wealth group suggests that school quality is a bigger concern than poverty in influencing student achievement in basic science and math proficiency in OIC countries.
BHR
BHR
BHR
BHR
BHR
IDNIDN
IDN
IDN
IDN
JOR
JOR
JOR
JOR
JORKAZ
KAZKAZ
KAZKAZ
LBN
LBN
LBNLBN
LBN
MYS
MYS
MYSMYS
MYS
MARMAR
MAR
MAR
MAR
OMN
OMN
OMN
OMN
OMN
QAT
QAT
QAT
QATQAT
SAU
SAUSAU
SAU
SAU
ARE
ARE
ARE
AREARE
.2.4
.6.8
1
% o
f ch
ild
ren
pas
sin
g le
vel
-1 m
ath
s th
resh
old
1 2 3 4 5wealth quintiles
OIC OECD
NON-OECD
BHR BHRBHR
BHR
BHR
IDN IDN IDNIDN
IDN
JORJOR JOR
JORJOR
KAZ
KAZ
KAZKAZ
KAZ
LBN LBN
LBNLBN
LBN
MYS
MYS
MYSMYS
MYS
MAR MAR MAR MAR
MAR
OMN OMN OMNOMN
OMN
QAT
QATQAT QAT
QAT
SAU SAU SAUSAU
SAU
AREARE
ARE
ARE
ARE
0.2
.4.6
.8
% o
f ch
ild
ren
pas
sin
g le
vel
-3 m
ath
s th
resh
old
1 2 3 4 5wealth quintiles
OIC OECD
NON-OECD
BHR
BHR
BHR
BHR
BHR
IDN
IDN IDN
IDN
IDN
JOR
JORJOR
JORJOR
KAZ
KAZKAZ KAZ
KAZ
LBN
LBN
LBN LBN
LBN
MYS
MYS
MYS
MYS
MYS
MAR MAR
MAR
MAR
MAR
OMN
OMN
OMN
OMN
OMN
QAT
QAT
QAT
QATQAT
SAU
SAUSAU
SAU
SAU
ARE
ARE
ARE
AREARE
0.2
.4.6
.81
% o
f ch
ild
ren
pas
sin
g le
vel-
1 s
cien
ce t
hre
sho
ld
1 2 3 4 5wealth quintiles
OIC OECD
NON-OECD
BHRBHR
BHR
BHR
BHR
IDN IDNIDN IDN
IDNJOR
JOR JOR
JOR
JOR
KAZKAZ
KAZ KAZ
KAZ
LBN LBNLBN
LBN
LBN
MYSMYS
MYS MYS
MYS
MAR MAR MAR MAR
MAR
OMN
OMN OMN
OMN
OMN
QAT
QATQAT
QAT
QAT
SAU SAUSAU
SAU
SAU
ARE
ARE
ARE
ARE
ARE
0.2
.4.6
.8
% o
f ch
ild
ren
pas
sin
g le
vel-
3 s
cien
ce t
hre
sho
ld
1 2 3 4 5wealth quintiles
OIC OECD
NON-OECD
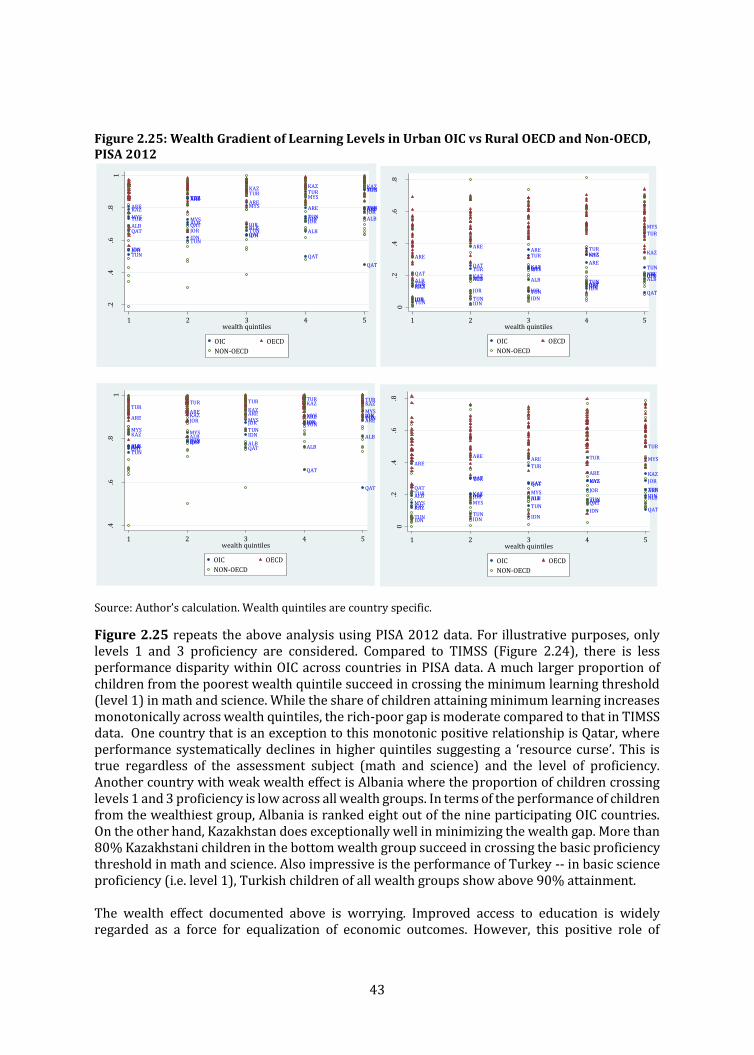
43
Figure 2.25: Wealth Gradient of Learning Levels in Urban OIC vs Rural OECD and Non-OECD, PISA 2012
Source: Author’s calculation. Wealth quintiles are country specific.
Figure 2.25 repeats the above analysis using PISA 2012 data. For illustrative purposes, only levels 1 and 3 proficiency are considered. Compared to TIMSS (Figure 2.24), there is less performance disparity within OIC across countries in PISA data. A much larger proportion of children from the poorest wealth quintile succeed in crossing the minimum learning threshold (level 1) in math and science. While the share of children attaining minimum learning increases monotonically across wealth quintiles, the rich-poor gap is moderate compared to that in TIMSS data. One country that is an exception to this monotonic positive relationship is Qatar, where performance systematically declines in higher quintiles suggesting a ‘resource curse’. This is true regardless of the assessment subject (math and science) and the level of proficiency. Another country with weak wealth effect is Albania where the proportion of children crossing levels 1 and 3 proficiency is low across all wealth groups. In terms of the performance of children from the wealthiest group, Albania is ranked eight out of the nine participating OIC countries. On the other hand, Kazakhstan does exceptionally well in minimizing the wealth gap. More than 80% Kazakhstani children in the bottom wealth group succeed in crossing the basic proficiency threshold in math and science. Also impressive is the performance of Turkey -- in basic science proficiency (i.e. level 1), Turkish children of all wealth groups show above 90% attainment. The wealth effect documented above is worrying. Improved access to education is widely regarded as a force for equalization of economic outcomes. However, this positive role of
ALBALB
ALBALB
ALB
IDN
IDN IDN
IDN
IDN
JOR
JORJOR
JOR
JORKAZ
KAZ
KAZ KAZ KAZ
MYS MYS
MYS
MYS
MYS
QATQAT
QAT
QAT
QAT
TUN
TUN
TUN
TUN
TUN
TUR
TURTUR TUR TUR
ARE
AREARE
ARE ARE
.2.4
.6.8
1
% o
f ch
ild
ren
pas
sin
g le
vel-
1 m
ath
s th
resh
old
1 2 3 4 5wealth quintiles
OIC OECD
NON-OECD
ALB ALB ALBALB
ALB
IDNIDN
IDN
IDN
IDN
JOR
JOR JORJOR
JOR
KAZ
KAZ
KAZ
KAZ KAZ
MYS
MYS
MYS
MYS
MYS
QAT
QATQAT
QAT
QAT
TUNTUN
TUN
TUN
TUN
TUR
TUR
TURTUR
TUR
ARE
AREARE
ARE
ARE
0.2
.4.6
.8
% o
f ch
ild
ren
pas
sin
g le
vel-
3 m
ath
s th
resh
old
1 2 3 4 5wealth quintiles
OIC OECD
NON-OECD
ALB
ALBALB
ALB
ALB
IDNIDN
IDN
IDNIDN
JOR
JOR JOR JORJOR
KAZ
KAZKAZ
KAZ KAZ
MYS MYS
MYSMYS
MYS
QAT
QATQAT
QAT
QAT
TUN
TUN
TUNTUN
TUN
TURTUR TUR TUR TUR
AREARE ARE
AREARE
.4.6
.81
% o
f ch
ild
ren
pas
sin
g le
vel-
1 s
cien
ce t
hre
sho
ld
1 2 3 4 5wealth quintiles
OIC OECD
NON-OECD
ALB ALBALB ALB
ALB
IDN IDN IDNIDN
IDN
JOR
JOR JOR
JOR
JOR
KAZ
KAZ
KAZ KAZ
KAZ
MYS MYS
MYS
MYS
MYS
QAT
QATQAT
QATQAT
TUNTUN
TUNTUN
TUNTUR
TUR
TUR
TUR
TUR
ARE
AREARE
ARE
ARE
0.2
.4.6
.8
% o
f ch
ild
ren
pas
sin
g le
vel-
3 s
cien
ce t
hre
sho
ld
1 2 3 4 5wealth quintiles
OIC OECD
NON-OECD
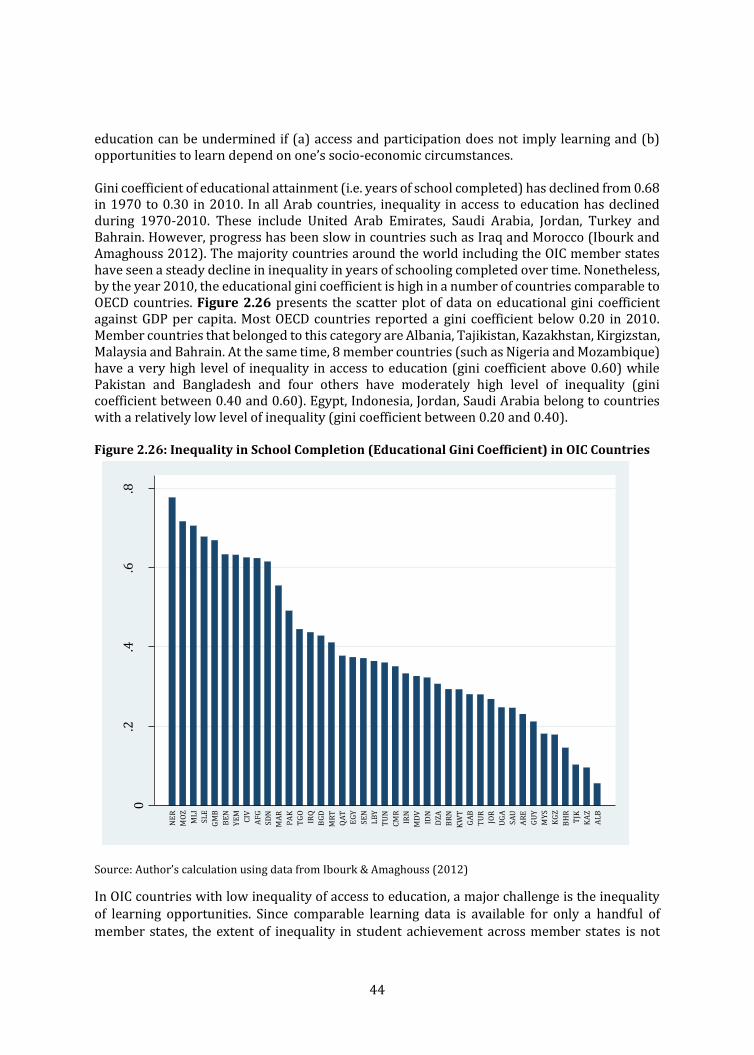
44
education can be undermined if (a) access and participation does not imply learning and (b) opportunities to learn depend on one’s socio-economic circumstances. Gini coefficient of educational attainment (i.e. years of school completed) has declined from 0.68 in 1970 to 0.30 in 2010. In all Arab countries, inequality in access to education has declined during 1970-2010. These include United Arab Emirates, Saudi Arabia, Jordan, Turkey and Bahrain. However, progress has been slow in countries such as Iraq and Morocco (Ibourk and Amaghouss 2012). The majority countries around the world including the OIC member states have seen a steady decline in inequality in years of schooling completed over time. Nonetheless, by the year 2010, the educational gini coefficient is high in a number of countries comparable to OECD countries. Figure 2.26 presents the scatter plot of data on educational gini coefficient against GDP per capita. Most OECD countries reported a gini coefficient below 0.20 in 2010. Member countries that belonged to this category are Albania, Tajikistan, Kazakhstan, Kirgizstan, Malaysia and Bahrain. At the same time, 8 member countries (such as Nigeria and Mozambique) have a very high level of inequality in access to education (gini coefficient above 0.60) while Pakistan and Bangladesh and four others have moderately high level of inequality (gini coefficient between 0.40 and 0.60). Egypt, Indonesia, Jordan, Saudi Arabia belong to countries with a relatively low level of inequality (gini coefficient between 0.20 and 0.40).
Figure 2.26: Inequality in School Completion (Educational Gini Coefficient) in OIC Countries
Source: Author’s calculation using data from Ibourk & Amaghouss (2012)
In OIC countries with low inequality of access to education, a major challenge is the inequality of learning opportunities. Since comparable learning data is available for only a handful of member states, the extent of inequality in student achievement across member states is not
0.2
.4.6
.8
Ed
uca
tio
n g
ini c
oef
fici
ent,
20
10
NE
R
MO
Z
ML
I
SL
E
GM
B
BE
N
YE
M
CIV
AF
G
SD
N
MA
R
PA
K
TG
O
IRQ
BG
D
MR
T
QA
T
EG
Y
SE
N
LB
Y
TU
N
CM
R
IRN
MD
V
IDN
DZ
A
BR
N
KW
T
GA
B
TU
R
JOR
UG
A
SA
U
AR
E
GU
Y
MY
S
KG
Z
BH
R
TJK
KA
Z
AL
B

45
known. Nevertheless, analysis of available data for the sub-group of countries that participate
in international assessments highlights two important patterns. Based on PISA 2012 data, Figure 2.27 reports share of resilient students. Resilient students are disadvantaged students, who belong to the lowest 25% of socioeconomic status but are among top 25% students
internationally in terms of performance. First, even among countries such as Indonesia, Jordan, Tunisia and Malaysia where inequality in access to school (in terms of years of schooling
completed) is low, the share of resilient students is very low. This implies that children from the poorest socio-economic groups in these countries have a very small presence in the topic quartile performing student population in PISA assessment. The only OIC country where the
share of resilient student population is above 5% is Turkey. This is significant because in PISA 2012, 6% of students across OECD countries (approximately one million students) are
“resilient” -- they defy the socio-economic odds against them and score among the top 25% of students internationally, when compared with students in other countries. In East Asian
countries like Hong Kong-China, Macao-China, Shanghai-China, Singapore and Viet Nam, 13% of students or more are resilient and perform among the top 25% of students across all participating countries and economies.
Figure 2.27: Share of Resilient Students in PISA 2012
Source: Author’s calculation using data from OECD (2012)
Another way to formalize the study of learning outcomes and inequality of access to quality education is by measuring the extent of inequality of learning opportunity in the education system. Learning opportunity can be defined as obtaining the minimum level of academic performance necessary to participate effectively and productively in adult life. Such analysis
ARE
IDN
JOR
KAZMYS
QAT
TUN
TUR
05
10
15
20
% r
esil
ien
t st
ud
ents
in P
ISA
, 20
12
0 20000 40000 60000 80000GDP per capita, 2006-2010
OIC OECD
NON-OECD

46
sheds light on how education systems vary in terms of the distribution of basic learning opportunities vis-a-vis various social groups in the country. Decomposition of ‘human opportunity index’ (HoI) into its component parts reveals that household wealth, parental education, and city size explain most of the cross-country differences in inequality in educational opportunities. Public spending on education also helps reduce inequality of opportunity (Balcazar, Narayan, and Tiwari 2015). To be precise, there is a positive relationship between public expenditure per student in primary and secondary as a % of GDP per capita and the percentage of students at or above level 2 of proficiency. However, higher spending on tertiary education has a negative impact. In terms of country specific results, evidence on Malaysia based on PISA 2012 identifies parental wealth and education as the main driver of inequality of learning opportunities (regardless of the study subject) (Balcazar, Narayan, and Tiwari 2015). Urban residency accounts for 23.4%, 12.6% and 18.4% of the inequality in math, reading and science respectively. Pre-school attendance is also an important source of inequality of opportunity in Malaysia. Evidence indicates that it accounts for 10%, 7.8% and 7.7% of the inequality in math, reading and science scores in PISA 2012 (Balcazar, Narayan, and Tiwari 2015). The country-specific patterns based on estimates of inequality of educational opportunity reported in Balcazar, Narayan, and Tiwari (2015) are similar to those in resilience student share (Figure 2.27). The estimate of the inequality of opportunity index is lowest in case of Turkey and very high in case of Qatar, Kazakhstan and Jordan. Indonesia and Malaysia also have a relatively high level of IoE when compared to the average for the OECD. Interestingly, two member states, Qatar and UAE, has very low share of resilient students despite very high level of per capita income. Student achievement (in PISA 2012) in these two countries is also characterized by a high level of IoE. Overall, Figures 2.21- 2.25 document the low level and significant economic disparities in the level of student achievement in OIC countries compared to the rest of the world. While family wealth (or poverty) is strongly linked to low scores, it is not destiny. Indeed in Kazakhstan, pupils from the poorest wealth group outperform their peers from the wealthiest group in Jordan, Albania, United Arab Emirates and Tunisia in level-1 proficiency in PISA math (Figure 2.25). The overall poor performance of two of the wealthiest OIC member states, United Arab Emirates and Qatar, in PISA also weakens the role of family wealth in explaining performance difference. While children in individual OIC member countries do differ in terms of family wealth, the education system in some countries fail children from all wealth groups while in others, it enables children from all groups to excel. In section 2.2.5, the levels of key correlates of learning outcomes, as identified in the conceptual framework in section 1, are analyzed jointly in a statistical model and compared between OIC and non-OIC countries.
2.1.5. Student Achievement in Low Income OIC Countries
The majority of the economically poorer OIC and non-OIC countries do not participate in international assessments. Emerging global evidence on these countries confirm that schooling is not the same as learning (UNESCO 2014, WDR 2018). This is further complicated by the fact the millions are not in school in many OIC countries. The full set of estimates of learning profiles, the empirical relationship between years of schooling completed and gains in learning, for OIC countries is not available. However, evidence emerging for countries such as Pakistan, Bangladesh and Afghanistan (Asadullah and Chaudhury 2015; Asadullah, Alim and Hossain,

47
2018) suggests that OIC countries may be also undergoing a similar learning crisis. Even after several years in school, the vast majority of students lack basic literacy and numeracy skills. In recent assessments in urban Pakistan, only three-fifths of grade 3 students could correctly perform a two-digit subtraction; in rural Pakistan, just over two-fifths could (WDR 2018). Across 51 countries which includes OIC member states such as Nigeria, Pakistan and Bangladesh, only about half of women who completed grade 6 (but no higher) could read a single sentence. As a matter of fact, it is predicted that 40 percent women would be illiterate even if all women completed at least six years of primary schooling (Pritchett and Sandefur 2016). Further evidence on the weak relationship between schooling and learning has emerged based on the Financial Inclusions Insights (FIIs) survey data on 10 countries including OIC members such as Bangladesh, Pakistan, Indonesia, Nigeria, and Uganda (Kaffenberger and Pritchett 2016). Countries on each high quality nationally representative data on student performance is unavailable also face the basic challenge of bringing children to school. According to the WIDE database, less than fifty percent children complete four years of education in OIC countries such as Afghanistan and Senegal. More than half of the world’s out-of-school children live in just 15 countries. Yet, these include 7 OIC member countries namely, Nigeria, Pakistan, Bangladesh, Niger, Yemen, Burkino Faso and Mozambique (UNESCO 2014).
2.1.6. The Determinants of Student Achievement
In this section, we build on the earlier descriptive analysis of the variation in student achievement in PISA and other international assessments and study the correlates of learning outcomes using multivariate regression analysis. Table 2.1 presents the OLS estimates of the determinants of student achievement PISA 2012 in the OIC, OECD and non-OECD countries. Data on all 9 OIC countries are pooled as a single population group. For comparison purposes, the results are also reported for participating OECD and non-OECD countries. Individual student level score in mathematics, reading and science are used separately as dependent variables so that for each 3 groups of countries, we present three regression models. The factors influencing student performance in OIC countries clearly differ when compared to OECD and non-OECD (and non-OIC) countries.
Key findings are as follows: The wealth effect is relatively higher in OIC countries. The coefficients on wealth quintile
dummies are much larger compared to those for OECD sample. The gender gap in reading (to the disadvantage of boys) is also much larger in OIC
countries. Teacher shortage does not display any systematic influence in OIC countries; only in
case of math the coefficient is significant while this variable also displays a negative and significant influence in OECD sample.
At the same time, there are a number of common drivers of student performance when compared to OECD countries. Among child-specific factors displaying a positive influence:
Pre-school attendance matters regardless of test subjects in OIC as well as OECD countries.
There is also a significant and positive correlation between private school attendance and student achievement. This is particularly pronounced in case of OIC countries.
Among school-specific factors displaying a positive influence are: Average disciplinary climate in school Number of computers available Proportion of certified teachers Autonomy over school budget

48
Among factors displaying a negative influence is a lack of parental pressure. Also significant is the rural-urban gap in student achievement. Children from towns and cities consistently score high in all subjects in OIC countries as well as OECD countries. However the urban influence is much bigger in case of OIC countries.
Table 2.1: OLS Estimates of the Determinants of Student Achievement PISA 2012 in the OIC, OECD and Non-OECD Countries
VARIABLES OIC OECD Non-OECD
VARIABLES Reading Math Science Reading Math Science Reading Math Science
Household wealth: 2 14.22** 11.82** 11.09** 7.647** 8.899** 7.456** 6.040** 6.311** 4.766**
(1.143) (1.046) (1.093) (0.590) (0.594) (0.601) (0.608) (0.631) (0.603)
Household wealth: 3 14.57** 11.86** 9.512** 7.279** 10.59** 7.425** 7.736** 6.669** 6.376**
(1.122) (1.032) (1.075) (0.587) (0.594) (0.600) (0.607) (0.629) (0.603)
Household wealth: 4 15.74** 14.74** 12.08** 6.094** 11.22** 6.397** 9.341** 8.477** 7.289**
(1.187) (1.108) (1.146) (0.627) (0.634) (0.639) (0.634) (0.662) (0.633)
Household wealth: 5 15.33** 15.22** 8.204** 2.384** 8.952** 2.600** 10.48** 12.56** 9.807**
(1.284) (1.219) (1.240) (0.647) (0.651) (0.656) (0.685) (0.715) (0.681)
Girl 44.91** 0.00295 15.94** 33.42** -
16.08** -
6.077** 30.46** -
13.72** -
4.341**
(0.759) (0.715) (0.732) (0.388) (0.392) (0.395) (0.394) (0.412) (0.393)
Age 8.580** 6.722** 6.789** 16.06** 17.11** 15.35** 11.68** 12.59** 13.34**
(1.313) (1.230) (1.263) (0.671) (0.677) (0.682) (0.677) (0.707) (0.676)
Attended pre-school 16.40** 15.25** 15.25** 27.73** 29.74** 27.19** 30.12** 31.90** 28.25**
(0.828) (0.769) (0.792) (0.816) (0.802) (0.812) (0.645) (0.634) (0.635)
Test language spoken at home 6.494** -
2.371** 8.296** 20.54** 9.053** 20.68** 15.55** 5.138** 11.76**
(0.924) (0.900) (0.920) (0.652) (0.638) (0.661) (0.796) (0.835) (0.779) Parent’s education: lower secondary
-9.744**
-4.855**
-5.132** 9.583** 14.07** 14.40** 16.76** 20.26** 16.51**
(1.633) (1.488) (1.532) (1.384) (1.346) (1.370) (0.732) (0.745) (0.722) Parent’s education: upper secondary
-15.90** -1.906
-5.421** 34.44** 41.41** 40.81** 24.59** 27.07** 24.62**
(1.325) (1.208) (1.264) (1.271) (1.234) (1.259) (0.689) (0.702) (0.682)
Parent’s education: Tertiary -2.961* 12.85** 11.74** 58.91** 65.93** 65.43** 38.29** 40.44** 37.61**
(1.319) (1.208) (1.263) (1.271) (1.232) (1.258) (0.686) (0.698) (0.676)
Learning minutes 0.0637*
* 0.0352*
* 0.0421*
*
-0.0309*
*
-0.0441*
*
-0.0437*
* 0.0292*
* 0.0425*
* 0.0272*
*
(0.00560)
(0.00480)
(0.00515)
(0.00260)
(0.00260)
(0.00267)
(0.00296)
(0.00321)
(0.00288)
Proportion of certified teachers 5.111** 10.90** 6.291** 26.39** 27.46** 26.39** 45.91** 60.83** 57.20**
(1.379) (1.289) (1.309) (0.880) (0.909) (0.890) (0.606) (0.630) (0.601)
Private school attended 30.51** 22.81** 27.40** 17.50** 15.53** 13.08** 16.32** 16.58** 15.91**
(1.293) (1.221) (1.264) (0.560) (0.583) (0.576) (0.609) (0.649) (0.603)
Teacher shortage -0.235 -0.735* 0.308 -
2.061** -
2.784** -
3.198** -5.193** -
5.374** -
6.015**
(0.317) (0.300) (0.307) (0.209) (0.210) (0.211) (0.187) (0.198) (0.187)

49
Average disciplinary climate in school 36.65** 48.36** 43.92** 38.64** 43.70** 37.96** 51.36** 57.87** 51.55**
(0.840) (0.798) (0.809) (0.439) (0.439) (0.443) (0.489) (0.515) (0.491) number of computers available
0.0641**
0.0818**
0.0726**
0.0132**
0.00539**
0.0197**
0.0729**
0.0987**
0.0724**
(0.00580)
(0.00549)
(0.00574)
(0.00163)
(0.00164)
(0.00165)
(0.00204)
(0.00252)
(0.00208)
Parental pressure: low -
9.675** -
6.144** -
6.563** -
21.70** -
19.29** -
20.13** -15.64** -
12.72** -
12.76**
(0.958) (0.909) (0.932) (0.506) (0.517) (0.519) (0.564) (0.610) (0.573)
Parental pressure: absent -
4.568** -0.930 -0.959 -
24.49** -
20.85** -
22.59** -17.24** -
15.94** -
15.29**
(1.089) (1.037) (1.049) (0.569) (0.580) (0.581) (0.580) (0.616) (0.585)
Small town 11.64** 7.893** 9.369** 6.790** 9.331** 5.299** 11.84** 10.57** 7.189**
(1.255) (1.157) (1.197) (0.802) (0.796) (0.821) (0.837) (0.840) (0.844)
Town 30.10** 25.69** 27.05** 18.31** 15.88** 13.23** 17.25** 12.73** 9.183**
(1.325) (1.221) (1.255) (0.762) (0.754) (0.780) (0.795) (0.800) (0.802)
City 31.86** 25.47** 25.70** 19.52** 14.34** 13.10** 26.74** 22.70** 17.49**
(1.255) (1.164) (1.201) (0.798) (0.793) (0.819) (0.807) (0.820) (0.815)
Large city 55.83** 46.06** 46.77** 24.39** 18.12** 13.37** 48.14** 52.56** 39.15**
(1.467) (1.401) (1.427) (0.938) (0.944) (0.959) (0.853) (0.898) (0.866)
Autonomy – content 4.211** -0.580 -2.096+ -1.088+ -0.461 2.470** -2.031** -1.444* 0.819
(1.181) (1.095) (1.134) (0.572) (0.577) (0.579) (0.581) (0.619) (0.582)
Autonomy – hiring -
31.41** -
18.82** -
25.29** -
17.21** -
11.65** -
10.80** 5.835** 9.652** 5.161**
(1.305) (1.203) (1.260) (0.634) (0.640) (0.643) (0.629) (0.649) (0.624)
Autonomy – budget 9.646** 4.311** 8.022** 3.692** 2.627** 4.044** 5.546** 2.859** 5.446**
(0.846) (0.786) (0.809) (0.523) (0.529) (0.528) (0.481) (0.492) (0.477)
Constant 192.7** 243.2** 237.8** 134.3** 140.7** 166.8** 132.1** 128.4** 127.9**
(20.97) (19.60) (20.16) (10.77) (10.86) (10.94) (10.81) (11.30) (10.80)
Observations 52,704 52,704 52,704 188,169 188,169 188,169 172,564 172,564 172,564
R-squared 0.213 0.190 0.182 0.193 0.173 0.157 0.305 0.333 0.297
Note: STR and class size data is missing for Albania and hence not included in the regression model.
These differences in the determinants imply that part of the learning gaps between OIC and non-OIC countries reported earlier in Figure 2.13 reflect socio-economic and institutional quality differences. Not all of these differences are statistically observed and hence fully measureable. Nonetheless, we the same regression specification reported in Table 2.1 pooling data for OIC and non-OIC countries and estimate the extent of country-specific shortfall in learning in the OIC sample that can’t be attributed to differences in child, family and school level factors that are included in the regression model. Figure 2.30 plots the coefficient on country-specific indicator variable from the full sample regression model where the comparison category is OECD countries and the included categories are 9 participating OIC countries and other non-OECD countries. Even after differencing out a host of common correlates of student learning, there are large gaps in test scores.

50
Figure 2.28: Learning Shortfalls in OIC and Non-OECD vs. OECD Countries, PISA 2012
Source: Author’s calculation based on PISA 2012 data. Note: Estimates based on OLS model of student achievement with students from OECD countries as the comparator group. All underlying regressions include control for covariates included in Table 2.1.
Figure 2.29 repeats the exercise by replacing OIC group indicator variable with country specific indicators. Only Turkey appears to have no systematic shortfall in learning vis-à-vis other OECD countries once differences in socio-economic conditions and school resources are taken into account. The gap in case of Tunisia and UAE is also modest (around 40-50 points). The laggards among participating countries are Albania, Kazakhstan, and Qatar where the average gap is around 100 points.
Figure 2.29: Learning Shortfalls in OIC vs. OECD Countries, PISA 2012
Source: Author’s calculation based on PISA 2012 data. Note: Estimates based on OLS model of student achievement with students from the OECD countries as the comparator group. All regressions include control for covariates included in Table 2.1.
-80
-70
-60
-50
-40
-30
-20
-10
0
OIC Non-OECD
Reading Maths Science
-100
-80
-60
-40
-20
0
Reading Maths Science
OIC_arab OIC_asia (non-Arab)
Non-OECD
-140
-120
-100
-80
-60
-40
-20
0
20
Alb
ania
Ind
on
esia
Jord
an
Kaz
ak
Mal
aysi
a
Qat
ar
Tu
nis
ia
Tu
rkey
UA
E
Reading Maths Science
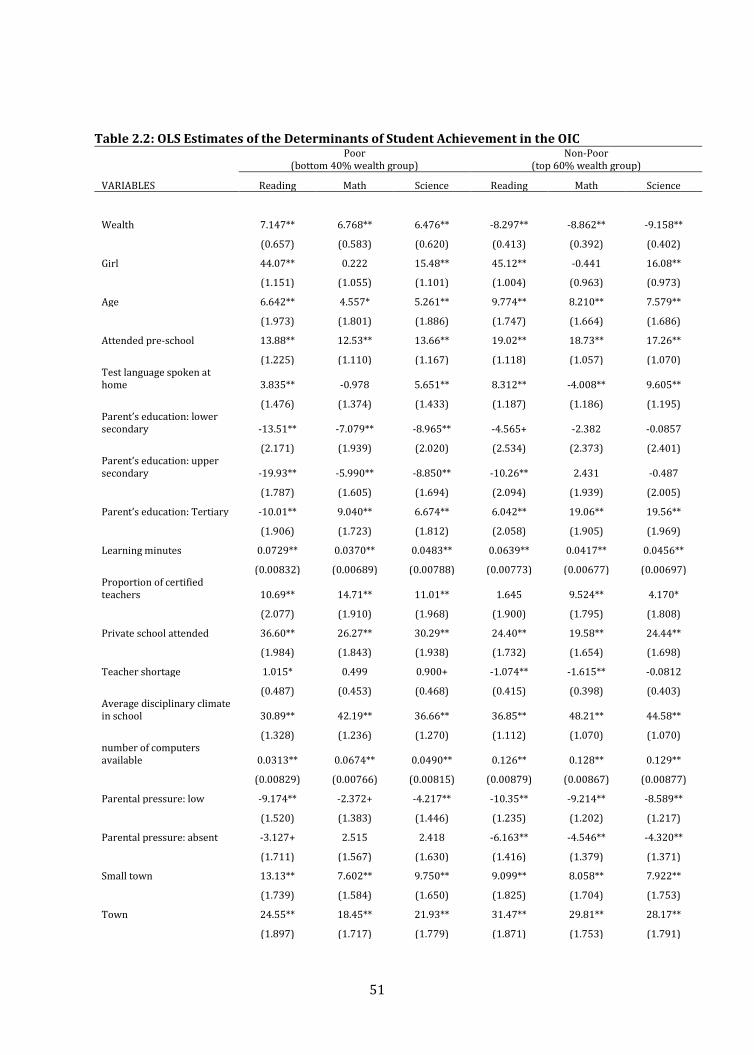
51
Table 2.2: OLS Estimates of the Determinants of Student Achievement in the OIC
Poor
(bottom 40% wealth group) Non-Poor
(top 60% wealth group)
VARIABLES Reading Math Science Reading Math Science
Wealth 7.147** 6.768** 6.476** -8.297** -8.862** -9.158**
(0.657) (0.583) (0.620) (0.413) (0.392) (0.402)
Girl 44.07** 0.222 15.48** 45.12** -0.441 16.08**
(1.151) (1.055) (1.101) (1.004) (0.963) (0.973)
Age 6.642** 4.557* 5.261** 9.774** 8.210** 7.579**
(1.973) (1.801) (1.886) (1.747) (1.664) (1.686)
Attended pre-school 13.88** 12.53** 13.66** 19.02** 18.73** 17.26**
(1.225) (1.110) (1.167) (1.118) (1.057) (1.070) Test language spoken at home 3.835** -0.978 5.651** 8.312** -4.008** 9.605**
(1.476) (1.374) (1.433) (1.187) (1.186) (1.195) Parent’s education: lower secondary -13.51** -7.079** -8.965** -4.565+ -2.382 -0.0857
(2.171) (1.939) (2.020) (2.534) (2.373) (2.401) Parent’s education: upper secondary -19.93** -5.990** -8.850** -10.26** 2.431 -0.487
(1.787) (1.605) (1.694) (2.094) (1.939) (2.005)
Parent’s education: Tertiary -10.01** 9.040** 6.674** 6.042** 19.06** 19.56**
(1.906) (1.723) (1.812) (2.058) (1.905) (1.969)
Learning minutes 0.0729** 0.0370** 0.0483** 0.0639** 0.0417** 0.0456**
(0.00832) (0.00689) (0.00788) (0.00773) (0.00677) (0.00697) Proportion of certified teachers 10.69** 14.71** 11.01** 1.645 9.524** 4.170*
(2.077) (1.910) (1.968) (1.900) (1.795) (1.808)
Private school attended 36.60** 26.27** 30.29** 24.40** 19.58** 24.44**
(1.984) (1.843) (1.938) (1.732) (1.654) (1.698)
Teacher shortage 1.015* 0.499 0.900+ -1.074** -1.615** -0.0812
(0.487) (0.453) (0.468) (0.415) (0.398) (0.403) Average disciplinary climate in school 30.89** 42.19** 36.66** 36.85** 48.21** 44.58**
(1.328) (1.236) (1.270) (1.112) (1.070) (1.070) number of computers available 0.0313** 0.0674** 0.0490** 0.126** 0.128** 0.129**
(0.00829) (0.00766) (0.00815) (0.00879) (0.00867) (0.00877)
Parental pressure: low -9.174** -2.372+ -4.217** -10.35** -9.214** -8.589**
(1.520) (1.383) (1.446) (1.235) (1.202) (1.217)
Parental pressure: absent -3.127+ 2.515 2.418 -6.163** -4.546** -4.320**
(1.711) (1.567) (1.630) (1.416) (1.379) (1.371)
Small town 13.13** 7.602** 9.750** 9.099** 8.058** 7.922**
(1.739) (1.584) (1.650) (1.825) (1.704) (1.753)
Town 24.55** 18.45** 21.93** 31.47** 29.81** 28.17**
(1.897) (1.717) (1.779) (1.871) (1.753) (1.791)

52
City 31.63** 21.49** 24.83** 30.71** 28.40** 25.05**
(1.805) (1.637) (1.707) (1.777) (1.677) (1.720)
Large city 48.81** 35.68** 39.10** 59.29** 53.35** 50.68**
(2.242) (2.090) (2.153) (2.001) (1.940) (1.964)
Autonomy – content 4.233* 2.288 -0.917 2.186 -5.217** -5.896**
(1.844) (1.671) (1.757) (1.578) (1.478) (1.515)
Autonomy – hiring -31.50** -17.32** -23.69** -28.74** -17.51** -23.57**
(2.007) (1.801) (1.929) (1.719) (1.613) (1.664)
Autonomy – budget 9.165** 1.975+ 7.162** 8.662** 4.680** 7.058**
(1.283) (1.167) (1.221) (1.120) (1.052) (1.070)
Constant 246.5** 296.2** 281.0** 180.0** 225.1** 226.9**
(31.46) (28.69) (30.07) (27.90) (26.54) (26.90)
Observations 22,872 22,872 22,872 29,832 29,832 29,832
R-squared 0.213 0.183 0.177 0.223 0.204 0.199
Source: Author’s calculation based on PISA 2012 data. In order to identify the determinants of learning achievement among children of rich and poor families in the participating OIC sample countries in PISA 2012, Table 2.2 reports OLS estimates pooling data on all 9 countries as a single population group. Among child-specific results, girls outperform boys in both wealth groups. In reading, the gap is equivalent to more than one full year in school. Pre-school attendance also benefits both groups of children. There is also a systematic advantage to private school attendance among both groups. Being absent from school also exerts a significant learning penalty among children from wealthier families though such negative effect is weak in case of children from economically poorer families. In case of family-specific factors, there is clearly a positive wealth effect among children poorest families (bottom two quartiles). However, this is reversed in case of children from the weather families (top two quartiles).
Main Factors Determining the Quality of Education
The vast majority of the OIC member states are low income countries where schools are inadequately funded by the state. Therefore the common perception is that quality is poor because of lack of a wide range of basic facilities in school such as teachers, classrooms, blackboards, textbooks, functional toilets. For instance, among secondary school principals who participated in the 2015 PISA survey, about 40% in Indonesia and Jordan reported that infrastructure problems adversely affected instruction (UNESCO 2017). Similarly, a large percentage of primary schools in Asian OIC member states worry about the lack of instruction space and heating or cooling and its adverse effect on classroom instruction. As per responses of school Principals in TIMSS 2015 survey, about half of primary principals in Jordan, Kuwait, Turkey and Saudi Arabia said insufficient instruction space and ineffective heating or cooling impeded teaching and learning (UNESCO 2017).
Among school specific resource-related factors, the shortage of qualified teachers as well as the lack of training provisions is thought to be a major constraint. Unfavorable STR means insufficient learning hours in a school day. In populous countries like Nigeria and Pakistan, lowering student-teacher ratio to no more than 30 students in primary education would require recruiting thousands of additional teachers. At the secondary level, there is also a shortage of

53
trained teachers who are qualified and have subject-specific teachers lack in core subjects such as languages, math, science and computer. Most countries lack pre-service professional training; there is no certification for school teaching. In some countries, there is no defined career path for teachers (e.g. graduating from an assistant teacher to school principal etc.).
Learning gains are also a function of family background, causing a low learning trap across generations (World Bank 2018). The intergenerational transmission of illiteracy works through a number of demand-side channels such as (a) poor health (e.g. childhood under-nutrition) (b) inadequate early childhood cognitive development (and brain formation) (c) maternal illiteracy. An illiterate mother is likely to adversely affect cognitive development among children (Asadullah et al 2016). Research shows a positive link between improvements in women’s education and children’s health outcomes in OIC member countries such as Pakistan and Senegal (WDR 2018). More schooled parents have children with higher educational attainment independent of household poverty. And children’s ability to benefit from education is shaped by their parents’ education. In Pakistan, each additional year of a mother’s schooling lead to children spending an additional hour per day studying at home (Andrabi, Das and Khawaja 2012).
System-specific explanation for the low level of learning in secondary grades across OIC countries includes the deficit in early-life foundational cognitive skills. OIC countries vary significantly in terms of access to early-life learning opportunities. There is a growing body of international evidence documenting the importance of early investment in reading skills at pre-primary and lower-primary cycles (Heckman, 2008; Murray, 2012). The first 8 years of life (i.e. from birth to age 8) is the most critical period for cognitive development. Evidence from OIC member state, Senegal, confirms that cognitive development in early grades matters – there is a significant and positive association between learning outcomes in grade 2 and children’s school progression seven years later (Glick and Sahn, 2010). Yet, among children who were enrolled and tested in primary school grades, less than 50% have learned the basics of reading in OC countries such as Morocco (38%), Burkina Faso (34%) and Senegal (38%). The level of basic learning is also low in mathematics -- the proportion of tested children achieving basic competencies in math was as low as 11% in Yemen; the figures for COTE D'IVOIRE, Morocco, Pakistan and Burkina Faso were 17%, 29%, 44% and 46% respectively. (UNICEF 2015). Equally, the evidence suggests rapid progress in cognitive development in the first 2 years of life (Heckman 2008). While in some countries many children attend pre-primary schools, participation is low and access is also far from equitable in all OIC countries.
However, regardless of learning quality at the early or later stage of schooling, research shows that there is no systematic link between resource availability at school and educational performance. The observed cross-sectional correlation between input level in school and student outcomes are often biased because economically poorer students are often sorted into under-funded schools. The first study on an OIC country examining the causal relationship between student achievement and class size finds no systematic adverse effect of smaller student-teacher ratio (Asadullah, 2005). This conclusion has been also supported by later studies on other developing country studies. Review of the available evidence finds that some studies report positive significant effects of smaller class size while others find no relationship between class size and student achievement (Rockoff, 2009). The absence of an effect in Bangladesh where the average class size is twice that observed in much wealthier OIC countries such as Qatar and Malaysia again challenges the common sense argument that low learning is simply a matter of better infrastructure.

54
Another case of resource scarcity is poor teacher pay. In many OIC countries, teachers are paid poorly compared to other occupations or infrequently (Asadullah 2006). In the case of Indonesia, the government therefore introduced a number of reforms including increased allocations to teachers. In the recent education budget, 52% has been allocated for teachers. Recent salary reforms permanently doubled base teacher pay. Yet, in spite of the huge percentage of the education budget being spent on teachers including salary increase, their performance remains unsatisfactory. Evidence indicates that it did not improve teacher effort and student learning outcomes even after two and three years of the pay rise. This again highlights the limits of expenditure-focused reforms to improve student learning even when expenditure is targeted to teachers (de Ree, Muralidharan, Pradhan, and Rogers, 2015).
Another commonly perceived driver of low quality is the lack of emphasis on literacy and numeracy in school education in many OIC countries. In many of the member countries, religious and modern education still operates in parallel, often without any significant overlap. The large presence of Islamic schools in the relatively poorer members of the OIC such as Bangladesh, Indonesia and Nigeria is a major policy issue and creates numerous challenges to deliver of quality education. In many instances, these schools remain outside the purview of the state and rely on non-standardized curricula. Learning materials are not regularly updated. The education received, while focused on moral and religious values, allegedly does not impart functional numeracy and literacy skills. Even in instances where governments have recognized madrasah education and has invested heavily, quality remains less than satisfactory. There are additional concerns of gender exclusions with female teachers and students discouraged or subject to restrictive socialization processes. These are serious concerns given the fact that Islamic schools have higher presence in locations where the availability of government schools is limited (Asadullah, 2016a). Madrasah children also disproportionately come from poorer economic backgrounds (Asadullah and Chaudhury, 2016; Asadullah and Maliki 2018). However, research comparing the relative performance of students attending Islamic schools in the OIC is almost non-existent. There is burgeoning evidence from one member country, Bangladesh, which has arguably the second largest Islamic schooling system in the Muslim world. These schools are indeed found to help build social capital in rural communities. Compared to students from non-religious schools, students of state recognized madrasahs are more trusting of others (Asadullah 2016b). At the same time, empirical analysis based on multiple rounds of detailed nationally representative survey data confirm that children from state-recognized secondary madrasahs are behind those from government owned non-religious secondary schools (Asadullah, Chaudhury and Dar 2007; Asadullah, 2016c). However, one important finding is that the quality of government schools in rural areas is not sufficiently high. In other words, the learning gap between Islamic and non-religious government school is not large. This conclusion is supported by more recent research using data from household based assessment of learning outcomes. The level of learning is found to be low across all types of providers (Asadullah and Chaudhury 2015). This highlights the fact that madrasahs per se are unlikely to be the main challenge. Muslim countries, similar to many other developing nations, face various structural challenges that limit the impact of schooling (Kuran 2018). Many OIC countries still suffer from negative attitudes toward girls’ schooling and textbook contents lack gender balance (Islam and Asadullah 2018; Asadullah, Amin, Chaudhury 2018). The emphasis on memorization also undermines critical thinking skills and creativity which are key ingredients for innovation.
One major structural challenge facing developing countries is the lack of institutional capacity to use inputs efficiently. Apart from resource related factors, low level of accountability is a challenge. A key mechanism for holding teachers accountable in terms of teaching and learning

55
activities is to conduct formal evaluations. World Bank’s Systems Approach for Better Education Results (SABER) study shows that the majority of the 26 low and middle income countries examined employ some form of teacher evaluation. This includes 14 OIC member states -- Cote d Ivoire, Djibouti, Egypt, Guinea-Bissau, Jordan, Kazakhstan, Kyrgyz Republic, Lebanon, Morocco, Mozambique, Nigeria, Tunisia, West Bank and Gaza and, Yemen (WB 2017a). Regular assessment of students is equally important to hold schools accountable. However, there is considerable variation within the OIC in terms of effectiveness and frequency of national assessment. In some member countries (e.g. Bangladesh, Malaysia, Pakistan), students sit for three-four high-stake public examinations at primary and secondary grades before tertiary education. In others (e.g. Jordan), there is only one pre-tertiary high stake national assessment. This has created additional challenges in countries with poor administrative capacity (e.g. Bangladesh) where test papers are regularly leaked in advance and sold to students. The absence of international scrutiny of schools muffles debate on education quality.
Over the past two decades, therefore, developing country governments and development partners have developed and implemented a range of education interventions to address the ongoing learning crisis. While the crisis is caused by a multitude of factors, existing interventions prioritize a specific input or problem area and directly focus on either children or the behavior or preference of households, teachers, schools and systems. As the global evidence has expanded, it is possible to learn from the existing interventions to identify reforms that are effective in improving learning outcomes. Globally thousands of studies have been conducted to examine the causal impact of interventions. Most observational studies suffer from various well-known methodological limitations. They differ in terms of measurement, sample size and controls for confounding factors all of which affect comparability of the evidence. It is also difficult to generalize the effectiveness of an input in boosting learning, based on simple correlations between inputs and outcomes. While improving school quality is found to raise test scores (Muralidharan and Sundararaman 2011), the exact aspect of school and teacher quality is difficult to locate (Azam and Kingdon, 2015). There is therefore a shift in preference in favor of randomized control trial (RCTs) evaluation of educational interventions. However, education related RCTs are rare for OIC countries. Moreover, the distribution of impact studies is uneven across different areas of educational development. Some interventions (e.g. cash transfers, structured pedagogy and computer-assisted learning) have been studied more frequently while the evidence on some other interventions (e.g. school-based health, information to children, remedial education and school day extension) is more limited (3IE 2016).
In this section, a brief overview of the available evidence is presented based on the existing international publications on education quality and factors and initiatives that work to improve school quality. While there is no single solution to fix the quality of education, this section also highlights some good practices within the OIC. In OIC member countries in central Asia such as Azerbaijan, Kazakhstan, Kyrgyz Republic, Tajikistan, and Uzbekistan, various national strategies to raise education quality produced mixed results (Chapman, Weidman, Cohen, and Mercer 2005). One country that particularly stands out in terms of innovations in the field of education is Malaysia, also home to arguably the largest education export zone in the world (Sabel and Jordan 2015). The government responded to poor performance in earlier round of PISA by introducing reforms which has helped improve student performance in PISA 2015. Malaysia therefore offers a number of good practices which we highlight while noting that these are not necessarily transferable as the underlying preconditions differ across OIC countries.

56
According to the WDR 2018, there are three dimensions of the learning crisis: (1) The level of learning is low, unevenly distributed and progress in improving outcomes has been slow progress (2) Schools are failing learners because of a lack of effective teaching, learning focused inputs, and the skilled management and governance system. (3). Systems are failing schools whereby political forces often shift the focus of the education system away from learning goals. The latest GMR 2017 on the other hand maintains that the key to an effective education system is accountability. Demand-side factors that are key to avoid learning trap include school readiness, ensuring that children arrive in school prepared to learn i.e. they are not malnutrition, hungry, sick, and face hostile environments at home. Supply-side factors include well-trained teachers, non-teaching input shortage and system wide issues such as poor management and governance and the lack of effective school leaders.
There has been a rapid growth in the number of studies on factors adversely affecting education quality though such research is often limited for OIC countries. These individual studies relied on experimental and quasi-experimental methods to evaluate policies and that were funded by national governments or by international donors or were conducted in collaboration with both. The individual studies differ greatly in terms of quality, rigor and representative. Therefore a number of meta-analysis as well as systematic reviews have been conducted in recent years to examine interventions that seek to improve learning outcomes in developing countries. The purpose of these reviews is to identify common support in favor of a particular intervention in varied contexts and therefore common recommendations on what works to improve learning. Some prominent examples include Glewwe et al. 2014, Kremer, Brannen, and Glennerster 2013, Krishnaratne, White, and Carpenter 2013, McEwan 2014, and Murnane and Ganimian 2014, Banerjee, Glewwe., Powers, and Wasserman, 2013) and Masino and Niño-Zarazúa (2016). These reviews provide support in favor of the WDR 2018 and GMR 2017 recommendations.
However, there is also considerable disagreement in terms of conclusions reached. One review concludes in favor systematic and sizable effects of interventions involving ICTs (McEwan 2014), another emphasizes pedagogical reforms as well as the incentives associated with hiring contract teachers (Kremer, Brannen, & Glennerster 2013). Another review of the evidence stresses on the impact of human capacity (e.g. teacher knowledge), accountability (teacher absenteeism) and physical resources (e.g. the availability of student desks on student learning) (Glewwe et al. 2014). Krishnaratne, White, & Carpenter (2013) underline the importance of learning materials. Some reviewers interpret the evidence strongly in favor of better provision of information on school quality and the economic benefit of education (Murnane and Ganimian 2014). A relatively recent review concludes that supply-side interventions per se are less effective than when combined with community participation or incentives that shift behaviors of students and teachers (Masino and Niño-Zarazúa 2016). According to another recent systematic review, pedagogical interventions that align teaching to student learning levels are effective at improving student test scores. This involves both teacher-led (repeated teacher training interventions) as well as facilitated by ICT (computer-assisted learning). Also important are improving accountability through contracts or performance incentives (Evans and Popova, 2016).
Another comprehensive systematic review on education effectiveness spanning 52 developing countries synthesized evidence on the effects of 21 different types of education interventions (3IE 2016). Impact was assessed on children’s school enrolment, attendance, completion and learning achievement (scores on cognitive, language and mathematics tests). While the evidence indicates that there are no ‘silver bullets’ to ensure high-quality education for all, a number of important lessons emerged from the review.

57
Most education schemes were found to improve either school enrolment or learning outcomes. But in very few instance, they improved both.
Some interventions appear to work in most contexts while others are promising but require further testing. A third group of interventions comprise of those that do not always work or have unknown effects owing to lack of sufficient studies.
Among child-specific interventions, merit-based scholarships and school meals are promising for improving learning outcomes. School meals programmers showed positive impact in both school participation and a wider range of learning outcomes such as language and mathematics test scores. The impact of others such as providing information and school-based child health improvement are yet to be fully documented.
Household-specific interventions include abolishing school fees, cash transfers and providing information to parents on school performance. Cash transfers (CTs) were consistently found to have the largest positive effects on improving access (e.g. increasing school enrolment and completion). However, the impact on learning outcomes is weak.
Among school-specific schemes showing consistent impact on improving learning outcomes, structured pedagogy programmers had the largest positive effects. These schemes provided customised curricula, new instructional approaches for teachers, and educational materials for students. Schemes that extend the school day and provide remedial education programmes are also promising. Public-private partnerships are promising for improving participation outcomes. But school-based management programmes and computer-assisted learning have not improved learning outcomes in most contexts.
Among teacher-specific interventions, the impact of teacher training and hiring is unknown while schemes that improve teacher accountability and incentives don’t always work.
However, compared to other low-and middle-income countries, the response of the OIC countries has been limited. In Arab countries in particular, carefully designed interventions with built-in evaluation study is limited. There is also variation in the quality of evidence as well as their regional coverage. In that sense, the distribution of impact evaluations studies is not even as OIC countries are largely absent. Studies on member countries are either of poor quality or are not based on an RCT design. The recent comprehensive review selected 238 impact evaluation studies in total covering Latin America and the Caribbean (87), Sub-Saharan Africa (59) and South Asia (51). For most Arab countries, researchers identified few or no studies. Evidence is also limited for OIC countries with large populations (e.g. Indonesia, Nigeria and Bangladesh). This makes it difficult to identify common barriers to quality education in OIC countries.
For some educationally advanced member countries, there are many examples of good practices. In the case of Malaysia, for instance, school principals engage in unannounced daily ‘learning walks’ to observe teachers more informally and enter classrooms to observe teaching and help maintain discipline (UNESCO, 2017). This indirectly helps raise student learning by improving teaching quality and ensuring effective use of resources through effective school leadership. Another good example is the digitization of information on student performance in the three public examinations at the end of primary, lower secondary and upper secondary to improve school quality in Malaysia. The Malaysian government also revamped the school management system, Sistem Pengurusan Sekolah, during 2013–2015 and made it more efficient to improve quality, facilitate access and increase use levels. Today, all public secondary schools

58
are obliged to use the new database. District education officers have been also trained to analyse and use the school data for diagnostics purpose (Malaysia Ministry of Education, 2013; UNESCO, 2017). A third good practice is the formation of broad-based coalitions of stakeholders to avoid implementation failure. To this end, Malaysia created a performance delivery unit (PEMANDU) or a “lab model” to spearhead comprehensive reforms in many sectors, including education (WDR 2018). This approach has been subsequently exported to a number of other developing countries. The PEMANDU model resembles the “problem driven, iterative adaption” (PDIA) approach where the key is to avoid implementation failure (Sabel and Jordan 2015). This approach integrates planning and doing authorizing local actors to incrementally improve initial plans. This ensures engagement of stakeholders in the design as well as implementation phase of reform (World Bank 2017/Malaysia). Stakeholders usually meet in the labs for six to nine weeks at the inception phase to finalize performance indicators and implementation plans. Decisions made at local levels are corrected by judgments at “higher” ones and vice versa. Nearly a third of the initial plans are implemented as they emerge from the Labs while the remaining two-thirds are revised in implementation. This has also inspired the Ministry of Education to create a similar accountability system—the “Performance and Delivery Unit” (PADU). Programs approved under the process have been credited with increasing grade 3 literacy rates in Malaysia from 89 percent in 2009 to close to 100 percent in 2012 (WDR 2018). However, none of these three potentially good practices have been scientifically evaluated. Hard evidence documenting their impact on student learning remains absent.
Policy Efforts To Improve Education Quality In The OIC Countries
The need for substantive improvements in education statistics and indicators of progress has long been emphasized for some member states (Heyneman, 1997). Yet only a handful of countries have responded positively. There is no OIC-wide initiative that coordinates actions and programs to improve the quality of education in member countries. This is despite the fact that these countries face common challenges and share socio-religious characteristics that impact schooling and learning outcomes. One body that goes some distance in filling this void is the “Islamic Education, Science and Culture Organization” (ISESCO) which spearheaded a number of initiatives to coordinate progress with the Islamic world towards meeting the millennium challenges. In 2005, a 10-year long Programme of Action to Meet Millennium Challenges was launched following the 3rd Extraordinary Islamic Summit in Mekkah. The initiative aimed to tackle various challenges facing the Islamic Ummah in the 21st Century. This was followed by a new three-year action plan (2013-2015) adopted in 2012 by the 11th General Conference held in Riyadh (Altwaijri, 2014).
Other important regional organizations involving OIC countries include the “Arab League Education, Culture and Science Organization” (ALECSO) and “Arab Regional Agenda for improving Education Quality” (ARAIEQ) and “Arab Program for Early Childhood Development” (APECD)5. The recently launched “Strategy for the Development of Education in the Islamic World” amended and adopted by the First ISESCO Conference of Education Ministers has clearly shifted to the focus education quality:
“The first step in building the future of the Islamic world as we aspire to is to eradicate illiteracy in all its forms, functional illiteracy, digital illiteracy and information illiteracy. It also entails developing and improving the quality of education by adopting modern and world class educational systems, starting with the training of teachers who believe
5 https://anecd.mawared.org/sites/default/files/anecd_ref_6-2015.pdf

59
in the vision of change, capable of leading the drive for change, mastering information technologies, resourceful, seasoned professionals who are capable of interacting with colleagues and students, knowledgeable about modern sciences and the culture of their societies”.6
ALECSO has launched a Strategic Plan for the period 2017-2022 entitled “Plan for the Development of Education in the Arab World” which identified the following as the major shortcomings in the education system of the Islamic world:
High illiteracy rate Social vulnerability Deficient educational curricula Poor teacher training Girls’ unequal access to education Low attention to pre-school education Low enrolment rates in primary school Low achievement in scientific subject Low outputs in secondary education Lack of planning and coordination in vocation and technical education Lack of quality in higher education Low scientific research performance Low spending on education
The strategic plan has 8 focus areas and goals which include that of “combating illiteracy in the Arab World Goal” by developing literacy and adult education policies7. The fifth goal is about improving “younger generations’ interaction with technologies and social media” whole the sixth goal is “Activating the role of community institutions in promoting education Goal”. The latter includes increasing the role of the family in the education and protection of children. The last goal is to “develop Member States’ policies and programs, and increase efforts for more efficient use of sciences, scientific research and technologies”.
Another international forum exclusively dedicated to educational development is E-9. Launched in 1993, is particularly notable as it is the only policy forum exclusively dedicated to education that brings the most educationally challenged Arab, Asian and African members of the OIC. Indirectly, therefore, it offers unique South-South cooperation within the OIC. E-9 is comprised of the nine most highly-populated countries of the South – these also include 5 OIC countries -- Bangladesh, Egypt, Indonesia, Nigeria and Pakistan. The five OIC members of E-9 face similar challenges – they account for the majority of the OIC’s illiterate adults and out-of-school children. Therefore the E-9 Initiative serves as an additional forum for these five high-population OIC countries to address their common education challenge, exchange best practices and track progress towards the SDG 4 target of achieving quality education for all.8
Significant progress has been achieved in the OIC members of E-9 since the initiative was launched in New Delhi in 1993. These includes universalizing primary education and reduction
6 https://www.isesco.org.ma/wp-content/uploads/2015/11/islamic_world_millennium_challenges.pdf 7 https://www.isesco.org.ma/wp-content/uploads/2015/05/Strategy-education-VE.pdf 8 http://www.unesco.org/new/en/education/themes/leading-the-international-agenda/education-for-all/coordination-mechanisms/e-9-initiative/

60
in gender disparities. However, in the cases of Nigeria and Pakistan, the progress is less than satisfactory. Moreover, the 2010 Abuja framework for action and cooperation focused on literacy for development. The 2012 New Delhi declaration expanded cooperation among member countries in the area of Inclusive, Relevant Quality Education for All. Yet E-9 member countries are well-known for very poor record in literacy and numeracy outcomes. Although government literacy statistics show upward trend, these are based on self-reported response and do not tally with independent assessment which test literacy skills. The impact of the E-9 initiative remains unclear as the learning crisis has apparently become more severe in member OIC countries over the past two decades.
Nonetheless, in recent decades, many member states joined different regional forums and international initiatives focused on the delivery of quality education. As pointed out already, some participate in international assessments and reviews conducted by multilateral agencies. For instance, the OECD report covers all 35 OECD countries and a number of partner countries which also includes OIC countries such as Indonesia and Saudi Arabia (OECD 2017).
Following the launch of the MDG agenda, there has been a coordinated response to educational development in OIC countries. One notable aspect of the MDG movement is that it facilitated new partnerships, galvanized public opinion and reshaped decision-making in developed and developing countries including the OIC countries. All OIC countries have launched programs to achieve the fourth goal of the SDGs proposed by the United Nations -- “Ensure inclusive and equitable quality education and promote life-long learning opportunities for all. In post-MDG era, there is now a consensus across OIC countries on building an education system that contributes to economic growth and boosts productivity and innovation.
Conclusion
A worrisome trend is the lack of progress in improving education quality in OIC countries in the last two decades. While assessments like TIMSS and PISA do not provide a full picture of a country’s education system, the results are increasingly recognized as key diagnostics tool. For instance, the “Sustainable Development Strategy: Egypt Vision 2030” document includes clear goals such as becoming “one of the top 30 countries in the quality of basic education index” and “one of the top 10 countries in the TIMMS assessment” by 2030.9 Yet the performance of OIC countries as a group in PISA and TIMSS does not suggest across the board long-term improvements in education quality. If anything, the gap between OIC and participating non-OIC countries have widened over time. In higher order competencies, there is also an absence of improvement across wealth groups. Even when comparison is made among children in OIC and OECD sample countries who are similar in terms of observed socio-economic, those from the OIC lag behind by approximately 70 PISA points. The learning shortfall is greatest in case of Qatar.
These findings are troubling because they relate to economically more advanced members of the OIC from MENA, Central and South-East Asia. The relatively wealthier Arab countries (from MENA) have a growing presence in international assessment facilitating in-depth, independent investigation into the state of education quality. In contrast, 27 African member states of the OIC, most of which are low-income countries, are under-represented in terms of data and evidence on education quality. This is also true for OIC member states from South Asia such as
9http://www.unosd.org/content/documents/1271Egypt_Dr.%20Nihal%20El%20Megharbel_Workshop%20on%20National%20Development%20Strategies%20_FINAL_MQ_NM_27Oct15.pdf

61
Pakistan, Afghanistan, Bangladesh and the Maldives. In other words, the majority of the member states where children have poor access to education remain outside the scrutiny as they don’t participate in any of the major international assessments. However, our review of the available evidence from these countries based on country-specific survey data reveals that the learning crisis in the OIC countries is likely to be more severe as new evidence on South Asian and African member states become available.
Most of the non-participating countries are income-poor and have been found to be challenged by resource-strapped education systems. Schools have unfavorable teacher-student ratio and classrooms are overcrowded. There is a shortage of trained teachers. At the same time, among countries that participate in international assessments and allow independent scrutiny of their education systems, student performance does not show a systematic correlation with resources. Therefore, learning, instead of enrolment and school completion or mere improvement in PTR, should be the primary goal of education in the OIC countries. While countries should meet the target of 20% of the GDP allocated to education, this alone is not sufficient to deliver quality education.
The multivariate analysis of the determinants of student achievement has highlighted a number of important associations that can inform reform initiatives in the OIC countries. First, findings show a “private school effect” – students educated in private schools scoring significantly higher in PISA. Increasing participation of the private sector is already emphasized in national plan documents such as the National Transformation Program 2020 of the Saudi Government10. In Egypt, there are about 6 thousand private schools, serving 1.6 million students. This represents approximately 9% of total enrolled students. 11 However, the provision of affordable private school is still very limited in member countries.
Second, the findings show a clear need for greater parental engagement. Some member states already recognize this. To quote from Saudi Arabia’s Vision 2030 document: “Our goal by 2020 is for 80 percent of parents to be engaged in school activities and the learning process of their children. We will launch the “Irtiqaa” program, which will measure how effectively schools are engaging parents in their children’s education. We will establish parent-led boards in schools, to open discussion forums and further engage with parents. Teachers will receive training to raise their awareness of the importance of communicating with parents and equip them with effective methods to do so successfully. We will also collaborate with private and non-profit sectors to offer innovative educational programs and events that can improve this academic partnership.”
Lastly, a small group of OIC member states show some signs of progress in terms of performance in international assessments. These include Indonesia, Malaysia, Jordan, Turkey and Kazakhstan. However, in most cases, the progress has not been sustained over time. After an impressive performance in the early rounds of PISA, Jordan has been a steady fall in student test scores. In case of Turkey, after a decade-long positive trend in PISA, there has been a decline though it is largely owing to a fall in the share of top performers; the percentage of students performing below proficiency levels performance of students has remained reasonably stable since 2006. In case of Indonesia and Malaysia, there are signs of recovery in the 2015 round of PISA. It remains to be seen whether this trend will be sustained in the coming years. The next section discuss in details the cases of Jordan and Malaysia.
10 https://www.moe.gov.sa/en/Pages/vision2030.aspx 11 http://sdsegypt2030.com/wp-content/uploads/2016/10/8.-Education-Training-Pillar.pdf

62
3. CASE STUDIES
Methodological Approach To understand better how learning outcomes are related with household poverty and school factors, and how policy can tackle some of the associated problems or leverage the positive links, this section presents four detailed country case studies. The selected countries are Malaysia, Jordan, Pakistan and Nigeria. Each case study includes a (i) description of the education system and a brief account of the policy landscape and current efforts to improve the quality of education (ii) brief account of the current state and trend of learning outcomes, (iii) quantitative analysis of the relationships between learning outcomes and various correlates of student learning, and a qualitative analysis of these relationships as well as stakeholders’ interviews. Secondary data and literature is also reference wherever applicable. Inclusion Criteria The case studies have been chosen to reflect the geographic distribution of OIC countries in the world. Jordan from MENA, Nigeria from Sub-Saharan Africa, Pakistan from South Asia while Malaysia from East Asia. We have selected South Asia over Central Asia because most of the world’s population with less than a primary education is in South Asia which is also home to 3 other Muslim countries – Afghanistan, Bangladesh and Maldives. In addition, the following criteria were considered before selecting the countries:
(i) Access-related patterns (i.e. enrolment and school completion): a large number of
OIC countries are still struggling with out-of-school children or poor retention rate among those already in school. Nigeria and Pakistan belong to this group. However, most middle-income OIC member countries have overcome this problem. Malaysia and Jordan belong to this group.
(ii) Trends in improvements in learning outcomes: In most cases, the level of learning is poor and progress lacking.
(iii) Availability of independent assessment of child-level learning outcomes: In most OIC countries, researchers do not have access to government data on child-level learning outcomes. Jordan and Malaysia have been chosen, however, because they at least have a long history of participation in independent international assessment of learning outcomes.
(iv) Citizen-led initiatives: Education system in OIC countries that do not participate in international assessment also maintain a centralized system of monitoring, assessment and evaluation. Pakistan has been chosen as an exception to this pattern and a rare example of large-scale citizen-driven regular assessment of the performance of all types of schools in the country. First introduced in India by the NGO Pratham, the Annual Status of Education Report (ASER) Pakistan is globally recognized for its evidence-based leadership in the field of basic education in Pakistan.
Additional consideration was given to the fact the OIC countries differ in terms of inequality in access and dependence on private schools. Nigeria and Pakistan were prioritized among income-poor member countries where private schools are have mushroomed. Among middle-income OIC countries, Jordan represents those with a growing share of private schools. Malaysia has also seen a recent rise in private provision.

63
Quantitative Analysis
For each selected country, two sets of quantitative data analysis were undertaken. The first one intends to shed light on the relationships between poverty and learning outcomes in a bi-variate setting. Attention is also paid to the performance of children from specific groups (e.g. rural vs urban; girls vs boys). The second one relates to multivariate models of the determinants of learning outcomes. To highlight the role of income poverty, we additionally present estimates of multivariate models separately for children from economically rich and poor families. For Nigeria and Pakistan, however, trends in access related indicators (e.g. enrolment rates, years of schooling completed) and physical indicators of quality (e.g. class size) are also reviewed. For multivariate models, the variables of interest were selected based on the conceptual and methodological frameworks described in Section 1. The review of the national policy documents and the international academic literature on school effectiveness suggests that student learning in OIC countries is not only low, there is also significant inequality in access to quality education. The former is owing to system-wide factors while the latter arises because of advantages enjoyed by children from high SES families. Therefore the level of student achievement is modelled following the framework of educational production function where student achievement is examined in relation to individual, family, school and institutional factors. In case of Jordan and Malaysia, the selection of explanatory variables is very comparable as data comes from PISA 2012 round. However, as explained in section 1, it is not possible to maintain a fixed set of explanatory variables in all four country case studies for two reasons. First, the data source varies across the four countries. In case of Jordan and Malaysia, detailed analysis is based on publicly available international data sets such as PISA and TIMSS. This corresponds to In case of Nigeria, analysis focuses on children who participated in Early Grade Reading Assessment (EGRA) In case of Pakistan, analysis is based on ASER, the largest household based survey that provides reliable estimates on the schooling status of children aged 3-16 years residing in all rural and few urban districts of Pakistan. Second, the sample in case of Jordan and Malaysia is school based and contains rich set of information on teachers and school facilities. Such information is limited in case of Nigeria and Pakistan. In case of Pakistan, the study makes use of the rich and extensive ASER data available from Pakistan to not only provide some key descriptive statistics on both the access to education by different groups and parts of the country but also the quality of education available to them. The latter are based not just on measures of physical quality indicators (such as availability of toilets or boundary walls) but more nuanced measures such as extent of multi-grade teaching (i.e. more than one class sitting together typically because of a shortage of teachers, rooms etc.) within classrooms and even more importantly on what children actually know as measured by learning outcomes in literacy and numeracy. In addition to descriptive statistics, regression analysis is undertaken to identify key drivers of educational quality as measured by individual learning outcomes in literacy and numeracy. This is achieved using probit models that specify learning as a binary variable (1 if a child is able to achieve a specified learning level as measured using ASER data, 0 otherwise) whilst controlling for a rich set of independent variables. As explained later, ASER data measures children’s’ literacy (Urdu, Pashto, Sindhi depending on region) and numeracy capabilities. Students are coded as being at ‘beginner’ level in numeracy if they cannot identify any three digits from 0 to 9;level ‘0–9’ if they can identify single-digit numbers;‘11–19’ if they can identify double-digit numbers; ‘subtraction’ if they can conduct Grade 2–level subtraction and ‘division’ if they can conduct Grade 3–level division successfully. Similarly, in the literacy test students are coded as being at ‘beginner’ level if they cannot identify any three

64
letters from the alphabet, ‘letter’ level if they can successfully identify letters from the alphabet, ‘word’ level if they can identify words, ‘sentence’ level if they can read a sentence fluently and ‘story’ level if they can successfully read a story. For the purposes of the analysis, we re-coded the achievement level scores to mean: (1) The child was coded at ‘higher’ language level (equals 1) if he or she could read a story (in Urdu, Sindhi or Pashto), and 0 if not; (2) The child was coded at ‘higher’ mathematics level (equals 1) if he or she reported at ‘division’ level, and 0 if not. Probit models were estimated with ‘higher’ levels in language and mathematics as dependent variables and various covariates as independent variables. This is done for data from 2013 and 2016, two rounds with full district coverage and a three year period between them to identify any measurable changes over time. In case of Nigeria, a number of providers cater to educational demand in Nigeria. Alongside non-religious government schools, there are non-religious private schools as well as thousands of Islamic schools or madrasahs. While the latter operates in different forms, the three main types of Islamic schools in Nigeria are Qur’anic, Islamiyya, and Tsangaya. These madrasahs operate at all levels of school education -- kotso (nursery stage), tittibiri (elementary stage), k’olo (middle-level) and, culminates (higher level). Almost four in every five Muslim children attend at least one type madrasah. IQTE (non-formal integrated Qur’anic/Islamiyya and Tsangaya Education) offers a consolidated form of Islamic education. However, data on the quality of this type of madrasah along with comparable information on the performance of government school students is rare. Access to government data on national examination performance is also not publicly accessible. Therefore, the data used comes from USAID’s EGRA-SSME cross-sectional study of grades 2 and 3 students conducted in 4 states of Nigeria -- Jigawa, Kaduna, Kano, and Katsina. Two-grade sample enabled an assessment of any improvement owing to an extra year spent in school. The focus on two languages allowed an assessment of proficiency in the two official languages that are used as the medium of instruction for the basic education curriculum in both formal and non-formal schools. Given the focus on grades 2 and 3, schools which did not have these grades were excluded from the study sample. Data was collected based on a two-stage sampling methodology. In the first stage, 258-Schools stratified by school type were sampled; 31 schools were selected per type in each state, proportional to grade 2 and grade 3 enrollment. In the second, stage, 3,795-Students were selected, stratified by grade and gender where 5 students from each gender in each grade were sampled with equal probability. Stakeholders’ Interviews and Review of Secondary Literature To complement the quantitative analysis, a number of stakeholders’ interviews have been carried out in each country. Stakeholder’s beliefs about the current problems in the educations sector in their country matter because it influence their attitudes toward and support for reform initiatives address these problems. But these beliefs may not be necessarily accurate. Moreover, views of policy stakeholders in centralized system may not be aligned with those directly involved with day to day management of the school. While the exact number of interviews competed varies from country to country, at least 12 stakeholders were successfully interviewed in each case study sample country. The same interview protocol was used in each country, although some questions were reworded to better reflect local realities. In addition, country-specific questions were also included. The interviews were meant to capture the perceived barriers to the delivery of quality education as well as possible policy solutions. Depending on the expertise of the respondent stakeholder, however, discussion also covered additional country-specific issues. In terms of field management, the interviews were face to face in most cases. If the respondent did not speak English, a local

65
interpreter was used. A number of interviews were conducted however online using a pre-defined list of questions. Integration of Quantitative and Qualitative Research Each case study follows the same structure. They start by discussing the country context, structure of the education system, and major reforms. This also includes brief paragraphs explaining the broad nature of the challenges faced by the country’s education sector in the context of the SDGs 4 targets. This is followed by an analysis of the data on levels and trends of learning outcomes before turning to the multivariate analysis of the links between children’s learning outcomes and child, family, school specific factors. Results of the regression analysis are discussed in the light of key findings of the review of secondary literature. This is followed by a discussion of the findings based on the stakeholders’ interviews. Lastly, for all countries, multivariate analysis is performed using data for only one year. In case of Pakistan, however, multiple rounds of ASER data (2010-2016) is also exploited to document trends in education quality as well as regional disparities (e.g. rural-urban and across-province spatial inequality).

66
Jordan
3.1.1. The Educational Landscape of the Country
The primary education system in Jordan comprises of ten years of compulsory education for children aged 5-15 years.1 This is followed by two years of secondary education (for children aged 16-18 years) which is organized in two streams, academic and applied/vocational. Jordan’s education system is one of the most flexible in the MENA region, providing choice between academic and vocational streams. Only those attending applied secondary schools (approximately 6 percent of students) are not provided the option of continuing education at the tertiary level (World Bank, 2008 MENA report). Schools in Jordan are distributed across three regions - the North, the South and the Centre. While most schools are government owned, there is a large presence of non-state sector. Since Islamic education is compulsory in all schools, Jordan does not have madrasahs or state-sponsored schools specializing in Islamic education. Alongside 2787 government schools, there are 1493 private schools.2 According to another estimate, there are 2,254 registered private schools under the private education authority of the Ministry of Education in Jordan (ILO 2013). These accounted for 38 per cent of the total number of schools in Jordan and mostly concentrated in the central region. 90.8 per cent of these are in urban locations.3 While there are national assessments at various stages of the schooling cycle, these are seen as low-stake as promotion is not contingent on performance in these exams. Grade repetition rate is very low given the government policy of automatic grade promotion. Only at the end of the academic secondary cycle (i.e. 12 years of schooling), students appear in Tawjihi, a General Certificate of Secondary Education (GCSE) examination. Students enrolled in the applied stream receive vocational training and apprenticeship and also receives a certificate upon completion. The general secondary stream is managed by the Ministry of Education while the applied secondary education by the Vocational Training corporation. Only basic education is compulsory – both pre-primary education and secondary education are optional. There are important variations in enrolment rates by stream of education and schools types. All children are offered free primary and secondary education in government schools. However, like many other OIC member states, many parents send children to high-fee charging private schools which account for one third of the school going child population in urban areas. According to EMIS data, enrolment share of private schools is highest in early grades (KG1, KG 2 and grade 1).4 But it declines steadily across primary schooling cycle and is the lowest in secondary grades (EMIS-Database, Ministry of Education 2014). Between 2001 and 2011, education spending as a percentage of GDP declined from 4.9% to 3.8%. During the same period, annual government budget as % of GDP also fell (UNICEF 2015). Private providers partly filled this void.5
1 Pre-primary or “Early Childhood Education and Development” (ECED) is also a key segment of the country’s education system. However in this report, our focus is only on primary and secondary education. 2 http://www.kinghussein.gov.jo/resources3.html 3 According to WDI data, 32% and 19% of enrolment at primary and secondary level are in private school. 4 There are also schools that belong to the United Nations Relief and Works Agency [UNRWA] and Ministry of Defence. But the share of these types in the overall enrolment is very small. 5 In addition to privately run schools, many education services have been contracted out to the private sector in Jordan since 2000 for purposes such as development of curricula and pedagogical tools, teacher trainings, and installation of ICT equipment. (World Bank 2008 MENA).

67
The enrollment share also varies within the secondary sector across academic and applied stream. Most students are enrolled under the GCSE stream. Enrolment in the vocational stream is around 10%. Access to basic education is equitable. Investment in basic education has been prioritized in various development plan documents. By policy, the government has closed rural-urban gap in provision by setting up a school in every village/ community with 10 or more school-going children6. However, significant gap exists in the quality of education between rural areas and the cities (UNICEF 2015). In contrast to the primary education, there are significant social disparities in the country’s secondary education sector. A significant portion (approximately one third) of the students drops out after the primary cycle, before completing GCSE. Drop-out rate is higher among children from poor families and girls. Among those who appear on the GCSE test, the majority of the students fail. In Jordan, the universal and free provision of elementary education is guaranteed in the constitution. According to Article 6, the government shall ensure work and education within the limits of its possibilities, and it shall ensure a state of tranquility and equal opportunities to all Jordanians while Article 20 states that elementary education shall be compulsory for Jordanians and free of charge in government schools (WB 2008 MENA). Significant inequality also exists in case of access to pre-primary school education (or ECED). Most pre-schools offering KG1 education and Nursery care are privately owned. Children from higher income families have a much higher chance of receiving early childhood care and education compared to those from low SES families. Consequently, the enrolment rate in KG2, KG1 and nurseries is low (HRD 2016). Therefore, Jordan has experienced contrasting achievements in terms of inequality in the education sector. The gini coefficient of educational attainment (i.e. years of school completed) has declined from 0.68 in 1970 to 0.30 in 2010 (Ibourk & Amaghouss 2012). But this progress has been undermined by inequality in learning outcomes. Peragine, Lagravinese, Palmisano, & Intini (2015) exclusively focus on the question of inequality of opportunity (IoP) for educational achievement in Jordan vis-à-vis four other Arab countries (Tunisia, Qatar; the United Arab Emirates (UAE)) using three rounds of PISA data (2006, 2009 and 2012). Evidence indicates rising relative inequality of opportunity in Jordan (as well as Qatar). When trends in inequality of opportunity is studied over time, Jordan appears to perform the worst -- both IoP in level and relative IoP experience rises between 2006 and 2012 in reading and science scores.7 Using an alternative methodology, Balcazar, Narayan, and Tiwari (2015) support this conclusion. The authors identify parental wealth and education account for the majority (54% in case of Math) of the variation in inequality of learning opportunities (26.4% in case of Reading). In contrast to Peragine, Lagravinese, Palmisano, & Intini (2015), the share of immigration status as a circumstance factor is insignificant. The authors also note significant increase in inequality of opportunity between 2009 and 2012 in all subjects; the increase in the largest in Reading. Moreover, pre-school attendance is once again highlighted as a source of inequality, even when assessed in the context of inequality of opportunity in PISA 2012 data. It accounts for 9.5%, 6% and 6.4% of the inequality in math, reading and science (Balcazar, Narayan, and Tiwari 2015).
6 http://www.kinghussein.gov.jo/resources3.html 7 This finding is based on a set of circumstances composed by the student’s gender, parental education and parental jobs. However, Jordan’s ranking improves once immigration status of children is included as a circumstance variable.

68
3.1.2. Major Education Reforms in Jordan: 1990-2017
Jordan has a long history of education reforms dating back to 1960s. At the time of independence, the first education reform initiative was launched in 1960. The second was introduced in 1970. Furthermore, in 1988, the government launched a ten-year education reform package to improve the quality of education by restructuring the curricula. Greater emphasis was placed on the development of problem solving ability and critical thinking skills. The ten-year education reform package also laid down the institutional foundation for future reforms. A dedicated and autonomous national center - National Center for Education Research (NCERD) -for assessment and education research was established in 1990. This was renamed to National Center for Human Resources Development (NCHRD) which subsequently designed a longitudinal system to monitor learning outcomes of students and assess teaching quality in basic education (Abdul-Hamid, Abu-Lebdeh and Patrinos 2011). The second reform plan spanned the period 1998-2002. In 2000 the government launched education reform for the knowledge economy charting action plans for change in pre-primary to higher education. This shift in education planning had two objectives: (a) to revitalize the learning environment in schools; (b) to transform Jordan into a regional technology hub. The Blueprint for reform was explained in the “Jordan Vision 2020” and the “2002 Vision Forum for the Future of Education”. The national development strategy and the Forum results were consolidated into specific development plans, the Social and Economic Transformation Plan, the General Education Plan 2003-08 (World Bank 2009). One of the earliest of these was the 1988 Education Reform which spurred from the National Conference for Education Reform; the most recent was Education Reform for the Knowledge Economy (ERfKE): phase one in 2003 and phase two in 2009, and due to end in December 20162. Both reforms focused on curriculum, teacher professional development and student learning outcomes, among other priorities. The MoE also identified school readiness as an important area of policy intervention. In 2000, an ECED strategy was also created which was based on five stages: (1) pre-natal phase; (2) post-natal (up to one year); (3) one-four years old; (4) four-six years old; and (5) children in the first three lower primary grades. More recently, in response to the rapidly deteriorating results on national school-leaving examinations and poor performance in international assessments, the government launched an ambitious program. The National Committee for Human Resource Development (HRD) was asked to draft a policy document detaining the national strategy for human resource development 2016-2025. Two key objectives relating to education quality are:
By 2025, ensure that all children have access to quality early childhood learning and development experiences that promote primary school readiness, ensure healthy lives, and promote their future wellbeing.
By 2025, ensure that all children complete equitable and quality primary and secondary education, leading to relevant and effective learning outcomes.
The conceptual framework underlying the national strategy is based on a 5 governing principles: (a) access (ensuring fair equal and opportunities) (b) quality (delivering world class outcomes) (c) accountability (delegating responsibilities and devolved, local decision-making) (d)

69
innovation (a learning system that learns and involves international and public-private partnerships) and (e) Mindset (promoting national values and unity). According to the NHRD report 2016, some of the key challenges adversely affecting the quality of education delivered in Jordanian schools include:
Centralized governance of education service delivery as well as teacher training Inadequate monitoring and evaluation Declining teacher quality, particularly in secondary education Inadequate pre-service and in-service training Outdated teaching methods at all education levels Lack of high quality private schools (including as public-private partnerships (PPPs)) to
complement public provisions Lack of parental involvement in children's learning activities
The report also identifies additional challenges specifically for the basic and secondary schools:
An outdated curriculum and assessment system A high stakes secondary school completion examination (Tawjihi) that the majority of
students fail to clear Teaching not an employment of choice Lack of in-service training for teachers Lack of teacher motivation A lack of accountability and leadership throughout the system (school as well as the Ministry level). A lack of community and family engagement A lack of evidence-based decision making
In light of the above, the strategy sets a number of specific target outcomes for four stakeholders in basic and secondary education -- the government, students, teachers and parents. For the government, these include (a) making education work and life oriented; (b) promoting research and data driven policy making (c) disseminating data to show progress on student performance, teacher quality and other indicators to further drive improvement and (d) achieving regional/global targets in assessments such as TIMSS, PISA, EGRA & EGMA. For students, target outcome includes ensuring equitable access to quality teaching and modern curricula. For teachers, target outcomes include (a) making teaching an employment of choice, (b) creating adequate incentives for teachers to perform and (c) improving the quality of pre- and in-service training for teachers. For parents and the community, target outcomes include (a) increase community engagement to improve school performance and (b) ensuring greater parental involvement to support student learning in and out-of-school hours.8 To achieve these outcomes and support the five governing principles (or strategic objectives) underlying the national strategy, the Committee recommended 22 projects. It was also suggested that progress be assessed using specific key performance indicators (KPI) over a span of 5 to 10 years. Some of these KPIs are: (a) increasing TIMSS Test Science Scores to 489 (5-year
8 The actual list includes 13 outcomes and an additional 3 for employers.

70
target) and 509 (10-year target); Math score to 446 (5-year target) and 466 (10-year target) (b) % of teachers attending over 80 hours of training every year 50% (5-year target) / 75% (10-year target) (c) Percentage of parents reading with their children 60% (5-year target) 70% (10-year target). One notable feature of the HRD strategy is the awareness of the risk of implementation failure. The strategy document is particular about having provisions to ensure management of the deliverables and implementation of the proposed reforms. There is a clear reference to regular monitoring of progress against planned targets as well as evaluating results and updating the plans (based on feedback from the monitoring stage). Three capabilities have been identified as critical to avoid implementation failure: (a) An autonomous and accountable governance structures to drive forward the implementation of the HRD strategy9 (b) bureaucratic capacity through leadership training and recruitment of new talents (c) participatory coordination efforts to be achieved by involving internal and external stakeholders. Not only are critical capabilities identified, as many as nine recommendations have been made to secure these capabilities. The Ministry of Education works closely with NCHRD to develop a feedback loop between researchers studying the education system and policymakers in charge of implementing reforms (Abdul-Hamid, Abu-Lebdeh and Patrinos 2011). Performance in TIMSS and PISA has directly impacted education policy in Jordan. The NHCRD report 2016 has time-bound key performance indicators relating to TIMSS and PISA outcomes (Ababneh, Al-Tweissi and Abulibdeh 2016). In sum, the HRD strategy of the National Committee for Human Resource Development offers a robust Blueprint to implement system-wide reforms in the educations sector. In terms of focus, earlier reform initiatives have emphasized more on supply-side factors. Recent reform measures however have also acknowledged the importance of demand-side strategies such as greater parental involvement and community engagement. Even then, supply-side policies and strategies dominate the reform agenda. These include improving teacher quality, school facilities, periodic revision of the curriculum, teacher training provisions, use of ICT in school, and so on. The MoE is already in a process of devolving responsibilities to local levels. Moreover, there has been significant progress in local capacity the institutions over the past two decades. Successful initiatives to improve student learning through teacher training include the Queen Rania Teachers Academy (QRTA), the Jordan Education Initiative (JEI), the Early Grade Reading and Math Project (RAMP). The Education Management Information System (EMIS) of the Ministry of Education has been a major boost in terms of data-driven monitoring, evaluation and decision making capacity in primary and secondary education. International donors and NGOs have also played a key role in educational development in Jordan. In 2003, a multi-donor funded 10-year program -- Education Reform for the Knowledge Economy Program (ErfKE) – was launched. The second phase of program spanned 2009-2015. Under ErfKE-I, the principal objective was to improve learning environment in schools as well as promote early childhood education. In addition to institutionalizing the reforms introduced
9 This will include, among others, an independent HRD Results and Effectiveness Unit with the full-time delivery capacity of the HRD Reform Board. This will act as a watch-dog on the entire HRD reform and to drive results.

71
under phase 1, ErfKE-II prioritized teacher quality, enhancing the monitoring and evaluation capacity and revising the curriculum to prepare students for a knowledge-based economy. UNESCO Jordan not only developed a UNESCO National Education Support Strategy (UNESS, 2008), it also helped developed the new Education Management Information System (EMIS). Equally UNICEF is working with the government to improve the quality of education in public schools through launching a programme called “Enhancing quality in primary and secondary education”, which focuses on innovative ways to improve the quality of learning opportunities for all students in Jordan. UNICEF also continues to play a key role in assisting the out-of-school child population. In 2011, it launched the Global Out-of-School Children Initiative (OOSCI) and profiled excluded children in Jordan and documented the barriers and bottlenecks related to their exclusion as well as strategies to address the barriers.10 Annother bilateral donor, USAID, has played important role in building local capacity to assess progress in learning outcomes. The agency helped strengthened the technical capacity of NCHRD in monitoring and evaluation, and conducting education policy studies and provide support for program quality evaluations. Notable USAID funded initiative is the four-year (2010-2015) long MEP project. This was part of the Government of Jordan’s Education Reform for Knowledge Economy (ERfKE II) program (Ababneh, Lebdih, and Tweissi, 2014). NGOs such as the Queen Rania Foundation (QRF) and the Queen Rania Teacher Academy (QRTA) actively work with government schools to better train teachers. In October 2016, the QRTA launched a nine-month 24 credit hour diploma -- Pre-service Professional Diploma Program (PPDP). The primary objective is to improve the teachers’ professional standards and enable them to enter into the teaching profession. The first cohort of PPDP program includes 185 teachers, who were selected through a competitive process. Graduating teachers will commit to a teaching job with the Ministry of Education for four years.11
Among most recent reform initiatives, earlier in 2017, the government has launched a new project to improve the quality of education through improved provision of ICT infrastructure. The Ministry of Education launched the project connecting 2764 schools across Jordan with internet services and advanced technologies. The initiative will facilitate implementation of the government projects, such as the online courses developed in partnership with the EDRAAK platform, which includes Tawjihi level courses in Physics, Mathematics, Chemistry and English. EDRAAK is also scheduled to launch an online educational content for all levels by next year, in cooperation with the Ministry of Education (Tabazah, 2017).
3.1.3. Assessment of Learning Outcomes
Jordan has participated in major international assessments of school quality since 1990s. These include the Trends in International Mathematics and Science Studies (TIMSS) as well as the OECD’s the Programme for International Student Assessments (PISA).12 Jordan also participated in the United States Agency for International Development’s (USAID) project on Education Data for Decision Making (EdData II). Jordan is one of the few countries to have participated in both EMGA and EGRA. In contrast to comparable and reliable data on learning outcomes, data on
10 This was based on the” Five Dimensions of Exclusion” framework. 11 https://www.queenrania.jo/en/media/press-releases/queen-rania-participates-workshop-jordan%E2%80%99s-performance-timss-assessment 12 For a discussion and overview of Jordan’s involvement in such assessment exercise, see Ababneh, Al-Tweissi and Abulibdeh (2016).

72
teacher quality is unavailable. Jordan did not participate in the 2008 and 2013 rounds of the Teaching and Learning International Survey (TALIS), the OECD’s survey on the quality of mainstream secondary school teachers and principals. While two of its neighbors, Saudi Arabia and United Arab Emirates, have registered for the next round to be conducted in 2018, Jordan still remains absent from TALIS. In addition to internationally comparable data on learning outcomes, Jordan has a rich EMIS data base which gathers detailed information on performance of schools in national assessments (Ababneh, Imad, Lebdih, and Tweissi, 2014) such as the Tawjihi (i.e. GCSE)13. Since 2000, the government has been also conducting these high-stakes National Test which were upgraded to focus on critical thinking and problem solving skills from 2006 onwards. Under the National Assessment for Knowledge Economy Skills (NAfKE) scheme, new assessment have been designed and conducted since 2008 with a focus on skills needed for the knowledge economy (Abdul-Hamid, Abu-Lebdeh and Patrinos 2011). This specialized national assessment (i.e. NAfKE) was created by NCHRD. The “stakes” of various types of student assessments in Jordan are sharply different from each other. For example, Tawjihii has the highest stake for students, teachers and schools; on the other hand, NafKE, TIMSS and PISA have the lowest stake for the same stakeholders. In sum, the major student assessments are: (1) The National Test (NT), a census-based test organized and administered by the MoE; (2) The National Assessment for the Knowledge Economy (NAfKE) test, a sample-based test organized and administered by National Center for Human Resource Development (NCHRD) created for the purposes of evaluating the ERfKE reform program; (3) The Tawjihii, the compulsory certification test for high school graduation exclusively organized and administered by a special unit in the MoE2; and (4) School Assessments, continuous or ongoing assessment which are carried out by teachers throughout school year but informed by guidelines from the MoE. In this report, we restrict our analysis to TIMSS, PISA and EGRA since we don’t have access to data on student performance in National Test, Tawjihii and NafKE.
3.1.4. Major Trends in Education Statistics
Table 3.1.1 presents data on basic indicators relating to acces to eduacation and qality of physical inputs. School enrolment rate is very high in primary and secondary (97% and 82% respectively) though low at the preprimary level (32%). Student-to-teacher ratio is also favorable, below 20 at all levels of schooling. All teachers are also reportedly trained. Official literacy rate is also close to 100%. Therefore, in terms of the commonly used indicators of access and quality, Jordan’s education system is doing well. However, a different picture emerges when learning outcomes are assessed.
13 This also includes data on physical quality of schools http://www.moe.gov.jo/en/

73
Table 3.1.1: Selected Indicators of Access, Input Quality, Literacy and Expenditure
Source: Author’s compilation based on WDI. All data is for the year 2014 except expenditure (2011) and literacy (2012).
Jordan first participated in an international assessment of student performance as part of the first round of IEAP in 1991. Its performance was poor - Jordan was ranked 18 among 19 countries. Jordan also ranked near the bottom in the second round of IAEP among the 20 participating countries. Almost three out of every four students in mathematics and 67 percent of students in science scored below the international average (Abdul-Hamid, Abu-Lebdeh and Patrinos 2011). The government responded to these results by implementing specific reforms14 so that significant improvements were recorded in TIMSS in 2003, particularly in science. However, in case of mathematics, no significant gain was noted between 1999 and 2007. Private school students underperformed throughout in TIMSS in math and science during 1999-2007 (Abdul-Hamid, Abu-Lebdeh and Patrinos 2011).
In this section, Jordan’s performance in EGRA, TIMSS and PISA is reviewed using more recent data. Figure 3.1.1 presents data on zero scores among grade 2 students (i.e. the proportion unable to read a single word of a grade-level paragraph) in EGRA assessment for Jordan and a sample of other participating countries.
14 These include curriculum revisions, development of new textbooks and review of teacher qualifications and evaluation and so on.
School enrollment, preprimary (% gross) 32.80
School enrollment, primary (% gross) 97.34
School enrollment, secondary (% gross) 82.45
Pupil-teacher ratio, preprimary 17.73
Pupil-teacher ratio, primary 16.91
Pupil-teacher ratio, secondary 14.60
Trained teachers in preprimary education (% of total teachers) 100
Trained teachers in primary education (% of total teachers) 100
Trained teachers in secondary education (% of total teachers) 100
Literacy rate, adult total (% of people ages 15 and above) 97.89
Literacy rate, youth total (% of people ages 15-24) 99.11
Government expenditure per student, primary (% of GDP per capita) 13.39
Government expenditure per student, secondary (% of GDP per capita) 16.47

74
Figure 3.1.1: Percentage of Zero Scores in EGRA: Jordan vs. Other OIC Countries
Source: Authors; adapted from Gove et al (2013). All data corresponds to assessment conducted at the end of grade 2 except Nigeria (middle of grade 3).
A zero score is recorded for those students who are unable to correctly read any words on the first line of a one minute oral reading fluency assessment using a graded reading passage (Gove et al 2013). One out of every five Jordanian children assessed obtained a zero score compared. In case of EGMA, 24 percent of Jordanian students failed to correctly answer items in the subtraction subtask, which consists of 20 single-digit subtraction problems (Gove et al. 2013). Jordan appears to perform well in early grade assessments only when compared to other much poorer OIC countries for which data is available. For instance, the percentage students with zero scores in case of Nigeria, Iraq and Morocco are 78%, 34% and 33% respectively. However, comparison to 2014 round of EGRA suggests some improvement (Figure 3.1.2). The percentage children with zero score dropped from 21 in 2012 to 11 in 2014. Among boys, this declined from 25 (2012) to 16 (2014) while for girls the fall was very sharp, from 17 in 2012 to 7 in 2014. Figure 3.1.2: Percentage of 2 Grade Students Who Could Not Read A Single Word Of Connected Text
Source: Authors, based on RTI/USAID data
0 20 40 60 80 100
Nigeria (Hausa)
Yemen (Arabic)
Iraq (Arabic)
Morocco (Arabic)
Jordan (Arabic)
Senegal (French)
0,00
0,05
0,10
0,15
0,20
0,25
0,30
All Boys Girls
2012 2014

75
EGRA scores for Jordan are not available for a long period of time. So it is not possible to assess trends in early grade student performance. However, such data is available for secondary school age children from international assessments such as TIMSS and PISA (Figure 3.1.3). In the latest TIMSS assessment, Jordan was placed 23 points below its earlier rank in eighth grade standard Science. This was the largest fall among the 39 participating countries. In eighth grade standard mathematics, Jordan also ranked poorly, 8th among the nine participating Arab countries.15 The latest performance is also low by international standards. The top 25% of PISA performers from Jordan ranked below the bottom 25% performed from OECD countries as well as East Asian countries like Singapore. One reason for this could be across country differences in years of schooling completed. For instance, young Singaporeans have 30 percent more schooling than young Jordanians. However, Singapore outperforms Jordan even after adjusted learning scores for such differences (World Bank 2018). Moreover, Jordan’s performance in mathematics also declined in PISA 2015 while science and reading scores showed no significant improvement during 2006-2015.
Figure 3.1.3: Trends in TIMSS And PISA, 1999-2015 (Jordan)
Source: Author based on data obtained from OECD publications
15 http://www.petra.gov.jo/Public_News/Nws_NewsDetails.aspx?lang=2&site_id=+1&NewsID=280561&Type=P
200250300350400450500550600
2006 2009 2012 2015
PISA scores
Mathematics Science Reading
200
300
400
500
600
1999 2003 2007 2011 2015
TIMSS scores
Mathematics Science

76
Figure 3.1.4: Trends in Subject-Specific Competencies in TIMSS and PISA, 1999-2012 (Jordan)
Source: Author using WIDE database
To better understand the nature of learning shortfalls, Figure 3.1.4 presents trends in student performance by levels of proficiency in different subjects instead of the total scores. Only in case of science performance in TIMSS, there is a steady rise in the proportion of children achieving a specific proficiency level between 1999 and 2007. By 2011, however, there was a decline across all proficiency level. In case of PISA, a monotonic decline is visible across all proficiency levels. Figure 3.1.5 presents data on trends in Jordanian students’ performance in basic proficiency (in terms of percentage of children attaining level-1 competency threshold) in Math and Science in TIMSS by family wealth for the period 1999-2011. In mathematics, there is a clear decline in performance across all wealth groups by 2011. This is a matter of concern considering the fact
00,10,20,30,40,50,60,70,80,9
1999 2003 2007 2011
Science scores in TIMSS
slevel1_m slevel2_m
slevel3_m slevel4_m
00,10,20,30,40,50,60,70,80,9
1999 2003 2007 2011
Math scores in TIMSS
mlevel1_m mlevel2_m
mlevel3_m mlevel4_m
00,10,20,30,40,50,60,70,80,9
2006 2009 2012
Math scores in PISA
mlevel1_m mlevel2_m
mlevel3_m mlevel4_m
00,10,20,30,40,50,60,70,80,9
2006 2009 2012
Science scores in PISA
slevel1_m slevel2_m
slevel3_m slevel4_m
00,10,20,30,40,50,60,70,80,9
2006 2009 2012
Reading scores in PISA
rlevel1_m rlevel2_m
rlevel3_m rlevel4_m

77
that performance decline relates to basic proficiency. In 1999, over 80% children from the wealthiest quintile in Jordan attained basic proficiency in math. By 2011, it is less than 80% among the top wealth quintile. The decline is even bigger among the poorest wealth group (by almost 10 percentage points). The across-wealth groups decline in math is even more pronounced in case of attainment of level-2 proficiency (Figure 3.1.6). In terms of level 3 threshold (advanced competency), the sharpest fall in attainment occurred among the top wealth quintile – it dropped from over 6% in 1999 to less than 2% in 2011 (Figure 3.1.7). Figure 3.1.5: Trends in Level-1 Competency in Math and Science in TIMSS by Family Wealth, 1999-2011 (Jordan)
Source: Author, based on WIDE database
0.2
.4.6
.8
1 2 3 4 5 1 2 3 4 5
Country Wealth Index Quintiles, 1999 Country Wealth Index Quintiles, 2011
Maths Science
% o
f ch
ild
ren
pas
sin
g le
vel-
1 t
hre
sho
ld
Graphs by category and year

78
Figure 3.1.6: Trends in Level-2 Competency in Math and Science in TIMSS by Family Wealth, 1999-2011 (Malaysia)
Source: Authors, based on WIDE database
Figure 3.1.7: Trends in Level-3 Competency in Math and Science in TIMSS by Family Wealth, 1999-2011 (Malaysia)
Source: Authors, based on WIDE database
0.2
.4.6
.8
1 2 3 4 5 1 2 3 4 5
Country Wealth Index Quintiles, 1999 Country Wealth Index Quintiles, 2011
Maths Science
% o
f chi
ldre
n pa
ssin
g le
vel-
2 t
hres
hold
Graphs by category and year
0
.02
.04
.06
.08
1 2 3 4 5 1 2 3 4 5
Country Wealth Index Quintiles, 1999 Country Wealth Index Quintiles, 2011
Maths Science
% o
f chi
ldre
n pa
ssin
g le
vel-
3 th
resh
old
Graphs by category and year

79
In case of science performance in TIMSS, the situation is slightly better. Children from the top two quintiles performed well in 1999 as well as in 2011 there is a clear decline in performance across all wealth groups by 2011. As a matter of fact, in 2011, over 80% children from the top two quintiles had attained basic science proficiency. In addition, children from the bottom wealth quintile performed at the same level in 1999 and 2011 in terms of attaining the basic proficiency threshold. These trends also held for intermediate (level 2) proficiency. However, in case of advanced science proficiency, there is an across-wealth groups decline. The biggest fall in attainment occurred among the top wealth quintile, from over 6% in 1999 to less than 4% in 2011 (Figure 3.1.7). In other words, Jordanian children continued to be poorly represented in among advanced achievers in TIMSS regardless of the assessment round and wealth groups. Figure 3.1.8: Trends in Level-1 Competency in Math, Reading and Science in PISA by Family Wealth, 2009-2012 (Jordan)
Source: Authors, based on WIDE database
In case of science performance in PISA, the situation is slightly better. In science and reading, performance is stable across wealth quintiles between 2006 and 2011 in basic proficiency (level 1) (Figure 3.1.8). However, in math, there is a sharp decline in performance among children from the poorest and richest wealth quintiles by 2011. The wealth gap is also the largest in case of math and the smallest in science performance. In higher order competency (level 4), wealth gap used to be very large in science (in 2006) (Figure 3.1.9). However, performance has declined monotonically across all wealth groups in science and reading by 2012, narrowing the wealth gap. Only in case of math, there is a slight improvement among children from top two wealth quintiles in math in PISA 2012 round though this is unlikely to be statistically large.
0.2
.4.6
.81
1 2 3 4 5 1 2 3 4 5
Country Wealth Index Quintiles, 2006 Country Wealth Index Quintiles, 2012
Maths Reading
Science
% o
f ch
ild
ren
pas
sin
g le
vel-
1 t
hre
sho
ld
Graphs by category and year

80
Figure 3.1.9: Trends in Level-4 Competency in Math, Reading and Science in PISA by Family Wealth, 2009-2012 (Jordan)
Source: Authors, based on WIDE database
In sum, Jordan’s performance in international assessment may reflect a system-wide learning crisis. Learning remains low not just in secondary schools and/or higher grades of primary schooling cycle, it appears to be low in the early grades of the basic schooling cycle. As per the USAID sponsored 2012 EMGA test, one in every five children in grade 2 could not read a single word of connected text. However, shortfalls in early learning (performance measured in terms of simple reading or math tasks) is less severe when compared to other OIC countries like Yemen, Iraq, Morocco and Tanzania and other developing countries like India (World Bank 2018).
Review of the Available Evidence There is a small body of academic scholarship on Jordan that has independently evaluated the determinants of student learning using data from national and international assessments. Existing policy documents identify important shortfalls such as lack of trained teachers, student absenteeism, lack of oversight (school inspections focusing on physical infrastructure instead of the quality of teaching and learning practices), insufficient use of technology, and low parental participation in Parent Teacher Associations and engagement with teachers (HRD 2016).
For review purpose, attention is given to the causes of unsatisfactory performance in TIMSS and PISA. Popular explanations for poor student learning outcomes in Jordan include shortfalls in school curricula and teaching techniques and the lack of incentives among student to take
0
.02
.04
.06
.08
.1
1 2 3 4 5 1 2 3 4 5
Country Wealth Index Quintiles, 2006 Country Wealth Index Quintiles, 2012
Maths Reading
Science
% o
f ch
ild
ren
pas
sin
g le
vel-
4 t
hre
sho
ld
Graphs by category and year

81
international exams seriously as these assessments don’t count towards their school diploma.16 During discussion with stakeholders in Amman, many also pointed out that low performance in PISA and TIMSS is because of the low-stake nature of the assessments i.e. students and teachers do not take these assessments seriously. 17 Qualitative evidence based on interviews of various stakeholders (students, teachers and schools) in Jordan also suggests that PISA and TIMSS are viewed as low-stake assessments in Jordan (Ababneh, Imad, Lebdih, and Tweissi 2014). However, the performance of Jordanian student is also unsatisfactory in high-stake examination such as Tawjihi. Therefore evidence based on performance in low-stake assessments such as EGRA, EGMA, TIMSS and PISA should be taken seriously.
Research on school accountability measures (e.g. pedagogical autonomy, school competition, freedom to hire and fire teachers, publicly posting data, and parent involvement in school affairs) does not suggest that autonomy per se leads to better performance. Analysis using PISA data on the performance of 15-year-old Jordanian students in mathematics, science, and reading skills suggest that students in schools with accountability measures do not have higher skills compared to those in school without the measures (Shafiq, 2011). Therefore accountability-based reform does not provide an answer to Jordan’s education challenges.
Neither there is clear evidence in support of the hypothesis that schools are underperforming simply because of a lack of resources. One study used TIMSS 2007 round data to examine the effects of selected classroom factors (e.g. student-centred approach, the shortage of instructional resources and homework) on the science and mathematics performance of Jordanian 8th graders (Sabah and Hammouri 2010). While the shortage of instructional resources negatively affected the mathematics achievement, it was found to have no effect on science test scores.
There is some indication that low performance in secondary education is partly related to over ambitious curriculum for two reasons. First, even when children have failed to acquire foundational skills (e.g. ability to recognize letter sounds and read unfamiliar words) and in grade 2, they are being taught reading comprehension and oral reading (Brombacher, Collins, Cummiskey, Kochetkova, Mulcahy-Dunn, 2012). There is a similar mismatch between the curriculum and student’s ability. In grade 2, the mathematics curriculum assumes knowledge of addition and subtraction involving three- and four-digit numbers while the survey evidence shows that children in grade 2 are struggling to add and subtract with two-digit numbers.
It may be noted that student’s SES does not significantly impact school readiness in Jordan. In terms of foundational cognitive skills, the difference between the wealthiest and the poorest students is not very large in grade 2. However, a significant SES gap opens up by grade 3. Students from the wealthiest families gain much more from an additional year of schooling compared to those from low SES families (Brombacher, Collins, Cummiskey, Kochetkova, Mulcahy-Dunn, 2012).
In other words, reasons for unsatisfactory performance at the secondary school level are likely to be systematic. Learning gaps emerge in the early grades, in foundational skills. A recent evaluation of learning levels in early grades EGRA found that the majority of students lack strength in the foundational (i.e. grade 1 standard) literacy skills (Brombacher, Collins, 16 http://www.petra.gov.jo/Public_News/Nws_NewsDetails.aspx?lang=2&site_id=+1&NewsID=280561&Type=P 17 https://www.queenrania.jo/en/media/press-releases/queen-rania-participates-workshop-jordan%E2%80%99s-performance-timss-assessment

82
Cummiskey, Kochetkova, Mulcahy-Dunn, 2012). The majority of students were found not to have acquired sufficient foundational skills to read fluently with comprehension in Arabic by the end of grade 3. This suggests a weak relationship between the curriculum and student learning outcomes. Similar patterns were noted in EGMA test scores.
In this connection, preschool/kindergarten attendance has been found to be positively associated with strong foundational cognitive skills such as decoding skills and oral reading fluency (Brombacher, Collins, Cummiskey, Kochetkova, Mulcahy-Dunn, 2012). Children from better SES background do better because, among other factors, they have a learning friendly atmosphere at home. For instance, access to reading materials outside of school is found to positively correlate with students’ reading development in Jordan (Brombacher, Collins, Cummiskey, Kochetkova, Mulcahy-Dunn, 2012). Students who attended preschool had EGMA and EGRA scores 10-13 percentile ranks above those who had not (Fink et al 2017). According to one estimate, providing children with 3 years of ECCE in Jordan would increase the average secondary and tertiary educational attainment by 0.7 years. (Fink et al 2017).
Another system-related factor is the student’s health status which has been identified as another channel through which student’s cognitive development is affected in Jordan. In early grade assessment surveys, nearly 3 out of every 10 students reported absent on one or more days during the week prior to the assessment. In the majority of cases, the reason for absence was physical illness (Brombacher, Collins, Cummiskey, Kochetkova, Mulcahy-Dunn, 2012). Data also shows a negative correlation between observed absenteeism rate and student performance (at class level).
Cross-country comparative research on student performance in TIMSS emphasizes cultural factors. One study examines the effects of student-related variables on mathematics achievement using data on 3736 13-year-old Jordanian 8th-graders who participated in the TIMSS (Hammouri 2004). Four attitudinal and motivational variables were reported to have positive and direct effects while two variables had negative effects on mathematics achievement.
Some studies have also focused on the assent of Jordan in international assessments during the 2000s. The country’s performance in education has not always been unsatisfactory. Between 1999 and 2007, no other country participating in TIMSS improved as much in science as did Jordan. A significant proportion at two-thirds of the increase in Jordan’s TIMSS scores over time is unexplained by changes in observed SES characteristics (Abdul-Hamid, Abu-Lebdeh and Patrinos 2011). Instead 16 percent of the total difference was due to the following improvements: (a) higher teacher confidence; (b) higher student self-confidence; and (c) more emphasis on problem-solving in classroom instruction. This suggests that the attention that the government gave to empowering teachers with training and material to focus on tackling problem-solving increased teachers’ confidence and effectiveness. While the student: teacher ratio increased slightly over time, the effectiveness of teachers to handle a large class improved; that is, the system became much more efficient, thus being able to educate more children, and to improve their test scores at the same time. All these contributed to improvement in student performance (Abdul-Hamid, Abu-Lebdeh and Patrinos (2011). The other reasons identified for improved performance include the closure of rural- urban gap in student performance and the doubling of female advantage over a short period of time (Abdul-Hamid, Abu-Lebdeh and Patrinos (2011).

83
Other evidence in support of Jordan’s successful reform agenda during 1999 and 2007 related to in the large size of the returns to total hours teaching. Analysis showed no real difference in the amount of hours devoted to 12 teaching. But there was a significant positive change in the returns to hours teaching. This alone accounted for 16 percent of the improvement in test scores over time. This shows that Jordanian teachers had become more effective at conveying the material in the classroom (Abdul-Hamid, Abu-Lebdeh and Patrinos (2011).
However it is unclear how Jordan’s advantage in TIMSS was lost. If the same level of resources compared to other countries from MENA produced more output (i.e. student test scores) in Jordan during 2000s. Why are teachers in Jordan unable to add more value with the same level of resources as they apparently succeeded in doing in earlier rounds of TIMSS? What explains the decline in value-added of Jordan’s teachers? Clear answer to these questions are absent in the academic and policy literature.
Lastly, evaluation of recently developed school-based pilot intervention programs designed to improve the reading and math skills also generated important insights into what works in improving student learning. The Ministry of Education implemented the National Early Grade Literacy and Numeracy Survey during 2013/2014 school year (Mulcahy-Dunn, Dick, Crouch, and Newton, 2016). As many as 400 teachers in 347 classrooms across 43 schools were studies covering approximately 12,000 students. As part of this, an intervention was designed to provide teachers with structured, and developmentally appropriate daily practice in foundational skills for reading and mathematics. Special training materials were developed for students and teachers. In addition, to provide feedback to teachers on their teaching practices, coaches were trained to visit and observe classrooms. The uniqueness of this study is that a group of schools were not given an intervention and hence serve as a “control population”. Student performance was measured using the EGRA/EGMA assessments. EGRA and EGMA test scores were collected before the intervention for both groups through a baseline survey.
The main findings are as follows. Students from control schools showed no learning gains between 2012 and 2014. In contrast, there were significant gains across intervention schools in a number of aspects: (a) reduction of the proportion of the lowest performers (b) increase in the proportion of the highest performers (c) increase in the proportion of readers (from 13% to 24%) (d) increase in the proportion of mathematicians (from 14% to 24%). The study also identified teacher behavior and actions as the key underlying driver of these positive changes in student performance. Three findings are noteworthy: (i) In 69% of the classes, teachers followed the notes and routines of the intervention with diligently; these were in top-performing classrooms for mathematics performance. (ii) In 80% of the classes, teachers monitored student understanding by asking for further explanations; these were in top-performing classrooms for mathematics (iii) In 84% of the classes, teachers marked all of the work in the student workbooks sessions; these classes were in top performing category for mathematics (Mulcahy-Dunn, Dick, Crouch, and Newton, 2016).
There are two key lessons from the pilot study. First, the provision of direct and frequent in-classroom support to teachers, in the form of in classroom coaching or supervisors visits, is critical. The frequency of visits by a supervisor or coach was found to significantly improve student performance -- 93% of teachers with frequent supervisor visits had top-performing classrooms (Mulcahy-Dunn, Dick, Crouch, and Newton, 2016). Second, in-service teacher training matters for student learning. Teachers who attended more of the available training sessions had a higher proportion of readers and mathematicians in their classes compared to those who attended less training (Mulcahy-Dunn, Dick, Crouch, and Newton, 2016).

84
3.1.5. Regression Analysis of the Determinants of Learning Outcomes
The review of the national policy documents and the international academic literature on school effectiveness suggests that student learning in Jordan is not only low, there is also significant inequality in access to quality education. The former is owing to system-wide factors while the latter arises because of advantages enjoyed by children from high SES families. Therefore in this section, the determinants of student achievement in Jordan are formally analyzed using PISA 2012 data. 18 To disentangle the influence of different types of covariates, multivariate regression analysis is undertaken. The regression model is conceptualized to account for personal, family-specific and institutional factors. The latter encompasses school resources as well as policies. We use PISA data for two reasons. First, it assess student performance in three domains whereas TIMSS is only limited to mathematics and science. Second, TIMSS data set doesn’t have reliable measures of family backgrounds. While this is available for grade 4 students, Jordan doesn’t participate in that version of TIMSS. In contrast, PISA data set includes a wide range of indicators capturing household socio-economic status including household wealth. Table 3.1.2: Determinants of Student Achievement in Math, Reading and Science, PISA 2012
VARIABLES Reading Math Science Household wealth: : 2nd quartile 6.505 3.421 5.715
(3.969) (3.774) (3.841) Household wealth: 3rd quartile 14.72** 12.16** 13.07**
(3.951) (3.673) (3.912) Household wealth: top quartile 9.815* 9.681* 10.73*
(4.417) (4.026) (4.491) Girl 61.47** 9.499+ 30.05**
(5.953) (5.561) (5.671) Age 14.93** 14.07** 17.23**
(4.203) (3.576) (3.906) Attended pre-school 31.60** 25.90** 24.95**
(3.727) (3.027) (3.487) Learning minutes (in language lessons) -0.0102 -0.00632 0.0170
(0.0254) (0.0289) (0.0257) Proportion of certified teachers -0.871 -1.202 -7.227
(7.934) (7.113) (6.201) Parental pressure: low 7.961 6.507 10.51
(8.731) (8.076) (7.512) Parental pressure: absent 8.823 1.256 8.215
(8.882) (8.164) (6.960) Small town 2.701 -2.651 -2.383
(9.030) (8.440) (9.598) Town 10.54 5.542 11.43
(9.966) (9.253) (9.909) City 18.30+ 14.16+ 9.745
(9.400) (8.458) (9.181) Large city 27.21* 26.56* 21.74*
(11.25) (12.43) (10.65)
18 For existing analysis based on older rounds of PISA data for Jordan, see World Bank, (HDNED, 2008) “Using PISA to Understand the Determinants of Learning in the Middle East and North Africa Region,” The World Bank, HDNED.

85
Private school 30.73** 30.17** 29.37**
(7.696) (7.273) (6.525) Teacher shortage -1.704 -1.187 -0.952
(1.522) (1.755) (1.545) STR -1.049* -1.754** -1.225**
(0.502) (0.418) (0.411) School size 0.0111 0.0155 0.0144
(0.00893) (0.0110) (0.01000) Average disciplinary climate in school 31.37** 33.43** 35.24**
(7.847) (8.444) (7.791) Parent’s education: upper secondary 13.44** 11.07** 11.62*
(4.200) (4.091) (4.639) Parent’s education: Tertiary 27.51** 29.19** 32.89**
(4.499) (4.262) (4.644) Constant 87.18 132.7* 79.09
(67.02) (55.68) (63.71)
Note: All regressions control for clustering of standard errors. *, ** and + indicate 1%, 5% and 10% level of significance. Estimation method is ordinary least square regressions allowing for multiple plausible values.
Table 3.1.2 presents ordinary least squares (OLS) estimates of the student achievement function for Malaysia in Reading, Math, and Science in PISA 2012 data where achievement is examined in relation to individual, family and school factors. As explained earlier, our model accounts for multiple plausible values of the dependent variable. Among household-specific factors, family wealth has a modest effect. While the coefficient on third and fourth quartile are significant, the size is small, particularly when compared to the influence of family wealth in student achievement in other OIC countries such as Malaysia or across OIC countries in general. This is regardless of math, reading and science test scores. Equally, children of educated parents perform significantly better compared -- parental education (particularly university educated parents) seem to matter significantly for student achievement.
Second, while there in Malaysia we found no advantage to attending a private school, this is not true for Jordan. Private school attendance is systematically associated with a higher level of test scores across all test subjects. The coefficient size implies nearly 30 points gain in PISA assessment. Equally, the experience of pre-school attendance is significantly associated with higher performance in all PISA subjects. The effect size is comparable to that of private school attendance.
Among individual level factors, one notable finding is the female advantage in science and language and the absence of any gender gap in mathematics in Malaysia. In other words, compared to many other parts of the world where girls lag behind boys in educational achievement, they excel in all domains of learning in Malaysia. However, the girl-boy gap very high not just in Reading, but also Science.
Among school-specific factors, variables such as school size, teacher shortage and proportion of certified teachers are not significantly associated with student performance. STR has a negative and statistically significant influence in case of all test subjects though the coefficient is small in size. Average disciplinary climate in the school is positively and significantly correlated with

86
student achievement19. Parental engagement doesn’t show a significant association with student performance.
Table 3.1.3: Determinants Of Student Achievement In Math, Reading And Science By Family Wealth, PISA 2012
Poor Non-poor VARIABLES Reading Math Science Reading Math Science Household Wealth 12.21** 8.277** 11.07** -5.670+ -3.030 -2.451
(2.888) (2.418) (2.531) (3.138) (2.404) (2.521) Girl 60.24** 11.96* 29.30** 61.93** 7.893 30.63**
(5.946) (5.612) (6.442) (7.055) (6.879) (6.595) Age 21.00** 15.49** 20.18** 9.738+ 12.38* 14.47**
(7.035) (5.172) (5.133) (5.272) (4.835) (5.429) Attended pre-school 26.55** 20.70** 20.93** 35.29** 30.06** 27.80**
(4.817) (4.020) (4.622) (4.880) (4.132) (4.997) Learning minutes (in language lessons)
-0.00563
-0.00640 0.00181 -0.0120
-0.00372 0.0296
(0.0356) (0.0317) (0.0333
) (0.0295
) (0.0353) (0.0313
) Proportion of certified teachers -4.355 -7.137 -11.55 2.980 3.932 -3.576
(9.367) (8.510) (7.648) (8.742) (8.026) (7.045) Parental pressure: low 7.609 7.172 10.19 8.747 6.848 10.96
(8.907) (6.915) (8.328) (9.701) (9.217) (8.113) Parental pressure: absent 12.20 5.853 9.924 6.292 -2.164 7.300
(9.460) (7.160) (7.515) (10.20) (9.942) (8.266) Small town -0.447 -1.789 -0.168 5.587 -3.157 -5.192
(10.15) (8.688) (11.25) (11.42) (10.27) (10.59) Town 9.379 9.423 17.95 11.08 2.266 4.799
(11.82) (10.18) (12.22) (11.57) (10.65) (10.22) City 17.32 16.32+ 11.86 17.30 11.28 5.373
(11.12) (9.184) (10.99) (11.40) (10.68) (10.57) Large city 20.85+ 20.16+ 18.43 30.52* 29.02+ 21.09+
(12.57) (11.11) (11.37) (13.54) (14.86) (12.53) Private school 31.11** 23.19* 26.48** 27.15** 28.87** 27.73**
(10.34) (9.647) (8.299) (9.773) (8.049) (8.071) Teacher shortage -0.347 0.913 1.209 -2.709 -2.731 -2.551
(1.906) (1.988) (1.956) (1.830) (1.905) (1.793) STR -0.688 -1.414* -0.982 -1.294+ -1.672** -1.251*
(0.663) (0.596) (0.627) (0.667) (0.521) (0.518) School size 0.0125 0.0169 0.0169 0.00973 0.0111 0.0111
(0.0134) (0.0120) (0.0129
) (0.0105
) (0.0136) (0.0125
) Average disciplinary climate in school 25.92** 26.30** 32.91** 35.41** 38.57** 37.17**
(7.487) (7.167) (8.202) (10.22) (11.49) (10.09) Parent’s education: upper secondary 13.39** 10.10* 11.20* 11.84 11.47 10.98
(4.713) (4.984) (5.217) (8.126) (7.638) (7.720) Parent’s education: Tertiary 22.96** 24.78** 27.05** 28.49** 31.33** 35.83**
(5.302) (5.027) (5.474) (8.142) (7.718) (7.526) Constant 17.58 124.4 58.87 180.4* 167.0* 131.5
(112.5) (82.50) (83.92) (82.01) (74.97) (85.34) Note: All regressions control for clustering of standard errors. *, ** and + indicate 1%, 5% and 10% level of significance.
19 This is constructed using data on 5 indicators: (a) Students don't listen, (b) Noise and disorder, (c) Wait for quiet (d) Cannot work well and (e) Long time to start.

87
Table 3.1.3 presents the OLS regression estimates separately for sample children from poor (bottom two wealth quartiles) and non-poor (top two wealth quartiles) families. Family wealth enters the achievement function significantly as a correlate of student performance for both groups once again confirming significant inequality in learning outcomes owing to differences in economic conditions at home. However, similar to between wealth groups, within-group wealth gap is modest in Jordan. The magnitude of parental education, particularly tertiary education, also appears to be similar across wealth groups. This implies that there are intergenerational gains from educated parents in the context of children’s education in Jordan regardless of the wealth groups they belong. We also note a similar correlation vis-à-vis pre-primary and private school attendance with student achievement at the secondary level. The coefficients on these two variables are also significant suggesting that access to these schools, particularly by children from lower socio-economic groups can help equalize learning opportunities in Jordan.
The analysis of Jordanian students’ achievements in language, math and science tests in PISA 2012 highlights the importance of early childhood education as well as access to private schools. This is also consistent with the available evidence for Jordan on the returns to early childhood education in terms of higher secondary and tertiary educational attainment as well as early advantage in learning outcomes in primary grades.20
Another encouraging finding is the weak influence of family wealth as a correlate of student achievement though it also highlights the fact that performance is low across and socio-economic groups. If so, the main challenge is to increase learning across the board for everyone. However, our results have also highlighted one demographic group that is falling behind in terms of learning outcomes. Male students underperform very poorly in science regardless of their family background. This implies that their relatively poor performance is not simply a matter of household poverty or financial difficulties.
3.1.6. Stakeholder Perceptions
As many as 15 stakeholders were interviewed in East and West Amman. This included school principals and teachers, teacher trainers and government officials. The majority of the stakeholders interviewed (over 90%) identified school leadership (or effectiveness of the principal) as one of the three most important features of an effective school. This was followed “frequent monitoring”, “a supportive learning environment”, “higher learning outcomes of teachers” and “family and community involvement in the school”. Physical facilities were not perceived as important. Given the acknowledge that school principal is critical to an effective school, respondent stakeholders were asked about the three most important features of an effective school principal,
20 Fink et al (2017).

88
Figure 3.1.10: Important Features of Effective Principal and Teachers
Source: Author’s calculation based on stakeholders survey data.
Given the importance of school leadership, stakeholders were asked to name the three most important features of an effective school principal. For comparison purpose, they were also asked to describe the three most important factors that define an effective school teacher. Figure 3.1.10 reports responses in terms of the proportion of stakeholders identifying a feature as one of the three most important. Data is presented separately for responses relating to principals and teachers. The total does not add up to 1 since we sum across three responses for each y-axis category. More than 60% respondents identified “promoting healthy student-teacher and parent-teacher relationship” as a characteristic of an effective school principal. This is followed by being focused on improving teaching and learning practices, being motivated, having proved leadership experience, promoting learning opportunities within and outside classroom, and being well-qualified.
Turning to characteristics of an effective school teacher, nearly half of the respondents identified the following three characteristics as important for an effective teacher -- being good at engaging with students, being focused on improving teaching and learning practices, and ensuring progress and personal development of students. Other characteristics reported (in order of importance) are: being motivated, promoting learning opportunities, being focused on professional development, being well-qualified, and being supportive of weaker students.
0 0,1 0,2 0,3 0,4 0,5 0,6 0,7
Well qualified/trained
Focused on professional development
Focused on improving teaching & learning…
Motivated
Promotes learning opportunities within/outside…
Robust and rigorous in self-evaluation
Ensures progress and personal development of…
Assesses and tracks pupil progress
Supportive of weaker students & provides extra…
Good at communication
Good at engaging w students, making a session…
Secondary Primary

89
Figure 3.1.11: Main Barriers to Quality Education in Primary and Secondry Education in Jordan
Source: Author’s calculation based on stakeholders survey data.
Participating stakeholders were also asked about their views on the main barriers to quality education at the primary and secodnary level in Jordan (Figure 3.1.11). Once again, the lack of effective school leadership is identified by over half of the stakeholders interviewed as one of the three most important barriers to quality education in primary school. This is followed by, in terms of importance, lack of teacher motivation, lack of good/qualified teachers, imappropriate curricula content, lack of school autonomy, lack of parental involvement and lack of funding, language of instruction and lack of facilities. Turning to the three most important barriers to education secondary education, half of the stakeholders interviewed identified the lack of good teachers. This is followed by pressure of external evaluation, lack of effective leadership, language of instruction, lack of teacher motivation, and inappropriate curricula content. Only one out of five respondents identified lack of facilities and lack of funds as barriers to quality secondary education in Jordan. The perceived lack of importance of facilities and funds is also noted in case of primary schools.
The lack of qualified/good teachers appears to be a shared constraint for delivering quality primary and secondary education in Jordan. A QRF sponsored nationwide survey of government school teachers also identified the lack of formal training among teachers. 28% of the interviewed teachers reported not having received pre-service training while less than half of teachers reported receiving in-service training in the last two years (Qarout, Pylvainen, Dahdah, and Palmer, 2015).
Given these responses, stakehodlers were asked to identify three factors that they considred as most important for improving education quality in Jordan. The most popular response was teacher development programs and improve school culture learning organization. The emphasis on teacher development is consistent with the fact that most stakeholders were worried about the lack of good/qualified teachers in Jordan. The other factors reported, in order of frequency, are the development of communication skills among students, promoting student-centred
0 0,1 0,2 0,3 0,4 0,5 0,6
Lack of effective school leadership
Lack of school autonomy
Lack of funds
Pressure of external evaluation
Lack of facilities
Lack of teacher motivation
Lack of good teachers
Language of instruction
Inappropriate curriculum/book content
Lack of parental involvement
Other
Secondary Primary

90
learning, mentoring program for school teachers, decentralized school management, continous professional development of teachers, access to after school-hours tuition, parental involvement in school, more in-service training provision and improved physical facilities in school. Greater provision of ICT facilities, greater provision of Islamic schools, affordable private schools were not perceived as an important to improving educaiton quality in Jordan.
Figure 3.1.12: Main Priorities for Investment to Improve Quality of Primary and Secondary Education in Jordan
Source: Author’s calculation based on stakeholders survey data.
The majority of the respondents perceived government schools to be inadequately funded, both at primary and secondary level. In order to ascertain education reform-related priorities and preferences of the stakeholders, they were asked to comment on a hypothetical situation where extra funding could be made available to improve the quality of education. Respondents were then requested to identify three priority areas where this extra funding could be allocated, separately for primary and secondary education. Figure 3.1.12 summarizes the responses. At the primary level, the two most frequently mentioned priority areas are leadership training program for head teachers and increasing teacher salary. This is followed by more spending on school building, better guidance and counselling service, ICT facilities for rural schools, develop new teaching and learning materials, additional funding for low-performing schools, development of soft skills, free provision of after school tuition, building more classrooms, placement of teachers to high-performing schools, more in-service training provision and hiring more teachers to reduce class size and build more schools. The provision of scholarship was not viewed as relevant to improving education quality in the primary sector if extra funding became available.
0 0,1 0,2 0,3 0,4 0,5 0,6
More scholarship for poor children
More spending on school building
ICT facilities for rural school
Additional funding for low-performing/rural…
Develop new teaching/learning materials
Free provision of learning materials
Free provision of after-school extra tuition
Increase teacher salary
Hire more teachers to reduce class size
Hire more female teachers
Improve guidance and counseling service
Build more schools
Build more classroom
More in-service provision
Placement of teachers to overseas/high-…
Student centered learning
Soft skills
Leadership training program for head teachers
Other
Secondary Primary

91
A QRF sponsored nationwide survey of government school teachers also identified the lack of formal training among teachers. 28% of the interviewed teachers reported not having received pre-service training while less than half of teachers reported receiving in-service training in the last two years (Qarout, Pylvainen, Dahdah, and Palmer, 2015).Turning to secondary education, the most frequently stated priority area for investment is leadership training programs for head teachers. This is followed by more spending on develop new teaching and learning materials, student centered-learning, development of soft skills, more in-service (training) provision, ICT facilities for rural schools, hire more teachers, build more schools, additional funding for low-performing schools, placement of teachers in high performing schools, spending on school building, hire more female teachers, increase teacher salary, building more classrooms and free provision of after school tuition. The provision of scholarship for poor children was not viewed as relevant to improving education quality in the secondary sector.
Lastly, the majority of the stakeholders interviewed said that Jordan could learn or adopt teaching and learning practices from other countries that have been successful in the field of education. When asked to name the country, as many as four countries were identified as potential country role models though Finland and Singapore dominated the list as the most popular choice.
In sum, motivation has been identified as a key factor defining an effective principal and effective school teacher by the stakeholders. Yet most respondents stressed that there is a lack of good as well as motivated teachers in Jordan, particularly in primary schools. This is also consistent with independent survey of teachers. Only two out of every five teachers (37%) interviewed as part of the QRF sponsored nationwide survey of government school teachers said that the teaching was their passion. In other words, most were in teaching because of other reasons such lack of non-teaching alternatives, academic circumstances, and suitability of the profession for women (Qarout, Pylvainen, Dahdah, and Palmer, 2015). From the discussion with stakeholders, it was unclear what could be done to improve teacher motivation. In case of primary school teachers, increasing the salary was considered as an important intervention area though all stakeholders mentioned leadership training programs for head teacher as the priority area if further funding became available to improve school quality. During in-depth interviews, stakeholders emphasized the importance of effective principals to motivate individual school teachers. One interesting observation relates to the lack of perceived importance of the greater provision of private schools to improve education quality in Jordan. This is in spite of the fact that major government policy documents recommend increased private sector participation in the delivery of quality education in Jordan. Equally the Jordan government has invested heavily in ICT in the education sector with no visible impact on learning outcomes. Yet a large proportion of stakeholders identified greater provision of ICT as important area for further investment. Lastly, an important barrier highlighted by stakeholders in delivering quality secondary education is the pressure of external evaluation. In Jordan, both teachers and students are focused on obtaining higher grades in in high-stakes secondary school exit exams, Tawjihi, as it is a key performance indicator for both groups. An unintended consequence of high external pressure on students and school authorities to deliver higher Tawjihi pass rates has led to examination-oriented learning. Cheating on examinations is a rampant in the Tawjihi. Students achieve this by relying on an elaborate networks using advanced technology and colluding with adult authorities (Buckner and Hodges 2016).

92
3.1.7. Conclusion
Jordan’s experience highlights the importance of continued participation in international assessments and using the evidence for diagnostics purpose as well as to guide education reforms to improve the quality of the education systems. The challenge of low level of student learning and growing inequality in access to quality education is not unique to Jordan. Despite significant efforts in past two decades to ensure free universal education, learning level is low and opportunities are unequally distributed. However, these patterns also characterize the education systems in most MENA countries. Other countries in the region also face a learning crisis and rising inequality in education quality despite large-scale improvements in access to education (Chapman & Miric, 2009). Similarly, inequality of opportunities has either remained unchanged or has worsened in recent years in MENA countries (Salehi-Isfahani, Hassine, & Assaad (2014). Alongside progressive educational reforms, better design of poverty policies can be critical in eliminating the sources of such inequalities in learning outcomes.
3.1.8. Recommendations
Below are some recommendations that can help achieve the goal of inclusive quality education.
First, shortfalls in learning occur early. Therefore it is critical to intervene in early grades to improve performance in later stages of schooling (e.g. among 15 years old in PISA). Regular assessment of foundational skills in the early grades is equally important. At the same time, pre-school attendance rate is low in Jordan. Increasing the access to quality ECDC/pre-primary schooling is critical.
Second, provide better support to teachers through in-classroom coaching and/or regular supervisor visits, training capacity in key instructional and teacher feedback methods need to be enhanced. In addition, better provision for in-service teacher training is needed to be increased as it helps teachers improve their instructional approach.
Third, the high failure rate in Tawjihii reflects a huge inefficiency in the education system. Twelve years of school education does not produce enough graduates who have enough cognitive skills to move to the next level in the education cycle. This is also confirmed by the declining performance of Jordanian students in TIMSS and PISA. However, the high-stake nature of the test creates numerous challenges for students and teachers. Therefore alternative options should be explored to ease the associated social and psychological pressure.
Fourth, given the high stake associated with Tawjihii/GCSE, the assessment focus should move away from traditional content, the ability to apply routine procedures and the ability to memorize. Focus should be on problem solving, critical thinking and communication abilities.
Fifth, a data dissemination policy may be formulated to facilitate greater access to raw (student) assessment data. At present, such data is not shared openly by the MoE or NCHRD (Ababneh, Imad, Lebdih, and Tweissi 2014); only TIMSS and PISA data are available (directly downloadable from TIMSS or PISA websites). Advanced countries make raw education data available for secondary data analysis to bonafide researchers. Limited data sharing undermines secondary analysis of student assessment results as well as education quality and harm local (education related) research capacity in the long-term.
Sixth, there must be feedback loops between the research, curriculum and professional development as part of a comprehensive reform. Equally, monitoring of implementation and results must be continuous and meaningful.

93
MALAYSIA
3.2.1. The Educational Landscape of the Country
Formal education in Malaysia is based on a 6-3-2-2-4 organization: six years of primary (Standard 1-6), three years of lower secondary school (Form 1-3), and two years of secondary (Form 4-5), two years of upper secondary (Form 6 Lower and 6 Upper) and 4 years of university education. Compulsory education in Malaysia is for the six years of primary education. The admission to primary education is at the age of seven. The types of schools vary across sectors. Pre-primary education is offered by both the public and the private sectors. Government preschools are provided free or at a minimal fee with limited places. Private preschools provide the majority of seats and play an important role in increasing access to education for students nationwide. There are also other agencies that provide preschool services. The Ministry targets to achieve universal enrolment in preschool for children aged 4+ and 5+ by 2020. In 2016, the preschool enrolment reached 85.6%, a slight improvement of 1% from 2015 (MOE 2016).21 At the primary level, there are two main types of schools: National Schools and National Type Schools. The medium of instruction in National Schools is the Malay Language whereas National Type Schools have been using Tamil and Chinese as a medium of instruction. While Malay is the national language of Malaysia, the use of Chinese and Tamil reflects the presence of three distinct racial and ethnic groups, Malays, Chinese and Indians (Joseph, 2008).22
At the primary level, in 2016, there were 5877 national schools, 1297 National Type Chinese schools, 524 National Type Tamil schools, 28 Special Education schools, 7 special model schools (K9) and 36 Government Aided Religious schools (MoE 2016). In other words, the majority of the primary schools are national primary schools (76.65%). Compared to pre-primary stage where private sector accounts for 32% of all schools, private schools have a very small presence at the primary level – only 126 (MOE 2016).23 At the secondary level, there are 2404 schools in total of which 82.53% are regular schools (2.87% are fully residential 2.37% are religious and 7.53% government aided religious schools and 3.33% vocational colleges. The rest comprise of technical, special education, special model, sports Bimbingan Jalinan Kasih and arts schools (MOE 2016). 24 In terms of enrolment share, about 75.95 percent students are in National schools, 20 percent in National Type Chinese schools, 3.1 percent in National Type Tamil Schools, 0.6 percent government aided religious schools and 0.35 percent is other schools (MOE, 2016). In terms of the enrolment at secondary level by types of schools, majority of the students are enrolled in regular schools.
Since Malaysia is a federally administered country, the federal government has the most legislative and executive powers. The entire education system is highly centralized and under the jurisdiction of the Ministry of Education which is in charge of overseeing and regulating the curriculum, controlling national examinations and supervising the development of education. There are special agencies of the Ministry of Education that are responsible to oversee the curriculum and assessment. The National Curriculum development center designs the national curriculum. The Examination syndicate (Lembaga Peperiksaan) prepares and administers the
21 The number of newly opened public pre-primary classes was 125 while the number of private pre-primary classes rose by 2,240 classes (MOE, 2016) 22 Regardless of ethnic orientation, all schools follow national curriculum and prepare students for national examinations in grades 6, 9 and 11. 23 Islamic school (Sekolah Pondok) are relatively fewer in numbers in Malaysia, registered and unregistered combined. 24 Private schools account for 5% of the secondary schools.

94
national examination at the school level. The Malaysian Examination Council prepares and administers (Majlis Peperiksaan) for the Malaysian Higher School certificate (Sijil Tinggi Pelajaran Malaysia) examination, as well as the Malaysian Universities English Test, taken at the end of form 6 for entry to university. Standard textbooks are used throughout National schools in Malaysia the preparation of which is coordinated by the Textbook bureau. The standardized curriculum, examinations and textbooks points to a highly centralized education system. The state and district education offices merely adhere to and implement policies of the federal government. Federal government also remains the key source of funding for schools. In 2016, actual educational expenditure accounted for 15.48% of the total federal expenditure. Generally, schools are funded using per capita grants based on number of students enrolled in the school (Marzuki, 2005a, 2005b).
3.2.2. Major Education Reforms and Policies
The education system in Malaysia has evolved in response to recommendations made by various education commissions. Following the recommendation of the Razak Report 1956 and the Education Ordinance 1957 emphasizing the formulation of a national education system, Malay was declared the primary medium of instruction along with the introduction of a common system of examination. Following the Rahman Talib Report and Education Act 1961, two streams were introduced at the upper secondary education level - academic and vocational. The 1979 Cabinet report recommended greater focus on reading, writing and arithmetic skills and policies as emphasized in the Rahman Talib report. The Education Bill 1995 focused on the national education system to deliver world-class education to achieve national aspirations. In 2003, an important policy shift was the change of the medium of instruction for mathematics and science curriculum from Malay to English language. However, the sudden implementation of the policy ‘Teaching and Learning of Science and Mathematics in English’ (PPSMI), without accounting for the competency level of teachers and students, created major challenges. There was resistance from parents and students, particularly from rural communities. In 2009, another new policy -- ‘Upholding the Malay Language and Strengthening Command of English’ (Memartabatkan Bahasa Malaysia Memperkukuh Bahasa Inggeris)25 -- was introduced for Year 1 to Form 5 students, replacing PPSMI by the Malaysian Cabinet in July 2009. This MBMMBI policy has been implemented in phases since 2010. The change from PPSMI to MBMMBI is expected to produce Malaysians who are fluent and assertive in both Malay (BM) and English languages.
Once again, this has created much schism. In the face of serious opposition from upper middle class parents, the government introduced a pilot scheme, the “Dual Language Programme” (DLP), under the government initiative ‘Empower Bahasa Malaysia and Strengthen English’. The DLP programme has been introduced at selected Malaysian primary and secondary schools beginning 2016, involving 300 schools. The purpose of the DLP initiative is to give students the opportunity to use either English or Malay in Science, Mathematics, Information Technology and Communication, and Design and Technology.
Education reforms in Malaysia gathered momentum in the last three five-year plan periods. The ninth Malaysia plan also saw the launch of the National Education Blueprint (2006-2010). Reforms introduced included initiatives to decentralize the education service delivery (e.g. the establishment of cluster schools, high performing schools, and trust schools). However, it remains contested to what extent these measures decentralized the education system. For
25 Also known as MBMMBI

95
instance, the cluster schools still suffer from limited autonomy in terms of human resource management such as teacher recruitment (Malakolunthu & Shamsudin 2011). Even though these schools are given additional allocations, the amount spent is based on guidelines laid out by the Ministry of Education.
In conjunction with the preparation of the 10th Malaysia Plan, Malaysia further introduced the Government Transformation Programme (GTP) in 2010 in order to achieve the Vision 2020. As part of this, four “National Key Results Areas” (NKRA) for the education sector were identified: (1) preschool, (2) educational literacy and numeracy, (3) high performance schools (curriculum and co-curriculum activities), and (4) new deals for principals and headmasters. NKRA also emphasized on the quality of English language teachers. The GTP was determined to ensure competency in the basic literacy and numeracy skills in Malay language (Bahasa Malaysia) among children in early grades by 2012. The literacy and Numeracy (LINUS) programme was launched to ensure that students master the skills in Malay language at grade three of their primary schooling. The Linus programme focused on early intervention (Years 1 through 3) for literacy and numeracy programs. In 2012, the national curriculum was also revamped and the standard curriculum for primary schools (KSSR) and standard curriculum for secondary schools (KSSM) were introduced. Under KSSR and KSSM, students are evaluated individually. Each student is given a “Band” on their performance evaluation at the end of the year, ranging from one to six, where band six is awarded to excellent students who are articulate in creative, critical and intellectual aspects and possessed good values. The other subjects such as civics, moral, physical education, and art are evaluated as per the School Based Assessment System.
The government built on the National Education Blueprint (2006-2010) by launching the Malaysian Education Blueprint (2013-2025) in 2013. The focus is on providing equal access to quality education of an international standard. Other key focus areas include (a) ensuring that every child is proficient in Bahasa Malaysia and English language, (b) develop values-driven Malaysians; transforming teaching into the profession of choice, (c) ensure high-performing school leaders in every school, (d) empowere schools to customize solutions based on need, (e) leverage ICT to scale up quality learning, (f) transform ministry and delivery capabilities and capacity, (g) partner with parents, community and private sector at scale, and (h) increase transparency for direct public accountability. One of the key policy shifts in the Education Blueprint 2013-2025 is to encourage higher order thinking skills among students and reduce focus on rote-learning (MOE, 2013). To this end, since 2014, Form 3 students are being assessed using the school based assessment system (PT3). This helped reduce emphasis on centralized examination and reduce pressure of external evaluation. It also gives more power to schools to choose examination contents and the grading process.
In the recently launched Eleventh Malaysia Plan 2016-2020, the emphasis on inclusive quality education has been retained and envisioned through a range of measures. These include better quality early childhood care and education (ECCE), professional development of teachers and school leaders, the provision of different schooling models to meet the needs of specific student groups, enhancing governance and stakeholder partnerships for better school support by empowering State Education office and District Education office to provide more instructional support to schools, and engaging the community and private sector as partners in the education transformation journey.
Progressing into Wave 2 of the Blueprint in 2016, the Ministry increased its efforts to improve accessibility to quality education through various initiatives, which included:

96
Enhancing Teachers’ Capabilities Incorporating Higher Order Thinking Skills (HOTS); Promoting Science, Technology, Engineering and Mathematics (STEM) education Improving literacy and language proficiency Strengthening teacher quality Enhancing school leadership quality Expanding parent and community involvement Encouraging private sector involvement Some of these initiatives are briefly described below. LINUS: Following the successful implementation of LINUS1.0 (2010-2012), which consisted of BM (literacy) and Mathematics (numeracy), LINUS2.0 was introduced in 2013 as an expansion of the existing programme to eradicate English language literacy problems among Level 1 primary school students. This move is part of the key feature for Shift 2 in the Blueprint which seeks to ensure that every child is proficient in both languages. LINUS2.0 has been added English language literacy as one of the components. The Ministry’s aspires that through the LINUS Programme, students will make a smooth transition to Year 4 with a firm grounding in basic literacy and numeracy skills. Besides that, teaching and learning LINUS2.0 modules were developed and distributed to all primary schools across the nation. For students who did not meet the required level of basic literacy and numeracy after being screened, teaching and learning aids for remedial instruction were prepared to help them improved. Enhancing Teachers’ Capabilities: The success of LINUS depended on the teachers’ capability to facilitate learning and acquisition of basic literacy and numeracy among students who just entered formal schooling. Therefore various trainings were targeted towards different groups of primary school teachers. This included Year 2 English language teachers, remedial teachers, FasiLINUS and State Education office (Jabatan Pendidikan Negeri, JPN) officers, remedial pedagogy for Year 4 English language teachers in hotspot schools, training of lecturers in 27 Institute of Teacher Education (IPGK) for familiarisation of LINUS2.0 Programme. The English Language Up-skilling Programme in School (Program Peningkatan Kemahiran Bahasa Inggeris di Sekolah, PPKBIS): It is an English language improvement scheme aimed at language teachers. Initiated in 2014, the programme is targeted at 1,191 ‘hotspot’ schools which under-performed in the 2013 SPM English Language paper. PPKBIS ensures that interventions are conducted in all hotspot schools through the School Improvement Specialist Coaches+ (SISC+) while a select group of hotspot schools are given direct interventions by ELTC lecturers through the School Support Plan. Because of the intensive intervention of PPKBIS, the average SPM English Language pass rate of hotspot schools increased from 65.0% in 2015 to 69.2% in 2016. The increase in performance directly contributed to the increase of the national average passing rate from 76.3% in 2015 to 79.4% in 2016. Higher Order Thinking Skills (HOTS): One of the factors contributing to Malaysia’s improved performance in PISA 2015 was the introduction of HOTS across the curriculum. The percentage of Mathematics and Science items for TIMSS assessment covered in the current Standard Curriculum for Primary School (Kurikulum Standard Sekolah Rendah, KSSR) were at 95.8% and 36%, respectively. A total of 270 lecturers from the Institutes of Teacher Education (Institut Pendidikan Guru, IPG) were trained to use the HOTS training modules to better impart the knowledge and increase the readiness of trainee teachers once deployed to schools. To better
97
assist teachers in activities related to Mathematics, Science and Reading Literacies for TIMSS and PISA in schools, 260 Master Coaches were trained. The percentage of HOTS questions included in 2016 UPSR and SPM remained at 20%. Questions on HOTS were incorporated into Form 3 Assessment (Pentaksiran Tingkatan 3, PT3) to assess student academic performance at the lower secondary level. School leadership: As preparation for leadership positions, the National Professional Qualification for Educational Leaders (NPQEL) was introduced to provide aspiring leaders with the necessary leadership quality and skills to lead schools. The NPQEL is recognised by the central agency as a certified training programme and is a prerequisite for school leadership appointment. In 2015, 1,371 candidates were trained. The availability of a pool of certified candidates has enabled the Ministry to successfully fill 99.1% of the vacant head teacher positions with qualified leaders at a faster rate. Average placement time has declined from 88.1 to 9.5 days. The Ministry has also provided various support programmes for head teachers to raise their leadership capabilities. These included mentorship programmes for newly appointed head teachers, coaching and mentoring by School Improvement Partners (SIPartners+) and CPD for underperforming school leaders by Institute Aminuddin Baki (IAB). Expanding Parents and Community Involvement: In 2013, the Ministry of Education piloted Sarana Sekolah (School Engagement Toolkit) to guide schools in promoting parental and community involvement in education. The main goal of the Sarana Sekolah was to enhance the cooperation between the school and the various stakeholders. To encourage parents and community participation, Sarana Ibu Bapa (Parent Engagement Toolkit) was introduced with the aim of providing methods for parents to be directly involved in schools. To facilitate the effective use of these toolkits, the Ministry trained a total of 130,098 teachers and school leaders nationwide in 2015. Encouraging Private Sector Involvement: The government acknowledges Public-Private Partnership (PPP) which allows for greater opportunities and possibilities in supporting schools to accelerate student performance. PPP in the education sector covers three work streams: One off Programme, School Adoption Programme and Trust School Programme. Educational Access among Ethnic Groups: The Orang Asli and the indigenous community in Malaysia comprise of diverse ethnic groups with unique culture and languages. They are also spread out across provinces though mostly concentrate in remote areas. These minority groups face higher risk of dropping out of school. The attrition rate among Orang Asli students remained significantly higher than the national average (MOE, 2016). At present, there are 98 primary schools catering to Orang Asli students. Comprehensive Special Model School (K9) was established to provide nine years of schooling until lower secondary level with the aim to curb the dropout rate among Orang Asli students after primary education. Qualified Orang Asli students are also accepted into the Bachelor in Education programme (Program Ijazah Sarjana Muda Perguruan, PISMP) to ensure a healthy pipeline of teachers who understands the local context and can serve the Orang Asli and indigenous communities’ best interest. Special considerations are given to the Orang Asli and indigenous students who aspire to enter the teaching profession. Educational Access for B40 Communities: Across all ethnicities, children from the bottom 40% household income group (B40) lag behind in terms of educational achievement. Various initiatives were implemented to address the influence of poverty and socio-economic

98
imbalances and the educational needs of children in B40 households such as the implementation of 1Asrama and Asrama Desa (residential school) programmes, which reduced student dropout from 47,260 in 2010 to 43,428 in 2013. In addition, as of 2014, over a million students benefited from financial aid including Kumpulan Wang Amanah Pelajar Miskin financial assistance for (KWAPM) and Rancangan Makanan Tambahan (supplementary food plan). According to 11th Malaysia Plan (2016-2020) (EPU, 2016), appropriate facilities such as hostel, transport and financial aid will continue to be provided to students in rural and remote areas to enable them to complete primary and secondary education. Special attention will also be given to address the needs of children from identified segment of disadvantaged groups, including children from Malay households in traditional villages, poor Indians from dislocated estates and urban areas and Chinese from new villages. Special awareness programmes on the importance of education will be conducted for school children and their parents to inspire a mind-set change. In addition, after school hours facilities in schools will be provided to prevent students from undesirable social activities and to allow them to interact in a safe and comfortable environment, especially for B40 in urban areas.
3.2.3. Assessment of learning outcomes
In Malaysia, the Ministry of Education conducts annual assessments on the quality of private preschool via the National Preschool Quality Standard. At each stage of the educational system, there are centralized national examinations. After 6 years of primary education, students take UPSR examinations (Primary School Achievement Test). All children who have completed primary school are eligible to continue to three years of lower secondary education. At the end of lower secondary education (Form 3), there is school based examination, the PT3 (the Assessment Test for form three). After completing Form 4 and 5, students have to pass the SPM examinations (the Malaysian Certificate of Education) in order to continue their studies in Form 6 or matriculation centers. At the end of two years of upper secondary, the students have to sit for the STPM examinations (The Malaysian Higher School Certificate). On the other hand, the matriculation program has its own examinations to meet the admission requirements to universities. Data on national assessment (e.g. UPSR, SPM, STPM) are, however, not available to researchers. Moreover, there are concerns about the reliability of the national assessment data as a measure of competencies achieved. However, Malaysia does participate in TIMSS and PISA which are more comprehensive because they assess student performance in multiple domains and across various levels of learning difficulties.
3.2.4. Major Trends in Education Statistics
Malaysia has done well in bringing children from all races into school. Enrolment for preschool increased from 81.7 percent in 2013 to 85.4 percent in 2016 (Figure 3.2.1). Primary school enrolment increased from 94.4 percent in 2013 to 97.2 percent in 2016 while the enrollment for lower secondary schools increased from 93.5 percent in 2013 to 95 percent in 2016. The transition rates from standard 6 to form 1, Form 3 to form 4, Form 5 to form 6 also increased over the years. This rapid educational expansion has been supported by sustained public expenditures on education - as a share of GDP, it has been increasing from 1995 to 2011 but it has been decreasing slightly from 5.7 percent to 5 percent (Appendix Figure 1). Pro-poor programs, particularly those targeting children from B40 income group also contributed to the increase in enrolment. 26 The transition rate among Orang Asli students from primary to
26 According to the Malaysia Millennium Development Goals (MDGs) 2010 Report, over 90% of those within lower secondary age and 75% within upper secondary school age and not in school are from the B40 households.

99
secondary level also showed a significant improvement from 79% in 2015 to 83% in 2016 (Appendix Figure 3). However, compared to primary and lower secondary, enrolment rate showed a limited improvement at the upper secondary level (Form 4 and Form 5). The difference in enrolment rates across levels of education is a cause for concern. Dropout rates are significant among Bumiputera in Sabah and Bumiputera in Sarawak in the transition from primary to secondary levels and from lower secondary to upper secondary.27 Figure 3.2.1: School Enrollment by Levels of Education, 1984-2016
Source: Annual Report 2016, Malaysia Education Blueprint 2013-2025, MOE; Malaysian Educational Statistics, MOE 2014; 2015; 2016; Ahmad, H. (2012)
27 Particularly challenged are children from groups such as the hard-core poor, indigenous population, refugees and asylum seekers, children without proper documentations and children in geographically remote areas in Sabah and Sarawak (Samuel, Tee & Symaco, 2017). Refugees and asylum seekers, For instance, are currently not permitted to attend national schools. However, there are learning centers run by non-governmental organizations or faith-based groups outside the formal education.
40
50
60
70
80
90
100
1984 1985 1986 1987 1988 2013 2014 2015 2016
En
roll
men
t (%
)
Preschool Primary Lower Secondary Upper Secondary

100
Figure 3.2.2: Pupil Teacher Ratio by School Type, 2010-2016
Source: Malaysian Educational Statistics, MOE 2014; 2015; 2016 The high level of public spending helped reduce pupil-teacher ratio during 2010-2016 (Figure 3.2.2). The average class size for secondary schools reduced from 33.6 in 1990 to 26.45 in the year 2016, while student-teacher ratio for secondary schools fell from 18.9 to 11.97 (Ahmad, 2012; MOE, [Malaysian Educational Statistics], 2016). New schools and classrooms were built under the National Development Plans during 1996-2010. Efforts have been also made to increase teacher quality. The Ministry of Education set a target that all teachers in secondary schools should possess a bachelor’s degree by 2010. The entry bar for teachers has been raised to among the best 30 percent of the graduates. In terms of teacher qualifications, this led to a noticeable increase in the number of teachers with degree (36.4 percent in 1990 to 97 percent in 2016) (Ahmad, 2012, MOE [Malaysian Educational statistics], 2016) (Figure 3.2.3). Figure 3.2.3: Percentage of Graduate Teachers by Secondary Schools Type, 2014-2016
Source: Malaysian Educational Statistics, MOE 2014; 2015; 2016
In contrast to the progress in school enrolment, and some improvement in teacher qualifications, Malaysia’s record is mixed when it comes to student achievement and learning
11
11,5
12
12,5
13
13,5
14
2010 2011 2012 2013 2014 2015 2016
Pu
pil
Tea
cher
Rat
io (
%)
Primary Secondary
40
50
60
70
80
90
100
2014 2015 2016
Gra
du
ate
Tea
cher
s (%
)
Primary Schools Secondary Schools

101
outcomes. Table 3.2.1 shows that the percentage of UPSR candidates with minimum competency level has increased between 2013 and 2015. This suggests improvement in student performance. Student participant in the LINUS program has also improved (Appendix Figure 4). Table 3.2.1: Student Performance in Primary School Achievement Test (UPSR), 2013-2015
2013 2014 2015
% of Candidates with Minimum Competency Level 65.43 66.93 66.34
% of Candidates with all 'A's 9.15 7.89 8.65
National Average Grade 2.27 2.29 2.27
Source: Quick Facts 2016, Malaysian Educational Statistics, MOE, page 29
However, there are achievement gaps between urban and rural schools. In the UPSR examinations 2016, the achievement gaps between urban and rural schools drastically widened by 26.3 percent in UPSR 2016 compared to 2012 (Appendix Figure 5). These gaps also vary by region. The biggest achievement gaps were in the subject of mathematics and English language (Appendix Figure 6). States with a higher proportion of rural schools, like Sabah and Sarawak, on average, perform poorer than states with less rural schools. One of the main factors that lead to such disparities is due to gap in mastery of English language. In addition, the changes in the format of UPSR exam for English language paper also compounded the problem. Prior to this, students only sat for one paper for English language. However, starting from 2016, the English language has two separate papers: Comprehension and writing. These papers are graded separately. Further, commencing 2016, UPSR examination has focused more on higher order thinking skills questions. This is consistent with the New Primary School Standard curriculum which focuses on 4Rs (reading, writing, arithmetic and reasoning) compared to previous curriculum which focuses only on 3Rs (reading, writing and arithmetic). The findings suggested that most students in rural areas lacked exposure to the usage of English language. The report also mentioned that teaching and learning process in the schools are not consistent with the assessment methods. Some teachers and students still relied heavily on route learning rather than the application of HOTS in teaching and learning. Some teachers also have not fully internalized the standards set in KSSR. Table 3.2.2: Student Performance in Secdondary School Certificate Test (SPM), 2013-2015
2013 2014 2015
Government Schools Candidates (% of Passes) 85.33 84.83 84.76
Private Schools Candidates (% of Passes) 87.88 87.19 86.03
Source: Quick Facts 2016, Malaysia Educational Statistics, MOE Table 3.2.2 indicates the percentage of passes for government schools remain high, ranging between 84 and 85 percent across years. A similar trend is also observed for private school candidates. Once again, the achievement gaps between urban and rural further narrowed by 22.9 percent by 2015, partly due to the improved performance by students in rural areas. Most states continue to show progress with Federal Territories of Labuan and Putrajaya showing the largest gains (Appendix Figure 7). Table 3.2.3 shows that percentage of passes for one subject in STPM examinations increases over the years. It increases from 65.42 percent in 2013 to 82.2 percent in 2016.

102
200
250
300
350
400
450
500
550
600
2006 2009 2012 2015
PISA scores
Mathematics Science Reading
200
250
300
350
400
450
500
550
600
1999 2003 2007 2011 2015
TIMSS scores
Mathematics Science
Table 3.2.3: Malaysia Certificate of Education (STPM), 2013-2015
Type of Schools 2013 2014 2015
Government Schools Candidates (% of passes, based on the minimum CGPA of 2.0)
65.42 83.85 84.70
Government Schools Candidates (% of passes, minimum full pass for one subject)
92.67 97.81 97.64
Private Schools Candidates (% of passes, based on the minimum CGPA of 2.0)
14.81 62.43 59.14
Private schools candidates (% of passes, minimum full pass for one subject)
57.77 86.71 82.62
Source: Quick Facts 2016, Malaysia Educational Statistics, MOE One paradox highlighted in the Education Blueprint 2013-2025 is that while student achievement in national examinations show progressive increase over the years, student scores on international educational assessment shows progressive decline (Figure 3.2.4). Similarly, Malaysian students perform below the international average in TIMSS and the performance has declined over the years. The inverse relationship between national and international examinations raises important question on what is being assessed and how the assessment is being done in national examinations. This also suggests major inefficiency in the education system and probable misallocation of funds to factors that have the highest impact on student outcomes. Figure 3.2.4: Malaysia’s Achievement in TIMSS 1999 - 2015
Source: Authors, based on data from Annual Report 2016 and WIDE. As seen from Figure 3.2.4, however, Malaysia showed some improvement in the latest round of PISA assessment. Mathematics scores increased to 446 points, a jump of 25 points from PISA 2012. Science scores also increased to 443 points, an increase of 23 points from PISA 2012 while reading scores increased by 33 points compared to 2012. This modest improvement suggests that reforms introduced under the Education Blueprint 2013-2025 are in the right direction. According to Malaysian Ministry of Education TIMSS report 2015, the improvement in TIMSS 2015 is due to various factors such as teacher preparation, principal, school environment and

103
socio-economic status. At present, about 65 percent of the school principal has undergraduate degree while 35 percent has postgraduate education. Teachers also underwent professional learning, training in terms of higher order thinking skills and assessment. The schools that have positive learning environment and principals shows more improvement in terms of scores (MOE, 2016). Nonetheless, a long-term upward trend in student performance is still lacking. However, Malaysia PISA scores still remain well below the OECD average.
Figure 3.2.5: Trends in Level-1 Competency in Math and Science in TIMSS by Family Wealth, 1999-2011 (Malaysia)
Source: Authors’ calculation based on WIDE database The low level of learning aside, there is also concern about socio-economic inequality in student achievement. Figure 3.2.5 presents data on trends in Malaysian students’ performance in basic proficiency (in terms of percentage of children attaining level-1 competency threshold) in Math and Science in TIMSS by family wealth for the period 1999-2011. In mathematics, there is a clear decline in performance across all wealth groups by 2011. This is a matter of concern considering the fact that performance decline relates to basic proficiency. In 1999, over 80% children from the wealthiest quintile in Malaysia attained basic proficiency in math. By 2011, it is still more than 80% among the top wealth quintile. The decline is even bigger among the poorest wealth group (by almost 50 percentage points). The across-wealth groups decline in math is even more pronounced in case of attainment of level-2 proficiency (Figure 3.2.2). At level 3 threshold (advanced competency), the sharpest fall in attainment occurred among the top wealth quintile – it dropped from over 6% in 1999 to less than 2% in 2011 (Figure 3.2.3).
0.2
.4.6
.81
1 2 3 4 5 1 2 3 4 5
Country Wealth Index Quintiles, 1999 Country Wealth Index Quintiles, 2011
Maths Science
% o
f ch
ild
ren
pas
sin
g le
vel
-1 t
hre
sho
ld
Graphs by category and year
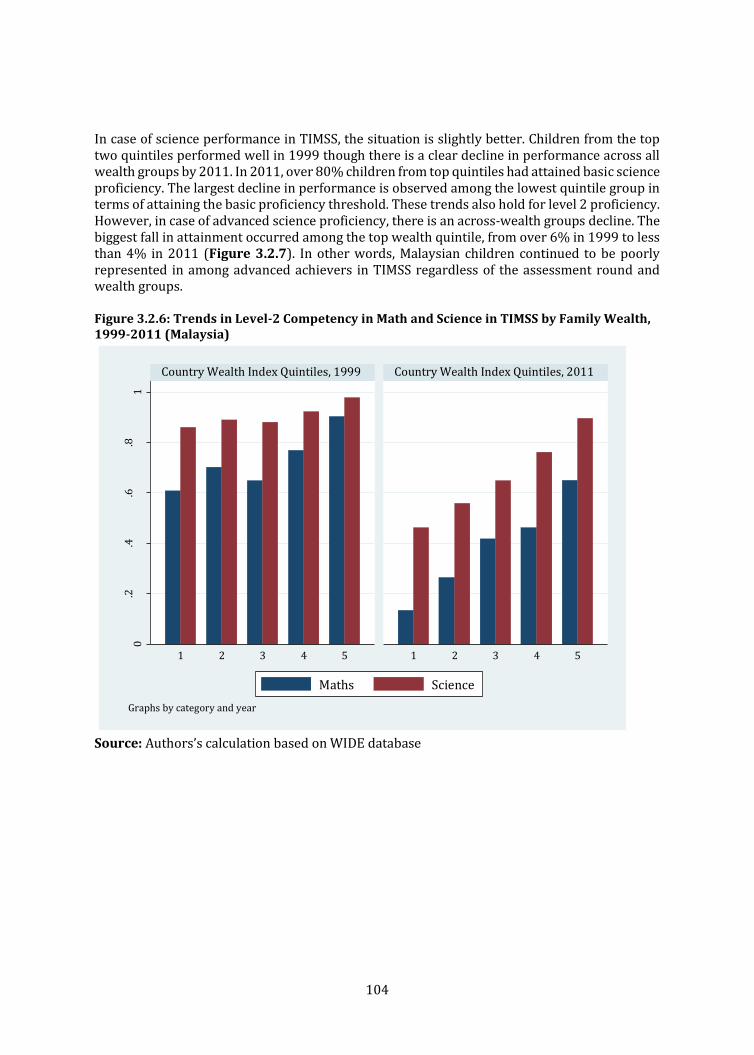
104
In case of science performance in TIMSS, the situation is slightly better. Children from the top two quintiles performed well in 1999 though there is a clear decline in performance across all wealth groups by 2011. In 2011, over 80% children from top quintiles had attained basic science proficiency. The largest decline in performance is observed among the lowest quintile group in terms of attaining the basic proficiency threshold. These trends also hold for level 2 proficiency. However, in case of advanced science proficiency, there is an across-wealth groups decline. The biggest fall in attainment occurred among the top wealth quintile, from over 6% in 1999 to less than 4% in 2011 (Figure 3.2.7). In other words, Malaysian children continued to be poorly represented in among advanced achievers in TIMSS regardless of the assessment round and wealth groups. Figure 3.2.6: Trends in Level-2 Competency in Math and Science in TIMSS by Family Wealth, 1999-2011 (Malaysia)
Source: Authors’s calculation based on WIDE database
0.2
.4.6
.81
1 2 3 4 5 1 2 3 4 5
Country Wealth Index Quintiles, 1999 Country Wealth Index Quintiles, 2011
Maths Science
% o
f ch
ild
ren
pas
sin
g le
vel
-2 t
hre
sho
ld
Graphs by category and year

105
Figure 3.2.7: Trends in Level-3 Competency in Math and Science in TIMSS by Family Wealth, 1999-2011 (Malaysia)
Source: Authors based on WIDE database
Figure 3.2.8: Trends in Level-1 Competency in Math, Reading and Science in PISA by Family Wealth, 2009-2012 (Malaysia)
Source: Authors based on WIDE database
0
.05
.1.1
5.2
.25
1 2 3 4 5 1 2 3 4 5
Country Wealth Index Quintiles, 1999 Country Wealth Index Quintiles, 2011
Maths Science
% o
f chi
ldre
n pa
ssin
g le
vel-
3 th
resh
old
Graphs by category and year
0.2
.4.6
.81
1 2 3 4 5 1 2 3 4 5
Country Wealth Index Quintiles, 2009 Country Wealth Index Quintiles, 2012
Maths Reading
Science
% o
f chi
ldre
n pa
ssin
g le
vel-
1 t
hres
hold
Graphs by category and year

106
Figure 3.2.9: Trends in Level-4 Competency in Math, Reading and Science in PISA by Family Wealth, 2009-2012 (Malaysia)
Source: Authors based on WIDE database In case of science performance in PISA, the situation is slightly better. In science and reading, performance is stable across wealth quintiles between 2009 and 2012 in basic proficiency (level 1) (Figure 3.2.8). However, in math, there is a sharp increase in performance among children from the poorest and richest wealth quintiles by 2012. The wealth gap is also the largest in case of math followed by science and reading. In higher order competency (level 4), wealth gap used to be large in mathematics and science (in 2009) (Figure 3.2.9). However, performance has increased across all wealth groups in mathematics by 2012, however, the increase is largest in the top wealth quintile. The wealth gap is also acknowledged in the Malaysia Education Blueprint (2013-2025) and the government already has schemes to eliminate this inequity through various initiatives such as providing financial assistance to disadvantaged students (KWAPM financial aid). However, the evidence consistently demonstrates that students from poor families are less likely to perform than students from middle-income or high-income households. Schools with higher concentrations of low income students were more likely to fall in Band 6 or 7 on the NKRA scale. Similarly, more than three-quarters of all high performing schools have less than a third of their students on financial aid. It appears that the largest achievement gaps in Malaysia are still those driven by socio-economic status, despite the government’s significant investments thus far (Appendix Figure 8). The performance of Orang Asli and K9 Schools also declined from a cumulative grade point of 3.65 in 2015 to 4.31 in 2016 in tandem with the regression in the mastery rate for UPSR papers from 45.6% in 2015 to 43.8% in 2016 (MOE, 2016).
0
.05
.1.1
5.2
1 2 3 4 5 1 2 3 4 5
Country Wealth Index Quintiles, 2009 Country Wealth Index Quintiles, 2012
Maths Reading
Science
% o
f ch
ild
ren
pas
sin
g le
vel
-4 t
hre
sho
ld
Graphs by category and year

107
The Orang Asli students still struggled to master the Bahasa Melayu subject. English language which is the third language for the students, posed a huge challenge for them to acquire. Thus, the subject became the weakest subject with a mere mastery rate of 33.3% for the English Language comprehension component and 27.7% for the writing component, However, the overall achievement in UPSR from 2012 to 2016 showed these group of students performed far behind their peers, with a passing rate of 43.8% compared to the national passing rate of 86.5%. The wide gap signified a low mastery rate among the Orang Asli students on the three Rs - reading, writing and arithmetic. Low literacy and numeracy skills will hinder the Orang Asli students’ progress and achievement at the secondary level and posed high risk.
3.2.5. Review of the existing evidence
A number of studies have been conducted to identify the factors that determine students’ achievement in Malaysia. Most of the research examined the influence of gender, socioeconomic status, students’ attitude, teachers’ shortage that determines students’ performance. However, research on the nature and extent of inequality in learning outcomes is limited. One study found that students from rural area schools in Tenom Sabah had low achievement in their academics (Polius 2009). The factors identified as responsible for low performance were students’ attitudes, parents’ attitude, parents’ socioeconomic status, school facilities, and shortage of teachers. Lack of facilities at schools also had direct effect on students’ academic achievement. The findings showed that teacher shortage, especially in critical subjects such as English, Science and Mathematics was one of the factors that influence the performance of students. The findings show that students had low achievement if their school faced teacher shortage. Similarly, Low and Ishak (2012) found that family socioeconomic status and academic self-concept affected academic performance of male and female students. Another study on the role of teacher-student relationship showed a positive relationship among teachers and students’ performance in English (Yunusa, Osmana and Ishaka 2011). Therefore, teacher-student relationship was able to increase students’ motivation level in learning. Othman and Muijs (2013) tested educational quality in urban and rural primary schools in Malaysia with a focus on 4 factors: educational resources, school leadership, school climate and involvement of parent in schools. Generally, the finding of their studies showed that educational quality among these two areas had no differences. Othman and Muijs noticed that primary school regardless urban or rural schools revealed no gap among the 4 factors that tested in the study. This means that there was no significant relationship between school locations with educational quality. However, finding showed that for school climate, teachers from rural schools distinguished lower levels. Teachers mentioned besides educational resources, school leadership, school climate and involvement of parent in schools, other factors may influence the school quality. The main factors in teachers’ perception were teaching and learning method and teachers’ workload. Ismail and Awang (2007) analysed the gap in mathematics achievement among eighth-grade students in Malaysia using the Trend International Mathematics and Science Study (TIMSS) 1999. A number of school, home, demographic and socio-economic variables were analysed to study the gap in the mean student mathematics scores. Gender, the language spoken at home, family background, and home educational resources were found to have significant impact on the students’ level of mathematics achievement.

108
Mohd Ibrahim, Mohamed Osman, Bachok & Mohamed (2016) conducted site observation in the selected primary and secondary schools in Gombak district with a focus on the provision of school facilities in the school. The components of school facilities were identified based on the Planning Standards and Guidelines of Selangor. The authors contended that financial allocation is an important factor for the improvement of school facilities and infrastructure and that an adequate provision of school facilities will improve the teaching lessons in class and directly have a positive impact students’ academic performance. There is also an emerging indigenous literature on the subject of principals’ instruction leadership in Malaysia (e.g. Jamelaa and Jainabee, 2012; Ibrahim and Amin, 2014; Ghani, 2012; Nashira and Mutaphab, 2013; Ghavifekr et al, 2015). School leadership has an important role in nurturing professional development and implementing effective leadership in schools. Thus, transformational leaders are energetic and bring changes for the effectiveness of schools (Mohammad Sani et al., 2013). Ibrahim, Ghavifekr, Ling, Siraj & K. Azeez (2013) investigated the impact of transformational leadership as idealized influence, inspirational motivation, intellectual stimulation, and individualized consideration on teachers’ commitment towards organization, teaching profession, and students’ learning. A quantitative survey was administered to a sample of 1,014 trained non-graduate and graduate teachers serving in twenty-seven secondary schools in Sarawak, Malaysia. The results indicate a moderate level of teachers’ commitment and a low level of transformational leadership qualities among the respondents. This study found that inspirational motivation, individualized consideration, and intellectual stimulation were the factors contributing towards teachers’ commitment to teaching profession, and there was no dominant factor influencing commitment to students’ learning. Arivayagan and Pihie (2017) examined teacher’s perceptions of principals’ creative leadership practices for enhancing the effectiveness of secondary schools in Klang District in Malaysia. Based on the generativity theory, the eight main core skills of challenges, broadening, capturing, manages teams, models core competencies of creativity expression, provides resources, provides work environment, and positive feedback and recognition, were examined to explore the concept of creativity in leaders. The model of High Performing School (HPS) was used to measure the School Effectiveness. A total of 250 teachers from these ten schools took part in the survey. The findings showed that a moderate correlation between school principals’ creative leadership practice and school effectiveness, followed by multiple regressions’ analysis indicated creative leadership practices dimension; Encourage Capturing received the strongest weight in the prediction. This study offers a dynamic perspective for school principals to practice creative leadership as the key factor for transforming school into an effective school. According to Guskey (2002), professional development aims to bring changes in the classroom practice of teachers, change in their attitudes and beliefs, and change in the learning outcome of students. Professional development activities develop an individual’s skills, knowledge, expertise and other characteristics as a teacher’ (OECD, 2009, p.49) which modify teacher practices and improve student learning outcomes (Darling-Hammond, Hyler, Gardner and Espinoza, 2017). Lastly, while studies have analyzed reasons for differences in student and school performance in Malaysia, there is a lack of evidence explaining why Malaysia as a country lag behind others in the region in terms of student performance. One study, Pereira and Asadullah (2017), has

109
attempted to answer this question. It is found that in PISA 2012, differences in students’ socio-economic backgrounds including family wealth do not account for the performance difference between Malaysian and Singaporean students. The same conclusion also holds when compared to South Korean students. In contrast, children from Vietnam perform at the same level as those from Korea after accounting for socio-economic differences (Asadullah, Pereira and Xiao 2017). This implies that economic development, poverty reduction, and income growth alone will not close the learning shortfalls between Malaysia and other high performing East Asian countries.
3.2.6. Regression Analysis of the Determinants of Learning Outcomes
Educational production function analyses the relationship between inputs and outputs. In this context, education production function is usually used to determine the relationship between school level factors that determine students’ performance. School level inputs can be class size, teacher quality, school resources such as library, computer, teaching and learning materials. The commonly used output is students’ achievement (Pigott, Williams, Pollanin & Wu-Bohanan, 2012). According to Mat Saad, Nik Yusoff & Mohammad Yassin (2001), the classroom environment plays an important role in providing a convenient and conducive learning environment. Small classrooms with overcrowded students and inadequate facilities make it difficult for the learning process (Tanner & Lackney, 2006). Conducive learning environment, smaller class size, quality and effective teachers have been commonly cited in policy documents and literature as determinants of students’ performance. However, recent emphasis has been on improvement on teaching quality, teaching and learning on higher order thinking skills, promoting school culture as learning organization, school leadership, parental commitment and encourage private sector involvement. In this section, we discuss trends in some of these indicators based on available data and education statistics. Table 3.2.4 presents ordinary least squares (OLS) estimates of the student achievement function for Malaysia in Reading, Math and Science in PISA 2012 data where achievement is examined in relation to individual, family and school factors.28 The estimation methods accounts for multiple plausible values since PISA data does not report a single test score for study subjects. Among household-specific factors, a number of results are noteworthy. Student achievement is most sensitive to family wealth in case of mathematics scores – compared to children from bottom 25% of the wealth distribution, children in the top 25% wealth group enjoy an extra 44 points in PISA math score, which equivalent to nearly one extra year of schooling. Equally, children of educated parents perform significantly better compared to those whose parents have only lower secondary education or below. Second, while there is no advantage to attending a private school, experience of pre-school attendance is significantly associated with higher performance in all PISA subjects. Among individual level factors, one notable finding is the female advantage in science and language and the absence of any gender gap in mathematics in Malaysia. In other words, compared to many other parts of the world where girls lag behind boys in educational achievement, they excel in all domains of learning in Malaysia. However, the girl-boy gap in Reading is very high and is a concern. If test language is spoken at home, this positively influences mathematics and science scores though the correlation is negative in case of reading score. This is important considering the fact that a large proportion of Malaysian students don’t
28 In the PISA 2012 round, 5197 students from 164 Malaysian schools participated.

110
speak the test language at home and there has been abrupt changes in the government policy for the use of English language as a medium of instruction in school. Among school-specific factors, variables such as teacher shortage, proportion of certified teachers and student teacher ratio are all negatively associated with student performance but no the associations are not statistically significant. However, disciplinary climate in the school is positive and significantly correlated with student achievement29. In all subjects, the coefficient is above 50 suggesting large gains from an improvement in student performance if the academic environment is more disciplined and less disruptive. Parental engagement however significantly improves student performance. Student achievement is low where school authorities report only a minority of parents applying pressure on academic standards or the pressure being “largely absent". Table 3.2.4: Determinants of Student Achievement in Math, Reading and Science, PISA 2012
VARIABLES Reading Math Science
Household wealth: : 2nd quartile 6.032+ 6.818* 2.681
(3.454) (2.933) (3.379)
Household wealth: 3rd quartile 15.89** 21.72** 14.67**
(3.397) (2.893) (3.259)
Household wealth: top quartile 33.26** 41.07** 31.79**
(4.379) (3.970) (4.081)
Girl 36.61** 3.350 7.592**
(2.595) (2.651) (2.722)
Age 11.51** 2.549 2.313
(3.804) (3.363) (3.660)
Attended pre-school 12.06** 12.23** 9.501**
(3.505) (2.795) (3.048)
Learning minutes (in language lessons) 0.143** 0.128** 0.0853**
(0.0255) (0.0239) (0.0270)
Proportion of certified teachers -15.18 -4.578 -25.44
(21.00) (17.80) (18.41)
Parental pressure: low -23.22** -24.78** -23.09**
(7.823) (8.526) (8.226)
Parental pressure: absent -22.84* -18.52+ -25.00**
(9.402) (9.655) (8.286)
Small town 9.482 10.57 9.993
(8.472) (6.438) (6.633)
Town 13.50 21.15** 18.70*
(8.906) (6.861) (7.543)
City 17.77+ 17.60* 13.82
(9.951) (8.554) (9.130)
Large city 11.23 25.36* 19.68+
(11.80) (11.63) (10.35)
Private school -9.205 25.16 -0.578
(22.31) (19.96) (22.23)
Teacher shortage -1.305 -2.215 -4.295
(5.318) (4.805) (4.480)
29 This is constructed using data on 5 indicators: (a) Students don't listen, (b) Noise and disorder, (c) Wait for quiet (d) Cannot work well and (e) Long time to start.

111
VARIABLES Reading Math Science
STR -1.110 -0.844 -1.113
(1.063) (0.884) (0.947)
School size 0.00299 0.00734 0.00266
(0.00598) (0.00528) (0.00569)
Average disciplinary climate in school 55.31** 54.52** 47.63**
(10.32) (9.908) (8.886)
st19q01 20.82** -11.54** 8.377*
(4.347) (4.200) (4.080)
Parent’s education: upper secondary 9.204* 9.922** 13.24**
(4.052) (3.513) (3.793)
Parent’s education: Tertiary 12.37* 12.16* 18.53**
(5.953) (4.892) (5.316)
Constant 182.9** 358.2** 389.1**
(68.31) (60.91) (63.24)
Note: *Significant at 10%; **significant at 5%; ***significant at 1%. Cluster-robust standard errors are reported in parentheses. Table 3.2.5 re-estimates the OLS regression models separately for sample children from poor (bottom two wealth quartiles) and non-poor (top two wealth quartiles) families. Family wealth matters significantly for both groups once again confirming significant inequality in learning outcomes owing to differences in economic conditions at home. However, achievement gaps are much larger between wealth groups than within. This is also reflected in the differential effect of parental education. In poor households, parental education is low and the contribution of parental education to their children’s educational performance is also insignificant. The other noticeable result from Table 3.2.1 is the striking difference in the role of pre-primary school attendance on student achievement at the secondary level. The coefficients on pre-school variable are much larger in the sample children from non-poor families (top 2 wealth quartiles) compared to those from poor families. Gender gap in achievement is also more pronounced in the latter group, highlighting a serious issue i.e. under-performance of boys from poorer families. Table 3.2.5: Determinants of Student Achievement in Math, Reading and Science by Family Wealth, PISA 2012
VARIABLES Poor Non-Poor
Reading Math Science Reading Math Science
Wealth 11.60** 11.22** 8.074** 8.753** 11.62** 9.988**
(2.913) (2.558) (2.451) (3.225) (2.880) (2.980)
Girl 40.04** 4.009 9.914** 31.19** 1.374 3.663
(3.638) (3.239) (3.280) (3.511) (3.481) (3.549)
Age 9.800+ 0.214 -0.277 15.34** 6.857 6.980
(5.011) (4.602) (4.969) (5.820) (4.631) (5.160)
Attended pre-school 6.461+ 9.011** 6.128+ 20.77** 16.05** 14.12**
(3.571) (2.826) (3.258) (5.654) (5.068) (5.230) Learning minutes (in language lessons) 0.182** 0.165** 0.124**
0.103**
0.0852** 0.0448

112
VARIABLES Poor Non-Poor
Reading Math Science Reading Math Science
(0.0348) (0.0335) (0.0370)
(0.0310) (0.0318) (0.037
3)
Proportion of certified teachers -11.25 -10.63 -26.97 -14.31 5.074 -22.84
(24.10) (22.66) (21.67) (26.99) (21.69) (23.51)
Parental pressure: low -19.41* -16.95* -17.06* -23.35* -28.15** -24.52*
(8.545) (8.427) (8.562) (9.311) (9.895) (9.896)
Parental pressure: absent -14.85 -8.595 -16.48+
-25.89* -22.66+ -
28.89**
(9.772) (9.462) (8.685) (11.42) (11.79) (9.615)
Small town 7.084 7.120 7.355 16.24 19.58* 17.70+
(8.362) (5.957) (6.892) (10.42) (8.320) (9.419)
Town 13.25 19.71** 17.33* 20.62+ 29.69** 27.49**
(8.810) (7.081) (8.002) (10.70) (8.456) (9.534)
City 14.88 14.46+ 8.562 25.10* 25.29* 23.70*
(10.52) (8.251) (9.439) (11.44) (10.58) (11.52)
Large city 13.68 30.45** 21.77+ 17.63 30.22* 27.65*
(14.02) (11.12) (11.15) (12.67) (13.91) (12.97)
Private school -20.95 17.77 -10.41 -8.117 23.49 -0.939
(30.39) (38.03) (36.26) (24.84) (19.43) (22.42)
Teacher shortage 0.898 -1.235 -1.486 -3.820 -2.910 -7.139
(4.460) (3.886) (4.106) (7.569) (6.232) (6.101)
STR -1.464 -1.548+ -1.454 -0.653 -0.168 -0.696
(1.107) (0.831) (0.986) (1.379) (1.219) (1.248)
School size 0.00038
6 0.00515 0.00081
3
0.00558 0.00938 0.0046
3
(0.00645)
(0.00518)
(0.00597)
(0.00794)
(0.00685)
(0.0072)
Average disciplinary climate in school 53.42** 51.71** 49.06**
55.86** 56.90** 44.80**
(11.92) (10.73) (10.26) (12.90) (11.75) (11.30)
Test language spoken at home 22.23** -7.302+ 10.92* 18.14** -16.94** 4.410
(4.774) (4.307) (4.465) (5.546) (5.479) (5.237) Parent’s education: upper secondary 5.638 7.260* 10.42**
19.69* 15.89* 22.08**
(4.284) (3.471) (3.782) (7.696) (7.532) (7.398)
Parent’s education: Tertiary -7.890 -3.183 1.832 31.04** 24.40** 34.08**
(7.306) (6.021) (6.431) (8.468) (7.942) (7.889)
Constant 233.2** 424.9** 446.3** 122.1 297.7** 318.3**
(88.94) (79.99) (82.89) (95.89) (81.68) (87.33)
Note: *Significant at 10%; **significant at 5%; ***significant at 1%. Cluster-robust standard errors are reported in parentheses.

113
Our analysis of student level data on achievements in language, Math and science highlights the importance of family background. Even though Malaysia belongs to the bottom quartile of countries in PISA and the average score remains low, it is worrying that achievement also varies significantly by family wealth. This implies that the broad-base growth in school participation is not equally benefiting all children. Learning gains from school education remains inequitable. The analysis also highlights one specific source of this disadvantage, namely, pre-school experience. Not only early childhood education is lower among the poor, children from well-off families gain more such early educational experience. These findings on the socio-economic disadvantage in learning outcomes are consistent with growing concerns over out-of-the pocket spending in education or private tutoring in Malaysia. Evidence based on the 2004/2005 Household Expenditures Survey (Kenayathulla, 2013) indicates that a sizable proportion of households incur non-zero expenditure on private tutoring. Factors affecting the level of spending on private tutoring include total household income, parent’s education, household number of school-age children, and home ownership. These findings draw attention to the role that private tutoring plays in exacerbating inequality, confirming that the more affluent households can afford to send their children for private tutoring, while others cannot.
3.2.7. Stakeholder Perceptions in Malaysia
The sample comprised 33 stakeholders of which the majority was school teachers and principals which included 8 non-school stakeholders (e.g. school inspectors, district education officers, officials of local NGOs and think tanks and so on). The majority of the stakeholders (over 65%) interviewed in Malaysia identified school leadership (or effectiveness of the principal) as the most important feature of an effective school.30 This was followed by an emphasis on learning -- high learning outcomes of school children and a supportive learning environment. The fourth factor was continuous professional development of teachers and frequent monitoring of teaching and learning activities. A good number of stakeholders also identified active engagement of parents and community as an important feature of an effective school. However, physical facilities were not perceived as important. Given the importance of school leadership, stakeholders were asked to name the three most important features of an effective school principal. For comparison purposes, they were also asked to describe the three most important factors that define an effective school teacher. Figure 3.2.10 reports stakeholder responses as proportion of respondents identifying a category as one of the three most important features. Data is presented separately for responses relating to principals and teachers. The total does not add up to 1 since we sum across three responses for each y-axis category. The majority (nearly 60%) identified being “focused on improving teaching and learning practices” as the most important feature of an effective principal. This also ranked as most important for an effective teacher (identified by nearly 50% of the stakeholders). Being motivated is identified as the second most important feature of an effective teacher. In case of principal, however, this is ranked as fourth most important. For an effective teacher, being good at communication and being supportive of weaker students were ranked as the third and fourth most important features respectively. Promoting learning opportunities and nurturing healthy student-teacher and parent-teacher relationship are perceived to be the second and third most important features of an effective school principal.
30 Previous studies on Malaysia also identified effective teachers as important for student achievement (Mat Saad, Nik Yusoff & Mohammad Yassin, 2001)

114
While qualification/training is also perceived by 30% stakeholders as important, it doesn’t rank very favorably compared to other features. It is also notable that experience is also perceived by a relatively small number of stakeholders as an important feature of an effective principal. Participating stakeholders were also asked about their views on the main barriers to quality education at the primary and secodnary level in Malaysia (Figure 3.2.11). Once again, the lack of effective school leadership and lack of motivated teachers were identified by the majority as one the three most important barriers, both in case of primary and secodnary education. This was followed by a lack of good/well-qualified teachers. This similiarily aside, there was considerable differences in perceived barriers to quality education across primary and secondary education. Lack of facilities and funding were highlighted as greater obstacles to quality education in primary school compared to secondary. 31 On the other hand, lack of parental important was identified as the third most commonly perceived barrier in secondary education (ranked sisth in primary). Surprisingly Malaysia has linguistic groups and has experimented for decades regarding the use of English as a medium of instruction. Yet only a small proportion of stakeholders interviewed perceived language of instruction to be an important barrier in primary and secondary education. Similarly, in spite of Malaysia’s highly centralized educational system, the stakeholders interviewed didn’t consider the lack of school autonomy to be a problem in primary and secondary education. Figure 3.2.10: Important Features of an Effective School Principal and Teacher
Source: Authors’ calculation based on stakeholders survey data.
Given these responses, stakeholders were asked to identify three factors that they considred as most important for improving education quality in Malaysia. The most popular response was the need to promote student-centered learning followed by school-learning culture organization within the school compound, other thab ethos, the values and beliefs of school leaders, teachers, and children are covert forces that shape the school culture (Hofstede & Hofstede, 2005; Schein,
31 There are many and different types of primary schools in Malaysia which along with the location of the schools cause variation in funding received from the government.
0 0,1 0,2 0,3 0,4 0,5 0,6
Well qualified/trained
Focused on professional development
Focused on improving teaching & learning…
Motivated
Promotes learning opportunities within/outside…
Robust and rigorous in self-evaluation
Ensures progress and personal development of…
Assesses and tracks pupil progress
Supportive of weaker students & provides extra…
Good at communication
Good at engaging w students, making a session…
Secondary Primary

115
2004; Sufean, 2002; 2009). Thus, every school has its own unique culture. However, among the various factors, it has been argued that it is the school leaders‘ attitude and aptitude which constitute the most important factor that strongly shapes a school culture. With this, instructional leadership - among other types of school leadership - has been theorized to be closely linked to school culture and effectiveness (McEwan, 2002). The third most perceived feature was the development of communication skills among students. Teacher training and development programs, greater parental invomvement and alinging curriculum with local standardas were all idenitified as the fourth most commonly perceived features. This is consistent with the emphasis on holistic development and current emphasis on 21st century learning which focuses more on student-centered learning., While improvement of physical facilities were not perceived as important, a large proportion of stakeholders perceived greater provision of ICT facilities as important for improving education quality. Islamic or Madrasah education was not perceived as an important solution to improve educaiton quality. Equally, access to after-school hours extra tuition or greater provision of affordable private school were judged by the majority of the stakeholders as not very important. Figure 3.2.11: Main Barriers to Quality Education at the Primary and Secodnary Level
Source: Authors’ calculation based on stakeholders survey data.
The majority of the respondents perceived government schools to be inadequately funded, both at primary and secondary level. In order to elicit the education reform-related priorities and preferences, stakeholders were asked to comment on a hypothetical situation where extra funding could be made available to improve the quality of education. They were then requested to identify three priority areas where this extra funding could be allocated, separately for primary and secondary education. Figure 3.2.12 summarizes the responses. The majority identified hiring more teachers to reduce class size as one of the three most important priorities for improving education quality. This is true for both primary and secondary education. In case of primary, other perceived priority investment areas (in order of importance) were more spending on school building, more scholarship targeting children from poor families, additional funding for under-performing rural schools, ICT facilities for rural schools, increase in teacher
0 0,1 0,2 0,3 0,4 0,5 0,6
Lack of effective school leadership
Lack of school autonomy
Lack of funds
Pressure of external evaluation
Lack of facilities
Lack of teacher motivation
Lack of good teachers
Language of instruction
Inappropriate curriculum/book content
Lack of parental involvement
Other
Secondary Primary

116
salary, student centered learning, development of new teaching/learning materials, development of soft skills, more provisions for leadership training for school principals, building more schools, more in-service (training) provision, improve counseling service, build more classrooms, free provision of learning materials and free provision of after school extra tuition. In the case of secondary, other perceived priority investment areas (in order of importance) were more spending on school building, more scholarship targeting children from poor families, ICT facilities for rural schools, development of new teaching/learning materials, additional funding for under-performing rural schools, more spending on school building, free provision of after school extra tuition, increase in teacher salary, building more schools, student centered learning, improve counseling service, development of soft skills, free provision of learning materials, more provisions for leadership training for school principals, build more classrooms, more in-service (training) provision and hire more female teachers.32 Figure 3.2.12: Main Priorities for Investment to Improve Quality Education at the Primary and Secondary Level
Source: Authors’ calculation based on stakeholders survey data.
Lastly, the majority of the stakeholders interviewed said that Malaysia could learn or adopt teaching and learning practices from other countries that have been successful in the field of
32 According to the Malaysia Education Blueprint (2013-2025), the government acknowledges that there are still significant infrastructure gaps in the education system. A 2011 Physical Infrastructure Audit report found that over 30% of all schools in Malaysia were in need of immediate repair.
0 0,05 0,1 0,15 0,2 0,25 0,3 0,35 0,4 0,45
More scholarship for poor children
More spending on school building
ICT facilities for rural school
Additional funding for low-performing/rural…
Develop new teaching/learning materials
Free provision of learning materials
Free provision of after-school extra tuition
Increase teacher salary
Hire more teachers to reduce class size
Hire more female teachers
Improve guidance and counseling service
Build more schools
Build more classroom
More in-service provision
Placement of teachers to overseas/high-…
Student centered learning
Soft skills
Leadership training program for head teachers
Secondary Primary

117
education. When asked to name the country, as many as seven countries were identified as potential country role models though Findland and Singapore dominated the list as the most popular choice.
3.2.8. Conclusion
In sum, there are some important gaps between perception and reality. Globally Malaysia ranked very favorably in terms of spending on education. The student-teacher ratio is one of the lowest in the world. Yet a large proportion of stakeholders identified lack of funding and resources as barriers to quality education in the country. Hiring more teachers to reduce class size has been identified by the majority of the stakeholders as one of the three priority area for investment if extra funding became available for improving the quality of primary education. Equally the Malaysian government has invested heavily ICT in the education sector with no visible impact on learning outcomes. However, a large proportion of stakeholders identified greater provision of ICT as important. In case of primary education where there is universal coverage, more scholarship for children from poor families were perceived as important to improve education quality even though extreme poverty has been nearly eradicated. This suggests that stakeholders perceive hidden costs to be hampering performance of children in primary education or access to quality education is still not equally available for children of all income groups in Malaysia. Currently scholarships are given mostly to school children in hard-core poverty. Bottom forty and middle income families still face significant private costs of education such as uniform, transportation, stationery, exercise books, tutoring costs,. Tutoring has become a common phenomenon in Malaysia especially among urban families. Private tutoring is also considered as a means to perform better in examinations (Kenayathulla, 2012, 2013a, 2013b).
Malaysian Government has prioritized investment in education since the country’s independence 60 years ago. The tenth shift of the Malaysia Education Blueprint 2013-2025 is to maximize students’ outcome for every ringgit. This is because of the recognition that there is a mismatch between student performance in national examinations and international assessments. The government has recently used international assessments as benchmarks for comparing the outcome of student learning from different educational systems (MOE, 2013; Kenayathulla, 2014). Various initiatives have been undertaken to ensure that quality education is provided for all the children regardless of gender, ethnicity and socio-economic status. Policy changes include emphasis on 21st century teaching and learning, meeting basic infrastructure, teachers training, leadership of principal and district administrators, community involvement and public private partnerships.
However, the findings indicate major challenges in the delivery of quality education. Among school specific factors, the main perceived barriers to quality education at the primary and secondary level in Malaysia are the lack of effective school leadership and lack of motivated teachers. This was followed by a lack of good or well-qualified teachers. There is significant wealth gap in learning outcomes though there is also evidence of decline in performance in international assessments across all wealth groups. Stakeholders also perceive hidden costs to be hampering performance of children in primary education while access to quality education is not equally available for children of all income groups in Malaysia. The findings also indicate the under performance of boys from poorer families. These boys might have less interest in studying since they might have to work to support family.

118
3.2.9. Recommendations
The following recommendations are made based on the review of the existing reform measures, stakeholder perceptions and evidence obtained from the primary analysis of PISA data on Malaysian students.
First, the influence of household wealth on learning outcomes should be reduced. The findings indicate that there is significant inequality in learning outcomes between children from poor and non-poor families. Compared to children from the lowest wealth group, those from the top wealth quartile enjoy a learning advantage of between 31 and 41 PISA points which is approximately equivalent to one year of schooling. This gap is not driven by differences in other student, family and school specific factors. Additionally, in poor households, parents are less educated and unable to assist children in terms of learning activities at home. Schools should provide a conducive learning environment through extra homework support (and substitute for private tutoring) as well as remedial classes at school so that these economically poor students can acquire quality education in school. However stakeholders perceived funding as being inadequate for government schools; public-private partnership (through corporate sector funding projects) for schools catering to disadvantaged children can help in addressing the wealth gap in learning outcomes.
Second, access to to quality preschool education at the early age should be equalized. The findings based on regression analysis clearly indicate that attending the pre-primary education is an important factor for students performance in secondary school. The learning gain is in around 10 PISA points. Pre-school attendance has a bigger impact among children from economically well-off families. The Malaysian government should establish more preschools to cater to the lower socio-economic students or provide them with vouchers to attend private pre-schools. Alternatively, grants can be given to private providers so that more affordable preschools can be set up. Among other things, more teachers need to be trained in early childhood education.
Third, measures should be undertaken to tackle the widening gender gap in learning oucomes. Compared to the majority of OIC countries, girls in Malaysia outperform boys in reading and science. In mathematics, they perform at the same level as boys. Our analysis of the determinants of learning outcomes show that the reverse gender gap is particularly worrisome in case of children from economically worse-off families. Therefore policy measures should be introduced targetting boys. While further studies are needed to understand the factors that lead to such under performance of Malaysian boys, schemes such as gender targeted scholarships and motivational talksfor boys from poorer families can be considered on a pilot basis. Other potential measures include elevating the status of alternatives to general education such as Technical and Vocational Education and Training (TVET) as a viable and respected pathway for post-secondary education and not a last resort.
Fourth, more needs to be done to improve school leadership and teacher motivation. The majority of the stakeholders interviewed identified “being motivated” as the second most important feature of an effective teacher. The majority also identified the lack of motivated teachers and effective leadership as two of the three most important barriers to the provision of quality education in Malaysian schools. Therefore, leadership training for senior management team and school teachers needs to be increased. Currently, Institute Aminuddin Baki is the only provider of the leadership training. Better training opportunity needs to be given to a diverse range of providers so that there is competition to ensure effective training. At the same time,

119
teacher salary did not appear to be a major issue during our discussion with stakeholders. Therefore, the reasons for the lack of teacher motivation needs to be better understood.
Fifth, better needs-based targetting of funds to primary schools should be prioritized. Our review of the evidence suggests that quality education is not about resource availablity per se. Malaysia already spends a lot on education. Our regression analysis also confirms that there is little return in further lowering student-teacher ratio by hiring more teachers. Yet lack of facilities and funding were highlighted as greater obstacles to quality education in primary school compared to secondary school. During fieldvisits, stakeholders reported lack of facilities in rural, remote locations. The key challenge is to conduct credible needs assessment, specifically targeting under-performing schools and perform diagnostics analysis to guide investment needs. The latter is critical for avoiding further investment in inputs such as reducing class size, which according to our evidence, is unlikely to improve learning outcomes in Malaysian context.
Sixth, initiatives and programs should be targetted to parents to increase their involvement in school activities. Lack of parental involvement was identified as one of the commonly perceived barriers in secondary education. The lack of parental pressure on academic standards was also found to be negatively associated with student performance in PISA. This is particularly an issue for children who belong to economically poor parents. At the same time, parents in rural areas more often than not have no choice and time for involvement owing to working shifts; they also lack confidence in being involved. Innovative schemes that incentivize their participation (e.g. public recognition of positive efforts, monthly luncheons in school for all parents, in-kind gifts that partly compensate for their time and so on) can be developed with sponsorship from local non-state actors such as private companies and NGOs.

120
Pakistan
3.3.1. The Educational Landscape of the Country
Pakistan’s educational system
Pakistan’s education system comprises of the following levels of education: pre-primary, primary, middle elementary, secondary (& vocational) and higher-secondary (with all of these levels comprising basic education) and post-secondary education. The National Education Census (NEC) in 2005/2006 was the first educational census to be conducted in the country’s history and provided a comprehensive overview of the system. According to the census, in 2005/2006, the entire education system was accommodating more than 36 million students, and 95% of these were studying at the basic education levels. Almost 50% of the entire student population in 2006 was studying at the primary level. According to more recent figures reported in the Pakistan Education Statistics (2015-2016), the education system comprised more than 303,000 institutions and was facilitating more than 47 million children (as compared to 36 million 10 years ago) with the assistance of some 1,723,790 teachers through some 191,065 public institutions and 112,381 private institutions.
Pakistan’s history bears witness to rich educational reforms
In Pakistan, education became a devolved provincial subject following the 18th Amendment to the Constitution in 2010. The Ministry of Federal Education and Professional Training (MoFEPT) together with provincial/area counterparts coordinates with international development partners and provides an active platform for exchange of information and to create synergy, synchronization and harmony. Each of the four provinces of the country after the 18 Amendment 2010 is responsible for making policies, curriculum, implementation and allocations for education. Each province has been deliberating and finalizing their enactment for implementing article 25-A, along with Education Sector Plans to address the challenges of access, equity and quality. To date, ICT, Sindh, Punjab and Balochistan have passed Compulsory and Free Education Acts. Khyber Pakhtunkhwa has drafted the bill and will be presenting it soon.
In Pakistan’s recent education history of the last two decades, 1998 is a milestone year when a new National Education Policy (NEP) was approved, and Social Action Plan (SAP) II started to wind up. SAP was designed by donors and government in 1990-91 to improve social indicators, including education. Education policies, sector reforms, action plans in Pakistan, from the late 1990s to 2017 can be clearly divided into three distinct eras: i) 1998 - 2008; 2) 2009-2014 and iii) 2015 onwards - These periods coincide with major shifts in education and political landscape at national, provincial and global levels.
1998-2008 is a decade of transitions and major landmarks. This period has to its credit end of the Social Action Plan (SAP) II) resulting in lowering of social and education indicators, finalization of two National Education Policies (NEP) of 1998 and 2009 (completed in 2008 and signed by the Cabinet in 2009), sector wide Education Sector Reforms (ESR) Action Plan 2001-2005 with innovations including reform of the education foundations in each province, issuance of first PPP guidelines, early childhood education (ECE) extended to the entire country backed by federal grants and major revamping of higher education and TVET. An era of political shifts from 1999 to 2008, experiments in Local Government/devolution to the district level, roll out of a nationwide Poverty Reduction Strategy Programs/Papers I and II accompanied by social safety nets amidst unprecedented earthquakes (2005), and escalating extremism and vulnerability.

121
Dakar Declaration/EFA Goals and MDGs (2000) were signed as global commitments by the Government, on the one hand and 9/11 debacle led to grave challenges. The metaphor of ‘emergencies’ took root in the education discourse thereafter; this era represents a fusion of complex global, national and sub-national narratives vis-a-vis the dimensions of access, quality, equity and governance.
2009-2014 by contrast is a period of democratic dispensation and devolution. Two successive general elections were held creating democratic deepening (2008 and 2013). The National Education Policy (NEP) 2009 was launched (Sept) followed by a drastic shift in assumptions and reality of governance arrangements in 2010 with the passage of the 18th Amendment to the Constitution. The 18th amendment abolished the concurrent list for 37 subjects including education, devolving it as a completely provincial business (Policy, language curriculum, budgets implementation etc.). This amendment added Article 25 A to the constitution finally making education a fundamental constitutional right for all 5-16 year old children as a state obligation for which federal/provincial laws were to be enacted as per governments’ desired crafting. The Federal Education Ministry was abolished in 2010 soon to be resurrected in its new clipped incarnation in 2011 July with curtailed scope and jurisdiction focusing on standards, curriculum(common core), education policies/principles and data consolidation. The Prime Minister gathered all provincial Governments in September 2011 to commit to implementing the NEP 2009 and National Curriculum 2006/7 supplemented by provincial education sector plans (ESPs) and new curriculum/textbooks production/standards protocols as per devolved arrangements. In 2009 Early Learning Development Standards (ELDS)/ECE and National Professional Teachers Standards were finalized. The devolution of education provided an opportunity for political leadership in provinces to spearhead and scale up education reforms and reach out to the most vulnerable. This era witnessed emergence of provincial laws for 25 A in all but one province(KP), enactments on curriculum and textbooks and ESPs embedded in access, quality, equity and governance (AQEG) as the framework for domestic and international financing. PPP Acts were promulgated in Punjab and Sindh in 2010 and amended in 2014 to include services to offset the infrastructure bias through inclusion of services to engage/procure non-state partners in improving service delivery. Learning from MDGs and their unmet goals, stocktaking was systematically under taken at multiple levels concurrently to a very inclusive global/local process for crafting the new post 15 agenda. 2010 marked the first citizen led Annual Status of Education Report (ASER) report on learning accountability on not just who went to school but the quality of learning of children’s aged 5-16 across Pakistan. This initiative was first of its kind and emerged to assist the government on data provision which is open for the public to use. The Benazir Income Support Program (BISP) and other initiatives were launched for social protection in Pakistan for conditional and unconditional cash transfers including education (Waseela-e-Taleem/WET), amidst continued natural disasters and displacements.
2015-2017 the most recent phase & Major National/Global/Provincial Landmarks: This era unfolding has witnessed the launch of Govt. of Pakistan’s Vision 2025 in 2015,committed to human and social capital formation, poverty eradication, sustained and inclusive growth. 2015 also marks the endorsement of 17 SDGs 2030 along with SDG 4 as a stand-alone goal for education (7 targets and 3 means of implementation) through a sector wide lens. SDG 4 is focused on quality, inclusion equity and ‘lifelong learning’ linked inextricably with all 16 SDGs. The current period is one of deepening of sector reforms with accountability and action for quality and equity aligned to SDG 4 , article 25 A /right to education, enhanced resources to education at the provincial level (20-28%) but with persistent challenges of utilization and

122
capacity. Active, provincial legislation and policies in education, curriculum, and social protection, are strong features of this phase as is the review and upgrading of the next generation sector plans across provinces. This period has witnessed new consensus based arrangements across provinces and federal government for the sector with respect to standards, curriculum principles and data protocols on key indicators to be reported nationally and globally. Local governments have been installed (2014-2016) backed by legislation with varying levels of responsibility towards education from province to province e.g. District Education Authorities established in 2016 in Punjab are given multiple powers to oversee school education. This period is also coinciding with preparation for the third General Elections scheduled for mid-2018; where political parties will be asked to take stock of their promises for education written in their manifestoes. The results of the multi-dimensional poverty index (2016) reveals reduction in overall poverty levels but also high levels of persistent poverty in many districts/provinces of Pakistan making girls most vulnerable among the poorest/poor quartiles. The call for Education Emergency has become a repeated one by politicians/governments alike. Two major nationwide education campaigns continued during this phase viz. Alif Ailaan for transforming education in Pakistan as a unique alliance and Ilm Ideas II, searching for innovations to accelerate learning and governance through technologies and traditional means, funded by DFID.
Each provincial government has vigorously crafted and refined their respective sector plans setting targets for access by sub-sector(ECE to Secondary, Non-formal and TVET), quality, equity (gender, geography, income and disadvantaged groups) governance with cross cutting attention to gender, ICTs, emergencies and public private partnerships. There is a principled focus on child centered pedagogies, teacher education reforms and use of technologies to assist in real time monitoring for better teacher attendance, rationalization, financial reforms and sector performance. These ESPs together with the right to education acts for 25 A in each province form the frameworks for sub-national planning and budgeting and support donor compliance norms on equity, systems strengthening and evidence based targets. Major donors supporting Pakistan 33 ’s education sector include; DFID, World Bank, USAID, Global Partnership for Education (GPE) EU, CIDA supported by UNICEF, UNESCO , INGOs, new private sector foundations (Open Society, Dubai Cares etc.).
Recent reform efforts have aimed to improve the teaching cadre in the country34
Improving teaching provision remains one of the most effective means of improving educational quality worldwide. It is widely recognized that poor quality of teaching is the most likely culprit resulting in low schooling quality within Pakistan (Dundar et al. 2014, Aslam and Rawal, 2015). The government of Pakistan’s increased emphasis on improving educational quality has centered on several reform efforts aimed at improved teaching quality. These have ranged from initiatives aimed at improved recruitment, more effective deployment, increased accountability and efforts aimed at reforming teacher training specifically at the pre-service level.
Teacher recruitment reforms have tended to focus on those aimed at revised hiring policies (hiring better qualified teachers with minimum B.Ed qualifications), strengthening merit-based
33 KP Education Sector Plan 2015-2020 Punjab Education Sector Plan 2014-2020 Balochistan Education Sector Plan 2013-2017 Sindh Education Sector Plan 2014-2018 34 Draws heavily from Aslam et al. (2016)

123
recruitment and reduced political interference (for instance through independent testing and giving District Management Officers (DMOs) greater authority in selecting teachers and shifting recruitment processes to local levels to reduce deployment imbalances. With permanent contracts being cited as a critical factor resulting in low teacher effort and poor incentives, the Punjab government experimented with contract hiring between 2002 and 2008. ‘Following a complete ban on teacher hiring between 1997 and 2002, new teachers were recruited only on a contract basis. The minimum qualification requirement was also raised to a Bachelors degree (a shift from 12 years of education and a college degree compared to the earlier 10 years of education and a high school degree). The policy was designed primarily to introduce high-stakes accountability by linking contract termination to unsatisfactory performance, and to induct better qualified teachers (Habib, 2010). Habib (2010) in her study suggests that the contract terms, specifically those relating to transfers and leave options, led to dissatisfaction among hired contract teachers. Lower salaries and greater workloads de-motivated these teachers and led to high absenteeism. Further, political pressure inevitably led to the regularization of these contract teachers, making the contract terms defunct. Hence, the contract policy had a limited impact on teacher absenteeism and accountability. The dismissal clauses in the contracts of teachers hired in 2003 onwards were revoked as a result of judicial action and political pressure. It should be noted that the role of teacher unions or collective action by other teachers in these developments has not been clearly documented. Other provinces have also experimented with the contract teacher policy with questionable success. Newspaper accounts demonstrate severe dissatisfaction of contract teachers with pay and work conditions.
Another example of a teacher-based reform that has been initiated in 3 of the 4 provinces (Sindh in 2012, Punjab in 2013 and KP (2015), is aimed at independent teacher tests as pre-requisites for merit-based recruitment. The National Testing Service (NTS) is an independent privately owned testing service which is being contracted by the government in Pakistan to administer tests for a broad range of posts across a number of government departments. The test aims to assess teachers’ content knowledge rather than pedagogy (with the latter being identified as particularly weak) and there do not appear to be many evaluations of this intervention for the country.
Whilst historically teacher-hiring has been at the provincial level (the selection for province wide teaching posts from a pool of teachers applying from all districts happens at the provincial level), recent reforms have aimed to shift recruitment towards local hiring which is aimed at reducing political interference within the recruitment process. ‘A semi-ethnographic study by Bari et al. (2013) on teacher deployment and transfer practices in Punjab revealed that a majority of transfer requests were regarding moving closer to hometowns, particularly by female teachers.
There have also been efforts to reform pre-service training in the country with much of the impetus on this initiative coming from donors and international development partners. Aslam et al. (2016) note that among the notable reforms in this area are the ones supported by UNESCO and USAID under the Strengthening Teacher Education in Pakistan (STEP) project which helped develop the National Professional Standards for Teachers and influenced policy recommendations for teacher education which ultimately fed into the National Education Policy (NEP) 2009 (ibid, p. 32). However, whilst these efforts have resulted in the development of new programs, the older certificate-based programs continue to be offered by some institutions. A more recent reform has introduced a cluster approach to teacher training as an efficient and cost-effective means of providing in-service. This was institutionalized by the Directorate of Staff Development (DSD) in the Punjab in 2004 and these clusters form the backbone of the in-

124
service teacher education system of the province even today. Of note is the fact that private sector has gained increasing importance in the provision of this training raising quality considerations. However, the public sector continues to play an important role in the professional development of teachers in the country.
Another study by Marine de Talancé (2016) provides strong evidence on the relationship between teachers and acquisition of skills. The results suggest that teachers are one of the main drivers of learning and some observable teacher characteristics are associated with students’ achievement. Teachers with temporary contracts seem to perform better than permanent teachers. Locally recruited teachers also tend to be more effective. Results also suggested that teachers’ wage policy could be a tool to motivate teachers and improve the quality of schooling.
Whilst many notable reforms have occurred to improve the teaching provision in the country, there are numerous challenges that prevail. A significant challenge highlighted by Aslam et al. (2016) is the politicization of teachers within the country with teachers and the government not always being positively engaged in the policy process at the design or implementation stages. The study argues that teachers are critical stakeholders who must be consulted within reform processes to give them a sense of ownership to implement the reforms effectively to improve educational outcomes.
The education provision landscape in the country has changed significantly over the last few decades
Each of the four provinces of the country after the 18th Amendment in 2010 is responsible for making policies, curriculum, implementation and allocations for education. Each province has crafted their legislation for implementing article 25-A, along with Education Sector Plans to address the challenges of access, equity, quality and governance. ICT, Sindh, Balochistan, Punjab and Khyber Pakhtunkhwa have passed their Compulsory and Free Education Acts; Sindh has also notified its rules in 2016. The implementation for all legislations on 25A is still awaited.
Over the years, the authority for planning and implementation of schooling has been devolved within state structures. From federal to provincial level, policy and budget formulation is a provincial mandate post the 18th Amendment in 2010. From provincial to district level, the resource allocation to schools and teacher accountability has been transferred to district administrations. From district to the school level, the school heads have been given authority to report underperforming teachers, allocate resources at the school level, hire contract teachers as stop-gap measures, empowered the community through school councils). In reality, effective practice of autonomy is missing and a number of the empowered agents are not making decisions autonomously and in response to needs (Khan, 2014; Malik and Rose, 2015; Malik, Bari, Muzaffar, 2015). There is very little research in the area of autonomous decision-making in Pakistan’s context. There continues to be a need for developing diagnostic tools for understanding the link between autonomous decision-making by front-line agents (teachers, school leaders) at the school and classroom level and learning outcomes in Pakistan’s context.
One of the most notable trends in education provision within Pakistan has been the mushrooming of the non-state sector as a popular alternative to state provided education, increasing the options parents have for education providers (Andrabi et al., 2007, Aslam 2009). Non-state schooling encompasses a wide array of providers operating at different scales, scope of operations, and extent of penetration across locations and in terms of their management structures, financing arrangements and their relationship with the government (Aslam,

125
2017)35. Within the different models of non-state provision (which range from sole-proprietor schools to chains and franchises to public-private partnerships in various guises and forms), the emergence of what is known as the ‘low-fee private school’ has captured the attention of many and has led to a vibrant (sometimes unfounded on evidence) debate both within the country and beyond. Low-fee private schools encompass a broad spectrum of providers but typically tend to be dependent on user fees to cover all or part of their operational and development costs (Ashley et al., 2014). Since some state schools also charge fees therefore other defined criteria for a private school is that private schools are managed/owned and/or funded largely independently of the state.
However, challenges remain in piecing together a comprehensive picture of the true nature and scale of ‘private’ provision in the country. A major caveat in our understanding of the low-fee private sector is that despite knowing of its existence and the fact that it is increasingly catering to a large share of children in Pakistan (and elsewhere in the world), the exact scale of low-fee private schools is not reliably documented. There are no consistent accounts of what exactly a ‘low-fee private school’ is, for example at what fee threshold is a school deemed to be ‘low-fee’ and catering specifically to a certain group of individuals. Some schools are also associated with religious organizations and offer a religious-based curriculum, whilst others are secular. Within the private schooling secular sector, there are variations across fee levels. There is no fixed definition of what counts as low fee or medium or elite private schools but literature in Pakistan indicates a typical low fee private school in a rural village of Pakistan charges Rs.1000 ($10) per year, which represents 4 percent of the GDP per capita for the country and a typical medium private school charges Rs.5000 ($50) per year. There are further categorization on the basis of school level, where middle and high school fee tends to be higher than that at the primary level. The average expenditure of a Pakistani family on a single primary school student is PKR 370 per month resulting in an average spending of PKR 4,423 per annum per child. (Alcott, B., & Rose, P. (2015).)
Despite these difficulties, there is now a clear understanding that fee-charging private schools (and especially low-fee schools) are catering to large populations of children in urban and rural areas of the country (Andrabi et al. 2007, Aslam 2009). In particular, the Annual Status of Education Report (ASER) data has documented high and increasing enrolments in ‘private’ and ‘non-state’ schools even in rural areas of the country. Overall, the share of private primary education in Pakistan in 2015 was 39% (Carneiro, Das and Reis, 2016). The growth of private schools, especially the LFPS, is arguably most visible in Punjab and Khyber-Pakhtunkhwa provinces. For example, some argue that virtually all the gain in school participation in Punjab over the 2004/05 and 2010/11 period especially at the primary level is attributable to private schools (Aziz et al. 2014). Government statistics document particularly high private presence from middle-schooling and beyond across Pakistan (Figure 3.3.1).
35https://opendocs.ids.ac.uk/opendocs/bitstream/handle/123456789/13202/178%20non-state%20provision.pdf?sequence=1&isAllowed=y

126
Figure 3.3.1: Distribution of Institutions by Sector (2015-16)
Source: Pakistan Education Statistics 2015-16
There is now a vibrant evidence base within Pakistan that showcases some key findings about the ‘explosion’ of private provision within the country. There is now evidence that indicates that many poor parents are willing to pay for private schooling. Even in environments where parents are poor and where they can access free government schooling, the evidence appears to suggest that they are willing to pay for private schooling. Other factors, such as reduced distance to school through accessing private schools also play an important role. A recent paper from rural Pakistan (Carneiro, Das and Reis, 2016.) strongly corroborates this finding. Parental willingness to pay for private schooling for girls also stems from the predominant female teachers that are typically found in these schools. The authors of the aforementioned study, for example, find that the elasticity of demand with respect to female teachers is positive for girls and negative for boys and on average girls’ parents are willing to pay an additional $2.8/year for an increase of 10 percentage points in the proportion of female teachers in the school, which corresponds to about 20% of average annual school fees in a private school (p. 30). This, the authors note, is a large amount and ‘is consistent with the fact that the average proportion of female teachers is close to 90% in schools attended by girls.’ (p. 31). Proximity of private schools, a conducive environment for female students, a client-focused business approach, better learning outcomes and parental preferences for fee-paying schools have also been cited as contributing to low cost private schools’ competitive advantage according to a recent study in Pakistan (ILM IDEAS, 2014).
There is also evidence to indicate that students in ‘private’ schools typically perform as well as students in the state sector (if not marginally better) and they do so at significantly lower per-pupil costs (Aslam 2009, Ashley-Day et al. 2014, Aslam 2016). However, whilst private schools show better learning outcomes than state schools, many children are not learning regardless of the type of school they are attending, suggesting that problems of quality are endemic (Alcott and Rose, 2015). The ability of private schools to provide similar (and sometimes better) quality education as state counterparts at a significantly lower cost stems from their ability to attract a pool of arguably less-qualified teachers who are paid a fraction of the salaries paid to
0%
10%
20%
30%
40%
50%
60%
70%
80%
90%
Primary Middle High Higher Sec.
Percentage
Institutions
Public Private

127
government school teachers. As most low-fee private schools operate as informal enterprises, the viability of their business model necessitates keeping operating costs low. This translates into paying very low wages, sometimes a pittance, to their employees (Andrabi et al. 2008, Fennell, 2013). In many instances, low-fee private schools are small-scale operations owned by private individuals. For example, ILM IDEAS (2014) in their study of 305 (what they term low cost) private schools across primary, middle and secondary levels in Punjab, Sindh and Khyber Pakhtunkhwa (with fees ranging from Rs.300-Rs. 2000/month) found that 63% of these schools were unregistered and owned by sole-proprietors. These small enterprises typically also charge low fees. Andrabi et al. (2008) show that the median annual fee in a rural private school in Pakistan in 2000 was Rs.600 and this, they argue, suggests that the monthly fee was typically less than the daily wage of an unskilled wage worker. Moreover, their study shows that the fixed costs of running low-fee schools are typically low, with the largest share (up to 90%) of the schools’ operational costs constituting teacher wages. A typical low-fee school in rural Pakistan employed 4 teachers, mostly locally resident women with at least a secondary education and enrolled about 100 children (cited in Andrabi et al. 2013). Nevertheless, many parents may still struggle to meet the expenses of private schooling with ILM IDEAS (2014) reporting that parental affordability and lack of interest as two main determinants of student dropouts in the study sample in Pakistan (Aslam 2016). Therefore, by paying a market-clearing wage which is typically below the mandated minimum wage but which is often competitive, a viable business model flourishes within the country (Aslam, 2016).
Public Private Partnerships (PPPs) specifically in Punjab and Sindh as key educational delivery mechanism within this changed education landscape
A push for Public Private Partnerships (PPPs) in education policy, sector plans and implementation in Pakistan has emerged over time as a counter narrative to inadequate financing and to a sub-optimal provision of education services by the government. PPPs in education as in other sectors are viewed as a value for money proposition for meeting education strategic targets nationally (25 A or RTE) and globally (MDGs/SDGs/EFA). Whilst dating back to the 1800s, the formal embracement of PPPs in Pakistan as a public policy strategy occurred under the Education Sector Reforms (ESR) Action Plan 2001-2005 aimed at addressing resource and management constraints. In this regard, 2010 was a landmark year for PPPs in education where the provinces of Punjab and Sindh passed their provincial PPP Acts in 2010 which were largely infrastructure focused. Subsequently both provinces issued new acts/amendments called the Punjab PPP Partnership Act 2014 and the Sindh PPP (Amendment) Act 2015 to include services beyond infrastructure across all sectors providing a cover to public financing of services through transparently procured partnerships. A large variety of education PPPs have since emerged within the country with differing owners, managers and financiers and with varying models focusing on learning outcomes, quality, access and equity.
Aslam, Rawal and Saeed (2017) have reviewed some of the evidence on PPPs overall (and some PPPs in Pakistan) to date. Their review finds mixed evidence of the extent to which the evaluated PPP models in the country36 have improved educational quality and learning outcomes but more positive evidence of improved enrolments through some PPP initiatives. Barrera-Osorio et al.’s 2015 evaluation of the Promoting Low-Cost Private Schooling in Rural Sindh (PPRS) programme, a PPP that aims to improve access to primary education, for example uses a Randomised Control Trial (RCT) design and finds that the introduction of this intervention into
36 including the Partnerships for Management, PfM including the adopt-a-school model in Punjab and Sindh) and the Foundation Assisted Schools (FAS) under the Punjab Education Foundation

128
villages leads to substantial improvements in enrolment with treatment villages experiencing 30 percentage point increase in enrolment for children within the target age group. In addition to this, the authors find a 12 percentage point increase in enrolment amongst the older age group. Similarly positive effects of the programme are found in relation to learning outcomes with treatment villages enjoying test score increases of 0.67 standard deviations for pre-enrolled children and of 2.01 standard deviations for those children who enrolled into the schools as a result of the programme.
Nevertheless, the political landscape within which private schools and PPPs operate is very charged with most government school teachers vehemently opposed to the privatization of education and critics claiming that privatization has resulted in lowering the status of the profession and resultant demotivation among those in the cadre (Aslam et al. 2016). Thus, the educational landscape of the country involves many stakeholders with differing views and incentives and provides both challenges and opportunities to the policy-makers involved.
The role of civil society & development partners
Civil society organizations (CSOs) across Pakistan have stood by as eager partners with the government to complement and accelerate the efforts. CSOs have worked at three levels viz. i) with the government in public sector state schools in various school improvement programs.
Here the access of CSOs has been negotiated at different levels formally through MOUs with the government through three strands: a) philanthropy led school improvement by responsible and generous citizens that may include backing of industry foundations which have been welcomed by the government after verification of purpose, interventions, targets and outcomes with value addition protocols. These models continue on a case to case basis with district and provincial level MOUs in a decentralized setting; b) CSOs working as Implementing Partners (IPs) for large or medium sized development partners (USAID, DFID, EU, UNICEF, Save the Children, Oxfam etc.) that have access to government schools through an umbrella understanding between the development agency under large/small multi-year projects with given interventions and targets; and c) the large scale government organized NGOs (GO-NGOs) in the country such as the Rural Support Programs(RSPs) across Pakistani provinces and the Pakistan Poverty Alleviation Fund (PPAF) also contract through a call for expression of interest CSOs, to become implementation partners in government and/or low school improvement programs. These different programs have led to a blossoming of innovations, tools and diversity of content, and , some with good results in teacher training across levels, governance through SMC capacity building, action for gender equality , youth mobilization “Teach for Pakistan’ and tech enabled initiatives etc. Did these lead to high end results? This question need rigorous research and in some cases some impact research has also been undertaken in -built into various donor and government funded projects.
ii) Through government financing /vouchers in education foundation funded schools
The Education Foundations (5) that began in 1992 in the post Jomtien reconnected to the Grant in Aid schemes to non-state providers for education outreach to the most disadvantaged. All of them have undergone reforms and work purely through PPPs under their own unique legislation to expand their footprint for access, equity and quality through CSOs/private sector. This is the most sustainable form of seeking partnerships with CSOS for education which is targets and outcomes based. Punjab and Sindh Education Foundations are currently both active and innovative scaling up their work to achieve large targets. Between the two more than 2

129
million children have been enrolled in the two provinces where government pays the per child voucher costs to partners who can perform service delivery effectively. Regular third party evaluations /monitoring are associated with these partnerships.
Recently the government of Sindh has successfully launched the public sector financed model of school improvement through the Education Management Organizations (CSOs/Private Sector) under the umbrella of the Sindh PPP Amendment Act 2015 as service providers. This is a good example of sustainable partnerships much like the Education Foundations that last over time.
These forms of partnership and intervention has helped in pushing the needle forward albeit modestly but with a great deal of promise for the future. Organizations are mobilized through a transparent and capability based approach that lead to outcomes. This mode of financing from the government is largely sustainable until the latter’s resources keep flowing for all the schools established and/or managed through PPPs.
iii) Privately funded schools/education programs to demonstrate what can be done at scale or as pilots with independent management, oversight and better results as discussed above. Here CSOs, trusts and not for profit private sector programs have assumed scale with innovations such as the The Citizens Foundation (TCF) as an eminent example and with almost 1500 schools across Pakistan and many other organizations running education initiatives through their own sustainable resources and strategies. In terms of empowerment and building of systems to run high quality high outcome schools these programs have generated very inspiring results. However, the challenge for mobilizing continuous resources is a major one for such organizations that requires refining of the business model for more sustainable long term solutions for reaching the most vulnerable over time.
CSOs also support government technically in generating large nationwide data sets on learning and equity such as the case of Annual Status of Education Report (ASER), researching complex issues on teachers, disability, language and learning, English proficiency etc. where the government capacity may be lagging. ASER is citizen and volunteer led sharing important data for benchmarking annually that is widely used and recorded in the Government of Pakistan’s prestigious annual Economic Survey report as well as mapped in the Education Sector Plans developed by the provinces.
What is significant in all these innovative programs is that there is a growing appetite of the government towards partnerships with CSOs/private for improvement and value addition through their own resources or that of the government. However, under the security challenges faced by Pakistan there is increasing scrutiny of CSOs as well. Whilst space for non-state actors has been growing at a healthy pace in education, there is need for more rigorous research on what works and also support for programs that do through more predictable financing models that ensure integrity and growth.
Increasingly INGOs such as PLAN International, the British Council, Save the Children, Oxfam, Right to Play, IRC, etc. have assumed the role of implementers and supported service delivery, capacity building and advocacy across Pakistan with or without local CSOs/private sector. Although the space for civil society activism is being curtailed given security challenges with complex procedures to register and operate. In spite of these issues the public sector procurement regimes and laws are becoming more proactive on procuring services of CSOs and not for profit and for profit private sector backed by robust public private partnership legislation and partnerships. Recent experience in Sindh province stands out, where Education

130
Management Organizations (EMOs) have been procured transparently under the legal provision of PPP Amendment Act 2014 to manage government schools through government finances/resources; the services are being procured for other areas too viz. teacher recruitments, assessments, training etc. Bilateral, multi-lateral donors have been active in Pakistan are also joined by new donors or global foundations in education (such as the World Bank and UK Aid).
3.3.2. Assessment of learning outcomes
ASER - The Annual Status of Education Report (ASER) is a survey aimed at measuring the quality of education in (predominantly rural) Pakistan. It seeks to provide a reliable set of data at the national level, that is comprehensive and, at the same time, easy to understand. The survey’s stated objectives are threefold:
(i) To get reliable estimates of the status of children’s schooling and basic learning (reading and arithmetic level) at the district level;
(ii) To measure the change in these basic learning and school statistics from last year;
(iii) To interpret these results and use them to affect policy decisions at various levels.
Unlike contemporary national assessments, ASER involves ordinary citizens in the process of data collection; empowering them with an accessible tool for evidence gathering and action. The idea is to create citizen pressure in a campaign mode for holding the education system accountable for its dissatisfactory deliverables. ASER helps in identifying gaps that need to be bridged in order to move forward towards fulfilling the obligations under Article 25-A. ASER methodology and process are derived from those followed by ASER India. ASER brings into light the state of education by assessing the learning levels of children in three basic competencies i.e. Language: Urdu/Sindhi/Pashto, English and Arithmetic. As ASER rests on the theory of change that ordinary educated citizens can be mobilized for extraordinary actions, the learning instruments are kept simple and easy to administer and are based on grade two and three level competencies as given in the national curriculum 2006. Moreover, a set of core questions have been designed which are adapted and expanded each year to explore different dimensions of schooling and learning at the elementary stage. This ensures that the data is comparable and easily collected by the surveyors.
ASER has sought to gather information on very basic learning instruments, which are reading and arithmetic. A set of core questions have been designed which are adapted and expanded each year to explore different dimensions of schooling and learning at the elementary stage. This ensures that the data is comparable and easily collected by the surveyors. Over the years ASER has become well reputed for its novel approaches to learning issues in the field as a unique tool in the region, and at the global level too. Another key feature of this survey is that it is a household-based survey that aims to measure reading, comprehension and numeracy skills for children aged 3-16 years within their homes. The assessments test grades 2 and3 level competencies. The survey is able to assess both enrolled and un-enrolled children and by measuring basic and generic literacy and numeracy rather than curriculum-based and grade-based skills measured by other assessments (such as Punjab Education Commission), captures a fuller picture of basic learning than has been historically been available in the country. In addition to testing basic literacy and numeracy among children aged 3-16 years, the survey also gathers basic literacy and numeracy information on parents and aims to gather household asset
131
information to be able to arrive at some measure of socioeconomic status. The survey also gathers school-level information on one government school within the village.
The ASER journey started in 2008 when a national organization (Idara Taleem-o-Aagahi) developed and piloted the tools for the first time in 11 districts and assessed 16, 737 children. Since then, ASER has progressively grown in scope to cover all rural districts in the country (across all provinces) and some urban areas over recent years. In 2016, for example, the survey covered 144 rural districts across Pakistan, covering more than 4000 villages and over 5000 schools and assessing over 250,000 children through 10,000 volunteers. Appendix Table A3 summarizes the coverage of ASER over the years.
There are, however, some important criticisms of ASER data. A key criticism relates to the very narrow set of mechanical functions that it is able to measure in computation and ability to recognize characters for reading but not being able to truly assess real understanding. The way the data are measured also only allows a very narrow usage of the resultant data (see below). Another key limitation of the data are that they are mainly rural. Although ASER Pakistan does collect some data in urban wards, the data are limited and not used in the analysis in this report. Also, the data is not captured from the same children every year. Instead, the 20 villages remain the same while 10 are added every year to keep the sample size to 30 villages from each district.
3.3.3. Major Trends in Education Statistics
Several studies and reports in the country have repeatedly identified some clear markers of disadvantage. Among them, gender, geographical location and socio-economic status emerge as some of the critical determinants of hardship. For example, the Pakistan Education Statistics (2015/2016) highlight the clear gender divide in the country in that the education system caters to a larger share of males (56%) as compared to females (44%). Poverty and socio-economic status also continues to further marginalize individual’s access to education and being located in a remote or conflict-ridden area further compounds these effects. The following sub-sections present some simple descriptive statistics focusing on these well-known markers of disadvantage within the country.
Educational access
Pakistan has made great strides in improving educational access. This is reflected in improvements in gross enrolment rates and participation rates over time (Economic Survey of Pakistan, 2015-16). However, universal access has still not been achieved and there are wide disparities across regions and provinces and for particular groups of children. Appendix Table A4 illustrates educational access for children aged 3-5 and for those of primary school-age (ages 6-10) with the latter illustrated using ASER data from 2015 and 2016 and PSLM data for 2014-15. The table indicates that the country remains persistently away from the universal access to basic education benchmark but there are disparities across the provinces with Balochistan persistently performing well below the national average.
Figure 3.3.2 depicts a more time-series picture of enrolment trends in rural Pakistan using ASER data. Some key findings include the gently upward trend in enrolment between 2012 and 2016 amongst the 6-10 year olds but wide and gaping disparities. Rural areas of economically poorer provinces such as Balochistan and Sindh perform far below the national average in providing basic schooling to their children and AJK and Punjab are amongst the ‘best performers’ when assessed on this parameter.

132
Figure 3.3.2: Enrolment by Province/Region, 2012-2016 (Children Aged 6-10 Years)
Source: ASER Rural Data (2012-2016)
As discussed in Section 2, non-state schooling is on the rise across the country. The increasingly large proportion of children (aged 6-16) who are absorbed into ‘private’ schools is reflected in Appendix Table A5. Latest ASER data (2016) indicates that nationally, about 23.5% of all children aged 6-16 are enrolled in some form of ‘private’ school and this proportion has increased from 21.7% in 2015. There remain large disparities within provinces (and regions) with the largest enrolment in the private sector within AJK and ICT and the lowest in Balochistan. This declining trend in enrolment within the government sector is pictorially depicted in Figure 3.3.3 which illustrates household tending to move their children (aged 6-10 years) out of the government and into the non-state sector between 2012 and 2016.
The persistence of gender gaps in educational outcomes has been repeatedly highlighted by ASER data over the last few years. A comparison of ASER enrolment data for 6-16 year olds across government and private schools indicates some improvements in girls’ enrolments over the 3 year period (Appendix Table A6). For example, girls’ enrolment in government schools appear to have improved at the national level from 35% in 2014 to 38% in 2016 and from 37% to about 40% over the same period in private schools. This 3% increase is not a small feat when focusing on absolute numbers – 4,877 more girls in school in 2016 in both government and private schools (69,295) than there were in 2014 (64,418). This national picture, whilst masking some differences across the provinces and regions, overall depicts a pattern of small improvements in enrolment across the board with some differences across the government and private sectors.
ASER data can also be used to identify whether educational access and outcomes differ for various groups on the basis of their socio-economic status. As already mentioned in Section 3, a key feature of the data is that it collects household-level information on various indicators which can then be effectively used to compute a wealth index. 37 These indicators measure the
37 Household indicators used: Type of house (Type of house is a categorical variable with kutcha given the value 1, semi-pucca equals 2, and pucca equals 3), house owned (Dummy equaling 1 if the house is owned, 0 otherwise), electricity connection (Dummy equaling 1 if the house had electricity, visible wires and fittings, 0
0,
20,
40,
60,
80,
100,
2012 2013 2014 2015 2016
Enrolment Trends (6-10)
National RuralBalochistanFATAGBISBKPPunjabSindhAJK

133
economic potential and achieved levels of income and wealth of a household. ASER wealth index have been developed by using principle component factor analysis procedure in the STATA software38. Using this methodology, ASER 2016 national data (144 rural districts of Pakistan) has been divided into 4 categories/quartiles (i.e. poorest, poorer, richer, and richest) thereby representing the entire population of Pakistan in a socio-economic context.
The results depicted using the ASER Wealth Index (2012, 2013, 2014, 2015) reveal that the richest quartile have the highest percentage of children enrolled in school (85%) whereas the poorest quartile have the lowest enrollment rate (59%). A strong correlation between wealth and enrollment is established as we move along the wealth index. Moreover, socio-economic background is also found to be influencing gender inequity. Male and female children belonging to the poorest quartile are particularly disadvantaged as depicted by the lowest enrollment rates. The highest enrollment of males and females is again in the richest quartile (87% and 83% respectively). Females are double disadvantaged – not only are their enrolment rates lower than those of males but poorer females are worse off than richer ones (Figure 3.3.4).
Figure 3.3.3: Enrolment in Government Schools by Province/Region, 2012-2016 (Children Aged 6-16 Years
Source: ASER Rural Data (2012-2016)
otherwise), mobile (Dummy equaling 1 if anyone in the house has a mobile, 0 otherwise) and television (Dummy equaling 1 if the household has a television, 0 otherwise) 38 It factorizes variablesby creating a weighted combination of the input variables in the following manner e.g. F1 = a11X1 + a12X2 + …. In order to select factors, eigen values from a principal component analysis are used and the factor coefficient scores are created. Further, the indicator values are multiplied by the coefficient scores and added to come up with the wealth index. The index is then divided into groups/quartiles to categorize the population according to their wealth status.
0,
20,
40,
60,
80,
100,
2012 2013 2014 2015 2016
Government School Enrolment (6-16)
NationalBalochistanFATAGBISBKPKPunjabSindhAJK

134
Figure 3.3.4: Enrolment by Gender and Socio-Economic Status
Source: ASER data National-Rural (2016)
The analysis for ASER 2016 data further reveals that the poorest quartile have the highest level of children enrolled in government schools (77%) whereas the remaining 19% of the children are enrolled in private schools (Figure 3.3.5). On the other hand, the richest quartile has the highest number of children enrolled in private schools (53%) and the lowest percentage of children in government schools (46%). It is evident from the figures that enrolment in government schools falls and that for private schools increases as we move along the wealth index towards the richest. A household’s socio-economic status, therefore, appears to be associated with the type of school their child attends.
Figure 3.3.5: Enrolment by School Type and Socio-Economic Status
Source: ASER data National-Rural (2016)
59
70
7885
67
7682
87
46
62
73
83
0
20
40
60
80
100
Poorest Poorer Richer Richest
% C
hil
dre
n
Enrollment by GenderOverall Male Female
7769
63
46
1927
35
53
0
20
40
60
80
100
Poorest Poorer Richer Richest
% C
hil
dre
n
Enrollment by Type of School
Government Schools Private Schools

135
Quality of physical educational inputs
Governments have typically tended to pursue ‘inputs’-based educational policies in the misguided view that improving inputs alone will improve educational quality. This is not to say that inputs do not matter, but the critical question remains ‘which’ inputs matter most to improve educational quality. However, research in education in recent years has questioned the value of investments in expensive resources (such as reduced class sizes) as the relationship between school resources and student achievement remains contested (Hanushek, 1997). Nevertheless, there are some basic facilities without which a child’s learning experience is likely to be compromised – the availability of a functioning toilet, safe drinking water, boundary walls for schools, physical classroom structures, textbooks and most importantly teachers who are qualified and have sufficient content and pedagogic knowledge to impart learning effectively to the child.
The evidence to date indicates that the quality of physical school indicators continues to remain poor across schools in Pakistan with private schools reporting better availability of most (though not all) facilities than government schools. There are large discrepancies across provinces and regions with the poorer provinces such as Balochistan consistently reporting poor educational inputs across both government and private schools. Figure 3.3.6 illustrates the availability of drinking water by province/region and by schooling level based on PSLM data (2015-2016). It is clear that safe drinking water is not available even based on these government statistics across most provinces and across various education levels. ASER data from most recent years also appears to highlight this dire state of affairs (Appendix Table A7); in Balochistan, for example, only 14% of primary government schools reportedly had safe drinking water and whilst private schools consistently reported better water facilities, even private schools in many parts of the country do not provide this basic facility to children. Similar findings are reported for toilet facilities (Figure 3.3.7 and Appendix Table A8). The data from ASER also consistently shows poor quality of other physical schooling facilities – with only 35% of government primary schools reporting having playgrounds available and only 45% of private schools indicating availability of playgrounds for children nationally.
Figure 3.3.6: Availability of Drinking Water (%), by Province/Region and Schooling Level
Source: Pakistan Education Statistics 2015-16
0
10
20
30
40
50
60
70
80
90
100
primary middle high higher secondary

136
Figure 3.3.7: Availability of Toilets (%), By Province/Region and Schooling Level
Source: Pakistan Education Statistics 2015-16
Student-teacher ratios (STR) provide another commonly used measure of school quality. Appendix Table A9 denotes the student-teacher ratio estimates available using ASER data from 2012-2016. It is clear from the table that the Pakistan-wide STR was 39 students to 1 teacher in 2012 and about 35 students to 1 teacher in 2016 in rural areas. There are some differences across provinces with KP depicting higher ratios than the national average over the years and ICT showing some of the lowest. However, it should be noted that the average STR remains below the benchmark of 40 typically proposed by the government.
STRs, however, may mask the existence of multi-grade teaching which has become a common strategy to meet MDGs goals and deal with teacher shortages and absences particularly in remote rural locations. Research on the effects of Multi-grade teaching on student learning to date has shown mixed results (Little 2008). Many agree that when it is a pedagogical choice that is accompanied with effective teacher training and materials to support this style of teaching, it can be as effective as mono-grade teaching. However in many developing contexts, multi-grade teaching arises due to necessity rather than choice and without the accompanying training and resources to ensure it is an effective method of teaching children. Nevertheless, this argument needs to be balanced with the rejoinder that for a vast majority of children in remote and rural contexts such as in Pakistan, small multi-grade classrooms are often the only type of school to which they have access. Appendix Table A10 using ASER 2015 and 2016 data indicates that multi-grade teaching is common practice across both government and private school settings in primary settings (but less common across private schools). Again there are wide disparities across provinces but from an equity perspective this finding indicates that there are insufficient teacher inputs available across both the government and private school settings and in all likelihood these multi-grade environments are more likely to be located in more remote and rural locations that already face educational deprivation and social marginalization.
Learning outcomes
Both government-based assessments/measures and independent assessments of learning outcomes consistently point to alarmingly low learning levels across Pakistan. Appendix Table A11 and Figure 3.3.8 illustrate the extent of the crisis in the country. According to government
0
10
20
30
40
50
60
70
80
90
100
primary middle high higher secondary

137
statistics (PSLM, 2014-2015), only 76% of individuals aged 10 and above in urban areas and only 51% in rural areas can be classified as ‘literate’. Overall only 60% of individuals in the country aged 10 and over are considered ‘literate’ based on the un-ambitious definition of anyone aged 15 or over who can both read and write with understanding a short simple sentence about their everyday life. These overall national figures mask large discrepancies across provinces with only 44% of individuals in Balochistan literate as compared to the national average of 60%. There are also clear gender gaps in literacy with females consistently less likely to be literate as compared to males across the board in the country with wider gaps in rural as compared to urban areas.
Results from independent assessments such as ASER paint an even more alarming picture of learning outcomes in the country as they go beyond simply denoting someone as literate based on being able to read or write a simple sentence to actually measuring basic literacy and numeracy competencies (see Section 3). Appendix Table A12 highlights the learning challenges of Pakistan across three basic competencies i.e. Language (Urdu/Sindhi/Pashto), English and Arithmetic, captured by ASER Results. In 2015, only 55% children (enrolled in class 5) could read a story in Urdu/Sindhi/Pashto, 49% were able to read basic sentences in English, 50% could solve 2 digit division sums. Similarly in 2016, the results show a further dip with only 52% children (enrolled in class 5) reading a story in Urdu/Sindhi/Pashto, 46% reading basic sentences in English, 48% able to solve 2 digit division sums.
Figures 3.3.9 and 3.3.10 use the time series of learning outcomes data available between 2012 and 2016 on basic literacy and numeracy outcomes to highlight some key facts about educational quality in the country over this period. Firstly, a large percentage of children in grade 5 across the country are unable to read a story or divide. Secondly, as we observed before, there are wide discrepancies across provinces with Balochistan consistently poor not only in access but also in terms of learning. Finally, what is perhaps most striking is the broadly ‘static’ nature of learning over the 4 year period with some visible improvements but largely persistently poor outcomes across the country.
Figure 3.3.8: Literacy Rates (%) for Individuals Aged 10 and Above by Province and Location
Source: PSLM (2014-2015)
0
20
40
60
80
100
National Balochistan Punjab Sindh KP
Literacy: 10 years & older
Urban Rural

138
Figure 3.3.9: Grade 5 Learning Levels in Language, by Province/Region
Source: ASER Rural Data (2012-2016)
Figure 3.3.10: Grade 5 Learning Levels in Mathematics, by Province/Region
Source: ASER Rural Data (2012-2016)
The small (but significant) improvements in enrolment numbers for girls reported above are not necessarily reflected in corresponding improvements in learning outcomes. Tables 13- 15 depict learning outcomes for 5-16 year olds between 2014-2016 and illustrate the percentage of boys and girls able to read Urdu sentences, read at least words in English or be able to at least do subtraction in Arithmetic across the provinces/regions and at the national level. The tables depict a dire picture – of worryingly low levels of learning as measured through the ASER domains and a persistence of poor outcomes over the years. There are wide disparities across the provinces/regions, with some areas faring far better than others and being well above the national average. The broad patterns, however, remain of persistently low and, in some instances, deteriorating learning outcomes.
The large pro-male gaps in learning outcomes are illustrated further in Appendix Table A15. Not only is Pakistan far from achieving parity in access to education, there are also wide gaps in
0,
20,
40,
60,
80,
100,
2012 2013 2014 2015 2016
Learning Level (Urdu/Sindhi/Pashto-Read Story)-Class 5
NationalBalochistanFATAGBISBKPKPunjabSindhAJK
0,
20,
40,
60,
80,
100,
2012 2013 2014 2015 2016
Learning Level (Arithmetic-Do Division)-Class 5
NationalBalochistanFATAGBISBKPKPunjabSindhAJK

139
learning outcomes (though significantly less than in enrolment), with boys almost always performing better than girls. These gaps are also persistent over the 2014-2016 period with almost no noticeable improvement. Some regions continue to depict alarmingly wide gaps in favor of males – FATA in particular (followed by Balochistan and KP) stand out as regions with extremely high pro-male gaps in learning outcomes that are persistently wide in favor of males.
3.3.4. Regression Analysis of the Determinants of Learning Outcomes
The descriptive statistics presented above hint at some key drivers of education disadvantage in Pakistan and specifically in rural Pakistan (with gender, location and socio-economic status among the most critical ones). A natural question to follow from this is whether these factors are simply correlations or more deeply associated with learning outcomes? In order to arrive at more nuanced and meaningful conclusions, this section undertakes simple multivariate empirical analysis aimed at estimating some key determinants of enrolment and learning outcomes for children in rural Pakistan.
This sub-section attempts to unravel the extent to which key factors, particularly that related to household poverty, impact student learning. To do so, we take advantage of the rich ASER data from Pakistan which assesses children in both literacy and numeracy and in doing so aim to unravel some of the equity implications for example of going to a specific type of school, being of a given gender or belonging to a specific region or socioeconomic class in the country. In order to achieve this, ASER data from two years 2013 and 201639 are separately used to estimate probit models to determine the link between a set of variables such as age, gender, socioeconomic status (measured using the wealth index discussed previously) type of school child attends, current class attended, parental education levels and region of residence (province) on the likelihood of a child completing ‘higher-level’ learning for those enrolled in school. Tables 3.3.1-3.3.2 report the results of the estimation for the full sample of children aged 5-16 years for the numeracy outcomes in 2013 and 2016 with columns further disaggregating the results for the poorest and richest children (i.e. those in the poorest and richest quartiles). The estimates for reading skills are presented in Tables 3.3.3-3.3.4.
There are some striking findings. Turn first to Tables on the determinants of numeracy outcomes, for all children and those belonging to the poorest and richest quartiles in 2013 and 2016. Of the factors determining ‘higher-order’ numeracy skills, age and gender are clearly important. Older children and those studying in higher grades are more likely to have higher order maths skills. Male children are also more likely as compared to female children to achieve more in numeracy and this appears to be the case amongst poorest quartiles (in 2013) and amongst both poor and rich quartiles (in 2016) in the country suggesting a significant male learning advantage. The wealth index is significantly positive for the full sample suggesting socio-economic status positively influences learning outcomes in maths. Both parent’s education also seems to positively influence maths outcomes and this doesn’t appear to differ substantially across the wealth quartiles or over the years. Another striking finding is the apparently better learning outcomes of children studying in ‘private’ schools as compared to their counterparts in government, independent madrasah or ‘other’ schools. The magnitude of the marginal effect is larger among the poorer children indicating that not only are poorer children more disadvantaged by socioeconomic status but also double disadvantaged in terms of achieving less when attending non-private schools.
39 The data from these years are used as it was from 2013 that ‘full’ district coverage for the entire Pakistan because available with ASER data and these datasets provide the most comprehensive country-wide information on learning in the country.

140
The finding that children in madrasahs are performing significantly less well than their counterparts in other schooling system is worthy of further discussion. Madrasahs have long been viewed with suspicion with significant international interest with some arguing that they breed extremism and others claiming that they constitute a minimal share of enrolment within the country (Khwaja et al. 2008). The government’s policies post 9/11 has focused attention towards madrasahs but has met with mixed success. In August 2001, the GOP created a Pakistan Madrasah Education Board (PMEB) to establish ‘model madrasahs’ and to regulate existing seminaries along with the five boards aligned to the doctrinal sects40 determining, curriculum, standards, holding examinations for diplomas /degrees. By doing so, it was hoped that madrasahs would be able to provide both religious and secular education. The Education Sector Reform Action Plan and other efforts were embarked upon by president Musharraf in the early to mid-2000s and included the reformation of madrasahs as a key goal. In particular, it was aimed to bring madrasah curriculum into mainstream education through incorporating the teaching of secular subjects within seminaries. However, many madrasahs resisted these reforms, favouring autonomy over registration. As early as 2001 the five boards or Wafaqs had joined hands to counter regulation through a body called Ittehad Tanzeemat-e-Madaris-e-Diniya (ITMD). Through the Voluntary Registration and Regulation Ordinance 2002, the state promised funding to madrasahs that formally registered with the government. In a more controversial step, the Pakistani state demanded that madrasahs expel all foreign students by December 31, 2005. Many Islamist groups deeply resisted these efforts. Many subsequent reforms have followed – including those embedded within education policies. However, despite all these efforts, the mistrust between madrasahs and the government has been hard to dispel. There is no empirical research on student outcomes for children studying in madrasahs in Pakistan that we are aware of. What quality research does exist, however, appears to note that these institutions are prominent non-state education providers and can be important partners in advancing education in the country (Bano 2011). However, forging such partnerships is contingent on a serious financial commitment on part of the state to establishing trust relationships at scale. Little is known beyond these facts but non-empirical accounts indicate that much of the learning that occurs within these institutions in Pakistan employs ‘mimetic-pedagogy’ and rote learning mostly of religious texts. There is also anecdotal evidence that children studying in these institutions are typically from the poor and disadvantaged backgrounds and these factors can potentially help explain the low learning levels witnessed among this category of children in the ASER data41.
The regional differences observed in descriptive statistics are very much prevalent in the regression results. In particular, all provinces fare worse than Punjab with Sindh (and Balochistan) performing significantly worse than the richest province. Tables 3.3.1-3.3.4 present the empirical estimates for ‘higher order’ reading/literacy outcomes for children aged 5-16 using 2013 and 2016 data. The findings are similar to those reported for numeracy and similar drivers of disadvantage and inequity prevail for literacy as they do for numeracy with older, male children, those with better educated parents, better socio-economic backgrounds and living in Punjab and AJK and studying in private schools, performing better than their counterparts.
40 http://jworldtimes.com/jwt2015/magazine-archives/jwt2017/jwtnovember2017/madrassah-education-in-pakistan-some-insights/ 41 http://newlearningonline.com/new-learning/chapter-8/inside-pakistans-madrassahs

141
Table 3.3.1: Key Determinants of ‘Higher Order’ Numeracy Skills (Children Aged 5-16), Full Sample and by Quartile (Poorest and Richest) – ASER (Rural) 2013 (Marginal Effects from Probit Model)
VARIABLES Can divide (=1), child aged 5-16 years
Full sample Poorest children Richest children
Child age (years) 0.0755*** 0.0682*** 0.0869***
(0.00278) (0.00515) (0.00629)
Male (=1 if male) 0.0513*** 0.115*** -0.0204
(0.00900) (0.0201) (0.0177)
Father’s education (years completed)
0.0103*** 0.0149*** 0.0174***
(0.000950) (0.00211) (0.00195)
Mother’s education (years completed)
0.00707*** 0.0102*** 0.00982***
(0.00125) (0.00384) (0.00212)
Current class* 0.284*** 0.300*** 0.264***
(0.00322) (0.00612) (0.00710)
Government school -0.139*** -0.185*** -0.122***
(0.0105) (0.0271) (0.0185)
Madrasah -0.454*** -0.622*** -0.448***
(0.0600) (0.115) (0.152)
Other school* -0.175*** -0.289* -0.0210
(0.0551) (0.150) (0.0910)
wealthindex 0.0905***
(0.00536)
AJK 0.0159 0.0120 -0.00265
(0.0156) (0.0392) (0.0284)

142
Balochistan -0.377*** -0.564*** -0.241***
(0.0134) (0.0329) (0.0399)
FATA -0.0447** -0.256*** -0.209***
(0.0188) (0.0361) (0.0618)
GB -0.134*** -0.191*** 0.0180
(0.0188) (0.0417) (0.0541)
ICT -0.315*** -1.042*** -0.196***
(0.0484) (0.322) (0.0578)
KP -0.256*** -0.304*** -0.290***
(0.0127) (0.0329) (0.0236)
Sindh -0.651*** -0.736*** -0.546***
(0.0164) (0.0391) (0.0313)
Constant -2.411*** -2.429*** -2.388***
(0.0226) (0.0516) (0.0461)
Observations 147,124 39,937 31,645
Note: *the base category of school type is ‘private, and Punjab for the regional controls. Robust standard errors are denoted in parentheses. *** p <0.01, ** p<0.05, *p<0.1. regression is conditional on being enrolled in school.

143
Table 3.3.2: Key Determinants Of ‘Higher Order’ Numeracy Skills (Children Aged 5-16), Full Sample and by Quartile (Poorest and Richest) – ASER (Rural) 2016 (Marginal Effects from Probit Model)
VARIABLES Can divide (=1), child aged 5-16 years
Full sample Poorest children Richest children
Child age (years) 0.0351*** 0.0280*** 0.0278***
(0.00288) (0.00475) (0.00618)
Male (=1 if male) 0.0817*** 0.0395*** 0.189***
(0.00845) (0.0126) (0.0217)
Father’s education (years completed)
0.00591*** 0.00523*** 0.00581**
(0.000987) (0.00154) (0.00245)
Mother’s education (years completed)
0.00897*** 0.0120*** 0.0112**
(0.00123) (0.00166) (0.00448)
Current class* 0.314*** 0.317*** 0.335***
(0.00339) (0.00553) (0.00763)
Government school -0.0982*** -0.0766*** -0.0935***
(0.0101) (0.0141) (0.0308)
Madrasah -0.118** -0.386*** -0.0322
(0.0578) (0.0946) (0.111)
Other school* -0.157*** -0.181* -0.132
(0.0528) (0.0956) (0.116)
wealthindex -0.0300***
(0.00571)
AJK 0.573*** 0.491*** 0.760***
(0.0138) (0.0171) (0.0563)

144
Balochistan -0.335*** -0.223*** -0.400***
(0.0132) (0.0293) (0.0312)
FATA -0.335*** -0.549*** -0.339***
(0.0176) (0.0355) (0.0396)
GB -0.0767*** -0.129*** 0.0740*
(0.0180) (0.0303) (0.0424)
ICT -0.0631 -0.0523 0.509
(0.0701) (0.0803) (0.389)
KP -0.352*** -0.217*** -0.457***
(0.0132) (0.0199) (0.0351)
Sindh -0.613*** -0.625*** -0.586***
(0.0135) (0.0193) (0.0362)
Constant -2.160*** -2.069*** -2.243***
(0.0217) (0.0336) (0.0545)
Observations 163,452 64,204 32,248
Note: *the base category of school type is ‘private and Punjab for the regional controls. Robust standard errors are denoted in parentheses. *** p <0.01, ** p<0.05, *p<0.1, regression is conditional on being enrolled in school

145
Table 3.3.3: Key Determinants of ‘Higher Order’ Reading Skills (Children Aged 5-16), Full Sample and by Quartile (Poorest and Richest) – ASER (Rural) 2013 (Marginal Effects from Probit Model)
VARIABLES Can read story in Urdu/Pashto or Sindhi (=1), child aged 5-16 years
Full sample Poorest children Richest children
Child age (years) 0.0891*** 0.0809*** 0.100***
(0.00271) (0.00490) (0.00630)
Male (=1 if male) 0.00368 0.0447** -0.0563***
(0.00885) (0.0192) (0.0178)
Father’s education (years completed)
0.0122*** 0.0181*** 0.0157***
(0.000940) (0.00204) (0.00197)
Mother’s education (years completed)
0.00779*** 0.00144 0.0104***
(0.00124) (0.00374) (0.00215)
Current class* 0.285*** 0.289*** 0.279***
(0.00322) (0.00596) (0.00733)
Government school -0.189*** -0.153*** -0.192***
(0.0104) (0.0268) (0.0188)
madrasah -0.481*** -0.542*** -0.296**
(0.0555) (0.109) (0.134)
Other school* -0.120** -0.144 -0.198**
(0.0540) (0.134) (0.101)
wealthindex 0.0955***
(0.00526)
AJK 0.0564*** 0.125*** -0.00268

146
(0.0154) (0.0377) (0.0285)
Balochistan -0.407*** -0.501*** -0.322***
(0.0132) (0.0317) (0.0392)
FATA -0.397*** -0.554*** -0.554***
(0.0196) (0.0366) (0.0634)
GB -0.332*** -0.271*** -0.487***
(0.0187) (0.0406) (0.0558)
ICT -0.0827* -0.275 -0.000595
(0.0447) (0.317) (0.0536)
KP -0.456*** -0.460*** -0.549***
(0.0127) (0.0321) (0.0244)
Sindh -0.471*** -0.453*** -0.448***
(0.0153) (0.0355) (0.0305)
Constant -2.298*** -2.362*** -2.249***
(0.0220) (0.0496) (0.0457)
Observations 147,894 40,150 31,774
Note: *the base category of school type is ‘private’ and Punjab for the regional controls. Robust standard errors are denoted in parentheses. *** p <0.01, ** p<0.05, *p<0.1, regression is conditional on being enrolled in school

147
Table 3.3.4: Key Determinants of ‘Higher Order’ Reading Skills (Children Aged 5-16), Full Sample and by Quartile (Poorest and Richest) – ASER (Rural) 2016 (Marginal Effects from Probit Model)
VARIABLES Can read story in Urdu/Pashto or Sindhi (=1), child aged 5-16 years
Full sample Poorest children Richest children
Child age (years) 0.0435*** 0.0456*** 0.0320***
(0.00283) (0.00467) (0.00615)
Male (=1 if male) 0.0686*** 0.0375*** 0.141***
(0.00848) (0.0127) (0.0215)
Father’s education (completed years)
0.00450*** 0.00701*** 0.000800
(0.000993) (0.00156) (0.00249)
Mother’s education (completed years)
0.00808*** 0.0108*** 0.0142***
(0.00123) (0.00167) (0.00450)
Current class* 0.330*** 0.331*** 0.355***
(0.00341) (0.00559) (0.00777)
Government school -0.148*** -0.101*** -0.216***
(0.0102) (0.0143) (0.0305)
madrasah -0.108* -0.518*** -0.00187
(0.0592) (0.0990) (0.112)
Otherschool* -0.0454 0.0738 -0.308***
(0.0488) (0.0811) (0.113)
wealthindex -0.0467***
(0.00567)
AJK 0.477*** 0.374*** 0.761***
(0.0139) (0.0173) (0.0575)
Balochistan -0.387*** -0.317*** -0.489***
(0.0132) (0.0293) (0.0309)
FATA -0.559*** -0.741*** -0.508***
(0.0183) (0.0372) (0.0401)
GB -0.252*** -0.267*** -0.220***
(0.0184) (0.0313) (0.0437)
ICT 0.268*** 0.340*** -0.361

148
(0.0651) (0.0747) (0.418)
KP -0.417*** -0.264*** -0.579***
(0.0134) (0.0202) (0.0349)
Sindh -0.504*** -0.520*** -0.583***
(0.0133) (0.0191) (0.0356)
Constant -2.137*** -2.164*** -2.076***
(0.0213) (0.0334) (0.0530)
Observations 163,446 64,138 32,279
Note: *the base category of school type is ‘private’ and Punjab for the regional controls. Robust standard errors are denoted in parentheses. *** p <0.01, ** p<0.05, *p<0.1, regression is conditional on being enrolled in school
3.3.5. Stakeholder perceptions of education quality
Interviews were conducted from relevant personnel working at public and private institutions, NGOs, INGOs, donors and other relevant parties from Lahore (Punjab), Islamabad (Punjab) and Karachi (Sindh). A total of 18 interviews were conducted. Of these, 10 were from Senior Management and 8 were from mid-management. Along with this, the same questionnaires were administered to head-teachers and subject teachers at 2 high performing and 2 low performing schools, further segregated on the basis of urban and rural presence.
90% of the respondents defined quality of education as a measure of student learning outcome. Effective school leadership, frequent monitoring of learning and teaching, and less turn out of teachers were chosen as the most-oft used responses and were therefore considered as an important feature of an effective school. For an effective school head-teacher and teacher, motivation was the most common attribute selected by a majority of the respondents along with the need to focus on improving learning practices. All respondents were of the view that head teacher/principal along with subjects teachers are equally important for student learning. On identification of barriers to quality education at primary and secondary level, a lack of school leadership, lack of teacher motivation, medium of instruction, lack of facilities and a dearth of good teachers were highlighted as the most common factors perceived to contribute to poor quality schooling at both the primary and secondary education levels.
A majority of the respondents were also of the view that inequality in the education system exists mostly along gender domains, between students attending different types of institutions (private versus public) and the least amongst rural and urban students (government schools only). The respondents, however, believed that learning gaps have widened between high and low performing schools, amongst the rich and the poor and along gender lines mainly because of frequent posting of teachers, access poverty and a lack of facilities in schools for female students respectively. They also believed that funding for primary and secondary schools is not adequate and it should be increased particularly in providing further inputs and for ICT provision. Interviews were conducted from government officials and head teachers/teachers from government school but responses for both the groups on quality of education were more or less the same. However teachers were also of the view that funding should be increased in the areas of training and material development for teachers and reducing the class size by having more teachers.

149
Respondents suggested that the country can definitely adopt the models that are successful elsewhere and should work on homework management techniques, student centered learning, programs for teachers’ attachment etc. in order to improve student learning. All reflected that madrasahs should be definitely mainstreamed and that they play a significant role in educating children specially belonging to poor households.
3.3.6. Conclusion
At the heart of any education enterprise is the question ‘are ALL children learning?” Access and schooling can only be successfully sustained if quality is pursued actively. Pakistan remains off target on access mainly on account of quality challenges. As increasing evidence mounts on learning across the education spectrum through both citizen led and government high stakes assessments, there is an urgency to develop equity and implementation focused action plans. These are to be fully backed by government resources mainly through domestic financing and new partnership arrangements that yield value for money, and measurable outcomes that are reported publicly sensitive to income differentials and inclusion. With the 2017 census results coming in and poverty score cards generated by BISP for targeting of the poorest, Pakistan needs policies and actions based on ‘progressive universalism’ (Education Commission 2016), whereby the most vulnerable groups have access to quality education opportunities and teachers deliver learning through an equity lens.
3.3.7. Recommendations
Taking into considerations findings from the analysis of the determinants of student achievement and stakeholder perceptions of quality education, following recommendations are made to achieve the target of inclusive and quality education in Pakistan.
First, the principle of ‘equity and inclusion’ where the poorest are targeted to enroll and learn on priority In Pakistan, as revealed by ASER data annually the poorest girls remain 7-20% behind poorest boys in learning and access within the same quartile; it is these gaps that need to be bridged in a targeted manner that will demonstrate positive results to investment.
Second, a culture of evidence based reforms and ‘deliverology’ for results has to be made part of ministries and departments of education and literacy in Pakistan to clear the backlog of poor performance. The education reforms narrative has been deeply embedded in the political narrative linked with a five year political/elections cycle. With better and regular evidence, policy reforms need to coincide with annual fiscal cycles at local and sub-national levels pushing for result based actions and transformations. Data driven regimes have been established in all provinces of Pakistan with technology enabled governance initiatives; such as biometrics, real time monitoring on key parameters of reforms and learning challenges, giving hope that policy is not a one-time milestone but can be far more iterative and upgraded within systems. The mentality events based policy rhetoric needs to be replaced by sharp results based actions for bridging gender gaps in learning, access and other implementation challenges.
Third, Pakistan’s education system is committed to the twin pillars of 25 A and SDGs/SDG 4 with agreed indicators, which needs regular tracking and reporting on right to quality education as a public good. The education sector can benefit from accountability driven regimes spurred by technologies for real time reporting, deepening democratic processes and holding decision makers to account for delivering human development. In all provinces real time monitoring has been introduced through tech enabled governance systems that range from biometrics (Sindh) together with monthly third party monitoring that provide the evidence for district rankings on

150
given indicators (Punjab/Sindh/KP). Punjab is more advanced on the governance dimension pushing for tech enabled governance improvements as data for public good. The Punjab Information Technology Board (PITB) is the IT-arm of the Government of Punjab, Pakistan. With a population of 110 million the province has many information, services and governance challenges.
As a core strategy, PITB leverages mobile technologies and open-source platforms to design terrain-viable solutions for real-time monitoring, on-spot assessment, and citizen feedback. Their tablet-PC and smart-phone based systems enable thousands of government officers across the province to capture and reliably share monitoring and evaluation information every day. This steady stream of data is automatically consolidated in real-time, and made available to decision-makers as actionable information in the form of SMS-alerts and online dashboards. Similarly, in Sindh ILMI is a public complaint system for education in Sindh that has been successful in pushing for action as a response to citizens's complaints.
Fourth, whilst learning needs to be measured regularly, disaggregated and sensitive to the most vulnerable, data needs to be made freely accessible to citizens. This evidence must drive interventions for high performance on what works for quality and what does not. Public policy and planning driven by evidence based culture to drive performance, innovations, inclusion, and right level of financing for results at the school, district, sub-national and national levels will make ‘learning’ everyone’s business. Recently, Punjab began an initiative through its third party monitors called the Monitoring Education Assistants (MEAs) all 950 of them who visit a school each month for verification on many 'functioning and governance" indicators of schools. MEAs traditionally used paper-forms to fill out visit reports, and would submit them to district administrative staff – who would subsequently summarize the data into ‘excel sheets. While the paper-based reporting approach served as a means of collecting and storing lots of paper, the traditional data-tabulation process was inherently delay-prone and open to several layers of operator errors and potential data manipulation.
To offset this in 2014, PITB introduced an innovative ICT-based solution for school monitoring and student assessment providing MEAs with low-cost tablet-PCs, and purpose-built Android-apps for real-time data capture. With access to Hence, these solutions have been rolled out at mass-scale. Since August 2014, over 1 Million school-visit and 2.2 Million student assessments have been logged into a central online reporting system. MEAs have real-time access to a central question-bank mapped to students learning outcomes in Urdu, English and Maths. MEAs select random questions for grade 3 and SMS-alerts for stakeholder. These tablet-based systems have become an integral component of Punjab’s multiyear School Reforms Roadmap. These systems now fuel the Education Stock-take presentations on quality, access and equity made to the Chief Minister and Chief Secretary every eight weeks.
Fifth, teachers’ competencies and knowledge remain a challenge when it comes to working with the most excluded and poorest. On the one hand child centered pedagogies integral to pre and in-service programs in Pakistan need to translate into active practice, and, on the other, teachers need to develop attributes of nurturing and care. They also need to be sufficiently competent and knowledgeable to be able to deliver the requistive learning to children. A recent World Bank study in Pakistan has noted the deeply unsatisfactory levels of teacher competence in rural Punjab and more worryingly the inability of teachers to transfer their own knowledge effectively to their pupils (Dhundar et al. 2014). This finding is reiterated by Aslam et al. (2016) who find a noticeable lack of content knowledge and inability to explain the curriculum as well as a poor ability to spot mistakes made by students. Teachers themselves are found to acknowledge that

151
they have difficulties in Mathematics teaching further highlighting an often raised concern with a lack of subject specific teachers (This coupled with the fact that policies often presume a given level of skill amongst teachers has resulted in several policies not achieving the desired outcomes. For example, the medium of instruction policy in Pakistan would have benefitted greatly had teachers been initially consulted and subsequently given the requisite training. It is unfair to expect teachers to deliver on the weighty expectations of policy without appropriate apparatus and support. Policy makers are duty bound to ensure adequate provision of this at the design stage and a crucial aspect of that is to involve teachers from the start (Aslam et al. 2016).
Sixth, prioritizing gender equality and equity in access to education is much needed. While gender disparities in educational attendance have narrowed globally, girls are still more likely to be out of school. Around the world 8.1 percent of boys are out of school as opposed to 9.7 percent of girls at the primary school age. Improving women’s education has positive impact on economic growth and employment outcomes, as well as incurring positive effects for the society in general. Female education contributes to a better home environment for child development. More educated women tend to follow a better diet which also ensures children are well-nourished. Children of better educated mothers are also more likely to attain higher levels of education. Therefore, gender equality in education should be given place as a priority in national strategies and plans, and girls should be targeted specifically in the education programmes.
Seventh, the level of malnutrition and stunting is highest in Sindh (48%) with prevalence in some districts of Punjab. The government of Punjab has recruited Health and Nutrition supervisors (H&NS) in rural areas attached to a cluster of primary schools. Sindh has recently embarked on a multi-sectoral program called “Sehatmand Sindh (Healthy Sindh)” targeting children and mothers from 0-5/6 years driven by the Planning & Development (P&D) Board, but its roll out remains slow. Health screening, immunization, parental /community awareness, referrals to next tier facilities/care and nutrition at the school level needs strong champions and believers that bring more visible results through inter-departmental collaboration. Health and nutrition remain peripheral initiatives, given the large prevalence of challenges including stunting and low learning milestones for children In Pakistan.
Amongst all these challenges, there are examples of good practice in the country. In particular, the there are opportunities that exist for the government to form effective and meaningful partnerships with non-state providers (such as madrasahs in some areas and private providers in others) that can help the government deliver on key educational policies. There are many positive examples of PPP relationships in Pakistan that appear to be producing positive outcomes and which can be emulated and replicated across the OIC context with adapation.

152
Nigeria
3.4.1. The Educational Landscape of the Country
Structure of Basic and Secondary Education System
Nigeria operates a modified version of the 6-3-3-4 system of education (six years of primary education, three years of junior secondary education, three years of senior secondary education and four years of tertiary education). The UBE provides a free and compulsory basic education, which consists of primary and junior secondary levels of education and leading to the restructuring of the country's education to a 9-3-4 system. A special category of the post-secondary education system, Colleges of Education which award Nigeria Certificate in Education (NCE), are responsible for basic education teachers' training while secondary (especially senior) school teachers are trained by the accredited faculties of education in the universities. The Nigerian education system is decentralized, which allows various categories of providers to establish and manage schools in the country. In the 1999 Constitution of the Federal Republic of Nigeria, education is on the concurrent list, which implies that each of the three tiers of the Nigerian government has roles to play in education. In practice, the Federal government is responsible for issuing educational policies and standards while the responsibility for managing the basic education sector lies with the state and local government. Both states and Federal government establish and manage senior secondary and tertiary education institutions. The Ministry of Education (MoE) has more than twenty agencies through which it implements various components of education policies. These agencies have conflicting and duplicated responsibilities that are not adequately defined. The Universal Basic Education Commission (UBEC) is responsible for coordinating the implementation of the basic education sector while the Department of Basic and Secondary Education within the MoE that has the responsibility for ensuring efficient and effective implementation, monitoring and evaluation both basic and secondary education sub-sectors. At the State level, these agencies are duplicated. The State Universal Basic Education Boards (SUBEB) are state structures of the UBEC and responsible for ensuring implementation of the UBE in the states under the supervision of the State Ministries of Education (SMoE). The UBE is coordinated at the state levels by the SUBEBS together with the Local government Education Authorities (LGEAs). Besides supervising the SUBEBs, the SMoEs finance its payroll and recurrent costs. Other subsectors, such as the university and colleges of education, have their respective coordinating agencies. Another important element of the decentralization in the education sector is the freedom to establish and manage different kinds and levels of schools by non-state providers. Thus, state and non-state, formal and informal, circular and religious schools exist side by side and giving parents diverse options for their children's education. Major categories of these schools are:
Public primary and secondary schools (formal), including special needs and technical schools.
Private and for-profit primary and secondary schools (formal) Private not-for-profit primary and secondary schools (some of these schools are formal
and often, but not rigidly the case, cater for special categories of learners such as special needs and people with disabilities and are largely established by non-governmental organisations

153
Religious schools (often categorized among public schools in government data and as such no special categories have been made for them in the Nigerian Digest of Education), include Christian and Islamic schools. Little is known about spread Christian religious schools at basic education level in Nigeria other than those that offer formal curriculum and are counted in the education digest as private schools. Contrarily, there are different kinds of Islamic schools: those that offer formal education curriculum and Qur’anic schools. There is a third category, which is an integrated Qur’anic school. Within the Qur’anic school system, both integrated and nonintegrated, three kinds exist: Qur’anic, Islamiyya, and Tsangaya (see section 2.8)
Notwithstanding, basic education is declared free and compulsory for children between five and fifteen years old in Nigeria.
3.4.2. Major Education Reforms
The development and various reforms in Nigeria's education sector have been widely influenced by global dynamics and international organisations. The foundation of Nigeria's education system was laid in the pre-colonial and colonial era, with the various colonial ordinances from 1882 up to the establishment of regional education laws in 1954. Various post-independent education reforms were largely adjustment to make education serve development needs of the country and also fit into various international conventions on education. In the basic education sub-sector, the early post-independent reforms (including some 1966 to 1979 education edicts) were largely regional affairs and were marked by a take-over of schools by governments from individuals and non-governmental organizations, an institutionalization of school management boards and unification of teaching service (Fabunmi, 2005; Imam, 2012). This was a period of initial nationwide effort to accelerate universal access to education through the Universal Primary Education (UPE) programme. Other key features of the first two decades of the country’s independence were efforts by the government to control and regulate education, convening of a National Curriculum Conference in 1969 to review and reorient national education goals, nationwide enrolment campaign through the UPE and, promulgation of a National Policy on Education in 1977 that has been regarded as Nigeria’s first indigenous policy on education and subsequent integration of the new education policy direction in the 1979 Constitution (Imam, 2012). The 1979 Constitution particularly supported the provision of education for everyone and ensuring equal educational opportunities for everyone at all levels. Nigeria began a nationwide provision of universal primary education in 1976 with the aim of closing regional and gender gaps in education. In 1999, a Universal Basic Education (UBE) was introduced (formalized with the enactment of the UBE Act in 2004), which seeks to achieve both the national objective of closing the gender and regional gaps as well as achieving existing global targets, such as the Education for All (EFA) and Millennium Development Goals (MDG). Another influence of the international agenda on the Nigerian education is the association of the National Policy on Education (NPE) with the 1960s pan-African educational reform movement that promoted educational reform as part of the broad nation-building strategies of Africa countries that emerged from colonialism (FME, 2011). The NPE has been severally reviewed in relation to more recent global agendas such as the Education for All (EFA) and United Nations Millennium Development Goals (MDG); the most recent version, 6th edition used in this report, was released in 2013 (see FME, 2013). The return of democracy in Nigeria in May 1999, contributed to bring the country fully into the mainstream global education strategies, which influenced the introduction of a Universal Basic Education (UBE).

154
The UBE is particularly linked to the Jomtien Conference declaration on Education for All (EFA) in 1990. It expanded the UPE provision from 6 years of primary education to 9 years of basic education. The programme was launched in late 1999 but the necessary legal framework was put in place in 2004, as the UBE Act (the Federal Republic of Nigeria, 2004). It provides nine-year free, compulsory and uninterrupted access to basic education for all Nigerian school-aged children, providing one year early learning, six years primary and three years junior secondary education. The UBE Act makes it a punishable offence to impose financial charges of any kind in public primary and junior secondary schools. Refusal to send children to school and withdrawal of children from school were also made punishable offence. However, these are rarely enforced and "primary education in Nigeria, to date, has never been universal, free, compulsory or basic" (Urevbu, 2006:2). Diverse policies and strategies have been advanced since the year 2000 to realize the objectives of the current UBE and are supported by different international donor agencies. Some of these strategies are summarized below (see also as UBEC, 2015).
1. Teacher Professional Development is directed towards improving teacher quality and ultimately the quality of basic education. The programme provides in-service training and mentorship for teachers, provides a framework for assessing teachers' needs, capacity and impact of training on their practices, and learning outcomes. Different donor-supported projects provide diverse forms in the implementation of this strategy. These projects include DFID-funded Teacher Development Programme (TDP) and Education Sector Support Programme in Nigeria (ESSPIN), Japan International Cooperation Agency (JICA) supported SMASE, British Council, UNICEF and the USAID-funded Northern Education Initiative.
2. Provision of Infrastructural and Educational Materials: the UBEC provides infrastructural and instructional materials to public basic education schools across the country through direct grants to the states. However, inequitable distribution of the materials, poor record-keeping and lack of routine monitoring remain major challenges of this strategy.
3. Integrated Islamiyya Quranic and Tsangaya Education: in the northern Nigeria very large population of children are out of formal education but are enrolled in Islamiyya Quranic and Tsangaya schools. As part of the effort to ensure that every child has basic education, the Federal Government established integrated Quranic education component that integrates core formal education curriculum subjects with the Islamiyya Quranic and Tsangaya Education (IQTE) system. A National Committee on Implementation of Almajiri Education was alsoset up in 2010, following up to the Ministerial Committee on Madrasah, with the aim of ensuring that Qur’anic schools children are integrated into the Universal Basic Education Scheme, strengthen teaching capacity of the Qur’anic schools, mainstream core elements of basic education into the Qur’anic education system in order to provide learners with formal education without interfering with their Qur’anic learning system and, enhance social mobility of students in the integrated Qur’anic school
4. Integrated Almajiri Education Programme: this intervention does not significantly differ from the integrated Qur’anic education programme but it is specifically directed towards providing basic education to almajiri children who are considered to be street

155
and out of schools children by Western education standard; they are treated separately to capture specific peculiarities of the almajiri (see section 2.8).
5. Girl-child Education Programme (GEP): GEP's programme include, inter alia, girls ‘education enrolment campaign, conditional cash transfer for poor households to enable them to release their girls to attend schools, Female Teacher Trainee Scholarship Scheme (FTTSS) that support teacher education of women in rural areas and raise role models for girls education in rural areas. It particularly inspired many other interventions, wider support and state commitment to girl’s education. The country’s Gender in Basic Education Policy was produced as an outcome of GEP (FME, 2007). Major components of the GEP are largely funded by DFID and implemented by the UNICEF in five northern states (Bauch, Katsina, Niger, Sokoto and Zamfara states). The DFID-funded ESSPIN also targeted promoted girls education in Jigawa, Kano, Kaduna, Kwara, Enugu and Lagos states.
6. UBE Boy-child Programme was designed to address diverse categories of out-of-school boys, especially in the southeast and south-south where there has been historically low male secondary school enrolment because boys tend to withdraw from school to engage in different kinds of business activities. Information from the literature suggests that the programme has not deeply taken roots like the GEP. It seeks to provide special vocational education as part of the broader UBE programme.
7. Home-Grown School Feeding and Health Programme provide at least one meal a day for pupils in schools as a way of promoting school enrolment, retention and completion. It has been implemented in 12 states (Bauchi, Cross River, Enugu, Imo, Kano, Kebbi, Kogi, Nasarawa, Ogun, Osun, Rivers and Yobe) and the Federal Capital Territory but was not sustained in all the pilot states. Some states like Kaduna have also taken up the intervention with a great measure of success in pupils enrolment but it is not clear if pupils are able to remain and complete their basic education (Ibrahim, 2017). Among the almajirai, it produces mix results as pupils tend to leave school after the meals to beg alms (Usman, 2008; Ezegwu et al. 2017).
8. School-Based Management Committee (SBMC): In 2005, the National Council on Education approved the establishment of School-based management committees (SBMCs) in Nigeria primary and secondary schools. This step was influenced by the implementation of the DFID-funded Girls Education Projects (GEP) and Education Sector Support Programme in Nigeria (ESSPIN) as well as other gaps observed in the community participation in education, funding and teaching quality concerns in schools (Poulsen, 2009; Adediran and Bawa, 2009; Humphreys and Crawfurd, 2014). By design, a unit of the SBMC supposed to include the head teacher, elected community representatives, female and youth representatives as well as teacher and pupil representatives. The committee’s function includes promotion community participation in governance, contribution in school quality improvement and closing of the gap that existed among relevant stakeholders in school management decision making and evaluation such as the school authorities, the host community and the government. However, the SBMC is not widely effective across the nation but has been successful in places where they are functional, they have some relative success in raising funds for their schools, serving as community voices in school governance and promoting quality and accountability (Dunne et al. 2013; Humphreys and Crawfurd, 2014).

156
9. Conditional Cash Transfer: this was designed to encourage rural poor households to enrol and retain their children in schools. Beneficiaries are identified through local school communities and SBMCs. The fund is also directed towards the provision of some infrastructural development of rural community schools. The strategy has been part of the DFID-GEP and has been adopted and expanded by the government.
10. Female Teacher Trainee Scholarship Scheme (FTTSS) provides a scholarship to rural women to undertake teacher education training under an agreement that they would be posted to rural areas to teach in schools and serve as role models to girls. The project also began as part of the GEP project but the government and other NGOs have also joined in some states to implement it (Dunne et al, 2014).
11. Second Chance Schools provide an opportunity for adults especially women that did not have the opportunity to go to school or initially dropped out from schools to enrol and acquire formal education.
12. Community Accountability and Transparency Initiative (CATI): According to UBEC (2015), the CATI was initiated to ensure transparent implementation education programme and running of educational institutions. It enables stakeholders’ to ask questions and evaluate education programmes and institutions in their areas by comparing the publicly released information on achievements of states with the realities on the ground and contribute in ensuring improved service delivery and transparency. However, the scheme was not sustained due to weak political will and funding (Oyefuga & Adefeso-Olateju, 2017).
Another area of important strategy relates to curriculum development. As a result of widespread criticism of the basic education curriculum that was considered to be both outdated and overloaded and outdated, which also laid overemphasis on knowledge transmission instead of skill acquisition, a revised basic education curriculum was launched in 2012 to take care of the shortcomings (Humphreys and Crawfurd, 2014). Minimum teacher education standards were also developed in line with the new basic education curriculum. While it appears too early to evaluate the UBE curriculum, a major challenge is that the relevant teacher education curriculum was only revised in 2012 and most of the existing teachers lack requisite training and experience in the new curriculum (Unterhalter et al. 2017). Poor system of teaching has been reported as a contributor in the non-enrolment, school dropout, truancy and poor performance in public schools and tends to induce pupils’ movement from public to the private schools in Nigeria (Hardman et al. 2008; Davison, 2010). Recent donor-funded initiatives are contributing to stimulating some modification toward learner-centred and interactive teaching approach but on the part of the teachers, there has been relatively low motivation and in-service training. While more than half of primary school teachers (56.4) attended in-service training in the past five years preceding a 2011 UBE survey, higher percentage of them (59.1%) surveyed received between $27.78 $and 108.33 as their monthly salary (UBEC, 2013). Other initiatives that seek to increase access to education for the poor, especially girls from the poor households include abolition of school fees in in Jigawa State (Jigawa SMoE 2010); provision of financial and material assistance, scholarships, uniforms and text books in many states (Chege et al. 2008; Adediran 2010; Jigawa SMoE 2010; Dunne et al. 2013; ESSPIN 2013); household mapping of school aged children, encouragement of households to enroll their children in school, monitoring of students and pupils attendance by NGOs and communities in Bauchi State (Chege et al. 2008; Coinco 2012); provision of alternative opportunities for pupils

157
to hawk during school breaks and after school hours in Bauchi State (Chege et al. 2008; Gabresek & Usman 2013); establishment of girls clubs (ActionAid 2012); Improvement of school infrastructure such as sports facilities, water and sanitation facilities by communities, government and donor agencies (Chege et al. 2008; Okojie 2008; UNICEF 2012; ESSPIN 2013) and; increasing the number of integrated Qur’anic and Islamiyya schools especially across the northern Nigeria (Chege et al. 2008; Okojie 2008; Humphreys and Crawfurd, 2014). The influence of international donor organisations on the country’s recent education policy reforms and interventions are very much evident. Many of the important UBE strategies in Nigeria are significantly externally driven and supported International Development Partners (IDPs). Besides projects that are directly supported by IDPs in Nigeria since the early 2000s, various state strategies and policies have been influenced by them. For example, the country's Gender in Basic Education Policy evolved from an ongoing DFID project. The document acknowledges that "This policy was developed in the context of the Girls' Education Project, developed in 2005 and implemented by the FGN, DFID and UNICEF as a contribution to the pursuit of EFA/UBE" (FME, 2007:3). Interventions like Conditional Cash Transfer, Teacher Assessment and Development Programmes, Female Teacher Trainee Scholarship Scheme (FTTSS), Annual School Census and School-Based Management Committee that contributes to shaping civil society's participation in education management and decision making also were inspired by international donor projects. Similarly, while the Nigerian tertiary education sector is largely underfunded, various policy-oriented research projects are mainly funded or undertaken by international donor-supported projects across Nigeria (see Humphreys and Crawfurd, 2014; Ezegwu, 2015; Gershberg et al., 2016; Unterhalter et al, 2017). These reforms are largely national but some are largely implemented in particular locations that have much of specific category of children: boys education is largely in the southeast, where there has been historical low male secondary enrollment (Ezegwu, 2012); Girls Education Project is implemented in northern states where early marriage and other gender practices inhibit girls’ educational development and; almijiri education programme is mostly implemented in the northern Nigeria that have very large number of almajiri children. The IDPs intervention projects that link to such reforms are also specifically implemented in locations where interventions are need and in line with the IDPs’ initiatives (UBEC, 2015). An important observation about the reforms is frequent changes in policies and strategies. For example, within an eight-year period, 1991-1999, there were five different political regimes, which had eight Ministers of Education. Each regime and Ministers had varying perspectives of educational development leading to frequent policy changes (Odukoya, 2013). The Community Accountability and Transparency Initiative (CATI): was a very important strategy for promoting transparency and accountability in education but it was scrapped as soon as the Minister that promoted its establishment left office (Adediran, 2015). The education provision across sectors and geopolitical zones
Nigeria is liberal in terms of freedom to establish and manage educational institutions. Section 40 of the National Policy on Education (FME, 2013) states that "Government welcomes the participation of voluntary agencies; communities and private individuals in the establishment and management of post-basic education provided the set standards are met". Providers of education in Nigeria vary. Accurate statistics on Nigeria schools are scarce. While Annual School Census and EMIS document schools by their ownership at various levels, unreliable nature of

158
the data has been documented suggesting caution in the use of the data (Humphreys and Crawfurd, 2014). Also, schools are usually categorized as public and private, within each category are other sub-categories. In the public sector, there are Federal schools, State (sub-regional) schools and Local Government managed primary schools. The private category includes religious, commercial schools, not-for-profit/charity schools and community schools. The non-state category also includes formal, non-formal and special schools. Many of the for-profit school offer secular curriculum while faith-based schools include those that offer both formal and non-formal curriculum. The state provided basic education is free but households still bear costs of providing school uniforms, transport, books, examination fees and other occasional levies. Various initiatives have been introduced to lower education costs and increase access but these are largely donor-driven. Some of the examples are a free primary school uniform, provision of instructional materials, transport support, the supply of sanitary pads to schools, school grants and conditional cash transfer. These initiatives are not evenly implemented and most of them are implemented in very few states (Coinco 2012; Pinnock 2012; UNICEF 2012; Dunne et al. 2013; Humphreys and Crawfurd, 2014). Despite the subsidization of state schools, households are increasingly embracing non-state primary and secondary schools where they pay varying ranges of fees. The government’s definition of private sector refers to anything besides the government, including for and not-for-profit schools. The Nigeria Digest of Education Statistics (NEDS) shows that there were 34717 private primary schools (public primary schools were 62184) and 20313 private secondary schools (public secondary schools were 12520) in Nigeria in 2015/2016 academic year but studies in Lagos and the Kwara States indicate that the number of private schools in NEDS is often far lower than the actual number of private schools in the country (Härmä, 2011a,b; FME, 2017). A study in Kwara state shows that the number of private schools was three times the number that is officially recognized and listed in the annual school census (Härmä, 2011c; Humphreys and Crawfurd, 2014). The report of the Lagos private school census indicates that almost 60% pupils are enrolled in private schools irrespective of the higher cost of private schools and 77% of the private schools lacked government’s approval, implying that they operate illegally and unknown to the government or without any state record (Härmä, 2011a,b). Reasons highlighted in a number of independent studies for choosing private schools over public schools by households relate to the inability of the government to provide sustainable access to quality education and a prevailing belief among parents that such schools offer higher quality learning experiences and opportunities to their pupils (Tooley and Dixon, 2005; Härmä, 2011a,b; Adefeso-Olateju, 2012; Humphreys & Crawfurd, 2014). A number of studies suggest that private schools tend to have better basic infrastructure and supplies than public schools and, private schools teachers spend more time in their jobs than in public schools (Tooley and Dixon, 2005; Keating 2007). Reasons provided for the choice of private education in the 2015 Nigerian Education Data slightly differ at the primary level but are similar at junior secondary level. Factors influencing school choice also vary across geopolitical zones, rural-urban locations and different economic quintiles (NPC & RTI, 2016). According to the NEDS, proximity/available space tops the list of reason poor households, residents in poorer zones and rural dwellers chose schools for their children at primary level. Proximity if seconded by the quality of education. A total of 61.7% of rural dwellers (32.1% for urban), 67.8% and 74.0% of northeast and northwest

159
respectively (25.6% in the southwest) and 79.7% of the poorest households (15.7% for the richest households) chose school for their children based on proximity with available space (see Appendix Table B1). At the junior secondary school level, quality and proximity were the highest percentages of reasons for choosing a school across various socioeconomic categories. The poorest households (58.7%) that lack means of transport and the two poorest zones in Nigeria were largely influenced by proximity. Rural areas (46.7%) also considered proximity more than the urban areas (22.9%) in the choice of schools. These suggest that poverty tends to limit the choice of the poorer households and localities in choosing schools for their children. The northeast, which has been heavily affected by insurgency has the highest level of security consideration in the choice of schools with (1.5%) and the richest households (1.1) had highest level of security consciousness in the choice school than any other category (see Appendix Table B2) (NPC & RTI, 2016).
The non-state education providers also vary in terms forms, providers and focus. They include for-commercially driven schools, faith-based schools, charity-run schools and community schools. The most prominent among them is commercially driven schools, which are of two categories, relatively elite and low-cost schools. Low-cost schools, which is often small and serving a bespoke community, provide poor households alternative to public schools (Härmä, 2011a). As Lagos school census highlights, while the majority of private schools are established and operated by individuals, there exist about 5% that b e l o n g t o faith-based organisations including about 3% that offer an Islamiyya integrated education (Härmä, 2011a,b). Religious groups are important providers of education in Nigeria. While missionaries led the introduction and expansion of formal education in Nigeria, limited information exists on the prevalence of primary and secondary schools provided by churches. Although a large number of churches still operates schools currently despite the earlier takeover of their schools by the government in the 1970s (and some states are handing over some of these schools back to churches) there is a scarcity of organized and comprehensive data around them. There is relatively more information in the literature on formal and informal Islamic schools, which are discussed in section 2.8 and 2.9. In Kano State, the number of Islamic schools has been reported to be eight times higher than the number of formal secular schools but these are rarely fully captured in EMIS because many of them do not offer circular curriculum (Antoninis, 2012; Humphreys and Crawfurd, 2014). Issues around equity and cost are major concerns about private schools. Analysis of the 2010 NEDS by Humphreys and Crawfurd (2014) shows that costs per pupil in non-state schools are far higher than whatever additional cost households bear to attend public schools. However, there is a tendency for pupils in private secondary schools to complete a six-year curriculum in five years (Härmä 2011a; Humphreys and Crawfurd, 2014). The study by Härmä (2011b) in Lagos shows that an average total cost of attending a government approved and unapproved private schools in Lagos in 2011 were about 48% and 20% respectively of the total minimum wage while. Poorest households found it difficult to bear such costs. The costs tend to deter poorest households from enrolling their children in even the low private schools. Another aspect of equity relates to teachers’ salaries. Härmä (2013) notes that some private schools paid their teacher three times as much lower (lower than $40 monthly) than state schools ($130 monthly). Yet, the public school teachers tend to be more qualified and have better job security than private schools (Härmä 2013). Because private school hire and fire teachers at ease, in addition to the direct monitoring of the schools by the school owners, private schools teachers tend to

160
commit more time and make extra effort to deliver their services than public schools’ teachers that have been observed to have more tendency to exhibit truancy (Humphreys and Crawfurd, 2014). The role of civil society
The role of civil society in Nigeria education varies and includes funding, direct provision of education, advocacy, research monitoring and evaluation of various aspects of the country’s education. Private provision of education has been discussed in section 2.4. Other contributions of the civil society are largely in forms of civil society organizations and communities’ services. The civil society organisations (non-governmental organisations) implement a wide range of locally initiated and donor-driven projects such as listed in section 2.2. Two important examples of community support primarily are informed of Parent Teachers Association (PTA) and School-Based Management Committees. As noted earlier, SBMCs contribute to ensuring good relations exist between schools and their host communities, serve as an avenue for channeling community inputs in school administration, funding, monitoring and evaluation. The PTAs are much older than the SBMCs and particularly contribute to ensuring smooth operations of schools, recruitment of additional teachers and provision of financial, labour, infrastructural and material support to schools. Pupils pay PTA levies through which these provisions are made to schools (FME 2005; Dunne et al. 2013). The PTA sometimes recruit and pay salaries of teachers they recruited (Theobald et al. 2007; Dunne et al. 2013). The introduction of the free UBE scheme in principle barred PTA levies in public schools but available reports indicate that they remain widespread (Lincove 2009; ActionAid 2011; NPC and RTI International 2011; Dunne et al. 2013).
There are diverse opportunities for public-private partnership (PPP), which refers to a form of collaboration between the public and the private sector, in the provision of education in Nigeria but limited are records of successful partnerships, besides international donor-supported education project partnership. Irabor (2014) explains that the development of PPPs in Nigeria has been slow because while the government reiterates some shortage of private sector with a strong interest in investments, the private investors are concerned about the business environment. The National Association of Proprietors of Private Schools (NAPPS) demanded inclusion of private schools in the UBE funding plan in 2009 but this seems mainly a demand for government funding of their school and appeared not to be a request for requisite PPP (Adefeso, Olateju, 2012). Known forms of existing PPP are largely temporary such as Educate a Child (EAC) that involves Oando Foundation, different forms of short-term training and capacity building projects with non-governmental organisations, digitization digitization and technology training in Nigerian schools, research and, teacher training and capacity building (Oni, 2012; Dunne et al, 2014; Gershberg et al, 2016; Obi, 2016; Vanguard, 2017). Islamic education
Islamic education and Arabic language were integral parts of the Islamic religion that was introduced in Nigeria in the 14th Century. Islamic education constitutes a major form of religious education in Nigeria. The National Policy on Education, section 26.1, provides that “State Governments and FCT shall ensure the integration of formal basic education curriculum into Qur’anic and Islamiya schools, and Special Needs schools” (FME, 2013). The Nigerian Education Data Survey (NEDS) observes that 44% of Muslim children attended both religious formal schools while 35% attended only religious schools and 11% was enrolled in formal schools only. 10% was not enrolled in any school at all (NPC & RTI, 2011). Qur’anic, Islamiyya, and Tsangaya

161
are three main types of Islamic schools in Nigeria of which 79% of Muslim children attended at least one of them. As summarized in Appendix Table 3, a majority (57%) attended Qur’anic schools 38% attended Islamiyya while 5% attended Tsangaya schools. Qur’anic schools teach recitation and memorization of the Qur’an under four main educational levels: kotso (nursery stage), tittibiri (elementary stage), k’olo (middle-level) and, culminates (higher level). The Islamiyya is structured to provide advanced religious education that combines Qur’anic scriptural instructions and legal subjects. There currently exist some kinds of traditional and integrated Islamiyya schools. The traditional kinds are largely extensions of Qur’anic schools while the Integrated Islamiyya schools offer some selected circular academic subjects such as English, mathematics, science and social studies. The Tsangaya schools are learning centres in Hausa language and are accompanied by itinerant or boarding institutions that serve mainly males (NPC & RTI, 2011).
The 2015 NEDS shows that 85% and 91% of children in northeast and northwest are Muslims of which 29% and 35% respectively attended only religious schools a 29% and 44% respectively attended both formal and religious schools in 2015 (see Appendix Table B7). In the north-central and south-west, less than half (43% in the north-central and 38% in the south-west) of the children were Muslim and much less percentage attended religious only schools. Information was not available for the Southeast but in the south-south, only two percent of the children were Muslims in 2015. One remarkable trend in the NEDS data is the decreasing number of a number of Muslim children and their participation in religious schools across various geopolitical zones down from 2010 records (NPC & RTI, 2016).
An early grade reading and arithmetic assessment in Bauchi and Sokoto states shows that pupils in integrated Quranic and Tsangaya schools recorded high scores in both English and Hausa reading (they were better in Hausa reading) and mathematics in comparison with other schools though general performance was low (USAID (2013), see further discussion on this in section 4.3.
While the initiative to integrate Western education with Qur’anic in Nigeria began in the 1920s, various challenges have made it not generally successful some of these challenges are (i) resistance from Qur’anic education proprietors to the integration of their centres due to their preference for the pristine and purity of Islamic tradition and prevention of contamination by circular affairs, poor supply of infrastructural facilities in the schools, parental rejection of and negative attitude towards Western education (Adediran, 2015). Almajiri Education
Over the years, the practice of Islamic education in Nigeria mixed with local tradition and produced widely misunderstood and discriminated category of young people aged between five and 15 years old in Nigerian streets that are currently called the almajiri (almajirai in plural). The term came from the corruption of the Arabic ‘al-muhajirin’ or ‘almuhajirun', which referred to ‘emigrant', including those that migrated for learning purposes. In the context of northern Nigeria, it refers, as Hoechner (2011: 719) explains, to “pupil, student, learner of Koranic school”, and also “destitute or poor person”. The Almajirai are distinguishable in most northern Nigerian towns with their poor dresses and plastic bowls for begging alms. Traditionally, the almajiri are considered as itinerant Qur’anic school pupils but as far as formal education is concerned they are out-of-school (OOSC) and street children (Hoechner, 2011; Ezegwu, et al 2017). The actual number of the almajirai is unknown. In 2012, when the estimated number of Nigeria’s OOSC was

162
over 10.5 million, the almajirai was recorded as constituting around 9.5million of the country’s OOSC population and an estimated 8.5million of them are located in northern Nigeria (Humphreys and Crawfurd, 2014; Ezegwu, et al 2017). Almajiri education programme is one of the UBE programmes that directly target the poor and street children and is closely related to the IQTE discussed above. Key variation relates to the specific target population, which is the Almajiri. The Almajiri model almajirai schools were established in 25 states to offer a combination of Islamic religious and circular educational curriculum (UBEC, 2012b, 2013). The programme seeks to integrate Islamic discipline into the country's basic education programme, discourage the Almajiri from begging and gradually eliminate the practice of itinerancy and begging by Almajirai in Nigeria (UBEC, 2010). The schools provide uniforms and free meals to ensure that the children remain in school and discourage alms begging in the street. The result has been mixed. Information from the literature suggests that, on the one hand, the management and supervision of the schools have been poor, supplies are often insufficient and poor communication and collaboration between the host communities and government have also been observed (Humphreys and Crawfurd, 2014). On the other hand, the pupils appear to have been uncomfortable with the model schools: the school uniform and furniture were alien to them; free food was seen by them as both foreign and insufficient and; they were discriminated against and bullied by other in children in the mainstream UBE schools (Usman, 2008; Humphreys and Crawfurd, 2014). The Universal Basic Education Commission (UBEC, 2015) identified the following challenges in the delivery of almajiri education programme: lack of political will and inability of various states to takeover and sustain the programme; non-integration of the traditional almajiiri school administrators and teachers (Alarammas/Mallams) into the programme; non-recruitment of formal education teachers for the schools and; irregularity of the school feeding component as a retention strategy. The government planned to establish 400 almajiri schools but less than half of the planned target was reached (UBEC, 2014a). A recent national newspaper report claims that the purpose of establishing the almajiri schools are failing in Kaduna, Sokoto and Zamfara as some of them have not been put to appropriate use, some have been converted into regular secondary school while others are lacking relevant facilities as the almajirai roam streets begging for alms (Mac-Leva et al, 2017).
Nomadic Education
Nomadic education is part of the inclusive basic education programme that targets children of pastoral nomads and migrant farmers outside the mainstream formal education system. The actual number of nomadic people in Nigeria is unknown and there is conflicting information about their population size. The 1991 census puts them at about 10.4 million. Current information on the NCNE website states that there are over nine million nomads in the country, out of which 3.3 million are school-age children but their participation in formal and non-formal education programmes remains very low and having a literacy rate that ranges between 0.2% and 2.9% (NCNE, 2017)42. From what is known, the majority of them are Fulbe/Hausa-Fulani ethnic groups (Bah-Lalya et al. 2011; Humphreys & Crawfurd, 2014; NCNE, 2017). Initial attempt to provide education to the nomadic communities met severe resistance. Usman (2006: 168) notes that Fulani parents perceived circular education curriculum as “not only dysfunctional to the daily needs of Fulbe nomads, but ineffective to the needs of their herding and social life style”, hence their discouragement of their children from attending the formal schools, which they considered its curriculum as “an insult to their intelligence and culture”.
42 http://www.ncne.gov.ng/about-us/

163
Another major challenge to the provision of education to the nomadic community is accessibility: they are often located in remote places and migrating across hard to reach locations (Usman 2006). In consultations and collaboration with leaders of the communities, a National Commission on Nomadic Education (NCNE) was established in 1989, which became responsible for coordinating formal education of nomadic populations across the country (McCaffery et al. 2006; Humphreys & Crawfurd, 2014). Nomadic education initiatives include the provision of mobile schools, use of material that have been adapted to their situations and language and, use of bespoke interactive radio and TV programmes (Usman 2006; Humphreys & Crawfurd, 2014). As summarized in Appendix Table B5, fluctuations have been observed in the number of nomadic schools and enrolment. As of 2010, there were close to 500,000 students (about 44% female) enrolled in more than 3,000 nomadic schools across the country, mostly in the northern parts of Nigeria, which slightly increased by 2014. The schools teacher-pupils ratio (TPR) ranged between 35 and 38 within this period (NBS, 2016). Compared with their estimated population, enrolment gap exists. Also, high dropout rates and low learning outcomes have been reported (Bah-Lalya et al. 2011; Humphreys & Crawfurd, 2014).
Special Needs Education
The Section Seven of the 2013 edition of National Policy on Education defines Special Education as component of the education that has been designed to address respective and unique needs of individuals with disabilities and special needs which may not be adequately catered for by the general education programme (FME, 2013). However, the special needs education lacks adequate funding, monitoring and support (Humphreys and Crawfurd, 2014). Sections 106 and 107 of the 2008 edition of the National Policy on Education makes provision for free education of special needs and people with disabilities at all levels, including the provision of their learning equipment and infrastructure. Such stipulation is not clearly made stated in the 2013 version and the commitments seem to be lacking. In practice, although 2% of the Federal Government’s contribution to the UBE intervention fund was initially allocated supporting children with special needs, in practice, little is known about the actual amount that is being spent on their education and very limited monitoring of this component of the basic education has been reported (Humphreys and Crawfurd, 2014). Reliable data is also scarce in this sector, besides extensive narratives from donor-supported projects such as the ESSPIN and World Bank-supported Lagos Eko Secondary Education Project. A report on the Lagos Eko Secondary Education Project shows that in 2012, all visually impaired students achieved 100% in English, Maths and Science in their Basic Education Certificate Examination (BECE) examination, which suggests an improvement from a 2010 baseline achievement of 45%, 50% and 50% in English, Maths and Science respectively (World Bank, 2013). An evidence of the weak state support for special needs education is highlighted in the assumption of the 2010 NEDS that 99% of children were without disability (see NPC and RTI International 2011). Humphreys and Crawfurd (2014: 80) note that alternative data indicates that this is constitutes a substantial underestimation that is probably due to the prevailing stigma that is attached to conditions of disability. Smith reports on a disability survey by the Leprosy Mission Nigeria with 1093 respondents in Kogi and Niger states and notes that the prevailing forms of disabilities were vision (37%), mobility (32%) an hearing (15%). The report remarkably notes that third of the people with disability surveyed were below 21 years old and without jobs, and up to 72% of them were Muslim while more than half had no education, with about 18% having some level of Islamic education. ESSPIN (2013) also reports its successful public-awareness and mobilization programme in Jigawa State that resulted in an increased enrolment of children with disabilities in 2011/2012 from 3,500 to nearly 5,800. These suggest that non-state support to the education of children with special

164
needs (including the blind/visually impaired, hearing/speech impaired and mentally challenged) is producing some positive attitudes toward provision of education for them. Some of the major challenges in the delivery of education to children with special needs include: limited number of special needs schools, lack relevant equipment in the available schools; limited number of private providers and very high school fees charged by the available ones (over $55.40 is charged per term), high cost of establishing special needs schools (UBEC, 2015).
3.4.3. Assessment of Learning Outcomes
A review of basic education reform by DFID's Education, Data Research and Evaluation in Nigeria (EDOREN) in 2016 concluded that there is no nationally-representative evidence on changes in learning outcomes at the basic education level is lacking and the country also lacks a standardized and regular learning assessment system for basic and senior secondary education level. Although the FME and its agencies conduct some assessment using primary and JSS pupils’ samples but their data are not reliable (EDOREN, 2016). Thus, data for this report is not unified and have been drawn from different surveys that either did not originally set out to assess provision of quality of education for the poor but simply included education as part of a broader survey (e.g. NDHS) or used varying indicators that are note inclusive and reliable. Also, some donor supported projects like DFID-funded Education System Support Programme in Nigeria (ESSPIN) and USAID-funded Northern Education Initiative (NEI) conducted some assessments in one or more states, which are also used in this report. It is pertinent to note that there exists Basic education Certificate Examination (BECE) taken at the end of the nine years basic education level (third year of the Junior Secondary School) but these are responsibilities of respective states of the federation and the Federal Capital Territory (FCT); for the 108 secondary schools that are managed by the Federal Government and special schools such as Armed Forces Secondary Schools, the National Examination Council (NECO) conducts the BECE for them. Up to 18 subjects are offered at the BECE level and are examined of which candidates expected take a maximum of ten subjects, including English and Mathematics. Results of these examinations were not accessible at the time of the study for comparison, hence only the senior secondary certificate examination results have been included.
3.4.4. Major Trends in Education Statistics
Educational access over time across geopolitical zones Nigeria Education Data Survey (NEDS) report particularly highlights how various costs, such as Parent Teachers Association (PTA) fees, exam fees, food, books and other supplies constitute an extra burden for poor households (NPC & RTI, 2016). The NEDS data also shows that economic reason ranks very high as reasons for dropping out of school, which is represented by direct financial cost (18%) and labour needs of the family (21%), a combination of which gives 39%. For those that dropped out of school, economic reason also ranked highest among factors that caused them to drop out; monetary cost of education (23%) and households’ labour needs (15) topped the list. Poor school quality also ranked 15% (NPC & RTI, 2016). There has been a historical gender and regional gaps in educational access, completion and outcomes in Nigeria across all levels of education and across different economic quintiles. The 2015 Nigeria Education Data Survey (NEDS) shows that there has been increasing school enrolment over the years. In 2015, up to 68% of primary school-aged Nigerian children were enrolled in primary school, which suggests an increase from 61% in 2008, about 60% and 51% in 2002 and 1990 respectively. At the secondary school level, a noticeable increase has also been

165
recorded: up to 56% of youths between the ages of 12 and 17 years were enrolled in secondary school compared to 44%, 35% and 24% in 2008, 2003 and 1990 respectively. Gender parity has been achieved in primary in many southern states but gaps remain in favour of boys in most northern states. Despite overall progress, low primary school attendance remains widespread in the North East and North West geopolitical zones, which was about half school attendance rates in southern geopolitical zones (NPC & RTI, 2015). Similarly, the Education Management Information System (EMIS) data shows that while there has been a general increase in enrolment, disaggregated data suggest a persistent shortcoming in the net enrolment rates (FME, 2017). The EMIS data shows a steady decrease in primary enrolment between 2013 and 2016, with -1.37% in 2014 and -1.39% in 2015. During the same period, enrolment in junior secondary schools fluctuated. Increase in junior secondary enrolment was noticed in 2013 and 2014 (16.89% and 0.48% respectively) while decreasing in 2015 and 2016 (-2.65% in 2015 and -1.28% in 2016. The senior secondary level increased throughout except 2016 when it dropped wit -8.87% (see table 3.4.1). FME (2017) attributes the decrease in enrolment to ongoing violence and insurgency in some northern parts of the country and unavailable data from states, indicating the need to treat the data with caution.
Table 3.4.1: Enrolment By Level Of School For The Years 2012 To 2016 And % Change In The Enrolment
2012 2013 2014 2015 2016
PRY 1-6 24,893,442 26,158,375 25,801,197 25,442,535 25,591,181
JS 1-3 5,277,527 6,168,764 6,203,094 6,180,291 5,968,142
PRY 1 - JS3 30,170,969 32,327,139 32,004,291 31,622,826 31,559,323
SS 1-3 4,934,722 5,152,805 4,292,489 4,910,944 4,475,309
Percentage change PRY 1-6 - 5.08 -1.37 -1.39 0.58
JS 1-3 - 16.89 0.48 -2.65 -1.28
PRY 1 - JS3 - 14.45 0.55 -0.37 -3.55
SS 1-3 - 4.42 16.7 14.41 -8.87
Source: FME (2017). * The actual enrolment rates are not provided EMIS data is not disaggregated by economic quintiles but the 2015 Multiple Indicator Cluster Survey (MICS) data shows that the lowest economic quintile, representing the poorest in the economic category of the society had almost twice lower primary school net enrolment ratio (NER) than the second quintile and the higher the economic level the higher the NAR. As Figure 3.4.1 shows, the lowest and second quintile respectively had 34% and 61% NAR while the forth and highest quintiles respectively had 78% and 84% NAR. The Gross Enrolment Ratio (GAR) for the lowest quintile stood at 50% while the highest quintile stood at 99% (National Population Commission (NPC) & Research Triangle Institute (RTI), 2016). A similar trend is observed at the junior secondary school (JSS) level where the lowest quintile had only 9% NAR while the highest quintile had up to 62% NAR. The JSS GAR for the poorest level of the society was 19 while the highest quintile was 87%, indicating that the poor still have very low access to education (see Figure 3.4.1).

166
Figure 3.4.1: Gross and Net Attendance in Primary and Secondary School by Household Wealth, 2011
Source: Author; data from NPC & RTI (2016) Poverty remains a major factor hindering educational access, despite the effort by the government to provide free and compulsory education. The Nigerian Human Development Report by UNDP (2015: 32) notes that 57% of females and 48% of males were “afraid of not being able to pay their children’s or own education”. The report also lists inability to bear personal or children’s educational expenses fees as one of the greatest concerns people held in relation to threats to individual security. Evidence suggests that majority of the country's 13.2 million out-of-school children possibly belong to the lowest quintile: while the estimated number of out-of-school children stood around 10.4 million in 2014, the street children (particularly Almajiri – see section 2.9) constituted about 9.5million. MICS' household survey data shows that economic reasons (monetary cost and labour needs of the households) ranked very high among other factors that hinder enrolment and completion. In 2015, the monetary cost of education and labour needs of the family respectively ranked 21% and 18% (totalling 39%) and were among top reasons people never attended school in Nigeria (NPC &RTI, 2016). It is noteworthy that up to 10% had no interest in formal education. Qualitative reasons for this were not provided. Besides poverty and economic pressures on poorer households, in the literature, low quality and value of education, unemployment and mistrust of Western education are noted as contributing factors that make education unattractive to some Nigerians, especially in the northern parts of the country (Usman, 2006, 2008; Hoechner, 2013; Humphreys and Crawfurd, 2014; Ezegwu et al, 2017).
Data from the National Bureau of Statistics (NBS, 2013), which accommodated both MICS and Millennium Development Goals (MDG) indicators, shows that the aggregate adjusted NAR for the country's children of primary school age attending primary or secondary school stood at 97.2 and 65.1 in urban and rural areas respectively. The NER for children of primary school age attending primary or secondary school for the period of 2016/17 stood at 26.2% for the children from poorest households, 90.5% for children in the richest households, 44.1 and 91.5 for those whose mother had no education and higher education respectively. Igbo and Yoruba ethnic groups respectively recorded over 85% respectively while Hausa had less than 50% (46.6) (NBS, 2017). Across the geopolitical zones, the NBS (2013) shows that southern zones had a
0%
20%
40%
60%
80%
100%
Primary NAR and GAR by Household Wealth
NAR
GAR
0%
20%
40%
60%
80%
100%
JSS NAR and GAR by Household Wealth
NAR
GAR

167
minimum of adjusted NAR of 90.0 while northeast and northwest respectively had 49,1 and 50.4 respectively. The primary school completion rates in states like Adamawa, Anambra, Ebonyi, and Imo states were more than 120% indicating that more children completed primary school around 11 years old or below and more males (94%) than females (77%) were in this category. The completion rate also showed north-south variation: southeast and south-south recorded 93% and 123% respectively while northeast and northwest recorded 55% respective and; north-central recorded 85.6% (NBS, 2013).
From the NBS (2013) data, there appears to be an association between mothers' educational level and children's school enrolment. More than 90% of children whose mothers had a minimum of secondary education were enrolled while 84% of those whose mothers had primary education were also enrolled but only half of the children whose mothers had no education were attending school. Also, net primary school completion rate correlated with mothers’ educational level and households’ socioeconomic status. Completion rates for children whose mothers had primary and no education were respectively 71% and 104% while children from the poorest households and those from the richest households were 59% and 79% respectively (see Figure 3.4.2).
Figure 3.4.2: Primary School Completion Rates and Transition Rate to Secondary School by Parental Schooling and Household Wealth, 2011
Source: National Bureau of Statistics (2013) Data from the National Bureau of Statistics (NBS, 2017) shows that the net intake rate of children of primary school entry age that entered grade 1 was lowest among children from poorest households (17.0%), Hausa ethnic group (29.7%) and children of women that had no education (25,7%) were lowest. It was highest among richest households (65.2), Igbo ethnic group (62.2) and children of women who had higher education (70.5%) (NBS, 2017). The data also indicates that 27.2% of Nigerian children are out-of-school, of which the northeast and northwest record 39.8% and 29.9% respectively (NBS, 2017)
The NBS 2016/2017 education data shows that primary school completion rate was 63.0% while the rate of transition to secondary school was 66.9. These also varied across economic levels, locations and mothers' educational levels. Primary school completion rate was highest in South-south (81.5) and North-central (72.9) zones and was lowest in northeast (54.0) and northwest (57.1) zones. Also, the rates of transition from primary to secondary school were
0
50
100
bottomquintile
2ndquintile
3rdquintile
4thquintile
topquintile
Primary school completion rates and transition rate to secondary
school by household wealth
Primary school completion rate
Transition rate to secondary school
0
50
100
None Primary Secondary +
Primary school completion rates and transition rate to secondary
school by mother's schooling
Primary school completion rate
Transition rate to secondary school

168
highest in the southwest (89.4) and south-south (88.2) and lowest in the northwest (49.6) and northeast (51.0). More pupils in urban locations (67.6) completed primary school than pupils in rural locations (60.4). Similarly, the urban dwellers (73.5) had better transition rates from primary to secondary schools than rural dwellers (62.1). Likewise, pupils from poorest households, were less likely to complete their primary schools (completing at 32.9 rates) while children from richest households completed at 52.7%; their respective rate of transition from primary to secondary school were 35.0 for the poorest homes and 87.6 for the richest households. Again Igbo and Yoruba completions rates (73.9 and 63.9 respectively) were higher than that of Hausa ethnic group (54.9); their respective transition rates were 91.0 for Igbo, 71.0 for Yoruba and 48.6 for Hausa. Women's levels of education reflected on their children's transition rates with children whose mothers had higher education transiting at 89.2 rates while children whose mothers had no education had the rate of 55.2 (NBS, 2017).
At the tertiary education level, available information is not well disaggregated. A major challenge in this education sector is relatively low students’ carrying capacity of the tertiary education system. In 2010, while a total of 1,513,940 candidates applied to study in Nigerian tertiary education institutions, only 28% of them were admitted across the country. A similar trend was observed in other years that followed. Of 1,636,356 candidates in 2011 only 26% secured admission and in 2012, only 27% of the applicants were admitted. The rest of the intakes were 24% in 2013, 25% in 2014 and 20% in 2015 (NBS, 2017).
Quality of Physical Inputs
Quality in terms of adequacy of inputs varies across states and geopolitical zones. This is partly because of the decentralization of education sector which allows various states and local governments to take responsibility for public primary and secondary education provision. Humphreys and Crawfurd (2014: 57) explain that “the relative independence of each SMoE and each SUBEB means that no two states have exactly the same systems for the provision of quality basic education”. States vary in their capacities to provide and finance quality education. Most states heavily depend on Federal Government allocations to finance education. More than 60% of average revenues of most states come from transfers from the Federal Government (Central Bank of Nigeria, 2012; Jones et al, 2014) and larger share of the Federal transfers for education are used to pay teachers’ salaries. This financial dependence affects states’ capacity to ensure and sustain quality in education. Although the UBEC receives various forms of support from MDGs (now SDG Office), International Development Partners such as China Economic and Commercial Office (CECO), DFID, Japan International Cooperation Agency (JICA), Korea International Cooperation Agency (KICA), the USAID, UNESCO, UNICEF, World Bank and others (UBEC, 2015), these are never sufficient. The share of the Education sector in the Federal Government budgets are very far below the UNESCO 26% recommendation.43 At the state level, some state is able to allocate up to 10% of their budget to education but still fall short of the UNESCO recommendation (Oyedeji, 2016; Adedigba, 2017).
The Federal Government designates 2% of its consolidated revenue fund for financing of the universal basic education level, which is shared among states using the following formula: matching grant in form of infrastructure/facilities supplies (50%), support for closing educational imbalance (14%), special needs education (2%), awards on good performance by
43 For example, only 7.04% of the total budget has been earmarked for education in the 2018 budget and similar trends have been observed in the previous years.
169
states (5%), supply of instructional materials (15%), teacher professional development (10%), monitoring of the UBE programme (2%) and UBE Implementation (2%) (Onocha, 2013; UBEC, 2013). Accessing the funds depends on states' commitment to meeting certain conditions, which include the provision of their counterpart fund. Onocha (2013) explains that between May 2011 and May 2013 many states could not receive the funds and up to 15% of the funds within this period was not accessed by states because they could not contribute their counter-part fund which is a major required that must be met before the Federal Government could release the grant to them. Besides, information on educational financing in Nigeria is patchy and unreliable. The Federal Ministry of Education (FME, 2011) concludes that making a comprehensive estimate on education financing is challenging because of budgeting and reporting inconsistency.
Following the funding inadequacy, misappropriation and low political will, provision of school infrastructure have been low albeit increasing. Through the UBE funding, significant investment has been made in education infrastructure in the past decade but serious gaps also remain. The UBEC nationwide assessment shows that although there has been some increase in the number of schools, the quality and quantity remain low and distribution of classroom blocks is both uneven and inadequate (UBEC, 2012b). UBEC assessment reveals that over 50% of primary school facilities, building roofs, and walls were in bad shape, requiring serious repair or replacement and, 74.09% of JSS schools lacked science laboratory and up to 91.36% did not have ICT facilities (UBEC, 2009, 2011). The report also shows that only 7.42% of primary schools had toilets, 8.20%, and 52.1% did not have and no information was provided about toilets in the 21.2% of the schools (UBEC, 2009, 2013). A study of the quality of education in Osun state public primary schools reveals inadequate facilities and furniture in schools and pupils tend to on the bare floor while receiving lessons (Ajayi and Adeyemi, 2011). Severe classroom shortage results in overcrowding classrooms and the poor quality of schools. The inadequate and poor conditions of school infrastructure played roles in driving 16.8% of children out of school (NPC and RTI International, 2011). While various reports suggest that private schools tend to have better facilities and less overcrowding challenges (Härmä, 2011a,b, Humphreys and Crawfurd, 2014; Gershberg et al. 2016).
While the private schools tend to have better facilities, their costs are also higher. Household expenses are higher in private schools. In 2015, households spent an average of 22.340 Naira in private primary schools annually which was more than ten times what they spent in public schools. In the urban areas the cost was also more than three times the households’ expenditure in the rural areas. Households spent more on females (8793 Naira) than on males (8146 Naira). Expenditures are is not uniform across geopolitical zones, most southern states spent higher on their children’s education than northern zones. Poorer households tend to spend lesser on children’s education, suggesting their possible inability to meet up with major school expenses; private schools expenses are even higher (see NPC & RTI, 2016).
Class size and teacher pupil-ratio are also other inputs of significant concern. The approved teacher-pupil ratio by the National Policy on Education at basic and post-basic educaiton levels are 1:35 and 1:40 respectively (FME, 2013). Using data from the National Abstract statistics, Ezegwu and Ewemooje (2011) highlighted that in many states class size and pupil-teacher ratio were very high. Despite diverse interventions over the years, a recent report shows that these challenges persist. Humphreys and Crawfud (2014) note that the figures of pupil–teacher ratio (PTR) published by the government in the Annual School Census (ASC) do not often reflect the classroom realities. Based on data from the Annual Schools Census, Humphreys and Crawfurd observed that TPR for qualified teachers in Jigawa were between 48 and 214; in Kano, it stood

170
between 32 and 99, while it was between 19 and 60 in Lagos state. Observation in Kaduna, Kano and Kwara indicated that TPRs were between 1:100 and 1:200 (Humphreys and Crawfud, 2014). In recent newspaper reports on teacher quality and supply in Kaduna state, Ibrahim (2017) reported a case of LEA Primary School that had over 22,000 pupils with each class having between 280 and 300 pupils and with most pupils sitting on the floor. In Cross Rivers State, Domike and Odey (2014: 399) note that “the classrooms are overcrowded and in some instances schools have operated with a teacher-pupil ratio of 1.76".
The Nigeria’s education index which summarizes the level of peoples’ learning and literacy by comparing Mean Years of Schooling (MYS) and Expected Years of Schooling (EYS) indicates that the south-south zone had the highest mean year of schooling in 2013 with a total of 10.664 years while the North-West zone had the lowest with 3.8126 years. The national rate stood at 7.404 in 2013, which indicated a drop from 8.4333 in 2010 record. Males’ national mean year of school in 2013 was 8.4 years while females were 6.6 years (UNDP, 2015).
The inadequate and low-quality supply of teachers has been widely reported. About 44% of the country's primary school teachers lack the minimum National Certification in Education for teaching at the basic education level (Daniels, 2016). A recent primary school teacher crisis was experienced in Kaduna where two-thirds of the teachers failed primary school level students assessments resulting in a mass sack of teachers in the state (Ibrahim, 2017). In a 2008 state-wide assessment of teachers in Kwara state, on all four key subjects tested, only 0.03% of all the teachers achieved the minimum threshold of 80% and above (Johnson, 2008). Also, poor teacher quality, inadequacy and commitment, poor planning and the need for improvement in how teachers’ are trained, recruited, replaced and managed are widely documented (FME 2005; FME 2011a; Thomas, 2011). A study that examined conditions of staffing in 13 states in Nigeria observed that “there is hardly any discernible norm for recruitment and deployment of staff across the states” (FME 2005: 234). The basic education teachers are employees of the SUBEBs and the LGEAs. The LGEAs are specifically responsible for paying salaries of primary school teachers while JSS teachers are paid by the state but lack of clarity has been observed as regards how responsibilities are shared between SmoE and SUBEB. Inappropriate procedure and method of work, low management capacity, duplication of responsibilities, the absence of performance appraisal and poor job definitions are prevalent (Johnson et al. 2007; Santcross et al. 2010; Obanya 2011; Humphreys and Ceawfurd, 2014).
Additionally, the UBEC (2014: xi) report of the external assessment of quality assurance in basic education conducted in 33 States and the FCT shows that "learners across the country have access and equity in basic education. The learners make progress in almost all the States as 90% of learners transited to JSS. Cases of drop-outs and repeaters were low at all levels". However, the report also notes, in relation to achievement and standards, that none of the 366 primary schools accessed is outstanding, 20% of them are good, 46% is fair, 27% are poor and 7% is very poor. On the quality of teaching and learning, the report explains that none of the primary schools is outstanding, 22% is good, 46% is fair, 25% are poor and 7% is very poor. At the junior secondary level, achievement standards report on 72 JSS shows that none of the assessed JSS is outstanding, 37% may be considered as good, 56% is fair and 7% are poor. As regards the quality of teaching and learning, only 1% is outstanding, 38% are good and 54% are fair while 7% are poor, and none is very poor (UBEC, 2014).
Besides, the UNESCO (1953) recommends the use of mother tongue in early years of education and evidence shows that language of delivery is very important in learning conversion (UNESCO, 2007; Ball, 2011; UNESCO, 2016). A six-year experiment with mother-tongue education in

171
Southwest Nigeria confirms that learners tend to learn to perform better in schools when they are educated for six years in their mother tongue (Bamgbose, 1976; Bamgbose, 2005).
However, English remains largely the language of instruction at all educational levels, especially in private schools and urban areas (Adekola, 2007; Ojetunde, 2012; Salami and Oyaremi, 2012; Ezegwu, 2013). Adekola (2007: 8) notes that "the language policy has been very poorly implemented to the detriment of student learning. English has become the default language of instruction at all levels of the primary school". A review of language use in primary and secondary school in Nigeria shows that schools often start off children with English right from nursery school level (Ezegwu, 2013). Also, a study on language delivery and cultural promotion by Ezegwu (2017: 2) observes that secondary school students “want literary works in Standard English because it is the language of education and it helps their learning of grammar but they do not always understand English works and want pidgin to help them to understand the texts and plays”. Humphreys and Crawfurd (2014: 5), observe that medium of instruction has been a “major impediment to teaching and learning and a cause of dropout and low learning outcomes, as exams and textbooks are in English”.
Learning outcomes
The National Education Quality Assurance Handbook (FME, 2016) lists the quality standards and goals of the country's basic education, which include ensuring quality of teaching and learning, quality of the curriculum, effectiveness of the educational leadership and management, quality of the learning environment and, quality of care, guidance and safety. These are majorly directed towards improved learning experiences and skills of the learners. These have not been reached. In addition to having the largest population of out-of-school children (approximately 25.3 million). Nigeria faces a huge challenge to deliver quality education. Government data on student performance in national examinations show that Nigeria is making progress. At the senior secondary school level, two major nationwide examination systems are provided by the West African Examination Council (WAEC) and National Examination Council (NECO). In addition, a transitional examination (from senior secondary to tertiary education level) is offered by the Joint Admissions and Matriculation Board (JAMB). Analysis of Performance of Senior Secondary Certificate Examination (SSCE) Candidates in National Examinations Council (NECO) between 2011 and 2015 shows that that has been increased in learning outcomes. The 2013 – 2016 final results indicate that candidates’ performances increased from 47.6% in 2013 to 81.9% in 2016 (National Bureau of Statistics, 2017) (see Figure 3.4.3).
Figure 3.4.3: National Examination Council Final Senior Secondary Schools Examination, 2013-2016
Source: Author; data is from the National Bureau of Statistics 2017
0,4
0,5
0,6
0,7
0,8
0,9
2013 2014 2015 2016
Male Female Total

172
However, independent assessment of learning outcomes show that among those already in school, more than half of the children cannot read or write indicating that they are not learning; about 63% of rural children cannot read at all; also about 84% of children from poorest households cannot read at all (Daniels 2016). Nigeria appears to have a pervasive low learning challenge at all levels of education (Ogbonna 2016). The Nigeria’s Multiple Cluster Indicator Survey (MICS) data suggests that the higher a households' economic status the higher their children's literacy and numeracy rates (NPC & RTI, 2016). Below, a number of data sources are used to document the level of student achievement in Nigeria with a focus on family wealth.
There are different surveys with differing information such as Nigeria Education Data Survey (NEDS) and Multiple Cluster Indicator Survey (MICS). The Monitoring of learning achievements (MLA) data suggests a decline in the quality despite the combined effort of the government and international development partners that are supporting educational development in the country. The MLA report by the Federal Ministry of Education on primary four level learning shows that vast majority of the pupil that participated in the study scored below average in both literacy and numeracy test. Only one out of five primary four pupils showed they had the expected competency in relation to the primary four national curricula (Ogbonna, 2016). As summarized in Figure 3.4.4, the national literacy mean score even declined from 35.05 in 2003 to 31.07 in 2011. Similarly, the national numeracy means score declined from 43.81 in 2003 to 36.28 in 2011. The decline was observed in public and private schools as well as urban and rural areas.
Figure 3.4.4: FME Primary MLA Literacy and Numeracy Percentage Mean Scores 1996-2011 (Grades 4 and 6)
Data Source: Ogbonna (2016). Notes: (a) In 2011 MICS, Literacy is measured by a child’s ability to identify or name at least ten letters of the test language alphabets and whether a child is are able to read at a minimum of four simple and popular (this definition is also adopted throughout this report). (b) In 2011 MICS, numeracy is measured by a child’s ability to recognize and mention symbols of at least numbers one to ten; if a child gets at least two of these correctly, such a child is considered to be on track developmentally (this definition is also adopted throughout this report). (c) All non-state schools, including religious schools are considered as private as noted earlier, hence, it is believed that religious schools are also included in the private category.
0
5
10
15
20
25
30
35
40
45
50
Mean score(literacy , grade 4)
Mean score(numeracy, grade
4)
Mean score(literacy , grade 6)
Mean score(numeracy, grade
6)
1996
2003
2011

173
At the primary six level, information is available for two different tests, 2003 and 2011, and also suggest similar trend observed in the primary four level test. The MLA, as summarized in Figure 3.4.4 indicates that the overall national mean percentage scores was 41.45 in 2003 and declined to 39.50 in 2011 in the literacy test. In numeracy test, it national score declined from 35.73 to 31.19.The decline is also observed across public and private and. Urban and rural areas.
The NEDS (2015) data considered children that could read at least one of three words presented on a flashcard in English literate. Also, those that could read any of the three National languages on a presented on a flashcard were considered literate. Despite the formal reduction of quality standards through a lowering of the literacy criteria, NEDS data also shows a decline learners’ achievement between 2010 and 2015. The achievement also varied according to households’ backgrounds. Children from poorest households achieved the lowest rate (10% in 2004, 16% in 2010 and 14% in 2015) while children from the richest households got highest rates (67% in 2004, 83% in 2010 and 82% in 2015). Similar trends are also observed at the JSS level (NPC & RTI, 2016).
Figure 3.4.5: Children's Numeracy Skills by Household Wealth (Children Ages 5-16 Able To Read)
Source: NPC & RTI, 2016 2015 NEDS reveals the noticeable difference between private and public schools. At the primary level, private schools literacy rate stood at 74% while public schools rate was 44%. A similar trend is also observed at the JSS level where private schools rate stood at 96% while the public school rate was 91%. In Numeracy, public schools' rate at both primary and JSS levels were 56% and 94% respectively while the private school rates were 84% and 95% respectively.
According to the 2015 NEDS data, a wide gap existed in primary school numeracy between pupils from poorest households (14% in 2015) and those from the richest households (87% in 2015). Figure 3.4.5 shows that the higher a households' economic status the higher their children's
0%
10%
20%
30%
40%
50%
60%
70%
80%
90%
bottomquintile
2nd quintile 3rd quintile 4th quintile top quintile
2004
2010
2015

174
numeracy rate. The rates fluctuated across different economic quintiles between 2004 and 2015 for children between the ages of 5 and 16. It is not clear the reason for this but a consistent correlation between economic quintiles and numeracy rates is observable from the data (NPC & RTI, 2016). Also, there appears to be a correlation between mothers' levels of education and children's performance in arithmetic. As summarised in Figure 3.4.8, children whose mothers had no education had 7% numeracy rate while those whose mothers had primary and minimum of secondary education had 65% and 95% rates respectively (NPC & RTI, 2016).
Figure 3.4.6: Children’s Numeracy Skill by Household Wealth
Source: NPC & RTI, 2016 Figure 3.4.7: Children's Literacy Skills by Household Wealth (Children Ages 5-16 Able To Read)
Source: NPC & RTI, 2016
0%
10%
20%
30%
40%
50%
60%
70%
80%
90%
100%
bottom quintile 2nd quintile 3rd quintile 4th quintile top quintile
2004 2010 2015
0%
10%
20%
30%
40%
50%
60%
70%
80%
90%
bottomquintile
2nd quintile 3rd quintile 4th quintile top quintile
2004
2010
2015

175
Figure 3.4.8: Children’s Numeracy Skill by Mother's Schooling
Source: Authors; Data is fromNPC & RTI, 2016 In the 2015 NEDS, literacy rate in the urban areas (67.7%) was better than that of the rural areas (34.8%). Across the zones and states, all the southern zones had more than 50% literacy rates with Lagos having up to 89% literacy rates while all the northern zones had lower than 50% literacy rates, which stood as low as 17% in Jigawa state in the northwest. Similar trend is observable in the 2010 NEDS data which shows that among children age 5–16, literacy rates varied greatly across the states. More children were not able to read in the north than in the south. More than 75% of the children in 10 out of the 19 northern states were not able to read. In all the southern states, only Ebonyi state had literacy rate below 50%, which was 49%. In all the northern zones, Only Federal Capital Territory (66%), Kogi (52) Kwara (53) and Plateau (53) all of which are in north-central zone had literacy rate above 50%, the rest of the northern states are below 50%. Bauchi and Sokoto states had 92% and 91% respectively of children age 5–16 that were unable to read while Lagos and Ekiti in the southwest had 92% and 85% respectively were able to read. It is noteworthy that unlike in the previous sections states data are presented within the zones to highlight actual states where critical attentions are needed (NPC & RTI, 2011). From the 2015 NEDS, it is observed that numeracy rate was almost twice higher in the urban (75.6%) than in the rural areas (39.6%). Across the zones, while the lowest rate in the south was 74.4% (southeast), the highest in the northern zones was 53.6% (north-central). Across the states, the lowest rate in the southern states was found in Cross Rivers (49.1%), the rest of the southern states had above 70% numeracy rates. In the north, no state in the northeast and northwest had up to 50% numeracy rate; the Federal Capital Territory had 82.9%; Benue, Niger and Plateau states did not record up to 50% numeracy rates (NPC & RTI, 2015).
0%
10%
20%
30%
40%
50%
60%
70%
80%
90%
100%
No Schooling Pre-primary Primary Secondary andHigher
2015 2010

176
Similar trend is observable in the 2010 NEDS data across the zones in numeracy among children age 5–16. Their performances varied across the states and zones. The northwest and northeast zones had the lowest numeracy rates and 13 out of the 19 northern zones had literacy rates lower than 50%. In Sokoto, Bauchi, Borno, and Yobe states numeracy rates stood between 14% and 20%. The lowest numeracy rate in the south was 67% (Ebnyi state). Abia, Ondo, Osun, and Lagos had between 92% and 94% numeracy rates among children age 5–16 (NPC & RTI, 2011). Nationwide independent evaluation is scarce for a comparison the government data, however, an Early Grade Reading and Mathematics Assessments (EGRMA) in Bauchi and Sokoto States by USAID project in 2013 shows that overall, pupils’ performance was very poor across school types and states. Over half of the pupils scored zero and only a few were able to read and understand sentences in either Hausa or English. According to the report, more than 90% of pupils in P2, approximately 80% in P3, more than 70% in Stage 1, and more than 50% of Stage 2 pupils scored zero. For English oral reading fluency, between 80% and 90% of P3 and Stage 2 pupils scored zero in both states. Given the high percentage of pupils who could not read a single word of the oral reading passage, comprehension scores were very low, even in Hausa USAID (2013). Figure 3.4.9 presents data, by region and gender, on the percentage of pupils who could not correctly answer any of the reading questions. Figure 3.4.10 presents raw probabilities of zero scores in five Hausa sub-tasks. Since the sample comprises of government and Islamic schools, we additionally present the figures by school types. To put student performance in context, a useful benchmarking reference is the mean ORF for all learners comprehending 80% (correctly answering 4 out of 5 questions) which is approximately equal to 50 correct words per minute (CWPM). The assessment shows that most pupils were yet to master relevant foundational skills in reading and mathematics and there were no substantial differences between boys’ and girls’ performances in both reading and mathematics. There was a very slight reading difference between primary 2 and primary 3 pupils’ performances suggesting the low outcome of the additional year of learning on pupils' reading skills. Some of the contributing factors for the low performances included the absence of appropriate teaching and learning materials, inadequate teacher training, high levels of absenteeism among students and teachers and, inadequate learning support for the pupils (USAID, 2013). Similar assessment in Jigawa, Kaduna, Kano and Katsina states as part of the processes for the Global Partnership for Education (GPE)-funded Nigeria Partnership for Education Project (NIPEP) shows that scores were exceedingly low in both government and IQTE schools and, government schools’ record was strikingly poor; pupils in IQTE centres in all the states outperformed those in government schools by a wide margin (Ogbonna, 2016). Information from the pupil learning and teacher effectiveness in Jigawa, Katsina and Zamfara state primary schools show that 88% of the teachers reported that their schools needed major repairs and up to 11% of the schools had no electricity. In these schools, only 3% of primary 2 and three pupils demonstrated a relevant level of proficiency in English, 6% in numeracy and 15% in scientific literacy (EDOREN, 2016). Similar records of low literacy were recorded in the MLA components of ESSPIN Composite surveys (2014 and 2016) and the pilot survey by LEARNigeria (2016). The ESSPIN survey suggest that pupils performances may have worsened while LEARNigeria pilot study indicates that, of children aged 5 to 15 years surveyed in two local governments in Kano and Lagos, only 10% of them in Kano State could read grade two level story level only 6.7% of
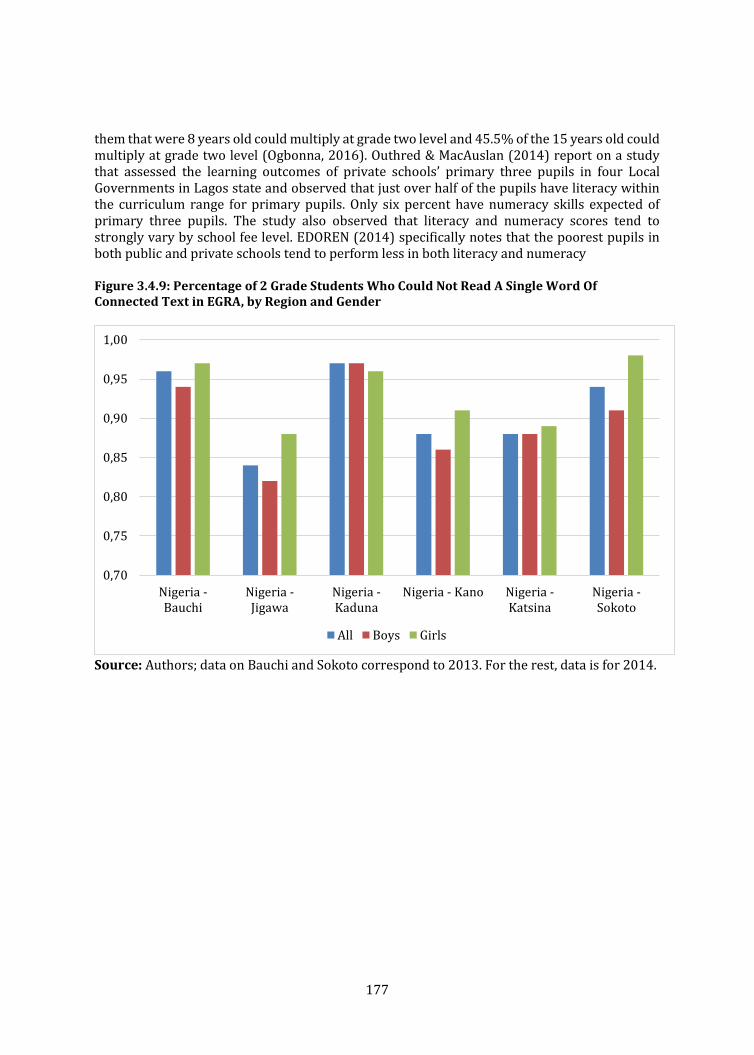
177
them that were 8 years old could multiply at grade two level and 45.5% of the 15 years old could multiply at grade two level (Ogbonna, 2016). Outhred & MacAuslan (2014) report on a study that assessed the learning outcomes of private schools’ primary three pupils in four Local Governments in Lagos state and observed that just over half of the pupils have literacy within the curriculum range for primary pupils. Only six percent have numeracy skills expected of primary three pupils. The study also observed that literacy and numeracy scores tend to strongly vary by school fee level. EDOREN (2014) specifically notes that the poorest pupils in both public and private schools tend to perform less in both literacy and numeracy Figure 3.4.9: Percentage of 2 Grade Students Who Could Not Read A Single Word Of Connected Text in EGRA, by Region and Gender
Source: Authors; data on Bauchi and Sokoto correspond to 2013. For the rest, data is for 2014.
0,70
0,75
0,80
0,85
0,90
0,95
1,00
Nigeria -Bauchi
Nigeria -Jigawa
Nigeria -Kaduna
Nigeria - Kano Nigeria -Katsina
Nigeria -Sokoto
All Boys Girls

178
Figure 3.4.10: Zero Scores in 5 Hausa Sub-Tasks in EGRA 2014
Source: Authors’ calculation based on raw (child-level) data. Overall, student performance in EGRA suggests very low levels of reading skills among Nigerian students except for listening abilities (Figures 3.4.9). Breakdown of the data by school type reveals that the prevalence of zero scores is particularly high in case of government schools. Among the IQTE students, around 40% students score zero in the first four subtasks. However, relative to government school students, the prevalence of zero scores is lower among students of IQTE (Figure 3.4.10). Part of the difference could arise owing to the fact that IQTE children are much older as these schools often offer education in a non-formal setting attracting much older children.44 We explore this difference along with other correlates of the low level of student achievement in Nigeria in the next section. The major observations in data tend to support evidence in the literature in many respects (especially in relation to limited quality inputs and outcomes) but the roles of school leadership, particularly the effectiveness of the principal in performing responsibilities, were remarkably highlighted by the study respondents as very instrumental to high pupils learning outcomes and constituting an important feature of an effective school in addition. The motivated and qualified teacher supply that remains a critical issue in the literature has also been emphasized in this in this study suggesting an urgent need for intervention in these areas as a critical strategy in promoting quality education. Besides, while the population size of madrasahs are very large, as observed in the earlier discussion, they are not considered as critical part of the mainstream formal education.
Apart from the wealth gap in learning outcomes, Nigeria also faces significant gender inequality which also varies across states. In most northern states, pervasive low female enrolment, retention and completion have persisted since the colonial era. In the south, relatively low male secondary enrolment has been persistent in places like Anambra State. In early 2000, UNICEF
44 In other dimensions such as school readiness, there is not much difference. Two-fifths of government school students, as well as IQTE pupils, reported having attended nursery school before enrolling in primary school.

179
(2003) observes that while the northern states experienced more than 30% average gender gap, which was as high as 48% in Sokoto and Zamfara, the southern states had less than 10%, with the gross enrolment ratio (GER) being in favour of girls by minus three (-3) in Anambra State. In the 2015 NEDS, adult literacy data shows that more females have no education than males. In the rural areas, 49% of females and 45% of males have no education. In the urban areas, 19% of males and 22% of females have no education. The percentage of males that have more than secondary education were 33% in urban and 13% in the rural areas while females that had more than secondary education stood at 22% in urban and 6% in rural areas (NPC & RTI, 2017). The 2015 Net School Attendance Ratios (NER) was 81% for urban males and 59% for rural males while for females, they were 80% in the urban and 55% in the rural areas (NBC, 2016). The northern states currently have the worst records on girls' education in Nigeria (Afri-Dev-Info, 2013; Humphreys and Crawfurd, 2014). The NBS (2017) data shows that all southern states have Gender Parity Index (GPI) at 1.0 at both primary and secondary school levels while northeast and northwest have GPI of 0.9 for primary school respectively; the secondary level, the northeast and northwest GPI are 0.8 and 0.9 respectively. In Jigawa state, 45.5% of men and 82% of women aged 15 to 49 have no formal education; in Kano State, 37.8% and 60.2% of females and males respectively have no formal education (Unterhalter et al., 2017).
Factors that contribute to exacerbating gender inequality in Nigeria's education are related to poverty, home chores, local attitude to girls’ education, early marriage and pregnancy, distance to school, gender violence and lack of water and sanitary facilities in schools (Humphreys and Crawfurd, 2014). Diverse interventions, especially international donor-supported girls education project have been implemented across Nigeria, with greater attention to northern Nigeria, but gender gaps persist (Erulkar & Bello, 2007; Dunne et al., 2013; Unterhalter, 2017). A review of some these interventions by the Independent Commission for Aid Impact (ICAI, 2012) revealed that many of the genders in education intervention projects are failing to achieve their objectives and are particularly finding it difficult to stimulate attitudinal changes among various stakeholders, including religious, traditional and political leaders.
3.4.5. Regression Analysis of the Determinants of Learning Outcomes
In this section, EGRA dataset on children enrolled in grades 2 and 3 are used to study the determinants of low level of student achievement in Nigeria. The sample comprises of 3,803 pupils from 257 primary schools where students were assessed in the Hausa and English languages which assessed the reading ability of grade 2 and grade 3 students in public and government-Islamiyya or IQTE (non-formal integrated Qur’anic/Islamiyya and Tsangaya Education) schools. The sample includes 127 government schools and 128 IQTE centres. The dataset includes a rich set of controls for child, family, school and teacher factors. Child-specific factors include information on student truancy. Since that pre-primary school attendance is key to school readiness and some children in Nigeria do attend nursery school, our regression model also accounts for this. Other child-specific factors include whether the child was absent from school the last week before the test and whether s/he ate a meal at home before coming to the school. Family-specific factors include indicators of (top four) wealth quintiles of the household. Among teacher-specific factors, we include an indicator of teacher absenteeism. School-specific factors include the presence of facilities (e.g. library, electricity, drinking water and toilet), the teacher-student ratio (TPR), whether it is a government school and whether the head teacher is a woman. Figure 3.4.11 summarizes the mean scores for oral reading fluency (ORF) in Hausa by school type. In case of correct letter sound identification per minute (CLSPM), over 60% zero. In case

180
of correct non-word decoding per minute (CNWPM), oral reading score (ORF) and reading comprehension, over 80% student score zero in the main sample. Only in case of listening comprehension is the percentage of children scoring above zero is high. Figure 3.4.11: Mean Scores in Correct Letters ğper Minute, Non-Word Decoding and Oral Fluency, EGRA 2014
Table 3.4.2 presents OLS regression estimates of the determinants of CLSPM, CNWPM and ORF. Consistent with figure 3.4.1, government school students have noticeably low scores compared to their peers from IQTE. However, all else equal, spending an extra year in school (i.e. being enrolled in grade 3) has no significant influence on learning outcomes. The coefficient on pre-school attendance is only significant (and positive) in case of CNWPM. Another school readiness indicator, being absent from school last week, is only significant and negative in case of CLSPM. Eating a meal before coming to school and speaking Hausa at home does not affect learning outcomes. Turning to family factors, wealth matters only in case of CLSPM – in other two learning outcomes, wealth variables are insignificant. Among school-level factors, provisions of a library and toilet are significantly and positively associated with all there domains of language skills. In contrast, teacher-pupil ratio is always insignificant. While electricity has a positive correlation, the negative association between learning outcomes and drinking water provision is counter-intuitive. The (language) teacher absence on the day of the test significantly lowers test scores in terms of CLSPM and ORF. Table 3.4.2: OLS Regression Estimates of Competencies in EGRA (Hausa) 2014
(1) (2) (3)
VARIABLES CLSPM CNWPM ORF
female -0.629 -0.951* -1.516**
(0.513) (0.377) (0.585)
Enrolled in grade 3 0.806 0.510 0.586
(0.575) (0.402) (0.618)
Government school -4.156** -8.645** -17.13**
(1.171) (1.292) (2.283)

181
age 0.743** 0.731** 1.350**
(0.167) (0.109) (0.189)
Attended KG school 0.860 0.970* 0.987
(0.586) (0.452) (0.663)
Ate meal at home 0.482 0.266 0.594
(0.677) (0.500) (0.725)
Language Hausa 0.867 0.528 0.452
(0.674) (0.669) (1.109)
Absent from school -0.948* -0.319 -0.238
(0.481) (0.414) (0.636)
Teacher absent -1.564** -0.570 -1.444**
(0.485) (0.385) (0.559)
Family wealth: q2 0.506 -0.119 0.220
(0.768) (0.571) (0.850)
Family wealth: q3 1.652* 0.251 -0.0156
(0.764) (0.657) (0.943)
Family wealth: q4 2.180* 0.535 0.727
(0.876) (0.639) (0.990)
Family wealth: q5 2.151* 1.151 1.839
(1.019) (0.839) (1.300)
School: TPR -0.00124 0.00113 0.00228
(0.00156) (0.00141) (0.00223)
School: female HT 1.160 1.297* 1.525
(0.996) (0.651) (1.086)
School: library 2.525** 1.111+ 1.689+
(0.887) (0.625) (0.949)
School: electricity 1.194 1.302+ 2.388*
(0.849) (0.689) (1.134) School: drinking water -1.970** -1.467** -2.514**
(0.577) (0.443) (0.654)
School : toilet 2.100** 0.983* 1.522*
(0.576) (0.404) (0.639)
Constant -2.594 1.597 5.214
(2.520) (1.815) (3.236)
Observations 2,831 2,832 2,827
R-squared 0.126 0.184 0.216
Notes: (1) Survey weights have been used to estimate the regression model. (2) Robust standard errors are reported. Given that the overall level of learning is low, perhaps it is more meaningful to study the determinants of zero scores instead of total scores. Table 3.4.3 presents Probit estimates of the determinants of zero scores in five Hausa sub-tasks. Only marginal effects are reported. Once again, there is no systematic return to time spent in school – being enrolled in grade 3 significantly lowers the probability of a zero score only in case of CNEPM and ORF. Students of government schools are significantly more likely to have zero scores while older students have a significantly lower probability of zero scores. Differences in pre-school attendance do not matter. The (language) teacher absence significantly increases zero score probability in case of CLSPM and reading comprehension. The provision of toilet, electricity and library also lower the probability of zero scores. However, family wealth doesn’t matter with the exception of CLSPM.

182
Table 3.4.3: Probit Regression Estimates of Zero Scores in EGRA (Hausa Sub-Tasks) 2014
VARIABLES
Letter-sound identification
(CLSPM), zero score
Non-word decoding
(CNWPM), zero score
Oral reading score (ORF)
Reading comprehension, zero score
Listening comprehension, zero score
female 0.0264 0.0441* 0.0395+ 0.0360* 0.0173
(0.0336) (0.0211) (0.0219) (0.0183) (0.0149)
Enrolled in grade 3 -0.0527 -0.0660** -0.0707** -0.0226 -0.0202
(0.0372) (0.0225) (0.0240) (0.0199) (0.0191)
Government school 0.127* 0.171** 0.254** 0.249** 0.00906
(0.0517) (0.0458) (0.0466) (0.0498) (0.0236)
age -0.0397** -0.0329** -0.0366** -0.0278** -0.0350**
(0.0103) (0.00530) (0.00570) (0.00449) (0.00575) Attended KG school -0.00792 -0.0178 -0.0205 -0.0239 0.00500
(0.0352) (0.0227) (0.0239) (0.0201) (0.0193)
Ate meal at home -0.0135 -0.0236 -0.0372 -0.0292 -0.0487*
(0.0443) (0.0269) (0.0272) (0.0219) (0.0241)
Language Hausa 0.0168 -0.0247 -0.0666* -0.0470* -0.113**
(0.0608) (0.0318) (0.0273) (0.0233) (0.0379)
Absent from school 0.0570 0.0275 0.0297 0.0240 0.00654
(0.0390) (0.0218) (0.0228) (0.0186) (0.0161)
Teacher absent 0.123** 0.0174 0.0254 0.0602** 0.0164
(0.0331) (0.0216) (0.0225) (0.0156) (0.0176)
Family wealth: q2 -0.00773 0.0245 -0.000988 -0.000160 -0.0503**
(0.0525) (0.0366) (0.0408) (0.0350) (0.0168)
Family wealth: q3 -0.169** -0.0116 -0.0173 -0.0123 -0.0659**
(0.0546) (0.0398) (0.0405) (0.0349) (0.0172)
Family wealth: q4 -0.149* -0.0256 -0.0157 0.00917 -0.0855**
(0.0589) (0.0417) (0.0408) (0.0329) (0.0193)
Family wealth: q5 -0.202** -0.0399 -0.0368 -0.0220 -0.108**
(0.0625) (0.0457) (0.0463) (0.0397) (0.0206)
School: TPR -0.00124 -0.00011 -0.00208 -0.00104 -0.00013
(0.000123) (6.62e-05) (7.00e-05) (5.63e-05) (7.62e-05)
School: female HT 0.0300 -0.0766* -0.0677+ -0.0384 0.0152
(0.0853) (0.0339) (0.0380) (0.0327) (0.0534)
School: library -0.121** -0.106** -0.126** -0.104** -0.0413*
(0.0441) (0.0400) (0.0413) (0.0358) (0.0208)
School: electricity -0.0921* -0.0718* -0.0695* -0.0254 -0.0494**
(0.0410) (0.0314) (0.0326) (0.0230) (0.0181)
School: drk water 0.0801** 0.0839** 0.108** 0.0738** -0.0181
(0.0306) (0.0239) (0.0253) (0.0207) (0.0150)
School : toilet -0.193** -0.0466* -0.0550* -0.0435* -0.0443*
(0.0302) (0.0211) (0.0225) (0.0186) (0.0188)
Observations 2,832 2,832 2,832 2,832 2,832
Notes: (1) Survey weights have been used to estimate the regression model. (2) Robust standard errors are reported. In conclusion, the level of student learning is low in Nigeria across all all four sample states. The quality of education delivered is so low in government schools that even pupils attending IQTE centres outperformed their government school peers. The low performance of government school is not owing to the subject of assessment. Although not reported, we repeated the analysis

183
using student performance data in English which is available only for government school students. However, the level of learning is also low in case of English. This could partly explain the demand for madrasahs in Nigeria. While we have looked at the role of a number of inputs, we do not find a clear pattern in the association between resources and student outcomes. At the family level, the resource effect is largely absent. However, in case of school factors, provisions of electricity, library and toilet seem to matter along with teacher absenteeism. The negative influence of teacher absenteeism highlights the lack of accountability and commitment among teachers.
3.4.6. Stakeholder perceptions
While the stakeholder survey took place in three states, responses from two states (Sokoto and Oyo) have been analyzed. The sample comprised of school teachers, principals and official of state ministry of education and local government education authority. The non-school stakeholders included officials from local NGOs, international and national organisations working in education and development issues. The majority of the stakeholders (over 40%) interviewed in Nigeria identified school leadership (or effectiveness of the principal) and high learning outcomes of school children as the most important features of an effective school. This was followed by an emphasis on continuous professional development of teachers, a supportive learning environment for children, frequent monitoring of teaching and learning activities. A good number of stakeholders also identified active engagement of parents and community as an important feature of an effective school. However, only around 10% respondents identified regular presence of teachers (or low teacher absenteeism) as important. Physical facilities were not perceived as important by anyone despite mounting evidence on low provision and depreciated nature of facilities (Gershberg et al. 2016). The emphasis on leadership and learning outcome is, however, in consonance with prevailing themes in Nigerian literature and news in the recent time, which possibly influenced the opinion of the respondents (see Adamu, 2017; Sani-Othman, 2017; Vanguard, 2017). Given the importance of school leadership, stakeholders were asked to name the three most important features of an effective school principal. For comparison purpose, they were also asked to describe the three most important factors that define an effective school teacher. Figure 3.4.12 reports stakeholder responses as proportion of respondents identifying a category as one of the three most important features. Data is presented separately for responses relating to principals and teachers. The total does not add up to 1 since we sum across three responses for each y-axis category. The majority (nearly 50%) identified being “well-qualified/trained” as the most important feature of an effective principal. This was followed by being “focused on improving teaching and learning practices”. Nearly 40% of the respondents also identified proven leadership experience as one of the most important features for an effective principal. Promoting learning opportunities, nurturing healthy student-teacher and parent-teacher relationship and being motivated were ranked as important by around 20% stakeholders. In case of an effective teacher, being “well-qualified/trained” was identified by over 60% stakeholders as the most important feature. This was followed by “being good at communication”, “being supportive of weaker students”, “focused on improving teaching and learning practices”, “good at engaging with children”, “promoting learning opportunities” and so on. Surprisingly, being teacher motivation was not identified as important. As noted above, there has been increasing discussion on teacher quality and performance across Nigeria lately in

184
response to a widely reported failure of primary four examination by 21,780 teachers in Kaduna state. However, this contradicts slightly the finding of the report of National Assessment of Learning Achievements in Basic Education (NALABE) NALABE conducted in 2011, which shows that that irregular payment of salaries and inadequate support/motivation from Government were top possible factors for low teacher morale (UBEC, 2013). Figure 3.4.12: Important Features Of An Effective School Principal And Teacher
Source: Authors’ calculation based on stakeholders survey data.
Participating stakeholders were also asked about their views on the main barriers to quality education at the primary and secodnary level in Nigeria (Figure 3.4.13). In both primary and secondary, lack of funding and facilities were described as the most important of all barriers. In case of primary school, the lack of good and motivated teachers were the third and fourth most common response. Nigeria has very diverse linguistic groups. While the language of instruction was considered to be a challenge in primary education, it was not so in secondary education. Other studies (e.g. Ezegwu, 2013, 2017; Humphreys & Crawfurd, 2014) show that language of instruction remains a critical issue in the educational quality and learning outcomes in Nigeria, especially in the rural areas. Possibly, because most respondents in the two states were drawn from urban areas where confluence of languages result in English and Pidgin English becoming major languages of interaction, might have influened this opinion. In case of secodary school, there were noticable differences in stakeholders’ perceptions of barriers. The lack of good teachers, school leadership and teacher motivation ranked as the third, fourth and fifth most common response. Once again, none of the stakeholders recognized the lack of autnomy as a matter of concern. This is consistent with the fact the majority of the respondents also did not consider decentralization of school management as important for improving school quality in Nigeria
0 0,1 0,2 0,3 0,4 0,5 0,6 0,7 0,8
Well qualified/trained
Focused on professional development
Focused on improving teaching & learning…
Motivated
Promotes learning opportunities…
Robust and rigorous in self-evaluation
Ensures progress and personal…
Assesses and tracks pupil progress
Supportive of weaker students & provides…
Good at communication
Good at engaging w students, making a…
Secondary Primary

185
Figure 3.4.13: Main Barriers To Quality Education At The Primary And Secodnary Level
Source: Authors’ calculation based on stakeholders survey data.
Given these responses, stakehodlers were asked to identify three factors that they considred as most important for improving education quality in Nigeria. The most common response was greater provision for teacher development programs and ICT facilities. This is consistent with the fact that resource-gap was also identified as the most important barriers by the stakeholders. The third most common answer was greater involvement of parents. 30% respondents emphasized on student-specific issues such as improving communication skills and promoting student-centred learning Although madrasahs or Islamic school is common in northern Nigeria, stakeholders did not consider higher provision of madrasahs as critical for improving education quality; less than 5% stakehodlers considered madarasas as important. If anything, there was apparently a greater support for the provision of affordable private schools (10% of the respondents considered this as important for improving education quality) or after school hours private tuition. Oyewusi & Orolade (2014) highlight prevalence of private tutoring in Nigeria and how controvasial they have become in relation to cost, corruption and outcome. But the overall concesus is that improving education quality in Nigeria is not just a matter of better acecss to a specific type of school – Islamic or private non-religious. Demand for decentralization also did not feature prominently in stakeholder responses – around 10% stakeholders identified this as important. As noted in sections 2.1 and 4.2, Nigeria’s education system is very much decentralized in terms of governance, management and operation. Since the lack of funding and facilities were described as common barriers to quality education at the primary and secodnary level, the stakeholders were asked about the state of funding of government schools in Nigeria. The majority of the respondents perceived government schools to be inadequately funded, both at primary and secondary level. In order to ascertain in what
0 0,1 0,2 0,3 0,4 0,5 0,6 0,7 0,8
Lack of effective school leadership
Lack of school autonomy
Lack of funds
Pressure of external evaluation
Lack of facilities
Lack of teacher motivation
Lack of good teachers
Language of instruction
Inappropriate curriculum/book content
Lack of parental involvement
Other
Secondary Primary

186
way funding could help address the problem of low quality, stakeholders were asked to comment where extra funding could be spent, if money became available, to improve the quality of education. The majority identified improving school building as one of the three most important priorities for improving education quality (Figure 3.4.14). This is true for both primary and secondary education. In case of primary education, other perceived priority investment areas (in order of importance) were (a) increasing teacher salary, (b) more scholarship targeting children from poor families, (c) develop new teaching/learning materials, (d) additional funding for under-performing rural schools, (e) ICT facilities for rural schools, (f) hiring more teachers to reduce class size, (g) free provision of learning materials and so on. There was little support for building more schools or new classrooms. It is noteworthy that in the literature shortfalls in the learning facilities, especially the ICT facilities, qualified ICT teacher, lack of electric power supply, obsolete computers and slow internet connectivity are observed across Nigeria, especially in the rural areas were observed (Ohiwerei, Azih & Okoli, 2013; Owolabi, Oyewole & Oke, 2013). In case of primary education, other perceived priority investment areas (in order of importance) were (a) develop new teaching/learning materials, (b) more scholarship targeting children from poor families, (c) increasing teacher salary, (d) ICT facilities for rural schools, (e) additional funding for under-performing rural schools, (f) hiring more teachers to reduce class size, (g) free provision of learning materials and so on. Once again, there was little support for building more schools or new classrooms. Figure 3.4.14: Main Priorities for Investment to Improve Quality Education at the Primary and Secodnary Level
Source: Authors’ calculation based on stakeholders survey data.
0 0,1 0,2 0,3 0,4 0,5 0,6
More scholarship for poor children
More spending on school building
ICT facilities for rural school
Additional funding for low-…
Develop new teaching/learning materials
Free provision of learning materials
Free provision of after-school extra tuition
Increase teacher salary
Hire more teachers to reduce class size
Hire more female teachers
Improve guidance and counseling service
Build more schools
Build more classroom
More in-service provision
Placement of teachers to overseas/high-…
Student centered learning
Soft skills
Leadership training program for head…
Secondary Primary

187
Lastly, the majority of the stakeholders interviewed agreed that Nigeria could adopt teaching and learning practices from other countries that have been successful in the field of education. However, a third of the respondents identified the USA as the potential country example, followed by the UK and Ghana. The reference to the USA, despite its poor performance in internatoinal student assessments, highlights the strong influence of USAID in shaping the staekeholder views in Nigeria. While USA and Ghana may not have best the edcation system in the world, their schools, along with the UK schools, are very popular among Nigerias and are also considered to have better education management and quality than Nigeria (Da Coster, 2011; Adesulu, 2015).
3.4.7. Conclusions
Nigeria and her international partners have invested enormously in diverse strategies and intervention programmes that have been directed at ensuring universal access to education. These strategies are commendable but their impact has been relatively limited due to multifaceted factors. First, the many stakeholders identified lack of funding and, inadequate and poor state of facilities as significant barriers to quality education in Nigeria, which was linked to underperformance among schools. Globally Nigeria ranks very poorly in terms of spending on education (Jones et al. 2014; Ogbonna, 2016). Financial shortfalls and poor management tend to affect the supply, maintenance and retention of both human and material resources that are needed in the provision of quality education. The inability of some states to access the UBE fund, effectively manage the available resources and prioritize resource utilization contributes to weaken the government capacity to provide quality education equitably. The stakeholders stressed on the need for more spending on ICT infrastructure in rural schools. Similar observations were also made in the literature. Second, there exists a serious income gap in terms of access. A significant percentage of children across the country remains out of school and the country has maintained an unbeaten record of the highest number of out-of-children in a single country for many years. Regional and gender imbalance in education that have been the central focus of the UPE and also the UBE remain pervasive. Different categories of children such as the almajirai are yet to be fully integrated into the country’s education system. The need for more scholarship for children from poor families was perceived as important to improve education quality in case of primary and secondary education where there is universal coverage. This can be explained by the fact that poverty is still widespread in Nigeria and remains a major barrier for children’s education, particularly in rural locations. Third, Nigeria has a very robust inclusive, access and quality education policy and strategies but challenges lie in the effective implementation of these strategies. International Development Partners’ led initiatives appear to be more successful that the government led strategies, albeit both externally and locally led initiatives are affected by local socio-political and economic environment. The provision of 2% of the government’s consolidated revenue fund for financing of the universal basic education (of which 50% is directed towards the provision of educational infrastructural facilities) is strategic but the outcomes have been limited. Similarly, various strategies, such as the Integrated Almajiri Education Programme and Girls Education Programme are very relevant but reports of their implementation and outcome (such as 2012 ICAI report) suggest they have made minimal impart. Cultural practices and strongly held values contribute to hinder effective social transformation and the existing interventions appear not to be very effective in dealing with them. Low political will and commitment also tent to contribute

188
to make the policies relatively ineffective. Important strategies like School Based Management Committee (SBMC) and Community Accountability and Transparency Initiative (CATI) that have capacity to promote good governance in education and promote provision of quality education have either been poorly implemented or completely failed. Fourth, both quality input and learning outcomes are still below the standard. The education budget, teacher supply and quality, infrastructure and effective coordination of the education sector still demand critical attention. There is a severe shortfall in qualified teacher supply leading to a very high teacher-pupil ratio. Hiring more teachers to reduce class size and increasing teacher salary were particularly emphasized as priority areas for investment if extra funding became available. The low-quality inputs are evidence of the learning outcome. Learners at all levels do not fully show they are learning enough. The gap between the country's set quality and learning standard and what learners actually manifest at the completion of different levels of education. These suggest critical attention to quality issues in Nigeria education. Fifth, Nigeria is not strongly integrated into the global survey and assessment frameworks like Trends in International Mathematics and Science Study (TIMSS), Programme for International Student Assessment (PISA) and Progress in International Reading Literacy Study (PIRLS). Information on nationwide learning outcomes are sparse and do not seem reliable. Yet they suggest very low student learning outcomes. Sixth, limited information exists on the actual number of and formal education learning outcomes in madrasahs. This is partly because, besides those that offer formal education curriculum, they are not largely seen as formal education and their students are largely considered as being out of education. Seventh, some of the key factors that keep children out of education are linked to poverty (such as early marriage and child labour) and inability to meet cost of education by households’, and various poverty related interventions appear not to be effectively addressing these. Some of the resultant effects of these are drops in enrolment rates and an increase in the number of out-of-school children instead of a decrease. It is acknowledged that insecurity is a contributing factor but both the government and various international actors have emphasized Boko Haram have been, which majorly targeted education has been decimated (Guardian, 2015; Premium Times, 2016; UNICEF, 2016), suggesting that it might have not contributed to the current upsurge in out-of-school-youth – from about 10.5 million in 2014 to about 13.2 million in 2017. There are indicators that the existing interventions need critical evaluation because they are not effectively addressing the root factors that keep the poor away from school (see aslo IACI, 2012, Usman, 2008).
3.4.8. Recommendations
In light of the above findings and conclusions, following recommendations are made:
First, specific attention needs to be given to how quality education is promoted across the country. Assessment of learning outcomes suggests that more than half of the children in school cannot read or write. MICS data links low learning to households socioeconomic status: children in poorer households tend to have lower learning outcomes than those in richer homes. The MLA data also shows that despite diversity of interventions, education qualiy is declining. The quality of public schools is rated poorly. Multivariate analysis of the determinants of early grade

189
achievements indicates that government school students have noticeably low scores. At the same time, across the country, quality in terms of adequacy of inputs varies across states and geopolitical zones. This indicates a serious need for a review of the supply of various quality input factors and basic education delivery strategies. Conflict and insecurity is also negatively affecting affect educational access, infrastructure and other quality inputs. However, the quality of education in zones that are not affected by widespread violence, such as northwest zone, is also remarkably low. Second, serious attention needs to be given to resource mobilization for the provision of quality education to the poor. Critical attention should also be given to how resources are allocated and utilized. Financial constraints affect the ability of the government to provide free quality education for every Nigerian child. Increased funding is required in the aspects of funding of key quality inputs such as teacher supply, training and equipment of teachers and supply of learning materials. Studies reviewed mention financial shortfalls as a major reason for the low quality inputs. Both the literature and significant proportion of respondents pointed out the need to give attention to the provision of requisite infrastructure and teacher development. Manpower development needs to be supplemented with provision of teaching materials while engaging the government to judiciously use the UBE funds to provide educational infrastructures. Besides, there is also need to prioritize what is provided with limited available resources, where and how they are provided. The UBEC reports emphasize that many states have not been able to access the UBE fund often due to their inability to meet conditions for accessing the funds. Various observers have highlighted how corruption and misappropriation of fund contribute to affect states capacity to provide quality education for the poor. These make it necessary for interventions in the provision of quality basic education to also take into account the funding environment and seek for ways to create enabling environment for sustainable funding and prudent utilization of the earmarked basic education funds.
Third, institutionalization of regular nationwide learning assessment is an urgent need in Nigeria’s basic education sector. As explained in the learning outcome section, nationwide learning assessment is lacking at the basic education level. The existing state level examinations are not largely available to the public for comparison. To understand the quality issues across the states, there is need for publicly available information on pupils performances in state-level examinations at the basic education sub-sector. The state-level exams also need to be harmonized to ensure that students in every state take similar examinations and the results of the examinations can be compared to understand locations where additional quality related interventions are required. It is also necessary to institutionalize regular and nationwide learning assessment at various levels in Nigeria to help in monitoring of teaching and learning outcomes, through the establishment of regular and systematic assessment system at the basic education level. Similarly, there exists an extant need to harmonize education data and evaluation system. Existing data on students’ performance vary and do not measure similar issues across years, levels and locations. It is also necessary for independent evaluations like Trends in International Mathematics and Science Study (TIMSS), Programme for International Student Assessment (PISA) and Progress in International Reading Literacy Study (PIRLS) to be introduced into the country and the existing ones like LearnNigeria be expanded to every state.

190
Fourth, strong political will is required to address the income gap and promote distributive justice in education. Although various interventions such as conditional cash transfer are directed at closing some economic-induced gaps, such strategies require strong political will to implement effectively and prevent fund diversion. Different tiers of the government need to be encouraged to seriously commit themselves to ensuring effective pursuit of both equity and quality issues in education across Nigeria and making adequate budgetary allocations to it. While IDP led projects appear to be contributing to close some gaps, the may not be sustainable at the expiration of the donor funding timeline. The government needs to expand its strategies and engagement with non-state actors and corporate bodies to raise regular fund for the basic education sector. Possibly a special arrangement may need to be made for regular donations, channeling of corporate social responsibilities and other support into the special basic education fund by the private sector besides the current tax fund which only 2% are allocated to the basic education sector by the Federal Government. Fifth, civil society engagement need to advance beyond playing advisory roles and mobilizing resources for local schools, there is need to provide an effective mechanism and build the civil society capacity to track education resources. The CATI need to be resuscitated while and the SBMCs needs to be made functional in each community to ensure civil society involvement in monitoring and evaluation of input and outcomes in the education sector. International support should particularly give attention on building capacity of the country on transparent resource utilization to minimize waste. Besides the issue of funding, evidence shows that SBMC is not operational in substantial percentage of schools across the country. Both the government and its partners need to give targeted attention to spreading, strengthening and sustaining the SBMC to ensure civil society participation in both financial and non-financial management of schools. Sixth, the integration madrasah into formal education needs to be strengthened. Evidence points to both political and traditional obstacles to integrated Qur’anic, Islamiyya, and Tsangaya schools. On the political side, after the previous efforts by the previous political administration in the country, subsequent administration appear to have given relatively limited attention to the integration of formal and Qur’anic education. Various reports also suggest that the existing integrated almajiri schools are either being put into different uses other than their original purpose of establishment while some others are falling apart without adequate care by either the federal or the state government. The OLS regression estimates of the determinants of CLSPM, CNWPM and ORF shows that the quality of in IQTE centres appears better than that of the government schoold system. The historical suspicion and rejection of the formal education in many traditional societies, such as nomadic Fulani groups, need to be addressed by establishing strong linkage between the providers of formal education, government, religious and traditional institutions. Such cooperation is needed to raise awareness and local support for formal education and promote acceptance and enrolment in the integrated schools. Seventh, comprehensive census of children with disabilities and effective implementation of special needs education policy are urgently needed. Children with disabilities are still relatively invisible as regards access to quality basic education in Nigeria. Reliable nationwide data on their numbers, nature of disabilities and what is currently being done remains scarce. This hinders meaningful special needs education planning, investment and intervention. Information from the literature suggests that inadequate attention is currently being given to issue of disability in education and the special needs education lacks adequate funding, monitoring and support.

191
Eight, underpinning causes of gender inequality demand urgent and critical intervention. Multiple interventions specific to girls’ education are in place across Nigeria, especially in the northern part. However, as independent reviews of some of the projects show, the projects appear not to be achieving their goals and are finding it difficult to influence attitudinal change among different stakeholders. Nigeria also needs to explore homegrown initiatives for dealing with entrenched gender and cultural practices that underpin gender inequality in education. While the almijiri education project and the boy child education projects are listed as key UBE gender-related intervention projects, their implementation has been very weak. The almajiri education has not been sustained; limited information exists on the operation of the boy child education project in the southeast and south-south zones.
Lastly, further investigation is required to understand what works for and ways to ensure effective provision of quality education for the poor and sustenance of IQTE and Almajiri education in Nigeria. Over the years, the number of the almajiri has increased though reliable information on them is lacking. Besides, the madrasahs that do not provide formal education curriculums are not included in the education statistics and their students are often reported as being out of school in the formal school statistics. There is need to understand the actual number of the schools that do not offer formal curriculum. It is equally important to understand what works in keeping children in integrated IQTE and factors that contribute to make the integrated IQTE effective from the perspective of the teachers, students and poor households. Such investigations are also required to understand how factors work to reinforce poverty related issues in ways that tend to weaken the effectiveness of existing interventions and quality education strategies.

192
4. CONCLUSIONS AND RECOMMENDATIONS
Educational attainment in most OIC countries has expanded from a privileged few to large masses of the population over the last two decades. However this has also created numerous policy challenges. The quality of education has not improved while access increased. This remains an important explanation for the decline in labor market returns to education in the Middle East and North Africa (MENA) region, which has frustrated the youth causing political unrest in some countries. The lack of further educational development is one of the most serious threats to long-term growth and prosperity of most OIC countries. Given the youthful population of most Muslim countries, quality education is key to ensuring greater skills and capabilities in the workforce at a time of globalization and changing labor market conditions. Quality education is also central to achieving SDG 3 (Ensure healthy lives and promote well-being for all at all ages) and SDG 5 (Achieve gender equality and empower all women and girls) by 2030. It is in this context that this report examined the state of education quality in the 57 OIC member countries. In the first chapter of this report, a framework was presented to conceptualize quality education. A high quality education system was defined in terms of high intake, high retention and ensuring basic numeracy and literacy for all. In the second chapter, the framework was use to motivate the statistical analysis of indicators of education quality. In addition to highlighting the broader trends in the OIC member countries, the analysis painted a comparative picture of student performance vis-à-vis other non-OIC countries. This was based on international assessments of student performance such as TIMSS and PISA. In all assessments, the OIC as a group showed a declining trend in education quality, measured in terms of student achievement in math, science and reading. In terms of learning in school, children in many wealthy OIC countries are falling behind those from economically much poorer countries. Country case studies also reveal significant inequalities in within-country resource distribution across regions, schools and grades. At the same time, children from the lower socio-economic strata were underrepresented in the sub-population of top performing students. This highlighted the problem of low quality and high inequality in learning outcomes in the OIC member countries, compared to their OECD counterparts. Economically worse-off member countries are under-represented in international assessments. Hence evidence of the state of education quality is limited for these countries. However, desk review of the evidence based on country-specific assessment exercise confirms that these countries are very likely to be undergoing severe learning crisis. Newly available evidence shows a flat learning profile (i.e. weak empirical relationship between years of schooling completed and the level of learning achieved) in Afghanistan, Bangladesh, Pakistan and Nigeria. A number of barriers to children’s access to quality education were highlighted in the report. These included poverty (family wealth), location, gender as well as system-wide problems such as lack of accountability, shortage of qualified and motivated teachers. Below is a list of preliminary recommendations to national governments, as well as to the broader international community and development partners, to improve education quality in OIC countries based on statistical findings as well as interview responses gathered from and lessons learned from 4 country case studies, which have emerged from this research.

193
Efforts should be made to make teaching an employment of choice. Stakeholders in case study countries frequently equated problems of education quality with gaps in resources and physical inputs. However, the majority agree that teachers are the most important factor affecting learning in schools and yet are in short supply in many OIC countries. Evidence indicates that the level of competencies and knowledge among teachers remain low in OIC member countries, particularly in schools serving the most excluded and poorest. Teachers also lack the ability to transfer their own knowledge effectively to their pupils. At the same time, filling this gap in the supply of qualified teachers is not sufficient to raise quality. More critical is the issue of motivation and integrity among teachers. In high performing countries such as Singapore and South Korea, many top graduate students aspire to enter the teaching profession. This is not the case in most OIC countries. Teacher pay is particularly poor, and often irregular, in government schools in Nigeria and Pakistan. Attracting best candidates to teaching remains a major challenge.
Accountability in the education sector needs to be improved. The lack of accountability is a key reason for the poor returns to public spending in education in OIC countries. This also disproportionately affects children in poor countries and communities. While any single actor is not responsible, accountability starts with government. Accounting for system-wide problems such as teacher absenteeism in government schools in the primary and secondary sector is critical. Accountability measures are lacking at various levels of the education system. Teacher truancy is a significant challenge in OIC countries. Stakeholders interviewed in Nigeria, Malaysia and Jordan all worried about the lack of teacher motivation. Available options to improve accountability include contract-based appointment or the introduction of performance incentives. Other measures include dissemination of information on performance of the school, greater involvement of different stakeholders in educational management and the use technology for real time reporting, deepening democratic processes and holding decision makers to account for service delivery in geographically remote locations. A notable example is the Punjab Information Technology Board (PITB), the IT-arm of the Government of Punjab, Pakistan. The tablet-PC and smart-phone based systems of PITB leverage mobile technologies and open-source platforms to design terrain-viable solutions for real-time monitoring, on-spot assessment, and citizen feedback. Re-orient curricula and teacher training programs. The exclusive focus on school enrolment and completion during the MDGs era has undermined progress in terms of improvements in learning outcomes. The curricula and teacher training programs did not prioritize basic competencies – students transited to higher grades without acquiring basic competencies. In some instances, this involved reliance on over-ambitious school curriculum. While school enrolment increased significantly, learning outcomes did not improve. Reforms therefore should focus on making the learning process child friendly; teachers also need to develop attributes of nurturing and care. Evidence indicates that pedagogical interventions that align teaching to student learning levels are effective at improving student performance. Curricula reforms and teacher training therefore should focus on the student’s understanding of the subjects and promote analysis instead of rewarding memorization. Child centered pedagogies integral to pre and in-service programs need to translate into active practice. New research is also required in OIC countries on changing the conventional mode of teaching-- to teach at the level of the student instead of relying on a fixed curriculum for all.
Adoption of new models, particularly ICT, must be informed by evidence and carefully designed pilot studies. Most of the stakeholders interviewed agreed the useful of borrowing models of teaching and learning that worked in other countries. SDG target 4.C also refers to the

194
need for substantially increasing the supply of qualified teachers, including through international cooperation for teacher training in developing countries, especially least developed countries. Many OIC countries already have such international collaboration schemes in place. Others (e.g. Jordan and Malaysia) have launched new projects to improve the quality of education by investing in ICT infrastructure in the education sector. While the use of ICT based teaching and learning models remain a popular choice to aid teachers and students, hard evidence on the efficacy of technology and software remains elusive. New ICT-based models therefore must be tried in small-scales and only be scaled up following an evaluation of their impact on learning outcomes. Maintain the credibility of national level student assessment systems. While participation in international assessments should be encouraged as a means to inform and aid government education reforms, equally important is to retain the quality and credibility of high-stake national examinations so that they truly capture the state of basic competencies and critical thinking skills. In Jordan, the majority students fail to clear the Tawjihi, creating tremendous pressure on students and school authorities. In contrast, the majority in Malaysia passes the equivalent Secdondary School Certificate Test (SPM) examination. The national examination system should be reformed to incentivize learning and ensure mastery of basic competencies. Invest to close the gender gap in enrolment as well as literacy and numeracy outcomes. Mothers play a big role in children’s later educational success in school. This highlights the importance of improving schooling and learning opportunities for girls given the positive spillover effect into the learning achievements of the next generation and achieve the SDG target 4.1 of ensuring that all girls and boys complete free, equitable and quality primary and secondary education leading to effective learning outcomes by 2030. However, while in middle-income OIC countries girls outnumber boys, the opposite is true in case of low-income member countries such as Nigeria, Afghanistan and Pakistan. In these countries, girls also lag behind boys in literacy and numeracy outcomes. In Pakistan, for instance, the pro-male gaps in learning outcomes are very large and persistent over time; there was almost no noticeable improvement in gender gap during the study period 2014-2016 and some regions (such as FATA, Balochistan and KP) continue to depict extremely high pro-male gaps in learning outcomes. These gaps greatly undermine the contribution of women to the economy. Further investments targeting girls’ school participation should be prioritized. Conditional transfers such as Female Scholarship Schemes have been promising in improving attendance and enrolment in OIC member states in South Asia. Such progress in girls’ schooling is lacking in African member states. Most importantly, evidence on the impact of conditional cash transfers on learning outcomes is weak.
Identify remedial policies to assist lagging students early through better early-childhood learning opportunities. Income poverty and poor health combines to limit early-life learning opportunities. The level of malnutrition and stunting is very high in some OIC member states such as Pakistan. Therefore, investment in child health and accessible quality pre-primary schooling can go a long way in removing inequalities in learning opportunities in later stages of school education. The importance of early development is already recognized in the SDGs target 4.2 i.e. ensuring that all girls and boys have access to quality early childhood development, care and preprimary education so that they are ready for primary education by 2030. Country-specific analysis of learning outcomes for Jordan, Malaysia and Nigeria also confirms the importance of pre-primary schooling. However, OIC member countries differ significantly in terms of the coverage of “Early Childhood Education and Development” (ECED). In majority countries, participation rate is low. In many instances, reliance on private providers limit access

195
among children from economically poor families. A related challenge is poor quality of education in the early primary grades. In most instances, student performance is evaluated in higher grades so that early signs of learning shortfalls are ignored. The rich-poor gap in learning outcomes should be closed. In many OIC countries, there are growing wealth gaps in student achievement. This implies significant inequality in access to quality education. Although poverty has declined in many OIC countries and most children are in school, educational opportunities are far from being equal. There is still a considerable socio-economic gap in learning. Learning gaps are largest for children from poor families even in countries where the overall level of learning is not high. This is partly because the quality of mainstream government schools in rural locations remains very poor and often only marginally better than alternatives such as madrasahs. Improving the performance of these schools is a key challenge. Pro-poor education models should be carefully studied and documented. Detailed statistical analysis of secondary and primary school student achievement data shows that family income still exerts a significant influence on student performance. In all four country case studies -- Nigeria, Jordan, Pakistan and Malaysia, children from economically poorer backgrounds have lower test scores. However, only a small number of countries have schools that succeed in providing quality education to children from poor families. This includes one-teacher non-formal schools run by the NGO, BRAC, in South Asia and the UNHCR schools in Jordan catering to Syrian refugee children. There are possibly other examples of inexpensive and innovative education service delivery within the OIC that improve student performance. But existing models of pro-poor education service delivery remains under-studied, limiting the scope for replication in other OIC countries. Equally, community led and home-grown initiatives for promoting provision of quality education and improve learning outcomes need to be explored considering that many existing pro-poor related interventions are often externally driven and have tended to have limited impact. Comprehensive evaluations of the community-based initiatives and interventions can also help in identifying relevant interventions that work best in different contexts and locations for effective provision of quality education for the poor. Of particular relevance is the institution of madrasahs which often operate in non-formal setting, outside the purview of the state. While madrasahs can be an important partner in educating children from poor families in Muslim communities, reforming and regulating these madrasahs remain an important challenge. There is an OIC-wide evidence gap on madrasah education. Increasing the supply of private schools need to go hand in hand with greater affordability. In many OIC countries such as Jordan, Nigeria and Pakistan, private schools are on the rise as alternatives to government schools. A variety of education Public Private Partnerships (PPPs) have also emerged within the OIC with differing owners, managers and financiers and with varying models focusing on learning outcomes, quality, access and equity. PPPs can play an important role in educational delivery in OIC countries. Existing reviews of the evidence on PPPs find mixed evidence of the extent to which the evaluated PPP models have improved educational quality and learning outcomes but more positive evidence of improved enrolments through some PPP initiatives. While in some OIC countries for-profit schools are found to offer better quality education, they are not always affordable. This is an important source of inequality in the education sector and risks widening the rural-urban gap in learning outcomes. Policies should be in place to help defray direct costs of private school enrolment through scholarship schemes or vouchers. Measures should be also in place to address spatial inequality in the concentration of private schools, particularly the issue of urban-bias in location choice.

196
Ensuring access to reliable data is key to building the evidence base and developing a participatory reform culture. In a very few OIC member states, researchers have access to government data. While relatively advanced countries such as Malaysia and Jordan also restrict access, these countries at least participate in international assessments of student performance. Data access is a serious issue in countries like Pakistan and Nigeria which also remain absent from international tests of learning outcomes. This remains a major challenge for a large number of OIC countries where not only millions are of school, half of those in school cannot also read or write. The lack of reliable data undermines the severity of learning crisis in the majority of OIC countries. ASER Pakistan offers a good example of citizen-sector led initiative of assessment of learning outcomes that other OIC member states can replicate. In addition, the OIC may encourage member countries to set a specific policy goal of participation in TIMSS and PISA by 2030. Low and lower middle-income OIC countries are poorly represented in international assessments such as TIMSS and PISA. This has limited scientific inquiry into the state of education quality is member countries. Since TIMSS and PISA are standardized assessments, they generate reliable comparable data for OIC-wide analysis as well as other regions. Currently very few member countries have specific plans in national policy documents. A coordinated participation in such assessments would help engage in periodic assessment of learning outcomes using an international framework such as the SDGs. The OECD already has an existing program -- the PISA for Development (PISA-D) initiative – to encourage and facilitate PISA participation by interested developing countries including OIC member states. Invest to build indigenous research capacity. Given the SDG target of achieving learning for all by 2030, more research is needed to identify the mechanisms for monitoring and reporting on SDG 4 and on education in the other SDGs. In particular, regular compilation of data on literacy and numeracy outcomes is needed to assess progress towards SDG 4. However, Education-Management Information System (E-MIS) is lacking in many member countries along with local capacity to conduct evaluation studies on existing programs designed to improve learning outcomes. Therefore, member country governments should strengthen institutional capacity for monitoring and evaluation and Research and Development (R&D) in the education sector.
Periodic research following up the findings presented in this report should be planned to inform future policy reforms on education in Muslim countries. The literature on what factors improve student learning is limited for the OIC member countries. Most importantly, there is no published OIC-wide analysis on the determinants of learning outcomes – this report is the first of its kind. Even then, the analysis was limited owing to the lack of data on learning outcomes, particularly in case of non-state schools such as madrasahs and private schools. While the report has identified a number of correlates of school quality, the exact aspect of school quality and the underlying pathways through which they affect learning outcomes is not fully understood. As more OIC countries participate in international assessments and more national data sets become available, it is critical that performance of a wider cross-section of OIC member states is documented. Given the enormous diversity among countries in terms of culture, history and income level, it is unlikely that a single model applies to all OIC countries. However, OIC countries do share common challenges such as demand for moral and religious education. The institution of madrasah is unique to OIC member states and yet found to differ in terms of quality across countries. In case of Nigeria, for instance, the model of Islamiyya Quranic and Tsangaya Education (IQTE) private schools appears to be working well to educate children from poor families. However, evidence on non-formal madrasahs (including Almajiri education) is lacking. Since millions are educated in madrasahs in Muslim countries, periodic follow up research using primary survey data exclusive to OIC countries is necessary to fully understand how such

197
institutions work to reinforce poverty related issues in ways that tend to weaken or strengthen the effectiveness of existing interventions to improve education quality.
Set up a Centre of Excellence to coordinate research and development in the field of education across OIC countries. Unlike the OECD’s The Centre for Educational Research and Innovation (CERI), the OIC countries do not have a prominent multi-government body offering extensive research work CERI covers learning at all ages, from birth to old age, and coordinates production of major research studies that inform member governments. CERI often has a longer timeframe than most work, typically aiming to set an agenda for the future, with a goal to ensure that the work is thoroughly integrated with empirical analysis and innovation awareness. Specific emphasis is put on accumulating statistical evidence to the value of its research work. This will help strengthen cooperation among member countries to facilitate dialogue and exchange of good practices. Initiatives such as this can help develop an OIC-wide learning metric to track progress in student achievement as a group of countries. In addition, the OIC should revitalize regional organizations such as ALECSO and ISESCO and leverage the existing institutional set up to develop a wider research programs in partnerships with member country governments.

198
REFERENCES
3IE (2016). The impact of education programmes on learning and school participation in low- and middle-income countries. Systematic Review Summary 7.
A Global Compact on Learning: Taking Action on Education in Developing Countries Center for Universal Education Brookings.
Ababneh, I., Abu Lebdih, K. and Tweissi, A. (2014). Mapping of Student Assessments in Jordan: Monitoring and Evaluation Partnership (MEP) Project. Amman, Education Reform for Knowledge Economy II.
Aburizaizah S., Kim Y., & Fuller B. (2016) Diverse schools and uneven principal leadership in Saudi Arabia. International Journal of Educational Research, 80, 37-48.
Adams, A. M. (2012). The Education Link: Why Learning is Central to the Post-2015 Global Development Agenda. Center for Universal Education.
Akkari, A. (2004). Education in the Middle East and North Africa: The current situation and future challenges. International Education Journal, 5(2), 144-153.
ALECSO (2017) Strategic Plan (2017-2020) Arab League Educational, Cultural and Scientific Organization (ALECSO) 2017, http://www.alecso.org/en/pdf/201701241034.pdf
ALECSO (2017) Strategy for the Development of Education in the Islamic World. Altinok, N. & Kingdon, G. (2012). New evidence on class size e_ects: A pupil _xed e_ects
approach. Oxford Bulletin of Economics and Statistics, 74(2), 203-234. Altwaijri, Abdulaziz Othman (2014) The Islamic World and Millennium Challenges, the Islamic
Education, Science and Culture Organization (ISESCO). Andrabi, Tahir & Jishnu Das & Asim Ijaz Khwaja (2012). What Did You Do All Day?: Maternal
Education and Child Outcomes. Journal of Human Resources, University of Wisconsin Press, 47(4), pages 873-912.
Andrabi, Tahir, Jishnu Das, & Asim Ijaz Khwaja. (2008). A dime a day: The possibilities and limits of private schooling in Pakistan. Comparative Education Review, 52(3), 329–55.
Andrabi, Tahir, Jishnu Das, and Asim Ijaz Khwaja. 2015. “Report Cards: The Impact of Providing School and Child Test Scores on Educational Markets.” Policy Research.
Aromolaran, A. B. (2004). Wage returns to schooling in Nigeria. African Development Review, 1693, 433-55.
Aromolaran, A. B. (2006), Estimate of Mincerian returns to schooling in Nigeria. Oxford Development Studies, 34(2), 265-89.
Asadullah M Niaz and Maliki (2018). Madrasah for Girls and Private School for Boys? The Determinants of School Type Choice in Rural and Urban Indonesia, International Journal of Educational Development (forthcoming).
Asadullah, M N., & Chaudhury, N. (2013). Peaceful coexistence? The role of religious schools and NGOs in the growth of female secondary schooling in Bangladesh. Journal of Development Studies, 49(2), 223-237.
Asadullah, M N., & Chaudhury, N. (2009). Holy alliances: Public subsidies, Islamic high schools, and female schooling in Bangladesh. Education Economics, 17(3), 377-394.
Asadullah, M N., & Chaudhury, N. (2009). Reverse gender gap in schooling in Bangladesh: Insights from urban and rural households, Journal of Development Studies, 45(8), 1360-1380.
Asadullah, M N., & Chaudhury, N. (2010). Religious schools, social values, and economic attitudes: Evidence from Bangladesh. World Development, 38(2), 205-217.

199
Asadullah, M N., & Chaudhury, N. (2015). The dissonance between schooling and learning: Evidence from Primary Schooling in Bangladesh. Comparative Education Review. 59(3), 447-472.
Asadullah, M N., & Chaudhury, N. (2016). To Madrasahs or not to Madrasahs: The question and correlates of enrolment in islamic schools in Bangladesh. International Journal of Educational Development, 49, 55-69.
Asadullah, M N., Chaudhury, N. & Dar, A. (2007). Student achievement conditioned upon school selection: Religious and secular secondary school quality in Bangladesh. Economics of Education Review, 26(6), 648-659.
Asadullah, M N., Chaudhury, N. (2017). The rise of low-cost private schools in Bangladesh. Paper presented at CIES Conference on Education, Atlanta, Georgia, March 2017.
Asadullah, M. N. (2005). The effect of class size on student achievement: Evidence from Bangladesh. Applied Economics Letters, 12(4), 217-221.
Asadullah, M. N. (2006). Pay differences between teachers and other occupations: Some empirical evidence from Bangladesh. Journal of Asian Economics, 17(6), 1044-1065.
Asadullah, M. N. (2006). Returns to education in Bangladesh. Education Economics, 14(4), 453-468.
Asadullah, M. N. (2009). Returns to private and public education in Bangladesh and Pakistan: A comparative analysis. Journal of Asian Economics, 20(1), 77-86.
Asadullah, M. N. (2016a). Do pro-poor schools reach out to the poor? Location choice of BRAC and ROSC schools in Bangladesh. Australian Economic Review, 49(7), 432-52.
Asadullah, M. N. (2016b). Trust, trustworthiness, and traditional Islamic education. Oxford Development Studies, 44(2), 152-166.
Asadullah, M. N. (2016c). The Effect of Islamic School Attendance on Academic Achievement. Singapore Economic Review, 61(4), 1550052-01-1550052-24.
Asadullah, M. N., Alim, A., & Hossain, A. (forthcoming). Enrolling girls without learning: Evidence from public schools in Afghanistan. Development Policy Review. DOI: 10.1111/dpr.12354
Asadullah, M. N., Alim, A., Khatoon, F., & Chaudhury, N. (2016). Maternal Early Marriage and Children’s Cognitive Skills Development. Paper preented at the World Institute for Development Economics Research (WIDER) Annual Conference.
Asadullah, M. N., Amin, S., & Chaudhury, N. (2018). Support for gender stereotypes: Does Madrasah education matter? Journal of Development Studies. DOI:10.1080/00220388.2017.1414190
Asadullah, M. N., Trannoy, A., Tubeuf, S., & Yalonetzky, G. (2017). Pupil’s effort and educational inequality of opportunity: Evidence from Rural Bangladesh. Paper presented at the Poverty Reduction, Equity and Growth Network (PEGNet) Conference 2017 on “Understanding national inequalities and how to address them”, NADEL Center for Development and Cooperation, ETH Zürich, September 11-12, 2017.
Asadullah, M.N., & Wahhaj, Z. (2017). Sustaining Women's Literacy in Bangladesh: The Impact of Schooling and Employment Status. Paper presented at the UKFIET Conference on “Learning and Teaching for Sustainable Development: Curriculum, Cognition and Context”, Oxford, September 2017.
Banerjee, A., Glewwe, P., Powers, S., & Wasserman, M. (2013). Expanding Access and Increasing Student Learning in Post-Primary Education in Developing Countries: A Review of the Evidence. Post Primary Education Initiative Review Paper, Abdul Latif Jameel Poverty Action Lab, Cambridge, MA.
Barrett A. M. (2011) A millennium learning goal for education post-2015: A question of outcomes or processes. Comparative Education. 47(1), 119–133.

200
Benhabib, J., and Mark M. Spiegel (2005) “Chapter 13 Human Capital and Technology Diffusion.” Handbook of Economic Growth. doi:10.1016/S1574-0684(05)01013-0.
Bouhlila, D. S. (2011). The quality of secondary education in the Middle East and North Africa: what can we learn from TIMSS’ results?. Compare: A Journal of Comparative and International Education, 41(3), 327-352.
Bouhlila, D.S. (2015). The Heyneman-Loxley effect revisited in the middle East and North Africa: Analysis using TIMSS 2007 database. International Journal of Educational Development, 42, 85-95.
Bouhlila, Donia Smaali (2017) Parents' education and literacy skills: Evidence on inequality of socioeconomic status in Arab countries, World Development Perspectives, 5, 34-43
Breton, Theodore R., & Canavire-Bacarreza, Gustavo (2017). Low test scores in Latin America: poor schools, poor families or something else?. Compare: A Journal of Comparative and International Education, 1-16.
Brixi, Hana; Lust, Ellen; Woolcock, Michael (2015) Trust, Voice, and Incentives: Learning from Local Success Stories in Service Delivery in the Middle East and North Africa. Washington, DC: World Bank.
Bruns, B., Filmer, D., & Patrinos, H. (2011). Making Schools Work: New Evidence on Accountability Reforms. World Bank, Washington, DC.
Buckner, Elizabeth, & Rebecca Hodges. (2016). Cheating or Cheated? Surviving secondary exit exams in a Neoliberal Era. Compare: A Journal of Comparative and International Education 46(4), 603–623.
Campante, Filipe R., & Davin Chor. (2012). Why was the Arab World poised for revolution? Schooling, economic opportunities, and the Arab Spring. Journal of Economic Perspectives, 26(2), 167-88.
Carnoy, Martin, Tatiana Khavenson, Prashant Loyalka, William H. Schmidt, & Andrey Zakharov. (2016). Revisiting the Relationship between International Assessment Outcomes and Educational Production: Evidence from a Longitudinal PISA-TIMSS Sample. American Educational Research Journal, 53(4), 1054–85.
Chapman, D. W., & Miric, S. L. (2009) Education quality in the Middle East. International Review of Education, 55(4), 311-344. https://doi.org/10.1007/s11159-009-9132-5
Chapman, David W., John C. Weidman, Marc Cohen, and Malcolm Mercer. (2005). The search for quality: A five country study of national strategies to improve educational quality in Central Asia. International Journal of Educational Development, 25(5), 514–530.
Colclough, C., Kingdon, G., & Patrinos, H. (2010). The changing pattern of wage returns to education and its implications. Development Policy Review, 28, 733–747.
Das, Jishnu, Priyanka Pandey, and Tristan Zajonc. 2006. “Learning Levels and Gaps in Pakistan.” Policy Research Working Paper 4067, World Bank, Washington, DC.
Datt, Gaurav and Wang, Liang Choon (2017) Schooling and Learning Deficits: A Simple Unified Measurement Framework. Available at SSRN: https://ssrn.com/abstract=2982929
de Ree, Joppe, Muralidharan, Karthik, Pradhan, Menno and Rogers, Halsey (2015) Double for Nothing? Experimental Evidence on the Impact of an Unconditional Teacher Salary Increase on Student Performance in Indonesia, NBER Working Paper No. 21806.
Dubeck, M. M., & Gove, A. K. (2015). The Early Grade Reading Assessment (EGRA): Its theoretical foundation, purpose, and limitations. International Journal of Educational Development, 40, 315–322.
Erosa, Andrés, Tatyana Koreshkova, & Diego Restuccia. (2010). How important is human capital? A quantitative theory assessment of world income inequality. Review of Economic Studies, 77(4), 1421– 49.

201
Evaluation, 14(1), 87-100. Evans , David K. & Popova, Anna. (2016). What Really Works to Improve Learning in
Developing Countries? An Analysis of Divergent Findings in Systematic Reviews. The World Bank Research Observer, 31(2), 242–270.
Fehling, M., Nelson, B. D., & Venkatapuram, S. (2013). Limitations of the Millennium Development Goals: A literature review. Global Public Health, 8(10), 1109-1122.
Filmer, D., Molina, E., & Stacy, B. (2015). What goes on inside the classroom in africa? Assessing the relationship between what teachers know, what happened in the classroom, and student performance.
Gaber, S., Cankar, G., Umek, L. M., & Tašner, Veronika. (2012). The danger of inadequate conceptualisation in PISA for education policy. Compare: A Journal of Comparative and International Education, 42(4), 647-663.
Glewwe, P. W., Hanushek, E. A., Humpage, S. D., & Ravina, R. (2014). “School resources and educational outcomes in developing countries: A review of the literature from 1990 to 2010.” in Education Policy in Developing Countries, ed. Glewwe, P. University of Chicago Press: Chicago and London.
Glewwe, P. W., Hanushek, E. A., Humpage, S. D., & Ravina, R. (2011).School resources and educational outcomes in developing countries: A review of the literature from 1990 to 2010. Technical report, National Bureau of Economic Research.
Glick, Peter & Sahn, David E. (2010). Early academic performance, grade repetition, and school attainment in Senegal: Panel data analysis. The World Bank economic review, 24(1), 93-120.
Global Commission (2016) Learning Generation. http://report.educationcommission.org/wp-content/uploads/2016/09/Learning_Generation_Full_Report.pdf
Heckman, J. J. (2008): Schools, skills and Synapses. Economic Inquiry, 46, 289-324 Heneveld, W., & Craig, H. (1996). Schools count: World Bank project designs and the quality of
primary education in Sub-Saharan Africa. Washington, DC: The World Bank. Heyneman, S. P. & Stern, J. M. (2014). Low cost private schools for the poor: What public policy
is appropriate? International Journal of Educational Development, 35, 3-15. Heyneman, Stephen P. (1997). The quality of education in the Middle East and North Africa
(MENA), International Journal of Educational Development, 17(4), 449-466. http://databank.worldbank.org/data/home.aspx, accessed 17 OCT 2017]
http://documents.wfp.org/stellent/groups/public/documents/resources/wfp290540.pdf
http://documents.worldbank.org/curated/en/289151468052754190/pdf/433720SR0WHITE11PUBLIC10YPN1English.pdf http://documents.worldbank.org/curated/en/468391486033158620/Turkey-Program-for-International-Student-Assessment-2015 http://doi.org/10.1080/17441692.2013.845676
http://saber.worldbank.org/index.cfm?indx=8&pd=1&sub=1 (Accessed 15 March 2017.) http://siteresources.worldbank.org/INTREAD/Resources/WP_12_READ_web.pdf.
https://files.eric.ed.gov/fulltext/EJ903844.pdf https://openknowledge.worldbank.org/handle/10986/24596 https://www.brookings.edu/wp-content/uploads/2012/04/0609_global_compact.pdf https://www.isesco.org.ma/wp-content/uploads/2015/11/islamic_world_millennium_challenges.pdf https://www.odi.org/sites/odi.org.uk/files/odi-assets/publications-opinion-files/7776.pdf

202
Islam, K., and Asadullah, M. N. (2018). Gender Stereotypes and Education: A Comparative Content Analysis of Malaysian, Indonesian, Pakistani and Bangladeshi School Textbooks, PLoS One. 13(1): e0190807.
Jones, S., Schipper, Y., Ruto, S., & Rajani, R. (2014). Can your child read and count? Measuring learning outcomes in east Africa. Journal of African economies, 23(5), 643-672.
Kaffenberger, M. and Pritchett, L. (2016). Schooling Completion and Learning: New Evidence from the Financial Inclusion Insights Data.
Krishnan, Nandini; Lara Ibarra, Gabriel; Narayan, Ambar; Tiwari, Sailesh; Vishwanath, Tara (2016) Uneven Odds, Unequal Outcomes: Inequality of Opportunity in the Middle East and North Africa. Directions in Development--Poverty. Washington, DC: World Bank.
Krishnaratne, S., White, H., & Carpenter, E. “Quality education for all children? What works in education in developing countries.” 3ie Working Paper 20, International Initiative for Impact Evaluation.
Lay J. (2012). Millennium development goal achievements and policies in education and health: What has been learnt? Development Policy Review, 30(1), 67–85.
Lockheed, Marlaine E.; Prokic-Breuer, Tijana; Shadrova, Anna (2015). PISA: the experience of middle-income countries participating in PISA 2000-2015. Washington, D.C.: World Bank Group.
Lucas, Robert E. (1988). On the mechanics of economic development. Journal of Monetary Economics 22, (1), 3-42.
Masino, S. & Niño-Zarazúa, M. (2016). What works to improve the quality of student learning in developing countries? International Journal of Education Development, 48, 53-65.
McEwan, P. (2012). Improving learning in primary schools of developing countries: A meta-analysis of randomized experiments. Review of Educational Research, 20(10), 1-42.
Mckenzie, P., D. Nugroho, C. Ozolins, J. Mcmillan, S. Sumarto, N. Toyamah, V. Febriany, R. J. Sodo, L. Bima, & A. A. Sim. (2014). Study on Teacher Absenteeism in Indonesia 2014. Jakarta : Education Sector Analytical and Capacity Development Partnership (ACDP). https://research.acer.edu.au/cgi/viewcontent.cgi?article=1003&context=policy_reform
Mekonen Y. A. (2010). ‘2015’ agenda for Africa: Development from a human perspective. IDS Bulletin, Institute of Development Studies, 41(1), 45–47.
Mulcahy-Dunn, A., Dick, A., Crouch, L., and Newton, E. (2016) Education Data for Decision Making (EdDataII): Key Achievements and Lessons Learned. USAID.
Muralidharan, K., and Sundararaman, V. (2013). The Aggregate Effect of School Choice: Evidence from a two-stage experiment in India. National Bureau of Economic Research (NBER) working paper no. w19441.
Murnane, R. J., & Ganimian, A.J. (2014). Improving Educational Outcomes in Developing Countries: Lessons from Rigorous Evaluations, NBER Working Paper 20284
Murray, H. (2012) Is School Education Breaking the Cycle of Poverty for Children?: Factors Shaping Education Inequalities in Ethiopia, India, Peru and Vietnam. Young Lives Policy Paper 6.
Nicholas Burnett and Colin Felsman (2012) POST-2015 EDUCATION MDGS AUGUST 10, 2012. Obeidat, O. and Dawani, Z. 2014. Disseminating and Using Student Assessment Information in
Jordan. Washington, DC, World Bank. OECD ( 2010) PISA 2009 Results, What Students Know and Can Do: Student Performance in
Reading, Mathematics, and Science. Vol. 1. Paris: OECD (Organisation for Economic Co-operation and Development).
OECD-UNICEF (2016) What makes a school a learning organisation? A guide for policy makers, school leaders and teachers.

203
Perera, D., & Asadullah, M. N. (2015). Mind the Gap: What Explains Malaysia’s Underperformance in PISA? Paper presented at the Singapore Economic Review Conference, August 2015.
Pritchett, L., Woolcock M. & Andrews M. (2013). Looking like a state: Techniques of persistent failure in state capability for implementation. Journal of Development Studies, 49, 1-18.
Pritchett, Lant and Sandefur, Justin (2016) Girls’ Schooling and Women’s Literacy: Schooling Goals Alone won’t Reach Learning Goals, December 16, 2016.
Rutkowski, David, Leslie Rutkowski, Julie Belanger, Steffan Knoll, Kristen Weatherby, & Ellen Prusinski. (2013). Teaching and Learning International Survey TALIS 2013: Conceptual Framework. OECD Publishing: Paris.
Sabel, Charles, and Luke Jordan. 2015. Doing, Learning, Being: Some Lessons Learned from Malaysia’s National Transformation Program. Competitive Industries and Innovation Program, World Bank, Washington, DC.
Shen, C. (2002). Revisiting the relationship between students' achievement and their self-perceptions: A cross-national analysis based on TIMSS 1999 data. Assessment in Education: Principles, Policy & Practice, 9(2), 161-184.
Shen, C., & Tam, H. P. (2008). The paradoxical relationship between student achievement and self-perception: A cross-national analysis based on three waves of TIMSS data. Educational Research and
Snilstveit, B., Stevenson, J., Menon, R., Phillips, D., Gallagher, E., Geleen, M., Jobse, H., Schmidt, T. and Jimenez, E. (2016). The impact of education programmes on learning and school participation in low-and middle-income countries: a systematic review summary report, 3ie Systematic Review Summary 7. London: International Initiative for Impact Evaluation (3ie).
Spaull, Nicholas and Taylor, Stephen (2015) Access to What? Creating a Composite Measure of Educational Quantity and Educational Quality for 11 African Countries, Comparative Education Review, Vol. 59, No. 1 (February 2015), pp. 133-165.
Tsaneva, Magda. (2017). Does school matter? Learning outcomes of Indonesian children after dropping out of school. World Development Perspectives, 6, 1-10.
UNESCO (2014) Teaching and Learning: Achieving Quality for All. UNESCO Education for All Global Monitoring Report (GMR) 2013-14. http://unesdoc.unesco.org/images/0022/002256/225654e.pdf
UNESCO (2017) Accountability in education: Global Education Monitoring (GMR) Report. Wagner, D. A., Lockheed, M., Mullis, I., Martin, M. O., Kanjee, A., Dowd, A., & Gove, A. K. (2012).
The debate on learning assessments in developing countries. Compare: A Journal of Comparative and International Education, 42(3), 509–545. doi: 10.1080/03057925.2012.670480
World Bank (1999). Education in the Middle East & North Africa: A strategy towards learning for development. Washington, DC: The World Bank.
World Bank (2007) Youth - An undervalued asset : towards a new agenda in the Middle East and North Africa - progress, challenges and way forward. Washington, DC: World Bank.
World Bank (2008-MENA) The Road Not Traveled: Education Reform in the Middle East and North Africa.
World Bank (2016) Results in Education for All Children (REACH): Annual Report 2015. Washington, DC, World Bank.
World Bank (2017). The World DataBank. Washington, DC. [available at World Bank (2017/Malaysia) “Driving Performance from the Center: Malaysia’s Experience
with Pemandu.” Knowledge and Research: The Malaysia Development Experience Series, World Bank, Kuala Lumpur.

204
World Bank (2017a) SABER: Teachers Ratings & Data. Washington, DC, World Bank. World Bank (2017c) Country Policy and Institutional Assessment Data. Washington, DC, World
Bank. https://data.worldbank.org/datacatalog/CPIA. (Accessed 20 November 2017.) World Bank (2018). LEARNING to Realize Education’s Promise. The World Development
Report 2018 (WDR 2018). World Bank (2018a) Riding the Wave: An East Asian Miracle for the 21st Century. The World
Bank. World Bank (2018b). LEARNING to Realize Education’s Promise. The World Development
Report 2018 (WDR 2018). World Bank. (2018b) Fair Progress?: Educational Mobility Around the World. World Bank,
Washington, DC.https://openknowledge.worldbank.org/handle/10986/28428 License: CC BY 3.0 IGO.
World Bank. 2016. Turkey - Program for International Student Assessment 2015. PISA education brief. Washington, D.C. : World Bank Group.
World Bank’s System Assessment and Benchmarking for Education Results (SABER) Jordan Ababneh, E., Al-Tweissi, A. and Abulibdeh, K. (2016). TIMSS and PISA impact - the case of Jordan.
Research Papers in Education. 31(5):542-555. Ababneh, Abdalla, Ababneh, Imad, Lebdih, Khattab Abu and Tweissi, Ahmad (2014) Mapping
of Student Assessments in Jordan, Monitoring & Evaluation Partnership (MEP) Project, Serial No. 180 September 2014.
Abdul-Hamid, H., Abu-Lebdeh, K.M. and Patrinos, H. A. (2011). Assessment testing can be used to inform policy decisions: the case of Jordan.
Abdul-Hamid, Abu-Lebdeh and Patrinos (2011) analyzed the improvements in TIMSS scores between 1999 and 2007 using decomposition analysis.
Balcazar, Carlos Felipe; Narayan, Ambar; Tiwari, Sailesh (2015) Born with a Silver Spoon : Inequality in Educational Achievement across the World. Policy Research Working Paper; No. 7152. World Bank Group, Washington, DC. https://openknowledge.worldbank.org/handle/10986/21149
Brombacher, A., Collins, P., Cummiskey, C., Kochetkova, E., Mulcahy-Dunn, A. (2012) Student Performance in Reading and Mathematics, Pedagogic Practice, and School Management in Jordan. USAID. http://pdf. usaid.gov/pdf_docs/PA00JBNH.pdf
Buckner, Elizabeth, and Rebecca Hodges (2016) “Cheating or Cheated? Surviving Secondary Exit Exams in a Neoliberal Era.” Compare: A Journal of Comparative and International Education 46 (4): 603–623.
Butler, Declan (2006) “Islam and Science: The data gap". Nature. 444: 26–27. Chapman, D. W., & Miric, S. L. (2009) Education quality in the Middle East. International Review
of Education, 55(4), 311-344. Fink, G., McCoy, D., Hatamleh, H., Pylvainen, H., Chen, A. & Al-Assaf, G. (2017) Economic
Implications of Investing in Early Childhood Care and Education in Jordan Brief on QRF Working Paper #1.
Hammouri, H. (2004). Attitudinal and motivational variables related to mathematics achievement in Jordan: Findings from the Third International Mathematics and Science Study (TIMSS). Educational Research, 46(3), 241-257.

205
Innabi, H., & Dodeen, H. (2006). Content Analysis of Gender-related Differential Item Functioning TIMSS Items in Mathematics in Jordan. School Science and Mathematics, 106(8), 328-337.
ILO (2013). A Study on the Gender Gap in Private Education in Jordan. Retrieved from: http://www.ilo.org/wcmsp5/groups/public/---arabstates/---ro-beirut/documents/publication/wcms_230673.pdf
Jordan 2025: A National Vision and Strategy. Retrieved from: http://inform.gov.jo/en-us/ByDate/Report-Details/ArticleId/247/Jordan-2025
Krishnan, Nandini; Lara Ibarra, Gabriel; Narayan, Ambar; Tiwari, Sailesh; Vishwanath, Tara (2016) Uneven Odds, Unequal Outcomes: Inequality of Opportunity in the Middle East and North Africa. Directions in Development--Poverty. Washington, DC: World Bank. https://openknowledge.worldbank.org/handle/10986/24596
Marsh, H. W., Abduljabbar, A. S., Abu-Hilal, M. M., Morin, A. J., Abdelfattah, F., Leung, K. C., ... & Parker, P. (2013). Factorial, convergent, and discriminant validity of timss math and science motivation measures: A comparison of Arab and Anglo-Saxon countries. Journal of Educational Psychology, 105(1), 108.
OECD (2013). PISA 2012 Results: What Makes Schools Successful? Resources, Policies and Practices Volume IV. Retrieved from: https://www.oecd.org/pisa/keyfindings/pisa-2012-resultsvolume-IV.pdf
Qarout, Dana, Pylvainen, Helena, Dahdah, Sami and Palmer, Robert (2015) Jordan’s Teachers: QRF National Teacher Survey 2014.
Salehi-Isfahani, D., Hassine, N. B., & Assaad, R. (2014). Equality of opportunity in educational achievement in the Middle East and North Africa. Journal of Economic Inequality, 12(4), 489.
Sabah, S. and Hammouri, H. (2010). Does subject matter matter? Estimating the impact of instructional practices and resources on student achievement in science and mathematics: findings from TIMSS 2007. Evaluation & Research in Education. 23(4):287-299.
Peragine, V., Lagravinese, R., Palmisano, F., & Intini, V. (2015). Inequality of opportunity for educational achievement in Arab Region: Evidence from PISA 2006–2009-2012. UN-ESCWA Working Paper. https://www.unescwa.org/sites/www.unescwa.org/files/page_attachments/inequality_of_opportunity_for_educational_achievement_in_arab_region.pdf
Shafiq, M. (2011) “Do school incentives and accountability measures raise skills in the Middle East and North Africa? The cases of Jordan and Tunisia.” Review of Middle East Economics and Finance 7(2), 1–28.
Tabazah, Sawsan (2017) Education Ministry brings Internet to schools and directorates, The Jordan Times, 31 October.
Unicef (2015) JORDAN COUNTRY REPORT ON OUT-OF-SCHOOL CHILDREN. UNICEF. Valverde, G. A. (2005). Curriculum policy seen through high-stakes examinations: Mathematics
and biology in a selection of school-leaving examinations from the Middle East and North Africa. Peabody Journal of Education, 80(1), 29-55.
World Bank (2009) Education Reform for the Knowledge Economy II. World Bank, Washington, DC.
World Bank (2008-MENA) The Road Not Traveled: Education Reform in the Middle East and North Africa.
World Bank (2018). LEARNING to Realize Education’s Promise. The World Development Report 2018 (WDR 2018).

206
Malaysia Asadullah, M Niaz, Perera, Liyanage D. H., and Xiao, S. (2018) What Explains Vietnam’s PISA
Surprise? A Comparative Analysis of Six Asian Countries (processed). Ahmad, H. (2012). Mission of Public Education in Malaysia: The Challenge of Transformation.
University of Malaya Press. Kuala Lumpur, Malaysia. Balcazar, C. F., Narayan, A., & Tiwari, S. (2015). Born with a silver spoon: inequality in
educational achievement across the world. Creswell, J. (2009). Research design: Qualitative, quantitative, and mixed methods approaches.
SAGE Publications, Incorporated. Creswell, J. W. (2008). Educational research. Planning, conducting, and evaluating quantitative
and qualitative research. Creswell, J. W. (2012). Qualitative inquiry & research design: Choosing among five approaches
(4th ed.). Thousand Oaks, CA: Sage. Economic Planning Unit (EPU). (2011). Prime Minister's Department, Malaysia. Tenth Malaysia
Plan, 2011-2015: Progress Issues and Challenges. Retrieved online from: https://www.pmo.gov.my/dokumenattached/RMK/RMK10_Eds.pdf
Economic Planning Unit (EPU). (2016). Prime Minister's Department, Malaysia. Eleventh Malaysia Plan, 2016-2020. Retrieved online from: http://www.epu.gov.my/en/rmk/eleventh-malaysia-plan-2016-2020
Guruz, Kemal (2011) Higher Education and International Student Mobility in the Global Knowledge Economy.
Hofstede, G.H. & Hofstede, G.J. (2005). Cultures and organizations : Software of the mind. New York: McGraw-Hill.
Joseph, C. (2008). Ethnicities and Education in Malaysia: Difference, Inclusions and Exclusions. The Education of Diverse Student Populations. In G. Wan (Ed.), Vol. 2, pp. 183-208; Springer Netherlands. Retrieved online from: http://www.springerlink.com/content/h1h8337724u45370/
Kenayathulla, H. (2013a). Shadow Education in Malaysia. Presentation at the Policy Forum on Regulating the Shadow Education System: Private Tutoring and Government Policies in Asia, 8-9 April. Hong Kong: Comparative Education Research Centre, The University of Hong Kong
Kenayathulla, H. (2013b). Household Expenditures on Private Tutoring: Emerging Evidence from Malaysia. Asia Pacific Education Review, 24(2): 629-644.
Kenayathulla, H. B. (2012). An economic analysis of household educational decisions in Malaysia (Doctoral dissertation, Indiana University).Kenayathulla, H. B., 2013. Household expenditures on Private tutoring: emerging evidence from Malaysia. Asia Pacific Education Review, 14(4), 629–644.
Kenayathulla, H.B. (2014). Ethical Issues in the Malaysian Education System. Educational Philosophy and Theory: 1–15
Kenayathulla, H.B. (2016). Financial Adequacy and Low Performing Schools: Evidence from Malaysia. Aktual'ni Problemy Ekonomiky = Actual Problems in Economics; Kiev Iss. 183, (2016): 126-136
Knoema. (2017). Malaysia - Current expenditure on education as a share of gross national income. Retrieved online from: https://knoema.com/atlas/Malaysia/topics/Education/Expenditures-on-Education/Expenditure-on-education-as-a-share-of-GNI

207
Lee, M. N. N. (2006). Centralised decentralisation in Malaysian education. In C. Bjork (Ed.), Educational decentralization: Asian experience and conceptual contributions (pp. 149–158). Dordrecht: Springer.
Low, S. F. & Ishak, Z. (2012). Priori Model of Students Academic Achievement: The Effect of Gender as Moderator. International Congress on Interdisciplinary Business and Social Science, 65, 1092-1100.
Malaklolunthu, S., Shamsudin, F. (2011). Challenges in school-based management: Case of a “cluster school” in Malaysia. Procedia—Social and Behavioral Sciences, 15, 1488-1492.
Othman, Mariam M. & Muijs, Daniel (2013). Educational quality differences in a middle-income country: the urban-rural gap in Malaysian primary schools. School Effectiveness and School Improvement, 24(1), 104-121.
Marzuki, S. (2005a). Mengurus kewangan sekolah: Pahang: PTS Publications and Distributions Sdn Bhd.
Marzuki, S. (2005b). Mengurus dan membiayai pendidikan di Malaysia. Kuala Lumpur: PTS Professional.
Mat Saad, A., Nik Yusoff, N.M.R. & Mohammad Yassin, R. (2011) Penilaian kemudahan pembelajaran, peruntukan kewangan dan kursus dalam perkhidmatan bagi kursus Pendidikan Islam di Politeknik Malaysia.JIAE: Journal of Islamic and Arabic Education, 3 (1). pp. 123-134. ISSN 1985-6236.
McEwan, E. (2002). Seven steps to effective instructional leadership. California: Corwin Press, 2002.
Md Yunusa, M; Wan Osmana, W. S. & Mohd Ishaka, N. (2011). Teacher-student relationship factor affecting motivation and academic achievement in ESL classroom. Procedia Social and Behavioral Sciences. 15, 2637–2641.
Ministry of Education (MOE). (2010). Financial Circulars. Surat Pekeliling Ikhtisas Bilangan 13 Tahun 2010 Pelaksanann Sekolah Berprestasi Tinggi (SBT). Number 13 Year 2010.
Ministry of Education (MOE). (2017). Malaysian Education Quality Standards [Standard Kualiti Pendidikan Malaysia (SKPM)]. Retrieved online from: https://www.moe.gov.my/index.php/en/pegawai-perkhidmatan-pendidikan/standard-kualiti-pendidikan-malaysia
Ministry of Education, Malaysia (MOE). (2013). Malaysian Education Blueprint 2013-2025. Retrieved online from: https://www.moe.gov.my/images/dasar-kpm/articlefile_file_003108.pdf
Ministry of Education, Malaysia (MOE). (2015). Annual Report 2015 Malaysian Education Blueprint 2013-2025. Retrieved online from: https://www.moe.gov.my/index.php/en/dasar/laporan-tahunan-2015
Ministry of Education, Malaysia (MOE). (2016). Malaysian Annual Report 2016 Malaysian Education Blueprint 2013-2025. Retrieved online from: https://www.moe.gov.my/index.php/en/soal-selidik/2-uncategorised/3427-annual-report-2016-malaysia-education-blueprint-2013-2025
Ministry of Education, Malaysia (MOE). (2016). Perangkaan Pendidikan Malaysia. Retrieved online from: https://www.moe.gov.my/images/KPM/BPM/Media/Penerbitan/Terbitan/2017/Buku_Perangkaan_Pendidikan_Malaysia_2016/perangkaan2016_FINAL_intractive-1-page-001.jpg
Ministry of Education, Malaysia (MOE). (2017). Malaysia Educational Statistics QUICK FACTS 2016 Malaysia Educational Statistics. Retrieved online from: https://www.moe.gov.my/index.php/en/media/penerbitan/terbitan/buku-

208
informasi/book/10-quick-facts-2016-malaysia-educational-statistics/6-terbitan-buku-informasi
Ministry of Finance, Malaysia (MOF). (2016). Malaysian Budget 2017. Retrieved online from: http://www.pmo.gov.my/bajet2017/Bajet2017.pdf
Ministry of Finance, Malaysia (MOF). (2017). Malaysian Budget 2018. Retrieved online from: http://www.pmo.gov.my/bajet2018/Bajet2018.pdf
Mohammed Sani Ibrahim, Ahmad Zabidi Abdul Razak & Husaina Banu Kenayathulla. (2015). Strategi Implementasi Pelan Pembangunan Pendidikan Malaysia: Penerbit Universiti Malaya.
Muhammad Faizal A. Ghani & Shahril Marzuki. (2008). Effective School Model: A change based on current demand (Model Sekolah Berkesan: Satu perubahan berdasarkan tuntutan semasa). Issue In Education (Masalah Pendidikan),31(1), 9-21. (Non-ISI/Non-SCOPUS)
OECD. (2013). Education at a Glance. OECD indicators. Retrieved online from: https://www.oecd.org/edu/eag2013%20(eng)--FINAL%2020%20June%202013.pdf
OECD. (2013). Education at a Glance. OECD indicators. Retrieved online from: https://www.oecd.org/education/skills-beyond-school/48631582.pdf
PEMANDU (2011). Improving Students Outcomes. Retrieved online from: // www.pemandu.gov.my.
PEMANDU. (2015). National Transformation Programme Annual Report 2015. Retrieved online from: https://www.pemandu.gov.my/assets/publications/annual-reports/ENG_PEMANDU_NTP_AR2015_260416.pdf
PEMANDU. (2015)The National Key Results Areas (NKRAs). Retrieved online from: http://gtp.pemandu.gov.my/gtp/What_Are_NKRAs%5E-@-NKRAs_Overview.aspx
Perera, Liyanage Devangi H. and Asadullah, M Niaz (2015) “Mind the Gap: What Explains Malaysia’s Underperformance in PISA?”. Paper presented at the Singapore Economic Review Conference, August 2015.
Pigott, T. D., Williams, R. T., Polanin, J. R., & Wu-Bohanon, M. J.(2012). Predicting student achievement with the education production-function and per-pupil expenditure: Synthesizing regression models from 1968-1994. Retrieved from: https://www.sree.org/conferences/2012s/program/downloads/abstracts/457.pdf
PISA. (2015). Retrieved online from: Https://www.moe.gov.my/images/Arkib/PISA2015/Laporan%20PISA%202015.pdf
Polius, A. (2009). Pencapaian rendah dalam ujian penilaian sekolah rendah dalam kalangan murid luar bandar: Kajian kes daerah Tenom Sabah. (Masters thesis, Universiti Malaysia Sabah). Retrieved from http://eprint.ums.edu.my/9395/3/mt eswell, J. W. (2009). Research Design: Qualitative, Quantitative, and Mixed Methods. Thousand Oaks, CA: Sage.
Ramaloo, S. (2000). Pengurusan Kewangan Sekolah – Satu Kajian Kes di SRJK(T) dan SRJK(C) di Rawang (Daerah Gombak), Selangor. Kertas Projek Dikemukakan Sebagai Memenuhi Syarat Untuk Memperolehi Ijazah Sarjana Pendidikan, Universiti Malaya, Kuala Lumpur.
Samuel, M., Tee, M. Y., Symaco, L. (2017). Education in Malaysia: Developments and Challenges. Asia-Pacific Educational Research Association. Springer.
Scheerens, J. (2014). School, teaching, and system effectiveness: some comments on three state-of-the-art reviews. School Effectiveness and School Improvement: An International Journal of Research, Policy and Practice. Pg. 282-290.
Schein, E.H. (2004). Organizational culture and leadership (San Francisco: Jossey-Bass, 3rd ed. SUAKAM. (2013). Report on Access to Education in Malaysia. Retrieved online from:
http://www.suhakam.org.my/wp-content/uploads/2013/11/Research-Report.pdf Sufean, H. (2002). Pendidikan di Malaysia: Sejarah, sistem & falsafah. Education in Malaysia:
History, system & philosophy. Kuala Lumpur: Dewan Bahasa & Pustaka.

209
Sufean, H. (2009). Memacu puncak ilmu: Autonomi universiti merencana pembangunan. Harnessing the Ivory Tower: University Autonomy in Planning Development. Kuala Lumpur: Tinta Publisher.
Tanner, C. K., & Lackney, J. A. (2006). The physical environment and student achievement in elementary schools. CK Tanner & JA Lackney, Educational facilities planning: Leadership, architecture, and management, 266-294.
TIMSS. (2015). Retrieved online from: https://www.moe.gov.my/images/Terbitan/Rujukan-Akademik/pubfile_file_002124.pdf
UNESCO. (2015). UNESCO Report: Higher Education in Asia: Expanding Out, Expanding Up. The rise of graduate education and university research. Retrieved online from: file:///C:/Users/Minda/Downloads/higher-education-asia-graduate-university-research-2014-en.pdf
Pakistan
Alcott, B., & Rose, P. (2015). Schools and learning in rural India and Pakistan: Who goes where, and how much are they learning? Prospects. DOI 10.1007/s11125-015-9350-5.
Alif Ailaan (2014-16). The state of education in Pakistan https://d3n8a8pro7vhmx.cloudfront.net/alifailaan/pages/496/attachments/original/1427452160/ASER_Updated_Factsheet_-_Pakistan.pdf?1427452160
Andrabi, Tahir; Das, Jishnu; Khwaja, Asim Ijaz; Zajonc, Tristan. 2005. Religious School Enrollment in Pakistan : A Look at the Data. Policy Research Working Paper; No. 3521. World Bank, Washington, DC. © World Bank. https://openknowledge.worldbank.org/handle/10986/8914 License: CC BY 3.0 IGO.
Andrabi, T., Das, J., Khwaja, A. I., Vishwanath, T., & Zajonc, T. (2007). Learning and educational achievements in Punjab schools (LEAPS): Insights to inform the education policy debate. Washington, DC: World Bank.
Andrabi, T., Das, J., and Khwaja, A. I. (2008). A dime a day: the possibilities and limits of private schooling in pakistan. Comparative Education Review, 52(3).
Andrabi T, Das J, Khwaja AI (2013). Students today, teachers tomorrow: identifying constraints on the provision of education. Journal of Public Economics100: 1–14
ASER Pakistan (2010-2016). Annual status of education report: National. Lahore: South Asian Forum for Education Development.
Asadullah, M. N. (2009). Returns to private and public education in Bangladesh and Pakistan: A comparative analysis. Journal of Asian Economics, 20(1), 77–86.
Aslam, M. (2009). ‘The Relative Effectiveness of Government and Private Schools in Pakistan: Are Girls Worse Off?’ Education Economics, 17 (3): 329–54.
Aslam, M. (2009). ‘Education Gender Gaps in Pakistan: Is the Labour Market to Blame?’ Economic Development and Cultural Change, Vol. 57 (4) July.
Aslam, M. (2016) http://www.heart-resources.org/wp-content/uploads/2016/10/Helpdesk-on-teacher-labour-market-in-Pakistan.pdf
Aslam, M. and P. Atherton (2014). 'The Shadow Education Sector in India and Pakistan: Opening Pandora's Box', in (eds: Macpherson, I., Robertson, S. and G. Walford), Education, Privatization and Social Justice: Case Studies from Africa, South Asia and South East Asia, Symposium Books, UK.

210
Aslam, M., Kingdon, G. and S. Rawal (2014), ‘Teacher Quality’, Flagship Report on Quality Schooling in South Asia, The World Bank, in Student Learning in South Asia: Challenges, Opportunities and Policy Priorities (Halil Dundar, Tara Beteille, Michelle Riboud and Anil Deolalikar), The World Bank, Washington D.C.
Aslam, M. and S. Rawal (2015), ‘Teachers - an indispensable asset: Examining teacher effectiveness in South Asia', in Handbook of International Development and Education (eds. Pauline Dixon, Chris Counihan and Steve Humble), Edward Elgar Publishing Limited.
Aslam, M. Rawal, S, Kingdon, G., Jamil. B, & S. Saeed (2017), Public Private Partnerships in Education: A Review of the Evidence, Ark-funded.
Aslam, M., Rawal, S., Asadullah, N., Bari, F., Kingdon, G., Malik, R. & P. Rose (2016), ‘Teacher Politics: Meeting Educational Quality Challenges with Teachers’, Report prepared for the Education Commission, September 2016.
Aziz, M., Bloom, D.E., Humair, S., Jimenez, E., Rosenberg, L. & Z. Sathar (2014), ‘Education system reform in Pakistan: why, when and how? IZA Policy Paper 76, Bonn, Germany.
Bano, M. (2011), Madrassahs as partners in education provision: the South Asian experience, Development in Practice, 20 (4-5): 554-566.
Bari, F. Raza, R. Aslam, M. Khan, B. Maqsood, N (2013), An Investigation into Teacher Recruitment and Retention in Punjab, IDEAS Report.
R, Malik. F, Bari. Muzaffar, I (2014). Public Private Partnerships in Education: Evidence from Punjab and Sindh, IDEAS Report.
Barrera-Osorio, Felipe and Dhushyanth Raju. 2015. “Evaluating the Impact of Public Student Subsidies on Low-Cost Private Schools in Pakistan.” The Journal of Development Studies 51 (7):808–825.
Bari, F. and Malik, R. (2014). Role of Private Sector in Education Reforms. In Reforming Education in Pakistan (Ed) Muhammad Memon and Sajid Ali. Oxford University Press: Karachi
British High Commission Islamabad (2010)
Carneiro, P., Das, J., and Reis, H. (2016). The Value of Private Schools: Evidence from Pakistan’, Centre for micro data methods and practice, cemmap working paper CWP 22/16 and The Institute of Fiscal Studies & Department of Economics, UCL.
Day Ashley, L., C. Mcloughlin, M. Aslam, J. Engel, J. Wales, S. Rawal, R. Batley, G. Kingdon, S. Nicolai and P. Rose (2014) The Role and Impact of Private Schools in Developing Countries: A Rigorous Review of the Evidence, London: Department for International Development.
Dundar, H.,T. Béteille, M. Riboud, and A. Deolalikar. (2014), Student Learning in South Asia: Challenges, Opportunities, and Policy Priorities. Directions in Development. Washington, DC: World Bank.
Fennell, S. (2012) ‘Why Girls’ Education Rather than Gender Equality? The Strange Political Economy of PPPs in Pakistan’, in S. Robertson and K. Mundy (eds.), Public Private Partnerships in Education: New Actors and Modes of Governance in a Globalizing World, Cheltenham: Edward Elgar Publishing, pp. 259–76.
Fennell, S. (2013), ‘Low-fee private schools in Pakistan: a blessing or a bane? In Srivastava, P. (ed.) Low-Fee Private Schooling: Aggravating Equity or Mitigating Disadvantage? Oxford Symposium Books, pp. 65-82.

211
Hanushek, E. (1997). Assessing the Effects of School Resources on Student Performance: An Update. Educational Evaluation and Policy Analysis, 19(2), 141-164. 9
Hanushek, E. (February 1998). The evidence on class size. Occasional Paper Number 98-1. Wallis Institute of Political Economy. University of Rochester. Retrieved May 28, 2016, from http://hanushek.stanford.edu/ http://nepc.colorado.edu/publication/research-based-options 6 of 7 sites/default/files/publications/Hanushek%201998%20HouseTestimony%20Class%20Size.pdf
Hanushek, E. (2002). Evidence, Politics and the Class Size Debate. In L. Mishel & R. Rothstein (Eds.), The Class Size Debate. Washington, DC: Economic Policy Institute. Retrieved June 5, 2016, from http://hanushek.stanford.edu/sites/default/files/publications/Hanushek%202002%20ClassSizeDebate.pdf
Habib, M. (2010). The impact of 2002 national teacher contract policy reform on teacher absenteeism in Lahore, Pakistan. Unpublished doctoral dissertation, George Washington University, Washington, DC.
ILM Ideas Report (2014). Retrieved from http://www.ilmideas2.pk/research/
Khwaja, Asim, Tahir Andrabi, Jishnu Das, and Tristan Zajonc. 2008. “Madrassa Metrics: The Statistics and Rhetoric of Religious Enrollment in Pakistan.” Beyond Crisis: A Critical Second Look at Pakistan, Ed. Naveeda Khan, Routledge, May 2008.
Kingdon, G., Aslam, M., Rawal, S., & Das, S. (2013). Are contract teachers and para-teachers a cost-effective intervention to address teacher shortage and improve learning outcomes? London, UK: University of London, Institute of Education.
Little, A., (2008), Size matters for EFA, CREATE Monograph no.26
Marine de Talancé (2016) Better Teachers, Better Results? Evidence from Rural Pakistan, Journal of Development Studies, Pages: 1697-1713
Pakistan Bureau of Statistics. (2015). Pakistan social and living standards measurement survey 2014–15. Islamabad, Pakistan: Author. Federal Ministry of Pakistan, Finance Division.
Pakistan Economic Survey. 2016–17 (chap. 10). Author. Federal Ministry of Pakistan, Finance Division.
Pakistan Education Statistics Report (2015-16). Author. Federal Ministry of Pakistan, Finance Division.
Rawal, S, M Aslam & B Jamil, Teacher characteristics, actions and perceptions: what matters for student achievement in Pakistan? Institute of Education, University of London, 2013.
Rose P, Malik R (2015) Can Pakistan afford quality education for all its children and young people? Pp.1-30
Rose, P. (2015) ‘Three lessons for educational quality in post-2015 goals: Clarity, measurability and equity’ International Journal of Educational Development. Vol 40 (January): 289-246
The Pakistan Education Task Force (2011)
UNESCO, Education for all: The quality imperative, 2003
UNESCO, Education for all: Global Monitoring Report, 2015.

212
Nigeria ActionAid (2011). Transforming education for girls in Nigeria (TEGINT); baseline research
summary report. Abuja: ActionAid Nigeria Adedigba, A. (2017, November 8). 2018 Budget: Buhari allocates 7% to education. Premium
Times. Retrieved from https://www.premiumtimesng.com/news/top-news/248663-2018-budget-buhari-allocates-7-education.html (accessed 16 December 2017)
Adediran, S. (2010). Assessment of effectiveness of the SBM system in Bauchi, Katsina, Sokoto and Niger, Nigeria (2008–2010). Abuja: UNICEF
Adediran, S. (2015). Forces of educational policy change since 2000 in Nigeria. Background paper prepared for the Education for All Global Monitoring Report 2015: Education for All 2000-2015: achievements and challenges, ED/EFA/MRT/2015/PI/38
Adekola, O. (2007). Language, literacy and learning in primary schools: implications for teacher development programs in Nigeria. World Bank Working Paper No. 96. Washington DC: Africa Region Human Development Department, World Bank.
Ademola, A., Adebisi, O. and Arogundade, K. (2012). Academic Corruption and the Challenge of Unemployable Graduates in Nigeria: Implications for Entrepreneurship Development and Economic Growth. The Journal of Commerce, 4(1), 1-12
Afri-Dev. Info (2013). Nigeria Girl Child Education Scorecard Highlighting Forced Marriage of Underage Girls & Trends in Adolescent Child Bearing. Retrieved from http://www.afri-dev.info/wp-content/uploads/2015/07/2013-Nigeria-Day-of-Girl-Child-Scorecard-on-Education_Forced-Marriage-Adolscent-Child-Bearing-Fn.pdf
Ahiuma-Young, A. (2016). Poverty: 112m Nigerians live below poverty line. The Nigerian Vanguard, October 18, 2016. Retrieved from https://www.vanguardngr.com/2016/10/poverty-112m-nigerians-live-poverty-line/ (accessed 28 November 2017)
Amnesty International (2013) ‘Keep away from schools or we’ll kill you: Right to education under attack in Nigeria’. Amnesty International October 2013, London.
Amnesty International (2013) ‘Keep away from schools or we’ll kill you: Right to education under attack in Nigeria’. Amnesty International October 2013, London.
Angrist, J. & Pischke, J. (2009). Mostly Harmless Econometrics: An Empiricist's Companion. Princeton, NJ: Princeton University Press
Bah-Lalya, I., Sutherland-Addy, E., and Onocha, C.O. (eds.) (2011). Nigeria: reaching out to the disadvantaged: nomads, adults and children in difficult circumstances. Tunis: Association for the Development of Education in Africa (ADEA).
Belo-osagie, K., Adeleye, O. & CLEMENT, C. (2015) Deepening public-private partnership for education. The Nation, December 24, 2015. Retrieved from http://thenationonlineng.net/deepening-public-private-partnership-for-education/ (accessed 29 November 2017)
Chege, F., Zakariya, J., Okojie, C., and Aregbeyen, O. (2008). Girls’ Education Project (GEP) evaluation report. Abuja: UNICEF
Coinco, E. (2012). Women’s participation in SBMC within the complex socio-cultural context of Nigeria. ESSPIN Report No. 425. Abuja: ESSPIN.
Daniels, B. (2016). A Review of Adamu Adamu’s Education Roadmap. ThisDay, September 18, 2016. Retrieved from https://www.thisdaylive.com/index.php/2016/09/18/a-review-of-adamu-adamus-education-roadmap/ (accessed December 1, 2017)
Dooga, T. (2012), Nigeria Languages: Failing Health and Possible Healing. AfrrevLaligens, 1(1), 76-95
213
Dunne, M., Humphreys, S., Dauda, M., Kaibo J., with Garuba, A. (2013). Adamawa State primary education research:Access, quality and outcomes, with specific reference to gender. Yola/ Brighton, UK: Adamawa State Universal Basic Education Board, Yola/ Centre for International Education, University of Sussex, UK
Dunne, M., Humphreys, S., Dauda, M., Kaibo J., with Garuba, A. (2013). Adamawa State primary education research:Access, quality and outcomes, with specific reference to gender. Yola/ Brighton, UK: Adamawa State Universal Basic Education Board, Yola/ Centre for International Education, University of Sussex, UK.
Dunne, M., Humphreys, S., Dauda, M., Kaibo J., with Garuba, A. (2013), Adamawa State primary education research:Access, quality and outcomes, with specific reference to gender. Yola/ Brighton, UK: Adamawa State Universal Basic Education Board, Yola/ Centre for International Education, University of Sussex, UK
EDOREN (2014) Comparing Learning Outcomes in Public and Low- And Medium fee Private Schools in Lagos. Abuja: EDOREN
EDOREN (2016). New Evidence on Pupils Learning and Teacher Effectiveness from Primary Schools in Jigawa, Katsina and Zamfara: Findings from a baseline survey of Teacher Development Programme (TDP). TDP Briefing Note, February 2016. Abuja: EDOREN
EDOREN (2016). The Universal Basic Education Reforms: A Review. Abuja: EDOREN Eribo, F. (1996). Higher Education in Nigeria: Decades of Development and Decline. Issue: A
Journal of Opinion, 24(1), 64-67 Erulkar, A. & Bello, M. (2007).The Experience of Married Adolescent Girls in Northern Nigeria.
New York: Population Council. ESSPIN (2013). Inclusive education approach paper, ESSPIN Report No. 64. Abuja: ESSPIN. Ezegwu, C. (2015). Home-grown initiatives for local challenges on gender inequality in basic
education in Nigeria. Available at https://edorennigeria.wordpress.com/2015/03/04/home-grown-initiatives-for-local-challenges-on-gender-inequality-in-basic-education-nigeria/
Ezegwu, C., Adedokun, A. & Ezegwu, C. (2017). "Street Children, Integrated Education and Violence in Northern Nigeria". In Panjwani, F., Revell, L., Gholami, R. and Diboll, M. (Eds.) Education and Extremisms: Rethinking liberal pedagogies in the contemporary world. London: Routledge
Fabunmi, M. (2005). Historical Analysis Of Educational Policy Formulation In Nigeria: Implications For Educational Planning And Policy. International Journal of African & African American Studies, 4(2), 1-7
Federal Ministry of Education (2007). National Policy on Gender in Basic Education. Abuja: Federal Ministry of Education.
Federal Ministry of Education (2016). National Education Quality Assurance Handbook for Basic and Secondary Education in Nigeria. Abuja: Federal Education Quality Assurance Service
Federal Ministry of Education (2016). National Education Quality Assurance Handbook for Basic and Secondary Education in Nigeria. Abuja: Federal Ministry of Education Federal Education Quality Assurance Service
Federal Ministry of Education (2017), Nigeria Education Indicators 2016. Abuja: FME Federal Ministry of Education FME (2011), Report of the Presidential Task Team on Education -
Main Report (Volume I). Abuja: FME Federal Republic of Nigeria (2013). National Policy on Education. 6th Edition 2013 Federal Republic of Nigeria (2013). National Policy on Education. 6th Edition 2013. Abuja: FME FME (2016), 2016-2019 Strategic Plan for Education. Abuja: FME

214
Gaadi, D. (2017). Of Nigeria’s major ethnic groups, geopolitical zones. Nigerian Tribune, October 30. Retrived from http://www.tribuneonlineng.com/nigerias-major-ethnic-groups-geopolitical-zones/ (accessed 30 November, 2017)
Gabresek, S. & Usman, M. (2013). The study on School-based Teacher Development (SbTD) and Student Tutoring, Mentoring and Counselling (STUMEC) programmes. Abuja: UNICEF/DFID.
Gbadegesin, M. (2017), Thoughts on Education Reform in Nigeria: Time to Stop the Drift. Walk With Me, March 08, 2017. Retrieved from https://muyiwagbadegesin.com/blog/2017/5/8/thoughts-on-education-reform-in-nigeria-time-to-stop-the-drift (accessed 26 November 2017)
Guardian (2016, March 24). Pakistan commends Nigeria military over success against Boko Haram. Retrieved from https://guardian.ng/news/pakistan-commends-nigeria-military-over-success-against-boko-haram/ (accesed 25 December 2017).
Härmä, J. (2011a), Study of private schools in Lagos, ESSPIN Report No. LG 303. Abuja: ESSPIN. Härmä, J. (2011a). Household survey on private education in Lagos. ESSPIN Report No. LG 503.
Abuja: ESSPIN. Härmä, J. (2011b), Lagos Private School Census 2010-2011 Report Report Number: LG 501.
Abuja: Education Sector Support Programme in Nigeria Härmä, J. (2011b). Study of private schools in Lagos, ESSPIN Report No. LG 303. Abuja: ESSPIN. Härmä, J. (2011c). Study of private schools in Kwara State, ESSPIN Report No. KW 326. Abuja:
ESSPIN. Härmä, J. (2013). Access or quality? Why do families in slums choose private education low-
cost private schools in Lagos, Nigeria? Oxford Review of Education, 39(4): 548–566. Human Rights Watch (2007). Chop Fine: the Human Rights Impact of Local Government
Corruption Human Rights Watch (2014). Those Terrible Weeks in their Camp – Boko Haram Violence
against Women and Girls in Northeast Nigeria. New York: Human Rights Watch Humphreys, S. and Crawfurd, L. (2014). Review of The Literature on Basic Education in
Nigeria: Issues of access, quality, equity and impact. Abuja: EDOREN Ibrahim, J. (2017). More On Teachers Failing While Their Students “Pass” Exams. PMNews
Nigeria, 22 October 2017. Retrieved from https://www.pmnewsnigeria.com/2017/10/22/teachers-failing-students-pass-exams/ (accessed 22 October 2017)
IDCM (2013).Nigeria IDP Figures Analysis. Available at http://www.internal-displacement.org/sub-saharan-africa/nigeria/figures-analysis (accessed 29 December 2014)
IDCM (2014a). Nigeria: Country Overview. Available at http://www.internal-displacement.org/sub-saharan-africa/nigeria/ (accessed 29 December 2014)
IDMC (2014b). Nigeria: multiple displacement crises overshadowed by BokoHaram. Avilable at http://www.internal-displacement.org/sub-saharan-africa/nigeria/2014/nigeria-multiple-displacement-crises-overshadowed-by-boko-haram. (accessed 27 December 2014)
Imam, H. (2012), Educational Policy in Nigeria from the Colonial Era to the Post-Independence Period. Italian Journal of Sociology of Education, 1, 2012, 181 - 204
Irabor, E. (2014), CONSTRAINTS TO THE GROWTH OF PPPs IN NIGERIA; IS THERE A LEGAL SOLUTION? This Day Newspaper October 7, 2014. Retrieved from http://www.vitaveritasllp.com/constraints-to-the-growth-of-ppps-in-nigeria-is-there-a-legal-solution/ (accessed 29 November 2017)

215
Jigawa State Ministry of Education (2010). Jigawa State Annual Education Report 2010. Dutse: Jigawa State MoE.
Johnson, D. (2008). An assessment of the development needs of teachers in Nigeria: Kwara state case study. Abuja: ESSPIN.
Jones, A. and Naylor, R. (2014). The quantitative impact of armed conflict on education: counting the human and financial costs. Doha: PEIC.
Lawal, I. (2017, March 9). Disparity in unity schools’ cut-off marks as an albatross. Retrived from https://guardian.ng/features/disparity-in-unity-schools-cut-off-marks-as-an-albatross/ (accessed 25 December 2017)
Mac-Leva, F., Umar, S., Adebayo, I. & Auwal, A. (2017), N15 billion Almajiri Schools in ruins. Daily Trust, 27 November. Retrieved from https://www.dailytrust.com.ng/n15-billion-almajiri-schools-in-ruins.html (accessed 27 November 2017)
McCaffery, J., Sanni, K., Ezeomah, C., and Pennells, J. (2006). Adult literacy and teacher education in a community education programme in Nigeria. In C. Dyer (ed.), The education of nomadic peoples: current issues, future prospects. Oxford: Berghahn Books.
Morakinyo, O. (2015). Language Policy in Nigeria: Problems, Prospects and Perspectives. International Journal of Humanities and Social Science, 5(9), 154-160
National Bureau of Statistics & Federal Ministry of Youth Development (2013), 2012 National Baseline Youth Survey. Abuja: National Bureau of Statistics
National Bureau of Statistics (2012), NIGERIA POVERTY PROFILE 2010. Abuja: NBS National Bureau of Statistics (2016), Social Abstract Statistics. Abuja: NBS National Bureau Of Statistics (2016). Statistical Report on Women And Men In Nigeria. Abuja:
NBC National Bureau of Statistics (2017), National Examinations Council: Distribution of Results by
Staet, Gender and Subject - June/Jul and Nov/Dec (2013-2016). Abuja: Naational Bureau of Statistics
National Bureau of Statistics (NBS) and United Nations Children’s Fund (UNICEF) (2017) Multiple Indicator Cluster Survey 2016-17, Survey Findings Report. Abuja, Nigeria: National Bureau of Statistics and United Nations Children’s Fund.
National Bureau of Statistics (NBS, 2013), Nigeria Multiple Indicator Cluster Survey 2011: Main Report: NBS ABUJA
National Population Commission (Nigeria) and RTI International (2015) Nigeria Education Data Survey (NEDS). Washington, DC. United States Agency for International Development.
National Population Commission (Nigeria) and RTI International (2016) 2015 Nigeria Education Data Survey (NEDS). Washington, DC. United States Agency for International Development
National Population Commission (Nigeria) and RTI International, 2011. Nigeria Demographic and Health Survey (DHS) EdData Profile 1990, 2003, and 2008: Education Data for Decision-Making. 2011. Washington, DC, USA: National Population Commission and RTI International
National Population Commission, Federal Ministry of Education, USAID and ESSPIN (2010). Nigeria Education Data Survey (NEDS) 2010: Early Childhood Education and Reading Skills. Abuja: NPC
NBS (2017) JAMB Admitted Candidates by State and Gender within Faculty - (2010-2016). Abuja: NBC
Obanya, P. (1974). Towards a History of Higher Education in Nigeria. Canadian Journal of African Studies / Revue Canadienne Des Études Africaines, 8(1), 159-162

216
Obanya, P. (2011). Politics and the Dilemma of Meaningful Access to Education: The Nigerian Story. Brighton, UK, Consortium for Research on Educational Access, Transitions and Equity, University of Sussex. (CREATE Pathways to Access Research Monograph, 56.)
Obi, P. (2016). Foundations Partner to Provide Quality Education for 60,000 Nigerian Children. This Day, 18 March 2016. Retrieved from https://www.thisdaylive.com/index.php/2016/03/18/foundations-partner-to-provide-quality-education-for-60000-nigerian-children/ (accessed 29 November 2017)
Odukoya, D. (2013), Educational Trends and Future in Nigeria. . In E. Takyi-Amoako (ed.). Education in West Africa. London: Bloomsbury
Ogbonna, S. (2016). Reflections on why basic education learning outcomes are declining in Nigeria. Abuja: ESSPIN
Okojie, C. (2012). Formative evaluation of the United Nations Girls’ Education Initiative: Nigeria report. New York: UNGEI
Okunola, R. and Ikuomola, A. (2009). Corporate establishments’ preferences and the quest for overseas’ qualifications by Nigerian university students. Educational Research and Review 4 (12), 626-633
Oni, S. (2012). Revitalizing Nigerian Education in Digital Age. Bloomington: Trafford Publishing Outhred, R. & MacAuslan, M. (2014). What are children in private schools learning? Findings
from four areas of Lagos. Abuja: EDOREN Oyedeji, O. (2016, December 16). 2017 Budget: Again, Nigeria fails to meet UN benchmark on
education. Retrieved from https://www.premiumtimesng.com/news/top-news/218097-2017-budget-nigeria-fails-meet-un-benchmark-education.html (accessed 16 December 2017)
Oyefuga, E. & Adefeso-Olateju, M. (2017), Citizens Action: Does Evidence Have a Role to Play? The Education Partnership (TEP) Center Working Paper 4, July 2017
Premium Times (2013, June 26). Reps probe cut-off marks in unity schools. Retrieved from https://www.premiumtimesng.com/news/139694-reps-probe-cut-off-marks-in-unity-schools.html (accessed 25 December 2017)
Premium Times (2016, September 23). UK hails Nigerian military’s success against Boko Haram. Retrieved from https://www.premiumtimesng.com/news/more-news/211098-uk-hails-nigerian-militarys-success-boko-haram.html (accesed 25 December 2017).
Schiffer, E., Mustapha, A. and Mustapha, A. (2013). Who influences non-salary funding of primary schools in Kano State Nigeria, Net-Map Study January / February 2013.
Schwab, K. (2012). The Global Competitiveness Report: 2012–2013. World Economic Forum Insight Report.
Smith, N. (2011). The face of disability in Nigeria: a disability survey in Kogi and Niger States. Disability, CBR and Inclusive Development, 22(1): 35–47.
The National Commission for Nomadic Education (2017), The National Commission for Nomadic Education Brochure. Kaduna : The National Commission for Nomadic Education
UBEC (2010). National Framework for the Development and Integration of Almajiri Education into UBE Scheme.
UBEC (n.d.), UNIVERSAL BASIC EDUCATION COMMISSION ALMAJIRI EDUCATION PROGRAMME UNIT UPDATE ON ALMAJIRI EDUCATION PROGRAMME. Abuja: UBEC. Retrieved from https://ubeconline.com/Pre/ALMAJIRI%20EDUCATION%20PROGRAMME%20jule%202015.pdf (accessed 1 December 2017).
UNDP (2015). National Human Development Report, 2015: Human Security and Human Development in Nigeria. Abuja

217
UNESCO (2012). National Literacy Action Plan for 2012 – 2015: NIGERIA. High-Level International Round Table on Literacy, UNESCO, Paris, 6-7, September 2012 . Paris: UNESCO
UNICEF (2003). Strategies for the Acceleration of Girls’ Education in Nigeria. Abuja: UNICEF UNICEF (2012). Girls’ Education Project (GEPII), northern Nigeria. End of project assessment.
Abuja: UNICEF. UNICEF (2016). Nigeria HUMANITARIAN SITUATION REPORT. Country Situation Report,
APRIL/MAY 2016. Abuja: UNICEF Universal Basic Education Commission (2013), Final Report 2011 National Assessment of
Learning Achievements In Basic Education Programme (NALABE), Abuja: UBEC Universal Basic Education Commission (2016). Communiqué issued at the end of the 16th
quarterly meeting of the Universal Basic Education Commission (UBEC) management with the executive chairmen of state and fct universal basic education boards held at crest hotel Jos, Plateau state, from 4th –7th october, 2016. Abuja: UBEC
Universal Basic Education Commission (UBEC, 2015), UBE ROAD MAP: 2015-2020: VOLUME II. Abuja: UBEC
Universal Basic Education Commission, 2012a. Impact assessment of the UBE programme delivery in Nigeria 1991–2009. Abuja: UBEC
USAID (2013), Results of the 2013 Early Grade Reading and Early Grade Mathematics Assessments (EGRA & EGMA) in Sokoto State. USAID-Northern Education Initiative.
USAID (2013). Results of the 2013 Early Grade Reading and Mathematics Assessments in Bauchi and Sokoto States. Results brief. Abuja: USAID.
USAID (2014). Nigeria Reading and Access Research Activity, Results of the 2014 Hausa and English Early Grade Reading Assessments (EGRAs) in Government Primary and IQTE Centers of Jigawa, Kaduna, Kano, and Katsina States
Usman, L. (2006). Rural Nomadic Fulbe Boys’ Primary Schooling: Assessing Repertoires of Practice in Nigeria. McGill Journal of Education. 41 (2), pp.155-174
Usman, L., 2008. Assessing the universal basic education primary and Koranic schools’ synergy for Almajiri street boys in Nigeria. International Journal of Educational Management, 22 (1), 62-73
Vanguard (2017). ExxonMobil partners with Kaduna State government to Improve education. APRIL 18, 2017. Retrieved from https://www.vanguardngr.com/2017/04/exxonmobil-partners-kaduna-state-government-improve-education/ (accessed 29 November 2017)
World Bank (2013). Aide memoire for the Implementation Support Mission, Lagos Eko Secondary Education Project. Washington DC: World Bank
World Bank (2017). Nigeria: World Bank Approves Operations in Support of Better Education Service Delivery for All and Development of Kaduna State. Press Release, June 20, 2017. Retrieved from http://www.worldbank.org/en/news/press-release/2017/06/20/nigeria-world-bank-approves-operations-in-support-of-better-education-service-delivery-for-all-and-development-of-kaduna-state (accessed November 2017)

218
ANNEXES
Malaysia
Appendix Figure 1: Public spending on education as a share of gross domestic product
Source: World Data Atlas
Appendix Figure 2: Transition rates in Government and Government-Aided Schools in Malaysia (2010-2016)
Source: Malaysian Educational Statistics, MOE 2014; 2015; 2016
4,0
4,5
5,0
5,5
6,0
1995 2006 2010 2011 2012 2013 2014 2015
10
20
30
40
50
60
70
80
90
100
2010 2011 2012 2013 2014 2015 2016
Tra
nsi
tion
Rate
(%
)
Standard 6 - Form 1 Form 3 -Form 4 Form 5 -Form 6

219
Appenidx Figure 3: Transition Rate (%) among Orang Asli Students from Year 6 to Form 1, 2008 – 2016
Source: Annual Report 2016, Malaysia Education Blueprint 2013-2025, MOE, page 3-15
Appendix Figure 4: Performance in LINUS Programme
Source: Annual Report 2016, Malaysia Education Blueprint 2013-2025, MOE
36 32 29 30 26 25 22 21 17
64 68 71 70 74 75 78 79 83
2008 2009 2010 2011 2012 2013 2014 2015 2016
Participation rate
to Form 1
Dropout rate after
Year 6
65
70
75
80
85
90
95
100
2014 2015 2016
Per
form
an
ce (
%)
Year
Bahasa Melayu English Language Numeracy

220
Appendix Figure 5: UPSR Urban-Rural Achievement Gap (average grade) in UPSR examination, 2012-2016
Source: Annual Report 2016, Malaysia Education Blueprint 2013-2025, MOE.
Appendix Figure 6: UPSR Urban-Rural Achievement in Bahasa Melayu, English Language, Science and Mathematics, 2016
Source: Annual Report 2016, Malaysia Education Blueprint 2013-2025, MOE, page 3-9
2
2,2
2,4
2,6
2,8
3
3,2
2012 2013 2014 2015 2016
Rural Urban
2,53 2,67
3,33
3,68 3,40
2,93
2,52 2,63 2,86
3,31 3,04
2,77
-
0,50
1,00
1,50
2,00
2,50
3,00
3,50
4,00
Rural Urban

221
Appendix Figure 7: National Urban-Rural Achievement Gap Trend in SPM, 2012-2016
Source: Annual Report 2016, Malaysia Education Blueprint 2013-2025, MOE
Appendix Figure 8: Distribution of student population receiving KWAPM by school band
5,44
5,28
5,45,44
5,36
4,83
4,68
4,85
4,944,89
4,5
4,6
4,7
4,8
4,9
5
5,1
5,2
5,3
5,4
5,5
2012 2013 2014 2015 2016
Rural Urban
75
56
31
18
25
17
719
52
0
10
20
30
40
50
60
70
80
90
100
Good Schools,Band 1 & 2
Average Schools,Band 3, 4, 5
Poor Schools,Band 6 & 7
Schools with >2/3 studentsreceivingKWAPM
Schools with1/3 - 2/3studentsreceivingKWAPMSchools with<1/3 studentsreceivingKWAPM

222
Pakistan
Appendix Table A1: Multidimensional Poverty and basic education indicators by Province/Region
Province Value
MPI Incidence
(H) Intensity
(A)
Punjab Overall 0.152 31.4% 48.4%
Rural 0.214 43.7% 48.9%
Sindh Overall 0.231 43.1% 53.5%
Rural 0.415 75.5% 54.9%
KPK Overall 0.250 49.2% 50.7%
Rural 0.295 57.8% 51.1%
Balochistan Overall 0.394 71.2% 55.3%
Rural 0.482 84.6% 57.0%
AJK Overall 0.115 24.9% 46.3%
Rural 0.130 28.1% 46.3%
GB Overall 0.209 43.2% 48.3%
Rural 0.238 49.0% 45.0%
FATA 0.337 73.7% 45.8%
Source: Multi-dimensional Poverty Index, 2015
223
Appendix Table A2: Pass rate at Secondary level – National
Year
Literacy Rate (Age 10 years and older)
Adult Literacy Rate (Age 15
years and older)
Youth Literacy Rate ( Age 15-24)
PSLM LFS PSLM LFS LFS
2011-12 58 _ _ _ _
2012-13 60 60 57 56 72
2013-14 58 60 _ 57 72
2014-15 60 61 57 57 72
Source:
i. Various Issues of Pakistan Social and Living Standards Measurement (PSLM) Survey,PBS, Islamabad
ii. Various Issues of Labor Force Survey (LFS), PBS, Islamabad
Appendix Table A3: Annual Status of Education Report, coverage 2008-2016
Year Districts Villages/blocks
Schools
Households
Children
(3-16)
Mothers
Volunteers
Mobilized
2008/9
11 326 283 6,520 16,737 8,577 450+
2010 32 960 1,297 19,006 54,062 19,915 2000
2011 87
(84 Rural & 3
Urban)
2,599 3,642 49,793 146,874 51,654 5000
2012 142
(136 Rural &6 Urban)
4,226 5,944 82,521 251,444 83,746 9000
2013 151
(138 Rural &
13 Urban)
4,382 6,170 87,044 263,990 88,375 10,000

224
Year Districts Villages/blocks
Schools
Households
Children
(3-16)
Mothers
Volunteers
Mobilized
2014 165 (144 Rural &
21 Urban)
4,698 6,235 93,096 279,427 93,681 10,000
2015 167
(146 Rural &
21 Urban)
4,760 6,439 94,550 286,570 95,326 10,000
2016 144 (Rural
Districts)
4,205 5,540 83,324 255,269 84,158 10,000
Appendix Table A4: Access to education by province, age (ASER and PSLM)
Access (By Age)
ASER Pakistan (Rural) PSLM Pakistan (Rural)
Age 3-5 Years
Age 6-10 Years Age 6-10 Years
Region 2015 2016 2015 2016 2014-15
National 37 36 84 84 63
Balochistan 23 22 74 65 49
Punjab 53 51 90 92 66
Sindh 36 38 80 83 52
KP 40 36 89 89 70
FATA 30 38 83 89 -

225
GB 36 41 85 87 -
AJK 51 33 97 99 -
ICT 46 61 99 98 94
Note: Access is defined as percentage of population who report being enrolled divided by total population/sample size
Appendix Table A5: Access to education, by school type and province (ASER Rural)
ASER Pakistan (Rural)
(Age 6-16 Years) Govt. Schools (Age 6-16 Years) Pvt. Schools
Region 2012 2013 2014 2015 2016 2012 2013 2014 2015 2016
National 57 58 55 62 60 20 21 24 19 21
Balochistan 58 56 53 68 59 8 10 14 4 6
Punjab 57 54 54 55 58 27 30 32 30 28
Sindh 61 64 60 67 69 7 7 12 9 10
KP 58 63 59 63 62 26 23 26 24 24
FATA 56 58 51 60 60 19 21 29 19 24
GB 45 57 44 48 48 39 36 42 37 39
AJK 59 58 57 60 49 33 37 37 36 49
ICT 58 53 53 30 53 37 43 47 68 45
Appendix Table A6: Percentage, Enrolment by Gender & Type of School (ASER Rural), 6-16 year olds
Provinces a) Government
2012 2013 2014 2015 2016
Boys Girls Boys Girls Boys Girls Boys Girls Boys Girls
National 64 36 65 35 65 35 65 35 62 38
Balochistan 70 30 71 29 70 30 70 30 69 31
Punjab 60 40 59 41 59 41 60 40 57 43
Sindh 64 36 66 34 65 35 64 36 62 38

226
KP 66 34 67 33 67 33 67 33 62 38
FATA 71 29 74 26 72 28 74 26 68 32
GB 59 41 64 36 62 38 62 38 56 44
AJK 55 45 54 46 56 44 55 45 53 47
ICT 60 40 57 43 57 43 45 55 57 43
Provinces a) Private
2012 2013 2014 2015 2016
Boys Girls Boys Girls Boys Girls Boys Girls Boys Girls
National 64 36 64 36 63 37 62 38 60 40
Balochistan 81 19 74 26 67 33 70 30 64 36
Punjab 58 42 57 43 58 42 58 42 57 43
Sindh 68 34 67 33 62 38 62 38 64 36
KP 72 28 70 30 68 32 68 32 63 37
FATA 88 14 89 11 82 18 81 19 78 22
GB 58 42 58 42 57 43 60 40 57 43
AJK 58 42 56 44 55 45 56 44 53 47
ICT 59 41 61 39 58 42 51 49 57 43
Appendix Table A7: Availability of useable drinking water by school type and province/region, ASER Rural
% Facilities (Useable Drinking Water-Primary Schools)
ASER Pakistan (Rural)
Govt. Schools Pvt. Schools
Region 2012 2013 2014 2015 2016 2012 2013 2014 2015 2016
National 61 64 57 60 60 84 83 79 82 85
Balochistan 44 29 26 24 14 86 75 59 65 54
Punjab 92 95 88 93 95 97 94 96 96 96
Sindh 56 68 59 59 61 76 60 78 69 86
KP 64 74 72 72 85 87 92 88 92 95
FATA 45 58 61 67 68 67 82 67 100 100
GB 37 56 22 48 41 56 51 51 60 77
AJK 57 53 45 66 70 81 81 60 78 81
ICT 80 100 89 67 50 100 100 100 - 100

227
Appendix Table A8: Availability of useable toilets by school type and province/region, ASER Rural
% Facilities (Useable Toilet- Primary Schools)
ASER Pakistan (Rural)
Govt. Schools Pvt. Schools
Region 2012 2013 2014 2015 2016 2012 2013 2014 2015 2016
National 50 47 51 52 54 75 76 75 78 84
Balochistan 22 17 19 17 11 81 69 59 85 54
Punjab 87 87 92 94 96 92 82 92 93 91
Sindh 48 50 48 46 43 65 60 61 59 82
KP 60 57 68 62 82 86 88 88 88 92
FATA 33 21 27 46 47 40 55 86 100 100
GB 33 41 28 40 48 63 49 45 50 70
AJK 36 33 39 59 67 57 56 59 71 86
ICT 80 86 100 100 75 100 100 100 - 100
Appendix Table A9: Student-teacher ratios, by provinces-ASER Pakistan Rural (2013-2016)
Student Teacher Ratio
2014 2015 2016
National 24:1 35:1 35:1
Balochistan 20:1 30:1 30:1
Punjab 25:1 37:1 34:1
Sindh 24:1 33:1 38:1
KP 26:1 43:1 37:1
FATA 35:1 35:1 34:1
GB 17:1 24:1 23:1
AJK 23:1 28:1 27:1
ICT 16:1 20:1 22:1
Source: ASER data (various years)

228
Appendix Table A10: Extent of multi-grade teaching observed in Grade 2 classrooms through ASER school surveys, Rural
% Multi-grade Teaching (Grade-2) ASER Pakistan (Rural)
Govt. Schools Pvt. Schools
Region 2012 2013 2014 2015 2016 2012 2013 2014 2015 2016
National 50 22 14 48 59 28 22 22 30 40
Balochistan 66 62 51 57 59 17 14 30 26 40
Punjab 36 34 32 39 29 34 35 26 33 28 Sindh 75 70 74 81 29 34 34 30 35 28 KP 45 38 30 33 27 16 17 11 11 10 FATA 35 51 33 37 31 22 26 10 5 2 GB 67 30 30 38 32 17 33 33 36 28 AJK 40 52 40 52 56 28 34 - 40 47 ICT 11 19 0 17 0 11 5 6 50 8
Appendix Table A11: Literacy rates aged 10 and above, PSLM (2015)
Rural Overall
Region Male Female Total Male Female Total
National 63 38 51 70 49 60
Balochistan 54 17 38 61 25 44
Punjab 65 45 55 71 55 62
Sindh 55 24 40 70 49 60
KP 69 31 50 71 35 52
FATA - - - - - -
GB - - - - - -
AJK - - - - - -
ICT - - - - - -

229
Appendix Table A12: Learning outcomes (Urdu, English and Arithmetic) amongst grade 5 students, ASER Rural
Quality Learning-Class 5, ASER Pakistan Rural
Provinces Urdu/Sindhi/Pashto (Story) English (Sentences) Arithmetic (Division)
2012 2013 2014 2015 2016 2012 2013 2014 2015 2016 2012 2013 2014 2015 2016
National 51 55 46 55 52 48 59 42 49 46 44 51 40 50 48
Balochistan 36 49 33 44 42 32 29 28 39 38 34 39 24 43 40
Punjab 67 66 63 70 65 61 62 57 60 57 56 56 51 59 60
Sindh 40 41 41 45 37 25 25 24 24 19 27 29 31 35 24
KP 43 39 38 47 45 47 39 42 50 43 44 38 40 48 44
FATA 46 30 46 53 32 50 28 46 47 35 42 37 49 53 35
GB 56 51 55 59 53 68 60 62 62 58 56 50 57 60 55
AJK 65 61 61 69 88 60 58 59 70 87 44 50 53 61 90
ICT 55 61 50 92 76 62 60 42 86 57 56 52 40 83 49
Appendix Table A13: % of children aged 5-16 able to read at least a sentence (lower order competency) in Urdu/Sindhi/Pashto, ASER Rural
2012 2013 2014 2015 2016
Provinces Boys Girls Boys Girls Boys Girls Boys Girls Boys Girls
National 45 37 46 40 46 39 49 41 43 36
Balochistan 34 19 35 25 34 23 35 19 32 16
Punjab 55 52 55 54 55 52 56 54 51 48
Sindh 30 22 33 25 36 29 40 33 34 25
KP 50 37 50 40 51 40 58 46 46 36
FATA 41 21 43 23 48 28 51 30 42 17
GB 53 52 51 46 53 48 57 52 47 44
AJK 62 60 63 63 61 60 68 67 73 71
ICT 74 71 59 59 65 61 61 64 55 64
230
Appendix Table A14: % of children aged 5-16 able to read at least words (lower order competency) in English, ASER Rural
2012 2013 2014 2015 2016
Provinces Boys Girls Boys Girls Boys Girls Boys Girls Boys Girls
National 48 40 67 65 49 42 51 43 40 33
Balochistan 35 20 31 23 33 22 35 18 30 15
Punjab 59 55 59 58 59 56 57 55 47 44
Sindh 27 18 31 24 31 25 36 31 26 19
KP 58 43 59 48 60 48 64 53 45 34
FATA 48 26 52 29 57 34 57 35 43 18
GB 62 61 60 56 63 57 63 60 48 45
AJK 67 65 68 67 67 67 73 71 71 69
ICT 79 78 62 61 77 75 62 66 51 59
Appendix Table A15: % of children aged 5-16 able to do at least subtraction (lower order competency) in Arithmetic, ASER Rural
2012 2013 2014 2015 2016
Provinces Boys Girls Boys Girls Boys Girls Boys Girls Boys Girls
National 44 35 45 38 45 38 49 41 44 36
Balochistan 33 18 33 24 29 19 36 18 32 15
Punjab 53 49 54 51 54 50 54 51 51 48
Sindh 25 17 28 20 32 25 37 31 32 24
KP 53 38 53 41 55 43 61 49 49 37
FATA 41 21 49 26 53 29 55 33 46 20
GB 54 52 52 48 56 51 59 54 51 47
AJK 59 57 62 60 59 59 67 66 77 75
ICT 73 69 55 57 69 68 59 61 51 60

231
Nigeria
Appendix Table B1: Reasons for choice of primary school in Nigeria Closest to
space available
Better School
Less Expensive
Religion
Safer School
Other # of children
Sex Male 48.
0 35.9
12.7 1.8 0.7 0.9 19,866
Female 47.5
37.1
12.0 1.9 0.5 0.9 17,523
Age
5 59.4
27.5
11.3 1.2 0.1 0.4 2,024
6 to 7 46.5
38.7
11.2 2.2 0.5 0.8 9,426
8 to 11 45.1
39.0
12.4 1.9 0.6 0.9 19,314
12 to 16 53.8
28.6
14.3 1.5 0.7 1.2 6,624
Residence
Urban 32.1
49.5
14.2 2.5 0.8 0.9 17,535
Rural 61.7
24.9
10.8 1.3 0.5 0.9 19,854
Region
North Central
48.8
36.6
11.8 1.5 0.4 0.8 6,248
North East 67.8
21.6
9.6 0.5 0.1 0.4 3,792
North West
74.0
15.0
8.0 2.4 0.2 0.3 8,401
South East 37.4
44.9
11.4 2.2 1.9 2.2 5,208
South-South
34.6
39.7
23.4 0.7 0.5 0.9 6,242
South West
25.6
59.2
10.6 2.8 0.7 1.0 7,497
Economic Status Quintile
Lowest 79.7
12.8
6.3 0.6 0.1 0.5 4,976
Second 68.7
17.5
11.5 1.3 0.3 0.5 7,148
Middle 52.9
27.9
15.6 2.2 0.5 0.8 8,083
Fourth 37.3
43.0
14.6 2.7 1.1 1.3 8,058
Highest 15.7
69.3
11.2 2.0 0.7 1.1 8,208
Source: NPC & RTI (2016)

232
Appendix Table B2: Reasons for choice of JSS in Nigeria Closest to
space available
Better School
Less Expensive
Religion
Safer School
Other
Don't Know/missing
Number of children
Sex
Male 35.7
45.1
15.4 0.8 0.7 2.2 0.1 5,513
Female 30.0
49.4
16.2 1.9 0.7 1.8 0.0 5,141
Residence
Urban 22.9
55.2
17.3 1.6 0.8 2.2 0.0 6,170
Rural 46.7
36.2
13.7 1.0 0.5 1.8 0.1 4,484
Region
North Central
38.5
46.8
11.0 1.6 0.2 1.8 0.0 1,574
North East
53.9
36.0
8.4 1.0 0.3 0.4 0.1 809
North West
49.0
33.2
14.5 2.7 0.1 0.6 0.0 1,776
South East
27.3
57.3
9.3 1.5 1.5 3.1 0.0 1,487
South-South
25.6
41.1
30.3 0.5 0.9 1.3 0.1 2,200
South West
22.3
59.0
13.5 1.0 0.8 3.4 0.0 2,808
Economic Status Quintile*
Lowest 58.7
32.1
7.2 0.1 0 1.6 0.2 586
Second 55.8
29.1
12.9 1.2 0.2 0.8 0 1,490
Middle 44.0
35.6
16.9 1.4 0.4 1.7 0.0 2,357
Fourth 28.3
47.4
18.7 1.8 0.8 3.0 0.1 2,830
Highest 14.6
65.7
15.3 1.2 1.1 2.0 0.0 3,390
Source: NPC & RTI (2016)

233
Appendix Table B3: Percent of Children Age 5–16 Able to Read, by State
Zone State Percent of children age 5–16 able to read
Northwest Sokoto 9 Kebbi 16 Zamfara 21 Katsina 22 Jigawa 26 Kano 35 Kaduna 46
northeast Bauchi 8 Yobe 11 Borno 15 Taraba 21 Adamawa 23 Gombe 32
North-central
Niger 22 Nasarawa 29 Benue 33 Plateau 53 Kwara 53 Kogi 52 FCT-Abuja 66
southwest Ogun 61 Oyo 68 Ondo 78 Ekiti 85 Osun 83 Lagos 92
South-south
Cross river 54 Delta 65 Edo 76 Rivers 68 Akwa ibom 80 Bayelsa 75
Southeast Enugu 51 Ebonyi 49 Imo 65 Anambra 84 Abia 83
Nigeria 46
Source: NPC & RTI (2011)

234
Appendix Table B4: Percent of Children Age 5–16 that are Numerate, by State
Zone State Percent of children age 5–16 that are numerate
Northwest Sokoto 14 Kebbi 28 Zamfara 24 Katsina 38 Jigawa 31 Kano 49 Kaduna 62
northeast Bauchi 18 Yobe 20 Borno 19 Taraba 41 Adamawa 42 Gombe 35
North-central
Niger 31 Nasarawa 57 Benue 59 Plateau 69 Kwara 61 Kogi 71 FCT-Abuja 70
southwest Ogun 77 Oyo 84 Ondo 92 Ekiti 89 Osun 92 Lagos 94
South-south
Cross river 76 Delta 81 Edo 79 Rivers 81 Akwa Ibom 87 Bayelsa 83
Southeast Enugu 81 Ebonyi 67 Imo 85 Anambra 69 Abia 92
Nigeria 58
Source: NPC & RTI (2011)

235
Appendix Table B5: Summary of Nomadic Schools in Nigeria By Year (2010-2014)
INDICATORS 2010 2011 2012 2013 2014
Total Number of Schools 3,060 2,819 3,109 3,538 3,467
Total Enrolment 484,694 475,732 518,241 519,018 515,080
Total Male Enrolment 276,276 271,167 295,397 295,043 286,777
Total Female Enrolment 208,418 204,565 222,844 223,975 228,303
Total Number of Teachers 13,849 14,455 14,463 13,675 13,737
Total Number of Male Teachers
9,833 9,986 10,271 9,709 9,319
Total Number of Female Teachers
4,016 4,205 4,192 3,966 4,418
Teacher/pupils Ratio 35 33 36 38 37
Source: National Bureau of Statistics (2016)

236
Appendix Table B6: School Attendance by Muslim Children by School Type in Nigeria*
No Schooling
Formal School
only
Religious School
only
Formal and Religious schools
Number of
pupils Region North Central 11.4 30.5 8.8 49.2 5,500 North East 31.4 10.8 29.3 28.5 9,719 North West 15.6 4.9 35.4 44 19,706 South East * * * * 17 South-South * 59.4 * 39 209 South West 6.7 44.2 1.6 47.5 5,455 Source: NPC & RTI (2016)
* Information is not provided by gender and socioeconomic level Appendix Table B7: Islamic Schools Attendance by Year and Geopolitical Zone
Year Percentage of children who are Muslim
Formal schooling only
Attend both formal and religious schooling
Religious schooling only
No schooling
North central
2010 46% 31% 49% 9% 11% 2015 43% 19% 48% 20% 12%
Northeast 2010 85% 11% 29% 29% 31% 2015 82% 8% 34% 42% 16%
Northwest 2010 91% 5% 44% 35% 16% 2015 92% 4% 46% 42% 7%
Southeast 2010 38% 44% 48% 48% 7% 2015 41% 39% 51% 4% 6%
Southwest 2010 * * * * * 2015 * * * * *
South-south
2010 2% 59% 39% 2* * 2015 3% 67% 31% 2% 1%
Nigeria 50% 15 42% 26% 18%
Source: NPC & RTI (2016)

237
Appendix Table B8: Literacy among children (all) in Nigeria
Could read all
Could read some
Could not read any
Percent Literate
Number of Children
UBE Age 5 4.7 8.4 87.0 13.0 9,600 6 to 11 23.2 17.9 58.9 41.1 42,615 12 to 14 53.8 16.5 29.7 70.3 16,623 15 to 16 66.1 12.2 21.7 78.3 9,722
Residence
Urban 49.9 17.8 32.3 67.7 32,734 Rural 20.5 14.3 65.2 34.8 45,824
Region
North Central 25.9 17.8 56.3 43.7 11,688 North East 15.8 11.8 72.4 27.6 11,154 North West 16.9 10.6 72.5 27.5 20,947 South East 40.8 19.9 39.3 60.7 8,980 South South 50.2 21.3 28.5 71.5 11,509 South West 55.7 17.6 26.7 73.3 14,280
North Central
Benue 20.1 18.1 61.8 38.2 2,513 Federal Capital Territory
60.1 18.4 21.5 78.5 666
Kogi 37.5 14.1 48.4 51.6 1,933 Kwara 34.5 21.5 44.1 55.9 1,353 Nasarawa 21.2 17.0 61.9 38.1 1,078 Niger 15.8 20.5 63.7 36.3 2,340 Plateau 18.2 15.3 66.5 33.5 1,804
North East
Adamawa 25.2 10.9 63.8 36.2 1,790 Bauchi 12.4 11.1 76.5 23.5 2,830 Borno 12.6 14.4 72.9 27.1 2,384 Gombe 21.2 12.8 66.0 34.0 1,392 Taraba 9.7 10.1 80.3 19.7 1,346 Yobe 16.8 10.7 72.5 27.5 1,412
North West
Jigawa 9.7 7.3 83.0 17.0 2,545 Kaduna 33.4 10.8 55.8 44.2 3,313 Kano 18.9 9.7 71.5 28.5 5,654 Katsina 13.3 9.8 76.9 23.1 3,478

238
Kebbi 14.5 17.1 68.4 31.6 1,980 Sokoto 6.8 14.9 78.2 21.8 2,221 Zamfara 12.2 6.5 81.3 18.7 1,756
South East
Abia 39.1 25.4 35.5 64.5 1,560 Anambra 54.9 16.5 28.6 71.4 2,301 Ebonyi 26.2 22.2 51.7 48.3 1,282 Enugu 41.8 14.7 43.5 56.5 1,733 Imo 34.6 22.4 42.9 57.1 2,105
South South
Akwa Ibom 47.6 19.2 33.2 66.8 2,200 Bayelsa 42.5 16.6 40.9 59.1 894 Cross River 26.0 24.1 49.9 50.1 1,605 Delta 57.3 18.1 24.6 75.4 2,284 Edo 49.4 26.3 24.4 75.6 1,731 Rivers 63.2 22.6 14.2 85.8 2,793
South West
Lagos 70.7 18.3 11.0 89.0 3,999 Ekiti 56.7 16.7 26.6 73.4 1,372 Ogun 54.6 19.4 26.1 73.9 1,982 Ondo 44.5 15.6 39.8 60.2 1,883 Osun 57.5 15.3 27.1 72.9 1,927 Oyo 42.3 18.6 39.1 60.9 3,117 Total Total 32.7 15.7 51.5 48.5 78,558
Could
read all Could read
some Could not read any
Percent Literate
Number of Children
Education No Schooling 4.3 5.4 90.3 9.7 19,449 Pre-primary 7.1 15.8 77.1 22.9 6,601 Primary 30.9 23.0 46.0 54.0 37,021 Secondary and Higher
82.6 11.2 6.1 93.9 15,700
Total 32.7 15.7 51.6 48.4 78,771
Source: NPC & RTI (2015)

239
Appendix Table B8: Numeracy among children (all) in Nigeria
Could solve
all
Could solve some
Could not solve any
Percent Numerate
Number of Children
UBE Age 5 7.8 10.3 82.0 18.1 9,543 6 to 11 33.4 16.1 50.5 49.5 42,468 12 to 14 60.4 13.2 26.4 73.6 16,586 15 to 16 69.5 10.1 20.4 79.6 9,696
Residence
Urban 59.5 15.9 24.7 75.4 32,673 Rural 26.9 12.7 60.5 39.6 45,620
Region
North Central 35.9 17.7 46.5 53.6 11,679 North East 17.5 11.1 71.4 28.6 11,053 North West 16.5 11.2 72.4 27.7 20,883 South East 57.2 17.2 25.5 74.4 8,961 South South 62.4 16.1 21.5 78.5 11,454 South West 69.1 13.7 17.2 82.8 14,264
North Central
Benue 31.9 14.8 53.3 46.7 2,512 Federal Capital Territory
67.2 15.7 17.1 82.9 668
Kogi 43.3 16.2 40.5 59.5 1,925 Kwara 57.0 20.3 22.6 77.3 1,353 Nasarawa 32.2 23.8 44.0 56 1,078 Niger 25.8 15.6 58.6 41.4 2,342 Plateau 21.4 20.9 57.8 42.3 1,800
North East
Adamawa 37.6 11.7 50.7 49.3 1,787 Bauchi 13.1 10.0 76.9 23.1 2,826 Borno 11.9 12.7 75.4 24.6 2,340 Gombe 19.1 13.8 67.1 32.9 1,343 Taraba 11.6 14.4 74.0 26 1,345 Yobe 14.1 4.1 81.9 18.2 1,412
North West
Jigawa 7.2 7.7 85.1 14.9 2,546 Kaduna 35.5 12.4 52.0 47.9 3,303 Kano 19.0 16.3 64.7 35.3 5,631

240
Katsina 14.5 9.7 75.8 24.2 3,471 Kebbi 11.3 8.9 79.8 20.2 1,969 Sokoto 4.7 5.9 89.4 10.6 2,208 Zamfara 10.4 9.7 80.0 20.1 1,755
South East
Abia 52.5 22.8 24.7 75.3 1,560 Anambra 62.8 15.1 22.1 77.9 2,291 Ebonyi 47.9 23.5 28.7 71.4 1,282 Enugu 59.5 13.7 26.8 73.2 1,726 Imo 58.6 14.5 26.9 73.1 2,102
South South
Akwa Ibom 69.3 11.9 18.9 81.2 2,194 Bayelsa 54.1 19.6 26.3 73.7 883 Cross River 29.5 19.6 50.9 49.1 1,572 Delta 67.2 16.4 16.4 83.6 2,280 Edo 68.8 14.5 16.7 83.3 1,731 Rivers 70.1 17.1 12.8 87.2 2,794
South West
Lagos 83.2 11.1 5.8 94.3 3,999 Ekiti 69.5 14.3 16.2 83.8 1,367 Ogun 58.5 20.1 21.4 78.6 1,979 Ondo 64.7 14.7 20.5 79.4 1,875 Osun 70.4 13.6 16.0 84 1,926 Oyo 59.5 12.1 28.4 71.6 3,117 Total Total 40.5 14.0 45.5 54.5 78,293
Source: NPC & RTI (2015)

241