education policy analysis - redalyc · education policy analysis archives vol. 25 no. 35 4...
TRANSCRIPT

Education Policy Analysis
Archives/Archivos Analíticos de Políticas
Educativas
ISSN: 1068-2341
Arizona State University
Estados Unidos
Lee, Jaekyung; Wu, Yin
Is the Common Core Racing America to the Top? Tracking Changes in State Standards,
School Practices, and Student Achievement
Education Policy Analysis Archives/Archivos Analíticos de Políticas Educativas, núm. 25,
2017, pp. 1-20
Arizona State University
Arizona, Estados Unidos
Available in: http://www.redalyc.org/articulo.oa?id=275050047028
How to cite
Complete issue
More information about this article
Journal's homepage in redalyc.org
Scientific Information System
Network of Scientific Journals from Latin America, the Caribbean, Spain and Portugal
Non-profit academic project, developed under the open access initiative
Journal website: http://epaa.asu.edu/ojs/ Manuscript received: 18/11/2016Facebook: /EPAAA Revisions received: 7/3/2017Twitter: @epaa_aape Accepted: 8/3/2017
education policy analysis archivesA peer-reviewed, independent, open access, multilingual journal
Arizona State University
Volume 25 Number 35 April 10, 2017 ISSN 1068-2341
Is the Common Core Racing America to the Top? Tracking Changes in State Standards, School Practices, and
Student AchievementJaekyung Lee
&Yin Wu
University at Buffalo, SUNYUnited States
Citation: Lee, J., & Wu, Y. (2017). Is the Common Core racing America to the top? Tracking changes in state standards, school practices, and student achievement. Education Policy Analysis Archives, 25(35). http://dx.doi.org/10.14507/epaa.25.2834
Abstract: This study examines the trends of the U.S. states’ reading and math proficiency standards before and after the adoption of the Common Core State Standards (CCSS) and explores their impact on school practices and student achievement. Drawing on the 2003-15 National Assessment of Educational Progress (NAEP) grades 4 and 8 assessment and survey datasets, the study gives new insights into the CCSS policy challenges and outcomes. The states that adopted CCSS raised the rigor of proficiency standards for their student assessments, reversing ‘race to the bottom’ trend during the earlier period of the No Child Left Behind Act (NCLB). However, the CCSS states failed to improve schools’ alignment of ELA and math programs with state/district assessments and also failed to improve students’ reading and math achievement more than the non-CCSS counterparts. The Common Core has helped America race to the top for performance standards, but not for performance outcomes yet.Keywords: Common Core; alignment; achievement; NAEP; NCLB; proficiency standards
Education Policy Analysis Archives Vol. 25 No. 35 2
¿Será Common Core lo que llevará América hacia la carrera para ser numero uno?Seguimiento de los cambios en las normas estatales, las prácticas escolares y los logros estudiantilesResumen: Este estudio examina las tendencias de los estándares de competencia en lectura y matemáticas en los estados de lo Estados Unidos antes y después de la adopción de los Estándares Estatales Comúnes (CCSS) y explora su impacto en las prácticas escolares y el logro estudiantil. El estudio, basado en los conjuntos de datos de evaluaciones y encuestas de lo s grados 4 y 8 de la Evaluación Nacional del Progreso Educativo (NAEP) 2003-15, ofrece nuevas perspectivas sobre los retos y resultados de la política de CCSS. Los estados que adoptaron la CCSS elevaron el rigor de los estándares de competencia para sus evaluaciones estudiantiles, invirtiendo la tendencia de la "carrera hacia el fondo" durante el período anterior de la Ley de No Child Left Behind (NCLB). Sin embargo, los estados de la CCSS no lograron mejorar la alineación de las escuelas de los programas ELA y matemáticas con las evaluaciones estatales / distritales y tampoco lograron a mejorar los logros de lectura y matemáticas de los estudiantes más que los de que no participaron en CCSS. El Núcleo Común ha ayudado a América a llegar a la cima para los estándares de rendimiento, pero no para los resultados de rendimiento.Palabras-clave: Common Core; alineación; logro; NAEP; NCLB; normas de estatales
Vai Common Core que vai levar a América para a corrida para ser o número um?Acompanhando alterações em normas estaduais, práticas escolares e desempenho do alunoResumo: O presente estudo analisa padrões tendências de proficiência em leitura e matemática nos estados dos Estados Unidos antes e depois da adoção de normas estaduais Common Core (CCSS) e explora o seu impacto sobre as práticas escolares e desempenho do aluno. O estudo, baseado em conjuntos de dados de avaliações e estudos dos graus 4 e 8 da Avaliação Nacional do Progresso Educacional (NAEP) 2003-15, oferece novas perspectivas sobre os desafios e resultados da política CCSS. Estados que adotaram o CCSS aumentou o rigor dos padrões de competência para as suas avaliações do estudante, invertendo a tendência de “corrida para o fundo” durante o período da Lei de No Child Left Behind (NCLB). No entanto, os estados da CCSS não conseguiu melhorar o alinhamento das escolas em ELA e programas de matemática com avaliações estaduais / distritais e também não conseguiu melhorar o desempenho em leitura e matemática estudantes do que aqueles que não participou CCSS. O Common Core ajudou América para chegar ao topo para os padrões de desempenho, mas ainda não deu resultados. Palavras-chave: Common Core; alinhamento; realização; NAEP; NCLB; normas estaduais
Is the Common Core Racing America to the Top?
The No Child Left Behind Act of 2001 (NCLB) was aimed at ensuring 100 percent reading and math proficiency for all students across all states by 2014 (Pub.L. 107-110, enacted January 8, 2002). However, the National Assessment of Educational Progress (NAEP) has revealed that for many states, their own proficiency levels were not as challenging as those of NAEP (Bandeira de Mello, 2011, Lee, 2008; Linn, Baker, & Betebenner, 2002). Furthermore, there was significant gap between the NAEP and state assessment results in terms of academic progress. Since NCLB’s inception, state assessment results showed improvements in math and reading, but without similar gains on the NAEP (Cronin, Dahlin, Adkins, & Kingsbury, 2007; Lee, 2008). While the NCLB allowed individual states to set Adequate Yearly Progress (AYP) targets based on the states’ own performance standards and assessments, the goals were unrealistic and the stakes were high for many low-performing schools; consecutive failure in meeting the targets posed school restructuring

Is the Common Core Racing America to the Top? 3
threats such as administrator/staff replacement, takeover and conversion (see Center on Education Policy, 2008; Koretz, 2008; Linn, Baker, & Betebenner, 2002; Welner, 2005). Therefore, the phenomenon of ‘race to the bottom’ occurred among the states where the rigor of proficiency standards on their own assessment relative to NAEP has declined under the threats of NCLB high-stake state testing (Hess, 2014; Lee, 2010).1
The “common core state standards” (CCSS) initiative, launched in 2009 and implemented in 42 states as of 2015, was intended to help fix this ‘race to the bottom’ problem by having the states adopt uniformly high standards for college and career readiness, that is, what K–12 students should know in English Language Arts and Mathematics at the end of each grade (Common Core Standards, 2013; Gewertz, 2013; Lee, 2016; Porter, McMaken, Hwang, & Yang, 2011).2 In 2008, Achieve, the Council of Chief State School Officers (CCSSO), and the National Governors Association (NGA) issued “Benchmarking for Success,” a report that urged states to develop and adopt common standards; called for federal incentives to promote that effort; and ad¬vocated aligning textbooks, curricula, and tests to those standards (Achieve, the Council of Chief State School Officers, and the National Governors Association, 2008; Hess, 2014). The federal government also provided support for the adoption and implementation of the CCSS through the Race to the Top (RTTT) program.
In 2009, the US Department of Education initiated a grant competition through the RTTT to support the development of assessment systems and resulted in two state assessment consortia —Partnership for Assessment of Readiness for College and Careers (PARCC) and Smarter-Balanced Assessment Consortium (SBAC); one of the grant funding requirements was “common cut scores” across all consortium states (Hain & Piper, 2016; McCall, 2016a). Achieve, a nonprofit educational policy organization, which was instrumental in the development of the CCSS became the project manager for the PARCC with its eight member states. The SBAC also adopted the CCSS as the basis of test development with its seventeen member states. Until the Every Student Succeeds Act (ESSA) was passed in December 2015, the U.S. Department of Education had encouraged states to adopt CCSS by tying the grant of NCLB waivers to adoption of the standards. However, since the ESSA has replaced the NCLB, the law prohibits the U.S. Department of Education from attempting to influence, incentivize, or coerce state adoption of the CCSS. Under the new consortia assessment system (i.e., PARCC and SBAC) , tension remains between the states and consortia regarding control over tests themselves and over proficiency standards; the challenge for consortia is to provide timely and useful information to school teachers through formative assessment and promote educator involvement in item writing, scoring, standard setting, and test design (McCall, 2016b).
We examine whether the CCSS have influenced states’ performance standards, thereby addressing the race to the bottom issue, and if so, whether such change have had any measurable impact on school program alignment and student achievement in reading and math. This study
1 Lee (2010) showed the inverse relationship between high-stakes accountability policy pressure and the rigor of proficiency standards during early NCLB period (2013-15). Hess (2014) viewed CCSS as a policy response to race to the bottom issue under NCLB: “The possibility of sanctions gave more than a few state leaders reason to adopt easy tests and lower the scores required for proficiency. A “race to the bottom” was soon underway, prompting an effort to combat the gamesmanship. … If all states played by the same rules, there would be no race to the bottom. Encouraged by bipartisan interest in the initiative, the CCSSO and NGA launched the Common Core effort.”2 The broad purposes of CCSS policy initiative include universal college and career readiness without remediation, preparing students to compete in a global marketplace, and improving equity by providing the same, rigorous standards across ZIP codes.
Education Policy Analysis Archives Vol. 25 No. 35 4
tracks the trends of 50 states’ reading and math proficiency standards under NCLB, including years before and after the adoption of the CCSS. Further, the study explores CCSS policy implementation in terms of the alignment of school programs with state curriculum standards and assessments and their impact on students’ academic achievement as measured by NAEP reading and math tests.
Research Framework and Perspectives
The implementation of federal education policies has been characterized as a process of mutual adaptation and compromise (see Cohen & Moffitt, 2009; McLaughlin, 1976; Peterson, Rabe, & Wong, 1986). Public schools have engaged in a process of decoupling to gain public confidence, although they face increasingly stronger demand for improved productivity (Meyer & Rowan, 1978; Rowan & Miskel, 1999). While the high-stakes accountability policy under NCLB brought more scrutiny into school performance, one-size-fits-all policy approach did not work well as intended, producing differential incentives and uneven effects (Brown & Clift, 2010; Center on Education Policy, 2007; Lee, Shin, & Amo, 2013). Implementation challenges continued during the CCSS and RTTT periods, particularly around the issues of new test development, buy-in, and alignment (Coburn, Hill, & Spillane, 2016; McCall, 2016b). Indeed, the CCSS states were undergoing a period of transition in phasing in new assessments and also facing a growing attack on testing; test opt-out movement occurred across the nation, particularly in states such as New York where education policymakers pushed for hasty implementation of new common core tests (see Harris & Fessenden, 2015; Strauss, 2014).
The conceptual framework of the CCSS policy is consistent with the mechanism of the standards-based education reform policies (Hamilton, Stecher, & Yuan, 2008). Standards-based education policy seeks academic improvement by setting and aligning key educational standards: content standards, performance standards, and opportunity-to-learn standards.3 One key component of standards-based reform is the alignment of instruction and assessments with content standards (Hamilton, Stecher, Marsh, McCombs, & Robyn, 2007; Polikoff & Porter, 2014; Smith & O’Day, 1991). Another major component is the balance of instructional autonomy with accountability for performance (Boser & Brown, 2016; Hamilton et al., 2007). While the earlier standards-based education reform focused on improving school inputs such as teachers and curriculum, the later reform policy shifted its focus to student outcomes; both input-based and performance-basedpolicies had limitations and failed to improve academic excellence and equity simultaneously across the nation (Lee, 2016). As CCSS-driven education policies seek to improve both standards alignment and testing accountability, it is essential to understand whether and how this new policy combination works for teaching and learning (Coburn et al., 2016).
The uniqueness of the CCSS lies in the fact that multiple states implemented same standards and standards-aligned assessments throughout their entire K-12 education system (Common Core Standards, 2013). In spite of these common expectations of standards-based education policy, the Achieve survey of state policies (2013) revealed significant variations in terms of implementing and supporting the CCSS. Although most states provided guidance (N = 40) and/or developed curricular and instructional materials for voluntary use (N = 30), fewer states approved/certified the materials aligned with standards (N = 17) and even fewer required use (N =5). The survey also
3 Content standards (also called (or curriculum standards) define what students should know and be able to do. Performance standards (also called proficiency standards) determine how good is good enough for academic proficiency or other levels of mastery. Opportunity-to-learn standards (also called school delivery standards) prescribe programs, staff, and resources for students to meet the content and performance standards.

Is the Common Core Racing America to the Top? 5
revealed variations in state assessment transition actions in 2013; only 27 states reported changes in assessments such as adding or removing items and expanding or creating performance-based assessments. Instead of focusing on accuracy in estimation and providing summative information about student learning, the new consortium assessment systems attempt to enhance formative assessment components in the entire assessment systems (Jiao & Lissitz, 2016). It remains to be seen whether and how the new state assessments as developed by two consortia will help schools advance toward the goal of college and career readiness for students at the time when the federal government returns control over test performance standards and school accountability back to individual states.
There were some mixed messages from previous studies on the implementation and potential effects of standards-based education reform policy during the CCSS era. Polikoff and Porter (2014) found that the associations between the alignment of teachers’ instruction with state standards and/or assessments and students’ achievement on state assessment were very weak. Concerns were also raised about the lack of teacher preparation and instructional support for the CCSS implementation (Gewertz, 2013; Kornhaber, Griffith, & Tyler, 2014; Schmidt & Houang, 2012; Welner, 2014). Davis, Choppin, Roth and Drake (2013) reported that a majority of middle school math teachers used textbooks adopted prior to the CCSS and cited a need for more support, including better-aligned curriculum materials and assessments. Schmidt and Houang (2012) suggested that the congruence between states’ mathematics standards and the CCSS (Mathematics) might help raise the states’ NAEP math performance. Boser and Brown (2016) also reported that many of the states that took a more robust standards-based approach to school reform showed the larger NAEP test score gains.
While most previous studies of the CCSS focused on content standards (what students should learn), there was relatively little attention to performance standards (how well students should perform). The earlier NAEP-state assessment standard mapping study showed the tendency of raising performance standards among some states during 2007-09 period (Bandeira de Mello, 2011). However, that study has limited generalizability since it did not examine all states throughout the entire NCLB period. Moreover, that study contrasts with the earlier studies’ finding that the rigor of proficiency standards had declined during 2003-05 period (Cronin et al., 2007; Lee, 2008). Using more recent data, Peterson and Ackerman (2015) reported that many states have raised their proficiency bars since 2011. However, that study was descriptive and could not tell whether these recent changes are significantly different from the earlier trend and if so, whether they are attributable to the CCSS. Moreover, the question about linkages between state standards and student achievement remains to be answered, since there were many challenges of policy implementation and thus expected impact on student achievement may not become evident yet. A previous study (prior to the CCSS) revealed that the linkage between state-level proficiency standards and classroom-level (teacher-made) proficiency standards was tenuous and the rigor of state standards for proficiency was not associated with student achievement gains (Lee, Liu, Amo, & Wang, 2014).
The CCSS are expected to influence student learning and achievement through a combination of multiple policy pathways, including (1) provision of high-quality curriculum and instructional materials aligned with new standards, (2) professional development support for teachers and school leaders, (3) development or revision of student assessment system aligned with new standards, (4) raising performance standards (proficiency levels) on existing or new assessments, and (5) holding schools and teachers accountable for the results of student assessments (Achieve, 2013). This study focuses on the pathway (4), that is, raising the rigor of proficiency standards which may directly or indirectly have positive impact on student achievement. The study examines school responses to the CCSS in terms of the degree of alignment, that is, structuring and modifying instructional programs and practices based on new curriculum standards/framework and new
Education Policy Analysis Archives Vol. 25 No. 35 6
assessment results (i.e., feedback mechanism). This study consists of two sequential parts: one that addresses changes in the rigor of state standards and another that addresses the relationship between state standards, school practices, and student achievement.
Data and Methods
This study measures the rigor of the 50 states’ proficiency standards for grades 4 and 8 students in reading and math, based on the average discrepancy between state assessment- and NAEP-based proficiency rates in logit values during the years when both NAEP and state assessment data are available: 2003, 2005, 2007, 2009, 2011, 2013, and 2015. The higher the student proficiency rates based on states’ own assessments relative to NAEP, the lower the rigor of state proficiency standards. The analysis was conducted separately for each grade and subject as well as for the composite of all grades and subjects. The composite index of rigor (in logit) of state test proficiency standards was the average of measures across grades 4 and 8 in reading and math; the correlations of rigor index were very high with consistent patterns among those subjects and grades (see Appendix).
Data sources for the NAEP state assessment results are the National Center for Education Statistics (NCES). Data sources for the state assessment results are the state department of education websites. Data sources for the CCSS adoption status are the Common Core website: http://www.corestandards.org/standards-in-your-state (see Appendix). The CCSS states (N = 42) (1) adopted the standards in both ELA and math since 2010 and (2) fully implemented the standards by 2015.4 The years of CCSS implementation during 2011-2015 period varies among states: N = 10 for 1 year, N = 26 for 2 years, N = 5 for 3 years, and N = 1 for 4 years. Data sources for the RTTT are the U.S. Department of Education website on RTTT grant awards: http://www2.ed.gov/programs/racetothetop/awards.html (see Appendix). The RTTT states (N = 18) include the winners for Phase 1 and Phase 2 grant in 2010, and the winners for Phase 3 in 2011.
For the first part of research questions, Hierarchical Linear Modeling (HLM) was used to track individual states’ rigor of the proficiency standards and to examine interstate variations (Raudenbush & Bryk, 2002). Two-level HLM analyses were conducted separately for each subject/grade rigor variable as well as the composite index of rigor variable; only the results of composite analysis are reported for summary as the patterns turned out to be consistent across the two subjects and grades. At level-1 (time-level), four parameters were used to keep track of each state’s proficiency standards as outcome variable: initial status (at NCLB onset) in 2003, growth rate in 2003, curvature in the growth rate during 2003-15, and post-CCSS change in 2015. At level-2 (state-level), the CCSS adoption status and RTTT grant award status variables were used to explain interstate variations in the trends of proficiency standards; student demographics including % minority and % poverty variables were included as covariates.
For the second part of research questions, the study examined the relationship between state-level CCSS policy factors and the NAEP student achievement gains during 2009-15 period.5
4 Among the eight non-CCSS states, Minnesota adopted common core standards in ELA only, but not in math; Indiana adopted the standards in 2010 but reversed its adoption in 2014. All states will reportedly have college and career ready (CCR) standards in place by 2014-15, although not all of them are CCSS (Achieve, 2013).5 State assessment results were not used as consistent measures of student achievement as policy outcomes in this study, since changes in proficiency rates are likely to be an artifact of changes in state assessments over the period. According to 2013 Achieve survey, states such as Kentucky, Minnesota, New York and Virginia

Is the Common Core Racing America to the Top? 7
Specifically, the following state-level predictors were included in the regression model to account for possible CCSS policy mechanism: (1) the rigor of state proficiency standards, (2) school program alignment with state curriculum standards, and (3) school program alignment with state/district assessment results (see Appendix). Multiple regression analysis was conducted to examine the relationships of at the state level.
For the factors (2) and (3), the NAEP 2009-15 school administrator survey data were used with regard to the extent to which school ELA and math programs were structured according to state curriculum standards or frameworks and according to results from state/district assessments. The NAEP school administrator survey includes these alignment questions since 2009, repeating them every two years until 2015. The correlations of state average school administrator response values between adjacent survey years were very high (r = .78 - .89 for program alignment with curriculum standards and r = .82 - .93 for program alignment with assessment results).6 This pattern suggests that even though the composition of school samples may have changed, the school responses were highly reliable at the state level during the 2009-15 NAEP assessment period. Given these stable patterns across subjects, we averaged out the state mean values of responses from all four repeated measures in ELA and math together to construct two composite factors of program alignment, both of which were used as predictors for the regression analysis of the 2009-15 NAEP student achievement gains.
Since the relationship between proficiency standards and student achievement may be reciprocal, this study also applied autoregressive cross-lagged path analysis method (Campbell & Stanley, 1963; Finkel, 1995) to seven successive waves of the NAEP reading/math assessment (2003 - 2015) and state standards. The analysis treated the rigor of standards as both independent and dependent variables, in that it may influence students’ academic achievement as measured by NAEP assessment at the state level but at the same time may be influenced by students’ achievement in previous years. Specifically, three types of effects were examined: stability, synchronous correlations, and cross-lagged effects. Of particular interest was the comparison of the cross-lagged relationships between state standards and student achievement because this comparison helps determine which is more likely to be the cause.
Results
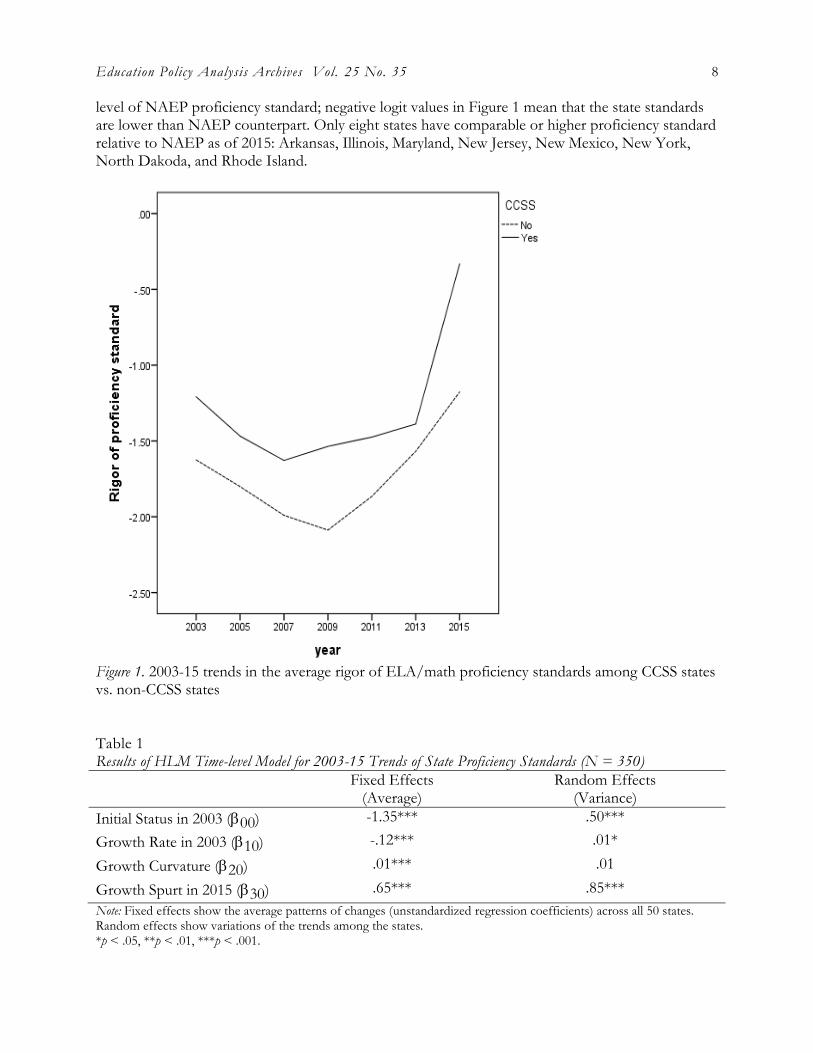
Overall, the rigor of state standards for ELA and math proficiency showed curvilinear trajectory over the period of 2003-15 (see Figure 1). The trend is marked by bifurcation with gradual decline during 2003-09, followed by gradual recovery during 2009-13 and then growth support in 2015 (Table 1). The turning point of this trend was around 2009, when many states started to reverse the earlier downward path under the NCLB. The average gain in the rigor of proficiency standards during 2009-2015 period was moderate to large with about 1 point in logit (equivalent to 0.6 in standard deviation unit). Several states (Alaska, Alabama, Arkansas, Idaho, Georgia, Illinois, Kansas) made very large positive gains with more than 1 standard deviation, whereas a few states (Nevada, Massachusetts, Tennessee, Wisconsin) made no or slightly negative gains. Although most states increased the rigor of proficiency standards after 2009, a majority of them still fall below the
which have already implemented assessments aligned to the CCSS or other CCR standards have seen substantial decreases in the percentages of students scoring at proficient or CCR level.6 Because the NAEP school sample changes each time due to its repeated cross-sectional survey design, it is not possible to check the consistency of individual school administrators’ survey responses over time. However, since this study uses survey information at the aggregate state level, what matters for reliability is the consistency of state average school responses for the same questions over time.
Education Policy Analysis Archives Vol. 25 No. 35 8
level of NAEP proficiency standard; negative logit values in Figure 1 mean that the state standards are lower than NAEP counterpart. Only eight states have comparable or higher proficiency standard relative to NAEP as of 2015: Arkansas, Illinois, Maryland, New Jersey, New Mexico, New York, North Dakoda, and Rhode Island.
Figure 1. 2003-15 trends in the average rigor of ELA/math proficiency standards among CCSS states vs. non-CCSS states
Table 1Results of HLM Time-level Model for 2003-15 Trends of State Proficiency Standards (N = 350)
Fixed Effects(Average)
Random Effects(Variance)
Initial Status in 2003 (00) -1.35*** .50***Growth Rate in 2003 (10) -.12*** .01*
Growth Curvature (20) .01*** .01
Growth Spurt in 2015 (30) .65*** .85***Note: Fixed effects show the average patterns of changes (unstandardized regression coefficients) across all 50 states. Random effects show variations of the trends among the states. *p < .05, **p < .01, ***p < .001.

Is the Common Core Racing America to the Top? 9
The comparison of the trends between the CCSS and non-CCSS states reveals that both of them followed curvilinear trajectories with some notable differences (see Figure 1). The proficiency standards of the CCSS states not only started at the higher level of rigor but also remained more rigorous than those of the non-CCSS states throughout the period. Moreover, the CCSS states started raising the rigor of proficiency standards a few years earlier than the non-CCSS states. According to the HLM analysis results in Table 2, there was significant growth spurt among the CCSS states in 2015, widening their preexisting gap relative to the non-CCSS states and at the same time narrowing the gap relative to the NAEP standard (see Table 2). Among the CCSS states, there were no significant differences between the RTTT and non-RTTT states in the rigor of proficiency standards. As far as the states’ student demographic factors were concerned, the minority rate (% racial minority students) had no significant effects on the trend, whereas the poverty rate (% free/reduced lunch students) had negative effect on the initial status of standards but not on the changes; high-poverty states had relatively lower proficiency standards and the pattern persisted over the period.
Table 2Results of HLM State-level Model for 2003-15 Trends of State Proficiency Standards (N = 50 States)
Fixed Effects“Growth Spurt in 2015” as Outcome
CCSS (31) 1.08*
RTTT (32) -.50 % Minority Students (33) .01
% Free/Reduced Lunch (34) .01 R2 (% between-state variance explained) .73
“Initial Status in 2003” as OutcomeCCSS (01) .38RTTT (02) -.22
% Minority Students (03) .01
% Free/Reduced Lunch (04) -.03*R2 (% between-state variance explained) .73Note: Results for “growth rate in 2003” and “Growth curvature” are not reported here due to insignificant variances and insignificant predictors at the state level. *p < .05
There is some evidence of policy-practice disconnect or loose coupling in terms of school program alignment with state standards and assessment results. According to the NAEP 2009-15 school administrator survey data, about 99% of the nation’s public schools reported that school ELA and math programs were structured according to state curriculum standards or frameworks. The average school-response rating was around 3.9 on a 4 point scale (1 = not at all, 2 = some extent, 3 = moderate extent, 4 = large extent), and it hardly changed between 2009 and 2015. There are also no significant differences in the average rating of program alignment with state standards between the CCSS and non-CCSS states (see Figure 2). Different patterns emerge for the NAEP school administrator survey question of to what extent school ELA and math programs were structured according to results from state or district assessment results. Over the same period (2009-

Education Policy Analysis Archives Vol. 25 No. 35 10
15), the average rating of alignment with assessment results dropped significantly in the CCSS states but not in the non-CCSS states (see Figure 2).
Figure 2. 2009-15 trends in the average alignment of school ELA/math programs with state curriculum standards (left panel) and state/district assessment results (right panel) among CCSS states vs. non-CCSS states

Is the Common Core Racing America to the Top? 11
The comparison of the NAEP proficiency rates between the CCSS and non-CCSS states reveals that they follow similar patterns of very modest achievement gains during 2003-15 period; there were no statistically significant differences in both average proficiency and growth rate between the CCSS and non-CCSS groups (see Figure 3). This linear (and modest) growth pattern for student achievement has sharp contrast with aforementioned curvilinear (and large) growth pattern for proficiency standards. There is no evidence suggesting possible reciprocal relationship between proficiency standards and student achievement throughout 2003-15 period.
Figure 3. 2003-15 trends in NAEP grades 4 and 8 reading and math proficiency rate (averaged across grades and subjects in logit) among CCSS states vs. non-CCSS states
The results of cross-lagged path analysis show the broken association between standards and performance variables in both directions; the NAEP proficiency rates remained highly stable over time, whereas the state proficiency standards fluctuated over time (see Figure 4). Even during the 2009-15 period when ELA and math proficiency standards were raised by many states under the CCSS, it appears that the upgraded state performance standards of and by themselves did not help improve student achievement in reading and math.

Education Policy Analysis Archives Vol. 25 No. 35 12
Figure 4. Model of cross-lagged relationship between standards (mean rigor score) and performance (NAEP proficiency rate)Note: The solid lines indicate coefficients statistically significant at p < .05. The dotted lines indicate nonsignificant coefficient.
Further, Table 3 shows the results of regression analysis that examines the relationship between the state-level CCSS policy factors and NAEP student achievement gains during 2009-15 period. Specifically, the following state-level predictors were included in the regression model to account for possible CCSS policy mechanism: (1) the rigor of proficiency standards, (2) alignment with state curriculum standards, and (3) alignment with state/district assessment results. While the first two factors (i.e., proficiency standards and alignment with curriculum standards) made no differences, the third factor (i.e., alignment with state/district assessment results) turned out to be a significant predictor of NAEP proficiency gains; one standard deviation increase in the assessment-based alignment variable was associated with .72 standard deviation increase in NAEP proficiency gains. While schools in the CCSS states reported relatively lower degree of program alignment with state/district assessment results than the non-CCSS counterparts, the CCSS adoption did not seem to make a difference in the states’ NAEP reading and math test results. This finding may help explain the insignificant relationship between the rigor of proficiency standards and student achievement as noted in Figure 4.
Table 3Results of HLM State-level Model for 2003-15 Trends of State Proficiency Standards (N = 50 States)
Standardized CoefficientsCCSS -.08 RTTT -.03 Rigor of Proficiency Standards .06 Program Alignment w/ State Curriculum Standards -.48 Program Alignment w/ State/District Assessment Results .72*R2 (% between-state variance explained) .18Note: *p < .05

Is the Common Core Racing America to the Top? 13
Discussion
American public education has been criticized for the lower student achievement levels as well as the larger achievement gaps among students in reading and math. Pointing out the lack of rigor in state educational standards as primary culprit, the national call for adoption of the CCSS by Achieve, NGA and CCSSO attempted to address some underlying problems: “watered down curriculum” (i.e., the lower rigor of state content standards relative to high-performing nations’ world-class benchmarks) and “race to the bottom” (i.e., the declining rigor of state performance standards as the basis of school accountability policy under the NCLB). With the common core standards in ELA and math, federal education policies pushed the states further through the RTTT grants and NCLB waivers towards developing new tests aligned with the content standards and raising performance standards for accountability. While there has been heightened political controversy about the federal role and policy efficacy in education, ongoing debates about the CCSS need to be informed by empirical data and research evidence.
This study tracked changes in the rigor of state performance standards (i.e., the level of proficiency thresholds for grades 4 and 8 ELA and math) before and after the CCSS. In the earlier period of the NCLB (2003 – 2009), many states reported significant increase of student ELA and math proficiency rate on their own state assessments (high-stakes tests) even when the same states’ student proficiency rates on NAEP (low-stakes tests) remained largely stagnant or improved only a little. In the later period of the NCLB (2009- 2015), the states raised the rigor of performance standards towards the convergence of proficiency rates between the NAEP and state assessments. The V-shape trend of state proficiency standards, particularly with post-CCSS growth spurt in 2015, implies that the adoption of CCSS-aligned tests may have contributed to making the state tests harder and raising the bar for student proficiency, thus reversing the earlier downward trend of state proficiency standards (i.e., race to the bottom phenomenon) under the NCLB high-stakes testing policy. Although the gap between the NAEP and state assessment results has been narrowing during the CCSS period, it is worth noting that most states’ own proficiency standards still remain relatively less rigorous than their NAEP counterpart.
It also needs to be noted that, albeit to a lesser extent, a similar trend (decline followed by growth) was observed among the non-CCSS states as well as the CCSS states. Even for the states without CCSS-aligned tests, simply changing proficiency cut-scores or modifying state assessments based on any new standards might have had chilling effects on students’ academic performance on their assessments. The trend of state proficiency standards also implies that the NCLB policy waivers may have also taken pressure off from states where many schools were under the threat of sanctions for failing to meet proficiency standards. Therefore, the relaxation of NCLB high-stakes testing pressure as well as the adoption of CCSS for benchmarking world-class standards may have affected the reversal of trends simultaneously. Among the CCSS states, this study did not find significant differences between the RTTT and non-RTTT states in terms of the trends of proficiency standards. This finding may be explained by the possibility that the RTTT competition could have incentivized almost all the states to adopt the CCSS in order to increase states’ chances of being a recipient of an RTTT award (thus being an RTTT state for our analysis).
Raising proficiency standards with new assessments may function as a double-edged sword for educational improvement, in the sense that the state initiative may help raise expectations for teaching and learning, but at the same time poorer student performance as an artifact of such drastic changes may demoralize school teachers and students, particularly in the absence of adequate support and tools for improvement. Notwithstanding the goal of racing America to the top under CCSS, there is no evidence yet that the more rigorous state proficiency standards would lead to the

Education Policy Analysis Archives Vol. 25 No. 35 14
higher student academic achievement as measured by the NAEP reading and math tests. While ELA and math proficiency standards were raised at the state level, the survey showed that schools did not necessarily intensify efforts to align their curriculum and instruction with the state standards and restructure ELA/math programs based on new state/district assessment results. Although the average level of alignment is high across the nation, it raises a question: why schools in the CCSS states did not strengthen their program alignment with state standards and assessments more than their counterparts in the non-CCSS states. These results might be understood in the context of growing resistance around the country to high-stakes testing, since testing backlash and disruptions, alongside more general issues of implementation challenges, could have resulted in the weaker alignment with assessments in the CCSS states. As far as the alignment with assessment mattered to the NAEP score gains, those CCSS states would fall short of other states whose assessments hadn’t been disrupted or potentially suffered some backlash due to the CCSS adoption.
Although it is premature to make any verdict on the impact of the CCSS on student achievement, the findings of this study as well as previous studies raise concerns about implementation challenges and limitations of the current CCSS-based education policies. The pace of reported changes based on school survey suggests that there is still a long way to go in bridging the gap between policy and practice. The Common Core has helped America race to the top for performance standards, but not for performance outcomes yet.
References
Achieve. (2013). Closing the Expectations Gap. 2013 annual Report on the Alignment of State K–12 Policies and Practice with the Demands of College and Careers . Washington, DC: Author.
Achieve, the Council of Chief State School Officers, and the National Governors Association (2008). Benchmarking for Success: Ensuring U.S. Students Receive a World-Class Education. Washington, DC: National Governors Association.
Bandeira de Mello, V. (2011), Mapping State Proficiency Standards Onto the NAEP Scales: Variation and Change in State Standards for Reading and Mathematics, 2005–2009 (NCES 2011-458). National Center for Education Statistics, Institute of Education Sciences, U.S. Department of Education, Washington, DC: Government Printing Office.
Boser, B., & Brown, C. (2016). Lessons from state performance on NAEP: Why some high-poverty students score better than others. Washington, DC: Center for American Progress.
Brown, A. B., & Clift, J. W. (2010). The unequal effect of adequate yearly progress evidence from school visits. American Educational Research Journal, 47(4), 774-798. https://doi.org/10.3102/0002831210374644
Campbell, D. T., & Stanley, J. C. (1963). Experimental and quasi-experimental designs for research on teaching. Washington, DC: American Educational Research Association.
Center on Education Policy. (2007). Choices, changes, and challenges: Curriculum and instruction in the NCLB era. Washington, DC: Author.
Center on Education Policy. (2008). A call to restructure restructuring: Lessons from the No Child Left Behind Act in five states. Washington, DC: Author.
Coburn, C. E., Hill, H. C., & Spillane, J. P. (2016). Alignment and accountability in policy design and implementation: The Common Core State Standards and implementation research. Educational Researcher, 45(4), 243-251. https://doi.org/10.3102/0013189X16651080
Cohen, D. K., & Moffitt, S. L. (2009). The Ordeal of Equality. Did Federal Regulation Fix the Schools? Cambridge, MA: Harvard University Press.

Is the Common Core Racing America to the Top? 15
Common Core Standards. (2013). K–8 publishers’ criteria for the Common Core State Standards for Mathematics. Retrieved from: http://www.corestandards.org/assets/Math_Publishers_Criteria_K-8_Summer%202012_FINAL.pdf.
Cronin, J., Dahlin, M., Adkins, D., & Kingsbury, G. G. (2007). The proficiency illusion. Washington, DC: Thomas B. Fordham Institute.
Davis, J., Choppin, J., Roth McDuffie, A., & Drake, C. (2013). Common Core State Standards for mathematics: Middle school mathematics teachers’ perceptions. Rochester, NY: The Warner Center for Professional Development and Education Reform, University of Rochester. Retrieved from http://www.warner.rochester.edu .
Finkel, S. E. (1995). Causal analysis with panel data (No. 105). Thousand Oaks, CA: SAGE.Gewertz, C. (2013, February 27). Teachers say they are unprepared for Common Core. Education
Week. Retrieved from http://www.edweek.org/ew/articles/2013/02/27/22common_ep.h32.html
Hain, B. A., & Piper, C. (2016). PARCC as a case study in understanding the design of large -scale assessment in the era of common core state standards., In H. Jiao & R. W. Lissitz (Eds.), The next generation of testing: common core standards, smarter-balanced, PARCC, and the nationwide testing movement (pp. 29-48). Charlotte, NC: Information Age Publishing.
Hamilton, L. S., Stecher, B. M., Marsh, J. A., McCombs, J. S., & Robyn, A. (2007). Standards-based accountability under No Child Left Behind: Experiences of teachers and administrators in three states. Santa Monica, CA: RAND Corporation.
Hamilton, L., Stecher, B., & Yuan, K. (2008). Standards-based reform in the United States: History, research, and future directions (No. RP-1384). Santa Monica, CA: RAND Corporation.
Harris, E. A., & Fessenden, F. (May 20, 2015). Opt Out’ Becomes Anti-Test Rallying Cry in New York State. New York Times. Retrieved from www.nytimes.com
Hess, F. M. (September 19, 2014). How the Common Core went wrong. National Affairs, 21, 3-19.
Jiao, H., & Lissitz, R. W. (2016) (Eds.) The next generation of testing: common core standards, smarter-balanced, PARCC, and the nationwide testing movement. Charlotte, NC: Information Age Publishing.
Koretz, D. (2008). The pending reauthorization of NCLB (pp. 9-26). In G. L. Sunderman (Ed.). The NCLB Challenge: Achieving Accountability, Equity and School Reform. Thousand Oaks, CA: Corwin Press.
Kornhaber, M. L., Griffith, K., & Tyler, A. (2014). It’s not education by zip code anymore – but what is it? Conceptions of equity under the Common Core. Education Policy Analysis Archives, 22(4). http://dx.doi.org/10.14507/epaa.v22n4.2014
Lee, J. (2008). Two Takes on the Impact of NCLB: Tracking Statewide Proficiency Trends through NAEP vs. State Assessment. (pp. 75-89). In G. L. Sunderman (Ed.). The NCLB Challenge: Achieving Accountability, Equity and School Reform. Thousand Oaks, CA: Corwin Press.
Lee, J. (2010). Trick or treat: New ecology of education accountability system in the USA. Journal of Education Policy, 25(1), 73-93. https://doi.org/10.1080/02680930903377423
Lee, J. (2016). The Anatomy of Achievement Gaps: Why and how American Education is Losing (but Can Still Win) the War on Underachievement. New York: Oxford University Press.
Lee, J., Liu, X., Amo, L. C., & Wang, W. L. (2014). Multilevel linkages between state standards, teacher standards, and student achievement testing external versus internal standards-

Education Policy Analysis Archives Vol. 25 No. 35 16
based education models. Educational Policy, 28(6), 780-811.https://doi.org/10.1177/0895904813475708
Lee, J., Shin, H., & Amo, L. (2013). Evaluating the Impact of NCLB School Interventions in New York State: Does One Size Fit All? Education Policy Analysis Archives, 21(67). Retrieved from http://epaa.asu.edu/ojs/article/view/1122
Linn, R. L., Baker, E. L., & Betebenner, D. W. (2002). Accountability systems: Implications of requirements of the no child left behind act of 2001. Educational Researcher, 31(6), 3-16.https://doi.org/10.3102/0013189X031006003
McCall, M. (2016a). Outline of smarter balanced validity agenda. In H. Jiao & R. W. Lissitz (Eds.), The next generation of testing: common core standards, smarter-balanced, PARCC, and the nationwide testing movement, (pp. 233-252). Charlotte, NC: Information Age Publishing.
McCall, M. (2016b). Overview, intention, history, and where we are now. In H. Jiao & R. W. Lissitz (Eds.), The next generation of testing: common core standards, smarter-balanced, PARCC, and the nationwide testing movement, (pp. 19-28). Charlotte, NC: Information Age Publishing.
McLaughlin, M. (1976). Implementation as mutual adaptation: Change in classroom organization. In W. Williams & F. Elmore (Eds.), Social program implementation, (pp. 167-180). New York: Academic Press.
Meyer, J. W., & Rowan, B. (1978). The structure of educational organizations. In M. W. Meyerand Associates (Eds.), Environments and organizations, (pp. 78-109). San Francisco: Jossey-Bass.
National Governors Association, Council of Chief State School Officers, and Achieve . (2008). Benchmarking for Success: Ensuring U.S. Students Receive a World-Class Education. Washington, DC: National Governors Association. Retrieved from http://www.nga.org.
Peterson, P. E., & Ackerman, M. (2015). States raise proficiency standards in math and reading. Education Next, 15(3). Retrieved from http://educationnext.org.
Peterson, P. E., Rabe, B., & Wong, K. (1986). When federalism works. Washington, DC: Brookings Institution.
Polikoff, M. S., & Porter, A. C. (2014). Instructional alignment as a measure of teaching quality. Educational Evaluation and Policy Analysis, 36(4), 399-416. https://doi.org/10.3102/0162373714531851
Porter, A., McMaken, J., Hwang, J., & Yang, R. (2011). Assessing the common core standards opportunities for improving measures of instruction. Educational Researcher, 40(4), 186-188. https://doi.org/10.3102/0013189X11410232
Raudenbush, S. W., & Bryk, A. S. (2002). Hierarchical linear models: Applications and data analysis methods (Vol. 1). Thousand Oaks, CA: SAGE.
Rowan, B., & Miskel, C. G. (1999). Institutional theory and the study of educational organizations. In J. Murphy & K. S. Louis (Eds.), Handbook of research on educational administration, (pp. 359-384). San Francisco, CA: Jossey-Bass.
Schmidt, W. H., & Houang, R. T. (2012). Curricular coherence and the common core state standards for mathematics. Educational Researcher, 41(8), 294-308. https://doi.org/10.3102/0013189X12464517
Schmidt, W. H., Wang, C. H., & McKnight, C.C. (2005). Curriculum Coherence: An Examination of U.S. Mathematics and Science Content Standards from an International Perspective. Journal of Curriculum Studies 37(5), 525-559. https://doi.org/10.1080/0022027042000294682

Is the Common Core Racing America to the Top? 17
Smith, M. S., & O’Day, J. A. (1991). Systemic school reform. In S. H. Fuhrman & B. Malen (Eds.), The politics of curriculum and testing: Politics of Education Association yearbook (pp. 233–267). Bristol, PA: Falmer Press.
Strauss, V. (May 15, 2014). Pushback on standardized testing around the country getting stronger. The Washington Post. Retrieved from https://www.washingtonpost.com.
Welner, K. G. (2005). Can irrational become unconstitutional? NCLB’s 100% presuppositions. Equity & Excellence in Education, 38, 171–179. https://doi.org/10.1080/10665680591002470
Welner, K. G. (2014). The lost opportunity of the Common Core State Standards: Until we focus on closing opportunity gaps, the Common Core will be part of the problem, and its potential benefits will never be realized. Phi Delta Kappan, 95(7), 39-40. https://doi.org/10.1177/003172171409500709
Education Policy Analysis Archives Vol. 25 No. 35 18
Appendix
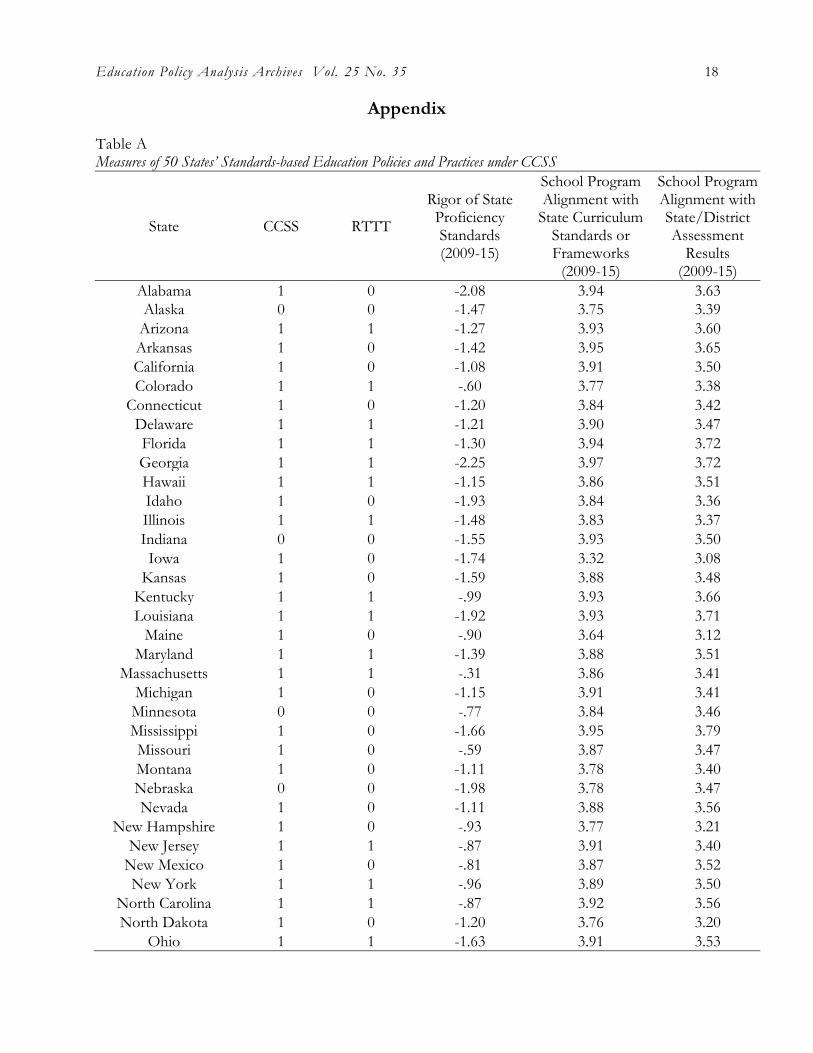
Table AMeasures of 50 States’ Standards-based Education Policies and Practices under CCSS
State CCSS RTTT
Rigor of State Proficiency Standards(2009-15)
School Program Alignment with
State Curriculum Standards or Frameworks
(2009-15)
School Program Alignment with State/District Assessment
Results(2009-15)
Alabama 1 0 -2.08 3.94 3.63Alaska 0 0 -1.47 3.75 3.39
Arizona 1 1 -1.27 3.93 3.60Arkansas 1 0 -1.42 3.95 3.65California 1 0 -1.08 3.91 3.50Colorado 1 1 -.60 3.77 3.38
Connecticut 1 0 -1.20 3.84 3.42Delaware 1 1 -1.21 3.90 3.47Florida 1 1 -1.30 3.94 3.72Georgia 1 1 -2.25 3.97 3.72Hawaii 1 1 -1.15 3.86 3.51Idaho 1 0 -1.93 3.84 3.36Illinois 1 1 -1.48 3.83 3.37Indiana 0 0 -1.55 3.93 3.50Iowa 1 0 -1.74 3.32 3.08
Kansas 1 0 -1.59 3.88 3.48Kentucky 1 1 -.99 3.93 3.66Louisiana 1 1 -1.92 3.93 3.71
Maine 1 0 -.90 3.64 3.12Maryland 1 1 -1.39 3.88 3.51
Massachusetts 1 1 -.31 3.86 3.41Michigan 1 0 -1.15 3.91 3.41Minnesota 0 0 -.77 3.84 3.46Mississippi 1 0 -1.66 3.95 3.79Missouri 1 0 -.59 3.87 3.47Montana 1 0 -1.11 3.78 3.40Nebraska 0 0 -1.98 3.78 3.47Nevada 1 0 -1.11 3.88 3.56
New Hampshire 1 0 -.93 3.77 3.21New Jersey 1 1 -.87 3.91 3.40
New Mexico 1 0 -.81 3.87 3.52New York 1 1 -.96 3.89 3.50
North Carolina 1 1 -.87 3.92 3.56North Dakota 1 0 -1.20 3.76 3.20
Ohio 1 1 -1.63 3.91 3.53

Is the Common Core Racing America to the Top? 19
Oklahoma 0 0 -1.84 3.93 3.67Oregon 1 0 -1.14 3.83 3.23
Pennsylvania 1 1 -1.15 3.87 3.47Rhode Island 1 1 -.80 3.77 3.27
South Carolina 0 0 -1.64 3.97 3.65South Dakota 1 0 -1.31 3.89 3.40
Tennessee 1 1 -1.31 3.96 3.76Texas 0 0 -2.28 3.93 3.68Utah 1 0 -1.45 3.91 3.46
Vermont 1 0 -.78 3.72 3.17Virginia 0 0 -1.87 3.94 3.71
Washington 1 0 -.81 3.79 3.35West Virginia 1 0 -.95 3.93 3.60
Wisconsin 1 0 -.12 3.73 3.15Wyoming 1 0 -1.31 3.76 3.38
Note: For CCSS and RTTT variables, 1= Yes, 0= No.
For the rigor of proficiency standards variable, differences between NAEP-based proficiency rates and state assessment-based proficiency rates were averaged across grades 4 and 8 in reading and math. Logit transformation of the gap measure was used: a positive value of the gap implies a relatively higher state standard in comparison with the NAEP standard, whereas a negative value of the gap implies a relatively lower state standard relative to the NAEP counterpart.
For school program alignment with state curriculum standards or frameworks and school program alignment with state/district assessment results variables, NAEP 2009-15 school administrator survey responses on a 4 point scale (1 = not at all, 2 = some extent, 3 = moderate extent, 4 = large extent) were aggregated to the state level and then averaged across grades 4 and 8 in reading and math.

Education Policy Analysis Archives Vol. 25 No. 35 20
About the Author
Jaekyung LeeUniversity at Buffalo, [email protected] Lee is the Dean and Professor of the Graduate School of Education at the University at Buffalo, SUNY. His research interests include education policy, testing, and comparative education.
Yin WuUniversity at Buffalo, [email protected] Wu is a Ph.D. Candidate in Educational Psychology and Quantitative Methods at theUniversity at Buffalo-SUNY. Her research interests are in the areas of educational equity, higher education learning outcome assessment, and career development of college students.
education policy analysis archivesVolume 25 Number 35 April 10, 2017 ISSN 1068-2341
Readers are free to copy, display, and distribute this article, as long as the work is attributed to the author(s) and Education Policy Analysis Archives, it is distributed for non-commercial purposes only, and no alteration or transformation is made in the work. More details of this Creative Commons license are available at http://creativecommons.org/licenses/by-nc-sa/3.0/. All other uses must be approved by the author(s) or EPAA. EPAA is published by the Mary Lou Fulton Institute and Graduate School of Education at Arizona State University Articles are indexed in CIRC (Clasificación Integrada de Revistas Científicas, Spain), DIALNET (Spain), Directory of Open Access Journals, EBSCO Education Research Complete, ERIC, Education Full Text (H.W. Wilson), QUALIS A2 (Brazil), SCImago Journal Rank; SCOPUS, SOCOLAR (China).
Please send errata notes to Audrey Amrein-Beardsley at [email protected]
Join EPAA’s Facebook community at https://www.facebook.com/EPAAAAPE and Twitter feed @epaa_aape.