education longitudinal study of 2002 (els:2002): a first
TRANSCRIPT

Education Longitudinal Study of 2002 (ELS:2002): A First Look at 2002 High School Sophomores 10 Years LaterFirst Look
NCES 2014-363 U.S . DEPARTMENT OF EDUCATION


Education Longitudinal Study of 2002 (ELS:2002): A First Look at 2002 High School Sophomores 10 Years LaterFirst Look
JANUARY 2014
Erich LauffSteven J. IngelsRTI International
Elise M. ChristopherProject OfficerNational Center for Education Statistics
NCES 2014-363U.S. DEPARTMENT OF EDUCATION
U.S. Department of EducationArne DuncanSecretary
Institute of Education SciencesJohn Q. EastonDirector
National Center for Education StatisticsJack BuckleyCommissioner
Sample Surveys DivisionChris Chapman Acting Associate Commissioner
The National Center for Education Statistics (NCES) is the primary federal entity for collecting, analyzing, and reporting data related to education in the United States and other nations. It fulfills a congressional mandate to collect, collate, analyze, and report full and complete statistics on the condition of education in the United States; conduct and publish reports and specialized analyses of the meaning and significance of such statistics; assist state and local education agencies in improving their statistical systems; and review and report on education activities in foreign countries.
NCES activities are designed to address high-priority education data needs; provide consistent, reliable, complete, and accurate indicators of education status and trends; and report timely, useful, and high-quality data to the U.S. Department of Education, the Congress, the states, and other education policymakers, practitioners, data users, and the general public. Unless specifically noted, all information contained herein is in the public domain.
We strive to make our products available in a variety of formats and in language that is appropriate to a variety of audiences. You, as our customer, are the best judge of our success in communicating information effectively. If you have any comments or suggestions about this or any other NCES product or report, we would like to hear from you. Please direct your comments to
NCES, IES, U.S. Department of Education1990 K Street NWWashington, DC 20006-5651
January 2014
The NCES Home Page address is http://nces.ed.gov.
The NCES Publications and Products address is http://nces.ed.gov/pubsearch.
This publication is only available online. To download, view, and print this report as a PDF file, go to the NCES Publications and Products address shown above.
This report was prepared for the National Center for Education Statistics under Contract No. ED-04-CO-00036/0004 with RTI International. Mention of trade names, commercial products, or organizations does not imply endorsement by the U.S. Government.
Suggested CitationLauff, E., and Ingels, S.J. (2013). Education Longitudinal Study of 2002 (ELS:2002): A First Look at 2002 High School Sophomores 10 Years Later (NCES 2014-363). U.S. Department of Education. Washington, DC: National Center for Education Statistics. Retrieved [date] from http://nces.ed.gov/pubsearch.
Content ContactElise M. Christopher(202) [email protected]

iii
Foreword This First Look presents findings from the third, and final, follow-up survey of the Education Longitudinal Study of 2002 (ELS:2002). ELS:2002 provides a wealth of information from multiple sources (tested achievement, questionnaire, and administrative records) about the factors and circumstances related to the performance and social development of the American high school student over time. This report draws on ELS:2002 data collected in 2012 to describe the outcomes of the cohort at about age 26, approximately 10 years after they were high school sophomores. These outcomes reflect several key life course markers of the transition into early adulthood, including high school and postsecondary educational attainment, entering the labor market and starting a career, marriage and family formation, student debt and aid, and the perceived impact of the college experience. The First Look tables provide national estimates for these phenomena, explored in terms of differences by sophomores’ demographic, social, and academic characteristics. We hope that the information provided in this brief overview will be useful to a wide range of interested readers, including policymakers and educators. We further hope that the results reported here will encourage other researchers to use the ELS:2002 data.
Jack Buckley Chris Chapman Commissioner Acting Associate Commissioner National Center for Education Statistics National Center for Education Statistics

iv
Acknowledgments The authors wish to thank the many individuals who helped plan, design, and conduct the various rounds of the ELS:2002. We are particularly indebted to the ELS:2002 Technical Review Panel, which met prior to each round to review plans for the study, help refine them, and provide important suggestions for instrument development.
We would be remiss if we did not acknowledge and thank the many schools and individuals who graciously participated in ELS:2002, especially those who were interviewed multiple times as they progressed from high school to adulthood. This study would not have been possible without their invaluable contributions.

v
Contents Foreword iii ......................................................................................................................................................
Acknowledgments iv ........................................................................................................................................
List of Tables vi ...............................................................................................................................................
List of Figures vii .............................................................................................................................................
...................................................................................................................................................
.............................................................................................................................. ..........................................................................................................................................
..........................................................................................................................................
.....................................................................................................................................................
..........................................................................................................................................
.....................................................................................
..........................................................................................................
Introduction 1
Focus of This Report 1 Study Design 1
Selected Findings 3
References 5
Figure and Tables 6
Appendix A: Technical Notes and Methodology A-1
Appendix B: Standard Error Tables B-1

vi
List of Tables Table Page 1. Educational attainment of spring 2002 high school sophomores, by select student
background characteristics: 2012 8 ........................................................................................................
...................................................................................................................................................
.......................................................
.......................................................................................................
......................................................................................
....................................................................................
............................................................................................................
............................................................................................................
...........................................................................................................................................
....................................................................
2. Spring 2002 high school sophomores with subsequent postsecondary enrollment: Educational attainment by select characteristics of their initial postsecondary enrollment: 2012 10
3. Spring 2002 high school sophomores with subsequent postsecondary enrollment: Student loan and grant types/amounts, by educational attainment: 2012 11
4. Spring 2002 high school sophomores with subsequent postsecondary enrollment: Subjective ratings of the importance of college in preparing them for various aspects of life, by educational attainment: 2012 13
5. Spring 2002 high school sophomores: Current employment status and select financial indicators, by educational attainment: 2012 14
6. Spring 2002 high school sophomores currently working for pay: Select characteristics of current job, by educational attainment: 2012 16
7. Spring 2002 high school sophomores currently working for pay: Current job type, by educational attainment: 2012 18
8. Spring 2002 high school sophomores: Adult roles and current living arrangements, by educational attainment: 2012 19
Appendix A: Technical Notes and Methodology
A-1. Summary of ELS:2002 base-year to third follow-up school and student response rates: 2002–13 A-5
A-2. Summary statistics for unit nonresponse bias analyses before and after weight adjustment for nonresponse, by ELS:2002 analytic weight: 2012 A-6
Appendix B: Standard Error Tables
B-1. Standard errors for educational attainment of spring 2002 high school sophomores, by select student background characteristics: 2012 B-2.............................................................................
.............................................................................................................................
........................
.............................................................................
...........................................................
....................................................
B-2. Spring 2002 high school sophomores with subsequent postsecondary enrollment: Standard errors for educational attainment by select characteristics of their initial postsecondary enrollment: 2012 B-4
B-3. Spring 2002 high school sophomores with subsequent postsecondary enrollment: Standard errors for student loan and grant types/amounts, by educational attainment: 2012 B-5
B-4. Spring 2002 high school sophomores with subsequent postsecondary enrollment: Standard errors for subjective ratings of the importance of college in preparing them for various aspects of life, by educational attainment: 2012 B-7
B-5. Spring 2002 high school sophomores: Standard errors for current employment status and select financial indicators, by educational attainment: 2012 B-8
B-6. Spring 2002 high school sophomores currently working for pay: Standard errors for select characteristics of current job, by educational attainment: 2012 B-10

vii
B-7. Spring 2002 high school sophomores currently working for pay: Standard errors for current job type, by educational attainment: 2012 B-12....................................................................................
............................................................................
.....................................................
B-8. Spring 2002 high school sophomores: Standard errors for adult roles and current living arrangements, by educational attainment: 2012 B-13
B-9. Standard errors for current employment and enrollment status of spring 2002 high school sophomores, by experience in postsecondary education: 2012 B-15
List of Figures Figure Page 1. Current employment and enrollment status of spring 2002 high school sophomores, by
experience in postsecondary education: 2012 7 .....................................................................................

1
Introduction
Focus of This Report The Education Longitudinal Study of 2002 (ELS:2002) tracks the educational and developmental experiences of a nationally representative sample of high school sophomores in the United States.1 This First Look report provides a descriptive portrait of these 2002 tenth-graders a decade later, when most were about 26 years old and had been out of high school for 8 years. In so doing, this report draws heavily on information collected during the 2012 third follow-up data collection.2 By this time, many members of the cohort had already completed postsecondary education, started or even changed careers, and started to form families.
The goal of this First Look report is to present selected estimates that highlight the central issues addressed in the study. Given that the third follow-up is the final round of ELS:2002, this First Look focuses on the selected outcomes associated with young adulthood: current work and education activities, postsecondary enrollment and educational attainment, labor market experiences, family formation (marital and parental status), and current living arrangements. This report examines outcomes not only for those who pursued postsecondary education, but also for those who did not complete high school, or otherwise did not continue their education beyond high school.
Because this report is descriptive in nature, readers are cautioned not to draw causal inferences based on the bivariate results presented in it. It is important to note that many of the variables examined in this report may be related to one another, and complex interactions and relationships among the variables have not been explored. The variables presented here are just a small subset of those that can be examined with the ELS:2002 data; they were selected to demonstrate the range of information available from the study and are not designed to emphasize any particular issue. The release of this report is intended to encourage more in-depth analysis of the ELS:2002 data using more sophisticated statistical methods.
Comparisons made in the text were tested for statistical significance to ensure that the differences were larger than might be expected as a result of sampling variation. All differences reported are significant at the p < .05 level. There were no adjustments for multiple comparisons. Given the short format of this release report, the findings presented in Selected Findings do not include all statistically significant findings from the tables.
Section A.11 of this report includes information about the specific variables used in each table and figure. Further information about the ELS:2002 dataset and the methodologies employed in the collection and processing of those data can be found in the technical appendix to this report (appendix A) and, with greater detail, in the ELS:2002 Base-Year to Third Follow-Up Data File Documentation (NCES 2014-364), available from the NCES website located at http://nces.ed.gov/pubsearch/getpubcats.asp?sid=107. Also, the ELS:2002 Field Test Report (NCES 2012-03) documents the development and evaluation of the survey items used in the 2012 third follow-up full-scale study.
Study Design In the high school years, ELS:2002 was an integrated multilevel survey involving multiple respondent populations. Base-year surveys were administered in 2002, including separate questionnaires for students 1 Although ELS:2002 data support two analysis cohorts (2002 high school sophomores and 2004 high school seniors), the focus of this report is the 2002 sophomore cohort; more specifically, this report focuses on the 13,133 members of the ELS:2002 sophomore cohort who participated in the third follow-up during 2012–13. 2 The ELS:2002 third follow-up data collection began in July 2012 and continued until early February 2013. For brevity, this report refers to students’ current status “as of 2012,” although some students were interviewed in 2013.
2
and their parents, teachers, school administrators, and librarians. The base-year data collection also included student assessments in math and reading, as well as a facilities checklist. The first follow-up was conducted in 2004, when base-year students were surveyed regardless of whether they were still in their base-year school, had transferred to a new school, or were out of school. School-based data collections concluded in 2005, when schools were asked to provide high school transcripts for each sample member, regardless of the sample member’s high school completion status.
In addition to the aforementioned high school survey components, follow-up surveys were also administered during the sample members’ postsecondary years: the second follow-up was conducted in 2006 (approximately 2 years after the sample’s modal high school graduation date), and the third follow-up was conducted in 2012 (when the majority of the sample was approximately 26 years old). Additional information about cohort members was also collected from extant data sources such as the American Council on Education (General Educational Development test data), the U.S. Department of Education Central Processing System (financial aid data), and SAT/ACT (postsecondary entrance exam scores). Finally, postsecondary transcripts will be collected during 2013–14, and the resulting data will be made available subsequent to the third follow-up data release.

3
Selected Findings •
•
•
•
•
•
•
•
•
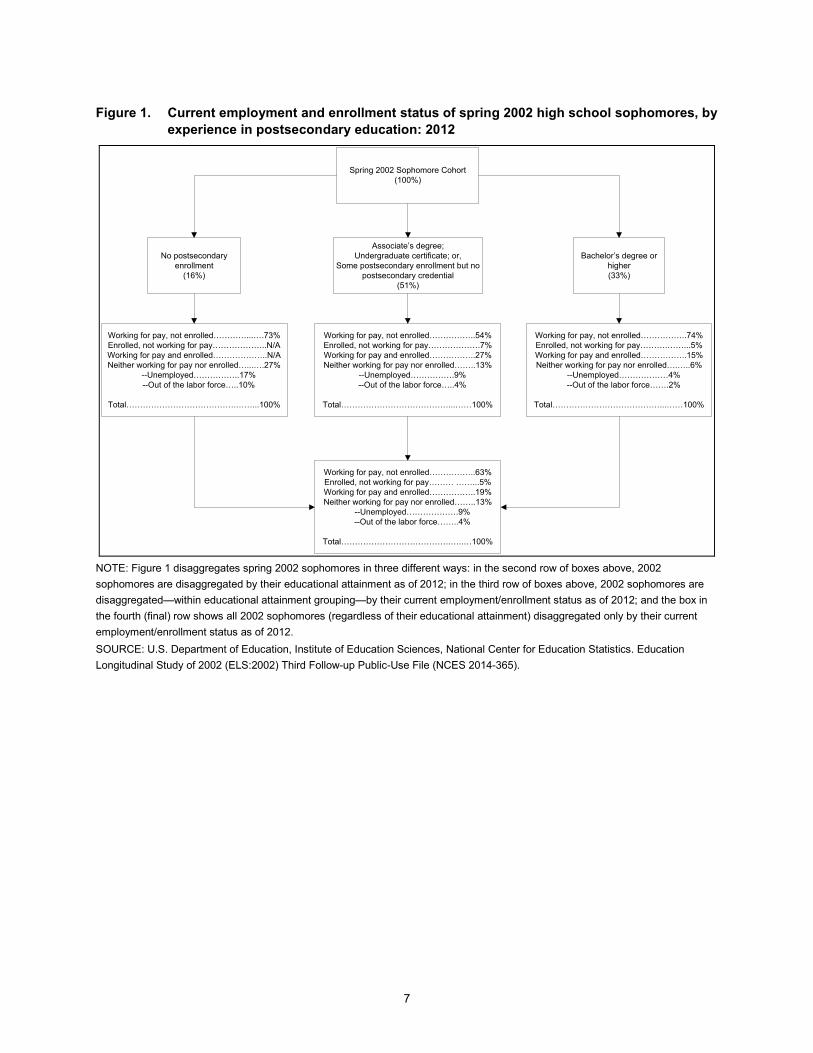
Approximately 10 years after their 10th-grade year, 2002 high school sophomores reported their current activities in terms of paid employment and postsecondary coursetaking as follows: 19 percent reported they were both working for pay and taking postsecondary courses; 63 percent reported they were working for pay only; 5 percent reported they were taking postsecondary courses only; and 13 percent reported they were neither working for pay nor taking postsecondary courses (figure 1).
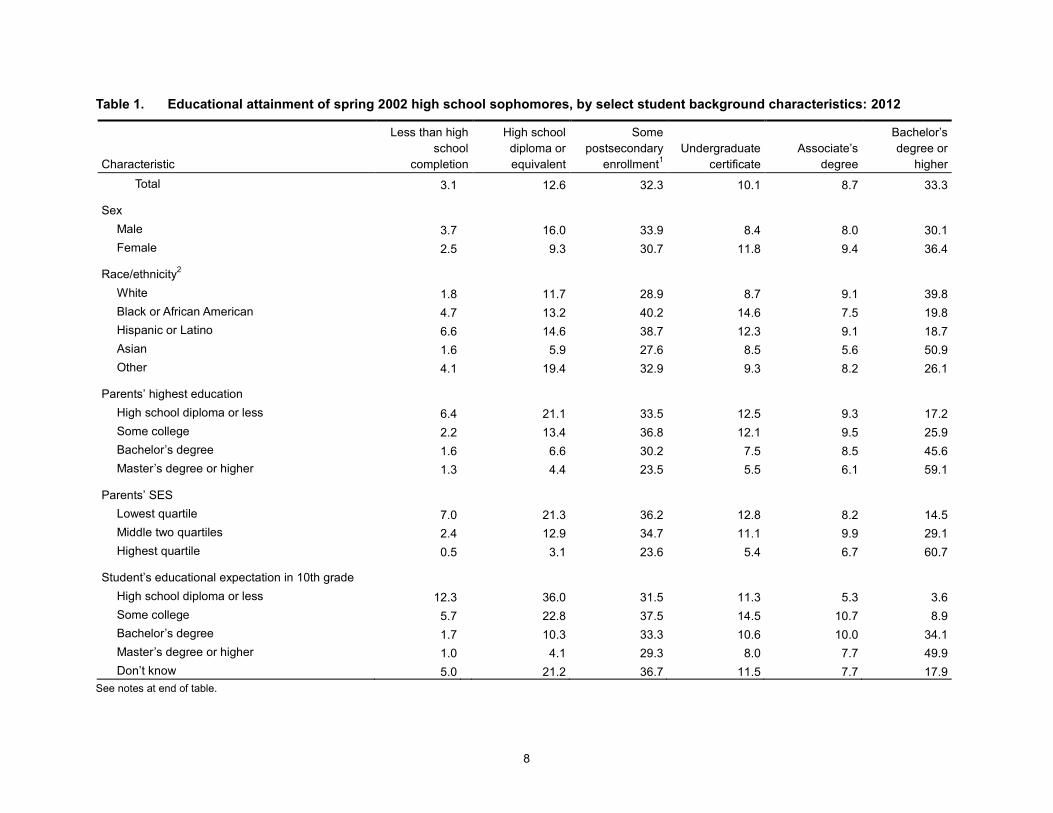
The highest levels of education completed by 2002 high school sophomores as of 2012 were as follows: bachelor’s degree or higher (33 percent); associate’s degree (9 percent); undergraduate certificate (10 percent); postsecondary attendance but no postsecondary credential (32 percent); high school diploma or equivalent (13 percent); and less than high school completion (3 percent) (table 1).
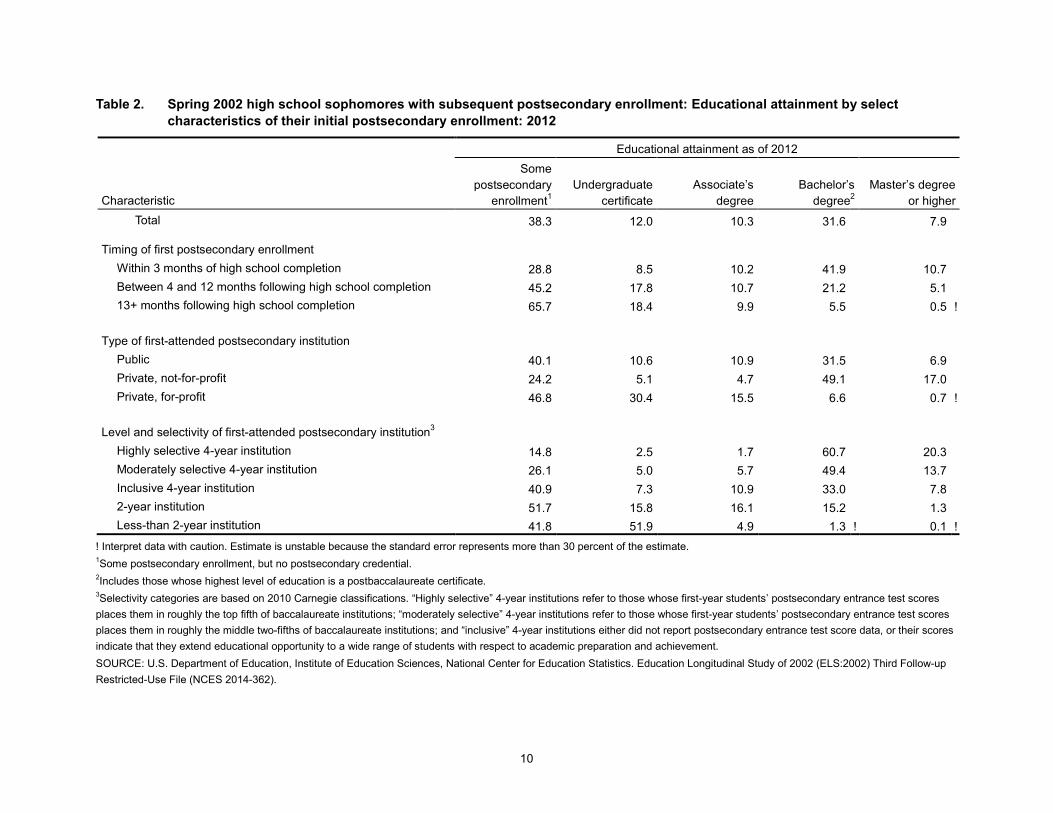
Among those who began their postsecondary education within 3 months of high school completion, 42 percent had earned a bachelor’s degree and another 11 percent had earned a master’s degree (or higher) by 2012; among those who began their postsecondary education 13 or more months following high school completion, 6 percent had earned a bachelor’s degree and another 1 percent had earned a master’s degree (or higher) by 2012 (table 2).
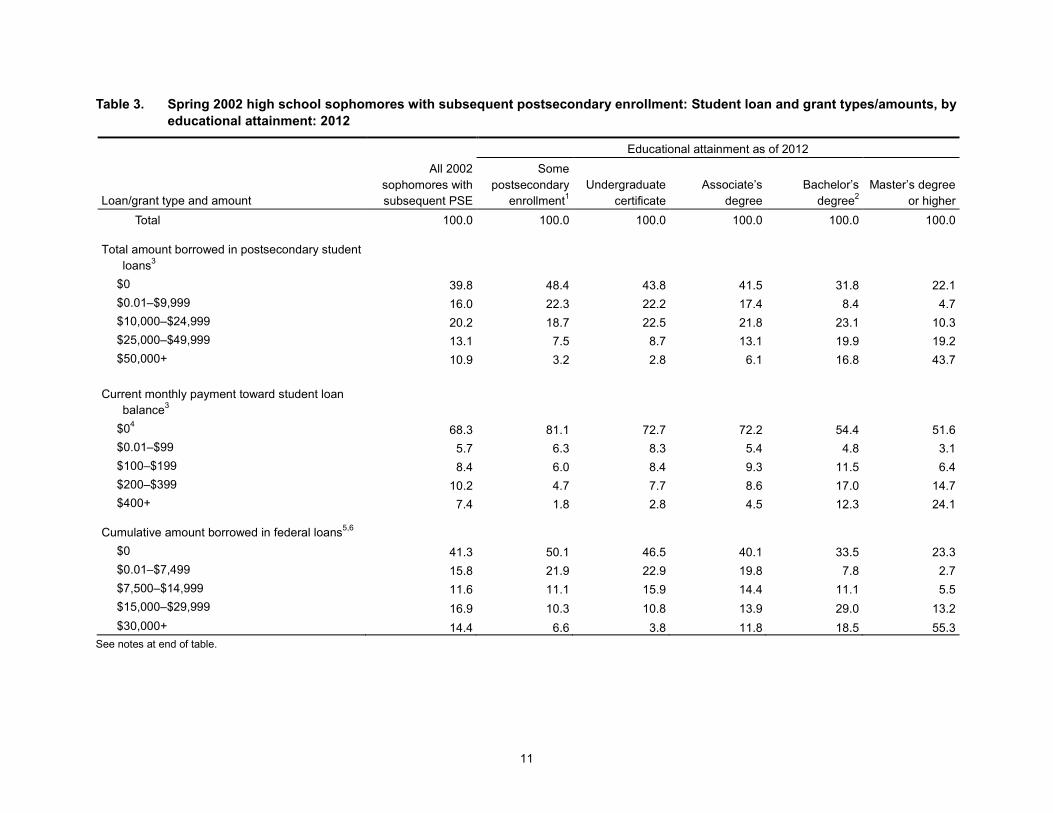
High school sophomores in 2002 with subsequent postsecondary enrollment reported the following student loan amounts as of 2012: 40 percent reported no borrowing; 16 percent reported borrowing more than $0 but less than $10,000 in student loans; 20 percent reported borrowing at least $10,000 but less than $25,000 in student loans; 13 percent reported borrowing at least $25,000 but less than $50,000 in student loans; and 11 percent reported borrowing $50,000 or more in student loans (table 3).
Twenty-eight percent of 2002 high school sophomores with subsequent postsecondary enrollment rated that attendance as very important in preparing them for civic participation, while 63 percent rated their postsecondary attendance as very important in preparing them for work and career (table 4).
A smaller percentage of those who had completed a bachelor’s degree or higher reported having lost a job since January 2006 (19 percent) than did those with a high school credential only (40 percent), or those who had not completed high school (45 percent) (table 5).
Seventy-six percent of 2002 high school sophomores who reported they were working for an employer as of 2012 (as opposed to being self-employed or not employed as of 2012) were working for an employer who offered medical insurance (table 6).
Among 2002 high school sophomores who were employed as of 2012 but had not yet finished high school, the most frequently reported current (2012) occupations were in the category of “Food preparation and serving occupations” (reported by 20 percent of this subgroup); meanwhile, among 2002 high school sophomores who were employed as of 2012 but whose highest level of education was an associate’s degree, the most frequently reported current (2012) occupations were in the category of “Office and administrative support occupations” (reported by 18 percent of this subgroup) (table 7).3
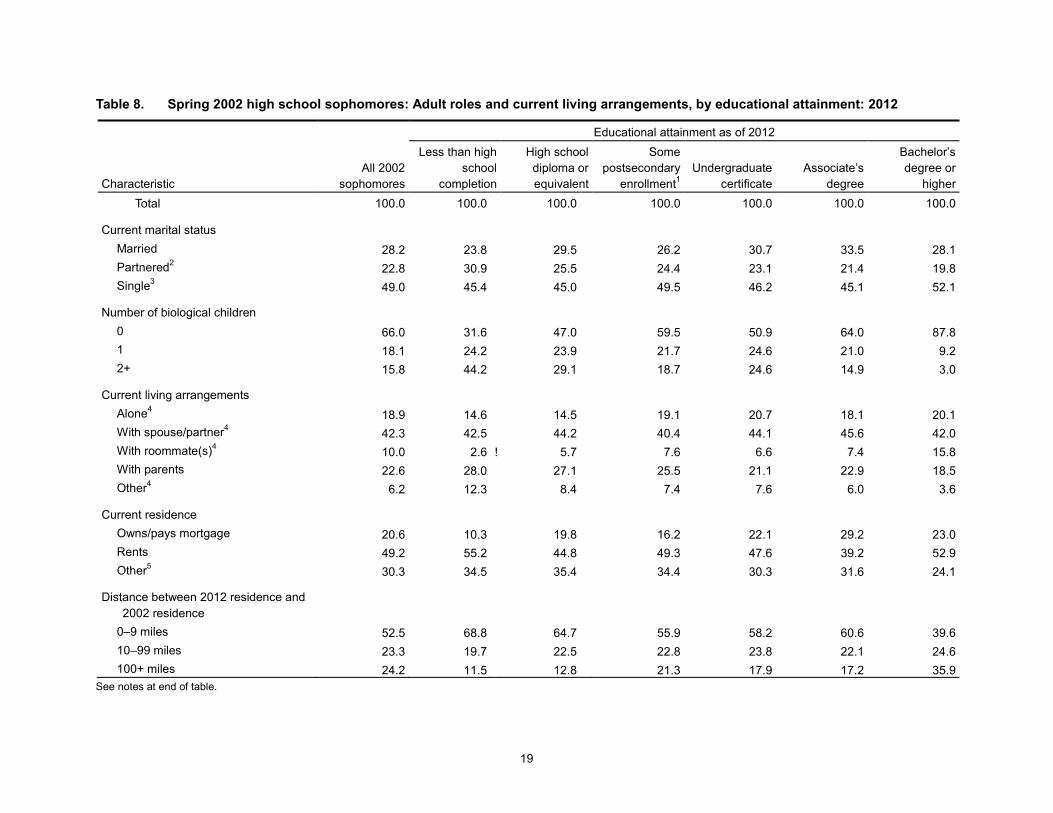
Living with a spouse or partner was the most commonly reported living arrangement among 2002 high school sophomores as of 2012; this pattern was true across all levels of educational
3 “Food preparation and serving occupations” includes occupations such as fast food workers, cooks, waiters, and waitresses; “Office and administrative support occupations” includes occupations such as customer service representatives, marketing clerks, secretaries, and administrative assistants.

4
attainment. Overall percentages for all 2002 sophomores as of 2012 were as follows: 19 percent were living alone, 42 percent were living with a spouse or partner, 10 percent were living with roommate(s), 23 percent were living with their parents, and 6 percent had some other arrangement (table 8).

5
References Bozick, R., Lytle, T., Siegel, P.H., Ingels, S.J., Rogers, J.E., Lauff, E., and Planty, M. (2006). Education
Longitudinal Study of 2002: First Follow-up Transcript Component Data File Documentation (NCES 2006-338). National Center for Education Statistics, Institute of Education Sciences, U.S. Department of Education. Washington, DC.
Ingels, S.J., Pratt, D.J., Alexander, C.P., Jewell, D.M., Lauff, E., Mattox, T.L., and Wilson, D. (2013). Education Longitudinal Study of 2002 (ELS:2002) Base-Year to Third Follow-up Data File Documentation (NCES 2014-364). National Center for Education Statistics, Institute of Education Sciences, U.S. Department of Education. Washington, DC.
Ingels, S.J., Pratt, D.J., Jewell, D.M., Mattox, T., Dalton, B., Rosen, J., Lauff, E., and Hill, J. (2012). Education Longitudinal Study of 2002 (ELS:2002/12) Third Follow-up Field Test Report (NCES 2012-03). National Center for Education Statistics, Institute of Education Sciences, U.S. Department of Education. Washington, DC.
Ingels, S.J., Pratt, D.J., Rogers, J.E., Siegel, P.H., and Stutts, E.S. (2004). Education Longitudinal Study of 2002: Base-Year Data File User’s Manual (NCES 2004-405). National Center for Education Statistics, Institute of Education Sciences, U.S. Department of Education. Washington, DC.
Ingels, S.J., Pratt, D.J., Rogers, J.E., Siegel, P.H., and Stutts, E.S. (2005). Education Longitudinal Study of 2002: Base-Year to First Follow-up Data File Documentation (NCES 2006-344). National Center for Education Statistics, Institute of Education Sciences, U.S. Department of Education. Washington, DC.
Ingels, S.J., Pratt, D.J., Wilson, D., Burns, L.J., Currivan, D., Rogers, J.E., and Hubbard-Bednasz, S. (2007). Education Longitudinal Study of 2002 (ELS:2002) Base-Year to Second Follow-up Data File Documentation (NCES 2008-347). National Center for Education Statistics, Institute of Education Sciences, U.S. Department of Education. Washington, DC.

6
Figure and Tables
7
Figure 1. Current employment and enrollment status of spring 2002 high school sophomores, by experience in postsecondary education: 2012
Spring 2002 Sophomore Cohort(100%)
No postsecondary enrollment
(16%)
Associate’s degree;Undergraduate certificate; or,
Some postsecondary enrollment but no postsecondary credential
(51%)
Bachelor’s degree or higher(33%)
Working for pay, not enrolled……………..54%Enrolled, not working for pay……………….7%Working for pay and enrolled……………..27%Neither working for pay nor enrolled……..13%
--Unemployed…………….9% --Out of the labor force…..4%
Total…………………………………...……100%
Working for pay, not enrolled……………..74%Enrolled, not working for pay……….……...5%Working for pay and enrolled……………..15%Neither working for pay nor enrolled….…..6%
--Unemployed………………4% --Out of the labor force…….2%
Total…………………………………...……100%
Working for pay, not enrolled…………...….73%Enrolled, not working for pay………………..N/AWorking for pay and enrolled………………..N/ANeither working for pay nor enrolled…...….27%
--Unemployed……………..17% --Out of the labor force…..10%
Total………………………………….……...100%
Working for pay, not enrolled……………..63%Enrolled, not working for pay……… ……...5%Working for pay and enrolled……………..19%Neither working for pay nor enrolled……..13%
--Unemployed……………….9% --Out of the labor force……..4%
Total………………………………….…..…100%
NOTE: Figure 1 disaggregates spring 2002 sophomores in three different ways: in the second row of boxes above, 2002 sophomores are disaggregated by their educational attainment as of 2012; in the third row of boxes above, 2002 sophomores are disaggregated—within educational attainment grouping—by their current employment/enrollment status as of 2012; and the box in the fourth (final) row shows all 2002 sophomores (regardless of their educational attainment) disaggregated only by their current employment/enrollment status as of 2012. SOURCE: U.S. Department of Education, Institute of Education Sciences, National Center for Education Statistics. Education Longitudinal Study of 2002 (ELS:2002) Third Follow-up Public-Use File (NCES 2014-365).
8
Table 1. Educational attainment of spring 2002 high school sophomores, by select student background characteristics: 2012
Characteristic
Less than high school
completion
High school diploma or equivalent
Some postsecondary
enrollment1 Undergraduate
certificate Associate’s
degree
Bachelor’s degree or
higher Total 3.1 12.6 32.3 10.1 8.7 33.3
Sex
Male 3.7 16.0 33.9 8.4 8.0 30.1
Female 2.5 9.3 30.7 11.8 9.4 36.4
Race/ethnicity2
White 1.8 11.7 28.9 8.7 9.1 39.8 Black or African American 4.7 13.2 40.2 14.6 7.5 19.8 Hispanic or Latino 6.6 14.6 38.7 12.3 9.1 18.7 Asian 1.6 5.9 27.6 8.5 5.6 50.9 Other 4.1 19.4 32.9 9.3 8.2 26.1
Parents’ highest education
High school diploma or less 6.4 21.1 33.5 12.5 9.3 17.2
Some college 2.2 13.4 36.8 12.1 9.5 25.9 Bachelor’s degree 1.6 6.6 30.2 7.5 8.5 45.6 Master’s degree or higher 1.3 4.4 23.5 5.5 6.1 59.1
Parents’ SES
Lowest quartile 7.0 21.3 36.2 12.8 8.2 14.5
Middle two quartiles 2.4 12.9 34.7 11.1 9.9 29.1 Highest quartile 0.5 3.1 23.6 5.4 6.7 60.7
Student’s educational expectation in 10th grade
High school diploma or less 12.3 36.0 31.5 11.3 5.3 3.6
Some college 5.7 22.8 37.5 14.5 10.7 8.9 Bachelor’s degree 1.7 10.3 33.3 10.6 10.0 34.1 Master’s degree or higher 1.0 4.1 29.3 8.0 7.7 49.9 Don’t know 5.0 21.2 36.7 11.5 7.7 17.9
See notes at end of table.

9
Table 1. Educational attainment of spring 2002 high school sophomores, by select student background characteristics: 2012—Continued
Characteristic
Less than high school
completion
High school diploma or equivalent
Some postsecondary
enrollment1 Undergraduate
certificate Associate’s
degree
Bachelor’s degree or
higher 2002 high school type
Public 3.3 13.4 33.0 10.4 8.8 31.1 Catholic 0.2 ! 1.6 23.7 6.4 6.2 61.9 Other private 0.3 ! 3.9 23.9 6.4 8.5 57.1
Cumulative high school GPA
0.00–1.99 11.3 25.7 41.8 12.5 5.4 3.3
2.00–2.49 2.4 18.3 44.5 12.5 9.9 12.4 2.50–2.99 0.6 11.1 35.8 12.4 12.5 27.6 3.00–3.49 0.1 ! 5.0 25.9 9.0 9.8 50.1 3.50+ 0.1 ! 1.6 13.1 2.9 5.7 76.7
! Interpret data with caution. Estimate is unstable because the standard error represents more than 30 percent of the estimate. 1Some postsecondary enrollment, but no postsecondary credential. 2All race categories exclude Hispanic or Latino origin, unless specified. NOTE: GPA = grade point average. SES = socioeconomic status. SOURCE: U.S. Department of Education, Institute of Education Sciences, National Center for Education Statistics. Education Longitudinal Study of 2002 (ELS:2002) Third Follow-up Restricted-Use File (NCES 2014-362).
10
Table 2. Spring 2002 high school sophomores with subsequent postsecondary enrollment: Educational attainment by select characteristics of their initial postsecondary enrollment: 2012
Educational attainment as of 2012
Characteristic
Some postsecondary
enrollment1 Undergraduate
certificate Associate’s
degree Bachelor’s
degree2 Master’s degree
or higher Total 38.3 12.0 10.3 31.6 7.9
Timing of first postsecondary enrollment
Within 3 months of high school completion 28.8 8.5 10.2 41.9 10.7 Between 4 and 12 months following high school completion 45.2 17.8 10.7 21.2 5.1 13+ months following high school completion 65.7 18.4 9.9 5.5 0.5 !
Type of first-attended postsecondary institution
Public 40.1 10.6 10.9 31.5 6.9 Private, not-for-profit 24.2 5.1 4.7 49.1 17.0 Private, for-profit 46.8 30.4 15.5 6.6 0.7 !
Level and selectivity of first-attended postsecondary institution3
Highly selective 4-year institution 14.8 2.5 1.7 60.7 20.3 Moderately selective 4-year institution 26.1 5.0 5.7 49.4 13.7 Inclusive 4-year institution 40.9 7.3 10.9 33.0 7.8 2-year institution 51.7 15.8 16.1 15.2 1.3 Less-than 2-year institution 41.8 51.9 4.9 1.3 ! 0.1 !
! Interpret data with caution. Estimate is unstable because the standard error represents more than 30 percent of the estimate. 1Some postsecondary enrollment, but no postsecondary credential. 2Includes those whose highest level of education is a postbaccalaureate certificate. 3Selectivity categories are based on 2010 Carnegie classifications. “Highly selective” 4-year institutions refer to those whose first-year students’ postsecondary entrance test scores places them in roughly the top fifth of baccalaureate institutions; “moderately selective” 4-year institutions refer to those whose first-year students’ postsecondary entrance test scores places them in roughly the middle two-fifths of baccalaureate institutions; and “inclusive” 4-year institutions either did not report postsecondary entrance test score data, or their scores indicate that they extend educational opportunity to a wide range of students with respect to academic preparation and achievement. SOURCE: U.S. Department of Education, Institute of Education Sciences, National Center for Education Statistics. Education Longitudinal Study of 2002 (ELS:2002) Third Follow-up Restricted-Use File (NCES 2014-362).
11
Table 3. Spring 2002 high school sophomores with subsequent postsecondary enrollment: Student loan and grant types/amounts, by educational attainment: 2012
Educational attainment as of 2012
Loan/grant type and amount
All 2002 sophomores with subsequent PSE
Some postsecondary
enrollment1 Undergraduate
certificate Associate’s
degree Bachelor’s
degree2 Master’s degree
or higher Total 100.0 100.0 100.0 100.0 100.0 100.0
Total amount borrowed in postsecondary student
loans3 $0 39.8 48.4 43.8 41.5 31.8 22.1
$0.01–$9,999 16.0 22.3 22.2 17.4 8.4 4.7 $10,000–$24,999 20.2 18.7 22.5 21.8 23.1 10.3 $25,000–$49,999 13.1 7.5 8.7 13.1 19.9 19.2 $50,000+ 10.9 3.2 2.8 6.1 16.8 43.7
Current monthly payment toward student loan
balance3
$04 68.3 81.1 72.7 72.2 54.4 51.6 $0.01–$99 5.7 6.3 8.3 5.4 4.8 3.1 $100–$199 8.4 6.0 8.4 9.3 11.5 6.4 $200–$399 10.2 4.7 7.7 8.6 17.0 14.7 $400+ 7.4 1.8 2.8 4.5 12.3 24.1
Cumulative amount borrowed in federal loans5,6 $0 41.3 50.1 46.5 40.1 33.5 23.3
$0.01–$7,499 15.8 21.9 22.9 19.8 7.8 2.7 $7,500–$14,999 11.6 11.1 15.9 14.4 11.1 5.5 $15,000–$29,999 16.9 10.3 10.8 13.9 29.0 13.2 $30,000+ 14.4 6.6 3.8 11.8 18.5 55.3
See notes at end of table.

12
Table 3. Spring 2002 high school sophomores with subsequent postsecondary enrollment: Student loan and grant types/amounts, by educational attainment: 2012—Continued
Educational attainment as of 2012
Loan/grant type and amount
All 2002 sophomores with subsequent PSE
Some postsecondary
enrollment1 Undergraduate
certificate Associate’s
degree Bachelor’s
degree2 Master’s degree
or higher Cumulative amount owed in federal loans5,6
$0 49.4 57.6 55.6 48.0 42.0 31.0 $0.01–$7,499 13.1 16.1 17.3 16.9 9.1 3.3 $7,500–$14,999 11.6 10.0 13.5 10.9 14.5 5.7 $15,000–$29,999 12.0 9.3 9.3 11.8 16.5 10.9 $30,000+ 14.0 7.0 4.3 12.4 18.0 49.0
Cumulative amount received in Pell grants5 $0 51.7 45.6 45.9 42.5 59.2 72.1
$0.01–$2,999 12.5 16.4 14.7 11.7 8.5 7.3 $3,000–$5,999 11.1 14.5 16.3 9.9 6.5 6.1 $6,000–$11,999 12.5 13.9 14.2 16.9 10.4 6.0 $12,000+ 12.3 9.6 8.9 19.0 15.5 8.6
1Some postsecondary enrollment, but no postsecondary credential. 2Includes those whose highest level of education is a postbaccalaureate certificate. 3As reported by the sample member. 4Includes those who (1) did not take out any student loans, (2) had already paid off their student loan(s), and (3) had taken out a student loan but were not making monthly payments on said loan(s). 5As indicated by the National Student Loan Data System. 6“Cumulative amount borrowed” refers to original loan amounts, while “cumulative amount owed” refers to total amount owed, both principal and interest, on any outstanding federal loans. NOTE: Columns sum to 100 within each subgrouping. PSE = postsecondary enrollment. SOURCE: U.S. Department of Education, Institute of Education Sciences, National Center for Education Statistics. Education Longitudinal Study of 2002 (ELS:2002) Third Follow-up Public-Use File (NCES 2014-365).

13
Table 4. Spring 2002 high school sophomores with subsequent postsecondary enrollment: Subjective ratings of the importance of college in preparing them for various aspects of life, by educational attainment: 2012
Educational attainment as of 2012
Area of preparation All 2002 sophomores with subsequent PSE
Some postsecondary
enrollment1 Undergraduate
certificate Associate’s
degree Bachelor’s
degree2 Master’s degree
or higher Total 100.0 100.0 100.0 100.0 100.0 100.0
Work and career
Very important 62.7 53.6 74.8 67.4 66.9 63.9 Somewhat important 27.9 29.6 18.7 26.7 28.6 32.1 Not at all important 9.4 16.9 6.5 6.0 4.6 4.0
Further education Very important 62.6 57.0 65.0 64.9 62.9 80.2
Somewhat important 27.9 28.5 26.3 27.6 30.4 18.0 Not at all important 9.5 14.5 8.7 7.5 6.7 1.8
Establishing financial security Very important 57.1 55.7 71.6 60.8 55.3 46.2
Somewhat important 26.7 22.0 18.9 25.4 32.1 38.2 Not at all important 16.2 22.2 9.4 13.8 12.6 15.6
Civic participation Very important 28.1 27.4 33.7 28.0 27.5 26.2
Somewhat important 41.5 37.8 40.0 40.8 44.9 47.0 Not at all important 30.4 34.8 26.2 31.2 27.7 26.8
1Some postsecondary enrollment, but no postsecondary credential. 2Includes those whose highest level of education is a postbaccalaureate certificate. NOTE: Columns sum to 100 within each subgrouping. PSE = postsecondary enrollment. SOURCE: U.S. Department of Education, Institute of Education Sciences, National Center for Education Statistics. Education Longitudinal Study of 2002 (ELS:2002) Third Follow-up Public-Use File (NCES 2014-365).

14
Table 5. Spring 2002 high school sophomores: Current employment status and select financial indicators, by educational attainment: 2012
Educational attainment as of 2012
Financial indicator All 2002
sophomores
Less than high school completion
High school diploma or equivalent
Some postsecondary
enrollment1 Undergraduate
certificate Associate’s
degree
Bachelor’s degree or
higher Total 100.0 100.0 100.0 100.0 100.0 100.0 100.0
Current employment status
Unemployed 11.0 25.9 15.0 14.1 11.8 9.6 5.2 Out-of-the-labor force 6.9 10.8 9.3 7.1 7.0 5.0 5.8 Working 0–34 hours/week 13.0 12.2 13.4 14.8 13.1 14.5 10.9 Working 35+ hours/week 69.1 51.1 62.3 63.9 68.1 70.9 78.1
2011 income from employment
$0–$1,999 14.7 34.2 23.2 17.6 12.7 12.2 8.2 $2,000–$14,999 19.3 22.9 19.3 22.9 21.9 19.4 14.8 $15,000–$24,999 19.8 19.8 20.1 21.5 24.5 20.7 16.3 $25,000–$39,999 25.0 16.2 23.6 23.7 24.3 26.7 27.5 $40,000+ 21.2 6.9 13.8 14.4 16.6 21.0 33.3
2011 income from sources other than
employment2 $0 70.3 68.8 74.7 70.1 72.2 74.8 67.6
$1–$999 5.8 7.2 5.7 6.9 5.7 4.9 5.1 $1,000–$2,999 8.1 10.8 8.8 8.2 6.4 6.8 8.3 $3,000+ 15.8 13.3 10.8 14.8 15.8 13.5 19.0
Received public assistance during 20112,3
Yes 18.6 47.2 32.4 24.8 26.2 16.9 4.6 No 81.4 52.8 67.6 75.2 73.8 83.1 95.4
Months unemployed since January 2009
0 60.0 47.4 55.5 55.7 59.3 65.4 65.7 1–5 17.1 16.4 16.4 16.2 16.7 14.4 19.2 6–11 10.4 13.1 11.0 12.0 11.1 8.9 8.6 12+ 12.5 23.1 17.1 16.1 12.9 11.4 6.4
See notes at end of table.

15
Table 5. Spring 2002 high school sophomores: Current employment status and select financial indicators, by educational attainment: 2012—Continued
Educational attainment as of 2012
Financial indicator All 2002
sophomores
Less than high school completion
High school diploma or equivalent
Some postsecondary
enrollment1 Undergraduate
certificate Associate’s
degree
Bachelor’s degree or
higher Lost a job since January 2006
Yes 31.9 45.2 40.4 40.8 37.1 28.8 19.3 No 68.1 54.8 59.6 59.2 62.9 71.2 80.7
Total debt2 $0 21.1 34.2 32.1 20.5 17.8 16.3 18.7
$1–$9,999 23.4 39.9 34.1 29.2 26.6 21.0 12.1 $10,000–$29,999 26.5 19.4 22.9 28.4 32.7 32.3 23.2 $30,000+ 29.0 6.5 11.0 21.9 23.0 30.4 45.9
Rating of financial stress4
Not at all stressful5 14.9 17.4 17.1 12.6 13.5 12.9 16.8 Somewhat stressful6 64.0 50.6 63.2 61.9 60.3 65.3 67.9 Extremely stressful7 21.1 32.0 19.7 25.5 26.1 21.8 15.3
1Some postsecondary enrollment, but no postsecondary credential. 2Includes sample member as well as sample member’s spouse (if married) or partner (if living with significant other in a marriage-like relationship). 3“Public assistance” includes Supplemental Security Income (SSI), SNAP (the Food Stamp Program), TANF (the Temporary Assistance for Needy Families Program), the Free and Reduced Price School Lunch Program, or WIC (the Special Supplemental Nutrition Program for Women, Infants, and Children). 4Respondents were asked “Many young adults experience financial problems. On a scale of 1 to 5, where 1 means ‘Not at all stressful’ and 5 means ‘Extremely stressful,’ how much stress have you felt in meeting your financial obligations during the past year?” 5Responses of “1” on the above scale. 6Responses of “2,” “3,” or “4” on the above scale. 7Responses of “5” on the above scale. NOTE: Columns sum to 100 within each subgrouping. SOURCE: U.S. Department of Education, Institute of Education Sciences, National Center for Education Statistics. Education Longitudinal Study of 2002 (ELS:2002) Third Follow-up Public-Use File (NCES 2014-365).

16
Table 6. Spring 2002 high school sophomores currently working for pay: Select characteristics of current job, by educational attainment: 2012
All currently working 2002 sophomores
Educational attainment as of 2012
Characteristic
Less than high school completion
High school diploma or equivalent
Some postsecondary
enrollment1 Undergraduate
certificate Associate’s
degree
Bachelor’s degree or
higher Total 100.0 100.0 100.0 100.0 100.0 100.0 100.0
Earnings at current job2
$0–$7.24 per hour 3.4 8.1 ! 3.4 5.1 2.7 2.8 2.0 $7.25–$9.99 per hour 15.3 34.3 23.4 21.0 19.5 12.1 6.4 $10.00–$14.99 per hour 32.9 36.4 39.3 38.9 38.7 37.3 23.1 $15.00–$19.99 per hour 21.7 15.0 19.8 19.4 19.2 22.4 25.1 $20.00+ per hour 26.7 6.2 ! 14.0 15.6 20.0 25.3 43.4
Current employer offers medical insurance3
Yes 76.1 44.7 69.9 70.3 76.2 78.2 83.4
No 23.9 55.3 30.1 29.7 23.8 21.8 16.6
Relationship between current job and career goals
Current job fulfills career goals 10.5 6.8 ! 9.6 6.3 13.7 11.9 13.2 Current job is a step on path toward career
goals 56.7 29.6 49.4 48.9 57.7 56.6 66.2 Neither 32.8 63.6 41.0 44.9 28.6 31.5 20.6
Satisfaction with current job4
Highest quartile 24.6 26.5 23.6 22.0 28.0 25.3 25.9
Middle two quartiles 50.3 54.9 53.6 49.3 50.8 48.8 50.1 Lowest quartile 25.1 18.6 22.8 28.7 21.2 25.9 24.0
Persistence intentions at current job5
Highest quartile 25.3 26.1 28.2 22.7 27.2 26.4 25.8
Middle two quartiles 50.6 59.1 55.5 51.8 51.0 50.2 47.7 Lowest quartile 24.2 14.8 16.3 25.6 21.8 23.4 26.6
See notes at end of table.

17
Table 6. Spring 2002 high school sophomores currently working for pay: Select characteristics of current job, by educational attainment: 2012—Continued
All currently working 2002 sophomores
Educational attainment as of 2012
Characteristic
Less than high school completion
High school diploma or equivalent
Some postsecondary
enrollment1 Undergraduate
certificate Associate’s
degree
Bachelor’s degree or
higher Rating of work support at current job6
Highest quartile 30.8 23.2 25.9 27.1 30.8 28.7 36.2 Middle two quartiles 49.1 51.8 53.0 48.0 48.8 50.8 48.2 Lowest quartile 20.1 25.1 21.2 24.9 20.5 20.4 15.5
! Interpret data with caution. Estimate is unstable because the standard error represents more than 30 percent of the estimate. 1Some postsecondary enrollment, but no postsecondary credential. 2Earnings which were reported in a format other than dollars per hour (e.g., dollars per week) were standardized to dollars per hour; see section A.11 of this report (definitions of analysis variables) for further information on standardization of earnings. 3Excludes those who reported they were self-employed. 4Quartile coding of job satisfaction scale score. See section A.11 of this report (definitions of analysis variables) for further information on the job satisfaction scale. 5Quartile coding of job persistence intentions scale score. See section A.11 of this report (definitions of analysis variables) for further information on the job persistence intentions scale. 6Quartile coding of work support scale score. See section A.11 of this report (definitions of analysis variables) for further information on the work support scale. NOTE: Columns sum to 100 within each subgrouping. SOURCE: U.S. Department of Education, Institute of Education Sciences, National Center for Education Statistics. Education Longitudinal Study of 2002 (ELS:2002) Third Follow-up Restricted-Use File (NCES 2014-362).

18
Table 7. Spring 2002 high school sophomores currently working for pay: Current job type, by educational attainment: 2012
All currently working 2002 sophomores
Educational attainment as of 2012
Current occupation type
Less than high school completion
High school diploma or equivalent
Some postsecondary
enrollment1 Undergraduate
certificate Associate’s
degree
Bachelor’s degree or
higher Total 100.0 100.0 100.0 100.0 100.0 100.0 100.0
Current occupation type2
Arts, design, entertainment, sports, and media occupations 3.3 1.2 ! 1.3 ! 2.3 1.8 2.6 5.4
Business and financial operations occupations 5.5 1.6 ! 1.6 ! 3.8 2.3 2.6 10.1 Computer and mathematical occupations 3.2 # 0.8 ! 2.5 1.5 ! 3.3 5.3 Construction and extraction occupations 3.9 10.4 10.7 4.4 5.5 4.1 0.5 Education, training, and library occupations 6.6 0.3 ! 1.4 ! 3.2 2.6 4.8 13.0 Food preparation and serving related occupations 6.3 19.7 8.2 9.2 4.3 6.2 3.0 Healthcare practitioners and technical occupations 6.6 0.6 ! 0.6 ! 2.2 10.7 13.3 9.9 Healthcare support occupations 3.8 2.4 ! 2.7 3.8 13.6 4.9 1.4 Installation, maintenance, and repair occupations 3.9 6.4 ! 9.6 4.4 6.8 4.6 0.5 Management occupations 9.0 6.0 ! 6.3 9.1 6.5 8.4 10.9 Office and administrative support occupations 13.8 7.5 ! 12.6 16.9 12.9 18.3 11.0 Personal care and service occupations 4.1 5.4 ! 4.6 4.3 8.6 3.9 2.4 Production occupations 5.1 10.7 13.0 6.5 5.6 4.2 1.0 Sales and related occupations 7.9 7.8 9.5 9.8 5.4 7.9 6.3 Transportation and material moving occupations 3.9 10.6 7.4 5.6 4.1 2.5 1.1
All other occupations3 13.2 9.5 9.5 12.1 7.7 8.6 18.3 ! Interpret data with caution. Estimate is unstable because the standard error represents more than 30 percent of the estimate. # Rounds to zero. 1Some postsecondary enrollment, but no postsecondary credential. 2Occupations are categorized based on the 23 job families included in the Occupational Information Network (O*NET) taxonomy. See http://www.onetonline.org/ for further information on the O*NET taxonomy. 3Includes: Architecture and Engineering Occupations; Building and Grounds Cleaning and Maintenance Occupations; Community and Social Services Occupations; Farming, Fishing, and Forestry Occupations; Legal Occupations; Life, Physical, and Social Science Occupations; Military Specific Occupations; and Protective Service Occupations. SOURCE: U.S. Department of Education, Institute of Education Sciences, National Center for Education Statistics. Education Longitudinal Study of 2002 (ELS:2002) Third Follow-up Public-Use File (NCES 2014-365).
19
Table 8. Spring 2002 high school sophomores: Adult roles and current living arrangements, by educational attainment: 2012
Educational attainment as of 2012
Characteristic All 2002
sophomores
Less than high school
completion
High school diploma or equivalent
Some postsecondary
enrollment1 Undergraduate
certificate Associate’s
degree
Bachelor’s degree or
higher Total 100.0 100.0 100.0 100.0 100.0 100.0 100.0
Current marital status
Married 28.2 23.8 29.5 26.2 30.7 33.5 28.1
Partnered2 22.8 30.9 25.5 24.4 23.1 21.4 19.8 Single3 49.0 45.4 45.0 49.5 46.2 45.1 52.1
Number of biological children
0 66.0 31.6 47.0 59.5 50.9 64.0 87.8
1 18.1 24.2 23.9 21.7 24.6 21.0 9.2 2+ 15.8 44.2 29.1 18.7 24.6 14.9 3.0
Current living arrangements
Alone4 18.9 14.6 14.5 19.1 20.7 18.1 20.1
With spouse/partner4 42.3 42.5 44.2 40.4 44.1 45.6 42.0 With roommate(s)4 10.0 2.6 ! 5.7 7.6 6.6 7.4 15.8 With parents 22.6 28.0 27.1 25.5 21.1 22.9 18.5 Other4 6.2 12.3 8.4 7.4 7.6 6.0 3.6
Current residence
Owns/pays mortgage 20.6 10.3 19.8 16.2 22.1 29.2 23.0
Rents 49.2 55.2 44.8 49.3 47.6 39.2 52.9 Other5 30.3 34.5 35.4 34.4 30.3 31.6 24.1
Distance between 2012 residence and 2002 residence
0–9 miles 52.5 68.8 64.7 55.9 58.2 60.6 39.6 10–99 miles 23.3 19.7 22.5 22.8 23.8 22.1 24.6 100+ miles 24.2 11.5 12.8 21.3 17.9 17.2 35.9
See notes at end of table.

20
Table 8. Spring 2002 high school sophomores: Adult roles and current living arrangements, by educational attainment: 2012—Continued
Educational attainment as of 2012
Characteristic All 2002
sophomores
Less than high school
completion
High school diploma or equivalent
Some postsecondary
enrollment1 Undergraduate
certificate Associate’s
degree
Bachelor’s degree or
higher Region of 2012 residence6
Northeast 17.5 13.6 16.2 15.5 14.9 16.9 21.3 Midwest 22.1 19.6 21.7 21.7 22.9 23.8 22.2 South 36.5 36.6 40.3 37.6 38.2 34.5 33.9 West 23.9 30.2 21.8 25.2 24.0 24.8 22.6
SES quartile as of 2012
Lowest quartile 24.8 86.5 63.2 38.8 15.0 2.0 #
Middle two quartiles 50.0 13.3 36.1 58.2 75.0 72.6 37.2 Highest quartile 25.2 0.2 ! 0.7 ! 3.0 10.0 25.4 62.8
! Interpret data with caution. Estimate is unstable because the standard error represents more than 30 percent of the estimate. # Rounds to zero. 1Some postsecondary enrollment, but no postsecondary credential. 2Living with a significant other in a marriage-like relationship. 3Not partnered, and either never married, divorced, separated, or widowed. 4Not with parents. 5Includes living with parents. 6The Northeast region includes CT, MA, ME, NH, NJ, NY, PA, RI, and VT. The Midwest includes IA, IL, IN, KS, MI, MN, MO, ND, NE, OH, SD, and WI. The South includes AL, AR, DC, DE, FL, GA, KY, LA, MD, MS, NC, OK, SC, TN, TX, VA, and WV. The West includes AK, AZ, CA, CO, HI, ID, MT, NM, NV, OR, UT, WA, and WY. NOTE: Columns sum to 100 within each subgrouping. SES = socioeconomic status. SOURCE: U.S. Department of Education, Institute of Education Sciences, National Center for Education Statistics. Education Longitudinal Study of 2002 (ELS:2002) Third Follow-up Public-Use File (NCES 2014-365).

A-1
Appendix A: Technical Notes and Methodology Appendix A provides the information about the following aspects of the Education Longitudinal Study of 2002 (ELS:2002) (and, in particular, the third follow-up of ELS:2002): Design and Purposes of ELS:2002 (section A.1); Instrumentation (section A.2); Sample Design (section A.3); Data Collection Results (section A.4); Weighting (section A.5); Nonresponse Bias Analysis (section A.6); Imputation (section A.7); and Disclosure Risk Analysis and Protections (section A.8). Discussion of the study is then followed by information specific to this report: Statistical Procedures (section A.9), Generation of Standard Errors (section A.10), and Definitions of Analysis Variables (section A.11).
For further information about ELS:2002, see the ELS:2002 Base-Year to Third Follow-up Data File Documentation (NCES 2014-364), or any of the prior-round data file documentations:
•
•
•
•
ELS:2002 Base-Year to Second Follow-up Data File Documentation (NCES 2008-347)
ELS:2002 Base-Year to First Follow-up Data File Documentation (NCES 2006-344)
ELS:2002 First Follow-up Transcript Component Data File Documentation (NCES 2006-338)
ELS:2002 Base-Year Data File User’s Manual (NCES 2004-405)
A.1 Design and Purposes of ELS:2002 ELS:2002 is the fourth in a series of secondary school longitudinal surveys sponsored by the National Center for Education Statistics (NCES).1 All of these studies monitor the transition of national samples of young people from their high school years to postsecondary statuses, including further education, participation in the work force, and the assumption of other adult roles; ELS:2002 tracks these critical transitions for two analysis cohorts: 2002 high school sophomores and 2004 high school seniors.
In the high school years, ELS:2002 is an integrated multilevel survey involving multiple respondent populations. Base-year surveys were administered in 2002, including separate questionnaires for students, their parents, their teachers, school administrators, and librarians. The base-year data collection also included student assessments in math and reading, as well as a facilities checklist. The first follow-up was conducted in 2004, when base-year students were surveyed regardless of whether they were still in their base-year school, had transferred to a new school, or were out of school. High school-based data collections concluded in 2005, when high school transcripts were requested (from schools) and processed for each sample member, regardless of the sample member’s high school completion status.
In addition to the aforementioned high school survey components, follow-up surveys were also administered during the sample members’ postsecondary years: the second follow-up was conducted in 2006 (approximately 2 years after the sample’s modal high school graduation date), and the third follow-up was conducted in 2012 (when the majority of the sample was approximately 26 years old). Additional information about cohort members was also collected from extant data sources such as the American Council on Education (General Educational Development test [GED] data), the U.S. Department of Education Central Processing System (financial aid data), and SAT/ACT (postsecondary entrance exam scores). Finally, postsecondary transcripts will be collected during 2013–14, and the resulting data will be made available subsequent to the third follow-up data release.
1 The three predecessor studies to ELS:2002 are: the National Longitudinal Study of the High School Class of 1972 (NLS-72); High School and Beyond (HS&B); and the National Education Longitudinal Study of 1988 (NELS:88).
A-2
A.2 Instrumentation The ELS:2002 third follow-up questionnaire was designed for electronic self-administration (Web) or computer-assisted interviewer administration (i.e., computer-assisted telephone interview or computer-assisted personal interview). Items were selected primarily for their intracohort value, that is, their relevance, as final outcomes, to the antecedent or predictor variables gathered in earlier rounds. Of secondary importance was the intercohort value of items, that is, whenever possible variables were used which would prove comparable to those employed in the final round (2000) of the NELS:88, when the NELS:88 cohorts were approximately the same age (and years beyond high school) as the third follow-up ELS:2002 sample.
Content of the third follow-up questionnaire is summarized below:
Current status. The interview asked about the respondent’s current activities, such as labor market status and educational status.
High school completion. For sample members who had not completed high school (or GED) by the second follow-up or whose completion status was unknown, the third follow-up interview obtained updated information.
Postsecondary education. This section of the interview focused on the postsecondary enrollment and attainment at all levels of credentialing and degree completion and included all forms and levels of sub-baccalaureate, baccalaureate, and graduate and professional enrollment. It also gathered information such as primary or secondary major or program of study. First, sample members were asked to identify postsecondary institutions they had attended; second, they were asked to identify any postsecondary credentials earned. Reasons for leaving school were also elicited. Each of the postsecondary institutions which ELS:2002 sample members reported attending will be contacted during the postsecondary transcript component of the study (2013–14), and transcripts will be requested for each sample member who reported attending said institution.
The college experience. In addition to questions regarding postsecondary institutions attended and postsecondary credentials earned, third follow-up respondents were also asked a series of questions regarding their college participation in high-impact educational activities (that is, select salient special learning activities, for example, a capstone course, being mentored, or study abroad), and about the perceived impact of their college education in preparing them for various aspects of their adult lives.
Education finance. The questionnaire explored the issue of educational borrowing and its impact. Information about receipt of scholarships, fellowships, and grants was also obtained.
Educational expectations. Following in the tradition of the prior NCES high school cohort studies, all respondents were asked to report the highest level of education they expected to achieve by age 30 (average age at the time of the 2012–13 third follow-up interview is about 26).
Employment and income. The interview gathered information on employment and income. A brief employment history was collected by asking respondents to answer a series of questions about job title and duties, hours worked, earnings, and employer type. Both the employed and the unemployed were asked about perceived employment barriers they may have faced or be facing. All respondents were asked for their annual income and whether they had any dependents. These questions will allow analysts to roughly estimate net earnings after taxes. The questionnaire asked separately about employment through the military. In addition, three scales (based in social-cognitive career theory) were written specifically for

A-3
ELS:2002 and were included in the third follow-up questionnaire. The focus of those three scales were work support, job satisfaction, and job persistence intentions.
Family formation. The interview collected information about marital status, whether the respondent had children, and the respondent’s current household composition.
Life values. As included in earlier rounds of ELS:2002 as well as in some of the prior NCES secondary longitudinal studies, questions were asked about the life values (acquisition of money, friendships, helping others, a good marriage, etc.) that are important to the respondent.
Additional topics. Additional topics included civic engagement (e.g., voting and community service), assets/debt, and certification/licensure.
A facsimile of the third follow-up questionnaire is available at the ELS:2002 homepage on the NCES website (http://nces.gov/surveys/els2002/).
A.3 Sample Design The ELS:2002 base-year sample design began with a nationally representative, two-stage stratified probability sample. The first stage of selection was schools; schools were selected with probability proportional to size. The public school sample was stratified by the nine U.S. Census divisions and by location (metropolitan status of urban, suburban, or rural). Private schools (Catholic and other private) were stratified by four levels of geography (Census regions) and three of location (urbanicity); private schools were oversampled. The target sample size was 800 schools. Cooperation was sought from 1,221 eligible selections. The realized sample comprised 752 participating 10th-grade schools (68 percent participation rate). The second stage of selection was students. Of 17,591 eligible sampled students in the schools, 15,362 students participated, with some groups (e.g., Asians, students in nonpublic schools) oversampled. The weighted student response rate was 87 percent.
Base-year schools were again invited to participate in the first follow-up, as were base-year sophomore respondents (and a sample of base-year nonrespondents), regardless of whether they remained in their base-year school or had transferred to another school. In addition, at participating base-year schools in the first follow-up, a sample freshening procedure was implemented so that spring-term 2004 seniors who had not had a chance of selection into the sophomore cohort 2 years before would have a chance of selection into ELS:2002 as seniors. Ten base-year schools were ineligible in the first follow-up because they no longer enrolled ELS:2002 sample members. Overall, there were 16,515 sample members (students, dropouts, homeschooled students, or early graduates), of whom 14,989 participated.
In autumn 2004, high school transcripts were requested for all sample members who participated in at least one of the first two student interviews: the base-year interview or the first follow-up interview. Thus, sample members who were dropouts, freshened sample members, transfer students, homeschooled students, and early graduates are included if they were respondents in either the 2002 or 2004 interview. Transcripts were also requested for students who could not participate in either of the interviews because of a physical disability, a mental disability, or a language barrier. Further information about the transcript component may be found in Bozick et al. (2006, NCES 2006-338), available to licensed users of the transcript data.
The basis for the ELS:2002 second follow-up sampling frame was the sample of students selected in the base year when they were 10th-graders in 2002 combined with the sample of freshened students who were in the 12th grade in 2004. The second follow-up included all first follow-up eligible sample members except deceased students, students who were determined study ineligible at prior rounds, and

A-4
sample members who were out of scope2 in the first follow-up study. Eligible sample members who had not responded in the base year and the first follow-up were not fielded for the second follow-up. Similarly, freshened sample nonrespondents were not fielded for the second follow-up. For additional details, see the ELS:2002 Base-Year to Second Follow-up Data File Documentation (Ingels et al. 2007, NCES 2008-347).
No additional sampling was performed for the third follow-up. The target populations for the third follow-up are the same as those in the first and second follow-up; namely, those students who were enrolled in the 10th grade in 2002 and those students who were enrolled in the 12th grade in 2004.
A.4 Data Collection Results Response rates for ELS:2002 are calculated by dividing the number of sample units who completed a particular study component by the number of sample units eligible for participation that are fielded. Sample members are not eligible for the third follow-up if they are classified as deceased. Third follow-up out of scope cases (those who have withdrawn from the study, as well as those who were incarcerated, institutionalized, out of the country or otherwise unavailable for the duration of the study) were not fielded, and while used in weighting, are not counted in the response rate. All response rates are calculated using the base weight. For each round of data collection, nonresponse bias analyses were performed to ensure that any identified biases because of nonresponse were small or were adjusted for (see section A.6 of this report for further information on nonresponse bias analyses).
Base-year school and student questionnaire response rates. Of the 1,221 eligible contacted schools, 752 participated in the survey for an overall weighted school participation rate of 68 percent. These schools are nationally representative of public and private schools. Of 17,591 selected eligible students, 15,362 participated, for a weighted student response rate of 87 percent. For further information on base-year data collection results, see the ELS:2002 Base-Year Data File User’s Manual (NCES 2004-405).
First follow-up student questionnaire response rates. In the first follow-up, there were 16,515 eligible sample members; a total of 14,989 sample members responded to the questionnaire for a first follow-up response rate of 89 percent. For further information on first follow-up data collection results, see the ELS:2002 Base-Year to First Follow-up Data File Documentation (NCES 2006-344).
High school transcript response rates. A total of about 1,500 base-year and transfer schools provided at least one transcript for sample members. Ninety-one percent (weighted) of the student sample have some transcript information (14,916 of 16,373). For further information on results of the high school transcript data collection, see the ELS:2002 First Follow-up Transcript Component Data File Documentation (NCES 2006-338).
Second follow-up response rates. A total of 14,159 individuals (of 15,892 eligible) responded to the second follow-up interview, for a weighted response rate of 88 percent overall. For further information on second follow-up data collection results, see the ELS:2002 Base-Year to Second Follow-up Data File Documentation (NCES 2008-347).
Third follow-up response rates. A total of 13,250 individuals (of 15,724 eligible) responded to the third follow-up interview, for a weighted response rate of 84 percent. For further information on third follow-up data collection results, see the ELS:2002 Base-Year to Third Follow-up Data File Documentation (NCES 2014-364).
2 Out-of-scope sample members include individuals who had not responded in any prior round, prior-round respondents who were incarcerated or out of the country, and prior-round study refusals.

A-5
Sample size and response rate data for ELS:2002 are summarized in table A-1.
Table A-1. Summary of ELS:2002 base-year to third follow-up school and student response rates: 2002–13
Survey component Selected Participated Weighted percent Unweighted percent Base-year school sample 1,221 752 67.8 61.6 Base-year student sample 17,591 15,362 87.3 87.3 First follow-up questionnaire 16,515 14,989 88.7 90.8 High school transcripts 16,373 14,916 90.7 91.1 Second follow-up questionnaire 15,892 14,159 88.4 89.1 Third follow-up questionnaire 15,724 13,250 83.8 84.3
SOURCE: U.S. Department of Education, National Center for Education Statistics, Education Longitudinal Study of 2002 (ELS:2002).
A.5 Weighting The general purpose of the weighting scheme in the base year was to compensate for unequal probabilities of selection of schools and students into the base-year sample and to adjust for the fact that not all schools and students selected into the sample actually participated. Three sets of weights were computed in the base year: a school weight, a weight for student questionnaire completion, and a contextual data weight for the “expanded” sample of questionnaire-eligible and questionnaire-ineligible students. School and student weights were adjusted for nonresponse to reduce or eliminate bias which is measured as differences between the means for respondents and nonrespondents in population groups where the mean for nonrespondents is known from a nonresponding school’s questionnaire augmented with frame data. In addition, base-year school weights were poststratified to known population totals.
In the first follow-up, three individual-level weights were generated to accommodate the spring 2002 sophomore cohort 2 years later and the freshened senior cohort of 2004: (1) a cross-sectional weight based on 2004 questionnaire completion; (2) an expanded sample weight that extended the weighting to encompass questionnaire-ineligible sample members; and (3) a panel weight for sophomore cohort members with data at both points in time. In addition, a cross-sectional weight, F1TRSCWT, was computed for transcript respondents.
Four sets of weights were computed for the second follow-up: (1) a cross-sectional weight for sample members who responded in the second follow-up (F2QWT); (2) a cross-sectional transcript weight for sample members who responded in the second follow-up and for whom a transcript was collected in the first follow-up transcript study (F2QTSCWT); (3) a second follow-up panel weight for longitudinal analysis using all sample members who responded in the second follow-up and responded in the first follow-up (F2F1WT); and (4) a second follow-up panel weight for all sample members who were sophomores in spring 2002 and who responded in the second follow-up (F2BYWT).
Six sets of weights were computed for the third follow-up: (1) a current-round weight for sample members who responded in the third follow-up (F3QWT); (2) a current-round high school transcript weight for sample members who responded in the third follow-up and for whom a high school transcript was collected in the first follow-up transcript study (F3QTSCWT); (3) a third follow-up cross-round or panel weight for all sample members who responded in the third follow-up and responded in the base year (F3BYPNLWT); (4) a third follow-up high school transcript panel weight for sample members who responded in the third follow-up and responded in the base year and for whom a high school transcript was collected in the first follow-up transcript study (F3BYTSCWT); (5) a third follow-up panel weight
A-6
for all sample members who responded in the third follow-up and responded in the first follow-up (F3F1PNLWT); and (6) a third follow-up high school transcript panel weight for sample members who responded in the third follow-up and responded in the first follow-up and for whom a high school transcript was collected in the first follow-up transcript study (F3F1TSCWT).
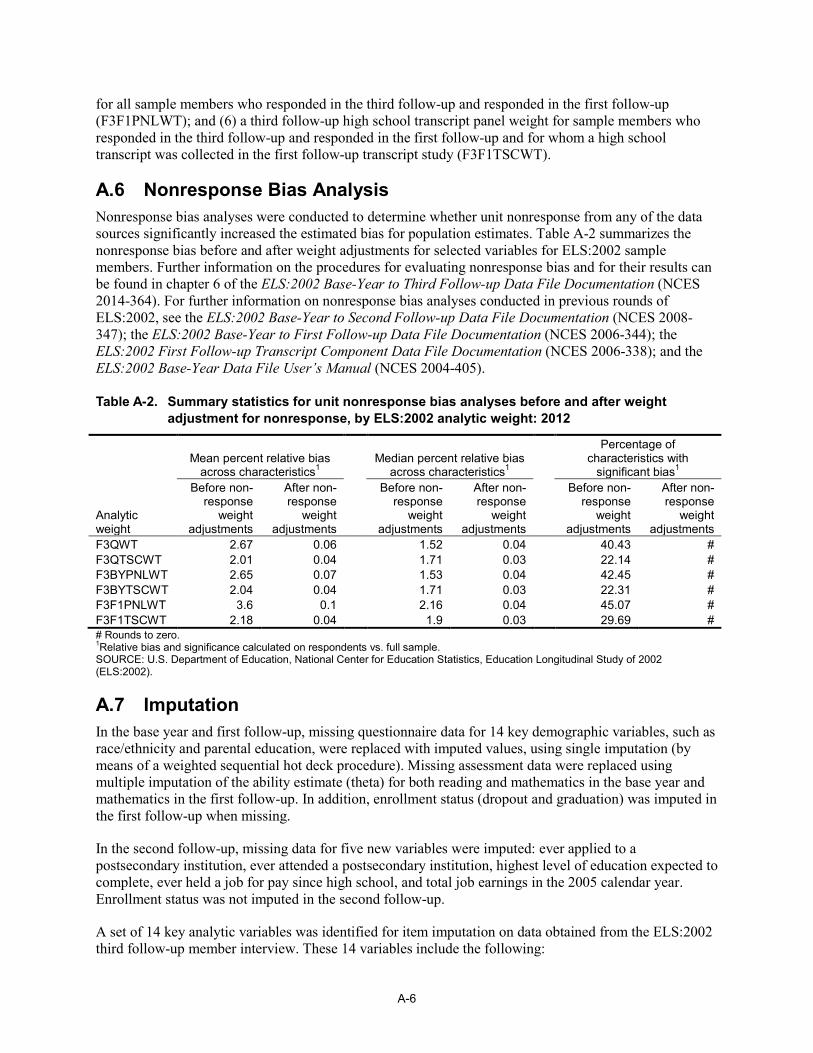
A.6 Nonresponse Bias Analysis Nonresponse bias analyses were conducted to determine whether unit nonresponse from any of the data sources significantly increased the estimated bias for population estimates. Table A-2 summarizes the nonresponse bias before and after weight adjustments for selected variables for ELS:2002 sample members. Further information on the procedures for evaluating nonresponse bias and for their results can be found in chapter 6 of the ELS:2002 Base-Year to Third Follow-up Data File Documentation (NCES 2014-364). For further information on nonresponse bias analyses conducted in previous rounds of ELS:2002, see the ELS:2002 Base-Year to Second Follow-up Data File Documentation (NCES 2008-347); the ELS:2002 Base-Year to First Follow-up Data File Documentation (NCES 2006-344); the ELS:2002 First Follow-up Transcript Component Data File Documentation (NCES 2006-338); and the ELS:2002 Base-Year Data File User’s Manual (NCES 2004-405).
Table A-2. Summary statistics for unit nonresponse bias analyses before and after weight adjustment for nonresponse, by ELS:2002 analytic weight: 2012
Mean percent relative bias across characteristics1
Median percent relative bias across characteristics1
Percentage of characteristics with
significant bias1
Analytic weight
Before non-response
weight adjustments
After non-response
weight adjustments
Before non-response
weight adjustments
After non-response
weight adjustments
Before non-response
weight adjustments
After non-response
weight adjustments
F3QWT 2.67 0.06 1.52 0.04 40.43 # F3QTSCWT 2.01 0.04 1.71 0.03 22.14 # F3BYPNLWT 2.65 0.07 1.53 0.04 42.45 # F3BYTSCWT 2.04 0.04 1.71 0.03 22.31 # F3F1PNLWT 3.6 0.1 2.16 0.04 45.07 # F3F1TSCWT 2.18 0.04 1.9 0.03 29.69 # # Rounds to zero. 1Relative bias and significance calculated on respondents vs. full sample. SOURCE: U.S. Department of Education, National Center for Education Statistics, Education Longitudinal Study of 2002 (ELS:2002).
A.7 Imputation In the base year and first follow-up, missing questionnaire data for 14 key demographic variables, such as race/ethnicity and parental education, were replaced with imputed values, using single imputation (by means of a weighted sequential hot deck procedure). Missing assessment data were replaced using multiple imputation of the ability estimate (theta) for both reading and mathematics in the base year and mathematics in the first follow-up. In addition, enrollment status (dropout and graduation) was imputed in the first follow-up when missing.
In the second follow-up, missing data for five new variables were imputed: ever applied to a postsecondary institution, ever attended a postsecondary institution, highest level of education expected to complete, ever held a job for pay since high school, and total job earnings in the 2005 calendar year. Enrollment status was not imputed in the second follow-up.
A set of 14 key analytic variables was identified for item imputation on data obtained from the ELS:2002 third follow-up member interview. These 14 variables include the following:

A-7
•
•
•
•
•
•
•
•
•
•
•
•
•
•
Ever held a job for pay since high school (F3EVRJOB);
Employment status as of the third follow-up interview (F3EMPSTAT);
2011 employment income: respondent only (F3ERN2011);
2011 employment income: spouse/partner only (F3SPERN2011);
Expected occupation at age 30 (F3ONET6AGE30);
Ever attended a postsecondary institution (F3EVRATT);
Enrollment status as of the third follow-up interview (F3EDSTAT);
Highest level of education attained as of the third follow-up interview (F3ATTAINMENT);
Number of months between high school completion and bachelor’s degree completion (F3HS2BA);
Number of months between postsecondary entry and bachelor’s degree completion (F3PS2BA);
Highest level of education expected to complete (F3STEXP);
Whether the respondent took out any student/postsecondary loans (F3STLOANEVR);
Total amount borrowed in student loans as of the third follow-up interview (F3STLOANAMT); and
Amount currently paid monthly toward student loan balance (F3STLOANPAY).
Section A.11 (Definitions of Analysis Variables) identifies any variables used in this report that contain imputed values; the weighted proportion of imputed values among the imputed variables used in this report ranges from less than 1 percent to 9 percent.3
A.8 Disclosure Risk Analysis and Protections To protect the confidentiality of NCES data that contain information about specific individuals, ELS:2002 data were subject to various procedures to minimize disclosure risk. As a first step, all ELS:2002 data files were reviewed to identify high-risk variables (public-use variables that might point to specific individuals or schools, e.g., some fine-grained variables, particularly those in continuous form, and variables with extreme outliers), which were suppressed or altered through data coarsening techniques such as top coding, bottom coding, or recasting into categorical form. As a second step, a technique called “data swapping” was carried out, whereby some variables for a sample case that has been paired with another case were exchanged. As a final step, the ELS:2002 data were analyzed to confirm that the disclosure limitation techniques did not compromise the analytic utility of the data.
A.9 Statistical Procedures in This Report Comparisons that appear in the selected findings have been tested for statistical significance (set at a probability of .05) to ensure that the differences are larger than those that might be expected because of sampling variation. There were no adjustments for multiple comparisons. The conclusions stated in this report are supported by a two-tailed test of statistical significance, specifically, a t test. Whether the 3 In addition, there are two variables used in this report—parent’s highest level of education (F1PARED) and parental/family SES (F1SES1QU)—which were not directly imputed, but were constructed from input variables which were imputed. The weighted proportion of F1PARED values used in this report where at least one of the two input variables was imputed (mother’s highest level of education, or father’s highest level of education) is 12 percent; the weighted proportion of F1SES1QU values used in this report where at least one of the five input variables was imputed (mother’s occupation, father’s occupation, mother’s highest level of education, father’s highest level of education, or 2001 family income) is 33 percent.

A-8
statistical test is considered significant is determined by calculating a t value for the difference between a pair of means or proportions and comparing this value to published tables of values, called critical values. The alpha level is an a priori statement of the probability that a difference exists in fact rather than by chance.
The t statistic between estimates from various subgroups presented in the tables can be computed by using the following formula:
( )22
21
21
SESE
xxt
+
−=
where x1 and x2 are the estimates to be compared (e.g., the means of sample members in two groups), and SE1 and SE2 are their corresponding standard errors. This formula is valid only for independent estimates.
A.10 Survey Standard Errors in This Report Because the ELS:2002 sample design involved stratification, the disproportionate sampling of certain strata, and clustered (i.e., multistage) probability sampling, the resulting statistics are more variable than they would have been if they had been based on data from a simple random sample of the same size.
Calculating exact standard errors for survey estimates can be difficult. Several procedures are available for calculating precise estimates of sampling errors for complex samples. Procedures such as Taylor Series approximations, balanced repeated replication (BRR), and Jackknife Repeated Replication, which can be found in advanced statistical programs such as SUDAAN, AM, or WESVAR, produce similar results. The ELS:2002 analyses included in this report used the BRR procedure to calculate standard errors.
A.11 Definitions of Analysis Variables This section describes the variables used in each of the figures/tables of this report. These variables were used in conjunction with the third follow-up questionnaire respondent weight (F3QWT) to generate estimates and standard errors. Researchers can consult http://nces.ed.gov/surveys/els2002/questionnaires.asp to (1) access flow charts representing how respondents were assigned survey items, and (2) access questionnaires/facsimiles to see the exact wording of survey items that were ultimately used to generate these variables.
Variables Used Across All Figures/Tables •
•
2001–02 sophomore cohort member (G10COHRT): This cohort flag identifies spring 2002 tenth-graders; for each figure/table included in this report, G10COHRT is used in concert with F3QWT (the third follow-up questionnaire rate) to generate nationally representative estimates of spring 2002 tenth-graders as of the third follow-up.
Highest level of education respondent has earned as of the third follow-up (F3ATTAINMENT): F3ATTAINMENT categorizes third follow-up respondents’ highest level of education as follows: (1) no high school credential and no postsecondary attendance; (2) high school credential, no postsecondary attendance; (3) some postsecondary attendance, no postsecondary credential; (4) undergraduate certificate; (5) Associate’s degree; (6) Bachelor’s degree; (7) postbaccalaureate certificate; (8) Master’s degree; (9) post-Master’s certificate; or (10) doctoral degree.

A-9
Figure 1 Variables •
•
Employment status as of the third follow-up interview (F3EMPSTAT): F3EMPSTAT characterizes the respondent’s employment status as of their third follow-up interview in terms of the number and type (full-time vs. part-time) of job(s) they were working. If the respondent was working multiple jobs, F3EMPSTAT also indicates the number of hours worked across all their jobs. If the respondent was not working for pay as of their third follow-up interview, F3EMPSTAT distinguishes between those looking for work (“unemployed”) and those not looking for work (“out of the labor force”). F3EMPSTAT is built from third follow-up survey variables, and is imputed when missing for third follow-up respondents.
Postsecondary enrollment status as of the third follow-up interview (F3EDSTAT): F3EDSTAT categorizes third follow-up respondents as (1) currently taking courses at a 4-year school; (2) currently taking courses at a 2-year school; (3) currently taking courses at a less-than-2-year school; (4) currently taking courses, institutional level unknown; (5) not currently enrolled, but has previous postsecondary attendance; or (6) having no postsecondary attendance. F3EDSTAT is imputed when missing for third follow-up respondents.
Table 1 Row Variables •
•
•
Sex (F1SEX): For base-year respondents, this variable was constructed from the base-year student questionnaire or, where missing, from (in order of preference) the school roster or logical imputation based on first name. Base-year nonrespondents were asked to self-report their sex in the first follow-up interview.
Race/ethnicity (F1RACE_R): F1RACE_R includes eight categories: (1) American Indian/Alaska Native, non-Hispanic; (2) Asian, non-Hispanic; (3) Black or African American, non-Hispanic; (4) Hispanic, no race specified; (5) Hispanic, race specified; (6) More than one race, non-Hispanic; (7) Native Hawaiian/Pacific Islander, non-Hispanic; and (8) White, non-Hispanic. For the purposes of this report, the eight F1RACE_R categories have been collapsed into five: White (8), Black (3), Asian (2), Hispanic (4 and 5), and Other (1, 6, and 7). The ELS:2002 race variables reflect new federal standards that require collecting race separately from ethnicity and allow respondents to mark more than one choice for race. For base-year respondents, information on race/ethnicity was obtained from the base-year student questionnaire when available, or (in order of preference) from the sampling roster, the parent questionnaire (if the parent respondent was a biological parent), or logical imputation based on other questionnaire items (e.g., surname, native language). Base-year nonrespondents were asked to self-report their race/ethnicity in the first follow-up interview.
Parent’s highest level of education (F1PARED): F1PARED is equivalent to either F1MOTHED (mother’s highest level of education) or F1FATHED (father’s highest level of education), whichever is the higher level of education. For base-year respondents, F1MOTHED and F1FATHED are taken from the parent questionnaire or, where missing, from (in order of preference) the base-year student questionnaire or imputation. For base-year nonrespondents who were first follow-up respondents, this information was taken from the new participant supplement. F1PARED is composed of eight distinct levels of education: (1) Did not finish high school; (2) Graduated from high school or GED; (3) Attended 2-year school, no degree; (4) Graduated from 2-year school; (5) Attended college, no 4-year degree; (6) Graduated from college; (7) Completed master’s degree or equivalent; and (8) Completed PhD, MD, or other advanced degree. For the purposes of this report, the eight levels of F1PARED were collapsed into four: High school or less (1 and 2), Some college (3, 4, and 5), Bachelor’s degree (6), and Master’s degree or higher (7 and 8).

A-10
•
•
•
•
Parental/family SES (F1SES1QU): Parental/family socioeconomic status exists as both a continuous variable and as a categorical variable based on weighted quartiles. The categorical form of the variable (F1SES1QU) divides F1SES1 into quartiles based on the weighted marginal distribution. For the purposes of this report, it was recoded to combine the middle two categories of the F1SES1QU variable. Three categories result: (1) lowest quartile of SES1 (i.e., students below the 25th percentile rank for SES); (2) middle two quartiles of SES1 (i.e., students whose SES percentile rank was at least 25th and below 75th); and (3) highest quartile of SES1 (i.e., students whose SES percentile rank was at least 75th). F1SES1 is a NLS-72/HS&B/NELS:88-comparable composite variable constructed from parent questionnaire data when available and from imputation or student substitutions when not. SES is based on five equally weighted, standardized components: father’s/guardian’s education (F1FATHED), mother’s/guardian’s education (F1MOTHED), family income (BYINCOME), father’s/guardian’s occupational prestige score (from F1OCCUFATH), and mother’s/guardian’s occupational prestige score (from F1OCCUMOTH).
Student’s educational expectations in the 10th grade (BYSTEXP): BYSTEXP is taken directly from the base-year student questionnaire, when available, and is imputed when missing for base-year respondents. Students were asked, “As things stand now, how far in school do you think you will get?” The eight response options were: (1) Less than high school graduation; (2) High school graduation or GED only; (3) Attend or complete a 2-year school course in a community college or vocational school; (4) Attend college, but not complete a 4-year degree; (5) Graduate from college; (6) Obtain a master’s degree or equivalent; (7) Obtain a PhD, MD, or other advanced degree; and (8) Don’t know. For the purposes of this report, these eight categories are collapsed into five: High school diploma or less (1 and 2), Some college (3 and 4), Bachelor’s degree (5), Master’s degree or higher (6 and 7), and Don’t Know (8).
Base-year /10th-grade school control (BYSCTRL): BYSCTRL indicates the type of school attended by the respondent in the base-year interview; sources include the Common Core of Data 1999–2000, and the Private School Survey 1999–2000. School control is classified as Public, Catholic, or Other Private.
GPA for all high school courses (F1RGP): F1RGP indicates the transcript-reported cumulative GPA, standardized to a 4-point scale. For full detail on the construction of this variable, see the ELS:2002 First Follow-up Transcript Component Data File Documentation (NCES 2006-338).
Table 2 Row Variables •
•
•
Ever attended a postsecondary institution (F3EVRATT): F3EVRATT indicates whether the respondent has ever attended a postsecondary institution; it is taken directly from the third follow-up interview (F3A11) if available, and imputed for third follow-up respondents if missing.
Number of months between high school completion and first postsecondary enrollment (F3HS2PS1): F3HS2PS1 calculates the number of months between the respondent’s high school credential date (F3HSCPDR) and the date they first attended a postsecondary institution (F3PS1START).
Control of first-attended postsecondary institution (F3PS1CTR): F3PS1CTR indicates the level of the respondent’s first-attended postsecondary institution. For most respondents, this is the level associated with the Integrated Postsecondary Education Data System (IPEDS) code of the first institution attended. For institutions without an IPEDS code, institutional level (if available) was provided by the respondent. Institutional levels include (1) 4-year college/university, (2) 2-year college/university, and (3) less-than-2-year school.

A-11
• Selectivity of first-attended postsecondary institution (F3PS1SLC): The ELS:2002 selectivity measure is based on the IPEDS variable “CCUGPROF” (Carnegie Classification 2010: Undergraduate Profile). Four-year institutions coded as “highly selective” refer to those whose first-year students’ test scores places them in roughly the top fifth of baccalaureate institutions; 4-year institutions coded as “moderately selective” refer to those whose first-year students’ test scores places them in roughly the middle two-fifths of baccalaureate institutions. Four-year institutions coded as “inclusive” either did not report test score data or the scores indicate that they extend educational opportunity to a wide range of students with respect to academic preparation and achievement.
Table 3 Row Variables •
•
•
•
•
•
•
•
Whether respondent took out any student/postsecondary education loans (F3STLOANEVR): F3STLOANEVR is drawn directly from the third follow-up interview when available (F3A18), and is imputed when missing for third follow-up respondents.
Total amount borrowed in student loans (F3STLOANAMT): F3STLOANAMT is drawn directly from the third follow-up interview when available (F3A19), and is imputed when missing for third follow-up respondents.
Whether currently making monthly payments on student loans (F3A20): F3A20 is drawn directly from the third follow-up questionnaire, where respondents were asked “Are you currently making any monthly payments on any of your education loans?”
Amount currently paid monthly toward student loan balance (F3STLOANPAY): The monthly amount the respondent is currently paying toward their student/postsecondary education loans is drawn directly from the third follow-up interview when available (F3A21), and is imputed when missing for third follow-up respondents.
Cumulative amount borrowed in federal education loans (FEDCUM3): FEDCUM3 is derived from the National Student Loan Data System (NSLDS), and indicates the cumulative federal loan amount borrowed for undergraduate and graduate education. Perkins Loans may be understated in FEDCUM3 since Perkins Loans are not always reported to NSLDS; FEDCUM3 excludes Direct PLUS Loans to parents of undergraduate students, which are only available to the parents of dependent undergraduates.
Cumulative amount owed in federal education loans (FEDDUE3): FEDDUE3 is derived from the National Student Loan Data System (NSLDS), and indicates the cumulative federal loan amount owed, principal and interest, for undergraduate or graduate education.
Cumulative Pell amount (PELLCUM): PELLCUM is derived from the National Student Loan Data System (NSLDS), and indicates the cumulative amount of Pell grant funds ever received.
NSLDS loan / Pell grant data availability status (F3NSLDSSTAT): This variable allows for identification of any cases where an NSLDS match was not attempted (due to missing or incomplete matching information, e.g. first and last name, date-of-birth, SSN); if desired, such cases can then be removed from any analysis using NSLDS-based variables.
Table 4 Row Variables Third follow-up respondents with any postsecondary enrollment were presented a series of items (F3A15A–F3A15D) and asked “How important would you say your [undergraduate education was / college education was / college attendance has been] in preparing you for the following aspects of your life?” Response options for each of the following items were “Not important,” “Somewhat important,” or “Very important”:

A-12
•
•
•
•
Work and career (F3A15A)
Further education (F3A15B)
Establishing your financial security (F3A15C)
Civic participation, for example, your involvement in the community, or voting (F3A15D)
Table 5 Row Variables •
•
•
•
•
•
•
•
•
Employment status as of the third follow-up interview (F3EMPSTAT): See description above under subsection titled “Figure 1 Variables.”
2011 employment earnings (F3ERN2011): The respondent’s earnings from employment during the 2011 calendar year are drawn directly from the third follow-up interview when available (F3D20), and are imputed when missing.
2011 income from sources other than employment (F3D26): F3D26 is taken directly from the third follow-up questionnaire, where respondents were asked “Without considering any 2011 earnings from employment, approximately how much did [you/you and your spouse/you and your partner] receive from sources of income other than employment in 2011? Sources of income other than employment might include investments, unemployment compensation, alimony or child support, public assistance, family members, or disability payments.”
Whether respondent has lost a job since January 2006 (F3D44C): F3D44C is taken directly from the third follow-up questionnaire, where respondents were asked “Since January 2006, have any of the following happened to you?” You lost your job… (1) no, has not happened since January 2006; (2) yes, has happened once since January 2006; or (3) yes, has happened more than once since January 2006.
Ever unemployed since January 2009 (F3C07): F3C07 is taken directly from the third follow-up questionnaire, where respondents were asked “Since January 2009, have you ever been unemployed for a period of one month or more, that is, not employed but seeking employment?”
Total number of months unemployed since January 2009 (F3C08): F3C08 is taken directly from the third follow-up questionnaire, where respondents were asked “Since January 2009, approximately how many months in total have you been unemployed (not employed but seeking employment)?”
Whether received public assistance during 2011 (F3D24): F3D24 is taken directly from the third follow-up questionnaire, where respondents were asked “During 2011, did [you/you or your spouse/you or your partner] receive any of the following benefits: Supplemental Security Income (SSI); SNAP (the Food Stamp Program); TANF (the Temporary Assistance for Needy Families Program); the Free and Reduced-Price School Lunch Program; or WIC (the Special Supplemental Nutrition Program for Women, Infants, and Children)?”
Total nonmortgage debt (F3D33): F3D33 is taken directly from the third follow-up questionnaire, where respondents were asked “Now, think about your debts, besides any mortgage on your home. How much do you [and your spouse/partner] owe altogether? Do not include mortgage loans, but include all other debts, such as credit card debt, unpaid student loans, unpaid car loans, and all other unpaid loans.”
Subjective rating of financial stress (F3D36): F3D36 is taken directly from the third follow-up questionnaire, where respondents were asked “Many young adults experience financial problems. On a scale of 1 to 5, where 1 means “not at all stressful” and 5 means “extremely stressful,” how much stress have you felt in meeting your financial obligations during the past year?”

A-13
Table 6 Row Variables •
•
•
•
•
•
•
Employment status as of the third follow-up interview (F3EMPSTAT): See description above under subsection titled “Figure 1 Variables.” When generating estimates for table 6 (and the associated standard errors for table B-7), F3EMPSTAT is used to subset the analysis sample used in this report to those who were currently employed as of their third follow-up interview.
Standardized hourly wage for current/most recent job (F3HOURWAGE): F3HOURWAGE indicates the respondent’s earnings at his or her current/most recent job, standardized to dollars per hour. Respondents were able to report earnings at their current/most recent job in different ways (i.e., per hour, per day, per week, every 2 weeks, twice per month, per month, or per year). By using the number of hours the respondent reported working per week, all earnings responses were converted to a dollars-per-hour value.
Whether current employer offers medical insurance (F3B24): F3B24 is taken directly from the third follow-up questionnaire, where respondents were asked “Does your employer for your current job offer medical insurance such as health, dental, or vision?”
Relationship between current job and career goals (F3B29): F3B29 is taken directly from the third follow-up questionnaire, where respondents were asked “Which of the following best describes your current job? (1) It fulfills your long-term career goals; (2) It is a step on the path to your long-term career goals; (3) It is not related to your long-term career goals; or (4) You do not have long-term career goals.”
Job satisfaction index/scale score (F3JOBSATIS): F3JOBSATIS is a scale of the respondent’s job satisfaction at his or her current/most recent job. Higher values represent greater job satisfaction. The variable was created through principal factor analysis (weighted by F3QWT) and standardized to a mean of 0 and standard deviation of 1. Only respondents who provided a full set of input responses (F3B34D, F3B34E, and F3B34F) were assigned a scale value. The coefficient of reliability (alpha) for the scale is 0.90.
Index/scale score for job persistence intentions (F3JOBPERSIST): F3JOBPERSIST is a scale of the respondent’s job persistence intentions at his or her current/most recent job. Higher values represent greater job persistence intentions. The variable was created through principal factor analysis (weighted by F3QWT) and standardized to a mean of 0 and standard deviation of 1. Only respondents who provided a full set of input responses (F3B34G, F3B34H, and F3B34I) were assigned a scale value. The coefficient of reliability (alpha) for the scale is 0.89.
Work support index/scale score (F3JOBSUPP): F3JOBSUPP is a scale of the respondent’s perceived work support at his or her current/most recent job. Higher values represent greater perceived work support. The variable was created through principal factor analysis (weighted by F3QWT) and standardized to a mean of 0 and standard deviation of 1. Only respondents who provided a full set of input responses (F3B34A, F3B34B, and F3B34C) were assigned a scale value. The coefficient of reliability (alpha) for the scale is 0.80.
Table 7 Row Variables •
•
Employment status as of the third follow-up interview (F3EMPSTAT): See description above under subsection titled “Figure 1 Variables.” When generating estimates for table 7 (and the associated standard errors for table B-8), F3EMPSTAT is used to subset the analysis sample used in this report to those who were currently employed as of their third follow-up interview.
Job family for current/most recent occupation (F3ONET2CURR): F3ONET2CURR stores the 2-digit (general category) Occupational Information Network (O*NET) code associated with the respondent’s current or most recent job. A 2-digit O*NET code exists for each of the 23 Job

A-14
Families in the O*NET taxonomy. Occupation codes were assigned primarily by the survey instrument assisted coder, and secondarily by upcoding activities. See section 5.4 of the ELS:2002/2012 Data File Documentation (NCES 2014-364) for further information regarding upcoding activities; see http://www.onetonline.org/ for further information regarding the O*NET codeframe.
Table 8 Row Variables •
•
•
•
•
•
•
•
Marital status as of the third follow-up (F3MARRSTATUS): Third follow-up respondents were asked for their current marital status, and, if not married at the time of their third follow-up interview, they were also asked “Are you currently living with a significant other in a marriage-like relationship?” F3MARRSTATUS draws on both of these pieces of information in coding each respondent as: (1) married; (2) never married, currently living with partner; (3) never married, not currently living with partner; (4) divorced/widowed, currently living with partner; (5) divorced/widowed, not currently living with partner; (6) separated, currently living with partner; or (7) separated, not currently living with partner. For the purposes of this report, categories 2, 4, and 6 are combined as “partnered,” and categories 3, 5, and 7 are combined as “single.”
Number of biological children (F3D07): F3D07 is taken directly from the third follow-up questionnaire, where respondents were asked “How many biological children have you had?”
Respondent’s living arrangement as of his or her third follow-up interview (F3LIVARR): F3LIVARR indicates whether the respondent was living by him- or herself; with parents; with a spouse or partner; with children; with siblings; with friends or roommates; or whether the respondent has some other living arrangement.
Whether respondent owns home, rents, or has some other arrangement (F3D30): F3D30 is taken directly from the third follow-up questionnaire, where respondents were asked, “Do you… (1) pay mortgage toward or own your home, (2) pay rent where you live, or (3) have some other arrangement?”
Whether respondent lives in parent(s) home, or parents live in respondent’s home (F3D16): F3D16 is taken directly from the third follow-up questionnaire, where respondents were asked, “Do you… (1) live in your parent or guardian’s home, or (2) [does she/does he/do they] live in your home?” F3D16 was only administered to those respondents who indicated they were living in the same household as one or more of their parent(s)/guardian(s).
Residential mobility, comparing base-year residence to third follow-up residence (F3MOBILITYBYF3): Distance (in miles) between the respondent’s base-year residence and his or her third follow-up residence; F3MOBILITYBYF3 is calculated by comparing the distance between the ZIP code centroid associated with his or her base-year residence to the ZIP code centroid associated with his or her third follow-up residence (the SAS ZIPCITYDISTANCE function is used to make this calculation).
Region of third follow-up residence (F3REGION): F3REGION indicates the geographic region of the respondent’s third follow up residence as: Northeast (including CT, MA, ME, NH, NJ, NY, PA, RI, and VT), Midwest (including IA, IL, IN, KS, MI, MN, MO, ND, NE, OH, SD, and WI), South (including AL, AR, DC, DE, FL, GA, KY, LA, MD, MS, NC, OK, SC, TN, TX, VA, and WV), or West (including AK, AZ, CA, CO, HI, ID, MT, NM, NV, OR, UT, WA, and WY).
Quartile coding of the sample member’s socioeconomic status as of the third follow-up interview (F3SESQU): F3SESQU is a weighted quartile coding of the composite variable F3SES; F3SES is the average of 3 inputs (2011 earnings from employment, the prestige score associated with the
A-15
respondent’s current/most recent job, and educational attainment), each of which is standardized to a mean of 0 and a standard deviation of 1 prior to averaging. Since F3SESQU does not account for the income, occupation, or education of the respondent’s spouse/partner, Table 8 estimates for “SES quartile as of 2012” reflect respondents’ individual socioeconomic status (as opposed to their household economic status) as of the third follow-up.

B-1
Appendix B: Standard Error Tables

B-2
Table B-1. Standard errors for educational attainment of spring 2002 high school sophomores, by select student background characteristics: 2012
Characteristic
Less than high school
completion
High school diploma or equivalent
Some postsecondary
enrollment1 Undergraduate
certificate Associate’s
degree
Bachelor’s degree or
higher Total 0.23 0.44 0.47 0.32 0.35 0.74
Sex Male 0.31 0.67 0.72 0.43 0.46 0.88
Female 0.26 0.51 0.68 0.46 0.50 0.91
Race/ethnicity2 White 0.22 0.51 0.60 0.40 0.47 0.91
Black or African American 0.70 1.10 1.31 0.93 0.80 1.18 Hispanic or Latino 0.75 1.10 1.27 0.84 0.87 1.39 Asian 0.46 0.96 1.60 0.93 0.87 2.16 Other 0.87 1.81 2.35 1.31 1.33 2.25
Parents’ highest education High school diploma or less 0.53 0.80 0.81 0.72 0.63 0.83
Some college 0.27 0.65 0.83 0.57 0.53 0.83 Bachelor’s degree 0.30 0.58 1.13 0.58 0.74 1.23 Master’s degree or higher 0.30 0.62 1.24 0.64 0.65 1.40
Parents’ SES
Lowest quartile 0.58 0.92 1.03 0.72 0.63 0.90 Middle two quartiles 0.26 0.54 0.68 0.48 0.52 0.82 Highest quartile 0.15 0.41 1.07 0.51 0.58 1.17
See notes at end of table.

B-3
Table B-1. Standard errors for educational attainment of spring 2002 high school sophomores, by select student background characteristics: 2012—Continued
Characteristic
Less than high school
completion
High school diploma or equivalent
Some postsecondary
enrollment1 Undergraduate
certificate Associate’s
degree
Bachelor’s degree or
higher Student’s educational expectation in 10th grade
High school diploma or less 1.44 1.88 1.94 1.38 0.92 0.79 Some college 0.88 1.45 1.70 1.31 1.16 0.99 Bachelor’s degree 0.27 0.66 0.88 0.57 0.64 1.00 Master’s degree or higher 0.19 0.40 0.79 0.53 0.47 0.94 Don’t know 0.88 1.58 1.92 1.06 0.98 1.56
2002 high school type Public 0.25 0.47 0.49 0.35 0.37 0.78
Catholic 0.16 0.45 1.26 0.66 0.68 1.99 Other private 0.20 0.98 2.00 1.01 1.26 3.08
Cumulative high school GPA 0.00–1.99 0.90 1.22 1.29 0.79 0.58 0.49
2.00–2.49 0.47 1.00 1.11 0.77 0.79 0.86 2.50–2.99 0.17 0.91 1.21 0.86 0.90 1.25 3.00–3.49 0.09 0.54 1.06 0.66 0.83 1.23 3.50+ 0.06 0.32 0.85 0.42 0.61 1.26
1Some postsecondary enrollment, but no postsecondary credential. 2All race categories exclude Hispanic or Latino origin, unless specified. NOTE: GPA = grade point average. SES = socioeconomic status. SOURCE: U.S. Department of Education, Institute of Education Sciences, National Center for Education Statistics. Education Longitudinal Study of 2002 (ELS:2002) Third Follow-up Restricted-Use File (NCES 2014-362).
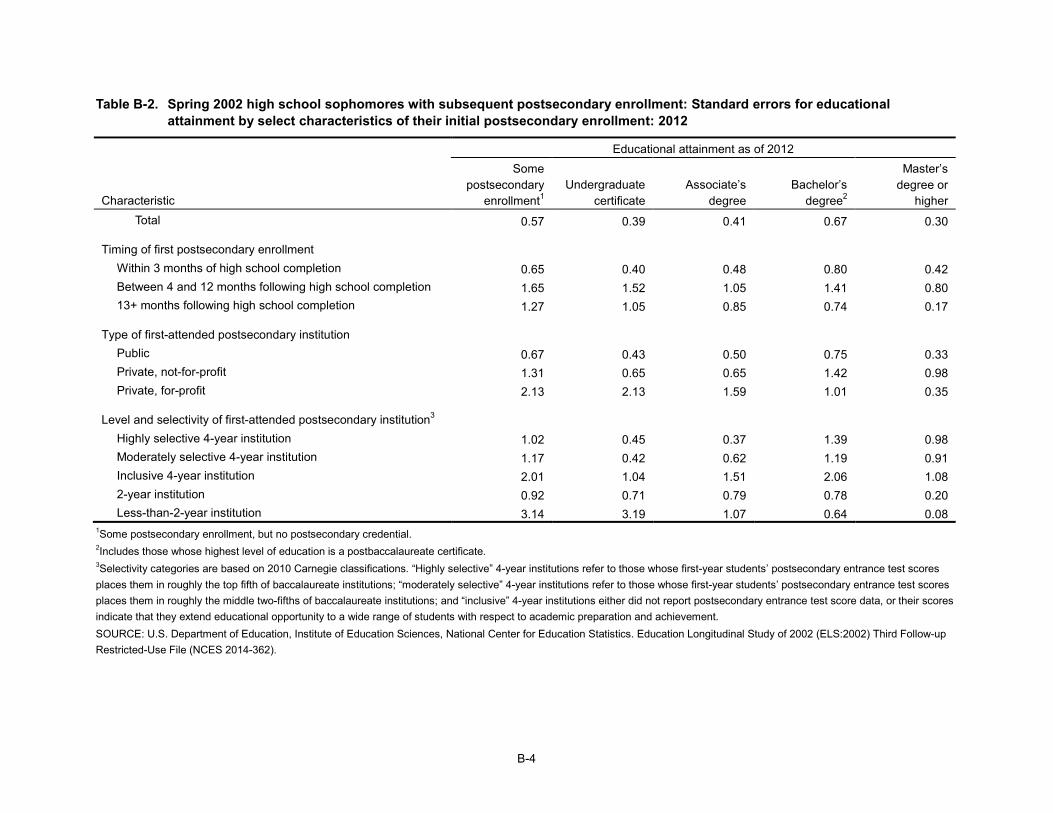
B-4
Table B-2. Spring 2002 high school sophomores with subsequent postsecondary enrollment: Standard errors for educational attainment by select characteristics of their initial postsecondary enrollment: 2012
Educational attainment as of 2012
Characteristic
Some postsecondary
enrollment1 Undergraduate
certificate Associate’s
degree Bachelor’s
degree2
Master’s degree or
higher Total 0.57 0.39 0.41 0.67 0.30
Timing of first postsecondary enrollment Within 3 months of high school completion 0.65 0.40 0.48 0.80 0.42
Between 4 and 12 months following high school completion 1.65 1.52 1.05 1.41 0.80 13+ months following high school completion 1.27 1.05 0.85 0.74 0.17
Type of first-attended postsecondary institution Public 0.67 0.43 0.50 0.75 0.33
Private, not-for-profit 1.31 0.65 0.65 1.42 0.98 Private, for-profit 2.13 2.13 1.59 1.01 0.35
Level and selectivity of first-attended postsecondary institution3 Highly selective 4-year institution 1.02 0.45 0.37 1.39 0.98
Moderately selective 4-year institution 1.17 0.42 0.62 1.19 0.91 Inclusive 4-year institution 2.01 1.04 1.51 2.06 1.08 2-year institution 0.92 0.71 0.79 0.78 0.20 Less-than-2-year institution 3.14 3.19 1.07 0.64 0.08
1Some postsecondary enrollment, but no postsecondary credential. 2Includes those whose highest level of education is a postbaccalaureate certificate. 3Selectivity categories are based on 2010 Carnegie classifications. “Highly selective” 4-year institutions refer to those whose first-year students’ postsecondary entrance test scores places them in roughly the top fifth of baccalaureate institutions; “moderately selective” 4-year institutions refer to those whose first-year students’ postsecondary entrance test scores places them in roughly the middle two-fifths of baccalaureate institutions; and “inclusive” 4-year institutions either did not report postsecondary entrance test score data, or their scores indicate that they extend educational opportunity to a wide range of students with respect to academic preparation and achievement. SOURCE: U.S. Department of Education, Institute of Education Sciences, National Center for Education Statistics. Education Longitudinal Study of 2002 (ELS:2002) Third Follow-up Restricted-Use File (NCES 2014-362).

B-5
Table B-3. Spring 2002 high school sophomores with subsequent postsecondary enrollment: Standard errors for student loan and grant types/amounts, by educational attainment: 2012
All 2002 sophomores with subsequent PSE
Educational attainment as of 2012
Loan/grant type and amount
Some postsecondary
enrollment1 Undergraduate
certificate Associate’s
degree Bachelor’s
degree2
Master’s degree or
higher Total amount borrowed in postsecondary
student loans3 $0 0.69 1.04 1.66 1.92 1.03 1.56
$0.01–$9,999 0.49 0.80 1.40 1.45 0.62 0.96 $10,000–$24,999 0.47 0.79 1.39 1.69 0.90 1.21 $25,000–$49,999 0.40 0.50 1.11 1.19 0.84 1.72 $50,000+ 0.37 0.31 0.56 0.97 0.75 2.13
Current monthly payment toward student loan
balance3 $04 0.62 0.78 1.63 1.79 1.04 1.89
$0.01–$99 0.26 0.44 0.90 0.89 0.43 0.77 $100–$199 0.35 0.48 1.07 1.13 0.70 1.04 $200–$399 0.37 0.42 0.94 1.10 0.77 1.41 $400+ 0.33 0.26 0.61 0.80 0.73 1.71
Cumulative amount borrowed in federal loans5,6 $0 0.73 1.08 1.67 1.99 1.06 1.62
$0.01–$7,499 0.49 0.88 1.51 1.45 0.53 0.63 $7,500–$14,999 0.37 0.60 1.28 1.36 0.65 0.87 $15,000–$29,999 0.47 0.62 1.16 1.37 0.98 1.26 $30,000+ 0.40 0.48 0.64 1.26 0.87 1.95
See notes at end of table.

B-6
Table B-3. Spring 2002 high school sophomores with subsequent postsecondary enrollment: Standard errors for student loan and grant types/amounts, by educational attainment: 2012—Continued
All 2002 sophomores with subsequent PSE
Educational attainment as of 2012
Loan/grant type and amount
Some postsecondary
enrollment1 Undergraduate
certificate Associate’s
degree Bachelor’s
degree2
Master’s degree or
higher Cumulative amount owed in federal loans5,6
$0 0.70 0.98 1.65 2.25 1.08 1.74 $0.01–$7,499 0.43 0.69 1.34 1.61 0.58 0.67 $7,500–$14,999 0.40 0.59 1.24 1.19 0.81 0.89 $15,000–$29,999 0.44 0.62 1.09 1.34 0.83 1.20 $30,000+ 0.42 0.50 0.71 1.28 0.83 2.03
Cumulative amount received in Pell grants5 $0 0.78 1.11 1.77 2.03 1.20 2.07
$0.01–$2,999 0.41 0.76 1.29 1.23 0.60 1.12 $3,000–$5,999 0.40 0.68 1.40 1.15 0.43 1.06 $6,000–$11,999 0.41 0.65 1.27 1.43 0.64 1.08 $12,000+ 0.44 0.58 0.94 1.58 0.84 1.24
1Some postsecondary enrollment, but no postsecondary credential. 2Includes those whose highest level of education is a postbaccalaureate certificate. 3As reported by the sample member. 4Includes those who (1) did not take out a student loan; (2) had already paid off their student loan(s); and (3) had taken out a student loan but were not making monthly payments on said loan(s). 5As indicated by the National Student Loan Data System. 6“Cumulative amount borrowed” refers to original loan amounts, while “cumulative amount owed” refers to total amount owed, both principal and interest, on any outstanding federal loans. NOTE: PSE = postsecondary enrollment. SOURCE: U.S. Department of Education, Institute of Education Sciences, National Center for Education Statistics. Education Longitudinal Study of 2002 (ELS:2002) Third Follow-up Public-Use File (NCES 2014-365).

B-7
Table B-4. Spring 2002 high school sophomores with subsequent postsecondary enrollment: Standard errors for subjective ratings of the importance of college in preparing them for various aspects of life, by educational attainment: 2012
All 2002 sophomores with subsequent PSE
Educational attainment as of 2012
Area of preparation Some postsecondary
enrollment1 Undergraduate
certificate Associate’s
degree Bachelor’s
degree2
Master’s degree or
higher Work and career
Very important 0.62 1.06 1.84 1.77 1.09 2.07 Somewhat important 0.62 0.95 1.54 1.75 1.06 2.13 Not at all important 0.37 0.75 1.00 0.98 0.47 0.78
Further education Very important 0.62 0.94 1.80 2.14 0.97 1.78
Somewhat important 0.59 0.88 1.65 2.01 1.00 1.73 Not at all important 0.37 0.72 1.07 1.00 0.50 0.53
Establishing financial security Very important 0.63 1.06 1.83 1.90 1.04 1.80
Somewhat important 0.60 0.91 1.58 1.80 1.01 1.87 Not at all important 0.47 0.86 1.19 1.48 0.76 1.54
Civic participation Very important 0.53 0.91 1.90 1.76 0.90 1.55
Somewhat important 0.62 0.93 1.92 2.27 1.07 2.08 Not at all important 0.53 0.91 1.72 1.85 0.94 1.82
1Some postsecondary enrollment, but no postsecondary credential. 2Includes those whose highest level of education is a postbaccalaureate certificate. NOTE: PSE = postsecondary enrollment. SOURCE: U.S. Department of Education, Institute of Education Sciences, National Center for Education Statistics. Education Longitudinal Study of 2002 (ELS:2002) Third Follow-up Public-Use File (NCES 2014-365).

B-8
Table B-5. Spring 2002 high school sophomores: Standard errors for current employment status and select financial indicators, by educational attainment: 2012
Educational attainment as of 2012
Financial indicator All 2002
sophomores
Less than high school completion
High school diploma or equivalent
Some postsecondary
enrollment1 Undergraduate
certificate Associate’s
degree
Bachelor’s degree or
higher Current employment status
Unemployed 0.41 2.89 1.23 0.72 1.17 1.26 0.39 Out-of-the-labor force 0.26 2.14 0.96 0.48 0.76 0.79 0.39 Working 0–34 hours/week 0.35 1.97 1.06 0.61 1.08 1.37 0.53 Working 35+ hours/week 0.54 2.89 1.71 0.90 1.51 1.70 0.70
2011 income from employment
$0–$1,999 0.41 2.88 1.41 0.79 1.10 1.19 0.50 $2,000–$14,999 0.39 2.51 1.24 0.86 1.32 1.51 0.69 $15,000–$24,999 0.42 2.11 1.16 0.82 1.52 1.47 0.63 $25,000–$39,999 0.50 2.38 1.12 0.82 1.45 1.77 0.79 $40,000+ 0.50 1.38 1.07 0.74 1.33 1.66 0.85
2011 income from sources other than
employment2 $0 0.55 3.53 1.42 0.95 1.65 1.68 0.93
$1–$999 0.26 1.80 0.70 0.53 0.77 0.84 0.39 $1,000–$2,999 0.33 2.43 1.05 0.62 0.87 1.00 0.59 $3,000+ 0.50 2.56 1.12 0.72 1.42 1.33 0.83
Received public assistance during 20112,3
Yes 0.50 3.69 1.58 0.87 1.56 1.63 0.41 No 0.50 3.69 1.58 0.87 1.56 1.63 0.41
Months unemployed since January 2009
0 0.51 2.92 1.49 0.86 1.70 1.78 0.82 1–5 0.40 2.48 1.18 0.76 1.30 1.24 0.73 6–11 0.33 2.26 1.07 0.53 1.12 0.93 0.58 12+ 0.36 2.63 1.17 0.66 1.17 1.30 0.38
See notes at end of table.

B-9
Table B-5. Spring 2002 high school sophomores: Standard errors for current employment status and select financial indicators, by educational attainment: 2012—Continued
Educational attainment as of 2012
Financial indicator All 2002
sophomores
Less than high school completion
High school diploma or equivalent
Some postsecondary
enrollment1 Undergraduate
certificate Associate’s
degree
Bachelor’s degree or
higher Lost a job since January 2006
Yes 0.59 3.71 1.88 1.00 1.74 1.89 0.76 No 0.59 3.71 1.88 1.00 1.74 1.89 0.76
Total debt2 $0 0.48 3.39 1.55 0.93 1.25 1.39 0.73
$1–$9,999 0.56 3.43 1.57 0.95 1.73 1.52 0.58 $10,000–$29,999 0.56 2.65 1.35 1.00 1.77 1.80 0.78 $30,000+ 0.51 1.75 1.02 0.76 1.48 1.77 0.94
Rating of financial stress4 Not at all stressful5 0.43 2.63 1.40 0.75 1.20 1.34 0.69
Somewhat stressful6 0.59 3.29 1.85 0.95 1.82 1.98 0.89 Extremely stressful7 0.47 3.17 1.52 0.81 1.52 1.81 0.67
1Some postsecondary enrollment, but no postsecondary credential. 2Includes sample member as well as sample member’s spouse (if married) or partner (if living with significant other in a marriage-like relationship). 3“Public assistance” includes Supplemental Security Income (SSI), SNAP (the Food Stamp Program), TANF (the Temporary Assistance for Needy Families Program), the Free and Reduced Price School Lunch Program, or WIC (the Special Supplemental Nutrition Program for Women, Infants, and Children). 4Respondents were asked “Many young adults experience financial problems. On a scale of 1 to 5, where 1 means ‘Not at all stressful’ and 5 means ‘Extremely stressful,’ how much stress have you felt in meeting your financial obligations during the past year?” 5Responses of “1” on the above scale. 6Responses of “2,” “3,” or “4” on the above scale. 7Responses of “5” on the above scale. SOURCE: U.S. Department of Education, Institute of Education Sciences, National Center for Education Statistics. Education Longitudinal Study of 2002 (ELS:2002) Third Follow-up Public-Use File (NCES 2014-365).

B-10
Table B-6. Spring 2002 high school sophomores currently working for pay: Standard errors for select characteristics of current job, by educational attainment: 2012
All currently working 2002 sophomores
Educational attainment as of 2012
Characteristic
Less than high school completion
High school diploma or equivalent
Some postsecondary
enrollment1 Undergraduate
certificate Associate’s
degree
Bachelor’s degree or
higher Earnings at current job2
$0–$7.24 per hour 0.22 2.58 0.58 0.52 0.61 0.70 0.26 $7.25–$9.99 per hour 0.48 3.89 1.75 0.93 1.57 1.41 0.55 $10.00–$14.99 per hour 0.66 4.48 1.98 1.22 2.10 2.05 0.91 $15.00–$19.99 per hour 0.56 3.03 1.52 0.91 1.52 1.65 0.87 $20.00+ per hour 0.65 1.86 1.40 0.87 1.67 1.93 1.06
Current employer offers medical insurance3 Yes 0.61 3.95 2.08 1.19 1.86 1.65 0.72
No 0.61 3.95 2.08 1.19 1.86 1.65 0.72
Relationship between current job and career goals Current job fulfills career goals 0.42 2.33 1.06 0.59 1.41 1.50 0.65
Current job is a step on path toward career goals 0.69 3.75 2.10 1.23 1.93 2.26 0.87 Neither 0.70 4.02 1.95 1.22 1.84 2.20 0.74
Satisfaction with current job4 Highest quartile 0.53 3.85 1.74 0.96 1.95 1.83 0.77
Middle two quartiles 0.66 4.07 2.04 1.24 2.21 2.12 0.96 Lowest quartile 0.54 3.47 1.78 1.14 1.69 2.06 0.84
Persistence intentions at current job5 Highest quartile 0.56 3.99 1.89 1.01 1.80 1.96 0.90
Middle two quartiles 0.70 4.62 1.91 1.24 2.36 2.12 0.93 Lowest quartile 0.55 3.08 1.52 0.97 1.82 1.78 0.88
See notes at end of table.
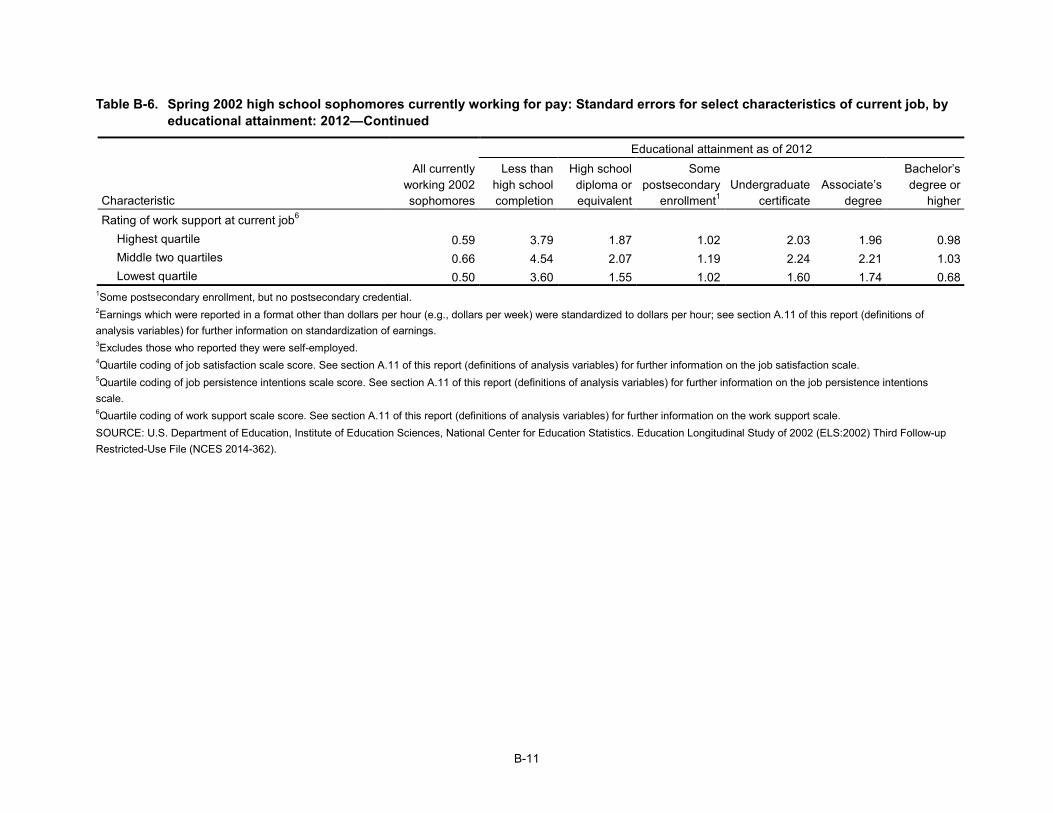
B-11
Table B-6. Spring 2002 high school sophomores currently working for pay: Standard errors for select characteristics of current job, by educational attainment: 2012—Continued
All currently working 2002 sophomores
Educational attainment as of 2012
Characteristic
Less than high school completion
High school diploma or equivalent
Some postsecondary
enrollment1 Undergraduate
certificate Associate’s
degree
Bachelor’s degree or
higher Rating of work support at current job6
Highest quartile 0.59 3.79 1.87 1.02 2.03 1.96 0.98 Middle two quartiles 0.66 4.54 2.07 1.19 2.24 2.21 1.03 Lowest quartile 0.50 3.60 1.55 1.02 1.60 1.74 0.68
1Some postsecondary enrollment, but no postsecondary credential. 2Earnings which were reported in a format other than dollars per hour (e.g., dollars per week) were standardized to dollars per hour; see section A.11 of this report (definitions of analysis variables) for further information on standardization of earnings. 3Excludes those who reported they were self-employed. 4Quartile coding of job satisfaction scale score. See section A.11 of this report (definitions of analysis variables) for further information on the job satisfaction scale. 5Quartile coding of job persistence intentions scale score. See section A.11 of this report (definitions of analysis variables) for further information on the job persistence intentions scale. 6Quartile coding of work support scale score. See section A.11 of this report (definitions of analysis variables) for further information on the work support scale. SOURCE: U.S. Department of Education, Institute of Education Sciences, National Center for Education Statistics. Education Longitudinal Study of 2002 (ELS:2002) Third Follow-up Restricted-Use File (NCES 2014-362).
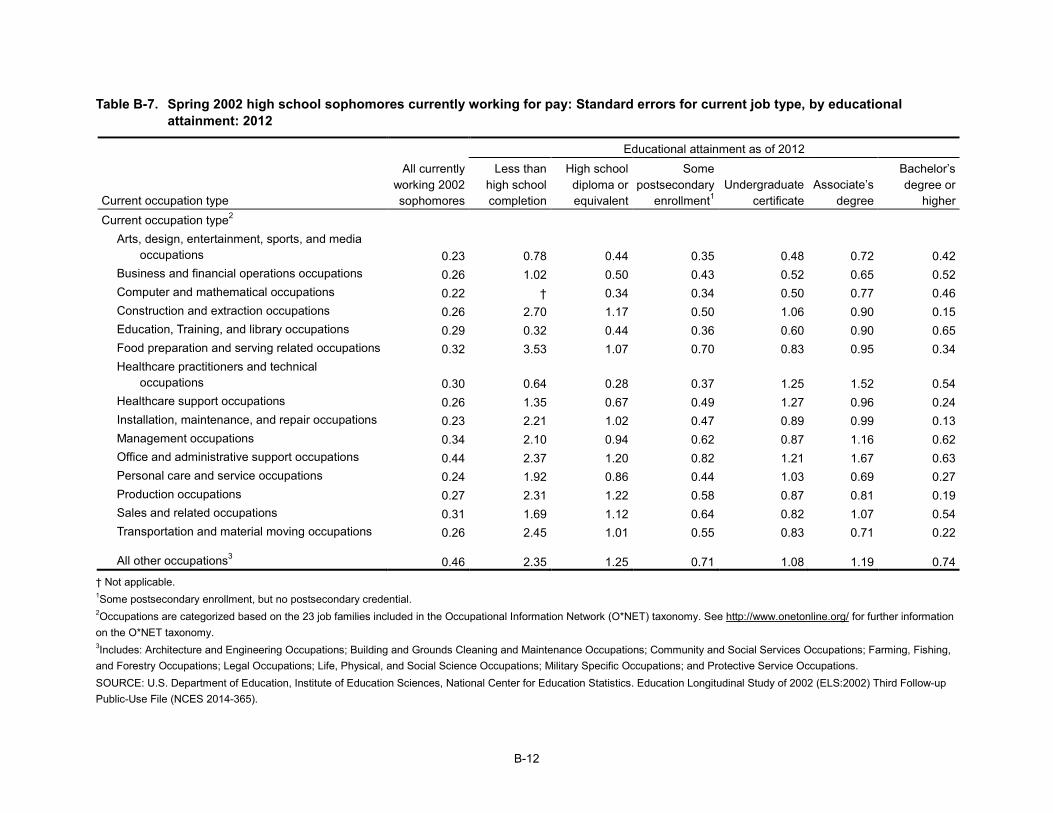
B-12
Table B-7. Spring 2002 high school sophomores currently working for pay: Standard errors for current job type, by educational attainment: 2012
All currently working 2002 sophomores
Educational attainment as of 2012
Current occupation type
Less than high school completion
High school diploma or equivalent
Some postsecondary
enrollment1 Undergraduate
certificate Associate’s
degree
Bachelor’s degree or
higher Current occupation type2
Arts, design, entertainment, sports, and media occupations 0.23 0.78 0.44 0.35 0.48 0.72 0.42
Business and financial operations occupations 0.26 1.02 0.50 0.43 0.52 0.65 0.52 Computer and mathematical occupations 0.22 † 0.34 0.34 0.50 0.77 0.46 Construction and extraction occupations 0.26 2.70 1.17 0.50 1.06 0.90 0.15 Education, Training, and library occupations 0.29 0.32 0.44 0.36 0.60 0.90 0.65 Food preparation and serving related occupations 0.32 3.53 1.07 0.70 0.83 0.95 0.34 Healthcare practitioners and technical
occupations 0.30 0.64 0.28 0.37 1.25 1.52 0.54 Healthcare support occupations 0.26 1.35 0.67 0.49 1.27 0.96 0.24 Installation, maintenance, and repair occupations 0.23 2.21 1.02 0.47 0.89 0.99 0.13 Management occupations 0.34 2.10 0.94 0.62 0.87 1.16 0.62 Office and administrative support occupations 0.44 2.37 1.20 0.82 1.21 1.67 0.63 Personal care and service occupations 0.24 1.92 0.86 0.44 1.03 0.69 0.27 Production occupations 0.27 2.31 1.22 0.58 0.87 0.81 0.19 Sales and related occupations 0.31 1.69 1.12 0.64 0.82 1.07 0.54 Transportation and material moving occupations 0.26 2.45 1.01 0.55 0.83 0.71 0.22
All other occupations3 0.46 2.35 1.25 0.71 1.08 1.19 0.74
† Not applicable. 1Some postsecondary enrollment, but no postsecondary credential. 2Occupations are categorized based on the 23 job families included in the Occupational Information Network (O*NET) taxonomy. See http://www.onetonline.org/ for further information on the O*NET taxonomy. 3Includes: Architecture and Engineering Occupations; Building and Grounds Cleaning and Maintenance Occupations; Community and Social Services Occupations; Farming, Fishing, and Forestry Occupations; Legal Occupations; Life, Physical, and Social Science Occupations; Military Specific Occupations; and Protective Service Occupations. SOURCE: U.S. Department of Education, Institute of Education Sciences, National Center for Education Statistics. Education Longitudinal Study of 2002 (ELS:2002) Third Follow-up Public-Use File (NCES 2014-365).
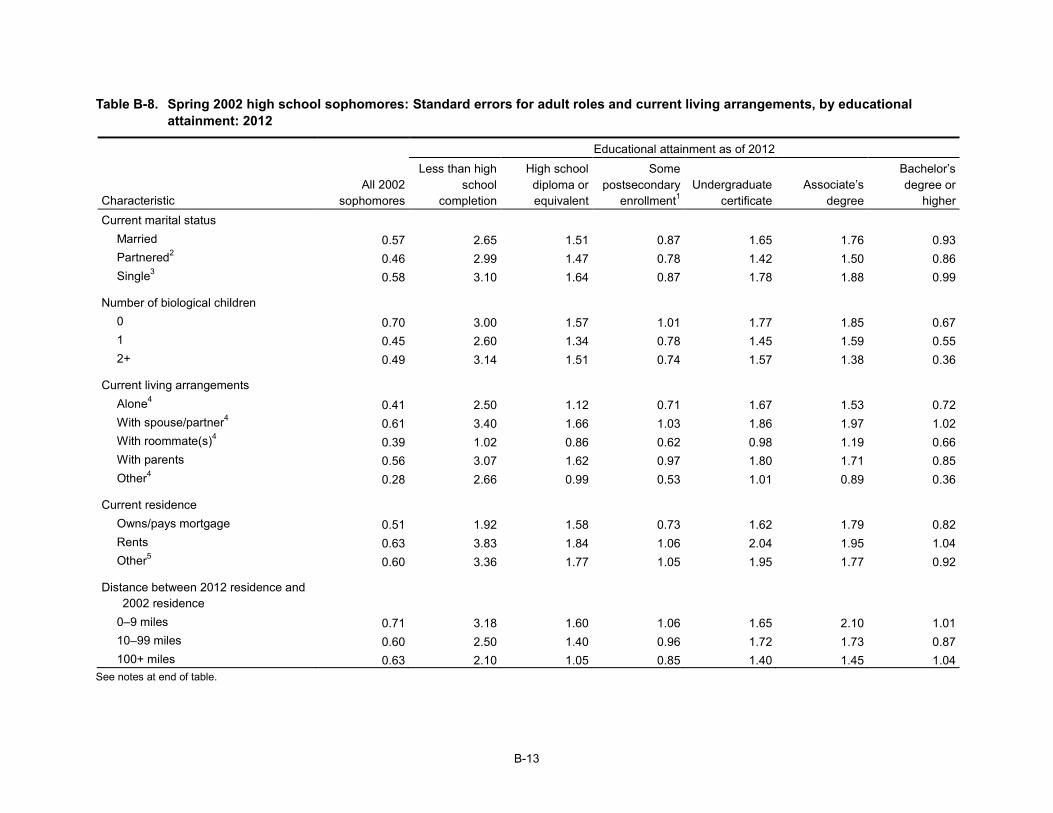
B-13
Table B-8. Spring 2002 high school sophomores: Standard errors for adult roles and current living arrangements, by educational attainment: 2012
Educational attainment as of 2012
Characteristic All 2002
sophomores
Less than high school
completion
High school diploma or equivalent
Some postsecondary
enrollment1 Undergraduate
certificate Associate’s
degree
Bachelor’s degree or
higher Current marital status
Married 0.57 2.65 1.51 0.87 1.65 1.76 0.93 Partnered2 0.46 2.99 1.47 0.78 1.42 1.50 0.86 Single3 0.58 3.10 1.64 0.87 1.78 1.88 0.99
Number of biological children 0 0.70 3.00 1.57 1.01 1.77 1.85 0.67
1 0.45 2.60 1.34 0.78 1.45 1.59 0.55 2+ 0.49 3.14 1.51 0.74 1.57 1.38 0.36
Current living arrangements Alone4 0.41 2.50 1.12 0.71 1.67 1.53 0.72
With spouse/partner4 0.61 3.40 1.66 1.03 1.86 1.97 1.02 With roommate(s)4 0.39 1.02 0.86 0.62 0.98 1.19 0.66 With parents 0.56 3.07 1.62 0.97 1.80 1.71 0.85 Other4 0.28 2.66 0.99 0.53 1.01 0.89 0.36
Current residence Owns/pays mortgage 0.51 1.92 1.58 0.73 1.62 1.79 0.82
Rents 0.63 3.83 1.84 1.06 2.04 1.95 1.04 Other5 0.60 3.36 1.77 1.05 1.95 1.77 0.92
Distance between 2012 residence and 2002 residence
0–9 miles 0.71 3.18 1.60 1.06 1.65 2.10 1.01 10–99 miles 0.60 2.50 1.40 0.96 1.72 1.73 0.87 100+ miles 0.63 2.10 1.05 0.85 1.40 1.45 1.04
See notes at end of table.

B-14
Table B-8. Spring 2002 high school sophomores: Standard errors for adult roles and current living arrangements, by educational attainment: 2012—Continued
Educational attainment as of 2012
Characteristic All 2002
sophomores
Less than high school
completion
High school diploma or equivalent
Some postsecondary
enrollment1 Undergraduate
certificate Associate’s
degree
Bachelor’s degree or
higher Region of 2012 residence6
Northeast 0.61 2.70 1.34 0.87 1.47 1.41 0.90 Midwest 0.62 3.03 1.40 0.93 1.64 1.77 0.95 South 0.70 3.65 1.83 1.10 1.79 1.97 0.96 West 0.70 3.57 1.56 1.12 1.58 2.05 1.05
SES quartile as of 2012 Lowest quartile 0.64 2.11 1.60 0.93 1.21 0.49 †
Middle two quartiles 0.59 2.09 1.59 0.99 1.63 1.88 0.98 Highest quartile 0.65 0.19 0.27 0.36 1.11 1.78 0.98
† Not applicable. 1Some postsecondary enrollment, but no postsecondary credential. 2Living with a significant other in a marriage-like relationship. 3Not partnered, and either never married, divorced, separated, or widowed. 4Not with parents. 5Includes living with parents. 6The Northeast region includes CT, MA, ME, NH, NJ, NY, PA, RI, and VT. The Midwest includes IA, IL, IN, KS, MI, MN, MO, ND, NE, OH, SD, and WI. The South includes AL, AR, DC, DE, FL, GA, KY, LA, MD, MS, NC, OK, SC, TN, TX, VA, and WV. The West includes AK, AZ, CA, CO, HI, ID, MT, NM, NV, OR, UT, WA, and WY. NOTE: SES = socioeconomic status. SOURCE: U.S. Department of Education, Institute of Education Sciences, National Center for Education Statistics. Education Longitudinal Study of 2002 (ELS:2002) Third Follow-up Public-Use File (NCES 2014-365).

B-15
Table B-9. Standard errors for current employment and enrollment status of spring 2002 high school sophomores, by experience in postsecondary education: 2012
Experience in postsecondary education
Characteristic Overall
No postsecondary
enrollment
Associate’s degree, undergraduate certificate, or some postsecondary
enrollment but no postsecondary credential
Bachelor’s degree or
higher Overall † 0.54 0.58 0.74
Working for pay, not enrolled 0.54 1.37 0.80 0.79 Enrolled, not working for pay 0.23 † 0.41 0.33 Working for pay and enrolled 0.41 † 0.67 0.70 Unemployed 0.37 1.17 0.47 0.35 Out of the labor force 0.21 0.86 0.26 0.23
† Not applicable. SOURCE: U.S. Department of Education, Institute of Education Sciences, National Center for Education Statistics. Education Longitudinal Study of 2002 (ELS:2002) Third Follow-up Public-Use File (NCES 2014-365).