education, cognition and health: evidence from a social
TRANSCRIPT

NBER WORKING PAPER SERIES
EDUCATION, COGNITION AND HEALTH:EVIDENCE FROM A SOCIAL EXPERIMENT
Costas MeghirMårten Palme
Emilia Simeonova
Working Paper 19002http://www.nber.org/papers/w19002
NATIONAL BUREAU OF ECONOMIC RESEARCH1050 Massachusetts Avenue
Cambridge, MA 02138April 2013
Financial support from the IFAU is gratefully acknowledged. Costas Meghir thanks the ISPSS andthe Cowles foundation for financial assistance. The usual disclaimer applies. The views expressedherein are those of the authors and do not necessarily reflect the views of the National Bureau of EconomicResearch.
NBER working papers are circulated for discussion and comment purposes. They have not been peer-reviewed or been subject to the review by the NBER Board of Directors that accompanies officialNBER publications.
© 2013 by Costas Meghir, Mårten Palme, and Emilia Simeonova. All rights reserved. Short sectionsof text, not to exceed two paragraphs, may be quoted without explicit permission provided that fullcredit, including © notice, is given to the source.

Education, Cognition and Health: Evidence from a Social ExperimentCostas Meghir, Mårten Palme, and Emilia SimeonovaNBER Working Paper No. 19002April 2013JEL No. I12,I14,J48
ABSTRACT
In this paper we examine how an education policy intervention - the introduction of a comprehensiveschool in Sweden that increased the number of compulsory years of schooling, affected cognitiveand non-cognitive skills and long-term health. We use detailed administrative data combined withsurvey information to create a data set with background information, child ability and long-term adultoutcomes. We show that extra education results in significant gains in skills among children, but theeffects on long-term health are overall negligible. However, we demonstrate that the schooling reformhad heterogeneous effects across family socio-economic backgrounds and initial skill endowments,with significant improvements in cognition and skills for lower Socio-economic status individuals andlower ability people.
Costas MeghirDepartment of EconomicsYale University37 Hillhouse AvenueNew Haven, CT 06511and IZAand also [email protected]
Mårten PalmeDepartment of EconomicsStockholm UniversitySE-106 91 StockholmSWEDENand [email protected]
Emilia SimeonovaDepartment of EconomicsPrinceton University355 Wallace HallPrinceton, NJ 08540and [email protected]

2
1. Introduction
Cognition and health are important determinants of human capital, which drives earnings
potential and ultimately standards of living. However, there are significant inequalities in both
cognitive and non-cognitive skills as well as health related to parental socio-economic status in
all societies that have been studied.4 This affects equality of opportunity, causes poverty and
holds back upward social mobility. If education policy can have an impact on these inequalities,
it could affect not only the distribution of income and human capital in the generation directly
targeted by the reform, but also in future generations. Previous research has shown that the
distribution of skills and health can have a long intergenerational memory (Currie, 2009; Almond
and Currie, 2011; Lindahl et al., 2013). In this study we bring new estimates of the impact of
schooling reform on cognitive skills, non-cognitive skills and health by parental background and
by early ability, presenting evidence on the ability of public policy to affect children’s human
capital development and thus longer-term outcomes in society.5
Thus, the question we ask in this paper is how do improvements in the quantity (and quality) of
schooling induced by education reform targeting teenagers affect human capital accumulation;
and importantly, do the effects differ depending on the socio-economic background and early
ability of the child. In particular we consider how education reform affects cognitive skill, non-
cognitive skill and long-term health, all of which are elements of human capital that affect
earnings and well being more generally, by types of parental education and early ability scores of
the children
To consider this important issue we use the quasi-experimental variation induced by a major
educational reform in Sweden that was gradually introduced from 1949 to 1962. A key element
of the education reform was to increase compulsory schooling by one or two years, depending
municipality. We set up a unique data set from both administrative and survey sources. For two
cohorts (1948 and 1953) our data includes cognitive tests at ages 12 and 18 as well as non-
cognitive tests. For all cohorts born between 1946 and 1957 we have detailed health and
mortality information and importantly for our purposes we also have parental education. Using
4 Carneiro and Heckman, 2003; Cunha, Heckman, Lochner and Masterov, 2006; Case, Lubotsky and Paxson, 2002; and Currie, 2009 5 The issues we analyze have a direct bearing on the debate surrounding the Bell curve. See Hernstein and Murray (1994) and Heckman (1995).

3
this larger and rich data we estimate the effect of the reform on health.6 We thus consider whether
such a major educational reform was able to affect these key elements of human capital.
An important contribution of our research relates to the impact of interventions relatively late in a
child’s life and the more general question of the appropriate timing of interventions in human
capital. There exists evidence that investments in human capital at early ages (such as during the
pre-school years) can have positive and lasting effects on skills and labor market success (see the
review by Cunha et al, 2006). Importantly, early interventions have been shown to be
complementary with later ones (see, Cunha, Heckman and Schennach, 2010). With this in mind,
it is important to show the extent to which interventions targeting teens and particularly those
from lower socio-economic background can be effective.
Previous research has also demonstrated that extra education obtained as late as the teenage years
could have positive effects on cognitive skills as measured by the Armed Forces Qualification
Test (AFQT). The AFQT is an appealing comparative test measure as it is administered around
the same age as the Swedish Army draft tests and purports to measure similar skills. Hansen,
Heckman and Mullen (2004) find that on average, one additional year of schooling in high school
results in an increase of 0.16 to 0.19 standard deviations in the AFQT score. They also report that
the effects are larger for years of schooling attained before the 9th grade (as in this research) than
in grades 10-12. Cascio and Lewis (2006) use National Longitudinal Survey of Youth (NLSY)
’79 data and differences in schooling attainment arising from school-entry cutoff dates to show
that an extra year of schooling increases minorities’ achievement on the AFQT by one third of a
standard deviation.
Higher AFQT scores are strongly correlated with labor market success in the US. Neal and
Johnson (1996) report that one standard deviation difference in AFQT scores increases log male
earnings by around 0.17 log points in a sample of NLSY youth. Carneiro et al (2006) add extra
years of observation and show that the effect becomes stronger over time. The estimated effects
of AFQT on wages in the US are about 50% larger than the comparable estimates for Sweden,
where we use army draft cognitive tests results to proxy for cognitive ability. This is not
surprising given the compressed wage distribution in Sweden compared to the US. Our estimates
are almost identical with those of Lindqvist and Vestman (2011), who also use Swedish data. 6 See Grossman (2006), Cutler and Lleras-Muney (2008) and Case, Fertig and Paxson (2005)

4
All previous large-sample studies examining the causal relationship between education and health
with a credible identification strategy7 do not investigate differences relating to socioeconomic
background. This poses the question as to whether the effects of compulsory schooling reforms
and generally of interventions that are most likely to affect lower socio-economic status (SES) 8
individuals are missed when averaged with the effects on higher SES groups that are unaffected.
Moreover, given the literature on the complementarity of interventions across stages of childhood
it is also important to be able to examine the heterogeneity of effects across different prior ability
groups.9 Our study is able to offer some evidence on whether and in what dimensions family
background is important.
The results show that the Swedish compulsory schooling reform had a significant positive effect
on the cognitive skills of men of military enlistment age (18-19 years old). The average
individual experienced an increase of seven to ten percent of a standard deviation with the
strongest gains accruing to boys coming from low SES families and with low initial cognitive
skills measured pre-reform in the 6th school grade. This is an important result because it shows
that keeping potential school dropouts as a group longer in school can have beneficial effects on
basic cognitive skills. For the higher SES group there is no effect either on their school
attendance or on their cognition; there is however a large improvement in their non-cognitive
skills, possibly because now they are attending non-selective schools with children from a
broader range of backgrounds.
The effects on health are either zero or very small both for the whole population and for
individuals from a lower SES background. The results are consistent across various different
measures, including mortality, hospitalization and receipt of sick pay, all of which show either no 7 Lleras-Muney, 2005 considers the case of the US in the first half of the 20th century, when many states increased the number of years children had to attend school. Her results imply that an extra year of schooling reduces the 10-year mortality rate by over 6 percentage points given a mean mortality rate of ten percent. Mazumder (2008) revisits these results by including state-specific time trends that significantly diminish the estimated coefficients. Also see the corrigendum to Lleras-Muney’s original 2005 paper on her website http://www.econ.ucla.edu/alleras/research/papers/8523_Lleras_Correction.pdf. Oreopoulos (2006) uses an RD approach and finds beneficial effects of education on health in the UK as a result of increases in compulsory schooling. However, Royer and Clark (2012) find no effect. Spasojevic (2010) and Lager and Torssander (2012) estimate the average health effect of the education reform under study in this paper. See Cutler and Lleras-Muney (2011) and Mazumder (2012) for a review. 8 Whenever we refer to lower SES individuals we mean those whose father had just the compulsory schooling of their generation. 9 A recent study by Brinch and Galloway (2012) from Norway uses population data to identify the effects of education on cognitive and non-cognitive skills but also ignores such background heterogeneity.

5
effect or negligible improvements. Perhaps the only exception is a significant and reasonably
large (but imprecisely estimated) decline in mortality for low-ability individuals. This is
important because it is this group that such interventions are meant to benefit and highlights the
importance of allowing for heterogeneity of effects in important dimensions. Further research
should seek to corroborate this result in other data sets so as to establish whether it is indeed a
general result.
2. The Comprehensive School Reform
3.1. The Swedish school system before and after the reform
Prior to the implementation of the comprehensive school reform, pupils attended a
common basic compulsory school (folkskolan) until grade six. After the sixth grade pupils were
selected to continue either for one or, in mainly urban areas, two years in the basic compulsory
school, or to attend the three year junior secondary school (realskolan). The selection of pupils
into the two different school tracks was based on their past performance, measured by grades.
The pre-reform compulsory school was in most cases administered at the municipality level. The
junior secondary school was a prerequisite for the subsequent upper secondary school, which was
itself required for higher education.
In 1948 a parliamentary committee proposed a school reform that implemented a new
nine-year compulsory comprehensive school.10 The comprehensive school reform had three main
elements:
1. An extension of the number of years of compulsory schooling to 9 years in the entire
country.
2. Abolition of early selection. Although pupils in the comprehensive schools were able to
choose between three tracks after the sixth grade - one track including vocational training,
a general track, and an academic level preparing for later upper secondary school - they
were kept in common schools and classes until the ninth grade.
10 The school reform and its development are described in Meghir and Palme (2003), Meghir and Palme (2005), and Holmlund (2007). For more detailed reference on the reform, see Marklund (1981).

6
3. Introduction of a national curriculum. The pre-reform compulsory schools were
administrated by municipalities and the pre-reform curriculum varied between
municipalities.
3.2. The social experiment
The social experiment with the new comprehensive nine-year compulsory school started
during an assessment period between 1949 and 1962, when the final curriculum was decided.11
The proposed new school system, as described above, was introduced in municipalities or parts
of city communities, which in 1952 numbered 1,055 (including 18 city communities). Figure 1
shows the take up rate of the experiment by cohort. It is evident from Figure 1 that the cohorts
included in our empirical analysis, born between 1946 and 1957, cover the entire period of
implementation of the comprehensive school. In 1962 it was decided that the new comprehensive
school would become the standard education in Sweden. The last class that graduated from the
old schooling system did so in 1970.12
The selection of municipalities was not based on random assignment. However, the
decision to select the areas was based on an attempt to choose locations that were representative
for the entire country, both in terms of demographics as well as geographically. At first the
National Board of Education contacted the municipalities, or sometimes they themselves applied
to participate. From this pool of applicants a "representative" sample of municipalities was
chosen. Municipalities could elect to implement the comprehensive school starting with first or
fifth grade cohorts. Once the grade of implementation was fixed, all individuals from the cohort
immediately affected and all subsequent cohorts went to comprehensive school. The older
cohorts continued in the pre-reform school.
11 The official evaluation was mainly of administrative nature. Details on this evaluation are also described in Marklund (1981). 12 Table A1 in the appendix shows the number of observations in each birth cohort and the proportion assigned to the reform.

7
Figure 1: Percentage share of birth cohort assigned to the post reform (comprehensive) school system.
Meghir and Palme (2005) and Holmlund (2007) study the effect of the comprehensive school
reform on educational attainments.13 Meghir and Palme’s (2005) estimates for their entire sample
are 0.252 additional years for males and 0.339 years for females; for low SES persons, i.e. those
whose father had just the statutory schooling of their generation, the estimates are 0.3 extra years
for males and 0.512 for females. Holmlund has estimates in the range 0.21-0.61 additional years
of schooling for men and 0.13-0.44 for women.
3. Data and Measurement
Our dataset combines survey data on a random subset of individuals born in 1948 and 1953
together with various sources of administrative data on the population of men born between 1946
and 1957 to link information on income, schooling, military tests and health. In all our analysis
we exclude data from Stockholm, where assignment of reform status based on location of birth is
not possible.
The data for the 1948 and 1953 cohorts was originally obtained by the Individual
Statistics (IS) project of the Institute for Education at the University of Göteborg (see Härnqvist,
1968 and 1997, for an overview of the project). These data include all children born on the 5th, 13 Holmlund (2007) does not have individual treatment status and imputes it from municipality of residence in 1960.

8
15th or 25th in each month – accounting for about 10 percent of each cohort – and were collected
when the respondents were in 6th grade, in the spring of 1961 and 1966 for the 1948 and the 1953
cohorts, respectively. The data include information on the educational level of children’s parents
as reported by the children, administrative information on grades in Swedish, English, and
Mathematics, as well as results from three cognitive (IQ) skills tests – number series (math),
opposites (verbal), and a visual/spatial IQ test called “folding”. We use these cognitive tests to
construct a measure of cognitive ability for individuals in 6th grade based on the cumulative score
obtained. The score on each test ranges from 1 (lowest) to 40 (highest). The highest cumulative
score obtainable is 120. A more detailed description of the cognitive skills tests can be found in
the Appendix. The measure we use is based on the original score, but standardized to have mean
zero and unit standard deviation. We construct separate standardized score measures for the two
cohorts, so that each child is compared only to children from the same birth cohort.
The second source of data is The Swedish Army draft tests. All Swedish males are required to
take the Army Enlistment tests in their 18th or 19th year. The enlistment exams include a detailed
physical exam, a battery of cognitive ability tests, and an interview with a psychologist. There are
four types of cognitive tests – a verbal test, a test of spatial and visual intelligence called “metal
folding” in Swedish, technical comprehension and logic. An assessment of non-cognitive skills is
given after an interview with trained psychologist. The interview is based on a manual that
specifies topics to be discussed and conducted as a guided conversation between the psychologist
and the conscript. The purpose of the interview is to assess young men’s ability to cope with the
stress of military service and their expected performance in case of war14. Military experts
realized early on that social skills are important in generating group cohesion, and therefore men
who were thought incapable of functioning well in a social group were considered unfit for
military service. The nature of the assessment emphasizes social skills, thus we use non-cognitive
skills and social skills interchangeably in the text.
14 These include: willingness to assume responsibility, independence, outgoing character, persistence, emotional stability, initiative (see Linqvist and Vestman, 2011). Difficulty accepting authority and violent aggressive behavior are among the negative characteristics psychologists look to identify. Obsession with the army and military topics is considered a negative trait (see Linqvist and Vestman, 2011).

9
Table 1: Descriptive statistics of the 6th grade and Army draft data
Schooling and skills 1948 cohort 1953 cohort Variable No reform Reform No reform Reform Verbal IQ 6th grade test 21.97 22.13 22.51 23.76 [6.85] [6.91] [6.79] [6.62] Spatial IQ 6th grade test 21.39 21.91 21.30 22.67 [7.44] [7.66] [7.60] [7.58] Maths IQ 6th grade test 19.43 19.66 19.10 20.59 [8.02] [8.14] [8.16] [8.21] Army test verbal score 27.30 28.01 24.24 25.23 [5.58] [5.50] [5.49] [5.32] Army test visual score 22.28 23.06 21.85 23.50 [6.24] [5.93] [6.21] [6.07] Army test technical score 12.13 12.55 13.59 14.04 [4.25] [4.18] [3.82] [3.77] Army test logic score 32.75 33.59 31.93 32.69 [7.89] [7.90] [7.85] [7.95] Composite army cognitive score 62.80 63.72 62.92 67.02 [17.95] [18.53] [18.33] [18.19] Non cognitive skill assessment+ 5.16 5.40 4.83 5.26 Army (scale 1-9) [1.78] [1.74] [1.98] [1.94] Father's education > compulsory 11.5% 15.5% 12.4% 19.2% Completed years of schooling in ‘00 11.1 11.8 10.7 11.5 Old compulsory level 24% 4% 23% 2% New compulsory level 9% 22% 19% 35% Vocational school15 27% 30% 27% 27% Higher education16 40% 44% 31% 36% Sample size 3201 1431 829 3195 Labor market outcomes panel Mean labor earnings in ‘000 SEK 190.6 205.5 168.5 185.8 (period: 1985-2005) [106.7] [116.5] [90.1] [104] Sample size 45760 23232 13232 55776 +Note: non-cognitive skill assessment for the 1948 cohort is conditional on a cognitive skills score being above the mean
15 Old compulsory school is 7 or 8 years of education, depending on municipality; new compulsory school is 9 years nation-wide; vocational school is schooling beyond 9 years of education (but less than college) that includes vocational training. Note that only academic high school completion enables students to apply for college. 16 Includes: completed high school, some college, college, and post-graduate education

10
In the early years when the non-cognitive skills component was first assessed, such
as in the 1948 cohort we study here, only men who scored above average in the cognitive skills
tests were also interviewed by psychologists. This rule was abolished over time and in the 1953
cohort all men had to sit for both types of assessment. Importantly, a draftee could not avoid
being called for service by flunking the cognitive test. The cognitive skills test could only affect
the type of unit one was called to serve in. On the other hand, obtaining a very bad score on the
non-cognitive test could potentially lead to being judged unfit for military service. A very bad
non-cognitive skills test score would indicate that the interviewer noticed serious anti-social and
potentially dangerous traits in the draftee that could make him unfit to bear arms. Lindqvist and
Vestman (2011) offer a detailed explanation of background leading to the introduction of these
tests, as well as some evidence that bad non-cognitive skills were deemed somewhat important in
the draft decision.
The cognitive skills tests consisted of 40 questions each. A draftee could obtain a maximum score
of 160. A detailed description of the cognitive tests components can be found in the Appendix.
Similarly to the 6th grade cognitive measure, we construct a cognitive abilities measure based on
the Army draft cognitive scores. We take the simple sum of all four Army tests and standardize
the resulting score to have a mean of zero and unit standard deviation. We construct separate
standardized scores for the two cohorts, so that each young man is only compared to young men
born in the same year.
Basic descriptive statistics for the 6th grade and Army draft data are presented in Table 1. The
data are split by birth cohort and reform status.17 The key conclusion from this table is that the
differences in average 6th grade cognitive skill tests scores between the reform and the non-
reform groups (which were taken at a stage of schooling not affected by the reform) are minimal
for both the 1948 and 1953 cohort.
While we will be basing our estimation strategy on a difference-in-differences approach, which
allows the distribution of baseline characteristics to differ between reform and non-reform
municipalities, such similarity does reinforce the validity of the empirical strategy. Nevertheless,
17 For variables that can be affected by the reform no causal interpretation should be given at this point because we need to control for municipality effects through a difference-in-differences strategy as the reform was not randomly allocated.

11
the need to control for differences across reform and non-reform municipalities becomes apparent
when we notice that the individuals assigned to the reform during the experiment tend to have a
higher socio-economic background (SES) as reflected in the average education of their fathers.
Data on educational attainments is obtained from the 1990 Swedish education register, containing
detailed information on the highest education obtained by each individual in 1990. Data on
educational attainment of the parent generation is obtained from the 1970 census. Since this
census only contains information on all individuals of age 60 and younger, we are missing
information on all parents who were older, deceased or had permanently emigrated by 1970. We
code family socio-economic status based on the father’s highest level of education. If the father
had any education beyond the basic compulsory level, we code the child as coming from a high
socio-economic status family. If the father had only the minimum required level of education (7
years), the child is coded as low SES.
The fourth source of data is the Swedish population censuses, which we use to estimate
the effects of extra schooling on long-term health. The sample comprises all individuals born in
Sweden between 1946 and 1957. These cohorts consist of 1,461,785 individuals, of whom
746,201 are males and 715,584 are females. Information on reform status is available for 745,330
men and 714,694 women. The reform assignment variable is obtained in two steps. First, we use
the name of the church parish of birth in order to obtain the municipality code according to the
1953 Swedish municipality division. Second, based on the year and municipality of birth, we use
an algorithm based on historical evidence on reform implementation in each municipality
provided by Helena Holmlund and described in Holmlund (2007) to assign reform status to each
individual in the sample. We also use information on the parents of these individuals. Identities of
the parents were obtained from the multi-generation register provided by Statistics Sweden.18
Data on date of death is obtained from the national Cause of death register
(Socialstyrelsen, 2009a). This register contains the date and a three digit ICD 9 code for the main
underlying cause of death for all Swedish citizens. Mortality data for this sample are available
between 1985 and 2005. Thus we can only estimate effects on mortality between the ages of 28
18 Statistics Sweden (2003) Flergenerationregistret 2002. En beskrivning av innehåll och kvalitet. Statistics Sweden. Avdelning för Befolknings och Välfärdsstatistik.

12
and 60. While this puts age restrictions on the conclusions we draw using this sample, the period
does cover the most productive periods of a person’s life. Our mortality findings are
economically meaningful even though we do not observe mortality among older adults and the
elderly.
Data on all hospital admissions between 1987 and 2005 was collected from the Swedish
National Patient Register (Socialstyrelsen, 2009b) This register also contains administrative
information such as date of admission, number of days in hospital care as well as discharge
diagnoses classified according to the 9th and 10th versions of International Classification of
Diseases (ICD). The National Patient Register records a hospital admission only if it included an
overnight hospital stay. Emergency room visits and shorter-term (less than 24 hours) inpatient
stays are not recorded.
The data on sick-pay insurance income for each year between 1991 and 2006 comes from
the National Social Insurance Board registers including all transactions between the social
insurance administration and the insured citizens. These registers were matched to our original
sample. Sweden has a compulsory sick-pay insurance replacing foregone earnings from
temporarily lost work ability due to illnesses or other health deficiencies. The replacement level
is currently 80 percent of forgone earnings up to a social security ceiling, but has varied
somewhat during the period covered in the data (for a detailed description of the sick-pay
insurance system in Sweden, see Johansson and Palme, 1995 or 2005). A certificate from a
physician, certifying inability of the insured individual to do his or her regular work, is required
on the eighth day in the sickness spell. Payments for the first week in a sickness spell is provided
by the employer and consequently not included in our data.
Table 2 reports the basic characteristics of all men born in Sweden between 1946 and
1957 and educated in the two systems. The summary table is based on national data available
through different registries. Swedes who went through the old schooling system are older as the
reform was rolled out nationally over time. Those who went through the post-reform school
system obtained on average half a year more of education. The difference in education levels is,
as expected, most striking at the lowest educational level. We see the old compulsory schooling
level attained by only 2.7% of the treated vs. 19.9% of the untreated individuals. The second
largest difference between the two groups is in attaining education level 2, the new compulsory

13
level. Swedes affected by the reform are 8.8 percentage points more likely to attain that education
level compared to those who went through the old schooling system.
Table 2: Summary statistics of main outcomes and controls [standard deviations in square brackets]. Population of men born 1946-1957. Variable Non-Reform Reform Died by 2006 0.056 0.04 Died from cancer 0.011 0.007 Died from circulatory disease 0.0125 0.007 Died from preventable causes 0.0127 0.01 Died from treatable causes 0.0056 0.0034 Hospitalized from any cause 1986-2005 0.549 0.51 Hospitalized with cancer 0.036 0.022 Hospitalized with circulatory disease 0.132 0.092 Hospitalized with preventable disease 0.007 0.004 Hospitalized with treatable disease 0.185 0.157 Sick leave pay received 0.177 0.163 [0.382] [0.369] Average age in 2006 57 53 [2.43] [3.02] Number of Observations 324,945 420,087 Education panel Years of education 10.92 11.49 [3.00] [2.741] Old compulsory level of education 19.9% 2.7% New compulsory level 9.4% 18.2% Vocational education# 44% 48% Higher education 27% 31% Number of Observations 295,677 395,538 #Note: Vocational education is generally two years of occupational specific education after the compulsory level; Upper secondary educations is in most cases three years of general education required for entrance to higher education; Higher education is at least three years of post-upper secondary education.
We define the different cause of death categories as mutually exclusive. This means
that an ICD death code features in one category only. For example, death from lung cancer is
clearly due to cancer, but we have grouped lung cancer and liver cirrhosis under the preventable
causes of death category. That is why an individual who died from lung cancer would be
classified as having died from a preventable cause of death. At the same time, someone who died
from pancreatic cancer is classified as having died from a cancer-related cause. In Appendix

14
Table A2 we list the ICD causes of death that feature in each separate cause of death category as
defined in Table 2. The same grouping of diagnoses is used to define hospitalization by cause.
4. The Association between Education and Human Capital
As a descriptive device we document the relationship between our various outcome measures and
schooling. A summary of the results for cognitive test scores, mortality, hospitalizations and sick
pay are presented in Table 3. A year of education is associated with 17% of a standard deviation
improvement in test scores. It is also associated with better health: a year of education is
associated with a decline in the mortality hazard rate by about 10.5 percentage points (pp); a
decline in hospitalizations by 1.4pp and a decline of sick pay receipts by 1.9pp.
Table 3: Years of schooling, cognition and health (men only).
(1) (2) (3) (4) Cognitive test
scores Mortality Ever hospitalized
1986-2005 P(sick pay) in the
year
Sample ’48 and ’53 cohorts
Population Population Population panel
Years of education 0.1705*** 0.894*** -0.014*** -0.013*** 95% confidence interval
(0.16, 0.18) (0.88, 0.91) (-0.015, -0.013) (-0.0133, -0.0122)
N 7894 691756 691756 8842850 Model OLS Cox OLS OLS
All regressions include cohort dummies and municipality fixed effects Notes: reform status is assigned based on the municipality of birth; all municipalities included except Stockholm.* indicates significance at the 10% level, *** indicates significance at the 1%; all standard errors clustered on the municipality of birth level
The overall mortality rate up to 2006 in the population of men born 1946-1957 is 4.7 percent. An
additional year of schooling is associated with a reduction of the rate by 10.06 percent to 4.23
percent. In 1986 when our mortality data start, the average man from these cohorts could expect
to live for 228.7 months in the next 20 years ((1-0.047)*12 months*20 years). An additional year
of education is associated with an increase in life expectancy of about 1.2 months (expected
increase in months of life for someone with an extra year of education is (0.106*0.047)*12
months*20 years).
The mean hospitalization rate in the sample is 52 percent. According to the estimates in column
(3) of Table 3, an additional year of education is associated with a decline in the risk of ever

15
having been hospitalized in 20 years by 1.4 percentage points, equivalent to 2.7 percent of the
mean. An additional year of education decreases the probability of having taken any sick leave in
a year by 1.3 percentage points. This is a non-trivial 7.6 percent decrease from the mean rate of
17 percent.
Table 4: The association between cognitive and non-cognitive skills, labor market success mortality and hospitalization. Survey data from the ’48 and ’53 cohorts. (1) (2) (3) Log earnings 1985-1996 (OLS regression) Army cognitive score 0.117*** 0.096*** (standardized) (0.005) (0.006) Army non-cognitive 0.082*** 0.060*** score (standardized) (0.007) (0.007) Observations 86,883 69,640 69,640 R-squared 0.278 0.290 0.307 Mortality (Cox proportional hazard regression) Army cognitive skills 0.788*** 0.855 (0.706 - 0.880) (0.708 - 1.032) Army non-cognitive 0.834** 0.868* (social) skills (0.722 - 0.963) (0.745 - 1.012) (standardized) Hospitalization (Linear probability OLS regression) Army cognitive skills -0.04340*** -0.04334*** (standardized) (-0.0568 - -0.030) (-0.06282 - -0.02387) Army non-cognitive -0.02780*** -0.01702** skills (standardized) (-0.04164 - -0.01396) (-0.03225 - -0.00179) Observations 8,356 6,555 6,555 R-squared 0.12645 0.14605 0.15035 Note: Robust 95% confidence intervals in parentheses, clustered on the municipality of birth level; *significant at 10%; ** significant at 5%; *** significant at 1%.
These are all large effects and the extent to which they represent causal impacts, at least for those
affected by the reform at the lower end of the educational distribution, is what we set out to
investigate.
The estimated effect of an additional year of schooling on cognitive skills is also large and
important. As Table 4 demonstrates, one standard deviation increase in cognitive skills is
associated with an increase in lifetime earnings of about 11%. Increasing social skills as
measured by Army psychologists by one standard deviation is also associated with an increase in

16
earnings, but the effect is about 25 percent lower than the comparable estimate for cognitive
skills. Among individuals with identical measures of social skills, one standard deviation increase
in cognitive skills is associated with 9.6 percent increase in lifetime earnings. The lower panel of
Table 4 shows the correlations of cognitive and social skills with health outcomes. One standard
deviation positive change in cognitive skills is associated with over twenty percent reduction in
the mortality hazard, and over 4 percent decrease in the probability of ever having been
hospitalized.19 Interestingly, we obtain estimates of similar magnitude for social and cognitive
skills in the mortality regressions, while the estimates for hospitalization clearly show a larger
impact of cognitive skills.
5. Empirical Strategy
We have two data sets. One that includes all cohorts born between 1946-57 and one that
includes only the survey data for the 1948 and 1953 cohorts. Both data sets include information
from administrative sources. The 48/53 survey data is of interest because it contains information
on the military enlistment tests, which provide the cognitive and non-cognitive outcomes as well
as child ability measured at 12, which is a source of impact heterogeneity that we consider. This
measure of ability cannot have been affected by the reform. We present estimates from both data
sources, depending on the outcome and on the conditioning variables.
Our empirical analysis is based on difference-in-differences across municipalities and
cohorts. In particular we compare the evolution of outcomes across cohorts in municipalities that
introduced the reform for some of the younger cohorts but not the older ones (late adopters) to
those who introduced it for some or all of the older ones as well (early adopters). Underlying all
our specifications is a set of assumptions that justify difference–in-differences. Formally, using
the notation in Athey and Imbens (2006), denote the outcome in the untreated state by !! =
ℎ(!! ,!) and define mi as an unobservable characteristic. Its distribution may differ across
municipalities, but we require the distribution of this unobservable to be the same across cohorts
C. Moreover the function h has to be strictly monotonic in the unobservable m.20 These
assumptions allow different sorting of individuals in treatment and control municipalities, but this 19 See Cutler, Deaton and Lleras-Muney (2006) for a review of results on the determinants of mortality. 20 Discrete outcomes, which violate strict monotonicity, require further identifying assumptions.

17
sorting must be permanent and not change across cohorts being compared. Then the cohort effect
C reflects a trend over cohorts, which is common across municipalities. The fact we use the
municipality of birth to assign reform status rather than the actual municipality of treatment
strengthens the validity of this assumption because it controls for the composition effects that can
arise as people sort themselves into different locations as a result of the reform, thus avoiding
selection issues originating from differential endogenous mobility.21 As a result, he estimates
should be interpreted as the effect of the “intention to treat”.
In addition to these basic assumptions we also impose certain functional form restrictions. In
particular for mortality and mortality by cause we use Cox proportional hazards models and
competing risk models respectively, where it is straightforward to control for the 1000 or so
municipality fixed effects and the cohort effects, using the principle of the partial likelihood (see
Cox and Oates, 1984). The fixed effects are included additively within the index defining the
hazard. The effect of the reform is then estimated as a factor of proportionality on the unrestricted
baseline hazard.
For cognitive and social skills we use the standardized test score across all sub-tests and
use linear difference–in-differences with additive fixed effects for cohort and municipality as
well as the nonparametric approach of Athey and Imbens (discussed below). Finally for binary
outcomes22 (incidence of hospitalizations, receipt of sick pay) we use the linear probability
model. This allows us to control for 1000 or so municipality fixed effects and 12 cohort effects
without computational complexity. For relatively small treatment effects, when both approaches
have been used in a similar context, the results are almost identical.23
Parental inputs into child human capital production and the response to government interventions
may differ depending on SES. For example, while we may expect wealthier parents to substitute
resources away from children as the government increases inputs, the behavior of poorer parents
may be quite different: if a small amount of resources is not in itself capable of generating returns
poor parents may refrain from investing in their children. However, when more resources become 21 However, the evidence for selective mobility is weak if there at all, as shown in Meghir and Palme (2005). 22 The army cognitive skills tests consist of four separate categories – a verbal (reading comprehension) test, ”metal folding” (visual/spatial test), technical comprehension and logic. The cognitive skills tests consist of 40 questions each. A draftee could obtain a maximum score of 160. 23 See for example Meghir, Palme and Schnabel (2011).

18
available it may now become worthwhile for parents to invest. In this case poorer parents may
crowd in resources. Finally, the interventions themselves, such as increasing compulsory
schooling, may only be relevant for lower socio-economic groups and in addition they may have
very different impacts depending on prior achievement and ability. For all these reasons we
present results by SES and when using only the data from the 1948/53 cohorts, by ability.
Moreover, by controlling for background characteristics we relax the underlying assumptions of
the diff-in-diffs specification. Finally we can also allow for differential municipality trends since
we observe outcomes for a number of years before and after the reform when we rely on
administrative data.
As a further robustness check we also implement the nonlinear difference-in-
differences estimator of Athey and Imbens (2006) for the cognitive test scores. This non-
parametric procedure can be particularly useful in the context of test scores because the scale
there is completely arbitrary and there is no guarantee that the scale used is the appropriate one
for implementing the usual linear difference in differences procedure; indeed even the sign of the
treatment effect can switch is we use linear difference in differences with an ad-hoc scale (see
Meghir and Rivkin, 2011).
5.1 Missing data for non-cognitive skills
For the 1948 cohort the Swedish army only required non-cognitive skills interviews and scoring
for those individuals who had achieved a score of 5 or more on a cumulative cognitive skills
scale. This scale ranges from 1 to 10 and is a simpler representation of the cumulative distribution
of the cognitive skills test scores. Only men with scores 5 and above, as prescribed by the army
manual, obtained non-cognitive skills evaluation. In the 1953 cohort all men obtained a score by
a psychologist, regardless of their performance on the cognitive tests24.
To solve the missing data problem we proceed as follows. Define by yc the cognitive score and
ync the non-cognitive one and suppose they are determined by the equation
24 Figure 1A in the Appendix shows the mapping from Army cognitive skills scores to the probability of having a non-cognitive skills score for the 1948 cohort.

19
!!! = ! + !!!! + !!
!!!" = ! + !!!! + !!
where x includes all the regressors on the right hand side of the diff-in-diffs regression. Now we
make the control function assumption ! !! !! , !! = !(!!|!!) and take the conditional
expectation of the second equation given the cognitive score. We thus get that
! !!!" !!! , !! = ! !!!" !! , !! = ! + !′!! + !(!!|!!)
= ! + !′!! + !(!!)
where the function f can be estimated non-parametrically.25 Under joint normality this function is
linear. However, the key point is that by conditioning on the residual from the cognitive
regression score we control for the endogenous selection. Moreover, in this case where we
observe the entire distribution of the cognitive scores no exclusion restriction is required; the only
assumption is the control function assumption.26
6. Results
6.1 Effects of the reform on educational attainment
Earlier papers have established the impact of the reform on educational attainment. 27 We confirm
that these results hold for our extended administrative sample in Table 5 with similar estimates,
although we now include many more cohorts and there is no reason for the effects to be the same.
We also exclude individuals who were born in Stockholm. It appears that in Stockholm boys in
the same birth cohort could attend schools of both types, and thus it is not immediately clear how
they should be classified in terms of reform status.
25 We use a polynomial to approximate the function f. 26 Using residuals in this way goes back to Telser (1961) and underlies the extensive literature on using control functions. 27 Due to extensive previous research on the schooling reform our discussion here is limited. See discussions of the nature and the validity of the reform as a social experiment is in Holmlund (2007) and Meghir and Palme (2005).

20
The average effect of the reform was an increase in attained years of education of 0.22, i.e. a little
over two and a half months. Both high and low SES background children are affected by the
reform, but the magnitudes of the effects and the statistical significance are very different. High
SES children’s educational attainment increases by 5% of a school year, while low SES
children’s education increases by 28%, or almost three and a half calendar months. Thus we
expect the bulk of the reform effect on human capital to be demonstrated among men with low
SES background. However, since the new educational system abolished tracking for children
over 12, it also affected the education received by the higher SES children who were the main
group attending the academic track. It is thus possible that they are also affected by the reform in
ways that are not easy to predict.
Table 5: The effect of the educational reform on years of completed schooling for men. Population of men born 1946-1957
(1) (2) (3) Men All Low Father’s education High father’s education Reform 0.226*** 0.284**** 0.058 (0.045) (0.022) (0.043) Sample size 627537 359251 177614 Note: Reform status is assigned based on the municipality of birth. All birth years (1946-1957) and all municipalities included except Stockholm. Municipality and cohort fixed effects included in all specifications; *** indicates significance at the 1% level; standard errors clustered on the municipality of birth level. The sample sizes of low and high SES subsamples do not add up to the total number of observations because of missing information on father’s education. 6.2 Cognitive skills
Table 6 shows the results for the effects of the school reform on cognitive skills. These measures
are obtained by the army during the army draft tests and are unrelated to the school curriculum.
Their nature is that of an IQ test. The main data source here is the random sample from the 1948
and 1953 cohorts for whom we have this enhanced information set. We present simple
difference-in-differences results. We then experiment in turn with adding ability controls or
adding differential trends and finally both. All results show clear and strong evidence that the
reform improved cognitive ability by 7% to 15% of a standard deviation. This demonstrates that
increasing compulsory schooling can improve cognitive outcomes even at this relatively
advanced age. Moreover it indicates that those who would have otherwise opted out of school can
benefit by being kept in school. Both these results are important because they may justify

21
interventions beyond early childhood at least from a benefit perspective. Of course to complete
the picture we need both an evaluation of the cost as well as a market return to this benefit.
Nevertheless the point remains that cognitive skills can be improved even at mid adolescence
with extra schooling.
In the 2nd-5th columns of the table we then break down this result by parental socioeconomic
status and by high/low child ability. Columns 2 and 3 we split the sample by low and high
father’s education. Because of the relatively small sample size for higher educated fathers we
cannot identify a difference in impacts for the two groups; indeed we cannot reject the hypothesis
that the impacts are the same. We then take the low father’s education group and we split it into
those with below median ability at 12 and above median ability.28 Here the point estimates are
much larger for the lower ability group. The differences are significant at the 10% level.
The result is perhaps not surprising since most of the education effect for the low SES group
comes from increased schooling of these lower ability students, who otherwise drop out, while
the higher ability pupils dropped out much less. However it does make an important point that
extra schooling is benefitting the lowest achievement group, a group that is often thought
unreachable. While research has shown that interventions at early ages have higher returns for the
most disadvantaged, the pattern reverses by the adolescent years when returns to human capital
investment are lower for lower ability and disadvantaged children (see the review by Cunha et al,
2006, for a number of references)
The estimates vary somewhat depending on whether we include ability controls and/or
municipality specific trends; however qualitatively they do not change and these alternative
specifications do not affect whether the impact is significant or not. Moreover, the results are not
significantly different from each other.
As shown in Athey and Imbens (2006), the key assumption underlying the difference-in-
differences estimator is that in the absence of treatment, test scores are a monotonic
transformation of an unobservable; the transformation may change over time, but the distribution
of the unobservable, while different between treatment and comparison groups, must remain the
28 This is based on the distribution of a principal components analysis of all test scores at that age.
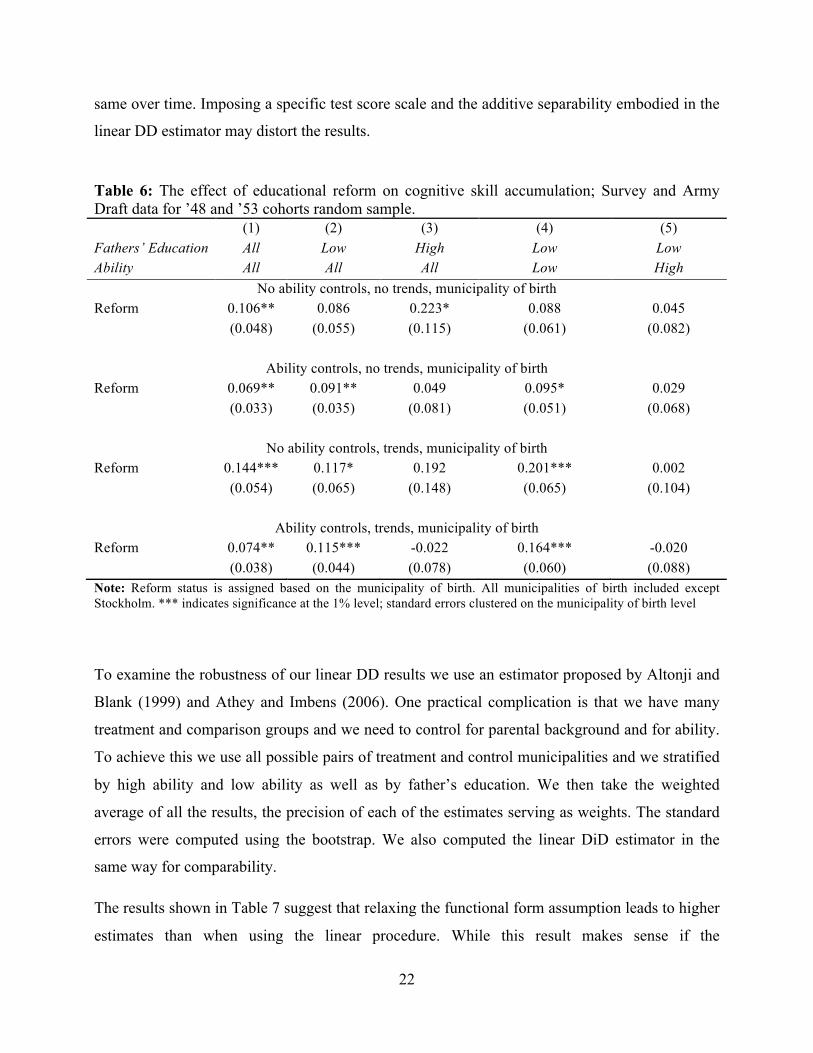
22
same over time. Imposing a specific test score scale and the additive separability embodied in the
linear DD estimator may distort the results.
Table 6: The effect of educational reform on cognitive skill accumulation; Survey and Army Draft data for ’48 and ’53 cohorts random sample. (1) (2) (3) (4) (5) Fathers’ Education All Low High Low Low Ability All All All Low High
No ability controls, no trends, municipality of birth Reform 0.106** 0.086 0.223* 0.088 0.045 (0.048) (0.055) (0.115) (0.061) (0.082)
Ability controls, no trends, municipality of birth
Reform 0.069** 0.091** 0.049 0.095* 0.029 (0.033) (0.035) (0.081) (0.051) (0.068)
No ability controls, trends, municipality of birth
Reform 0.144*** 0.117* 0.192 0.201*** 0.002 (0.054) (0.065) (0.148) (0.065) (0.104)
Ability controls, trends, municipality of birth
Reform 0.074** 0.115*** -0.022 0.164*** -0.020 (0.038) (0.044) (0.078) (0.060) (0.088) Note: Reform status is assigned based on the municipality of birth. All municipalities of birth included except Stockholm. *** indicates significance at the 1% level; standard errors clustered on the municipality of birth level
To examine the robustness of our linear DD results we use an estimator proposed by Altonji and
Blank (1999) and Athey and Imbens (2006). One practical complication is that we have many
treatment and comparison groups and we need to control for parental background and for ability.
To achieve this we use all possible pairs of treatment and control municipalities and we stratified
by high ability and low ability as well as by father’s education. We then take the weighted
average of all the results, the precision of each of the estimates serving as weights. The standard
errors were computed using the bootstrap. We also computed the linear DiD estimator in the
same way for comparability.
The results shown in Table 7 suggest that relaxing the functional form assumption leads to higher
estimates than when using the linear procedure. While this result makes sense if the

23
transformation from ability to scores is concave, the difference form the linear DD estimate is not
significant. Thus overall, our results are robust to relaxing the functional form assumption and if
anything they seem to be underestimates of the impact of the reform on cognitive scores.
Table 7: Comparing linear and non-parametric difference-in-differences estimates of the effect of schooling reform on cognitive skills. ’48 and ’53 Cohort army draft data. Linear Difference in
Differences Nonparametric Difference in
Differences Reform 0.11 0.16 (0.059) (0.065) Note: Bootstrap standard errors clustered at the municipality of birth level in parentheses
The point estimates for the impact of the reform are quite high: indeed if we take the group with
low fathers’ education and we suppose that the entire effect of the reform operates through
schooling our estimates imply that an extra year of schooling at about 14 years of age causes an
increase in cognitive scores in the range of 32%-40% of a standard deviation. It is important to
stress that we do not believe we can apply IV in such a way because we believe that the reform
may have affected achievement for this group in more ways than only through an increase in the
quantity of schooling. In particular, the reform also changed schooling quality by imposing a
national curriculum and by abolishing tracking, so that high and low ability children now
coexisted in the same classrooms thus changing the peer group structure for all.
Beyond these qualifications, the magnitude of the point estimates is similar to what has been
found in the US-based literature studying the effects of education on AFQT scores. Cascio and
Lewis (2005) find that an extra year of education improves minority students’ cognitive scores by
33% of a standard deviation (SD). Neal and Johnson (1996) use US compulsory school age laws
as in Angrist and Krueger (1991) to identify similar effects – gains of 0.25SD for women, and of
0.22SD for men; these gains are estimated for an older treated group, as the compulsory
schooling laws bind around age 16 in the US. 29 Hansen, Heckman and Mullen (2004) based on
29 See also Whinship and Korenman, 1997 for a detailed review of the existing literature to date

24
NLSY data and using a factor model to control for the endogeneity of education find very similar
gains. 30
Our result bring to bear new evidence, with a causal interpretation that more and better
schooling can have substantial impacts on cognitive outcomes and hence on adult standard of
living and social mobility.
6.3 Non-cognitive skills
The role of non-cognitive skills is an important and separate dimension of human capital as has
been emphasized by Heckman and co-authors in a number of papers.31 Indeed analysis of the
Perry-preschool experimental results, for example, seems to suggest that that particular
intervention had no long run effect on IQ but did affect social skills; this in turn is the mediating
factor to which the subsequent relative labor market success of the treatment group was attributed
to. Table 8 shows the results for our sample. The polynomial in the first stage residual is included
to control for the missing data in the 1948 cohort as explained before. The residual is highly
significant as we expect. We only present the results from the most general specification
including differential trends and controls for ability at 12.
The results are interesting and show a different pattern to those on cognition: the overall effect is
an improvement of 17 percent of a standard deviation attributable to the reform. The surprising
effect is that the impact is larger for those from a higher SES. Comparing columns 2 and 5 the
difference is significant at 5 percent with a t-statistic of 2.2. Breaking down the effect for the low
SES pupils by prior ability we obtain no significant differences although the point estimate is
larger for the lower ability children. The result is a bit surprising because schooling itself did not
increase for those from a higher SES background, from which we need to conclude that the other
aspects of the reform, such as abolishing tracking and mixing children from various backgrounds
in the classroom, also had important effects on outcomes at least in this dimension.
30 An early study of this issue was carried out by Harnqvist (1968a, 1968b) who uses data from the 1948 Swedish cohort. He found gains in the range of 44% of a SD those who completed only the general comprehensive school and 54% SD for men who completed the theoretical comprehensive school as a terminal degree. The estimates are even larger than ours but he does not control for the endogeneity of education. 31 Cunha et al, 2006; Heckman, Stixrud and Urzua, 2006; Cunha, Heckman and Schennach, 2010; Carneiro, Heckman and Masterov, 2005.

25
Table 8: The effect of education reform on non-cognitive skills accumulation; ’48 and ’53 random sample included
(1) (2) (3) (4) (5) Father’s education (SES) All Low Low Low High Ability All All Low High All Reform 0.171** 0.065 0.089 0.193 0.530***
(0.077) (0.076) (0.127) (0.123) (0.198)
First stage residual 0.272*** 0.335*** 0.298*** 0.418*** 0.044
(0.041) (0.047) (0.074) (0.081) (0.162)
First stage residual ^2 -0.053 0.110* 0.138 0.016 -0.258**
(0.033) (0.059) (0.086) (0.116) (0.119)
First stage residual^3 0.037 -0.034 -0.018 -0.041 0.254*
(0.034) (0.044) (0.060) (0.080) (0.153)
First stage residual ^4 0.007 -0.067*** -0.076** -0.034 0.047*
(0.005) (0.021) (0.037) (0.053) (0.026)
Linear trends Yes Yes Yes Yes Yes N 5,937 4,916 2,721 2,195 1,021 Note: Reform status assigned on the municipality of birth level; Cluster-robust standard errors in parentheses; standard errors clustered at the municipality of birth level; *** indicates significance at the 1% level; all regressions include municipality of birth and cohort dummies and 6th grade cognitive ability controls; all municipalities of birth included except Stockholm
6.4 Health
The next dimension of human capital we look at is longer term-health outcomes. Here we can
rely both on the large administrative data source covering all relevant cohorts and the 1948/53
data. We will report on three types measures of health: mortality and mortality by cause;
hospitalizations; sick leave pay. While mortality by the age of 60 is a relatively clean indicator of
important health problems, hospitalizations may confound the impact of illness with the action of
attending hospitals as a health investment. Finally sick leave pay will confound health outcomes
with behaviors relating to the incentives induced by the system (see Johansson and Palme, 1995
and 2005). Nevertheless these incentives are common across treatment and comparison groups;
the main concern there is whether the increase in wage due to the education reform induces a
reduction in sick leave pay: this will still be a causal effect of the reform but could possibly be
attributed to other factors than improvements in health. Despite the potential issues with
hospitalizations and sick leave pay we include them because they may pick up smaller changes in

26
health that have no substantial impact on mortality but that have the potential of affecting
productivity and wellbeing more generally.
6.4.1 Mortality
The results on mortality are reported in Tables 9A and 9B. Table 9A shows the results on
mortality from the smaller 1948/53 random sample cohort data as well as results from the entire
administrative data. We compare results estimated in the same way, i.e. including differential
municipality trends, but with no ability controls, as these are not available in the population-level
administrative data. The reported coefficients represent the proportional effect on the exit
(mortality) hazard implied by the reform. A coefficient of 1 implies no change in the mortality
hazard, while a coefficient of less than one implies a decrease.
When we disaggregate by SES (low and high father’s education) we report results for both
groups based on the entire population of the 1946-57 cohorts from the administrative data. We
also present results for the low SES group from the survey data for the 48/53 cohorts, but not for
the higher one because there are not enough deaths in the latter for the results to make sense. All
regressions include municipality and cohort dummies as well as municipality specific linear
trends.
From these results there is no indication that the school reform reduced overall mortality. In the
much larger administrative data the overall effect is almost exactly zero both overall and when
we consider low and high SES background separately. In the smaller cohort data set the estimates
point to a substantial reduction in the mortality hazard of about 50% but the effect is very
imprecise and is far from being significant.32
However, when we split the smaller 1948/53 survey by ability measured at 12 (above and below
median) we get an imprecisely estimated but significant decline in mortality for this group. This
is consistent with the educational attainment results - the decline in mortality is strongest in the
population group for which the reform increased education most. The average mortality rate
among men with low cognitive skills in 6th grade is 5.5 percent. The point estimate reported in
Table 9A implies a decline of mortality of 3.5 percentage points among those who attended the
32 Such a large point estimate is not out of order because the overall mortality hazard is quite low for most people who are quite young.
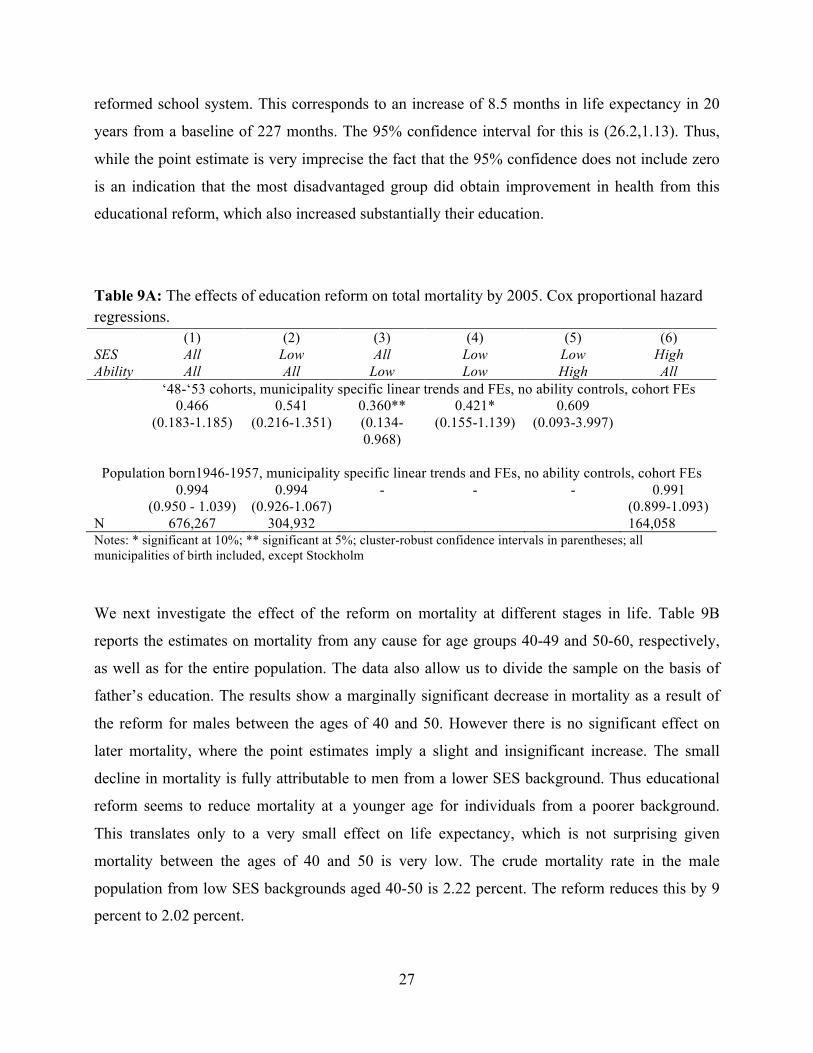
27
reformed school system. This corresponds to an increase of 8.5 months in life expectancy in 20
years from a baseline of 227 months. The 95% confidence interval for this is (26.2,1.13). Thus,
while the point estimate is very imprecise the fact that the 95% confidence does not include zero
is an indication that the most disadvantaged group did obtain improvement in health from this
educational reform, which also increased substantially their education.
Table 9A: The effects of education reform on total mortality by 2005. Cox proportional hazard regressions. (1) (2) (3) (4) (5) (6) SES All Low All Low Low High Ability All All Low Low High All
‘48-‘53 cohorts, municipality specific linear trends and FEs, no ability controls, cohort FEs 0.466 0.541 0.360** 0.421* 0.609 (0.183-1.185) (0.216-1.351) (0.134-
0.968) (0.155-1.139) (0.093-3.997)
Population born1946-1957, municipality specific linear trends and FEs, no ability controls, cohort FEs
0.994 0.994 - - - 0.991 (0.950 - 1.039) (0.926-1.067) (0.899-1.093) N 676,267 304,932 164,058 Notes: * significant at 10%; ** significant at 5%; cluster-robust confidence intervals in parentheses; all municipalities of birth included, except Stockholm
We next investigate the effect of the reform on mortality at different stages in life. Table 9B
reports the estimates on mortality from any cause for age groups 40-49 and 50-60, respectively,
as well as for the entire population. The data also allow us to divide the sample on the basis of
father’s education. The results show a marginally significant decrease in mortality as a result of
the reform for males between the ages of 40 and 50. However there is no significant effect on
later mortality, where the point estimates imply a slight and insignificant increase. The small
decline in mortality is fully attributable to men from a lower SES background. Thus educational
reform seems to reduce mortality at a younger age for individuals from a poorer background.
This translates only to a very small effect on life expectancy, which is not surprising given
mortality between the ages of 40 and 50 is very low. The crude mortality rate in the male
population from low SES backgrounds aged 40-50 is 2.22 percent. The reform reduces this by 9
percent to 2.02 percent.

28
Table 9B: The effects of education reform on mortality in different age groups. Cox proportional hazard regressions; population of men born 1946-1957. Age 40-50 age group 50-60 age group aggregate Father’s education All SES Groups Reform 0.943* 1.076 0.994 (0.881 - 1.009) (0.970 - 1.193) (0.950 - 1.039) N 670,372 501,338 676,267 Deaths 16,351 12,231 35,142 Low Father’s Education Reform 0.911* 1.122 0.994 (0.823 - 1.009) (0.964 - 1.307) (0.926 - 1.067) N 302,942 220,119 304,932 Deaths 6,702 4,867 13,701 High Father’s Education Reform 1.024 0.992 0.992 (0.880 - 1.192) (0.805 - 1.222) (0.900 - 1.093) Deaths 3,416 2,303 6,946 N 163,022 111,291 164,058 Notes: Cluster-robust 95% confidence intervals in parentheses; standard errors are clustered on the municipality of birth level; all municipalities of birth are included except Stockholm; linear trends by year of reform implementation included in all estimations. The samples of low and high SES background men do not add up to the aggregate sample size because of missing information on father’s education in the registry data
Thus the average low SES background male at age 40 could expect to live for 117.34 months in
the next 10 years. The reform increased that by just 7.6 days, which is significant at the 10%
level. The increase in life expectancy is essentially zero and quite precisely estimated, but
perhaps this slight movement at an age when mortality is so low anyway does reveal some
underlying improvements in health and can hide counteracting effects as we investigate now.
Mortality can be affected by behavior; for example smoking can cause lung cancer and excess
drinking can cause liver disease. While education may induce healthier behaviors as the life-time
returns increase, they may also lead to increases in consumption of unhealthy goods; on the other
hand other health outcomes may not be directly affected by such consumption patterns but could
be sensitive to health investments such as exercise and obtaining treatment. Improved education
may act in opposite directions in each case.

29
Table 10: The effect of education reform on total mortality by cause of death: Cancer, Circulatory, Treatable, and Preventable causes of death. Cox proportional hazard regressions. Population of men born 1946-1957. (1) (2) (3) (4)
Circulatory Cancer Preventable Treatable Father’s education All SES Groups Reform 0.967 1.010 1.143* 1.074 (0.875 - 1.068) (0.906 - 1.125) (0.980 - 1.334) (0.935 - 1.235) Deaths 7,107 6,475 8,557 3,278 N 676267 676267 676267 676267 Low Father’s Education Reform 0.929 1.044 1.034 1.037 (0.797 - 1.083) (0.884 - 1.233) (0.791 - 1.351) (0.827 - 1.299) Deaths 2,841 2,655 3,149 1,310 N 304932 304932 304932 304932 High Father’s Education Reform 1.041 0.946 1.063 1.186 (0.819 - 1.322) (0.740 - 1.208) (0.730 - 1.549) (0.814 - 1.729) Deaths 1,265 1,458 1,538 661 N 164058 164058 164058 164058 Notes: * is significant at the 10% level; Cluster-robust confidence intervals in parentheses, clustered at the municipality of birth level; all municipalities included except Stockholm; all estimations stratified at the municipality of birth level; linear trends by year of reform implementation included in all estimations. Mortality by cause categories are mutually exclusive, meaning that ICD codes of death are assigned to only one mortality cause. Individual mortality from different causes is defined as follows. An individual who died from any kind of cancer except lung cancer (which is a preventable cause of death) is assigned 1 in the cancer death category. Individuals who did not die from cancer, even if they died from another cause or from lung cancer (preventable) is assigned a 0 in the cancer death category. Appendix table A2 lists individual ICD codes of death that are assigned to each mortality category.
Previous research in the medical sciences has affirmed that cause of death may signal (lack of)
investments in different types of health promoting behaviors (McGinnis, 1993). Thus, in Table 10
we present a competing risk analysis based on different causes of death. We look separately at
“Treatable” and “Preventable” causes of death since these relate directly to health behaviors. We
also look explicitly at circulatory diseases and cancer because in the descriptive analysis we
found that mortality from circulatory diseases had a stronger education gradient than mortality
due to cancer. Again, we present results separately for the low and high SES groups.
Although the point estimates suggest a decline in deaths due to circulatory diseases the effects are
not significant, while being very precisely estimated. There is however some evidence

30
(significant at the 10%) that mortality from preventable diseases increased slightly, possibly
reflecting income effects on the consumption of alcohol and cigarettes. Recall that preventable
causes of death include only pulmonary cancer (related to smoking) and liver cirrhosis (possibly
related to excessive alcohol consumption).
6.4.2 Hospitalization
We now turn to hospitalizations, which may pick up subtler changes in health that do not
necessarily reduce mortality but may improve productivity and well-being. Of course
hospitalizations may increase with education as access to and willingness to use health-care may
increase. This may counteract, or maybe exceed, the positive health effect of the education
reform. However, the results on the relation between observed education and hospitalization,
reported in Section 5, suggest a significant inverse relationship for all hospitalizations and for
most of the diagnoses.
Table 11 shows linear probability model estimates for the effect of the reform on the probability
of being hospitalized for any cause between 1987 and 2006 along with estimates restricted to the
same causes as considered for the causes of death in Section 7.1. The results are also shown
separately for groups with high and low educated fathers.
Although the estimates are obtained with quite high rate of precision, we are not able to reject a
zero effect for any of the sub-groups or diagnoses under study. For overall hospitalization we can
reject effects larger than 0.6 percent in any direction and for circulatory diseases the
corresponding number is 0.5 percent.
The background to these small effects could either be that the effects on the underlying health are
very small or that the effects are counteracted by increased healthcare consumption given health
status. Note however, that this hypothesized behavioral response to increased health-care
consumption that could be counteracting a possible decrease in hospitalizations due to improved
health would not be related to costs, since health care is free in Sweden.

31
Table 11: The effect of the reform on hospitalizations for preventable and treatable causes. Linear probability regressions. Population of men born 1946-1957. Ever hospitalized (1) (2) (3) (4) (5) 1986-2005 All causes Circulatory Cancer Preventable Treatable Father’s education
All SES backgrounds
Reform -0.002 0.0015 -0.00035 0.00029 -0.00227 (-.006 -.002) (-0.002, 0.005) (-0.002, .001) (-0.0004, 0.001) (-0.006, 0.002) Hospitalizations 392,187 74,739 19,344 3,719 115,146 N 676,267 676,267 676,267 676,267 676,267 Hospitalization rate
1 0.191 0.049 0.009 0.294
Ever hospitalized 1986-2005 Low Father’s Education Reform -0.003 0.00103 0.00052 0.00039 -0.00414 (-0.01, -.004) (-0.003, 0.006) (-0.002, 0.003) (-0.00, 0.001) (-0.01, 0.001) Hospitalizations 173,962 33,338 8,340 1,559 52,574 N 304,932 304,932 304,932 304,932 304,932 Hospitalization rate
1 0.192 0.048 0.009 0.302
Ever hospitalized 1986-2005 High Father’s Education Reform 0.003 0.00541* 0.00079 0.00008 -0.00014 (-.006 -.011) (-0.001, 0.012) (-0.003, .004) (-0.001, 0.002) (-0.008, 0.008) Hospitalizations 96,413 15,282 4,443 681 25,426 N 164,058 164,058 164,058 164,058 164,058 Hospitalization rate
1 0.159 0.046 0.007 0.264
Notes: Cluster-robust standard errors in parentheses, clustered at the municipality of birth; * is significant at the 10% level; all estimations include cohort and municipality of birth fixed effects; all municipalities of birth except Stockholm are included; linear trends by year of reform implementation included in all estimations. The number of observations for low and high SES background do not add up to the total number of observations because of missing data on father’s education. Hospitalizations by cause categories are mutually exclusive, meaning that primary cause ICD codes are assigned to only one group. Individuals are counted only once and categorized into different hospitalization categories based on the first (primary ICD code) hospitalization cause. Hospitalization from different causes is defined as follows. An individual who was hospitalized with any kind of cancer except lung cancer (which is a preventable cause) is assigned 1 in the cancer hospitalization category. Individuals who were hospitalized with lung cancer are assigned a 0 in the cancer hospitalization category and a 1 in the preventable cause category. Appendix table A2 lists individual ICD codes that are assigned to each hospitalization category.
Taken together the results imply either zero or very small effects of the education reform on
health overall. For the set of outcomes where we do find health effects, these point to
improvements for individuals with lower prior ability and/or from lower socio-economic
background, which is consistent with the nature and impact of the reform, and for a decline in
mortality at younger ages (40-50). However, even there the effects are either very small or only
significant at the 10% level.

32
Table 12: The probability of taking paid sick leave in the year; linear probability models, individual panel data comprise all years for which data on sick pay are available. Population of all men born 1946-1957 (1) (2) (3) Parental education background Probability (took sick pay) All Low Father’s Education High Father’s Education Reform -0.0021** -0.0026** 0.0003 (0.0011) (0.0013) (0.0015) Mean dependent variable 0.170 0.171 0.141 Observations 8,887,608 4,087,056 2,205,407 Note: * significant at 10%; ** significant at 5%; *** significant at 1%; cluster-robust standard errors in parentheses, clustered at the municipality of birth level; all birth municipalities included except Stockholm; all estimations include municipality of birth fixed effects; linear trends by year of reform implementation included in all estimations. 6.4.3 Sick pay
In Table 12 we present results from linear probability regressions using the full panel of
individual level data across years (1991-2002 and 2004-2006) for which we have information on
sick leave payments. Although previous research (see Johansson and Palme, 1995 and 2005) has
shown that economic incentives affect the propensity to claim sick-pay insurance benefits, and
the reform indeed increased labor earnings, the estimated elasticities from this research suggest
that the effect is negligible in this context. In addition, the data we use on sick-pay insurance
benefits stems from spells longer than seven days where a certificate from a physician is needed
for the right to receive benefits. This limits the influence of other factors than health for this
outcome measure.
The results in Table 12 show that men who went to reform schools have a 0.2 percent lower
probability of taking sick leave in any year, which is a decrease of 1.2 percent estimated at the
mean. This estimated impact for men coming from low SES backgrounds is 1.5 percent evaluated
at the mean. The effect of education reform on the sick-leave taking of high SES men is quite
precisely estimated to be zero.
The impact is very small (effectively zero), and particularly so if we note that the overall claim
rate is actually quite high. The fact we only obtain an effect for the lower SES group is also
consistent with the rest of the results and the way the reform impacted; the fact hospitalizations
did not decline implies that this small improvement either does not really reflect health, but

33
changed incentives to claim due to higher opportunity cost of time, or that the underlying health
improvements are small. These results are consistent with the overall picture that if there were
any health gains from the reform they are very small and concentrated among those with lower
SES backgrounds.
7. Conclusions
We constructed two data sets based on administrative and survey data to estimate the effects of a
major Swedish educational reform - that increased compulsory schooling - on cognitive skills,
non-cognitive skills and health, all of which are key determinants of longer term outcomes for
individuals. The quasi-experimental nature of the implementation of the reform we use provides
credible exogenous variation. Our rich data allows us to focus separately on different
socioeconomic and ability groups and estimate potentially small effects with precision.
We find that the reform had a major effect on cognitive skill, particularly for those from lower
SES backgrounds and those with lower prior ability. Non-cognitive skills did not improve for this
group but they did for those from a higher socio-economic background, an outcome that we
interpret as resulting from the fact they no longer attend selective schools and come into contact
with a broader mix of people.
The overall impact on health is effectively zero. This is true across a wide variety of health
measures, including mortality, mortality by cause, hospitalizations and sick pay receipt. However
the most disadvantaged group in our smaller cohort sample, those with below median ability,
show a significant but imprecisely estimated increase in life expectancy over 20 years from the
age of 40. Thus, the results indicate that if there are any effects of education on health for
societies like Sweden at the time of the reform they are more likely to be found amongst the most
disadvantaged. Based on our results it is on this group that future research should focus when
investigating the effects of education on health.
34
References
Almond, Douglas and Janet Currie (2011) “Human Capital Development before Age Five” in David Card and Orley Ashenfelter (eds.) Handbook of Labor Economics Volume 4, Amsterdam: North-Holland, 1315-1486. Altonji, Joseph and Rebecca Blank (1999) “Race and Gender in the Labor Market” in O. Ashenfelter and D. Card, (eds.), Handbook of Labor Economics Volume 3c, Amsterdam: North-Holland, 3144-3259.
Angrist, Joshua D., and Alan B. Krueger (1991) “Does Compulsory School Attendance Affect Schooling and Earnings?” Quarterly Journal of Economics 106, 979-1014.
Athey, Susan and Guido Imbens (2006) “Identification and Inference in Nonlinear Difference-In-Difference Models” Econometrica 74 (2), 431-498.
Brinch, Christian N. and Taryn A. Galloway (2012), “Schooling in Adolescence Raises IQ” Proceedings of the National Academy of Sciences 109(2), 425-430.
Carneiro, Pedro, James J. Heckman, and Dimitriy V. Masterov (2005) “Labor Market Discrimination and Racial Differences in Premarket Factors” The Journal of Law and Economics 48(1), 1-39. Carneiro, Pedro and James J. Heckman (2003) “Human Capital Policy” in J. Heckman and A. Krueger, (eds.) Inequality in America: What Role for Human Capital Policy? MIT Press, 77–240. Cascio, Elizabeth and Ethan Lewis (2006) “Schooling and the Armed Forces Qualifying Test: Evidence from School-Entry Laws” the Journal of Human Resources 41(2), 294-318. Case, Anne, Angela Fertig and Christina Paxson (2005) “The Lasting Impact of Childhood Health and Circumstance” Journal of Health Economics 24, 365-389. Case, Anne, Darren Lubotsky, and Christina Paxson (2002) “Economic Status and Health in Childhood: The Origins of the Gradient” American Economic Review 92(5) 1308-1334. Clark, Damon and Heather Royer (2010) “The Effect of Education on Adult Health and Mortality: Evidence from Britain” NBER Working Paper 16013. Cox, David R., and David Oakes (1984) Survival Analysis, London: Chapman and Hall.
Cunha, Flavio, James J. Heckman, Lance J. Lochner and D. V. Masterov (2006) “Interpreting the evidence on life cycle skill formation” in E. A. Hanushek and F. Welch (eds.), Handbook of the Economics of Education, Amsterdam: North-Holland, 697–812 Cunha, Flavio James J. Heckman and Susanne M. Schennach (2010) “Estimating the Technology of Cognitive and Noncognitive Skill Formation” Econometrica 78(3), 883-931. Currie, Janet (2009) “Healthy, Wealthy, and Wise? Socioeconomic Status, Poor Health in Childhood, and Human Capital Development” Journal of Economic Literature 47(1), 87-122. Cutler, David, and Adriana Lleras-Muney (2006) “Education and health: evaluating theories and evidence” in J.S. House, R.F. Schoeni, G.A. Kaplan, and H. Pollack, eds., The Health Effects of Social and Economic Policy, New York: Russell Sage Foundation.
Cutler, David, and Adriana Lleras-Muney (2011) “Education and Health” Unpublished manuscript.

35
Cutler, David, Angus Deaton and Adriana Lleras-Muney (2006) “The Determinants of Mortality” Journal of Economic Perspectives 20(3), 97-120. Grossman, Michael (2006) “Education and Nonmarket Outcomes” in E. Hanushek and F. Welch (eds.) Handbook of the Economics of Education, Amsterdam: North-Holland, Elsevier Science. Hansen, Karsten T., James J. Heckman, Kathleen J. Mullen (2004) “The effect of schooling and ability on achievement test scores” Journal of Econometrics 121(1–2), 39–98. Heckman, James J. (1995) “Lessons from the Bell Curve” Journal of Political Economy 103(5), 1091-1120. Heckman, James J., Jora Stixrud and Sergio Urzua (2006) “The Effects of Cognitive and Noncognitive Abilities on Labor Market Outcomes and Social Behavior” Journal of Labor Economics 24(3), 411-482.
Herrnstein, Richard J. and Charles Murray (1994) The Bell Curve: Intelligence and Class Structure in American Life New York: Free Press.
Holmlund, Helena (2007) “A Researcher’s Guide to the Swedish Compulsory School Reform” Working paper 9/2007, Swedish Institute for Social Research, Stockholm University.
Härnqvist, Kjell (1968) “Relative changes in intelligence from 13 to 18. I. Background and methodology” Scandinavian Journal of Psychology 9, 50-64.
Härnqvist, Kjell (1997) “Gender and Grade Differences in Latent Ability Variables” Scandinavian Journal of Psychology 38(1), 55–62.
Johansson, Per and Mårten Palme (1996) “Do Economic Incentives Affect Work Absence? Empirical Evidence Using Swedish Micro Data” Journal of Public Economics 59, 195-218.
Johansson, Per and Mårten Palme (2005) “Moral Hazard and Sickness Insurance”, Journal of Public Economics 89, 1879-1890.
Lager, Anton and Jenny Torssander (2012) “Causal effect of education on mortality in a quasi-experiment on 1.2 million Swedes” Proceedings of the National Academy of Sciences 109(22), 8461-8466. Lindahl, Mikael, Mårten Palme, Sofia Sandgren Massih and Anna Sjögren, (2013) “Long-term intergenerational persistence of human capital: an empirical analysis of four generations” Department of Economics, Stockholm University, Working Paper 2013:3.
Lleras-Muney, Adriana (2005) “The Relationship Between Education and Adult Mortality in the United States,” Review of Economic Studies 72, 189-221.
Marklund, Sixten (1981) Skolsverige 1950–1975: Försöksverksamheten. Stockholm: Liber Utbildningsförlaget.
McGinnis J. Michael and William W. Foege (1993) “Actual causes of death in the United States” Journal of the American Medical Association 270, 2207–2212.
Mazumder, Bhashkar (2008) “Does Education Improve Health: A Reexamination of the Evidence from Compulsory Schooling Laws” Economic Perspectives 33(2), 2-16.
Mazumder, Bhashkar (2012) “The Effects of Education on Health and Mortality” Nordic Economic Policy Review 3(1), 261-301.

36
Meghir, Costas and Mårten Palme (2005) “Educational Reform, Ability, and Family Background” American Economic Review 95(1), 414-424. Meghir, Costas and Steven Rivkin (2011) “Econometric Methods for Research in Education” in E. Hanushek, S. Machin and L. Woessmann (eds.) Handbook of the Economics of Education Volume 3, Amsterdam: North-Holland, Elsevier Science, 1-39.
Neal, Derek and William Johnson (1996) “The role of premarket factors in black–white wage differences” Journal of Political Economy 104(5), 869–895.
Oreopoulos, Philip (2006) “Estimating Average and Local Average Treatment Effects of Education when Compulsory School Laws Really Matter” American Economic Review 96(1), 152-175. Socialstyrelsen (2009a) The Swedish Cause of Death Registry. Sweden, Stockholm. 2009.
Socialstyrelsen (2009b) The Swedish National Patient Register. Inpatient diseases in Sweden 1987-2007. Sweden, Stockholm. 2009.
Spasojevic, Jasmina (2010) “Effects of Education on Adult Health in Sweden: Results from a Natural Experiment” in D. Slottje and R. Tchernis (eds.) Current Issues in Health Economics (Contributions to Economic Analysis, Volume 290), Emerald Group Publishing Limited, 179-199.

37
APPENDIX [FOR ONLINE PUBLICATION ONLY]
Table A1: Number of individuals in a cohort by reform status of the municipality of birth
Pre-reform Post-reform Alive in 1985 Died by 2005 Alive in 1985 Died by 2005 1946 120,808 7,097 16,034 962 1947 113,341 6,114 20,999 1,124 1948 92,009 4,505 40,632 2,009 1949 79,238 3,479 48,316 2,182 1950 64,571 2,540 57,410 2,387 1951 58,112 2,217 58,490 2,249 1952 44,314 1,615 72,447 2,473 1953 34,340 1,088 82,395 2,647 1954 27,765 833 84,900 2,429 1955 4,433 106 109,936 2,969 1956 781 16 114,436 2,886 1957 61 3 113,691 2,545
Table A2: ICD 9 and ICD10 codes groups used to establish different causes of death and hospitalization.
Cause ICD9 ICD10 Treatable causes of death Tuberculosis 010-018, 137 A15-A19. B90 Malignant neoplasm of cervix uteri 180 C53 Chronic rheumatic heart disease 393-398 I05-I09 All respiratory diseases 460-519 J00-J99 Asthma 493 J45, J46 Appendicitis 540-543 K35-K38 Abdominal hernia 550-553 K40-K46 Hypertensive and cerebrovascular disease 401-405,430-438 I10-I15, I60-I69 Chollelthiasis and cholecystitis 574, 575.0, 575.1 K80-K81 Cancer deaths Cancers, excl lung cancer 140-239 C00-C99; D00-D48 Circulatory deaths Diseases of the circulatory system, excl chronic rheumatic heart disease, hypertensive and cardiovascular disease
390-459 I00-I99
Preventable causes of death Lung cancer 162 C33-C34 Cirrhosis of liver 571.0-571.3, 571.5-571.6 K70, K74.3-K74.6

38
Table A3: Mortality by different cause as a fraction of total mortality by reform status of the municipality of birth.
Pre-reform Post-reform N dead by 2005 (total) 26,862 % total deaths 29,613 % total deaths Preventable 1,962 7,304% 2,587 8,736% Treatable 2,834 10,550% 3,336 11,265%
Circulatory (excluding hypertension; rheumatic heart disease) 3,921 14,597% 5,169 17,455% Cancer (excluding lung cancer and cervical cancer) 6,964 25,925% 8,472 28,609% Breast Cancer 1,418 5,279% 1,579 5,332%
Figure A1: Probability of missing the Army non-cognitive score by cognitive score group and by IQ rank in 6th grade in the 1948 cohort.
By cognitive group in the Army By IQ rank in 6th grade
Description of the cognitive skills tests in 6th grade and in the Army draft
Test administered in 6th grade
The test was specifically designed for a study by researchers in the University of
Gothenburg headed by Kjell Härnqvist. It consisted of three sub-tests, designed to capture the
verbal, reasoning, and spatial components of intelligence. We describe the different components
below, following Härnqvist (1968).

39
Opposites: To find the opposite of a given word among four choices. 40 items, 10
minutes
Number series: To complete a number series, of which six numbers are given, with two
more numbers. 40 items, 18 minutes
Metal folding: To find the three0dimensional object among four choices that can be made
from a flat piece of metal with bending lines marked on the drawing. 40 items, 15 minutes.
Answers were written directly on an exam booklet that also contained questions about
school interest and attitudes. The test was administered in the classroom by the teachers
according to instructions provided by the researchers.
Army draft test
Subtest A, Instructions: To follow verbal instruction to mark, cancel, or write things. For
a few items simple information of a very general nature is needed. A few items imply changes of
directions on dials or simple diagrams. The main character of the test, however, is decidedly
verbal. 40 items, 12 minutes
Subtest B, Concepts: To select among five verbally expressed concepts the one that does
not belong to the same class as the remainder. 40 items, 7 munites.
Subtest C, Form-board. To find among four choices the set of pieces that can be fitted
together to form a given flat board, with lines between pieces marked on it. 25 items, 4 minutes
Subtest D, Mechanical comprehension. A variation of the Bennett test. 52 items, 15
minutes
All answers are marked on separate answer sheets.
Education and Human Capital Outcomes
The health results have been derived by Table A4 shows the hazard rates estimated from Cox
proportional hazard regressions broken down into mortality by cause. Mortality causes are
grouped into five exclusive categories: cancer, circulatory, preventable, treatable, and others.
Appendix table A2 lists the ICD9 diagnoses that enter in each group. In Table A3 we show the
distribution of deaths by difference cause in the treated and control populations.
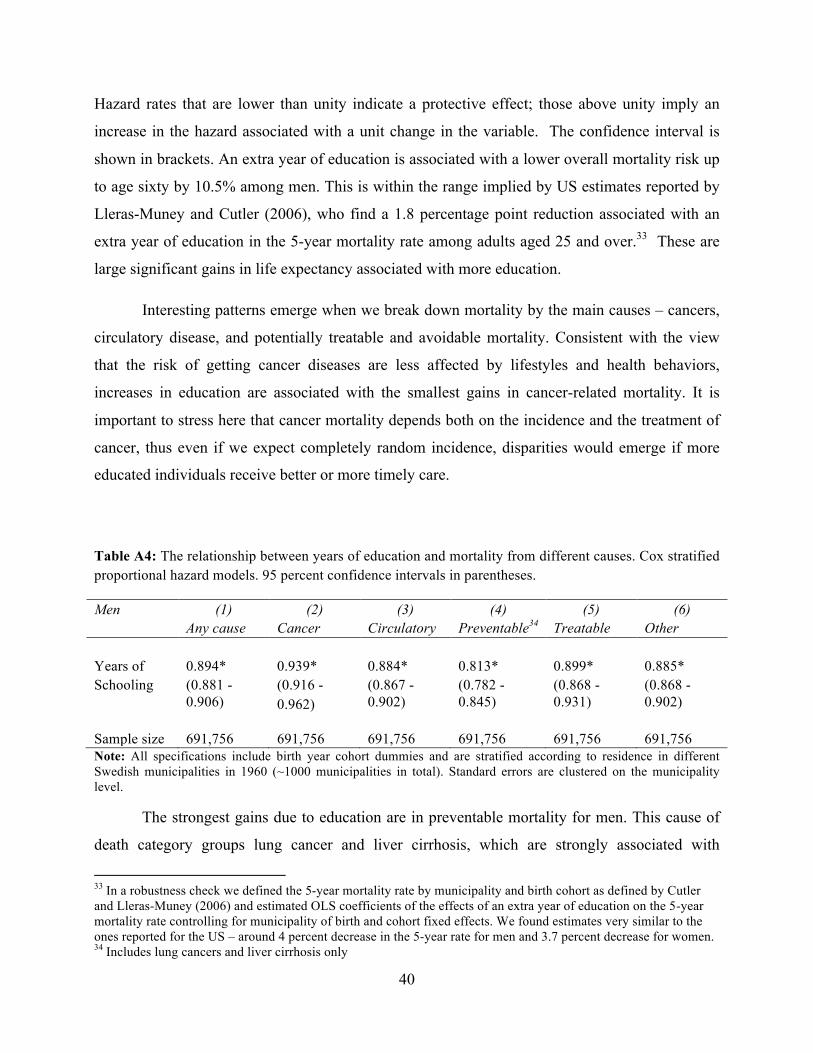
40
Hazard rates that are lower than unity indicate a protective effect; those above unity imply an
increase in the hazard associated with a unit change in the variable. The confidence interval is
shown in brackets. An extra year of education is associated with a lower overall mortality risk up
to age sixty by 10.5% among men. This is within the range implied by US estimates reported by
Lleras-Muney and Cutler (2006), who find a 1.8 percentage point reduction associated with an
extra year of education in the 5-year mortality rate among adults aged 25 and over.33 These are
large significant gains in life expectancy associated with more education.
Interesting patterns emerge when we break down mortality by the main causes – cancers,
circulatory disease, and potentially treatable and avoidable mortality. Consistent with the view
that the risk of getting cancer diseases are less affected by lifestyles and health behaviors,
increases in education are associated with the smallest gains in cancer-related mortality. It is
important to stress here that cancer mortality depends both on the incidence and the treatment of
cancer, thus even if we expect completely random incidence, disparities would emerge if more
educated individuals receive better or more timely care.
Table A4: The relationship between years of education and mortality from different causes. Cox stratified proportional hazard models. 95 percent confidence intervals in parentheses.
Men (1) (2) (3) (4) (5) (6) Any cause Cancer Circulatory Preventable34 Treatable Other Years of 0.894* 0.939* 0.884* 0.813* 0.899* 0.885* Schooling (0.881 -
0.906) (0.916 - 0.962)
(0.867 - 0.902)
(0.782 - 0.845)
(0.868 - 0.931)
(0.868 - 0.902)
Sample size 691,756 691,756 691,756 691,756 691,756 691,756 Note: All specifications include birth year cohort dummies and are stratified according to residence in different Swedish municipalities in 1960 (~1000 municipalities in total). Standard errors are clustered on the municipality level.
The strongest gains due to education are in preventable mortality for men. This cause of
death category groups lung cancer and liver cirrhosis, which are strongly associated with
33 In a robustness check we defined the 5-year mortality rate by municipality and birth cohort as defined by Cutler and Lleras-Muney (2006) and estimated OLS coefficients of the effects of an extra year of education on the 5-year mortality rate controlling for municipality of birth and cohort fixed effects. We found estimates very similar to the ones reported for the US – around 4 percent decrease in the 5-year rate for men and 3.7 percent decrease for women. 34 Includes lung cancers and liver cirrhosis only

41
smoking and drinking, respectively. These types of mortality are most strongly affected by health
behaviors and lifestyle, suggesting that health behaviors are a major channel through which
education affects health.
Table A5 shows the relationship between education and the probability of being
hospitalized. The outcome is a binary variable equal to one if the person was hospitalized
overnight for any cause at any time during the period 1987-2005. We run linear probability
models. Even if we were to take education as exogenous, the probability of hospitalization
depends on two potentially conflicting channels. First, worsening underlying health would
increase the incidence of hospitalizations. This implies that more educated individuals would be
hospitalized less often. However, hospitalization is also a means of health investment. Higher
educated individuals may have higher returns from such investments. This implies that more
educated people would be more likely to be hospitalized for planned treatments. In addition,
higher educated individuals may have lower discount rates and thus invest more anyway, further
increasing hospitalizations. As it turns out (Table A5) hospitalizations are negatively associated
to increases in education. An extra year of schooling decreases the probability of hospitalization
by 1.4 percentage points among men. We emphasize that cancer hospitalizations do not appear to
be significantly affected by education; however cancer mortality is lower among the better
educated. This suggests that one of the channels through which education lowers mortality is by
improving survival chances post-diagnosis.
Table A5: The effects of education on hospitalizations. OLS estimates controlling for municipality and birth cohort fixed effects. 95 percent confidence intervals in parentheses.
Men (1) (2) (3) (4) (5) Any cause Cancer Circulatory Preventable Treatable Years of -0.014*** -0.00015* -0.00501*** -0.00031*** -0.00610*** schooling (-0.015 -
0.013) (-0.00032 -0.00001)
(-0.00539 -0.00463)
(-0.00037 -0.00026)
(-0.00656 -0.00564)
Sample size 691,756 691,756 691,756 691,756 691,756 Note: * significant at 10%; ** significant at 5%; *** significant at 1%
Table A6 shows the estimated hazard ratios from a Cox proportional hazard model for
retirement using years of schooling and dummy variables for cohort of birth as independent
variables. The results reveal a very strong association between education and the timing of

42
retirement: every year of additional education is associated with an about 9 percent decrease in
the probability of exiting from the labor force for both males and females. As a sensitivity
analysis, we have repeated these estimates using different thresholds for labor earnings and the
results are robust to these checks.
Table A6: Hazard ratios from Cox proportional hazard models of the association between years of schooling and retirement. 95 percent confidence intervals in parentheses. Variable Males Years of schooling 0.9103* (0.8983 - 0.9224) Sample size 755,634 Note: + significant at 10%; ** significant at 5%; * significant at 1%