education centre analyses
TRANSCRIPT
8/3/2019 Education Centre Analyses
http://slidepdf.com/reader/full/education-centre-analyses 1/18
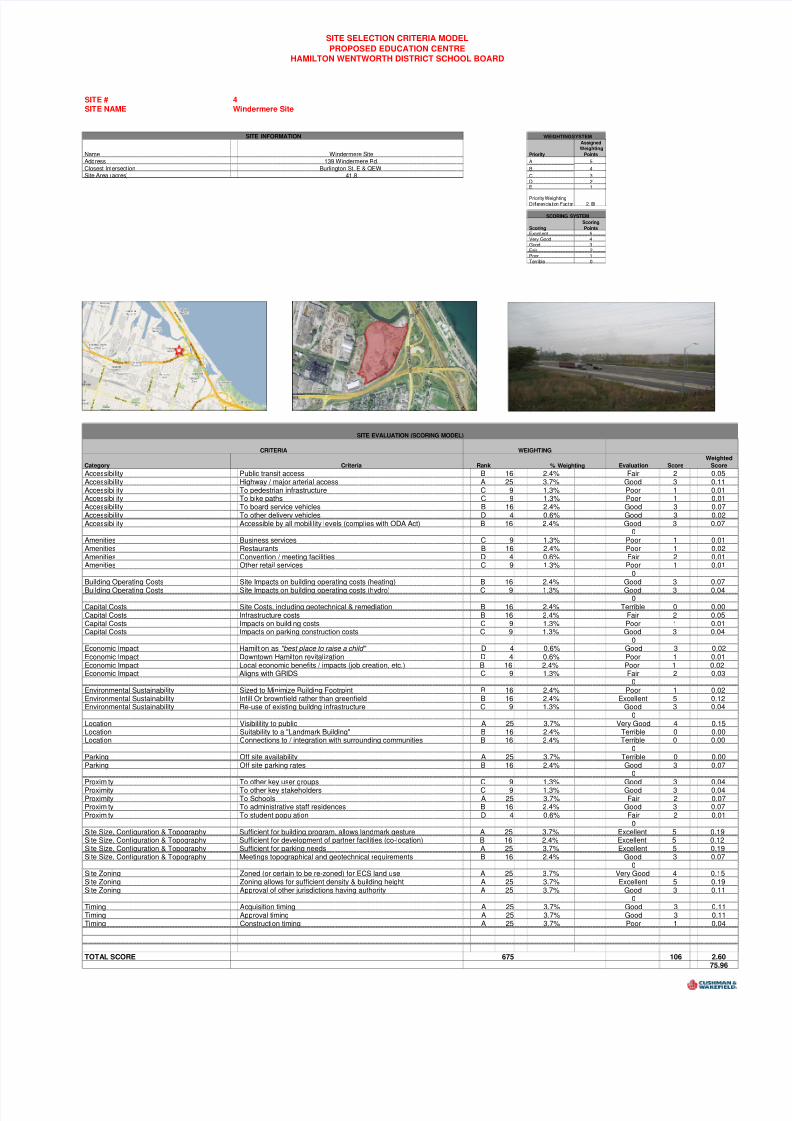
SITE # 4SITE NAME Windermere Site
Name Windermere Site Priority
AssignedWeighting
Points
Address 139 Windermere Rd. A 5
Closest Intersection Burlington St. E & QEW B 4
Site Area (acres) 41.8 C 3D 2E 1
Priority WeightingDifferenciation Factor 2.00
Scoring
Scoring
PointsExcellent 5Very Good 4Good 3Fair 2Poor 1Terrible 0
Category Criteria Rank Evaluation Score
Weighted
Score
Accessibility Public transit access B 16 2.4% Fair 2 0.05
SITE SELECTION CRITERIA MODEL
PROPOSED EDUCATION CENTREHAMILTON WENTWORTH DISTRICT SCHOOL BOARD
% Weighting
SITE EVALUATION (SCORING MODEL)
CRITERIA WEIGHTING
SITE INFORMATION
SCORING SYSTEM
WEIGHTING SYSTEM
Accessibility Highway / major arterial access A 25 3.7% Good 3 0.11Accessibility To pedestrian infrastructure C 9 1.3% Poor 1 0.01Accessibility To bike paths C 9 1.3% Poor 1 0.01Accessibility To board service vehicles B 16 2.4% Good 3 0.07Accessibility To other delivery vehicles D 4 0.6% Good 3 0.02Accessibility Accessible by all mobilility levels (complies with ODA Act) B 16 2.4% Good 3 0.07
0Amenities Business services C 9 1.3% Poor 1 0.01Amenities Restaurants B 16 2.4% Poor 1 0.02Amenities Convention / meeting facilities D 4 0.6% Fair 2 0.01Amenities Other retail services C 9 1.3% Poor 1 0.01
0Building Operating Costs Site Impacts on building operating costs (heating) B 16 2.4% Good 3 0.07
Building Operating Costs Site Impacts on building operating costs (hydro) C 9 1.3% Good 3 0.040
Capital Costs Site Costs, including geotechnical & remediation B 16 2.4% Terrible 0 0.00Capital Costs Infrastructure costs B 16 2.4% Fair 2 0.05Capital Costs Impacts on building costs C 9 1.3% Poor 1 0.01Capital Costs Impacts on parking construction costs C 9 1.3% Good 3 0.04
0Economic Impact Hamiltion as "best place to raise a child" D 4 0.6% Good 3 0.02Economic Impact Downtown Hamilton revitalization D 4 0.6% Poor 1 0.01Economic Impact Local economic benefits / impacts (job creation, etc.) B 16 2.4% Poor 1 0.02Economic Impact Aligns with GRIDS C 9 1.3% Fair 2 0.03
0Environmental Sustainability Sized to Minimize Building Footrpint B 16 2.4% Poor 1 0.02Environmental Sustainability Infill Or brownfield rather than greenfield B 16 2.4% Excellent 5 0.12Environmental Sustainability Re-use of existing buildng infrastructure C 9 1.3% Good 3 0.04
0Location Visibilility to public A 25 3.7% Very Good 4 0.15Location Suitability to a "Landmark Building" B 16 2.4% Terrible 0 0.00Location Connections to / integration with surrounding communities B 16 2.4% Terrible 0 0.00
0Parking Off site availability A 25 3.7% Terrible 0 0.00Parking Off site parking rates B 16 2.4% Good 3 0.07
0Proximity To other key user groups C 9 1.3% Good 3 0.04Proximity To other key stakeholders C 9 1.3% Good 3 0.04Proximity To Schools A 25 3.7% Fair 2 0.07Proximity To administrative staff residences B 16 2.4% Good 3 0.07Proximity To student population D 4 0.6% Fair 2 0.01
0Site Size, Configuration & Topography Sufficient for building program, allows landmark gesture A 25 3.7% Excellent 5 0.19Site Size, Configuration & Topography Sufficient for development of partner facilities (co-location) B 16 2.4% Excellent 5 0.12Site Size, Configuration & Topography Sufficient for parking needs A 25 3.7% Excellent 5 0.19Site Size, Configuration & Topography Meetings topographical and geotechnical requirements B 16 2.4% Good 3 0.07
0Site Zoning Zoned (or certain to be re-zoned) for ECS land use A 25 3.7% Very Good 4 0.15Site Zoning Zoning allows for sufficient density & building height A 25 3.7% Excellent 5 0.19Site Zoning Approval of other jurisdictions having authority A 25 3.7% Good 3 0.11
0Timing Acquisition timing A 25 3.7% Good 3 0.11Timing Approval timing A 25 3.7% Good 3 0.11Timing Construction timing A 25 3.7% Poor 1 0.04
TOTAL SCORE 675 106 2.6075.96

8/3/2019 Education Centre Analyses
http://slidepdf.com/reader/full/education-centre-analyses 2/18
SITE # 18SITE NAME Aberdeen Site
Name Aberdeen Site Priority
Assigned
Weighting
Points
Address 606 Aberdeen Ave. A 5
Closest Intersection Aberdeen Ave. & Longwoods Rd. S B 4
Site Area (acres) 14.6 C 3D 2E 1
Priority WeightingDifferenciation Factor 2.00
ScoringScoringPoints
Excellent 5Very Good 4Good 3Fair 2Poor 1Terrible 0
Category Criteria Rank Evaluation ScoreWeighted
Score
Accessibility Public transit access B 16 2.4% Fair 2 0.05% Weighting
PROPOSED EDUCATION CENTRE
SITE SELECTION CRITERIA MODEL
HAMILTON WENTWORTH DISTRICT SCHOOL BOARD
SITE EVALUATION (SCORING MODEL)
CRITERIA WEIGHTING
SITE INFORMATION WEIGHTING SYSTEM
SCORING SYSTEM
Accessibility Highway / major arterial access A 25 3.7% Excellent 5 0.19Accessibility To pedestrian infrastructure C 9 1.3% Fair 2 0.03Accessibility To bike paths C 9 1.3% Fair 2 0.03Accessibility To board service vehicles B 16 2.4% Very Good 4 0.09Accessibility To other delivery vehicles D 4 0.6% Very Good 4 0.02Accessibility Accessible by all mobilility levels (complies with ODA Act) B 16 2.4% Good 3 0.07
0Amenities Business services C 9 1.3% Good 3 0.04Amenities Restaurants B 16 2.4% Good 3 0.07Amenities Convention / meeting facilities D 4 0.6% Good 3 0.02Amenities Other retail services C 9 1.3% Good 3 0.04
0Building Operating Costs Site Impacts on building operating costs (heating) B 16 2.4% Good 3 0.07
Building Operating Costs Site Impacts on building operating costs (hydro) C 9 1.3% Good 3 0.040
Capital Costs Site Costs, including geotechnical & remediation B 16 2.4% Poor 1 0.02Capital Costs Infrastructure costs B 16 2.4% Very Good 4 0.09Capital Costs Impacts on building costs C 9 1.3% Fair 2 0.03Capital Costs Impacts on parking construction costs C 9 1.3% Fair 2 0.03
0Economic Impact Hamiltion as "best place to raise a child" D 4 0.6% Good 3 0.02Economic Impact Downtown Hamilton revitalization D 4 0.6% Poor 1 0.01Economic Impact Local economic benefits / impacts (job creation, etc.) B 16 2.4% Poor 1 0.02Economic Impact Aligns with GRIDS C 9 1.3% Very Good 4 0.05
0Environmental Sustainability Sized to Minimize Building Footrpint B 16 2.4% Poor 1 0.02Environmental Sustainability Infill Or brownfield rather than greenfield B 16 2.4% Excellent 5 0.12Environmental Sustainability Re-use of existing buildng infrastructure C 9 1.3% Good 3 0.04
0Location Visibilility to public A 25 3.7% Fair 2 0.07Location Suitability to a "Landmark Building" B 16 2.4% Fair 2 0.05Location Connections to / integration with surrounding communities B 16 2.4% Poor 1 0.02
0Parking Off site availability A 25 3.7% Poor 1 0.04Parking Off site parking rates B 16 2.4% Good 3 0.07
0Proximity To other key user groups C 9 1.3% Good 3 0.04
Proximity To other key stakeholders C 9 1.3% Good 3 0.04Proximity To Schools A 25 3.7% Good 3 0.11Proximity To administrative staff residences B 16 2.4% Good 3 0.07Proximity To student population D 4 0.6% Good 3 0.02
0Site Size, Configuration & Topography Sufficient for building program, allows landmark gesture A 25 3.7% Poor 1 0.04Site Size, Configuration & Topography Sufficient for development of partner facilities (co-location) B 16 2.4% Poor 1 0.02Site Size, Configuration & Topography Sufficient for parking needs A 25 3.7% Fair 2 0.07Site Size, Configuration & Topography Meetings topographical and geotechnical requirements B 16 2.4% Good 3 0.07
0Site Zoning Zoned (or certain to be re-zoned) for ECS land use A 25 3.7% Good 3 0.11Site Zoning Zoning allows for sufficient density & building height A 25 3.7% Good 3 0.11Site Zoning Approval of other jurisdictions having authority A 25 3.7% Good 3 0.11
0Timing Acquisition timing A 25 3.7% Good 3 0.11Timing Approval timing A 25 3.7% Good 3 0.11Timing Construction timing A 25 3.7% Good 3 0.11
TOTAL SCORE 675 116 2.6276.16

8/3/2019 Education Centre Analyses
http://slidepdf.com/reader/full/education-centre-analyses 3/18
SITE # 15SITE NAME Ancaster High School
Name Ancaster Site Priority
Assigned
WeightingPoints
Address 374 Jerseyville Rd. W A 5
Closest Intersection Jerseyville Rd. W & Meadowbrook Dr. B 4
Site Area (acres) 42.8 C 3D 2E 1
Priority WeightingDifferenciation Factor 2.00
Scoring
Scoring
PointsExcellent 5Very Good 4Good 3Fair 2Poor 1Terrible 0
Category Criteria Rank Evaluation ScoreWeighted
Score
Accessibilit Public transit access B 16 2.4% Fair 2 0.05
SCORING SYSTEM
WEIGHTING SYSTEMSITE INFORMATION
SITE SELECTION CRITERIA MODEL
PROPOSED EDUCATION CENTREHAMILTON WENTWORTH DISTRICT SCHOOL BOARD
SITE EVALUATION (SCORING MODEL)
CRITERIA WEIGHTING
% Weighting
. .Accessibility Highway / major arterial access A 25 3.7% Good 3 0.11Accessibility To pedestrian infrastructure C 9 1.3% Good 3 0.04Accessibility To bike paths C 9 1.3% Good 3 0.04Accessibility To board service vehicles B 16 2.4% Fair 2 0.05Accessibility To other delivery vehicles D 4 0.6% Fair 2 0.01Accessibility Accessible by all mobilility levels (complies with ODA Act) B 16 2.4% Good 3 0.07
0Amenities Business services C 9 1.3% Fair 2 0.03Amenities Restaurants B 16 2.4% Fair 2 0.05Amenities Convention / meeting facilities D 4 0.6% Fair 2 0.01Amenities Other retail services C 9 1.3% Fair 2 0.03
0Building Operating Costs Site Impacts on building operating costs (heating) B 16 2.4% Good 3 0.07
Building Operating Costs Site Impacts on building operating costs (hydro) C 9 1.3% Good 3 0.040
Capital Costs Site Costs, including geotechnical & remediation B 16 2.4% Excellent 5 0.12Capital Costs Infrastructure costs B 16 2.4% Very Good 4 0.09Capital Costs Impacts on building costs C 9 1.3% Very Good 4 0.05Capital Costs Impacts on parking construction costs C 9 1.3% Very Good 4 0.05
0Economic Impact Hamiltion as "best place to raise a child" D 4 0.6% Good 3 0.02Economic Impact Downtown Hamilton revitalization D 4 0.6% Poor 1 0.01Economic Impact Local economic benefits / impacts (job creation, etc.) B 16 2.4% Poor 1 0.02Economic Impact Aligns with GRIDS C 9 1.3% Poor 1 0.01
0Environmental Sustainability Sized to Minimize Building Footrpint B 16 2.4% Poor 1 0.02Environmental Sustainability Infill Or brownfield rather than greenfield B 16 2.4% Fair 2 0.05Environmental Sustainability Re-use of existing buildng infrastructure C 9 1.3% Good 3 0.04
0Location Visibilility to public A 25 3.7% Fair 2 0.07Location Suitability to a "Landmark Building" B 16 2.4% Poor 1 0.02Location Connections to / integration with surrounding communities B 16 2.4% Good 3 0.07
0Parking Off site availability A 25 3.7% Poor 1 0.04Parking Off site parking rates B 16 2.4% Good 3 0.07
0
Proximity To other key user groups C 9 1.3% Good 3 0.04Proximity To other key stakeholders C 9 1.3% Good 3 0.04Proximity To Schools A 25 3.7% Poor 1 0.04Proximity To administrative staff residences B 16 2.4% Fair 2 0.05Proximity To student population D 4 0.6% Poor 1 0.01
0Site Size, Configuration & Topography Sufficient for building program, allows landmark gesture A 25 3.7% Very Good 4 0.15Site Size, Configuration & Topography Sufficient for development of partner facilities (co-location) B 16 2.4% Good 3 0.07Site Size, Configuration & Topography Sufficient for parking needs A 25 3.7% Very Good 4 0.15Site Size, Configuration & Topography Meetings topographical and geotechnical requirements B 16 2.4% Very Good 4 0.09
0Site Zoning Zoned (or certain to be re-zoned) for ECS land use A 25 3.7% Very Good 4 0.15Site Zoning Zoning allows for sufficient density & building height A 25 3.7% Excellent 5 0.19Site Zoning Approval of other jurisdictions having authority A 25 3.7% Excellent 5 0.19
0Timing Acquisition timing A 25 3.7% Good 3 0.11Timing Approval timing A 25 3.7% Good 3 0.11Timing Construction timing A 25 3.7% Excellent 5 0.19
TOTAL SCORE 675 121 2.9279.20

8/3/2019 Education Centre Analyses
http://slidepdf.com/reader/full/education-centre-analyses 4/18
SITE # 1SITE NAME Chatham Street
Name Chatam Site Priority
AssignedWeighting
Points
Address n/a A 5
Closest Intersection Chatham St. & Dundurn St. S. B 4
Site Area (acres) 16.5 C 3D 2E 1
Priority WeightingDifferenciation Factor 2.00
Scoring
Scoring
PointsExcellent 5Very Good 4Good 3Fair 2Poor 1Terrible 0
Category Criteria Rank Evaluation Score
Weighted
Score
Accessibility Public transit access B 16 2.4% Excellent 5 0.12
SITE SELECTION CRITERIA MODEL
PROPOSED EDUCATION CENTREHAMILTON WENTWORTH DISTRICT SCHOOL BOARD
SITE EVALUATION (SCORING MODEL)
SITE INFORMATION
WEIGHTING
% Weighting
SCORING SYSTEM
WEIGHTING SYSTEM
CRITERIA
ccess y g way ma or ar er a access . oo .Accessibility To pedestrian infrastructure C 9 1.3% Poor 1 0.01Accessibility To bike paths C 9 1.3% Fair 2 0.03Accessibility To board service vehicles B 16 2.4% Good 3 0.07Accessibility To other delivery vehicles D 4 0.6% Good 3 0.02Accessibility Accessible by all mobilility levels (complies with ODA Act) B 16 2.4% Good 3 0.07
0Amenities Business services C 9 1.3% Fair 2 0.03Amenities Restaurants B 16 2.4% Fair 2 0.05Amenities Convention / meeting facilities D 4 0.6% Good 3 0.02Amenities Other retail services C 9 1.3% Fair 2 0.03
0Building Operating Costs Site Impacts on building operating costs (heating) B 16 2.4% Good 3 0.07Building Operating Costs Site Impacts on building operating costs (hydro) C 9 1.3% Good 3 0.04
0Capital Costs Site Costs, including geotechnical & remediation B 16 2.4% Poor 1 0.02Capital Costs Infrastructure costs B 16 2.4% Very Good 4 0.09Capital Costs Impacts on building costs C 9 1.3% Good 3 0.04Capital Costs Impacts on parking construction costs C 9 1.3% Very Good 4 0.05
0Economic Impact Hamiltion as "best place to raise a child" D 4 0.6% Good 3 0.02Economic Impact Downtown Hamilton revitalization D 4 0.6% Poor 1 0.01Economic Impact Local economic benefits / impacts (job creation, etc.) B 16 2.4% Poor 1 0.02Economic Impact Aligns with GRIDS C 9 1.3% Very Good 4 0.05
0Environmental Sustainability Sized to Minimize Building Footrpint B 16 2.4% Poor 1 0.02Environmental Sustainability Infill Or brownfield rather than greenfield B 16 2.4% Excellent 5 0.12Environmental Sustainability Re-use of existing buildng infrastructure C 9 1.3% Good 3 0.04
0Location Visibilility to public A 25 3.7% Terrible 0 0.00Location Suitability to a "Landmark Building" B 16 2.4% Terrible 0 0.00Location Connections to / integration with surrounding communities B 16 2.4% Terrible 0 0.00
0Parking Off site availability A 25 3.7% Poor 1 0.04Parking Off site parking rates B 16 2.4% Good 3 0.07
0Proximity To other key user groups C 9 1.3% Good 3 0.04
Proximity To other key stakeholders C 9 1.3% Good 3 0.04Proximity To Schools A 25 3.7% Good 3 0.11Proximity To administrative staff residences B 16 2.4% Good 3 0.07Proximity To student population D 4 0.6% Good 3 0.02
0Site Size, Configuration & Topography Sufficient for building program, allows landmark gesture A 25 3.7% Good 3 0.11Site Size, Configuration & Topography Sufficient for development of partner facilities (co-location) B 16 2.4% Poor 1 0.02Site Size, Configuration & Topography Sufficient for parking needs A 25 3.7% Very Good 4 0.15Site Size, Configuration & Topography Meetings topographical and geotechnical requirements B 16 2.4% Good 3 0.07
0Site Zoning Zoned (or certain to be re-zoned) for ECS land use A 25 3.7% Very Good 4 0.15Site Zoning Zoning allows for sufficient density & building height A 25 3.7% Excellent 5 0.19Site Zoning Approval of other jurisdictions having authority A 25 3.7% Good 3 0.11
0Timing Acquisition timing A 25 3.7% Good 3 0.11Timing Approval timing A 25 3.7% Good 3 0.11Timing Construction timing A 25 3.7% Very Good 4 0.15
.77.11

8/3/2019 Education Centre Analyses
http://slidepdf.com/reader/full/education-centre-analyses 5/18
SITE # 9SITE NAME City Hall Site
Name City Hall Site Priority
AssignedWeighting
Points
Address 71 Main st. W A 5
Closest Intersection Main St. W & Bay St. S B 4
Site Area (acres) 6 C 3D 2E 1
Priority WeightingD if feren ciat ion Fac tor 2 .0 0
Scoring
Scoring
PointsExcellent 5Very Good 4Good 3Fair 2Poor 1Terrible 0
Category Criteria Rank Evaluation Score
Weighted
Score
Accessibility Public transit access B 16 2.4% Excellent 5 0.12
PROPOSED EDUCATION CENTREHAMILTON WENTWORTH DISTRICT SCHOOL BOARD
SCORING SYSTEM
WEIGHTING SYSTEMSITE INFORMATION
SITE SELECTION CRITERIA MODEL
SITE EVALUATION (SCORING MODEL)
CRITERIA WEIGHTING
% Weighting
Accessibility Highway / major arterial access A 25 3.7% Good 3 0.11Accessibility To pedestrian infrastructure C 9 1.3% Very Good 4 0.05Accessibility To bike paths C 9 1.3% Fair 2 0.03Accessibility To board service vehicles B 16 2.4% Fair 2 0.05Accessibility To other delivery vehicles D 4 0.6% Fair 2 0.01Accessibility Accessible by all mobilility levels (complies with ODA Act) B 16 2.4% Good 3 0.07
0Amenities Business services C 9 1.3% Excellent 5 0.07Amenities Restaurants B 16 2.4% Excellent 5 0.12Amenities Convention / meeting facilities D 4 0.6% Excellent 5 0.03Amenities Other retail services C 9 1.3% Excellent 5 0.07
0Building Operating Costs Site Impacts on building operating costs (heating) B 16 2.4% Excellent 5 0.12
Building Operating Costs Site Impacts on building operating costs (hydro) C 9 1.3% Good 3 0.040
Capital Costs Site Costs, including geotechnical & remediation B 16 2.4% Poor 1 0.02Capital Costs Infrastructure costs B 16 2.4% Excellent 5 0.12Capital Costs Impacts on building costs C 9 1.3% Poor 1 0.01Capital Costs Impacts on parking construction costs C 9 1.3% Terrible 0 0.00
0Economic Impact Hamiltion as "best place to raise a child" D 4 0.6% Good 3 0.02Economic Impact Downtown Hamilton revitalization D 4 0.6% Very Good 4 0.02Economic Impact Local economic benefits / impacts (job creation, etc.) B 16 2.4% Very Good 4 0.09Economic Impact Aligns with GRIDS C 9 1.3% Excellent 5 0.07
0Environmental Sustainability Sized to Minimize Building Footrpint B 16 2.4% Very Good 4 0.09Environmental Sustainability Infill Or brownfield rather than greenfield B 16 2.4% Excellent 5 0.12Environmental Sustainability Re-use of existing buildng infrastructure C 9 1.3% Fair 2 0.03
0Location Visibilility to public A 25 3.7% Very Good 4 0.15Location Suitability to a "Landmark Building" B 16 2.4% Excellent 5 0.12Location Connections to / integration with surrounding communities B 16 2.4% Excellent 5 0.12
0Parking Off site availability A 25 3.7% Excellent 5 0.19Parking Off site parking rates B 16 2.4% Terrible 0 0.00
0Proximity To other key user groups C 9 1.3% Good 3 0.04Proximity To other key stakeholders C 9 1.3% Good 3 0.04Proximity To Schools A 25 3.7% Fair 2 0.07Proximity To administrative staff residences B 16 2.4% Fair 2 0.05Proximity To student population D 4 0.6% Fair 2 0.01
0Site Size, Configuration & Topography Sufficient for building program, allows landmark gesture A 25 3.7% Terrible 0 0.00Site Size, Configuration & Topography Sufficient for development of partner facilities (co-location) B 16 2.4% Terrible 0 0.00Site Size, Configuration & Topography Sufficient for parking needs A 25 3.7% Terrible 0 0.00Site Size, Configuration & Topography Meetings topographical and geotechnical requirements B 16 2.4% Very Good 4 0.09
0Site Zoning Zoned (or certain to be re-zoned) for ECS land use A 25 3.7% Excellent 5 0.19Site Zoning Zoning allows for sufficient density & building height A 25 3.7% Excellent 5 0.19Site Zoning Approval of other jurisdictions having authority A 25 3.7% Good 3 0.11
0Timing Acquisition timing A 25 3.7% Fair 2 0.07Timing Approval timing A 25 3.7% Good 3 0.11Timing Construction timing A 25 3.7% Good 3 0.11
TOTAL SCORE 675 139 3.1381.35

8/3/2019 Education Centre Analyses
http://slidepdf.com/reader/full/education-centre-analyses 6/18
SITE # 14SITE NAME Crestwood Site
Name Crestwood Priority
AssignedWeighting
Points
Address 50 Millwood Place A 5
Closest Intersection Mohawk Rd. E & Upper Wentworth St. B 4
Site Area (acres) 9.85 C 3D 2E 1Priority Weighting
D iffer enc iat ion Fac tor 2. 00
Scoring
Scoring
PointsExcellent 5Very Good 4Good 3Fair 2Poor 1Terrible 0
Category Criteria Rank Evaluation Score
Weighted
Score
Accessibility Public transit access B 16 2.4% Very Good 4 0.09Accessibilit Hi hwa / ma or arterial access A 25 3.7% Ver Good 4 0.15
SITE SELECTION CRITERIA MODEL
PROPOSED EDUCATION CENTREHAMILTON WENTWORTH DISTRICT SCHOOL BOARD
% Weighting
SITE EVALUATION (SCORING MODEL)
CRITERIA WEIGHTING
SITE INFORMATION
SCORING SYSTEM
WEIGHTING SYSTEM
Accessibility To pedestrian infrastructure C 9 1.3% Good 3 0.04Accessibility To bike paths C 9 1.3% Good 3 0.04Accessibility To board service vehicles B 16 2.4% Very Good 4 0.09Accessibility To other delivery vehicles D 4 0.6% Very Good 4 0.02Accessibility Accessible by all mobilility levels (complies with ODA Act) B 16 2.4% Good 3 0.07
0Amenities Business services C 9 1.3% Very Good 4 0.05Amenities Restaurants B 16 2.4% Very Good 4 0.09Amenities Convention / meeting facilities D 4 0.6% Good 3 0.02Amenities Other retail services C 9 1.3% Very Good 4 0.05
0Building Operating Costs Site Impacts on building operating costs (heating) B 16 2.4% Good 3 0.07Building Operating Costs Site Impacts on building operating costs (hydro) C 9 1.3% Good 3 0.04
0Capital Costs Site Costs, including geotechnical & remediation B 16 2.4% Very Good 4 0.09Capital Costs Infrastructure costs B 16 2.4% Excellent 5 0.12Capital Costs Impacts on building costs C 9 1.3% Very Good 4 0.05Capital Costs Impacts on parking construction costs C 9 1.3% Very Good 4 0.05
0Economic Impact Hamiltion as "best place to raise a child" D 4 0.6% Good 3 0.02Economic Impact Downtown Hamilton revitalization D 4 0.6% Poor 1 0.01Economic Impact Local economic benefits / impacts (job creation, etc.) B 16 2.4% Good 3 0.07Economic Impact Aligns with GRIDS C 9 1.3% Very Good 4 0.05
0Environmental Sustainability Sized to Minimize Building Footrpint B 16 2.4% Fair 2 0.05Environmental Sustainability Infill Or brownfield rather than greenfield B 16 2.4% Good 3 0.07Environmental Sustainability Re-use of existing buildng infrastructure C 9 1.3% Fair 2 0.03
0Location Visibilility to public A 25 3.7% Fair 2 0.07Location Suitability to a "Landmark Building" B 16 2.4% Fair 2 0.05Location Connections to / integration with surrounding communities B 16 2.4% Good 3 0.07
0Parking Off site availability A 25 3.7% Fair 2 0.07Parking Off site parking rates B 16 2.4% Good 3 0.07
0Proximity To other key user groups C 9 1.3% Good 3 0.04
Proximity To other key stakeholders C 9 1.3% Very Good 4 0.05Proximity To Schools A 25 3.7% Very Good 4 0.15Proximity To administrative staff residences B 16 2.4% Excellent 5 0.12Proximity To student population D 4 0.6% Very Good 4 0.02
0Site Size, Configuration & Topography Sufficient for building program, allows landmark gesture A 25 3.7% Good 3 0.11Site Size, Configuration & Topography Sufficient for development of partner facilities (co-location) B 16 2.4% Fair 2 0.05Site Size, Configuration & Topography Sufficient for parking needs A 25 3.7% Very Good 4 0.15Site Size, Configuration & Topography Meetings topographical and geotechnical requirements B 16 2.4% Very Good 4 0.09
0Site Zoning Zoned (or certain to be re-zoned) for ECS land use A 25 3.7% Excellent 5 0.19Site Zoning Zoning allows for sufficient density & building height A 25 3.7% Excellent 5 0.19Site Zoning Approval of other jurisdictions having authority A 25 3.7% Excellent 5 0.19
0Timing Acquisition timing A 25 3.7% Excellent 5 0.19Timing Approval timing A 25 3.7% Good 3 0.11Timing Construction timing A 25 3.7% Excellent 5 0.19
TOTAL SCORE 675 154 3.6286.16

8/3/2019 Education Centre Analyses
http://slidepdf.com/reader/full/education-centre-analyses 7/18
SITE # 5SITE NAME Flamborough Site
Name Flamborough Site Priority
AssignedWeighting
Points
Address 1046 Hwy 6 A 5
Closest Intersection Hwy 6 & Concession Rd. 6 W B 4
Site Area (acres) 5.33 C 3D 2E 1
Priority WeightingDifferenciation Factor 2.00
Scoring
Scoring
PointsExcellent 5Very Good 4Good 3Fair 2Poor 1Terrible 0
Category Criteria Rank Evaluation Score
Weighted
Score
Accessibility Public transit access B 16 2.4% Terrible 0 0.00
SCORING SYSTEM
WEIGHTING SYSTEMSITE INFORMATION
SITE SELECTION CRITERIA MODEL
PROPOSED EDUCATION CENTREHAMILTON WENTWORTH DISTRICT SCHOOL BOARD
SITE EVALUATION (SCORING MODEL)
CRITERIA WEIGHTING
% Weighting
Accessibility Highway / major arterial access A 25 3.7% Good 3 0.11Accessibility To pedestrian infrastructure C 9 1.3% Terrible 0 0.00Accessibility To bike paths C 9 1.3% Terrible 0 0.00Accessibility To board service vehicles B 16 2.4% Good 3 0.07Accessibility To other delivery vehicles D 4 0.6% Good 3 0.02Accessibility Accessible by all mobilility levels (complies with ODA Act) B 16 2.4% Fair 2 0.05
0Amenities Business services C 9 1.3% Terrible 0 0.00Amenities Restaurants B 16 2.4% Terrible 0 0.00Amenities Convention / meeting facilities D 4 0.6% Poor 1 0.01Amenities Other retail services C 9 1.3% Terrible 0 0.00
0Building Operating Costs Site Impacts on building operating costs (heating) B 16 2.4% Good 3 0.07
Building Operating Costs Site Impacts on building operating costs (hydro) C 9 1.3% Good 3 0.040
Capital Costs Site Costs, including geotechnical & remediation B 16 2.4% Good 3 0.07Capital Costs Infrastructure costs B 16 2.4% Poor 1 0.02Capital Costs Impacts on building costs C 9 1.3% Fair 2 0.03Capital Costs Impacts on parking construction costs C 9 1.3% Very Good 4 0.05
0Economic Impact Hamiltion as "best place to raise a child" D 4 0.6% Good 3 0.02Economic Impact Downtown Hamilton revitalization D 4 0.6% Poor 1 0.01Economic Impact Local economic benefits / impacts (job creation, etc.) B 16 2.4% Poor 1 0.02Economic Impact Aligns with GRIDS C 9 1.3% Poor 1 0.01
0Environmental Sustainability Sized to Minimize Building Footrpint B 16 2.4% Very Good 4 0.09Environmental Sustainability Infill Or brownfield rather than greenfield B 16 2.4% Poor 1 0.02Environmental Sustainability Re-use of existing buildng infrastructure C 9 1.3% Good 3 0.04
0Location Visibilility to public A 25 3.7% Fair 2 0.07Location Suitability to a "Landmark Building" B 16 2.4% Terrible 0 0.00Location Connections to / integration with surrounding communities B 16 2.4% Terrible 0 0.00
0Parking Off site availability A 25 3.7% Terrible 0 0.00Parking Off site parking rates B 16 2.4% Good 3 0.07
0Proximity To other key user groups C 9 1.3% Good 3 0.04Proximity To other key stakeholders C 9 1.3% Good 3 0.04Proximity To Schools A 25 3.7% Poor 1 0.04Proximity To administrative staff residences B 16 2.4% Terrible 0 0.00Proximity To student population D 4 0.6% Poor 1 0.01
0Site Size, Configuration & Topography Sufficient for building program, allows landmark gesture A 25 3.7% Poor 1 0.04Site Size, Configuration & Topography Sufficient for development of partner facilities (co-location) B 16 2.4% Terrible 0 0.00Site Size, Configuration & Topography Sufficient for parking needs A 25 3.7% Poor 1 0.04Site Size, Configuration & Topography Meetings topographical and geotechnical requirements B 16 2.4% Good 3 0.07
0Site Zoning Zoned (or certain to be re-zoned) for ECS land use A 25 3.7% Good 3 0.11Site Zoning Zoning allows for sufficient density & building height A 25 3.7% Very Good 4 0.15Site Zoning Approval of other jurisdictions having authority A 25 3.7% Good 3 0.11
0Timing Acquisition timing A 25 3.7% Good 3 0.11Timing Approval timing A 25 3.7% Good 3 0.11Timing Construction timing A 25 3.7% Fair 2 0.07
TOTAL SCORE 675 78 1.8468.39

8/3/2019 Education Centre Analyses
http://slidepdf.com/reader/full/education-centre-analyses 8/18
SITE # 2SITE NAME Highland Rd.
Name Highland Site Priority
AssignedWeighting
Points
Address 512 Highland Rd. A 5
Closest Intersection Highland Rd. & Upper Mt. Albion Rd. B 4
Site Area (acres) 16.6 C 3D 2E 1
Priority WeightingDifferenciation Factor 2.00
Scoring
Scoring
PointsExcellent 5Very Good 4Good 3Fair 2Poor 1Terrible 0
Category Criteria Rank Evaluation Score
Weighted
Score
Accessibility Public transit access B 16 2.4% Good 3 0.07
SITE SELECTION CRITERIA MODEL
PROPOSED EDUCATION CENTREHAMILTON WENTWORTH DISTRICT SCHOOL BOARD
% Weighting
SITE EVALUATION (SCORING MODEL)
CRITERIA WEIGHTING
SITE INFORMATION
SCORING SYSTEM
WEIGHTING SYSTEM
ccess y g way ma or ar er a access . xce en .Accessibility To pedestrian infrastructure C 9 1.3% Fair 2 0.03Accessibility To bike paths C 9 1.3% Good 3 0.04Accessibility To board service vehicles B 16 2.4% Very Good 4 0.09Accessibility To other delivery vehicles D 4 0.6% Very Good 4 0.02Accessibility Accessible by all mobilility levels (complies with ODA Act) B 16 2.4% Good 3 0.07
0Amenities Business services C 9 1.3% Fair 2 0.03Amenities Restaurants B 16 2.4% Very Good 4 0.09Amenities Convention / meeting facilities D 4 0.6% Fair 2 0.01Amenities Other retail services C 9 1.3% Very Good 4 0.05
0Building Operating Costs Site Impacts on building operating costs (heating) B 16 2.4% Good 3 0.07Building Operating Costs Site Impacts on building operating costs (hydro) C 9 1.3% Good 3 0.04
0Capital Costs Site Costs, including geotechnical & remediation B 16 2.4% Good 3 0.07Capital Costs Infrastructure costs B 16 2.4% Good 3 0.07Capital Costs Impacts on building costs C 9 1.3% Good 3 0.04Capital Costs Impacts on parking construction costs C 9 1.3% Very Good 4 0.05
0Economic Impact Hamiltion as "best place to raise a child" D 4 0.6% Good 3 0.02Economic Impact Downtown Hamilton revitalization D 4 0.6% Poor 1 0.01Economic Impact Local economic benefits / impacts (job creation, etc.) B 16 2.4% Good 3 0.07Economic Impact Aligns with GRIDS C 9 1.3% Fair 2 0.03
0Environmental Sustainability Sized to Minimize Building Footrpint B 16 2.4% Fair 2 0.05Environmental Sustainability Infill Or brownfield rather than greenfield B 16 2.4% Fair 2 0.05Environmental Sustainability Re-use of existing buildng infrastructure C 9 1.3% Good 3 0.04
0Location Visibilility to public A 25 3.7% Very Good 4 0.15Location Suitability to a "Landmark Building" B 16 2.4% Good 3 0.07Location Connections to / integration with surrounding communities B 16 2.4% Good 3 0.07
0Parking Off site availability A 25 3.7% Fair 2 0.07Parking Off site parking rates B 16 2.4% Good 3 0.07
0Proximity To other key user groups C 9 1.3% Fair 2 0.03
Proximity To other key stakeholders C 9 1.3% Good 3 0.04Proximity To Schools A 25 3.7% Very Good 4 0.15Proximity To administrative staff residences B 16 2.4% Very Good 4 0.09Proximity To student population D 4 0.6% Very Good 4 0.02
0Site Size, Configuration & Topography Sufficient for building program, allows landmark gesture A 25 3.7% Excellent 5 0.19Site Size, Configuration & Topography Sufficient for development of partner facilities (co-location) B 16 2.4% Very Good 4 0.09Site Size, Configuration & Topography Sufficient for parking needs A 25 3.7% Excellent 5 0.19Site Size, Configuration & Topography Meetings topographical and geotechnical requirements B 16 2.4% Good 3 0.07
0Site Zoning Zoned (or certain to be re-zoned) for ECS land use A 25 3.7% Very Good 4 0.15Site Zoning Zoning allows for sufficient density & building height A 25 3.7% Very Good 4 0.15Site Zoning Approval of other jurisdictions having authority A 25 3.7% Good 3 0.11
0Timing Acquisition timing A 25 3.7% Good 3 0.11Timing Approval timing A 25 3.7% Good 3 0.11Timing Construction timing A 25 3.7% Fair 2 0.07
.83.11

8/3/2019 Education Centre Analyses
http://slidepdf.com/reader/full/education-centre-analyses 9/18
SITE # 8SITE NAME Innovation Park
Name Innovation Park Priority
AssignedWeighting
Points
Address 175 & 270 Longwoods Rd. A 5
Closest Intersection Longwoods Rd. & Aberdeen Ave. B 4
Site Area (acres) 15.5 C 3D 2E 1
Priority WeightingDifferenciation Factor 2.00
Scoring
Scoring
PointsExcellent 5Very Good 4Good 3Fair 2Poor 1Terrible 0
Category Criteria Rank Evaluation Score
Weighted
Score
Accessibility Public transit access B 16 2.4% Fair 2 0.05
SITE SELECTION CRITERIA MODEL
PROPOSED EDUCATION CENTREHAMILTON WENTWORTH DISTRICT SCHOOL BOARD
% Weighting
SITE EVALUATION (SCORING MODEL)
CRITERIA WEIGHTING
SITE INFORMATION
SCORING SYSTEM
WEIGHTING SYSTEM
Accessibility Highway / major arterial access A 25 3.7% Very Good 4 0.15Accessibility To pedestrian infrastructure C 9 1.3% Good 3 0.04Accessibility To bike paths C 9 1.3% Fair 2 0.03Accessibility To board service vehicles B 16 2.4% Excellent 5 0.12Accessibility To other delivery vehicles D 4 0.6% Excellent 5 0.03Accessibility Accessible by all mobilility levels (complies with ODA Act) B 16 2.4% Good 3 0.07
0Amenities Business services C 9 1.3% Good 3 0.04Amenities Restaurants B 16 2.4% Good 3 0.07Amenities Convention / meeting facilities D 4 0.6% Good 3 0.02Amenities Other retail services C 9 1.3% Good 3 0.04
0Building Operating Costs Site Impacts on building operating costs (heating) B 16 2.4% Good 3 0.07
Building Operating Costs Site Impacts on building operating costs (hydro) C 9 1.3% Good 3 0.040
Capital Costs Site Costs, including geotechnical & remediation B 16 2.4% Poor 1 0.02Capital Costs Infrastructure costs B 16 2.4% Very Good 4 0.09Capital Costs Impacts on building costs C 9 1.3% Fair 2 0.03Capital Costs Impacts on parking construction costs C 9 1.3% Very Good 4 0.05
0Economic Impact Hamiltion as "best place to raise a child" D 4 0.6% Good 3 0.02Economic Impact Downtown Hamilton revitalization D 4 0.6% Poor 1 0.01Economic Impact Local economic benefits / impacts (job creation, etc.) B 16 2.4% Poor 1 0.02Economic Impact Aligns with GRIDS C 9 1.3% Very Good 4 0.05
0Environmental Sustainability Sized to Minimize Building Footrpint B 16 2.4% Poor 1 0.02Environmental Sustainability Infill Or brownfield rather than greenfield B 16 2.4% Excellent 5 0.12Environmental Sustainability Re-use of existing buildng infrastructure C 9 1.3% Good 3 0.04
0Location Visibilility to public A 25 3.7% Fair 2 0.07Location Suitability to a "Landmark Building" B 16 2.4% Good 3 0.07Location Connections to / integration with surrounding communities B 16 2.4% Fair 2 0.05
0Parking Off site availability A 25 3.7% Very Good 4 0.15Parking Off site parking rates B 16 2.4% Very Good 4 0.09
0Proximity To other key user groups C 9 1.3% Very Good 4 0.05Proximity To other key stakeholders C 9 1.3% Very Good 4 0.05Proximity To Schools A 25 3.7% Good 3 0.11Proximity To administrative staff residences B 16 2.4% Good 3 0.07Proximity To student population D 4 0.6% Good 3 0.02
0Site Size, Configuration & Topography Sufficient for building program, allows landmark gesture A 25 3.7% Very Good 4 0.15Site Size, Configuration & Topography Sufficient for development of partner facilities (co-location) B 16 2.4% Fair 2 0.05Site Size, Configuration & Topography Sufficient for parking needs A 25 3.7% Excellent 5 0.19Site Size, Configuration & Topography Meetings topographical and geotechnical requirements B 16 2.4% Poor 1 0.02
0Site Zoning Zoned (or certain to be re-zoned) for ECS land use A 25 3.7% Very Good 4 0.15Site Zoning Zoning allows for sufficient density & building height A 25 3.7% Excellent 5 0.19Site Zoning Approval of other jurisdictions having authority A 25 3.7% Good 3 0.11
0Timing Acquisition timing A 25 3.7% Good 3 0.11Timing Approval timing A 25 3.7% Good 3 0.11Timing Construction timing A 25 3.7% Very Good 4 0.15
TOTAL SCORE 675 137 3.2082.04

8/3/2019 Education Centre Analyses
http://slidepdf.com/reader/full/education-centre-analyses 10/18
SITE # 17SITE NAME Jackson Square
Name Jackson Square Priority
AssignedWeighting
Points
Address 77 James St. N A 5
Closest Intersection James St. & King St. E B 4
Site Area (acres) 3.5 C 3D 2E 1
Priority WeightingDifferenciation Factor 2.00
Scoring
Scoring
PointsExcellent 5Very Good 4Good 3Fair 2Poor 1Terrible 0
Category Criteria Rank Evaluation Score
Weighted
Score
Accessibility Public transit access B 16 2.4% Excellent 5 0.12
SCORING SYSTEM
WEIGHTING SYSTEMSITE INFORMATION
SITE SELECTION CRITERIA MODEL
PROPOSED EDUCATION CENTREHAMILTON WENTWORTH DISTRICT SCHOOL BOARD
SITE EVALUATION (SCORING MODEL)
CRITERIA WEIGHTING
% Weighting
ccess ty g way / ma or arter a access 25 3.7% oo 3 0.11Accessibility To pedestrian infrastructure C 9 1.3% Very Good 4 0.05Accessibility To bike paths C 9 1.3% Fair 2 0.03Accessibility To board service vehicles B 16 2.4% Poor 1 0.02Accessibility To other delivery vehicles D 4 0.6% Poor 1 0.01Accessibility Accessible by all mobilility levels (complies with ODA Act) B 16 2.4% Good 3 0.07
0Amenities Business services C 9 1.3% Excellent 5 0.07Amenities Restaurants B 16 2.4% Excellent 5 0.12Amenities Convention / meeting facilities D 4 0.6% Excellent 5 0.03Amenities Other retail services C 9 1.3% Excellent 5 0.07
0Building Operating Costs Site Impacts on building operating costs (heating) B 16 2.4% Excellent 5 0.12
Building Operating Costs Site Impacts on building operating costs (hydro) C 9 1.3% Very Good 4 0.050Capital Costs Site Costs, including geotechnical & remediation B 16 2.4% Excellent 5 0.12Capital Costs Infrastructure costs B 16 2.4% Excellent 5 0.12Capital Costs Impacts on building costs C 9 1.3% Excellent 5 0.07Capital Costs Impacts on parking construction costs C 9 1.3% Good 3 0.04
0Economic Impact Hamiltion as "best place to raise a child" D 4 0.6% Good 3 0.02Economic Impact Downtown Hamilton revitalization D 4 0.6% Very Good 4 0.02Economic Impact Local economic benefits / impacts (job creation, etc.) B 16 2.4% Very Good 4 0.09Economic Impact Aligns with GRIDS C 9 1.3% Very Good 4 0.05
0Environmental Sustainability Sized to Minimize Building Footrpint B 16 2.4% Excellent 5 0.12Environmental Sustainability Infill Or brownfield rather than greenfield B 16 2.4% Excellent 5 0.12Environmental Sustainability Re-use of existing buildng infrastructure C 9 1.3% Excellent 5 0.07
0Location Visibilility to public A 25 3.7% Very Good 4 0.15Location Suitability to a "Landmark Building" B 16 2.4% Good 3 0.07Location Connections to / integration with surrounding communities B 16 2.4% Very Good 4 0.09
0Parking Off site availability A 25 3.7% Excellent 5 0.19Parking Off site parking rates B 16 2.4% Terrible 0 0.00
0Proximity To other key user groups C 9 1.3% Very Good 4 0.05
Proximity To other key stakeholders C 9 1.3% Very Good 4 0.05Proximity To Schools A 25 3.7% Fair 2 0.07Proximity To administrative staff residences B 16 2.4% Fair 2 0.05Proximity To student population D 4 0.6% Fair 2 0.01
0Site Size, Configuration & Topography Sufficient for building program, allows landmark gesture A 25 3.7% Terrible 0 0.00Site Size, Configuration & Topography Sufficient for development of partner facilities (co-location) B 16 2.4% Terrible 0 0.00Site Size, Configuration & Topography Sufficient for parking needs A 25 3.7% Terrible 0 0.00Site Size, Configuration & Topography Meetings topographical and geotechnical requirements B 16 2.4% Excellent 5 0.12
0Site Zoning Zoned (or certain to be re-zoned) for ECS land use A 25 3.7% Excellent 5 0.19Site Zoning Zoning allows for sufficient density & building height A 25 3.7% Excellent 5 0.19Site Zoning Approval of other jurisdictions having authority A 25 3.7% Excellent 5 0.19
0Timing Acquisition timing A 25 3.7% Very Good 4 0.15Timing Approval timing A 25 3.7% Excellent 5 0.19Timing Construction timing A 25 3.7% Excellent 5 0.19
.86.33

8/3/2019 Education Centre Analyses
http://slidepdf.com/reader/full/education-centre-analyses 11/18
SITE # 12SITE NAME Jerome Site
Name Jerome Site Priority
Assigned
WeightingPoints
Address 1310 Upper Wellington A 5
Closest Intersection Upper Wellington St. & L. A. Pkwy B 4
Site Area (acres) 26.9 C 3D 2E 1
Priority WeightingDifferenciation Factor 2.00
ScoringScoringPoints
Excellent 5Very Good 4Good 3Fair 2Poor 1Terrible 0
Category Criteria Rank Evaluation ScoreWeighted
Score
Accessibility Public transit access B 16 2.4% Good 3 0.07
SITE SELECTION CRITERIA MODEL
PROPOSED EDUCATION CENTREHAMILTON WENTWORTH DISTRICT SCHOOL BOARD
% Weighting
SITE EVALUATION (SCORING MODEL)
CRITERIA WEIGHTING
SITE INFORMATION
SCORING SYSTEM
WEIGHTING SYSTEM
Accessibility Highway / major arterial access A 25 3.7% Good 3 0.11Accessibility To pedestrian infrastructure C 9 1.3% Good 3 0.04Accessibility To bike paths C 9 1.3% Good 3 0.04Accessibility To board service vehicles B 16 2.4% Good 3 0.07Accessibility To other delivery vehicles D 4 0.6% Good 3 0.02Accessibility Accessible by all mobilility levels (complies with ODA Act) B 16 2.4% Good 3 0.07
0Amenities Business services C 9 1.3% Good 3 0.04Amenities Restaurants B 16 2.4% Fair 2 0.05Amenities Convention / meeting facilities D 4 0.6% Good 3 0.02Amenities Other retail services C 9 1.3% Fair 2 0.03
0Building Operating Costs Site Impacts on building operating costs (heating) B 16 2.4% Good 3 0.07
Building Operating Costs Site Impacts on building operating costs (hydro) C 9 1.3% Good 3 0.040Capital Costs Site Costs, including geotechnical & remediation B 16 2.4% Good 3 0.07Capital Costs Infrastructure costs B 16 2.4% Good 3 0.07Capital Costs Impacts on building costs C 9 1.3% Very Good 4 0.05Capital Costs Impacts on parking construction costs C 9 1.3% Very Good 4 0.05
0Economic Impact Hamiltion as "best place to raise a child" D 4 0.6% Good 3 0.02Economic Impact Downtown Hamilton revitalization D 4 0.6% Poor 1 0.01Economic Impact Local economic benefits / impacts (job creation, etc.) B 16 2.4% Poor 1 0.02Economic Impact Aligns with GRIDS C 9 1.3% Good 3 0.04
0Environmental Sustainability Sized to Minimize Building Footrpint B 16 2.4% Poor 1 0.02Environmental Sustainability Infill Or brownfield rather than greenfield B 16 2.4% Fair 2 0.05Environmental Sustainability Re-use of existing buildng infrastructure C 9 1.3% Good 3 0.04
0Location Visibilility to public A 25 3.7% Poor 1 0.04Location Suitability to a "Landmark Building" B 16 2.4% Terrible 0 0.00Location Connections to / integration with surrounding communities B 16 2.4% Fair 2 0.05
0Parking Off site availability A 25 3.7% Poor 1 0.04Parking Off site parking rates B 16 2.4% Good 3 0.07
0Proximity To other key user groups C 9 1.3% Good 3 0.04
Proximity To other key stakeholders C 9 1.3% Good 3 0.04Proximity To Schools A 25 3.7% Very Good 4 0.15Proximity To administrative staff residences B 16 2.4% Very Good 4 0.09Proximity To student population D 4 0.6% Very Good 4 0.02
0Site Size, Configuration & Topography Sufficient for building program, allows landmark gesture A 25 3.7% Excellent 5 0.19Site Size, Configuration & Topography Sufficient for development of partner facilities (co-location) B 16 2.4% Excellent 5 0.12Site Size, Configuration & Topography Sufficient for parking needs A 25 3.7% Excellent 5 0.19Site Size, Configuration & Topography Meetings topographical and geotechnical requirements B 16 2.4% Very Good 4 0.09
0Site Zoning Zoned (or certain to be re-zoned) for ECS land use A 25 3.7% Very Good 4 0.15Site Zoning Zoning allows for sufficient density & building height A 25 3.7% Very Good 4 0.15Site Zoning Approval of other jurisdictions having authority A 25 3.7% Very Good 4 0.15
0Timing Acquisition timing A 25 3.7% Excellent 5 0.19Timing Approval timing A 25 3.7% Good 3 0.11Timing Construction timing A 25 3.7% Very Good 4 0.15
.81.24

8/3/2019 Education Centre Analyses
http://slidepdf.com/reader/full/education-centre-analyses 12/18
SITE # 10SITE NAME King & Queen
Name King & Queen Site Priority
Assigned
WeightingPoints
Address King & Queen A 5
Closest Intersection King & Queen B 4
Site Area (acres) 3.79 C 3D 2E 1
Priority WeightingDifferenciation Factor 2.00
ScoringScoringPoints
Excellent 5Very Good 4Good 3Fair 2Poor 1Terrible 0
Category Criteria Rank Evaluation ScoreWeighted
Score
Accessibility Public transit access B 16 2.4% Excellent 5 0.12
SITE SELECTION CRITERIA MODEL
PROPOSED EDUCATION CENTREHAMILTON WENTWORTH DISTRICT SCHOOL BOARD
% Weighting
SITE INFORMATION
SCORING SYSTEM
WEIGHTING SYSTEM
SITE EVALUATION (SCORING MODEL)
CRITERIA WEIGHTING
Accessibility Highway / major arterial access A 25 3.7% Good 3 0.11Accessibility To pedestrian infrastructure C 9 1.3% Very Good 4 0.05Accessibility To bike paths C 9 1.3% Fair 2 0.03Accessibility To board service vehicles B 16 2.4% Fair 2 0.05Accessibility To other delivery vehicles D 4 0.6% Fair 2 0.01Accessibility Accessible by all mobilility levels (complies with ODA Act) B 16 2.4% Good 3 0.07
0Amenities Business services C 9 1.3% Very Good 4 0.05Amenities Restaurants B 16 2.4% Excellent 5 0.12Amenities Convention / meeting facilities D 4 0.6% Very Good 4 0.02Amenities Other retail services C 9 1.3% Very Good 4 0.05
0Building Operating Costs Site Impacts on building operating costs (heating) B 16 2.4% Good 3 0.07
Building Operating Costs Site Impacts on building operating costs (hydro) C 9 1.3% Good 3 0.040Capital Costs Site Costs, including geotechnical & remediation B 16 2.4% Fair 2 0.05Capital Costs Infrastructure costs B 16 2.4% Good 3 0.07Capital Costs Impacts on building costs C 9 1.3% Fair 2 0.03Capital Costs Impacts on parking construction costs C 9 1.3% Terrible 0 0.00
0Economic Impact Hamiltion as "best place to raise a child" D 4 0.6% Good 3 0.02Economic Impact Downtown Hamilton revitalization D 4 0.6% Very Good 4 0.02Economic Impact Local economic benefits / impacts (job creation, etc.) B 16 2.4% Good 3 0.07Economic Impact Aligns with GRIDS C 9 1.3% Excellent 5 0.07
0Environmental Sustainability Sized to Minimize Building Footrpint B 16 2.4% Excellent 5 0.12Environmental Sustainability Infill Or brownfield rather than greenfield B 16 2.4% Very Good 4 0.09Environmental Sustainability Re-use of existing buildng infrastructure C 9 1.3% Poor 1 0.01
0Location Visibilility to public A 25 3.7% Very Good 4 0.15Location Suitability to a "Landmark Building" B 16 2.4% Very Good 4 0.09Location Connections to / integration with surrounding communities B 16 2.4% Very Good 4 0.09
0Parking Off site availability A 25 3.7% Very Good 4 0.15Parking Off site parking rates B 16 2.4% Poor 1 0.02
0Proximity To other key user groups C 9 1.3% Good 3 0.04
Proximity To other key stakeholders C 9 1.3% Good 3 0.04Proximity To Schools A 25 3.7% Fair 2 0.07Proximity To administrative staff residences B 16 2.4% Fair 2 0.05Proximity To student population D 4 0.6% Fair 2 0.01
0Site Size, Configuration & Topography Sufficient for building program, allows landmark gesture A 25 3.7% Terrible 0 0.00Site Size, Configuration & Topography Sufficient for development of partner facilities (co-location) B 16 2.4% Terrible 0 0.00Site Size, Configuration & Topography Sufficient for parking needs A 25 3.7% Terrible 0 0.00Site Size, Configuration & Topography Meetings topographical and geotechnical requirements B 16 2.4% Good 3 0.07
0Site Zoning Zoned (or certain to be re-zoned) for ECS land use A 25 3.7% Good 3 0.11Site Zoning Zoning allows for sufficient density & building height A 25 3.7% Good 3 0.11Site Zoning Approval of other jurisdictions having authority A 25 3.7% Good 3 0.11
0Timing Acquisition timing A 25 3.7% Fair 2 0.07Timing Approval timing A 25 3.7% Good 3 0.11Timing Construction timing A 25 3.7% Fair 2 0.07
.77.38
8/3/2019 Education Centre Analyses
http://slidepdf.com/reader/full/education-centre-analyses 13/18
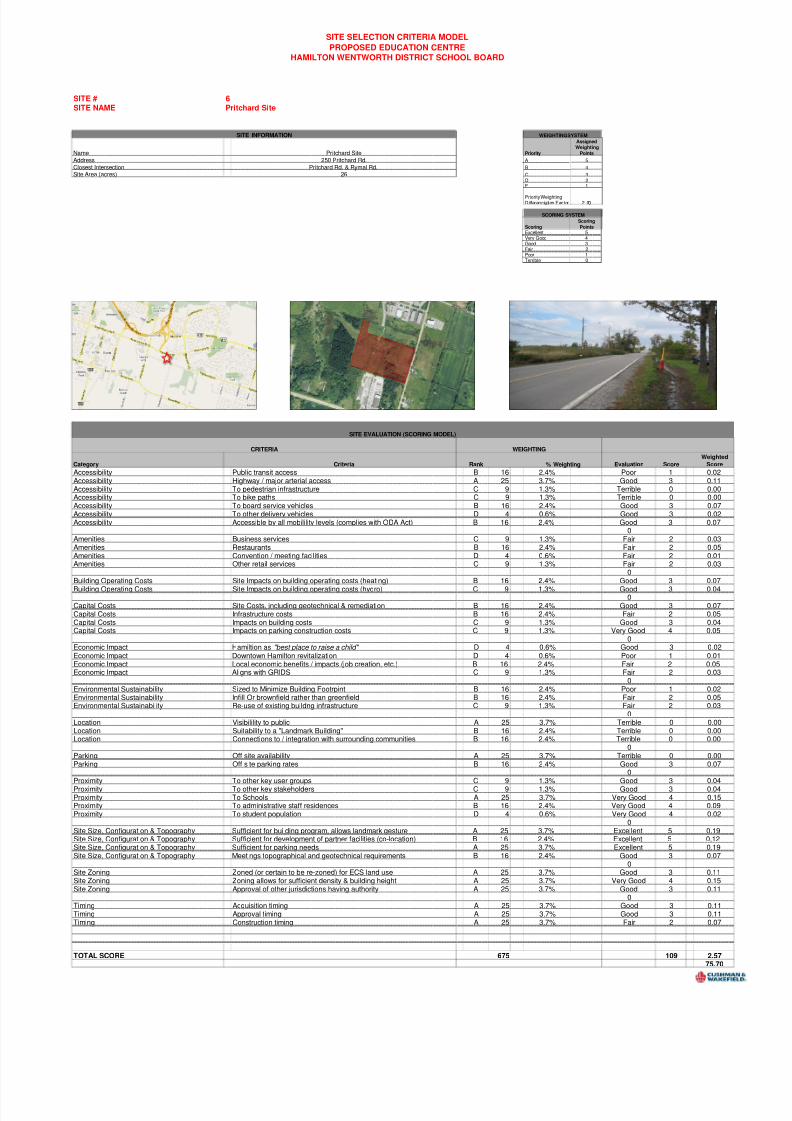
SITE # 6SITE NAME Pritchard Site
Name Pritchard Site Priority
AssignedWeighting
Points
Address 250 Pritchard Rd. A 5
Closest Intersection Pritchard Rd. & Rymal Rd. B 4
Site Area (acres) 26 C 3D 2E 1
Priority WeightingDifferenciation Factor 2.00
Scoring
Scoring
PointsExcellent 5Very Good 4Good 3Fair 2Poor 1Terrible 0
Category Criteria Rank Evaluation Score
Weighted
Score
Accessibility Public transit access B 16 2.4% Poor 1 0.02
SITE SELECTION CRITERIA MODEL
PROPOSED EDUCATION CENTREHAMILTON WENTWORTH DISTRICT SCHOOL BOARD
% Weighting
SITE EVALUATION (SCORING MODEL)
CRITERIA WEIGHTING
SITE INFORMATION
SCORING SYSTEM
WEIGHTING SYSTEM
Accessibility Highway / major arterial access A 25 3.7% Good 3 0.11Accessibility To pedestrian infrastructure C 9 1.3% Terrible 0 0.00Accessibility To bike paths C 9 1.3% Terrible 0 0.00Accessibility To board service vehicles B 16 2.4% Good 3 0.07Accessibility To other delivery vehicles D 4 0.6% Good 3 0.02Accessibility Accessible by all mobilility levels (complies with ODA Act) B 16 2.4% Good 3 0.07
0Amenities Business services C 9 1.3% Fair 2 0.03Amenities Restaurants B 16 2.4% Fair 2 0.05Amenities Convention / meeting facilities D 4 0.6% Fair 2 0.01Amenities Other retail services C 9 1.3% Fair 2 0.03
0Building Operating Costs Site Impacts on building operating costs (heating) B 16 2.4% Good 3 0.07
Building Operating Costs Site Impacts on building operating costs (hydro) C 9 1.3% Good 3 0.040
Capital Costs Site Costs, including geotechnical & remediation B 16 2.4% Good 3 0.07Capital Costs Infrastructure costs B 16 2.4% Fair 2 0.05Capital Costs Impacts on building costs C 9 1.3% Good 3 0.04Capital Costs Impacts on parking construction costs C 9 1.3% Very Good 4 0.05
0Economic Impact Hamiltion as "best place to raise a child" D 4 0.6% Good 3 0.02Economic Impact Downtown Hamilton revitalization D 4 0.6% Poor 1 0.01Economic Impact Local economic benefits / impacts (job creation, etc.) B 16 2.4% Fair 2 0.05Economic Impact Aligns with GRIDS C 9 1.3% Fair 2 0.03
0Environmental Sustainability Sized to Minimize Building Footrpint B 16 2.4% Poor 1 0.02Environmental Sustainability Infill Or brownfield rather than greenfield B 16 2.4% Fair 2 0.05Environmental Sustainability Re-use of existing buildng infrastructure C 9 1.3% Fair 2 0.03
0Location Visibilility to public A 25 3.7% Terrible 0 0.00Location Suitability to a "Landmark Building" B 16 2.4% Terrible 0 0.00Location Connections to / integration with surrounding communities B 16 2.4% Terrible 0 0.00
0Parking Off site availability A 25 3.7% Terrible 0 0.00Parking Off site parking rates B 16 2.4% Good 3 0.07
0Proximity To other key user groups C 9 1.3% Good 3 0.04Proximity To other key stakeholders C 9 1.3% Good 3 0.04Proximity To Schools A 25 3.7% Very Good 4 0.15Proximity To administrative staff residences B 16 2.4% Very Good 4 0.09Proximity To student population D 4 0.6% Very Good 4 0.02
0Site Size, Configuration & Topography Sufficient for building program, allows landmark gesture A 25 3.7% Excellent 5 0.19Site Size, Configuration & Topography Sufficient for development of partner facilities (co-location) B 16 2.4% Excellent 5 0.12Site Size, Configuration & Topography Sufficient for parking needs A 25 3.7% Excellent 5 0.19Site Size, Configuration & Topography Meetings topographical and geotechnical requirements B 16 2.4% Good 3 0.07
0Site Zoning Zoned (or certain to be re-zoned) for ECS land use A 25 3.7% Good 3 0.11Site Zoning Zoning allows for sufficient density & building height A 25 3.7% Very Good 4 0.15Site Zoning Approval of other jurisdictions having authority A 25 3.7% Good 3 0.11
0Timing Acquisition timing A 25 3.7% Good 3 0.11Timing Approval timing A 25 3.7% Good 3 0.11Timing Construction timing A 25 3.7% Fair 2 0.07
TOTAL SCORE 675 109 2.5775.70

8/3/2019 Education Centre Analyses
http://slidepdf.com/reader/full/education-centre-analyses 14/18
SITE # 13SITE NAME Sheldon Site
Name Sheldon Site Priority
AssignedWeighting
Points
Address 315 Stone Church Rd. W A 5
Closest Intersection Stone Church Rd. W & Garth St. B 4
Site Area (acres) 29.1 C 3D 2E 1
Prior ity Weigh ting Dif fe renciat ion Facto r 2 .00
Scoring
Scoring
PointsExcellent 5Very Good 4Good 3Fair 2Poor 1Terrible 0
Category Criteria Rank Evaluation Score
Weight
Scor
Accessibility Public transit access B 16 2.4% Good 3 0.07Accessibilit Hi hwa / ma or arterial access A 25 3.7% Ver Good 4 0.15
SCORING SYSTEM
WEIGHTING SYSTEMSITE INFORMATION
SITE SELECTION CRITERIA MODEL
PROPOSED EDUCATION CENTREHAMILTON WENTWORTH DISTRICT SCHOOL BOARD
SITE EVALUATION (SCORING MODEL)
CRITERIA WEIGHTING
% Weighting
Accessibility To pedestrian infrastructure C 9 1.3% Good 3 0.04Accessibility To bike paths C 9 1.3% Good 3 0.04Accessibility To board service vehicles B 16 2.4% Good 3 0.07Accessibility To other delivery vehicles D 4 0.6% Good 3 0.02Accessibility Accessible by all mobilility levels (complies with ODA Act) B 16 2.4% Good 3 0.07
0Amenities Business services C 9 1.3% Good 3 0.04Amenities Restaurants B 16 2.4% Fair 2 0.05Amenities Convention / meeting facilities D 4 0.6% Fair 2 0.01Amenities Other retail services C 9 1.3% Fair 2 0.03
0Building Operating Costs Site Impacts on building operating costs (heating) B 16 2.4% Good 3 0.07Building Operating Costs Site Impacts on building operating costs (hydro) C 9 1.3% Good 3 0.04
0Capital Costs Site Costs, including geotechnical & remediation B 16 2.4% Good 3 0.07Capital Costs Infrastructure costs B 16 2.4% Fair 2 0.05Capital Costs Impacts on building costs C 9 1.3% Fair 2 0.03Capital Costs Impacts on parking construction costs C 9 1.3% Excellent 5 0.07
0Economic Impact Hamiltion as "best place to raise a child" D 4 0.6% Good 3 0.02Economic Impact Downtown Hamilton revitalization D 4 0.6% Poor 1 0.01Economic Impact Local economic benefits / impacts (job creation, etc.) B 16 2.4% Poor 1 0.02Economic Impact Aligns with GRIDS C 9 1.3% Fair 2 0.03
0Environmental Sustainability Sized to Minimize Building Footrpint B 16 2.4% Poor 1 0.02Environmental Sustainability Infill Or brownfield rather than greenfield B 16 2.4% Fair 2 0.05Environmental Sustainability Re-use of existing buildng infrastructure C 9 1.3% Fair 2 0.03
0Location Visibilility to public A 25 3.7% Poor 1 0.04Location Suitability to a "Landmark Building" B 16 2.4% Terrible 0 0.00Location Connections to / integration with surrounding communities B 16 2.4% Fair 2 0.05
0Parking Off site availability A 25 3.7% Poor 1 0.04Parking Off site parking rates B 16 2.4% Good 3 0.07
0Proximity To other key user groups C 9 1.3% Good 3 0.04
Proximity To other key stakeholders C 9 1.3% Good 3 0.04Proximity To Schools A 25 3.7% Very Good 4 0.15Proximity To administrative staff residences B 16 2.4% Very Good 4 0.09Proximity To student population D 4 0.6% Very Good 4 0.02
0Site Size, Configuration & Topography Sufficient for building program, allows landmark gesture A 25 3.7% Excellent 5 0.19Site Size, Configuration & Topography Sufficient for development of partner facilities (co-location) B 16 2.4% Very Good 4 0.09Site Size, Configuration & Topography Sufficient for parking needs A 25 3.7% Excellent 5 0.19Site Size, Configuration & Topography Meetings topographical and geotechnical requirements B 16 2.4% Good 3 0.07
0Site Zoning Zoned (or certain to be re-zoned) for ECS land use A 25 3.7% Very Good 4 0.15Site Zoning Zoning allows for sufficient density & building height A 25 3.7% Very Good 4 0.15Site Zoning Approval of other jurisdictions having authority A 25 3.7% Very Good 4 0.15
0Timing Acquisition timing A 25 3.7% Excellent 5 0.19Timing Approval timing A 25 3.7% Good 3 0.11Timing Construction timing A 25 3.7% Good 3 0.11
TOTAL SCORE 675 126 3.0180.0
8/3/2019 Education Centre Analyses
http://slidepdf.com/reader/full/education-centre-analyses 15/18
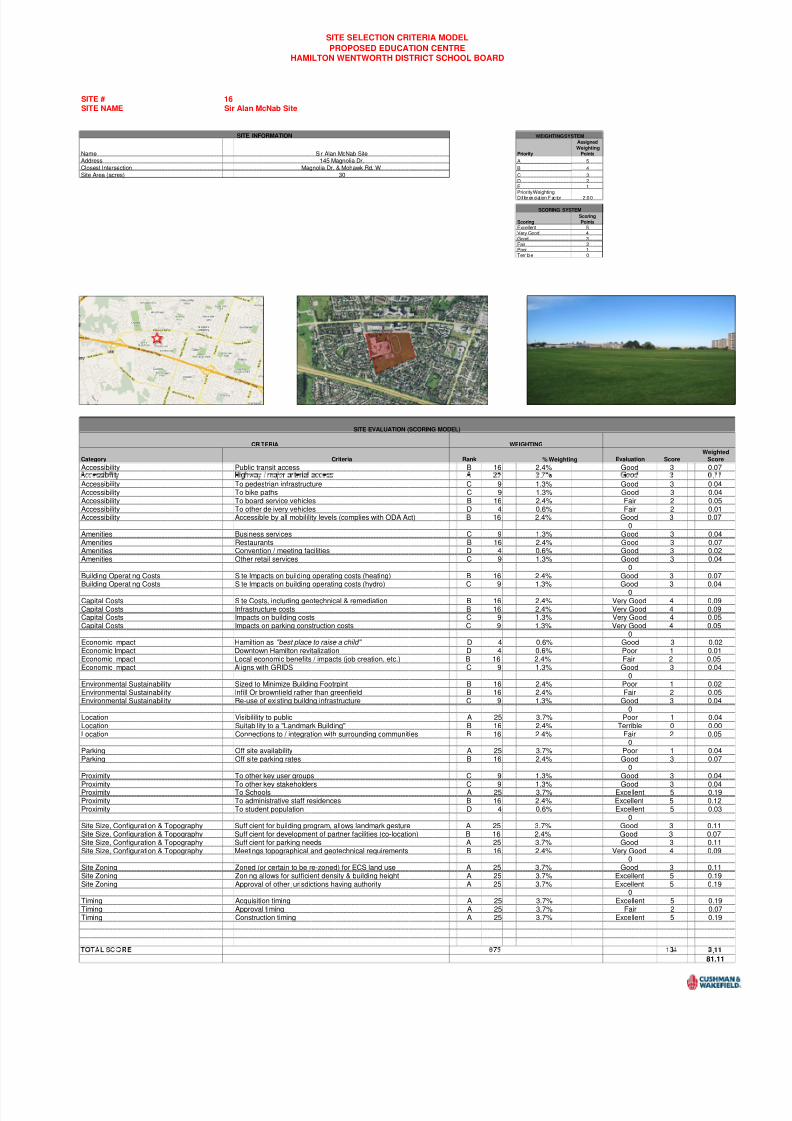
SITE # 16SITE NAME Sir Alan McNab Site
Name Sir Alan McNab Site Priority
Assigned
WeightingPoints
Address 145 Magnolia Dr. A 5
Closest Intersection Magnolia Dr. & Mohawk Rd. W B 4
Site Area (acres) 30 C 3D 2E 1Priority Weighting
D if feren ciat ion Fac tor 2 .0 0
ScoringScoringPoints
Excellent 5Very Good 4Good 3Fair 2Poor 1Terrible 0
Category Criteria Rank Evaluation ScoreWeighted
Score
Accessibility Public transit access B 16 2.4% Good 3 0.07
SITE SELECTION CRITERIA MODEL
PROPOSED EDUCATION CENTREHAMILTON WENTWORTH DISTRICT SCHOOL BOARD
% Weighting
SITE EVALUATION (SCORING MODEL)
CRITERIA WEIGHTING
SITE INFORMATION
SCORING SYSTEM
WEIGHTING SYSTEM
. .Accessibility To pedestrian infrastructure C 9 1.3% Good 3 0.04Accessibility To bike paths C 9 1.3% Good 3 0.04Accessibility To board service vehicles B 16 2.4% Fair 2 0.05Accessibility To other delivery vehicles D 4 0.6% Fair 2 0.01Accessibility Accessible by all mobilility levels (complies with ODA Act) B 16 2.4% Good 3 0.07
0Amenities Business services C 9 1.3% Good 3 0.04Amenities Restaurants B 16 2.4% Good 3 0.07Amenities Convention / meeting facilities D 4 0.6% Good 3 0.02Amenities Other retail services C 9 1.3% Good 3 0.04
0Building Operating Costs Site Impacts on building operating costs (heating) B 16 2.4% Good 3 0.07Building Operating Costs Site Impacts on building operating costs (hydro) C 9 1.3% Good 3 0.04
0Capital Costs Site Costs, including geotechnical & remediation B 16 2.4% Very Good 4 0.09Capital Costs Infrastructure costs B 16 2.4% Very Good 4 0.09Capital Costs Impacts on building costs C 9 1.3% Very Good 4 0.05Capital Costs Impacts on parking construction costs C 9 1.3% Very Good 4 0.05
0Economic Impact Hamiltion as "best place to raise a child" D 4 0.6% Good 3 0.02Economic Impact Downtown Hamilton revitalization D 4 0.6% Poor 1 0.01Economic Impact Local economic benefits / impacts (job creation, etc.) B 16 2.4% Fair 2 0.05Economic Impact Aligns with GRIDS C 9 1.3% Good 3 0.04
0Environmental Sustainability Sized to Minimize Building Footrpint B 16 2.4% Poor 1 0.02Environmental Sustainability Infill Or brownfield rather than greenfield B 16 2.4% Fair 2 0.05Environmental Sustainability Re-use of existing buildng infrastructure C 9 1.3% Good 3 0.04
0Location Visibilility to public A 25 3.7% Poor 1 0.04Location Suitability to a "Landmark Building" B 16 2.4% Terrible 0 0.00Location Connections to / integration with surrounding communities B 16 2.4% Fair 2 0.05
0Parking Off site availability A 25 3.7% Poor 1 0.04Parking Off site parking rates B 16 2.4% Good 3 0.07
0Proximity To other key user groups C 9 1.3% Good 3 0.04
Proximity To other key stakeholders C 9 1.3% Good 3 0.04Proximity To Schools A 25 3.7% Excellent 5 0.19Proximity To administrative staff residences B 16 2.4% Excellent 5 0.12Proximity To student population D 4 0.6% Excellent 5 0.03
0Site Size, Configuration & Topography Sufficient for building program, allows landmark gesture A 25 3.7% Good 3 0.11Site Size, Configuration & Topography Sufficient for development of partner facilities (co-location) B 16 2.4% Good 3 0.07Site Size, Configuration & Topography Sufficient for parking needs A 25 3.7% Good 3 0.11Site Size, Configuration & Topography Meetings topographical and geotechnical requirements B 16 2.4% Very Good 4 0.09
0Site Zoning Zoned (or certain to be re-zoned) for ECS land use A 25 3.7% Good 3 0.11Site Zoning Zoning allows for sufficient density & building height A 25 3.7% Excellent 5 0.19Site Zoning Approval of other jurisdictions having authority A 25 3.7% Excellent 5 0.19
0Timing Acquisition timing A 25 3.7% Excellent 5 0.19Timing Approval timing A 25 3.7% Fair 2 0.07Timing Construction timing A 25 3.7% Excellent 5 0.19
.81.11

8/3/2019 Education Centre Analyses
http://slidepdf.com/reader/full/education-centre-analyses 16/18
SITE # 3SITE NAME Stone Church and Pritchard
Name Pritchard Site Priority
Assigned
WeightingPoints
Address 130 Mud St. & 1565 Stone Church Rd. E A 5
Closest Intersection Stone Church Rd. E & Pritchard Rd. B 4
Site Area (acres) 16 C 3D 2E 1
Priority WeightingDifferenciation Factor 2.00
Scoring
Scoring
PointsExcellent 5Very Good 4Good 3Fair 2Poor 1Terrible 0
Category Criteria Rank Evaluation ScoreWeighted
Score
Accessibilit Public transit access B 16 2.4% Good 3 0.07
SCORING SYSTEM
WEIGHTING SYSTEMSITE INFORMATION
SITE SELECTION CRITERIA MODEL
PROPOSED EDUCATION CENTREHAMILTON WENTWORTH DISTRICT SCHOOL BOARD
SITE EVALUATION (SCORING MODEL)
CRITERIA WEIGHTING
% Weighting
. .Accessibility Highway / major arterial access A 25 3.7% Excellent 5 0.19Accessibility To pedestrian infrastructure C 9 1.3% Poor 1 0.01Accessibility To bike paths C 9 1.3% Good 3 0.04Accessibility To board service vehicles B 16 2.4% Very Good 4 0.09Accessibility To other delivery vehicles D 4 0.6% Very Good 4 0.02Accessibility Accessible by all mobilility levels (complies with ODA Act) B 16 2.4% Good 3 0.07
0Amenities Business services C 9 1.3% Fair 2 0.03Amenities Restaurants B 16 2.4% Good 3 0.07Amenities Convention / meeting facilities D 4 0.6% Fair 2 0.01Amenities Other retail services C 9 1.3% Good 3 0.04
0Building Operating Costs Site Impacts on building operating costs (heating) B 16 2.4% Good 3 0.07
Building Operating Costs Site Impacts on building operating costs (hydro) C 9 1.3% Good 3 0.040
Capital Costs Site Costs, including geotechnical & remediation B 16 2.4% Good 3 0.07Capital Costs Infrastructure costs B 16 2.4% Fair 2 0.05Capital Costs Impacts on building costs C 9 1.3% Good 3 0.04Capital Costs Impacts on parking construction costs C 9 1.3% Very Good 4 0.05
0Economic Impact Hamiltion as "best place to raise a child" D 4 0.6% Good 3 0.02Economic Impact Downtown Hamilton revitalization D 4 0.6% Poor 1 0.01Economic Impact Local economic benefits / impacts (job creation, etc.) B 16 2.4% Fair 2 0.05Economic Impact Aligns with GRIDS C 9 1.3% Fair 2 0.03
0Environmental Sustainability Sized to Minimize Building Footrpint B 16 2.4% Fair 2 0.05Environmental Sustainability Infill Or brownfield rather than greenfield B 16 2.4% Fair 2 0.05Environmental Sustainability Re-use of existing buildng infrastructure C 9 1.3% Good 3 0.04
0Location Visibilility to public A 25 3.7% Very Good 4 0.15Location Suitability to a "Landmark Building" B 16 2.4% Good 3 0.07Location Connections to / integration with surrounding communities B 16 2.4% Fair 2 0.05
0Parking Off site availability A 25 3.7% Terrible 0 0.00Parking Off site parking rates B 16 2.4% Good 3 0.07
0
Proximity To other key user groups C 9 1.3% Good 3 0.04Proximity To other key stakeholders C 9 1.3% Good 3 0.04Proximity To Schools A 25 3.7% Very Good 4 0.15Proximity To administrative staff residences B 16 2.4% Very Good 4 0.09Proximity To student population D 4 0.6% Very Good 4 0.02
0Site Size, Configuration & Topography Sufficient for building program, allows landmark gesture A 25 3.7% Excellent 5 0.19Site Size, Configuration & Topography Sufficient for development of partner facilities (co-location) B 16 2.4% Good 3 0.07Site Size, Configuration & Topography Sufficient for parking needs A 25 3.7% Excellent 5 0.19Site Size, Configuration & Topography Meetings topographical and geotechnical requirements B 16 2.4% Good 3 0.07
0Site Zoning Zoned (or certain to be re-zoned) for ECS land use A 25 3.7% Very Good 4 0.15Site Zoning Zoning allows for sufficient density & building height A 25 3.7% Very Good 4 0.15Site Zoning Approval of other jurisdictions having authority A 25 3.7% Good 3 0.11
0Timing Acquisition timing A 25 3.7% Good 3 0.11Timing Approval timing A 25 3.7% Good 3 0.11Timing Construction timing A 25 3.7% Fair 2 0.07
TOTAL SCORE 675 131 3.1181.05

8/3/2019 Education Centre Analyses
http://slidepdf.com/reader/full/education-centre-analyses 17/18
SITE # 7SITE NAME Upper James Site
Name Upper James Site Priority
AssignedWeighting
Points
Address Upper James & Alderlea Ave. A 5
Closest Intersection Upper James & Alderlea Ave. B 4
Site Area (acres) 19.7 C 3D 2E 1
Priority WeightingDifferenciation Factor 2.00
Scoring
Scoring
PointsExcellent 5Very Good 4Good 3Fair 2Poor 1Terrible 0
Category Criteria Rank Evaluation Score
Weighted
Score
Accessibility Public transit access B 16 2.4% Good 3 0.07
SCORING SYSTEM
WEIGHTING SYSTEMSITE INFORMATION
SITE SELECTION CRITERIA MODEL
PROPOSED EDUCATION CENTREHAMILTON WENTWORTH DISTRICT SCHOOL BOARD
SITE EVALUATION (SCORING MODEL)
CRITERIA WEIGHTING
% Weighting
Accessibility Highway / major arterial access A 25 3.7% Good 3 0.11Accessibility To pedestrian infrastructure C 9 1.3% Terrible 0 0.00Accessibility To bike paths C 9 1.3% Terrible 0 0.00Accessibility To board service vehicles B 16 2.4% Good 3 0.07Accessibility To other delivery vehicles D 4 0.6% Good 3 0.02Accessibility Accessible by all mobilility levels (complies with ODA Act) B 16 2.4% Good 3 0.07
0Amenities Business services C 9 1.3% Good 3 0.04Amenities Restaurants B 16 2.4% Good 3 0.07Amenities Convention / meeting facilities D 4 0.6% Fair 2 0.01Amenities Other retail services C 9 1.3% Good 3 0.04
0Building Operating Costs Site Impacts on building operating costs (heating) B 16 2.4% Good 3 0.07
Building Operating Costs Site Impacts on building operating costs (hydro) C 9 1.3% Good 3 0.040
Capital Costs Site Costs, including geotechnical & remediation B 16 2.4% Good 3 0.07Capital Costs Infrastructure costs B 16 2.4% Good 3 0.07Capital Costs Impacts on building costs C 9 1.3% Good 3 0.04Capital Costs Impacts on parking construction costs C 9 1.3% Very Good 4 0.05
0Economic Impact Hamiltion as "best place to raise a child" D 4 0.6% Good 3 0.02Economic Impact Downtown Hamilton revitalization D 4 0.6% Poor 1 0.01Economic Impact Local economic benefits / impacts (job creation, etc.) B 16 2.4% Fair 2 0.05Economic Impact Aligns with GRIDS C 9 1.3% Fair 2 0.03
0Environmental Sustainability Sized to Minimize Building Footrpint B 16 2.4% Poor 1 0.02Environmental Sustainability Infill Or brownfield rather than greenfield B 16 2.4% Fair 2 0.05Environmental Sustainability Re-use of existing buildng infrastructure C 9 1.3% Good 3 0.04
0Location Visibilility to public A 25 3.7% Good 3 0.11Location Suitability to a "Landmark Building" B 16 2.4% Fair 2 0.05Location Connections to / integration with surrounding communities B 16 2.4% Fair 2 0.05
0Parking Off site availability A 25 3.7% Terrible 0 0.00Parking Off site parking rates B 16 2.4% Good 3 0.07
0Proximity To other key user groups C 9 1.3% Good 3 0.04Proximity To other key stakeholders C 9 1.3% Good 3 0.04Proximity To Schools A 25 3.7% Good 3 0.11Proximity To administrative staff residences B 16 2.4% Good 3 0.07Proximity To student population D 4 0.6% Good 3 0.02
0Site Size, Configuration & Topography Sufficient for building program, allows landmark gesture A 25 3.7% Very Good 4 0.15Site Size, Configuration & Topography Sufficient for development of partner facilities (co-location) B 16 2.4% Good 3 0.07Site Size, Configuration & Topography Sufficient for parking needs A 25 3.7% Excellent 5 0.19Site Size, Configuration & Topography Meetings topographical and geotechnical requirements B 16 2.4% Good 3 0.07
0Site Zoning Zoned (or certain to be re-zoned) for ECS land use A 25 3.7% Poor 1 0.04Site Zoning Zoning allows for sufficient density & building height A 25 3.7% Good 3 0.11Site Zoning Approval of other jurisdictions having authority A 25 3.7% Poor 1 0.04
0Timing Acquisition timing A 25 3.7% Good 3 0.11Timing Approval timing A 25 3.7% Fair 2 0.07Timing Construction timing A 25 3.7% Fair 2 0.07
TOTAL SCORE 675 111 2.5475.38
8/3/2019 Education Centre Analyses
http://slidepdf.com/reader/full/education-centre-analyses 18/18
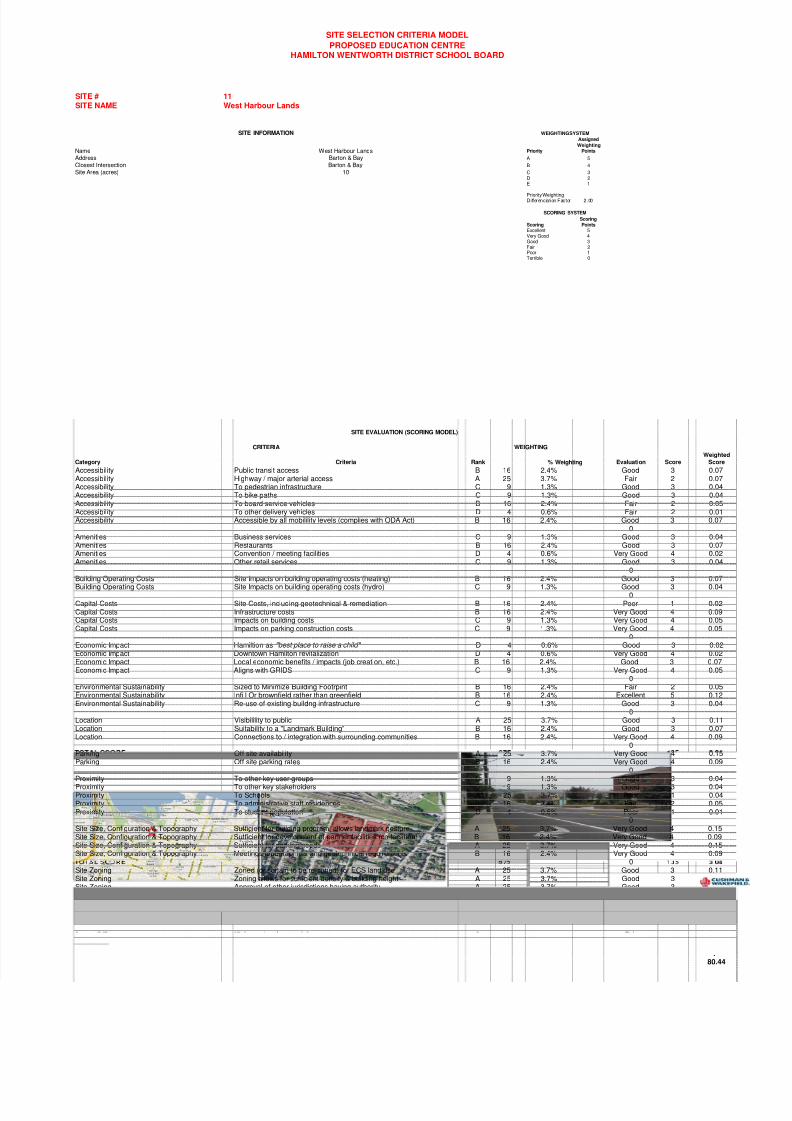
SITE # 11SITE NAME West Harbour Lands
Name West Harbour Lands Priority
Assigned
WeightingPoints
Address Barton & Bay A 5
Closest Intersection Barton & Bay B 4
Site Area (acres) 10 C 3D 2E 1
Priority WeightingDifferenciation Factor 2.00
ScoringScoringPoints
Excellent 5Very Good 4Good 3Fair 2Poor 1Terrible 0
Category Criteria Rank Evaluation ScoreWeighted
Score
Accessibility Public transit access B 16 2.4% Good 3 0.07
PROPOSED EDUCATION CENTREHAMILTON WENTWORTH DISTRICT SCHOOL BOARD
SCORING SYSTEM
WEIGHTING SYSTEMSITE INFORMATION
SITE SELECTION CRITERIA MODEL
SITE EVALUATION (SCORING MODEL)
CRITERIA WEIGHTING
% Weighting
Accessibility Highway / major arterial access A 25 3.7% Fair 2 0.07Accessibility To pedestrian infrastructure C 9 1.3% Good 3 0.04Accessibility To bike paths C 9 1.3% Good 3 0.04Accessibility To board service vehicles B 16 2.4% Fair 2 0.05Accessibility To other delivery vehicles D 4 0.6% Fair 2 0.01Accessibility Accessible by all mobilility levels (complies with ODA Act) B 16 2.4% Good 3 0.07
0Amenities Business services C 9 1.3% Good 3 0.04Amenities Restaurants B 16 2.4% Good 3 0.07Amenities Convention / meeting facilities D 4 0.6% Very Good 4 0.02Amenities Other retail services C 9 1.3% Good 3 0.04
0Building Operating Costs Site Impacts on building operating costs (heating) B 16 2.4% Good 3 0.07
Building Operating Costs Site Impacts on building operating costs (hydro) C 9 1.3% Good 3 0.040Capital Costs Site Costs, including geotechnical & remediation B 16 2.4% Poor 1 0.02Capital Costs Infrastructure costs B 16 2.4% Very Good 4 0.09Capital Costs Impacts on building costs C 9 1.3% Very Good 4 0.05Capital Costs Impacts on parking construction costs C 9 1.3% Very Good 4 0.05
0Economic Impact Hamiltion as "best place to raise a child" D 4 0.6% Good 3 0.02Economic Impact Downtown Hamilton revitalization D 4 0.6% Very Good 4 0.02Economic Impact Local economic benefits / impacts (job creation, etc.) B 16 2.4% Good 3 0.07Economic Impact Aligns with GRIDS C 9 1.3% Very Good 4 0.05
0Environmental Sustainability Sized to Minimize Building Footrpint B 16 2.4% Fair 2 0.05Environmental Sustainability Infill Or brownfield rather than greenfield B 16 2.4% Excellent 5 0.12Environmental Sustainability Re-use of existing buildng infrastructure C 9 1.3% Good 3 0.04
0Location Visibilility to public A 25 3.7% Good 3 0.11Location Suitability to a "Landmark Building" B 16 2.4% Good 3 0.07Location Connections to / integration with surrounding communities B 16 2.4% Very Good 4 0.09
0Parking Off site availability A 25 3.7% Very Good 4 0.15Parking Off site parking rates B 16 2.4% Very Good 4 0.09
0Proximity To other key user groups C 9 1.3% Good 3 0.04
Proximity To other key stakeholders C 9 1.3% Good 3 0.04Proximity To Schools A 25 3.7% Poor 1 0.04Proximity To administrative staff residences B 16 2.4% Fair 2 0.05Proximity To student population D 4 0.6% Poor 1 0.01
0Site Size, Configuration & Topography Sufficient for building program, allows landmark gesture A 25 3.7% Very Good 4 0.15Site Size, Configuration & Topography Sufficient for development of partner facilities (co-location) B 16 2.4% Very Good 4 0.09Site Size, Configuration & Topography Sufficient for parking needs A 25 3.7% Very Good 4 0.15Site Size, Configuration & Topography Meetings topographical and geotechnical requirements B 16 2.4% Very Good 4 0.09
0Site Zoning Zoned (or certain to be re-zoned) for ECS land use A 25 3.7% Good 3 0.11Site Zoning Zoning allows for sufficient density & building height A 25 3.7% Good 3 0.11Site Zoning Approval of other jurisdictions having authority A 25 3.7% Good 3 0.11
0Timing Acquisition timing A 25 3.7% Fair 2 0.07Timing Approval timing A 25 3.7% Good 3 0.11Timing Construction timing A 25 3.7% Good 3 0.11
.80.44