education as absorptive capacity and its role for economic
TRANSCRIPT
Education as absorptive capacity and its role for economic growth
Mourelle, Estefanía a; Márquez-Ramos, Laura
b
aUniversidade da Coruña, Spain;
bInstitute for International Trade, University of Adelaide,
Australia.
Abstract
Might a country’s economic growth behave in a different manner depending
on the evolution of its absorptive capacity? In this research, education is
considered as a channel for economic growth since it is a key element for a
country’s absorptive capacity. Then, we hypothesize the existence of a
threshold for absorptive capacity, so that once it is exceeded, economic
growth shows certain (and different) characteristics. Addressing this
question requires moving from the traditional linear framework to a
nonlinear one and, in this sense, we resort to Smooth Transition
specifications. The empirical results point to the existence of nonlinearities in
the relationship between absorptive capacity and economic growth.
According to the behavior of the country’s absorptive capacity, economic
growth displays different dynamics; this asymmetric evolution is clearly
appreciated in the two dimensions of absorptive capacity taken into account
(i.e., secondary and tertiary), although it is more pronounced in case of
tertiary education. Our evidence provides important insights for higher
education such as the fact that both secondary and tertiary education matter
for countries’ economic growth and that nonlinearities of this relationship
should be taken on board.
Keywords: education; absorptive capacity; economic growth; network
society; nonlinearities; Smooth Transition models.
3rd International Conference on Higher Education Advances, HEAd’17Universitat Politecnica de Valencia, Valencia, 2017DOI: http://dx.doi.org/10.4995/HEAd17.2017.5440
This work is licensed under a Creative Commons License CC BY-NC-ND 4.0Editorial Universitat Politecnica de Valencia
844844

Education as absorptive capacity and its role for economic growth
1. Introduction
The objective of the present paper is to analyze the relationship between education and
economic activity from a new perspective. Specifically, we understand that a country with a
population able to exploit new knowledge will perform better. Therefore, education is
considered a channel for economic growth since it constitutes an intrinsic mechanism of
knowledge absorption1 and then, it is a key element for a country’s absorptive capacity.
Following Cohen and Levinthal (1990), Zahra and George (2002), and Márquez-Ramos and
Martínez-Zarzoso (2010), we consider absorptive capacity as the ability to put information
from abroad into practice, which plays a key role in economic development. In this vein,
we focus on exploitation capabilities and examine their role in economic growth. As a
consequence, our interest goes beyond the consideration of years of schooling as a potential
determinant of economic growth: we generalize to countries’ exploitation capabilities and
explore the inherent nonlinearities in the absorptive capacity-economic growth relationship.
This research has a bearing in the literature of education and economic growth, which has
analyzed the causal effect of education on countries’ economic performance using a variety
of measures and quantitative tools for cross-country, time series and panel data. In this
brand of the literature, Hanushek and Wößmann (2010) highlighted that economic growth
is affected by people’s knowledge. Also the importance of nonlinearities has previously
been identified, as the work of Krueger and Lindahl (2001) points out.
The present paper brings into question the linearity assumption by using time series
techniques for 1971-2013 in Spain, as we believe that the role of absorptive capacity can be
that of a force driving a possible nonlinear behavior in the economic growth. Moreover, we
incorporate additional variables that are closely related to both absorptive capacity and
economic growth, as they also affect this relationship. Focusing on the case of Spain is of
great interest, mainly because Spain is a country with a solid trajectory in its education
system and it is also a developed economy that is representative of a large number of
countries. In this case study, we are able to provide evidence of the nonlinear relationship
between absorptive capacity and economic growth at country-level. This analysis will also
help us to shed light on the question posed by the existing literature about the positive,
although still without consensus, impact of education on growth.
The paper is organized as follows. Section 2 presents the methodology employed. Section 3
explains the empirical results obtained. Section 4 concludes.
1 See, for example, the illustration of the role of education in the aerospace sector for establishing sufficient levels
of absorptive capacity in Asia (van der Heiden et al., 2015).
845

Mourelle, E.; Márquez-Ramos, L.
2. Methodology
One common assumption when analyzing the relationship between two variables is that of
linearity. Actually, the majority of empirical papers centered on the education-economic
growth link are grounded on the linear consideration. Nevertheless, this assumption is too
strong if what we aim to analyze is the relationship between absorptive capacity and
economic growth, as this would mean that the parameters in the relationship do not change
over time. This is, however, unrealistic as it would reflect that learning and innovation
processes are linear (Márquez-Ramos and Mourelle, 2016). By using Smooth Transition
Regression (STR) models, we allow for the parameters to change depending on a shock,
which is defined on an ad hoc basis. This framework provides us with more flexibility
when studying the dynamics of economic growth and other variables related to absorptive
capacity. The reason for selecting this type of models is in line with the idea of a potential
threshold that determines the behavior of the economic growth according to some variable.
Smooth Transition (ST) models belong to the family of state-dependent models where the
data-generating process is linear but switches between a certain number of regimes
according to some rule. STs have been popular in economic time series, proving good
performance in capturing cyclical behavior in macroeconomic variables. For further details
on these models, see Teräsvirta (1994, 1998) and van Dijk et al. (2002).
We resort to the most general ST model, the STR, as it permits the incorporation of
exogenous variables in addition to the endogenous structure. Let yt be a stationary, ergodic
process and, without loss of generality, one exogenous variable xt. The model is given by:
(
) ( ) , (1)
with ( ) a vector of regressors;
( ) and ( ) parameter vectors (p=p1+p2+1); and ut an
error process. F(.) is a transition function customarily bounded between 0 and 1, so that
STR coefficients vary between j and j + j (j = 0, ..., p), respectively. The regime at each t
is determined by the transition variable, st, and the associated value F(st); the transition
variable can be a lagged endogenous variable, an exogenous variable or another variable.
The slope parameter γ defines the smoothness of the transition: the higher it is, the more
rapid the change; the location parameter c indicates the threshold between the two regimes.
Two formulations are mainly used for F: logistic and exponential. In the logistic model the
extreme regimes are associated with st values far above or below c, where dynamics may be
different; otherwise, in the exponential case the extreme regimes are related to low and high
absolute values of st, with rather similar dynamics, which can be different in the transition
846846

Education as absorptive capacity and its role for economic growth
period. Conceptually speaking, the logistic transition appears to be the most suitable for
describing our relationship, as there is no reason to assume a similar effect for a positive
and a negative variation in the absorptive capacity of a country on its economic activity.
The STR model is estimated by nonlinear least squares. Following the related literature, we
carry out an extensive search of STRs by defining a grid for (γ,c), trying for different values
of γ and using the mean of the transition variable for c. Where parameter convergence is
reached, models are subject to further refinement; we evaluate cross-parameter restrictions
to increase efficiency and drop nonsignificant coefficients to conserve degrees of freedom.
In the ST framework, special attention is given to the validation stage, as it unveils any
possible inadequacy of the model. Most tests commonly applied to dynamic models are
also valid for STs. Besides, there are evaluation tests especially derived for STs: the test of
residual serial independence; the test of no remaining nonlinearity in the residuals; and the
test of parameter constancy. In this paper, we use the adjusted R2 and the variance ratio of
the residuals from the nonlinear model and the linear regression estimated by Ordinary
Least Squares (OLS), as it provides relevant information on the explanatory power of both
models. In addition, we use the test of no ARCH structure and the specific STs tests.
Finally, in order to offer a better characterization of the relationship under study, we also
develop a structural analysis of the STR model through the definition and understanding of
the theoretical paths economic growth would follow in response to changes in education.
3. Empirical results
3.1. Data and preliminary analysis
As mentioned above, the data used for this empirical application is centered on the Spanish
case. Real and seasonally adjusted Gross Domestic Product (GDP) is obtained from the
International Monetary Fund’s IFS database; GDP is traditionally considered for measuring
economic activity. We measure absorptive capacity by using gross enrollment ratios for
secondary and tertiary education (available from the World Bank); we denominate
dimension 1 to our measure for secondary education and dimension 2 to tertiary education.
The proxies for labor force are defined by calculating the proportion of active population
with secondary (tertiary) education over total active population (data obtained from The
Valencian Institute of Economic Research, IVIE); in the context of our research, these
variables proxy for the prior knowledge base in Spain. For the physical capital, we use real
Gross Fixed Capital Formation (IVIE database); we include investment as it exerts an
indirect effect on education. Finally, the government expenditure on education (% of GDP,
World Bank) serves as a control variable that allows to isolate the relationship between
absorptive capacity and economic growth. The sample goes from 1971 to 2013 and we use
annual data. All variables are used in logarithms. Figure 1 depicts the variables over time.
847

Mourelle, E.; Márquez-Ramos, L.
Figure 1. Evolution of the variables over time, in logs. Source: Own elaboration.
Notes. ENRT: enrollment ratio tertiary education (ENRS for secondary education); PHY: physical capital; LABT:
labor force tertiary education (LABS for secondary education); EXP: government expenditure on education.
Before focusing on the relationship between economic growth and absorptive capacity, a
statistical processing of the information is required. In particular, all the variables involved
in the study must be stationary, a property that is evaluated by means of unit root tests. In
this sense we have applied the Ng and Perron (2001) unit root tests. Results are not shown
for space reasons2. All the variables considered in the study are unit root processes. These
results point out the need for applying regular differences in all our variables.
3.2. Estimated models: Discussion
Three aspects must be remarked. First, as specific data regarding enrollment and active
population ratios for secondary and tertiary education is available, the estimation process
has two branches so as to distinguish the two dimensions of absorptive capacity. Second,
four explanatory variables are initially included in the analysis: education, physical capital,
labor force and expenditure on education. Third, we consider up to two lags of the variables
in the regressions to account for the effect of their most recent history on economic growth.
The starting point of the modelling procedure consists of finding out the linear model that
would describe the behavior of our series. OLS estimation is carried out; all parameters are
introduced initially, but then those nonsignificant at a 0.05 level are successively excluded
(results not reported). The next stage is the estimation of the nonlinear models. We achieve
valid STR specifications for the secondary and tertiary education. As our main purpose is to
study the impact of absorptive capacity on economic growth, the decision on the transition
variable is clear: the enrollment ratio. Then, this variable plays a double role in explaining
the economic growth dynamics. On the one hand, it represents the source of nonlinearities
2 Along the paper, all the results not shown for space reasons are available from the authors upon request.
0
1
2
3
4
5
6
7
8
1971 1974 1977 1980 1983 1986 1989 1992 1995 1998 2001 2004 2007 2010 2013
GDP ENRT ENRS PHY LABT LABS EXP LABS
848848

Education as absorptive capacity and its role for economic growth
in the evolution of economic growth; on the other hand, it is also a determining factor of
GDP growth dynamics. Table 1 presents the estimated models, along with several
diagnostic statistics and evaluation tests.
Table 1. Estimated STR models
Secondary education Tertiary education
Transition variable: ΔlENRSt-1 Transition variable: ΔlENRTt-2
Linear part Nonlinear part Linear part Nonlinear part
ΔlGDPt-1 -1.308 (0.259) 3.969 (1.381) 0.655 (0.148) -1.346 (0.281)
ΔlGDPt-2 1.426 (0.248) -2.661 (0.804) 0.320 (0.144)
ΔlENRTt 0.176 (0.057) -0.341 (0.120)
ΔlENRTt-1 -0.505 (0.120) 0.670 (0.137)
ΔlENRTt-2
ΔlPHYt 0.564 (0.143) 0.233 (0.028)
ΔlPHYt-1 0.558 (0.066) -1.509 (0.478) 0.176 (0.071)
ΔlPHYt-2 -0.476 (0.131) 0.835 (0.266) -0.182 (0.070) 0.225 (0.070)
ΔlLABS/Tt -0.847 (0.318) 1.264 (0.529) 0.068 (0.035) 0.068 (0.035)
ΔlLABS/Tt-1 1.075 (0.359) -1.765 (0.624) 0.170 (0.047)
ΔlLABSt-2 0.164 (0.093)
ΔlEXPt 0.080 (0.045)
ΔlEXPt-1 0.212 (0.077) -0.152 (0.084)
ΔlEXPt-2 -0.083 (0.041)
γ 2.172 (1.005) 66.647 (375.649)
c 0.015 (0.009) 0.052 (0.003)
0.92 0.87
s2/s2L 0.25 0.33
ARCH 0.266 (0.768) 0.097 (0.907)
AUTO 2.886 (0.083) 3.525 (0.056)
NL 2.597 (0.235) 2.499 (0.324)
PC 1.398 (0.380) 1.088 (0.549) Source: Own elaboration. Notes: Δ denotes first differences and l stands for the logarithm. Values after regression
coefficients are SEs of the estimates; : adjusted determination coefficient; s2/s2L: variance ratio of the residuals
from the STR model and the linear regression; ARCH: statistic of no ARCH based on 2 lags; AUTO: test for
residual autocorrelation of order 2; NL: test for no remaining nonlinearity; PC: general parameter constancy test.
Numbers in parentheses after evaluation statistics are p-values.
Going into detail on dimension 1 of exploitation capabilities, we appreciate notably
significant coefficients in the estimated model that highlight the dependence of economic
growth on its recent history, as well as on physical capital, labor force and expenditure on
education. As it is observed, the first dimension of absorptive capacity is not a determining
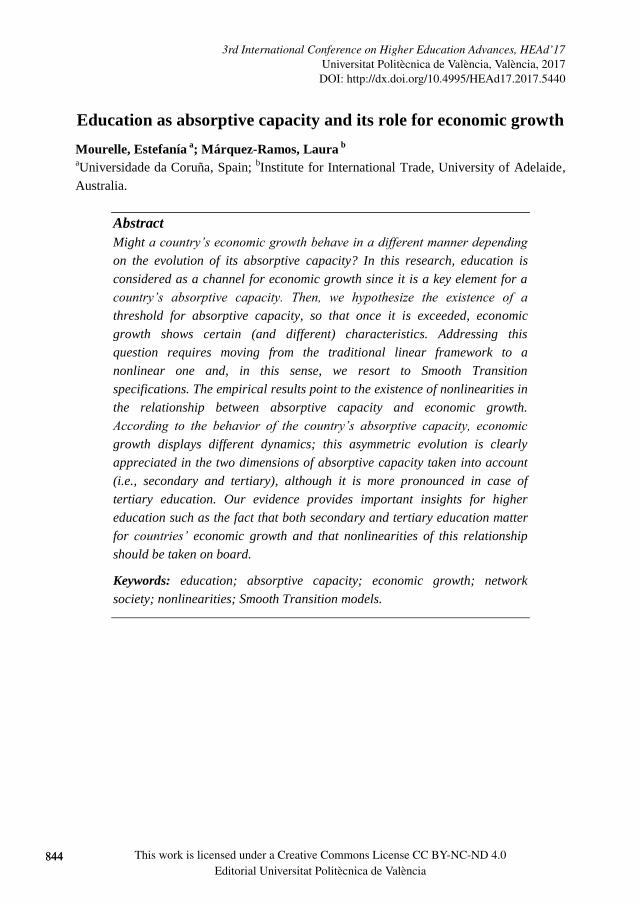
factor for economic activity. Figure 2 depicts the estimated transition functions.
849
Mourelle, E.; Márquez-Ramos, L.
Figure 2. Estimated transition functions. Source: Own elaboration.
The transition between regimes is smooth, according to γ, and the delay is one year. We can
define a lower extreme regime, covering from negative growth to 1.5% variation in the
enrollment ratio, and an upper extreme regime, for rates greater than 1.5%. The estimated
threshold is slightly below the enrollment ratio mean (2%). The model presents no evidence
of misspecification; there are no signs of ARCH structure and the validation tests do not
detect serial dependence in the estimated residuals, there is no need for a second transition
function and parameter constancy is demonstrated. A fact to emphasize is the high
explanatory power of this model compared to the linear one: according to the variance ratio,
the STR model explains 75% of the residual variance of the linear regression.
Turning now to the second dimension of exploitation capabilities, the estimated parameters
are again highly significant, indicating that recent history of economic growth has effects
on its current state, as well as enrollment ratio, physical capital, labor force and expenditure
on education. In contrast to the previous dimension, the enrollment ratio in tertiary level is a
significant determinant for the economic growth dynamics in Spain. This result indicates
that higher education is a key factor for economic development and, in terms of absorptive
capacity, we interpret that it is very important for economic growth that people in a country
are “creators” and not only “users” of those tools required for processing innovation and
creation. We consider that a higher number of “creators” in a country increases the
country’s potential to put new information and knowledge into practice by developing new
products and processes that conduct to economic growth.
Another difference with secondary education are the features of the transition from one
regime to the other: now it is quite abrupt and the delay is two years instead of one. In fact,
these extremely rapid regime changes suggest the need for threshold specifications,
strengthening the importance of using STR models. Therefore, economic growth evolves
more rapidly from one extreme regime to the other when considering the second dimension
of absorptive capacity; that is, economic growth reacts in a more immediate way to shocks
in tertiary education. A possible cause can be found in the high weight traditionally given to
pursuing an university degree in Spain; a historical and sociological background points to a
more rooted character of higher education in Spain than in other similar countries.
850850

Education as absorptive capacity and its role for economic growth
Two regimes arise from this model: a lower extreme regime, ranging from negative growth
to 5.2% variation in the enrollment ratio, and an upper extreme regime, for variations
greater than 5.2%. The threshold is remarkably close to the mean of the transition variable
(5.7%). There are no indications of misspecification, so one may conclude that this STR
model is adequate. Once again, this model shows greater explanatory power than the linear
formulation: the STR model explains 67% of the residual variance of the linear regression.
3.3. Short-run dynamics analysis
This study consists of analyzing the path that economic growth - whose behavior is
described by a nonlinear model - would keep after the effect of changes in absorptive
capacity. As a result, the immediate effect of these changes (in sign and quantity) and how
the variable returns to an equilibrium path can be appreciated. Two considerations must be
taken into account beforehand. First, the starting value for the variation of the proxies used
for measuring absorptive capacity (i.e., enrollment ratios) corresponds to its sample mean.
Second, the values of the other regressors remain constant at a certain level (its sample
mean) when examining the effect of a change in the enrollment ratio on economic growth.
We simulate the evolution of economic growth according to its behavior defined by the
STR model. Regarding the first dimension of absorptive capacity, the point of departure is a
stationary equilibrium state characterized by a 1% enrollment ratio rate of growth (the mean
rate for this variable is below 2% in our sample). In the first exercise, the enrollment ratio
passes from growing at a 1% to a 1.5%. This evolution causes an increase in economic
growth in the short run; the impact is quite outstanding at the beginning and moderate (even
negative) afterwards. The return to an equilibrium growth is achieved several years later.
A further distinctive feature of nonlinear models is the lack of symmetry in the responses of
the variables aftershocks (the linear context implies symmetry). Along these lines, we carry
out a second exercise, where the enrollment ratio steadily rises at a 1% until it starts to rise
at a 0.5%. This slower pace involves a severe fall in economic growth; the impact is quite
irregular but always means negative values, and the path towards the stationary location
takes longer than in the previous exercise. We clearly observe the absence of symmetry
when considering two comparable situations (plus or minus five percentage points).
Regarding the second dimension of absorptive capacity, the starting point is a stationary
equilibrium state characterized by a 3% enrollment ratio growth rate (the mean rate for this
variable is below 6% in our sample). In the new exercise, the enrollment ratio starts to grow
at a higher rate (5%) than the initial one (3%). Following the theoretical path, the economic
growth reacts with a moderate increase in its growth level; after several years, the variable
begins to fall to the long-run location. In the last exercise, the enrollment ratio experiences
a decrease in its growth rate (from a 3% to a 1%). The evolution of the economic growth
851

Mourelle, E.; Márquez-Ramos, L.
turns unfavorable after this shock; economic activity grows at almost zero rates during the
first years but then faces with negative rates. We appreciate again the lack of symmetry.
In short, the simulation study appears to point to a direct impact of absorptive capacity in
the short run (with the two dimensions) on economic growth. As a remarkable fact, the
effects become more severe when the enrollment ratio (and hence absorptive capacity)
decreases its growth rate; in this case, a decrease in absorptive capacity impacts economic
growth generating a larger negative effect when there is a decrease in the number of “users”
(i.e. secondary education) than in the number of “creators” (i.e. tertiary education) of those
tools required in the society. An explanation may rest on the fact that secondary education,
apart from an objective itself, is also the previous requirement for higher education studies;
in other words, a certain proportion of “users” will be “creators” in the future.
An important conclusion we can draw from the analysis is that in order to economically
succeed, it seems necessary that countries maintain and foster their level of absorptive
capacity, not only by maintaining (or increasing) their achieved number of “users” of those
tools required, but also by increasing the number of “creators”. Therefore, under the
contemporaneous societal changes that we are experiencing worldwide, going from an
industrial society, to a knowledge society and, finally, to a network, the future role of
universities and other higher education organizations should be a priority for the
development of countries.
4. Conclusions
This paper analyzes the nonlinear relationship between absorptive capacity and economic
growth at country-level. To do so, it focuses on secondary and tertiary enrollment in Spain.
The empirical framework is that of time series (from 1971 to 2013) and, more specifically,
we estimate Smooth Transition Regressions, which are able to explain our relationship of
interest in a satisfactory manner. The asymmetric evolution of economic growth is clearly
observable in the two dimensions of absorptive capacity taken on board (secondary and
tertiary), although it is more pronounced in the case of higher education. In sum, this
research proves the crucial relevance of education, and of higher education in particular.
Our main policy implication is that governments must care for their educational system, not
only for its intrinsic importance, but also for its effects on a country’s economic growth.
852852

Education as absorptive capacity and its role for economic growth
References
Cohen, W.M., & Levinthal, D.A. (1990). Absorptive capacity: A new perspective on
learning and innovation. Administrative Science Quarterly, 35, 128-152.
Hanushek, E.A., & Wößmann, L. (2010). Education and economic growth. In P. Peterson,
E. Baker & B. McGaw (Eds.), International Encyclopedia of Education. Volume 2 (pp.
245-252). Oxford: Elsevier.
Krueger, A.B., & Lindahl, M. (2001). Education for growth: Why and for whom? Journal
of Economic Literature, 39, 1101-1136.
Márquez-Ramos, L., & Martínez-Zarzoso, I. (2010). The effect of technological innovation
on international trade. Economics: The Open-Access, Open-Assessment E-Journal, 4
(2010-11), 1-37.
Márquez-Ramos, L., & Mourelle, E. (2016). Selecting a suitable approach to analyze the
future of higher education. Procedia - Social and Behavioral Sciences, 228, 86-91.
Teräsvirta, T. (1994). Specification, estimation, and evaluation of smooth transition
autoregressive models. Journal of the American Statistical Association, 89(425), 208-
218.
-. (1998). Modeling economic relationships with smooth transition regressions. In A. Ullah
& D.E.A. Giles (Eds.), Handbook of Applied Economic Statistics (pp. 507-552), New
York: Marcel Dekker.
van Dijk, D., Teräsvirta, T., & Franses, P.H. (2002). Smooth transition autoregressive
models-A survey of recent developments. Econometric Reviews, 21(1), 1–47.
van der Heiden, P., Pohl, C., Mansor, S.B., & van Genderen, J. (2015). The role of
education and training in absorptive capacity of international technology transfer in the
aerospace sector. Progress in Aerospace Sciences, 76, 42-54.
Zahra, S. A., & George, G. (2002). Absorptive capacity: A review, reconceptualization, and
extension. Academy of Management Review, 27(2), 185-203.
853