education and social reproduction: the impact of social ... · school segregation and residential...
TRANSCRIPT

1
Education and social reproduction: The impact of social origin, school segregation and residential segregation on educational performance in Athens
T. Maloutas,1 A. Hadjiyanni,2 A. Kapella,3 S.N. Spyrellis4 and D. Valassi5
Abstract The paper explores the spatial distribution of educational performance in the Athens Metropolitan Area (AMA) of the mid 2000s and attempts to model its relation with social and urban inequalities. It draws on rich discussions about education as a mechanism of social reproduction and, especially, about educational structures and processes in urban areas, as well as on related policies and family strategies. It also draws on work regarding education inequalities in Greece, and in particular in Athens, where a socially diversified secondary education –with a functionally important private segment at the top– leads to a rather democratic access to higher education. This access has substantially increased during the last 20 years, but it was followed by a much higher social selectivity amongst university Faculties and Departments, and by the substantial loss of social mobility prospects that the lower tier of these Faculties and Departments traditionally offered. The paper focuses on the crucial transition between secondary and higher education, relating the performance of candidates in the national admissions examination to the social profile of its outcome, to the types of secondary schools and to the social profile of residential areas candidates originate from.
Introduction Educational mechanisms are fundamental in reproducing social inequality. Following a classical liberal or neoliberal ideological orientation, all forms of social inequality are, more or less, justified since they represent the outcome of responsible individuals’ decisions to take advantage of the theoretically equal opportunities life has offered them. If opportunities are clearly unequal and this becomes politically unsustainable, positive discrimination policies may be used to redress the balance, the assumption remaining however that, in the end, a just society should remain unequal, reflecting the different drive and talent of its members. A socialist interpretation is much less inclined to consider inequality as the expression of unleashed talent and drive and much more as a social construct. Therefore, it considers that equal opportunities are in fact impossible within unequal societies, equality being a prerequisite for equal opportunity (Baudelot, Establet 2009). In policy terms, however, things have been less clear, especially during the last decades of neoliberal ideological domination when educational policies from Conservative and Socialist parties have often been quite similar.
1 Harokopio University and National Centre for Social Research (EKKE). 2 National Centre for Social Research (EKKE). 3 National Centre for Social Research (EKKE). 4 Université Paris-1. 5 University of Crete.

2
Urban inequality is –or appears to be– a more straightforward social process than educational inequality. You live where you can afford to live depending on your class position, and/or where you are not discriminated against on the basis of your ethnic origin or skin color. On the other hand, unequal educational attainment seems much more related to personal merit and, therefore, the unequal access to the hierarchy of occupational positions depending on educational performance seems much more justified (Duru-Bellat 2009; Dubet et al. 2010). Both urban and educational inequality are important items in the international debate, not only as expressions of social inequality, but also as mechanisms that contribute to its reproduction. A systematically unequal educational attainment by different social groups, which corresponds to their hierarchical positions, leads to reproducing this hierarchy. Life and upbringing in unequal neighborhoods influences life chances, positively or negatively, through an unequal neighborhood effect and, thus, contribute to reproducing social inequality. The literature on both is vast. The democratization of education permitted initially the access to occupational and power positions outside hereditary privilege. In the long run, this has been an incremental process with longer years in learning, a growing average education level and an increasing participation rate of lower social classes at all education levels (Moore 2004); its social effect is sanctioned by the social mobility it entails, as those who obtain higher educational degrees have access to higher occupational positions independently of their social origin. Social mobility became possible, but also stratified following the unequal access of the multiple new segments of the increasingly complex social structure to the increasingly long and demanding educational options. It is not clear to what extent the ever increasing years in education serve more the real needs of social and economic development rather than create, in a systematic way, the conditions for a socially unequal insertion in professional life (Duru-Bellat 2006). Education is caught, therefore, in a tension between its educational function –in principle equally open to everyone and rewarding personal merit– and its social reproduction function (Duru-Bellat 2009; Felouzis 2012). The latter is illustrated and implemented through the systematic socially unequal access to increasingly higher educational levels and exclusive options and its effect on the access to occupational positions, following the just reward of educational merit. But, what appears as personal merit is, to a large extent, a social construct, testified by the systematic social differentiation of educational performance. Education is, therefore, also a mechanism disguising social inequality to personal merit and, thus, legitimating it (Duru-Bellat 2009). This tension between the educational and social reproduction functions varies amongst different periods and within different contexts. Social mobility, may thus become more important in periods of economic growth, like in the long postwar boom, and restrained when growth is checked. Social mobility is respectively boosted or reduced both following the availability of occupational places –depending mainly on macro socioeconomic changes– and because of the varying weight of social origin as a selection factor, regulated by educational policies. National education systems present a variety of ways to manage social selectivity. A unique curriculum until almost the end of secondary school, as in most Scandinavian countries, versus selection of socially differentiated curricula
3
at an early age, like in Germany or the Netherlands; or options offered at a later stage, but involving socially exclusive paths to accessing the occupational elite (like the filières leading to the Grandes Écoles in France) (Felouzis 2009). Different curricula are usually accompanied by other forms of school segregation with important quality disparities amongst schools corresponding to a, more or less, clear social differentiation of their clientele. This is primarily the case within mixed systems, especially where high profile private institutions, not state funded and completely free to choose their clientele, are accessible only to those who can afford them, but also within systems dominated by public schools where more intricate forms of middle class family education strategies realize school segregation in different ways (Ball 2003; Power et al. 2003; van Zanten 2001 and 2009; Merle 2012). School segregation is often the simple corollary of strong residential segregation leading to socially (and sometimes racially) segregated schools following the strict application of rules regarding school catchment areas. It follows from the incentive to move to an area equipped with good schools –a classic reason for moving to the (White) suburbs in the US. But school segregation may also be a side effect of gentrification, when gentrifiers select some of the schools in the areas they invade, proclaim them as the best and manage to displace locals from them (Butler et al. 2013). The broad national education systems, their strong or weak connection to residential segregation and the socially diversified family educational strategies, lead to social outcomes that are also influenced by short and medium term educational policies. The last wave of such policies has been driven by the idea of school choice which –apart from embodying the general slipping from citizen to consumer in the realm of education– give a further advantage to the middle and upper middle class in an era when social mobility decreases and their own reproduction becomes harder. The reforms of New Labour (‘Excellence in Cities’, ‘Educational Priority Areas’, ‘Five-year Strategy’) increased parental choice and, therefore, enhanced the margins for, and at the same time legitimated, middle class strategies (Oria et al., 2006), while it is feared that pro-choice policies to boost educational attainment eventually increase educational inequality (Power et al., 2003; Seppänen, 2003; Bosetti, 2004; Denessen et al., 2005; Riddell, 2005; Butler and van Zanten, 2007; Dubet et al., 2010; Dronkers et al., 2010; Merle, 2012). These reforms are also related to the growing size and internal diversity of the middle classes and to their (actual or presumed) political support for more ‘consumer choice’ in education. More parental choice characterizes also recent education policies in the US, like G.W.Bush’s NCLB (no child left behind) or Obama’s RTTT (race to the top) and the proliferation of Charter schools that “have contributed to the privatization and non-profitization of urban schools across the country” (Patterson, Silverman, 2013). The relaxation of catchment areas in France, following pro-choice policies, had ambiguous social consequences. Even though parental choice was advertised as a tool for working class and other underprivileged families to access better schools than those in their areas, it eventually served families from classes that are more informed and more driven by educational objectives (Oberti et al., 2012; Merle, 2012). Residential segregation, on the other hand, is generally considered an important issue due to its assumed impact on living conditions and on chances of social mobility. There has been a substantial growth in the literature addressing the impact of segregation, i.e. the neighborhood or area effect. This literature has mainly been developed in the US (Ellen and Turner 1997) focusing on social

4
isolation and ghetto culture; on the lack of role-models, related to the absence of successful middle class groups; on forms of social capital that constrain rather than enable social mobility; on poor quality of services and reduced access to new jobs (Atkinson and Kintrea 2001: 2278). The central issue is whether there are specific spatial effects on peoples’ lives and life prospects “over and above non-spatial categories such as gender and class (…)” (Atkinson and Kintrea 2001: 2277). These additional effects may originate from the different socio-demographic composition of neighborhoods, from their intrinsic quality—e.g. the quality of their environment or of the locally provided services—and from neighborhoods’ comparative status, ranging from privileged to stigmatized (Buck 2001). Does living in an area of concentrated poverty raise the chances of not finding a job or of not doing well at school compared to someone equally poor living in a mixed or a middle class neighborhood, and to what extent? Is there a linear relation between area effects and the intrinsic characteristics of neighborhoods or are there thresholds after which things change dramatically? Even though such questions about neighborhood effects can be formulated rather clearly, the research design for their empirical investigation is quite complicated because it is difficult to disentangle the complex ways in which individuals interact with neighborhoods (Buck 2001, Lupton 2003). The question of neighborhood effects is further complicated by the fact that they may refer to different spatial scales, they may be negative or positive and they are not necessarily the same for different class categories. According to Gordon and Monastiriotis (2006 and 2007) neighborhood effects in education performance in the UK appear more important as a middle class advantage than as a disadvantage of working class groups. Research from the UK (Buck 2001, Atkinson and Kintrea 2001, Buck and Gordon 2004) and Netherlands (Ostendorf et al. 2001) reveals a relatively low, but significant level of neighborhood effects compared to individual/household characteristics. Musterd et al. (2006) found effects of varying magnitude from a number of European city neighborhoods that were not always what was expected according to the local welfare regime; these effects were considered important— even though not fundamentally important for people’s lives—and not necessarily either positive or negative. Proving the existence and importance of neighborhood effects does not, however, seem necessary in order to convince policy makers in the UK, France or Netherlands, as they seem already convinced of their existence and for the need to develop area based policies or initiatives (Lupton 2003) which often end-up serving middle class groups rather than those they are supposed to, as in facilitating gentrification to enhance social mixing, supposedly beneficial for lower social groups. The critical stance against the assumptions about the importance of neighborhood effects and the policies to confront them has recently come to question their validity as a research object by turning the argument upside-down and posing as a central question the reasons social groups are unevenly distributed amongst neighborhoods of uneven quality rather than take it for granted and focus on its consequences (Slater 2013). The neighborhood effects literature is unevenly developed geographically, and this partly reflects the unevenness of these effects in different contexts. Enforced and strict spatial isolation, as in the excluded black ghetto, obviously reduces opportunities for social mobility to a much higher degree (Massey and Denton 1993, Wilson 1987) than spatial separation in comparatively low segregation environments and relatively evenly serviced residential areas, as in

5
Dutch cities. In the latter, neighborhood effects may be found to be of considerably less importance for social mobility than the personal/household characteristics of the relatively isolated and deprived groups (Ostendorf et al. 2001, Musterd et al. 2003). Neighborhood effects in Southern European cities can be expected to be somewhere in the middle due to the contradictory influence of, on the one hand, the absence of highly segregated areas and groups and, on the other, the relatively poor and unevenly distributed social services. Studies referring to inequalities in higher education in Greece, can be divided into three main categories: those focused on unequal access to higher education; those dealing with social differentiations and hierarchies within higher education and those related to graduates’ fate in the labor market. Several studies fall within these categories. The foundational work of Tsoukalas (1977) stressed the democratic character of Greek secondary and tertiary education, in terms of the relatively massive access provided to students of lower social origin and of the important wave of social mobility it has supported for a quite long period. Frangoudaki (1985) argued about the relative hypertrophy of higher education, leading to socially diverse occupational positions and to important differentiations among university Departments and degrees in terms of mobility prospects. Kontogiannopoulou-Polydorides (1999) showed that, since the 1960s, the chances of candidates originating from families of professionals and office employees backgrounds were much higher than those from farmers and the working class; and that, at least since the 1980s, these inequalities are not limited to the access to higher education, but are closely related to the unequal ways that graduates with similar diplomas fare subsequently in the labor market. Thanos (2011) reached the same conclusions regarding the important differences amongst socio-professional categories in terms of access to different university Departments and other subdivisions within higher education. In fact this socially unequal distribution is twofold: certain occupational categories –especially the professionals– have high rates of access to higher education, and, at the same time, they are overrepresented in highly demanded Faculties and Departments in respect to their specific weight within the active population. Scholars realized increasingly that the 'democratization' –restricted to the growing access of different social groups to higher education– did not necessarily lead to more social justice. Thus, researchers shifted their interest to inequalities within higher education and revealed new divisions and hierarchies, confirming that the education system produces and reproduces inequality in changing forms of social division that may be difficult to identify (Bourdieu, 2000). Panayotopoulos (2000) presented social divisions within higher education in Greece, going beyond the main separation level between universities and technological institutions (polytechnics) to distinctions amongst university Faculties and Departments. The Faculties of Medicine, Law and most Schools of the National Technical University of Athens (especially Architecture and Mechanical Engineering) seem reserved, to a certain extent, for upper and upper-middle social strata, while those of Theology or Education are mainly relegated to lower and lower-middle ones. Maloutas (2007b) confirmed that the increasing number of students did not lead

6
to a more 'democratic' higher education in Greece since highly demanded Faculties and Departments, like Medicine and Law, remained very unequally accessible by students from different social backgrounds. Moreover, such Faculties and Departments form, to a large extent, the mechanism of internal reproduction of occupations, procuring a far higher rate of endogenous reproduction compared to other occupations requiring a higher education degree. Hadjiyanni and Valassi (2009) focused on social inequalities observed within tertiary education. They argue that the rapid development of postgraduate study programs and the unequal prospects offered by different types of institutions, academic disciplines and specialities have created new social inequalities and/or reinforced existing ones. They conclude that the attenuation of inequalities in opportunities of entering higher education observed during the last decades has led to a shift towards increasing inequality at higher educational levels – postgraduate diplomas and doctorates. Despite the progress in research findings on inequality in higher education, there are issues that are either studied insufficiently or have not been studied at all. In terms of performance in school and the transition to higher education, we still know little about the effect of school segregation, of the quality of the educational/school environment (infrastructure, qualification level of teaching staff, curricula) or of the neighborhood effect on the chances to access higher education and to follow particular types of studies. In this paper we try to address the impact of both school and residential segregation in educational attainment, and therefore in social reproduction. The Greek educational context is characterized by a homogeneous curriculum including the Gymnasium (first stage of secondary school that concludes the nine years of compulsory education) and a dominant general option in the second stage of the secondary (General Lyceum) compared to a smaller option of professional orientation (69% and 31% in 2007-8)6. In Athens, more than anywhere else in Greece, there is an important private segment operating in secondary education (8,5%) without financial assistance from the State. According to Dronkers et al. (2010) Greece and the UK are the only EU countries where private schools do not receive public funds. Most private schools perform better than average and especially the few elite schools that also offer options (like International Baccalaureate) related to prospective studies abroad. Public schools are much more socially mixed and of variable performance. Residential segregation in Athens is relatively reduced both in class and ethnic terms for a host of reasons related to its urbanization model (Allen et al. 2004) to the local welfare system and the role of family networks, to the structure of the housing market and housing supply, to the reduced international recruitment at the high-end of its labour market (Maloutas 2007a; Maloutas et al. 2012) etc. Reduced segregation hinders affluent families from strategies of relocation to good school areas and induces them to rely more on school segregation in order to gain educational advantage. We focus on the crucial transition from secondary to higher education, which is organized through a national admissions examination. The best performances in these examinations give access to the Departments and Faculties with the
6 http://www.uis.unesco.org/Education/ISCEDMappings/Pages/default.aspx

7
highest demand and prestige. The exam performance accounts for 70% of the total mark that arbitrates the candidate’s placement in the Department or Faculty of his/her choice –the rest being the graduation performance from secondary school. We analyze data regarding this composite performance and how it relates to the social hierarchy of higher education institutions, to the type of secondary schools, to the social profile of candidates’ residential areas and to some of their demographic features like age and sex.7 The object is to illustrate and roughly measure the function of social reproduction of this socially selective transition to higher education through the dependence it develops from school segregation and residential segregation.
Constructing the problem with the available data As we saw earlier, the question of social inequality in terms of higher education does not refer mainly nowadays to the distinction between those who have access and those who are left out, but to the differences between those who have access to what may be considered the upper or upper-middle tier of University Faculties and Departments and those that have access to the lower tier or have no access at all. In this paper we try to assess the importance of what may be assumed as the most crucial parameters in producing and reproducing the systematic inequalities observed. The socioeconomic status of candidates’ families, their demographic features (age and gender), the type of schools they have attended, the neighborhood social profile they were living in and its effect on their chances for mobility through education, and their personal aptitudes may be initially assumed as such potential crucial parameters. Ideally, we should have data on all those parameters and model in some way their relative importance. In practice what we do have is a large database on all graduates of secondary education for 2005 and their performance in the admission exams to higher education for that year. This database relates every graduate and candidate to a specific secondary school and, therefore, to its features (type of school, average performance in the entrance examinations, quality attributes in terms of infrastructure and teaching personnel etc.). Through the school, it also relates candidates to a specific geographical area (i.e. the catchment area of their school). In order to make things simpler, we calculated a single performance index composed by the average performance of each candidate in all the main courses examined, excluding supplementary courses for particular Departments, like design or foreign languages. The average performance of candidates from the same school was useful to consider both in terms of its unequal geographical distribution and of its potential impact on candidates’ chances. Individual performance is measured in this paper in two different ways: a) by the performance in the national admissions examination to higher education, i.e. by the scores of over 30.000 individual candidates originating from several hundreds of public, and a smaller number of private, secondary schools in AMA;
7 The dataset we used comprised a very large number of variables on all secondary education graduates in Greece for the school year 2004-05 and was produced by the ITYE (Computer Technology Institute and Press ‘Diophantus’) as part of the task “Mining knowledge from data of the educational community”, component of the project “Technical Counsel – Ministry of Education 2006-07”.
8
b) by the position of the Faculty/Department of higher education, where each candidate was effectively admitted, on a clustered ranking produced following the social profile of parents of students enrolled in these Faculties and Departments in recent years. This position was used as a proxy for candidates’ social profile, assuming that during the second part of the last decade the social construction of enrollment by Faculty and Department through the exam mechanism remained relatively stable. It was used, in fact, as an independent variable in a multivariate model seeking to explain the performance in the admissions examination (dependent variable) where –apart from the basic demographic features of each candidate (age and gender)– the other explanatory/independent variables were a number of important features of candidates’ schools (e.g. average school performance or quality indices like teacher/pupil ratio and percentage of teachers with a post-graduate degree) along with the social and urban characteristics of residential areas (census tract level) surrounding each school as a tentative measure of neighborhood effect. In order to relate every school comprised in the database to its catchment area, they have all been geocoded and assigned the average socioeconomic profile of residents in the census tracts contained in a radius of 900m around each school.8 This was used as indicator of the socioeconomic status of candidates’ neighborhood, especially relevant for the large majority of candidates attending public schools (91,5%). The catchment areas of private schools are much larger and more irregular, even though they systematically tend to attract their clientele from higher than lower status residential areas. The paper discusses the performance of this model within what appears to be a context of relatively weak residential segregation combined with relatively strong school segregation (Maloutas 2007b). The main explanatory hypothesis is that strong school segregation, within conditions of increasing competition for social mobility, is the outcome of socially layered educational strategies aiming at preserving social advantage by counteracting the evening out of this advantage within a context of relatively weak residential segregation, while the increasingly broad social access to higher education induces the growing social differentiation of its internal divisions. However, whatever the relation between school and residential segregation may be, the candidate’s social profile seems to remain the strongest predictor of educational performance. We have focused our attention to the Athens Metropolitan Area, where socioeconomic inequalities are much clearer, and inequalities amongst schools are more important than in the rest of the country, due to the much higher presence of private institutions among other things.
8 We considered the neighborhood from an every day’s life point of view, estimating that a distance less than 1,500m constitutes a pedestrian neighborhood in which most daily activities, such as going to school, can be managed on foot or within a short driving distance. In order to estimate the optimum distance within this upper limit we first calculated the average minimum distance of the census tract centroids to the closest high school within the same municipality. Then, by increasing gradually the radii from 400m to 1,500m, we estimated the changing percentage of the total metropolitan area covered by the school buffer zones and the percentage of overlapping surface. Our target was to cover most of the metropolitan area limiting at the same time the amount of census tracts attributed to more than one high schools. The analysis showed that on average for every census tract there is a high school within a 550m radius and that 900m was the distance fulfilling the target of maximum coverage and minimum overlapping.
9
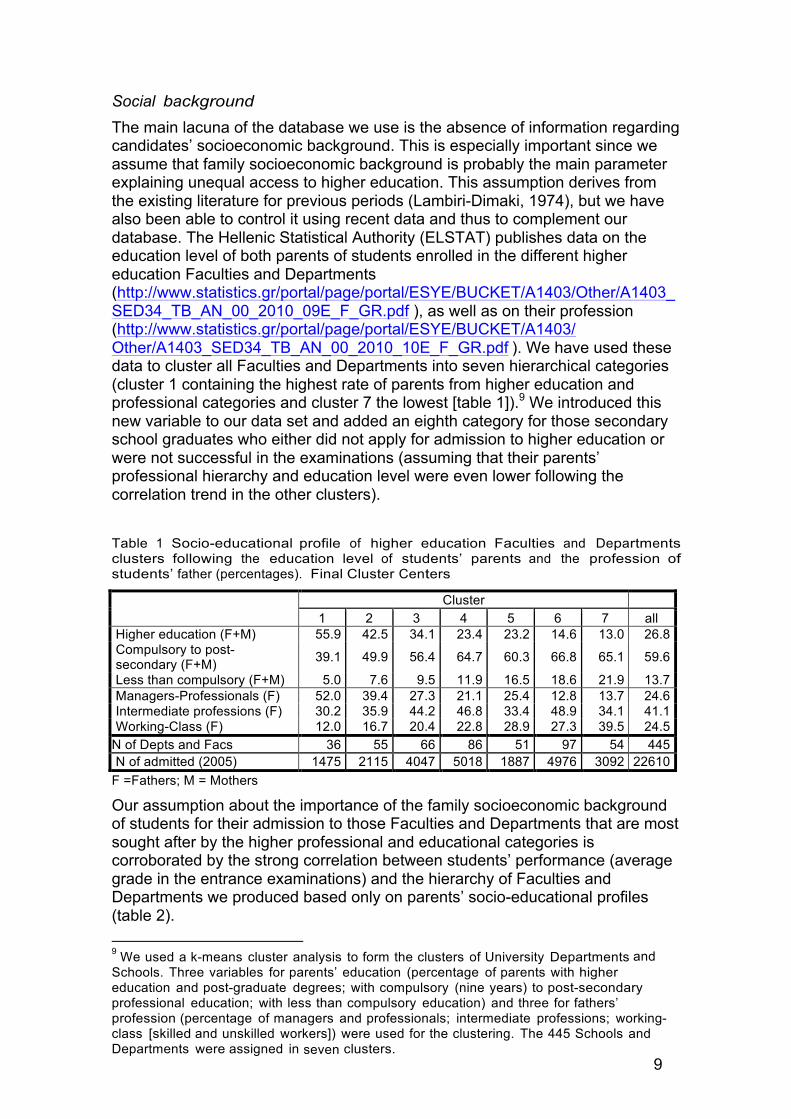
Social background The main lacuna of the database we use is the absence of information regarding candidates’ socioeconomic background. This is especially important since we assume that family socioeconomic background is probably the main parameter explaining unequal access to higher education. This assumption derives from the existing literature for previous periods (Lambiri-Dimaki, 1974), but we have also been able to control it using recent data and thus to complement our database. The Hellenic Statistical Authority (ELSTAT) publishes data on the education level of both parents of students enrolled in the different higher education Faculties and Departments (http://www.statistics.gr/portal/page/portal/ESYE/BUCKET/A1403/Other/A1403_SED34_TB_AN_00_2010_09E_F_GR.pdf ), as well as on their profession (http://www.statistics.gr/portal/page/portal/ESYE/BUCKET/A1403/ Other/A1403_SED34_TB_AN_00_2010_10E_F_GR.pdf ). We have used these data to cluster all Faculties and Departments into seven hierarchical categories (cluster 1 containing the highest rate of parents from higher education and professional categories and cluster 7 the lowest [table 1]).9 We introduced this new variable to our data set and added an eighth category for those secondary school graduates who either did not apply for admission to higher education or were not successful in the examinations (assuming that their parents’ professional hierarchy and education level were even lower following the correlation trend in the other clusters).
Table 1 Socio-educational profile of higher education Faculties and Departments clusters following the education level of students’ parents and the profession of students’ father (percentages). Final Cluster Centers
Cluster 1 2 3 4 5 6 7 all
Higher education (F+M) 55.9 42.5 34.1 23.4 23.2 14.6 13.0 26.8 Compulsory to post-secondary (F+M) 39.1 49.9 56.4 64.7 60.3 66.8 65.1 59.6
Less than compulsory (F+M) 5.0 7.6 9.5 11.9 16.5 18.6 21.9 13.7 Managers-Professionals (F) 52.0 39.4 27.3 21.1 25.4 12.8 13.7 24.6 Intermediate professions (F) 30.2 35.9 44.2 46.8 33.4 48.9 34.1 41.1 Working-Class (F) 12.0 16.7 20.4 22.8 28.9 27.3 39.5 24.5
N of Depts and Facs 36 55 66 86 51 97 54 445 N of admitted (2005) 1475 2115 4047 5018 1887 4976 3092 22610
F =Fathers; M = Mothers
Our assumption about the importance of the family socioeconomic background of students for their admission to those Faculties and Departments that are most sought after by the higher professional and educational categories is corroborated by the strong correlation between students’ performance (average grade in the entrance examinations) and the hierarchy of Faculties and Departments we produced based only on parents’ socio-educational profiles (table 2). 9 We used a k-means cluster analysis to form the clusters of University Departments and Schools. Three variables for parents’ education (percentage of parents with higher education and post-graduate degrees; with compulsory (nine years) to post-secondary professional education; with less than compulsory education) and three for fathers’ profession (percentage of managers and professionals; intermediate professions; working-class [skilled and unskilled workers]) were used for the clustering. The 445 Schools and Departments were assigned in seven clusters.

10
Table 2 Correlation between students’ performance in entrance examinations and the hierarchy of University Faculties and Departments according to the socio-educational profiles of enrolled students parents
(a) excluding non- applicants and non- admitted candidates
average grade in entrance exams X 7 clusters of Faculties and Departments according to parents socio-educational profile
Pearson Correlation -.707**
Sig. (2-tailed) 0.000 N 22610
(b) including non- applicants and non- admitted candidates
average grade in entrance exams X 8 clusters of Faculties and Departments according to parents socio-educational profile
Pearson Correlation -.785**
Sig. (2-tailed) 0.000 N 30103
** Correlation is significant at the 0.01 level (2-tailed).
Table 2 may be interpreted as indicating what seems tautological to some extent, i.e. that higher performances lead you to higher positions in the hierarchy of Faculties and Departments formed by the preferences of candidates originating from families with higher socio-educational profiles. At the same time, however, it also means that having formed this hierarchy of Faculties and Departments in the long run through their repeated preferences, these social strata manage to preserve a systematically unequal access to the best segments of higher education through a systematically higher performance in entrance examinations –the magically unequal distribution of educational merit in favor of higher social strata according to Duru-Bellat (2009). An R = -.785 means that almost 62% (R2 = .616) of candidates’ performances place them in the social hierarchy of Faculties and Departments according to the dominant pattern established by the preferences of higher social categories; the rest of the variance is explained by other patterns of candidates’ choice (e.g. choice of a Faculty or Department at a lower hierarchical position in spite of performances permitting a ‘better’ choice within the dominant hierarchy; or performances that supersede the expected performance according to candidate’s social background). The percentage of students in each of the seven clusters of Faculties and Departments we defined above according to the education level of their parents was then compared to the distribution of education levels in the whole population –aged between 40 and 75 to roughly correspond to the expected age of students’ parents– to determine the socially unequal chances to get admitted in each of these clusters. Figure 1 shows clearly that candidates from a highly educated family background have over four times more chances than the average candidate to get admitted to one of the most sought-after Faculties or Departments (1st cluster) and over 34 times more than the candidate from poorly educated family background. The range of inequality decreases as we move down the clustered hierarchy of Faculties and Departments. The higher social strata seem to lose interest for the less prominent part of the hierarchy (their chances compared to those of candidates from a lower educational background decrease from 34 times [1st cluster] to 2 [6th and 7th clusters]) while those of candidates from intermediate educational backgrounds decrease less steeply and remain much higher than those of the less privileged candidates even at the end of the clustered hierarchy (respectively from 7 times [1st cluster] to 3 [6th and 7th clusters]).

11
Figure 1 Comparative chances of candidates originating from different educational family backgrounds to get admitted to Faculties and Departments clustered according to the socio-educational profile of students’ parents (2010)
Schools The second parameter we assumed had some importance in explaining inequalities in the access to higher education is the quality of secondary schools attended by the candidates. The quality of schools may be assessed in different ways. One of them is to measure the average performance of each school in the admissions examination. This is certainly a valid measure, but it does not necessarily (or at least entirely) reflect the quality of schools per se (i.e. the quality of educational work, the state of the infrastructure or the organization efficiency), as differences in performance amongst schools may be the outcome of the uneven social profile of their clientele. We should note, on this occasion, that most of the parameters we assumed important for explaining unequal access to higher education are not mutually independent, and therefore the
1st cluster
2nd cluster
3rd cluster
4th cluster
5th cluster
6th cluster
7th cluster
higher educa6on 4.15 3.15 2.53 1.74 1.72 1.08 0.96
intermediate 0.86 1.09 1.24 1.42 1.32 1.46 1.43
primary educa6on 0.12 0.19 0.23 0.29 0.40 0.45 0.54
average admission performance (2005) 1.837 1.623 1.536 1.269 1.098 1.059 1.017
0.00
0.50
1.00
1.50
2.00
2.50
3.00
3.50
4.00
4.50

12
explanation of their specific impact must be formulated with caution. In any way, there is an important correlation between candidates’ performance in the admission examinations and the average performance of the school they attended (R = .362, table 3). This means that in principle 13% of the variance in candidates’ performance (R2 = .131) is explained by his/her school performance, which however cannot be entirely attributed to the quality of work done in each school, as it may also be the outcome of the unequal social profiles of schools’ clientele. Table 3 Correlation between candidates’ performance and the average performance of the secondary schools they attended
Average school performance
Candidates’ performance Pearson Correlation -.362**
Sig. (2-tailed) 0.000
N 30103
** Correlation is significant at the 0.01 level (2-tailed)
Secondary schools may also be distinguished by important features other than their average performance in admissions examination to higher education institutions. Some of them are private and they account for 8,5% of students in the last year of secondary education. Good private schools are renown for their performance as well as for their social selectivity (Valassi 2012 and forthcoming). However, there is also a small lower tier of private schools with very low educational performance and a different social function. Moreover, a number of evening schools –mostly public– accommodate working students, either from lower socioeconomic environments or mature students returning to the classroom and having to work at the same time. These schools account for 3,2% of the student population at the final year of secondary education and have usually a low rate of admission to higher education. The bulk of secondary education is constituted by daytime public schools, which account for 88,3% of the student population. Among these schools a limited number of experimental ones used to operate selection based on student performance and to implement innovative education methods (Lambias 2009). Although these policies have been tampered on both accounts, experimental schools continue to have a systematically higher performance amongst public schools. They account for 3,3% of the student population. We produced a hierarchical variable for all schools taking into account their public or private status, their operation during the day or the evening and, in case they were public, their experimental character. Where necessary, we subdivided these categories according to average school performances in the entrance examinations to higher education. This resulted to the following 9- category variable (table 4). This hierarchical variable is highly correlated with the hierarchy of higher education Faculties and Departments that the candidates, originating from one of these secondary school categories, have eventually been admitted (R = -.333).

13
Table 4 Number of students and average performance in the admissions examination by type of school in Athens (2005)
type of school
Number of students
%
Average performance
private – low performance 495 1.6 944 evening school 1014 3.2 876 public – low performance 7572 23.5 973 public – mid-low performance 11029 34.5 1109 public mid-high 3631 11.3 1192 public – high performance 5006 15.6 1276 public experimental 1048 3.3 1323 private – medium performance 1212 3.8 1404 private – high performance 1011 3.2 1543 total 32018 100.0 1142
It is clear from Figure 2 that there are substantial differences in the access to higher education depending on the type of secondary school. More than 80% of those who graduated from high performance private schools end up to highly or averagely positioned University Departments and Faculties (clusters 1 to 4) and only 4,2% does not get admitted. Those graduating from evening schools, on the contrary, are not admitted at a rate of 75% and only 15% have access to a highly or averagely sought after Faculty or Department.
Figure 2 Percentage distribution of candidates from different secondary school types to the hierarchical clusters of higher education Faculties and Departments and to the non-admitted
Figure 3 shows the percentage composition of the student population in the different clusters of University Faculties and Departments in terms of the type of secondary school they originate from. It conveys a relatively different picture. The overwhelming importance of students from public schools (figure 4) leads to a somehow equilibrated composition within most clusters. The majority of students originate from public and relatively low performance schools in all

14
clusters. Even in the highest cluster of Faculties and Departments more than 40% originate from such schools; only 32% of students originate from high and medium performance private and experimental public schools, and this is reduced to 23% for cluster 2. This situation gives the impression of a rather democratic access to all parts of higher education, which is not far from the truth.
Figure 3 Percentage distribution of students in the different hierarchical clusters of higher education Schools and Departments according to the type of secondary school they graduated from (2005)
Figure 4 Number of candidates in the admissions examination to higher education by type of school and type of residential area in Athens (2005)
This double sided picture conveys very eloquently the coexistence, on the one hand, of secure ways of access to higher education for the higher social strata through mechanisms like private schools and choice public schools, and, on the other, a relatively open access for other strata –even though the chances for the
upper upper-‐middle mixed lower-‐
middle lower
private 737 643 1333 900 132
public 420 4729 8605 11869 2663
0
2000
4000
6000
8000
10000
12000
14000

15
latter are far less and decreasing as we move down the social ladder. Social elites and upper middle class strata have privileged, but not exclusive, access to their reproduction through higher education in Greece; thus, they often use more exclusive complementary mechanisms, i.e. studies abroad to academically and often financially highly demanding institutions in Western Europe and the US.
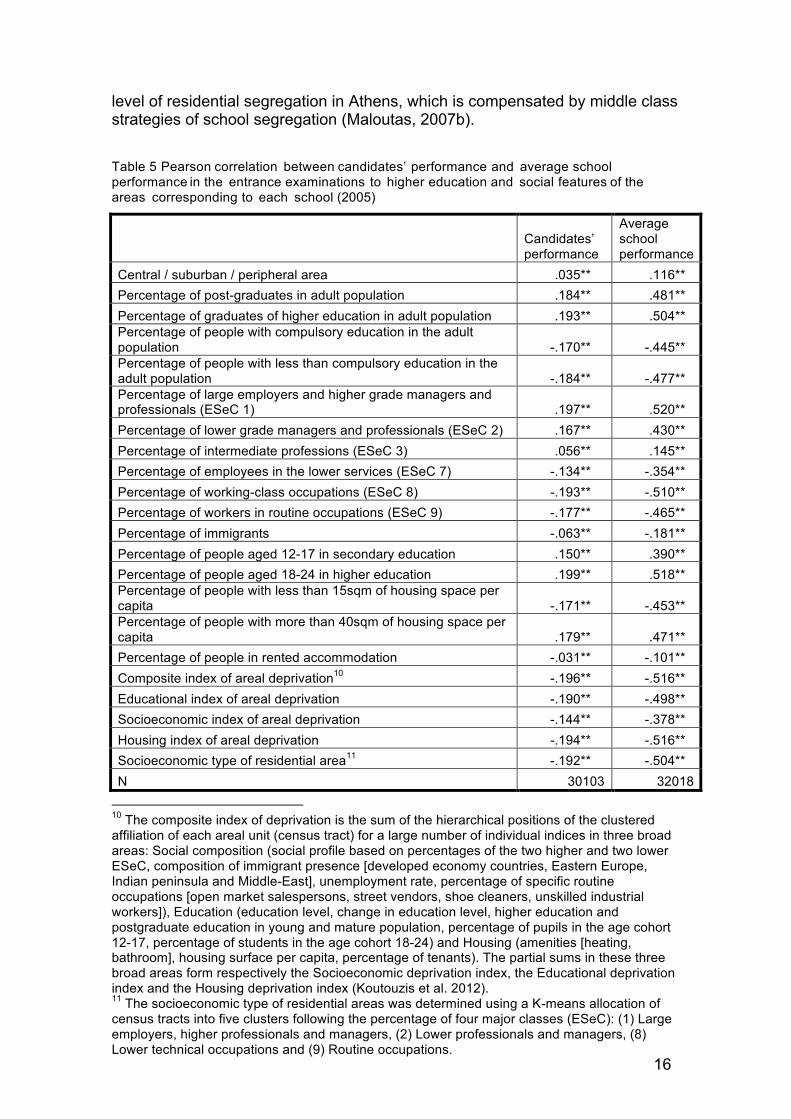
Neighborhood The next important parameter we tried to assess is the neighborhood effect. With the available data it was impossible to attempt this properly, since the absence of data on the social background of each candidate did not permit to disentangle personal/family characteristics from neighborhood features. Therefore, we were not able to assess the differences in performance for the same social group of candidates in different types of neighborhood. Even more so, it was impossible to address the different parameters related to neighborhood effects in a comprehensive manner (i.e. the social composition of neighborhoods, the quality of their natural [e.g. pollution levels] and social environment [e.g. social services]) and their image ranging from highly sought- after to stigmatized (see Buck, 2001; Atkinson and Kintrea, 2001; Lupton, 2003). We limited our investigation, therefore, to the impact of residential areas’ social profiles on candidates’ performance. At first sight the area of residence seems to matter in terms of performance in the entrance examination to higher education, even though the correlation of candidates’ performance with several attributes conveying neighborhoods’ social profile is of not particularly high (R ≈.150 to .200) (table 5). In table 5 all area attributes –mostly those assumed related to difference in social rank– are significantly correlated with candidates’ performance in the entrance examinations. Higher correlation indices appear for attributes related to occupational or other groups at the extremes of the social hierarchy. Positions around the middle of the social hierarchy (graduates of secondary education, intermediate professions) are much less correlated to candidates’ performance; the same applies to variables related to the geographic position of the neighborhood in respect to the city centre (central/suburban/peripheral area), to housing tenure (percentage of people in rented accommodation) or to the presence of immigrant groups. Average school performance is correlated to area attributes much more than individual performance since all standard deviation within institutions disappears; And it does in a rather systematic way with schools that are performing better usually situated in neighborhoods of higher social profile. Map 1 shows a rather clear location pattern of highly performing schools near upper or upper-middle social areas. The measures in table 5, however, should not be considered as indicators of neighborhood effects. They just indicate the systematically positive correlation of neighborhoods with a higher social profile to candidates’ performance. This is expected independently of the existence of neighborhood effects, since neighborhoods with a higher social ranking contain a larger percentage of middle and upper-middle class groups who systematically perform better in such examinations. In this sense, it may be considered that the correlation level between the social type of neighborhoods and candidates’ performance is rather low. This relatively low correlation level could be attributed to the relatively low
16
level of residential segregation in Athens, which is compensated by middle class strategies of school segregation (Maloutas, 2007b).
Table 5 Pearson correlation between candidates’ performance and average school performance in the entrance examinations to higher education and social features of the areas corresponding to each school (2005)
Candidates’ performance
Average school performance
Central / suburban / peripheral area .035** .116** Percentage of post-graduates in adult population .184** .481** Percentage of graduates of higher education in adult population .193** .504** Percentage of people with compulsory education in the adult population -.170** -.445** Percentage of people with less than compulsory education in the adult population -.184** -.477** Percentage of large employers and higher grade managers and professionals (ESeC 1) .197** .520** Percentage of lower grade managers and professionals (ESeC 2) .167** .430** Percentage of intermediate professions (ESeC 3) .056** .145** Percentage of employees in the lower services (ESeC 7) -.134** -.354** Percentage of working-class occupations (ESeC 8) -.193** -.510** Percentage of workers in routine occupations (ESeC 9) -.177** -.465** Percentage of immigrants -.063** -.181** Percentage of people aged 12-17 in secondary education .150** .390** Percentage of people aged 18-24 in higher education .199** .518** Percentage of people with less than 15sqm of housing space per capita -.171** -.453** Percentage of people with more than 40sqm of housing space per capita .179** .471** Percentage of people in rented accommodation -.031** -.101** Composite index of areal deprivation10 -.196** -.516** Educational index of areal deprivation -.190** -.498** Socioeconomic index of areal deprivation -.144** -.378** Housing index of areal deprivation -.194** -.516** Socioeconomic type of residential area11 -.192** -.504** N 30103 32018
10 The composite index of deprivation is the sum of the hierarchical positions of the clustered affiliation of each areal unit (census tract) for a large number of individual indices in three broad areas: Social composition (social profile based on percentages of the two higher and two lower ESeC, composition of immigrant presence [developed economy countries, Eastern Europe, Indian peninsula and Middle-East], unemployment rate, percentage of specific routine occupations [open market salespersons, street vendors, shoe cleaners, unskilled industrial workers]), Education (education level, change in education level, higher education and postgraduate education in young and mature population, percentage of pupils in the age cohort 12-17, percentage of students in the age cohort 18-24) and Housing (amenities [heating, bathroom], housing surface per capita, percentage of tenants). The partial sums in these three broad areas form respectively the Socioeconomic deprivation index, the Educational deprivation index and the Housing deprivation index (Koutouzis et al. 2012). 11 The socioeconomic type of residential areas was determined using a K-means allocation of census tracts into five clusters following the percentage of four major classes (ESeC): (1) Large employers, higher professionals and managers, (2) Lower professionals and managers, (8) Lower technical occupations and (9) Routine occupations.

17
Map 1 Location of high schools by type and average performance in the entrance examinations to higher education
A negative indication for the existence of a positive neighborhood effect in education performance, i.e. boosted performance in the better-off residential areas, is shown in figure 5.
#
#
#
#
##
#
#
#
#
#
#
#
#
#
#
#
##
#
#
#
#
#
#
#
#
##
#
#
#
#
#
#
#
#
#
#
#
#
Saronikos Gulf
Elefsis Bay
Mount
Hymettus
Mount
Egaleo
Mount
Penteli
Mount
Parnitha
4 KM
Private SchoolsType of School
Private High Performance
Private Medium Performance
Private Low Performance
Public SchoolsType of School
Municipalities
$
#
#
#
Public High Performance & Experimental Schools
Public Low Performance & Evening Schools
Public Mid-Low Performance
Public Mid-High Performance
Census Tracts

18
Figure 5 Average and expected performance in the admissions examination to higher education by school type and by social type of residential area in Athens (2005)
Figure 5 shows the average performance of candidates in the admissions examination to higher education institutions by broad social type of residential area. This performance is shown for all candidates, and separately for those originating from public or private schools. We have also calculated the predicted value of this performance based on its relation with the composite index of deprivation in the areas around the 447 schools, where more than 30.000 candidates completed their last year in secondary education. This composite index of deprivation adds up three simpler indices referring to different aspects of social hierarchy, which cluster the areas of reference for each school according to the content of census tracts in a 900m radius around each school: 1) the social composition index (calculated on the basis of occupational data), 2) the educational level index (educational level of the adult population) and 3) the housing deprivation index (a synthesis of housing surface per capita and age of house building). The composite deprivation index is the standardized sum of these three indices for each school’s area (see also footnote 7). Therefore, the expected values express what the average performance in each broad social type of residential area would be according to the relation between performance and social profile. Comparing the actual with the expected performance in
upper upper-‐middle mixed lower-‐
middle lower
public 1219 1207 1156 1077 1014
private 1515 1376 1359 1204 990
expected value 1295 1252 1170 1087 1002
all 1410 1226 1176 1081 1014
950
1050
1150
1250
1350
1450
1550

19
different social settings for all candidates (figure 5) we observe no substantial differences, except in the upper class areas. This may lead to the conclusion that, potentially, there is a positive neighborhood effect in those areas, and that would be consistent with similar assertions in other contexts (Gordon and Monastiriotis, 2006 and 2007). However, this higher than expected performance in upper class areas is clearly related primarily to the concentration of privileged private schools, which attract students from higher and upper-middle social strata from a broad spatial range. In this sense, the systematically higher performance of candidates from private schools, observed in all but the lower social type of area (figure 5), is much more related to school segregation rather than to some form of neighborhood effect. For the much larger number of candidates from public schools (figure 4), the actual performance decreases increasingly as we move from lower to higher social types of areas, indicating the possible existence of a neighborhood effect that operates on a counter intuitive mode. This is, however, probably the effect of the draining of good students operated by private schools in all but the lower type of areas –where private schools perform worse than public on average. This draining culminates in the higher status areas, where it seems that both the number and socio-educational function of public schools becomes residual under the overwhelming presence of highly esteemed private schools. Another way of testing the assumption of a more significant school segregation compared to residential segregation is by comparing the performance of candidates to higher education in comparable segments of the school hierarchy and the residential area hierarchy (table 6). Table 6 shows that there is a comparable number of candidates for higher education who either graduated from high performance private schools (1008) or who live in the highest social type (upper) of residential area (1144). Obviously a number of these candidates fall into both categories. However, those in high performance private schools do clearly better (>10% difference) on average than the residents of areas with the highest status.12 They also form a much more coherent group in terms of performance, as witnessed by the much smaller standard deviation, which in the case of upper class areas is increased by the presence of both high performance private schools and residual public schools. The same applies to the next level where we can compare the 5141 candidates living in upper-middle class residential areas with the 7072 who attended medium performance private schools (1205), experimental public schools (1036) or another high performance public school (4841). The weighted performance of the latter (1304,6) is 6,5% higher from the performance of those who live in upper-middle class areas (1225,6). Differences become less important (1-2%) between middle performance secondary schools and lower middle class or socially mixed residential areas. They increase again at the other end of the social hierarchy, where 7954 candidates graduating from low performance schools (90,6% from daytime public schools) have fared worse by 4,8% (967,6 weighted average) than the 2585 candidates that attended schools in areas at the lower end of the social hierarchy (1014,2). 12 In fact, the difference is even higher since high performance private schools are mostly situated in high status residential areas and their students are necessarily assigned collectively to ‘upper’ class areas –even though students in these schools are attracted from different and socially diverse parts of the city– due to the shortcomings of our database (absence of information on the effective address of students and substitution by the area corresponding to the address of their school).

20
Table 6 Candidates’ average performance by school type and residential area social type (2005)
School type Mean* N Std. Dev. Area type Mean*
N Std. Dev.
private low 944.4 443 491.1 lower 1014.2 2585 410.8
esperino 875.5 304 417.5
public low 972.9 7207 400.0
public mid-low 1109.1 10565 406.5 lower-middle 1081.2 11937 414.0
public mid-high 1192.2 3494 405.0 mixed 1176.0 9296 429.7
public high 1275.8
4841
412.1
upper-middle 1225.6 5141 428.3
public experim. 1323.4 1036 406.4 private medium 1403.9 1205 383.4
private high 1543.2 1008 325.3 upper 1409.5 1144 400.7
Total 1141.9 30103 428.9 Total 1141.9 30103 428.9
* Maximum possible score = 2000
In sum, table 6 offers a clear indication of a systematically more divided performance within the hierarchy of schools than within the hierarchy of residential areas, corroborating the assumption of a higher degree of social segregation within the former than the latter. Moreover, the much higher difference of scores at the upper –compared to the lower– end of the social hierarchy may be an indication that school segregation, as the outcome of middle and upper middle-class strategies, practically functions more as an advantage to higher social groups than as a disadvantage to lower ones (see Gordon and Monastiriotis, 2006 for a similar observation).
Demographic features Table 7 Mean performance at the admissions examinations by age of candidate (2005)
age of candidate Mean N Std. Dev.
expected age 1 year delay 2 years delay 3-5 years delay 6-9 years delay 10 years delay or more
1194.8 974.5 864.2 892.2 916.9 898.9
23705 4214
892 549 334 259
424.0 376.0 384.4 399.8 430.0 404.0
Total 1142.8 29953 428.5
The importance of two demographic features (gender and age) regarding educational performance could be assessed using our database. Candidates in the admissions examination are normally 18 years old, but often a bit older if they failed to be admitted on their first attempt; if they chose to try again for another Faculty or Department; if they opted to finish first with their military service (for boys) or if they were delayed in completing secondary school. The correlation between candidates’ performance in the entrance examinations and the delay in their taking the examination is rather important (R = -.142); it means that there is a non-negligible negative effect of older age on performance (table

21
7). This delay is related to social origin. Students from schools in lower social status areas take the admissions exam at the expected age at a rate of 70% against 90% for those from schools in upper social status areas. Figure 6 Average performance in the entrance examinations by gender within each cluster of University Schools and Departments (1 = average performance for each cluster)
Figure 7 Number of candidates admitted in each cluster of University Schools and Departments following the entrance examinations by gender
In the late 1920s the participation of women students in higher education was 4,9% of the student population (Katsikas and Kavadias, 1994, 123) against 59,8% in 2010 (ELSTAT, 2010). For several years now, girls have been

22
performing better, and in higher education in particular. Our database reveals that there is a slightly positive correlation between girls and performance in the entrance examinations (R = .058); it also reveals that a significantly larger number of girls is taking these examinations (17.246 versus 14.785) meaning that a larger percentage of girls than boys completes secondary school. The average score in the entrance examinations for girls (1164,6) is 4,5% higher than the score for boys (1114,5). This inequality between girls and boys is observed throughout the hierarchy of University Faculties and Departments the candidates have been admitted to; it is only reversed for candidates who failed their entry, amongst whom boys have a higher average score than girls (figure 6). Following their higher scores, more girls are admitted at all levels of the hierarchical clustering of University Faculties and Departments, with higher gender differences observed in the upper-middle part of the hierarchy (clusters 3 and 4). Boys are more numerous only in the non-admitted category (figure 7).
Regression model Table 8 Model summary for stepwise linear regression. Dependent variable: Athenian candidates performance in admissions examination to higher education (2005)
a) All schools Model
R R Square Adjusted R Square Std. Error of the Estimate
1 .786 .618 .618 264.863 2 .795 .631 .631 260.166 3 .800 .639 .639 257.370 4 .801 .642 .642 256.470 5 .802 .643 .643 256.054 6 .802 .644 .643 255.839 7 .802 .644 .644 255.756 8 .802 .644 .644 255.693
Predictors: (Constant), Social clusters of University Depts and Faculties, Average school performance, Studies orientation, Older candidate, Gender, School’s participation rate to admissions exam, Type of secondary school, Composite neighborhood deprivation index b) Public schools Model
R R Square Adjusted R Square Std. Error of the Estimate
1 .771 .595 .595 267.809 2 .780 .608 .608 263.475 3 .786 .617 .617 260.381 4 .787 .620 .620 259.465 5 .788 .621 .621 259.040 6 .788 .621 .621 258.915 Predictors: (Constant), Social clusters of University Depts and Faculties, Average school performance, Studies orientation, Older candidate, Gender, Composite neighborhood deprivation index A stepwise linear regression model was set to investigate the combined effect of all possible variables –including the ones discussed in the previous sections– on

23
performance in the admissions examination as the dependent variable. The model was calculated both for candidates from all schools, and for those uniquely from public schools. A high R2 resulted for the two models (.64 and .62 respectively). Eight independent variables were retained in the first model and six in the second, coinciding with the first six of the first model. Tables 8a and b show the progressive increase of the total correlation index (R) as the predictors (independent variables) were successively introduced in the stepwise model. Table 8 shows that the first independent variable (the social hierarchy of University Faculties and Departments) standing for the social profile of candidates, offers an overwhelmingly large part of the explanation provided by the model regarding the variance of candidates performance in the admissions examination (dependent variable). Therefore, social difference explains approximately 60% of educational merit as expressed in the admissions exams to higher education. Table 9 Correlation coefficients (R) for the dependent and the independent variables retained by the stepwise regression model (all schools)
DV (1) (2) (3) (4) (5) (6) (7) (8)
Candid. perform. in adm. exam Dep. Variable 1 -.785** .362** -.254** -.142** .058** .201** .332** -.196**
Social clusters of Depts and Facult. (1) -.785** 1 -.330** .215** .175** -.076** -.227** -.333** .201**
Average school perform. (2) .362** -.330** 1 -.093** -.183** .010 .469** .877** -.516** Studies orientation (3) -.254** .215** -.093** 1 -.090** .215** -.095** -.094** .033** Older candidate (4) -.142** .175** -.183** -.090** 1 -.009 -.442** -.185** .056** Gender (5) .058** -.076** .010 .215** -.009 1 .051** .012* .022** School’s particip. rate to adm. exam (6) .201** -.227** .469** -.095** -.442** .051** 1 .475** -.177**
Type of secondary school (7) .332** -.333** .877** -.094** -.185** .012* .475** 1 -.492** Composite neighb. deprivation index (8) -.196** .201** -.516** .033** .056** .022** -.177** -.492** 1
** Correlation is significant at the 0.01 level * Correlation is significant at the 0.05 level The much lower contribution of the other independent variables retained in the model is due to their significantly lower correlation with the dependent variable as well as to important correlation levels amongst these variables (table 9) that reduced further their effective contribution. The latter can be witnessed in the reduced value of the partial correlation for these variables (table 10), i.e. their covariance with the dependent variable when all other independent variables remain constant, reducing that is the initial correlation value by the part explained also by these other variables. The model confirms the dominant explanatory role of the social hierarchy in educational performance, through its reproduction as the social hierarchy of higher education Faculties and Departments by the systematically unequal performance of individuals following the unequal relations of social groups to which they belong. Part of the explanatory potential of school types and school performance appears collinear with social hierarchy and was, therefore, discarded by the model. A substantial part remains, however, especially for the model limited to candidates from public schools, where the unequal performance among schools seems to play per se a much more important role, i.e. beyond its relation with social inequality.

24
Table 10 Model coefficients for stepwise linear regression. Dependent variable: Athenian candidates performance in admissions examination to higher education (2005) a) All schools Model
Unstandardized Coefficients Standardized Coefficients
t Sig.
B Std. Error Beta (Constant) 1427.616 27.896 51.177 .000 Social clusters of University Depts and Faculties -140.729 .729 -.724 -192.922 .000
Average school performance .401 .026 .145 15.228 .000 Studies orientation -61.867 2.343 -.096 -26.407 .000 Older candidate -9.739 .784 -.045 -12.428 .000 Gender 29.470 3.066 .034 9.613 .000 School’s participation rate to admissions exam 1.439 .225 .028 6.389 .000
Type of secondary school -10.209 2.292 -.039 -4.453 .000 Composite neighborhood deprivation index 1.469 .369 .016 3.980 .000
a. Dependent Variable: Candidate performance in admissions examination a) All schools (continued) Model
Correlations Zero-order Partial Part
(Constant) Social clusters of University Depts and Faculties -.786 -.744 -.665
Average school performance .362 .088 .053 Studies orientation -.254 -.151 -.091 Older candidate -.142 -.072 -.043 Gender .057 .055 .033 School’s participation rate to admissions exam .200 .037 .022
Type of secondary school .332 -.026 -.015 Composite neighborhood deprivation index -.197 .023 .014
b) Public schools Model Public Schools
Unstandardized Coefficients
Standardized Coefficients
t Sig.
B Std. Error Beta (Constant) 1487.701 25.600 58.114 .000 Social clusters of University Depts and Faculties -140.136 .769 -.718 -182.260 .000
Average school performance .418 .015 .124 27.476 .000 Studies orientation -66.203 2.510 -.103 -26.375 .000 Older candidate -10.598 .776 -.051 -13.659 .000 Gender 30.355 3.254 .036 9.329 .000 Composite neighborhood deprivation index 2.067 .395 .023 5.238 .000
a. Dependent Variable: Candidate performance in admissions examination b) Public schools (continued) Model Correlations

25
Public Schools Zero-order Partial Part (Constant) Social clusters of University Depts and Faculties -.771 -.741 -.679
Average school performance .297 .164 .102 Studies orientation -.246 -.158 -.098 Older candidate -.135 -.082 -.051 Gender .059 .056 .035 Composite neighborhood deprivation index -.158 .032 .020
Demographic features retain some importance in the model. Gender appears to contribute with its full potential, as it is weakly correlated with almost all other independent variables. Older age in taking the admissions exam remains a valid explanatory parameter, curtailed however due to its stronger correlation with several other independent variables, and mainly its much more uneven –compared to gender– social profile. Finally, the quality of the neighborhood, expressed by the composite index of neighborhood deprivation, offers the smallest contribution to this explanatory model and appears more important when only candidates from public schools are considered. This may be interpreted as revealing a relatively low level of potential neighborhood effects that become stronger when private education is taken out of the picture, withdrawing thus the major component of school segregation that mitigates the effect of residential segregation on educational performance. Conclusion Access to the detailed database of candidates’ performance in the 2005 national admissions examination to higher education –produced by the ITYE (Computer Technology Institute and Press ‘Diophantus’) for the project “Mining knowledge from data of the educational community” for the Ministry of Education– gave us the rare opportunity to investigate and roughly measure the social reproduction function of the transition to higher education in Greece. We focused on the Athens Metropolitan Area, where school segregation and residential segregation are much more developed than anywhere else in Greece and, therefore, where we could most effectively link them to social reproduction. Greek education has a number of features that support the arguments about its democratic character: a single curriculum in the first part of secondary school and a relatively atrophic technological option in its second part which, respectively, delay and restrain social selection; a dominant public education system accounting for more than 90% of secondary and for 100% of higher education; a substantial and growing participation of lower-middle and working class groups to higher education (even to highly demanded Faculties and Departments); a long history of uninterrupted social mobility through education during most of the postwar period. The structure of the educational system may be, to some extent, the reflection of a weakly polarized social structure (at least until the crisis). At the same time, however, Greek society remains unequal. Educational mechanisms contribute substantially in reproducing inequalities, even if this is implemented in a rather silent way and does not figure on the political agenda.

26
Privileged groups follow a number of educational strategies to create advantage for their children: investment in private schooling; selection of better schools within the public sector; investment in continuously longer education; investment in studies abroad and in highly rated institutions and/or degrees. These strategies seldom comprise residential relocation within a context of rather limited residential segregation. We have been able to retain most of the crucial parameters in the transition from secondary to higher education, and to particular paths within it, in order to model the statistical explanation of educational performance. The result was clear: the simultaneous effect of different variables produced a multivariate model where social origin emerged as the, by far, main explanatory variable for the performance in the national admissions examination, followed by the statistically significant (but much less important) contribution of school type and performance, gender and age, and social type of neighborhood, as the last and least. The margin for personal merit, unrelated to social origin, lies somewhere in the 37% of variance not explained by the model. The transition to higher education is, therefore, relatively open, but also socially highly unequal even though this inequality is dissimulated and legitimated as personal merit. References Allen, J., Barlow, J., Leal, J., Maloutas, T., Padovani, L. 2004. Housing and Welfare in Southern Europe. Oxford: Blackwell Atkinson, R. and Kintrea, K. (2001) Disentangling area effects: Evidence from deprived and nondeprived neighbourhoods. Urban Studies 38(12), 2277–98. Baudelot C., Establet R. (2009) L’Élitisme républicain, Paris: Éditions du Seuil. Bosetti, L. (2004) Determinants of school choice: understanding how parents choose elementary schools in Alberta, Journal of Education Policy, 19(4), 387–405. Bourdieu P. (2000), Reproduction in education, society and culture, London – Thousand Oaks – New Delhi: Sage Publications Buck, N. (2001) Identifying neighbourhood effects on social exclusion. Urban Studies 38(1), 2251–75. Butler, T., van Zanten, A. (2007) School choice: A European perspective, Journal of Education Policy, 22(1), 1-5. Butler T., Hamnett C., Ramsden M.J. (2013) Gentrification, Education and Exclusionary Displacement in East London, International Journal of Urban and Regional Research, 37(2), 556-75. Denessen, E., Driessenaa, G. & Sleegers, P. (2005) Segregation by choice? A study of group specific reasons for school choice, Journal of Education Policy, 20(3), 347–368. Dronkers J., Felouzis G., van Zanten A. (2010) Education markets and school choice, Educational Research and Evaluation, 16(2): 99-105. Dubet F., Duru-Bellat M., Vérétout A. (2010) Les sociétés et leur école. Emprise du diplôme et cohésion sociale, Paris : Seuil. Duru-Bellat, M. (2006) L’inflation scolaire. Les désillusions de la méritocratie, Paris: Seuil.

27
Duru-Bellat, M. (2009) Le mérite contre la justice, Paris, Presses de Sciences Po. Ellen, I. and Turner, M. (1997) Does neighbourhood matter? Assessing recent evidence. Housing Policy Debate 8(4), 833–66. ELSTAT (2010) Students by gender, semester of studies, institution and department (http://www.statistics.gr/portal/page/portal/ESYE/BUCKET/A1403/Other/A1403_SED33_TB_AN_00_2010_03E_F_GR.pdf ). Felouzis, G. (2009) Systèmes éducatifs et inégalités scolaires : une perspective internationale, SociologieS [En ligne], Théories et recherches, mis en ligne le 05 novembre 2009, consulté le 03 mars 2013. URL : http://sociologies.revues.org/2977 Felouzis, G. (2012) Le modèle scolaire français contre la justice sociale, SociologieS [En ligne], Grands résumés, Le Mérite contre la justice, mis en ligne le 27 janvier 2012, consulté le 03 mars 2013. URL : http://sociologies.revues.org/3778 Frangoudaki, A. (1985) Sociology of education. Theories about social inequality in school, Athens: Papazisis (in Greek). Gordon, I., Monastiriotis, V. (2006) Urban size, spatial segregation and inequality in educational outcomes Urban Studies, 43(1), 213-36. Gordon, I., Monastiriotis, V. (2007) Education, location, education: a spatial analysis of English secondary school public examination results. Urban studies, 44(7). pp. 1203-28. Hadjiyanni A. and Valassi D. (2009), “Reproducing inequality in Higher Education: ‘the small and the great door’ in the greek higher education Sector”, in T. Maloutas (ed.) Aspects of social structure and social transformation in Athens in the new era, Athens: National Centre of Social Research (EKKE), pp. 207 – 245 (in Greek). Katsikas, C. and Kavadias, G.K. (1994) Inequality in Greek education. The changing opportunities for accessing Greek education (1960–1994), Athens: Gutenberg (in Greek). Kontogiannopoulou – Polydoridis G. (1999), Sociological analysis of school performance and evaluation. The entrance examinations: setting performance, integration into hierarchical higher education school performance, Athens: Gutenberg (in Greek). Koutouzis M., Kyridis A., Maloutas T., Papadakis N., Syrigos S. (2012) Areas of educational priority. Research report for the Ministry of Education. EKKE Working paper 26 (in Greek). Lambias G. (2009), School performance and university entrance: the case of the Experimental High School of Thessaloniki University School, Dissertation, Thessaloniki: Aristotle University of Thessaloniki Lambiri-Dimaki, I. (1974) For a Greek sociology of Education (v. 2) (Athens, EKKE) (in Greek). Lupton, R. 2003. ‘Neighbourhood Effects’: Can We Measure Them and Does it Matter? CASE Paper 73. London: LSE. Maloutas, T. (2007a) Segregation, social polarisation and inequality in Athens

28
during the 1990s: Theoretical expectations and contextual difference. International Journal of Urban and Regional Research 31(4), 733–58. Maloutas T. (2007b) Middle class education strategies and residential segregation in Athens, Journal of Education Policy, 22/1: 49-68. Maloutas T., Arapoglou V., Kandylis G., Sayas J. (2012) Social polarization and de-segregation in Athens, in T. Maloutas and K. Fujita (eds) Residential segregation in comparative perspective. Making sense of contextual diversity, Farnham: Ashgate, 257-84. Massey, D.S. and Denton, N.A. (1993) American Apartheid: Segregation and the Making of the Underclass. Cambridge, MA: Harvard University Press Merle P. (2012) La segregation scolaire, Paris: La Découverte. Moore R. (2004) Education and society. Issues and explanations in the sociology of education, Cambridge: Polity. Musterd, S., Murie, A. and Kesteloot, C. (eds) (2006) Neighbourhoods of Poverty. Urban Social Exclusion and Integration in Europe. Basingstoke: Palgrave. Musterd, S., Ostendorf, V. and De Vos, S. (2003) Neighbourhood effects and social mobility: A longitudinal analysis. Housing Studies 18(6), 877–92. Oberti, M., Prétéceille, E., Rivière C. (2012) Les effets de l’assouplissement de la carte scolaire dans la banlieue parisienne, Paris : Osc-Sciences-po (rapport de recherche). Oria, A., Cardini, A., Stamou, E., Kolokitha, M., Vertigan, S., Ball, S. & Flores-Moreno, C. (2006) Urban education, the middle classes and their dilemma of school choice, Journal of Education Policy, 21(6), 91–105. Ostendorf, V., Musterd, S. and De Vos, S. (2001) Social mix and the neighbourhood effect. Policy ambitions and empirical evidence. Housing Studies 16(3), 371–80. Panayotopoulos N. (2000), Oppositions sociales et oppositions scolaires: Le cas du système d’enseignement supérieur grec, Regards Sociologiques, vol. 19, pp. 57 - 74. Patterson, K.L., Silverman R.M. (2013) Urban education and neighborhood revitalization, Journal of Urban Affairs, 35(1): 1-5. Power, S., Edwards, T., Whitty, G. & Wigfall, V. (2003) Education and the middle class (Buckingham, Open University Press). Riddell, R. (2005) Government policy, stratification and urban schools: a commentary on the Five-year Strategy for Children and Learners, Journal of Education Policy, 20(2), 237–241. Seppänen, P. (2003) Patterns of ‘public-school markets’ in the Finnish comprehensive school from a comparative perspective, Journal of Education Policy, 18(5), 513–531. Slater, T. (2013) Your life chances affect where you live: A critique of the ‘cottage industry’ of neighbourhood effects research, International Journal of Urban and Regional Research, 37(2): 367-87. Thanos T. (2011), Sociology of social inequality in education. Socio- occupational categories and access to higher education (1956 – 1998), Athens:

29
Nissos (in Greek). Tsoukalas, K. (1977) Dependence and reproduction. The social role of educational mechanisms in Greece, Athens: Themelio (in Greek). Valassi D. (2012), Privileged learning or learning of privilege. The social space of elite private secondary education in Greece, Social Sciences. Annual Trilingual Review of Social Research, vol. 1, pp. 95 – 123 (in Greek). Valassi D. (forthcoming), Social reproduction, class strategies and educational advantages: Choosing a private school in the Greek education market, The Greek Review of Social Research, p. 22 (in Greek). Van Zanten A. (2009) Choisir son école. Stratégies familiales et mediations locales, Paris: Presses Universitaires de France. van Zanten, A. (2001) L’école de la périphérie. Scolarité et ségrégation en banlieue Paris, Presses Universitaires de France. Wilson, W.J. 1987. The Truly Disadvantaged: The Inner City, the Underclass and Public Policy. Chicago: Chicago University Press.