education and invention
TRANSCRIPT

DISCUSSION PAPER SERIES
ABCD
www.cepr.org
Available online at: www.cepr.org/pubs/dps/DP8537.asp www.ssrn.com/xxx/xxx/xxx
No. 8537
EDUCATION AND INVENTION
Otto Toivanen and Lotta Väänänen
INDUSTRIAL ORGANIZATION
brought to you by COREView metadata, citation and similar papers at core.ac.uk
provided by Research Papers in Economics

ISSN 0265-8003
EDUCATION AND INVENTION
Otto Toivanen, Katholieke Universiteit Leuven and CEPR Lotta Väänänen, Nokia
Discussion Paper No. 8537 August 2011
Centre for Economic Policy Research 77 Bastwick Street, London EC1V 3PZ, UK
Tel: (44 20) 7183 8801, Fax: (44 20) 7183 8820 Email: [email protected], Website: www.cepr.org
This Discussion Paper is issued under the auspices of the Centre’s research programme in INDUSTRIAL ORGANIZATION. Any opinions expressed here are those of the author(s) and not those of the Centre for Economic Policy Research. Research disseminated by CEPR may include views on policy, but the Centre itself takes no institutional policy positions.
The Centre for Economic Policy Research was established in 1983 as an educational charity, to promote independent analysis and public discussion of open economies and the relations among them. It is pluralist and non-partisan, bringing economic research to bear on the analysis of medium- and long-run policy questions.
These Discussion Papers often represent preliminary or incomplete work, circulated to encourage discussion and comment. Citation and use of such a paper should take account of its provisional character.
Copyright: Otto Toivanen and Lotta Väänänen

CEPR Discussion Paper No. 8537
August 2011
ABSTRACT
Education and Invention*
Modern growth theory puts invention on the center stage. Inventions are created by individuals, raising the question: can we increase number of inventors? To answer this question, we study the causal effect of M.Sc. engineering education on invention, using data on U.S. patents’ Finnish inventors and the distance to the nearest technical university as an instrument. We find a positive effect of engineering education on the propensity to patent, and a negative OLS bias. Our counterfactual calculation suggests that establishing 3 new technical universities resulted in a 20% increase in the number of USPTO patents by Finnish inventors.
JEL Classification: I21, J24 and O31 Keywords: ability bias, citations, education, engineers, growth, innovation, invention, inventors and patents
Otto Toivanen Department of Managerial Economics Strategy and Innovation (MSI) Katholieke Universiteit Leuven Naamsestraat 69 - box 3535 3000 Leuven BELGIUM Email: [email protected] For further Discussion Papers by this author see: www.cepr.org/pubs/new-dps/dplist.asp?authorid=145788
Lotta Väänänen Nokia, Keilalahdentie 2-4 02150 Espoo FINLAND Email: [email protected] For further Discussion Papers by this author see: www.cepr.org/pubs/new-dps/dplist.asp?authorid=171756
* We would like to thank Julia Lane, Andrea Mühlenweg, Viktor Slavtchev, Marko Terviö and Joachim Winter for their comments, as well as the participants at the SEEK conference at ZEW, the EEA conference in Glasgow, the ASIGO conference in Nurnberg, the SFB meeting in Tutzing, and the FDPE microeconomics seminar in Helsinki. We thank the Yrjö Jahnsson Foundation for financial support. Väänänen also gratefully acknowledges financial support from the FDPE and from the Deutsche Forschungsgemeinschaft through SFB/TR 15. The usual caveat applies. Submitted 10 August 2011

2
1 Introduction
A cornerstone of much of recent growth theory is that ideas, being non-rival in nature, are
a key source of growth (for surveys see e.g. Jones 2005 and Aghion and Howitt 1998,
2009). Furthermore, ideas are produced by human capital. The central consequence of
this line of thinking is aptly summarized by Jones (2005, pp. 1107): “The more inventors
we have, the more ideas we discover, and the richer we all are”. This immediately leads
to the following policy question: (How) can the number of inventors be increased? We
seek to contribute to answering this question by studying the causal effect of education on
invention. Education has been linked to growth in previous empirical work at the macro-
level,1 but to the best of our knowledge, we are the first to address the question at the
micro-level and to focus on the link from education to individuals’ propensity to patent
inventions.
Both stylized facts and government policies support the view that education
drives inventions and growth. First, both in cross section and over time, GDP per capita
and levels of education are positively correlated. Second, societies invest increasingly
large amounts (see e.g. Freeman 2010) in education - educational investments are
typically 3 – 6% of GDP2 - suggesting a strong belief in the existence of a causal link
between education and growth. Third, some rapidly developing countries, notably China
and India, have singled out (science and) engineering education as a way to foster
1 The current consensus (see recent surveys by Silanesi and van Reenen 2003, Stevens and Weale 2004 and
Krueger and Lindahl 2001) seems to be that there is at best weak empirical support for the causal relation
between education and growth. In a recent paper, Aghion, Boustan, Hoxby and Vandenbussche (2009),
using U.S. state level data, provide evidence of a causal link between education and growth (see also
Vandenbussche, Aghion and Meghir 2005). 2 See e.g. WDI education indicators at
http://siteresources.worldbank.org/DATASTATISTICS/Resources/table2_9.pdf , accessed August 28th,
2009.

3
(future) growth. This is documented in Figure 1 that displays the number of science and
engineering graduates in selected countries (due to lack of data on the former, only the
latter for India).3 The two countries showing a notable increase are China and India. In
terms of comparing levels, it is interesting that these two countries outpace others,
especially allowing for the fact that for India, only engineering graduates are included.
Finally, the fact that the U.S. has dropped down in rankings in science and engineering
graduates, both in absolute and in relative terms, has lead to alarm being raised in the
U.S. together with some analyses on how to react to this (see e.g. Burrelli and Rapoport
2009, Freeman 2006, 2010).4
Figure 1 here
We study the effect of individuals’ education, concentrating on university
(master’s level or higher) engineering education, on their inventive productivity, as
measured by patents and their quality. We use data on U.S. (USPTO) patents5 matched to
individual level data on (essentially) the whole Finnish working population over the
period of 1988 – 1996. Previous descriptive studies using data on individual inventors
have shown that inventors tend to be highly educated. Giuri et al. (2007) report that 77%
of European inventors in the PatVal survey have a university degree and 26% have a
doctorate. In our data about 35% of the inventors have a master’s degree and 14% have a
3 The reason for this is that we did not manage to find comparable data on Indian science graduates. The
recent India Science Report (Shukla 2005) reports (Table 2.3) that the ratio of science to engineering
students is 3:1. 4 See e.g. the Science Daily of Jan 18
th, 2010: “The state of the science and engineering (S&E) enterprise in
America is strong, yet its lead is slipping, according to data released at the White House January 15 by the
National Science Board (NSB).” In the same issue, the assistant director for federal research and
development, Kei Koizumi is quoted as saying: “ U.S. dominance [in science, technology, engineering and
mathematics] has eroded significantly." See also the recent report by The Task Force on the Future of
American Innovation”. In their list of “signs of trouble” they mention as first that “Undergraduate science
and engineering degrees within the U.S. are awarded less frequently than in other countries. Among
countries with higher rates they mention Finland. For a less alarmist view, see Gereffi, Wadhwa, Rissing
and Ong (2008) who argue that quality is more important than quantity. 5 Obtained from the NBER patents and citations data file (Hall, Jaffe Trajtenberg 2001).

4
doctorate (see Table 1). In addition, our data shows that the majority of Finnish inventors
have an engineering degree (66%), indicating that also the field of education is associated
with patented inventions.6 This observation is interestingly in line with Murphy, Shleifer
and Vishny (1991) who report some evidence that countries with a higher proportion of
engineering college majors grow faster. While existing evidence thus suggests a
significant positive association between individuals’ education and their inventiveness,
the causality of this link remains unexplored.
We identify the causal effect of university engineering education on the
propensity to patent by using geographic and over time variation in the possibility to
obtain a university engineering degree. During the 1960s and 1970s, Finnish education
policies lead to a large increase and geographic widening in the possibility to obtain a
university engineering degree. We use these changes as a quasi-natural experiment in the
spirit of papers that use the distance to college as an instrument in studying the returns to
education (surveyed e.g. by Card 2001), and of papers that use the schooling reform
implemented in all Nordic countries in the 60s and 70s to study the effects of education
on various outcomes (e.g. Meghir and Palme 2005 and Pekkarinen, Uusitalo and Kerr
2006). We link the individuals to the distance to the nearest university offering
engineering education and use this as an instrumental variable for the individuals’
schooling choice.
Using Finnish data seems pertinent to the study of the effect of education on
invention for two reasons: First, as documented by e.g. Trajtenberg (2001), Finland is
6 In the macroeconomic literature on the relationship between education and growth there is some work
seeking to differentiate the impact of different levels of education on growth. See e.g. ch13 in Aghion and
Howitt (1999).

5
among those nations that have accomplished a transformation from a resource based to an
invention based economy. This is reflected in the large increase in Finnish patent
applications to the USPTO in the past two decades. Second, while the increased
availability of higher education is a widely spread phenomenon among the developed
countries, this development has been particular in Finland in two respects. The first one is
the scope of this change – the proportion of a cohort to whom there are higher education
study places is among the highest in the world (OECD 2008). The second is that the
Finnish enlargement of the higher education sector has had a strong emphasis on
increasing the availability of engineering education. During this period (1950s – 1970s),
three new universities offering engineering education were established in different
regions of Finland. The share of engineering in higher education has traditionally been
quite high in Finland. In 1950, engineering students accounted for about 15% of all new
university students. While this share decreased from 1950 until 1965 to 9%, there was
renewed focus with the establishment of the universities and the share increased back up
to 15% by 1981. By way of contrast, in the U.S., the proportion of graduate students
studying engineering has been around 5% between 1975 and 2005 (NSF 2006, Table 1).
Among OECD countries, Finland stands out as the one with the highest emphasis on
engineering: 27% of the Finnish working age population with tertiary education has a
degree in engineering whereas the OECD average is 15% (OECD 2008). Given that
engineering is the form of higher education that is most directly targeted towards
industrial R&D, one could view the Finnish education policy as an experiment whose
individual level treatment effect we seek to identify and from which other countries may
learn.

6
To demonstrate these facts further, we show in Figure 2 the number of USPTO
patents, and the annual intake of engineering students at Finnish universities. The catch
of the figure is that the two highly correlated graphs (correlation coefficient 0.98) are
from different periods: The patent series is from 1981-2007, the intake of engineering
students from 1951-1977. While the (choice of) timing of the time-series is obviously
open to criticism,7 it demonstrates that at the aggregate level, there is some reason to
think that there could be a relationship between a policy that was implemented from the
1950s to the 1970s and outcomes measured in the 1990s.
Figure 2 here
By way of preview of our results, our Wald estimates that utilize the (different
changes over time in the) regional variation in the distance to the nearest technical
university show a positive treatment effect. In the IV-estimations, the first stage results
show that the distance to the nearest university offering engineering is a good predictor
for getting such degree. The estimated effect of a university engineering degree on the
individuals’ propensity to patent is positive and significant, with a coefficient of 0.15 (0.3
for the patent count). This is about 2.5 times as large as the OLS estimate. We thus find a
strong negative selection bias in the OLS estimations. The potentially counterintuitive
direction of the bias suggests that lowering the barriers (in particular reducing distance-
related costs) to university education may be an effective policy tool in attracting to
formal (tertiary, engineering) education inventive individuals who would otherwise have
chosen something else.8 We find some evidence that the estimated treatment effect is the
7 The qualitative message of the figure is robust to different timing choices. Naturally, the figure implies
nothing about causality. 8 That is, we identify the (weighted) local average treatment effect on the “compliers”, i.e,, those
individuals that were prompted to enter university engineering education by a shift in the instrument we

7
average treatment effect on the treated instead of a local average treatment effect. Our
back-of-the-envelope counterfactual calculation, where we look at what would have
happened if the new engineering universities had not been established, shows that the
number of USPTO patents assigned to Finnish inventors would have declined by some
20%.
We proceed as follows. In Section 2 we describe the data. In Section 3, we present
the empirical framework and discuss the identification strategy. In Section 4 we present
the results, in Section 5 the counterfactual analysis, and in Section 6 the conclusions.
2 Data and descriptive analysis
2.1 Data
Our data comes from several sources. Information on inventors and USPTO patents
comes from the NBER patents and citations data file described in Hall, Jaffe Trajtenberg
(2002). This data is matched to the Finnish Linked Employer-Employee data of Statistics
Finland (FLEED). The FLEED is a register-based dataset that contains detailed
information on the population of Finnish working-age individuals and on their
employers.9 Third, we use the Finnish 1970 census to add information on the parents of
the individuals in our sample. Finally, we match the patent data to data on the universities
and student intake in engineering in the years 1950-1981, obtained from the Finnish
Educational Establishment Statistics, and obtain a matrix of inter-municipality driving
distances from the Finnish Road Administration.
Briefly, the process of matching the inventors from the patent records to FLEED
use. See e.g. ch. 25 in Cameron and Trivedi (2005) or section 6.3.2 in Imbens and Wooldridge (2008). 9 The FLEED is described in Korkeamäki and Kyyrä (2000).
8
was as follows.10
To identify the individuals, the information contained in the patent
records (name of individual, address (at least the municipality) at which the individual
resided at the time) was used to search the Finnish Population Information System for the
identification codes of individuals that matched these data. In case there was more than
one match, we picked the individual whose employer’s name in the FLEED matched the
patent assignee in the USPTO data (at the time of application). If this process failed to
identify a single individual, we excluded such individuals from our data. Out of the 8065
inventor-patent records we were able to match 5905, consisting of 3253 individuals.
The Finnish Educational Establishment Statistics are available for each year from
1945 onwards. They contain information on all the higher education establishments,
including the type of the establishment and fields of education, size (by number of
students), and geographical coordinates. We concentrate on engineering education at
universities, because the inventors in our data are predominantly, if unsurprisingly,
engineers with a university degree.11
For each individual, we measure the distance from
each engineering establishment (in the year of the individual’s 18th
birthday, to represent
the relevant year of making the schooling choice) to the individual’s birth place.12
The
distances we use are road driving distances from the Finnish Road Administration. We
also measure the student intake in each of the establishments relative to the size of the
potential applicant cohort as an alternative measure.
10
The matching process is described in more detail in Toivanen and Väänänen (2010). 11
In Finland, a university level engineering degree is a (5-year) master’s degree. Engineering colleges
offer(ed) a 4-year degree that is equivalent to a bachelor’s degree. There is also a large fraction of college
engineers in the data, thus we use both definitions in our analysis. 12
Municipality of residence at the time of the schooling choice would be preferred, but is unavailable.

9
2.2 The sample
To construct the sample, we take a cross-section of individuals in the year 1988, who
were born between 1932 and 1963. These individuals made their schooling choices in the
years 1950-1981, under the assumption that they did so when they are eighteen years old.
In addition to all the individuals identified as inventors in the time period 1988-1996
(2328 inventors), our data includes a random sample of working-aged individuals (non-
inventors) from the FLEED. The FLEED data contains the full Finnish working-age
population. We take a 5% random sample from the 1988 cross-section for our analysis,
after which we keep the observations for individuals born between 1932 and 1963. Our
sampling weights are the inverse of the sampling probability (1/0.05), i.e., a weight of 20
for each of the control observations. Thus the sampling procedure we use is "choice-
based" sampling, with separate random samples for observations with Y=0 and Y>0.
2.3 Descriptive statistics
Table 1 shows the means, measured in 1988, for the key variables for inventors, i.e., for
those individuals who were inventors in a patent applied in any of the years 1988-1996,
as well as for a random sample of the Finnish working-age population. The table shows
that there are several characteristics according to which the inventors are different from
the rest of the working-age population. They are more likely to be male (only 7% are
female); they are highly educated, i.e., much more likely to have completed their high-
school matriculation and have a university education (a bachelor, master or a doctorate
degree); and they are more likely to have their education in the fields of natural sciences
and engineering. Finally, we note that they are particularly likely to be university
educated engineers (33% of inventors compared to 3% of the random sample).

10
Table 1 here
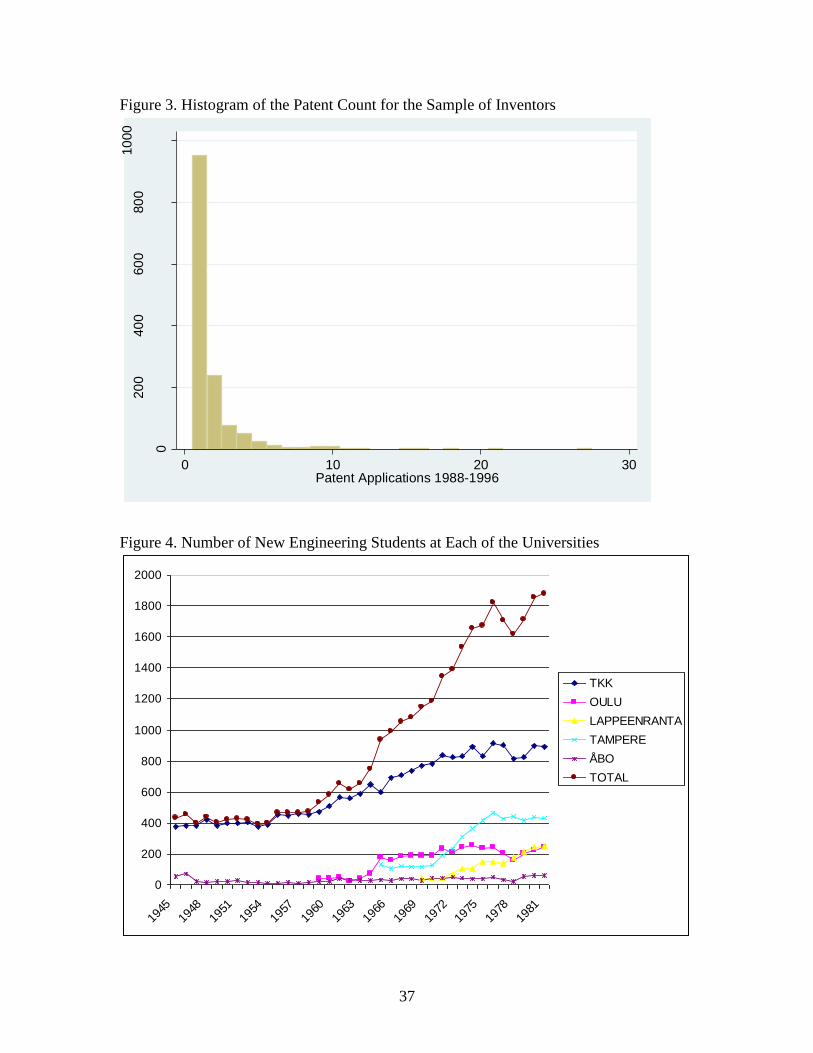
In Figure 3 we present histograms of the number of patents per inventor over the
period of 1988-1996. The great majority of the inventors (60%) have just one patent over
the whole time period, while about 20% have two patents and very few have more than 5
patents.
Figure 3 here
Next, we explore the association between different types of education and patent
output, and run an OLS regression with 46 dummies for the level-field combinations of
education. We use weights in the regression to adjust for the sampling procedure. As
control variables, we include in our estimating equation indicator variables for gender,
nationality (Finnish, foreign), language (Finnish, Swedish, other) and birth-year. While
most coefficients are small in absolute size, we find significant and large differences
between different fields and levels of education. Table 2 shows the coefficients of the
education dummies from the OLS regression. We see that engineering education has a
positive significant coefficient at all levels of education but the lowest, with the
magnitude increasing with the level of education.13
At the master’s and the doctorate
level, the coefficients for the natural sciences are large and significant. At the doctorate
level, also the coefficient of the health and welfare-field is large and significant.
Table 2 here
13 Here it is interesting to note that according to the NSF (2009, chapter 3), in the U.S. 53% of those
individuals that 1) hold a S&E degree and 2) who report R&D as a major work activity have bachelor's
degrees as their highest degree. Only 12% have doctorates.

11
2.4 Data on engineering education
In this section we present the data we use to generate our instrumental variable. Figure 4
shows a graph of the number of new engineering students in each of the Finnish
universities that offered engineering education during the period 1945-1981. In 1945,
there were two universities offering engineering education, both in Southern Finland: the
largest one in Helsinki (TKK) on the south coast,14
and a small Swedish-speaking one in
Turku (Åbo Akademi) in the south-west corner of the country. Together they had a total
of just over 400 new students starting that year. In 1959, the University of Oulu (over
600km from Helsinki) in Northern Finland began to offer engineering education,
followed by Tampere in Southern Finland (176km from Helsinki) in 1965 and
Lappeenranta in Eastern Finland (221km from Helsinki) in 1969.15
From the year 1960,
there has been rapid growth in the total number of new engineering students at
universities, tripling from 600 to 1800 in less than 20 years. While the Helsinki
University of Technology has doubled its student intake in engineering in the period
1945-1981, the universities in the other regions have also grown to significant size.
Figures 4 and 5 here
In Figure 5, we show the Finnish map, with the locations of the technical universities
and their distance to Helsinki highlighted. The figure demonstrates how the establishment
14
TKK itself moved from Helsinki to the neighboring Espoo starting in the late 1950s. The move was
completed in 1966. The capital region of Finland consists of several independent cities and municipalities,
the two largest of which are Helsinki and Espoo. This move obviously has only a very minor impact on the
distance to the nearest technical university. 15
Other universities, not offering an engineering education, were also established in cities shown on the
map in Figure 5. Jyväskylä’s teacher college obtained the right to grant doctorate degrees in 1944, and
established the Faculty of Philosophy in 1958. The planned University of Eastern Finland was initially split
into three, one of which is the technical university in Lappeenranta: University of Joensuu was established
in 1970, University of Kuopio in 1972. These two merged in 2010. University of Vaasa on the west coast
was established in 1968, and started to offer also an engineering education in 1988 (i.e., too late to affect
the educational choices of the individuals in our sample). Finally, University of Lapland was established in
Rovaniemi in 1979.

12
of the new universities considerably changed - even allowing for the fact that the Finnish
population is concentrated in the south and south-western parts of the country16
- the
distance to the nearest technical university for a large majority of the Finnish population.
The distance between the “old” technical universities in Helsinki and Turku is 165
kilometres. The new technical universities in Tampere, Lappeenranta and Oulu are
clearly inland, to the east, and to north of the old technical universities. Our instrument
builds to a large extent on this geographic and over-time variation in where university
level engineering education was available.
3 The empirical framework
We estimate the effect of engineering higher education on individuals’ inventiveness, as
measured by their total patent output (USPTO patents by application date) over the time
period of 1988-1996. We use a linear specification and estimate equations of the
following form:
(1) .
iY is our output measure (a 0/1 indicator for patents granted to individual i,, sum of
patents granted to individual i, or citations received by the patents of individual i), iX are
control variables describing the individual (gender, cohort dummies, native tongue),
iENG is an indicator equal to one if the individual has obtained a university engineering
degree (master or doctorate) by the year 1988. is the key parameter of interest,
measuring the (weighted) local average treatment effect (see Imbens and Wooldridge,
16
This concentration has increased over time. In 1960, the three southern/south-western regions (lääni) of
Uusimaa, Turun ja Porin lääni and Hämeen lääni housed 47% of the population; in 1996, the figure was
54%.
iii ENGXY

13
2008, section 6.3.2) of engineering education on inventive output, and is a vector of
parameters on the control variables.
The error term in equation (1) may be correlated with the schooling measure and
patents due to, for example, omitted variables related to unobserved individual ability, as
in estimating the returns to schooling. However, it is not clear ex ante what the direction
of the omitted variable bias is, because the unobserved ability affecting the propensity to
patent (individual’s inventiveness) is not necessarily positively correlated with the ability
that is typically thought to increase individual’s net benefits from schooling. In other
words, individuals with low (effort) costs of studying could on average be less good at
creative thinking that leads to invention, leading to negative correlation and a downward
bias in the OLS estimate.
In addition, there may also be an issue of essential heterogeneity or selection on
gains, which generates positive correlation between schooling and the error term. If
engineering higher education increases the propensity to patent, but mainly for those
individuals with innate inventive ability, then those individuals have a higher additional
benefit of schooling in terms of their increased propensity to patent, and are thus more
likely to choose such schooling.
We apply instrumental variables for the individuals’ schooling choice and identify
the (weighted) local average treatment effect (LATE) for those individuals who are
affected by the instruments we use. We discuss our identification strategy and our
instrumental variables in the next section.
3.1 Identification
We borrow the idea of using (time-varying) geographic variation from the literature that
14
utilizes educational reforms to estimate e.g. the returns to education (Card 2001, Meghir
and Palme 2005). The quasi-experiment we use is the growth of the Finnish university
level engineering education system that took place in the period 1950-1981. This
variation allows us to adopt an instrumental variable approach.
Individuals choose their education by evaluating the costs and benefits of the
alternatives. We use instruments generated from exogenous factors that affect the
individuals’ cost of choosing an engineering education. Using individuals’ birth year and
place, we determine the distance to and availability of university engineering education.
These measures correspond to institutional variations on the supply side of the education
system, and are typical of the kind of instrumental variables used in the recent literature
studying the effects of schooling choices on labor market outcomes (Card, 2001).17
We
combine distance-based instruments (geographical variation) with cohort-based
instruments (over time variation).
Our instrumental variable is based on distance, which exogenously generates
variation in the individuals’ mobility costs. Individuals, depending on where they live,
face different costs of travelling or moving to a town where engineering education is
offered. Our identifying assumption is thus that the distance between the location of an
individual and the nearest technical university affects the probability to obtain a
(university level) engineering degree, but does not directly affect the propensity to patent
(or the quality of the patents, measured by citations).
This instrument mainly has geographical variation, but there is also some variation
17
Kelchtermans and Verboven (2009) and Frenette (2009) study choice of higher education institutions.
The former utilize a funding reform in Belgium (Flanders) and the latter the establishment of new
universities in Canada. Both studies find that distance plays an important role in the choice of what to study
(and where).
15
over cohorts, as three new universities are founded at different times during the time
period. When using a location-based instrument, it is important to control for other
factors that are correlated with the location. For example, families living in or near
university towns are different to those living in smaller towns and rural areas, and family
background can influence both schooling and inventiveness. We control for the level and
field of the father’s education at reasonably high level of disaggregation, measured in the
year 1970, the first year for which such data is available.
The treatment effect we identify is LATE for individuals affected by the instruments
we use. As our instruments generate variation in the costs of choosing university
engineering education, the individuals affected by the instrument are those who are at the
margin of choosing university engineering education over some other schooling choice. It
is important to note that it is unclear what the relevant counterfactual is, i.e., what the
individuals would have chosen had they not chosen university engineering education. We
can only make a guess that the relevant next best choice for this group is either a lower
level engineering degree, or a university degree in some other field.
The LATE we identify is a however a relevant variable from the policy point of
view. Viewing our instruments as being generated by variation in government
educational policy, we are identifying the effect of this policy, to the extent that the
policy can be represented by the location of universities.
4 Results
We estimate the effect of university engineering education on individuals’ propensity to
patent, measured by the sum of their USPTO patent output over the time period of 1988-
1996. We begin by presenting simple difference- and Wald -estimates of the

16
establishment of the three new universities in the provinces where they were established.
We then move on to the regression analysis.
4.1 Wald -Estimates
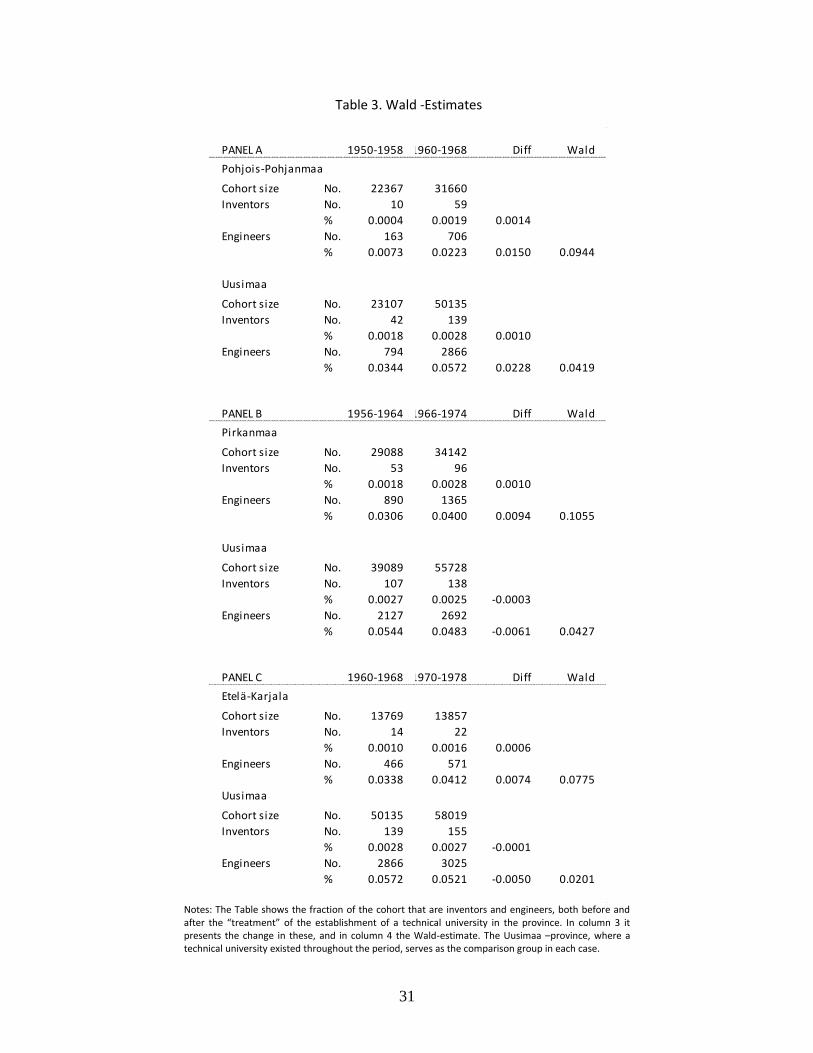
Table 3 presents simple difference- and Wald -estimates of the establishment of the three
new universities in the provinces where the universities were established. The benefit of
the Wald estimates is that they utilize in a straight-forward manner the differential
variation over time in the availability of university engineering education at different
locations. For each province, we look at groups of 9 birth-cohorts before the
establishment of the university and the 9 cohorts after. As a comparison, we always look
at the Uusimaa province (where the nation’s largest technical university existed
throughout the period) over the same time period.18
We report the fraction of the cohort
(of 18-year olds) born in the province that are a) inventors (i.e., obtain a USPTO patent in
1988-1996), b) engineers (higher level college or university engineering degree), before
and after the establishment of the university.
Table 3 here
In Panel A, we look at the Pohjois-Pohjanmaa province (for the years before
1950-1958; after 1960-1968), where a technical university was established in Oulu in
1959. The fraction of engineers increases from 0.7% to 2.2%, while the fraction of
inventors increases from 0.04% to 0.19%. During the same period, there is also rapid
growth in the fraction of engineers in the Uusimaa cohorts (as Helsinki University of
Technology also experienced an increase in student intake), from 3.4% to 5.7%, and the
fraction of inventors goes up from 0.18% to 0.27%. The Wald estimate of 0.09 for
18
The Uusimaa estimate is thus not a Wald-estimate, as the instrument (i.e., distance to the nearest
technical university) does not change.

17
Pohjois-Pohjanmaa indicates that about 1/10 engineers became an inventor. For Uusimaa,
the estimate is only about half the size, around 0.04. Thus for Uusimaa, where the initial
level of engineers is higher, further increases appears to produce less inventors on
average.
Looking at the Pirkanmaa province (Panel B) and the years 1956-1964 (before)
and 1966-1974 (after the establishment of the technical university in Tampere), there is a
relatively modest increase in the number of engineers (there was an established
engineering college in Tampere already before the establishment of the university), but
the increase in inventors is larger (in percentage terms). The resulting Wald estimate is
0.10 (notably similar to the figure for Pohjois-Pohjanmaa). For the same period for
cohorts born in Uusimaa, the fraction of engineers in fact decreased, as did the fraction of
inventors. The estimate is very similar to the one in the earlier period (0.04).
Finally, looking at Etelä-Karjala before and after the establishment of the
technical university in Lappeenranta (Panel C), we get a Wald estimate of 0.08, and for
the same period comparison the estimate for Uusimaa (where again both the fraction of
engineers as well as the fraction of inventors decreased) is 0.02.
Altogether these results suggest that the increase in the number of engineers born
in the provinces where new technical universities were established, around the time of the
establishment, is associated with larger increases in the number of inventors (born in
these provinces) than the increase of inventors for cohorts born in Uusimaa where an
established university already existed and the initial level was already high.
4.2 Regression Analysis
We run our estimations for three different (2nd
stage) dependent variables, (patent count,

18
patent dummy, expected citations) and for three different measures of education
(engineering education, technical university education, and university education).
Furthermore, we run these specifications with two sets of control variables (with and
without father’s education).
4.2.1 OLS-estimations
Table 4 presents the estimated coefficients from the OLS estimations for our key variable
of interest (i.e. a dummy variable indicating the type of education). The first column
shows the results from the estimations based on a larger sample without controlling for
family background, and the second column from the estimations with father’s education
included as a control (45 dummies for field-level combinations of education). This
sample is smaller, as father’s education is not available for all the individuals. The
smaller sample is also somewhat different with regard to the ages of the individuals, as
for the older cohorts it is more likely that the father is no longer alive in 1970.
Table 4 here
The OLS regressions show, throughout the different specifications, that education,
in particular university level engineering education, has a positive and significant
association with patenting. For the patent count as our dependent variable (the upper
panel in Table 4), the coefficients on university engineering education range from 0.110
(with s.e. of 0.007) to 0.118 (with s.e. of 0.009). The coefficients for engineering
education in general (including college-educated engineers) is only about half of this, and
those for university education in general are even smaller. When using either a patent
dummy (middle panel in Table 4) or citations as the dependent variable (the lower panel
in Table 4) we obtain results that mirror the previous ones.
19
As discussed earlier, the endogeneity bias in the OLS estimates could be in either
direction. This is what we investigate next using instrumental variables.
4.2.2 IV-estimations
In the instrumental variable regressions, the results of which are reported in Tables 5 and
6, we use the distance to the nearest university offering an engineering degree as our
instrumental variable affecting the choice of engineering education. For the effect of
university education in general, the instrumental variable is the distance to the nearest
university (including universities that do not offer engineering degrees). Table 5 presents
the estimated coefficients (and associated t-statistics below) on the instrumental variable
in explaining the individual’s education type (first stage). Table 6 presents the IV-
estimates of the coefficients on the education dummy from the regressions on patent
output. Similarly to the previous table, the first column shows the results from the
estimations based on the larger sample without controlling for family background, and
the second column from the estimations with father’s education included as a further
(vector of ) control variable(s).
Table 5 here
Looking at columns one and two in table 5, we see that the distance to the nearest
technical university has a significant negative effect on choosing such schooling, as
expected. The coefficients on the distance (in 100km) are -0.0026 (without father’s
education) and -0.0016 (with father’s education) for university engineering education.
Given the average probability of choosing such education (0.022), this translates into
about a 10% increase in the probability as distance decreases by 100km. We also see that
our instrument is quite strong in both specifications, although somewhat reduced by

20
controlling for father’s education (t-value of almost 10 in the regression without father’s
education, and 2.6 in the regression with). Part of this reduction in the strength of the
instrument is also due to the younger sample in the regression with father’s education;
when we run the specification without controls for father’s education on this sample, the
t-value of the instrument falls to 6.5.
Table 6 presents the estimation results from the second stage of the IV-
estimations, i.e., the patenting equation. The estimated coefficients throughout the
different specifications are 2-2.5 times the respective OLS estimates. This result could
indicate a negative selection bias, meaning that those who have a high innate propensity
for invention have a lower propensity to study at a technical university. This
interpretation is, in a sense, in line with the instruments we use and the treatment effect
we identify. Individuals who are induced to obtain a university-level engineering
education as a result of the proximity of a university (our instrument) are individuals at
the margin and thus not those who have the highest net benefits. The LATE we identify is
for the part of the population that is affected by these distance-related mobility costs.
From the specification in column two for the effect of university engineering education,
the coefficient of 0.3 indicates that inducing individuals to choose this kind of education
due to its proximity (affected by the establishment of the new universities) leads to
increases in patent output; about 3 university engineers are needed to produce one extra
patent.
Table 6 here
Comparing the results across dependent variables reveals that the pattern
discovered in the OLS estimations is replicated here, with the patent indicator yielding

21
the smallest coefficients, and the citation count the largest. When one compares the
results across specifications it is clear that the statistical significance of the estimated
treatment effect tends to decline as we include the vector of father’s education dummies
as control variables. Finally, when comparing the three endogenous dependent variables
(= measures of education), it is worth pointing out that the relative sizes of the
coefficients are well in line with what the OLS estimates already suggested, with
university engineering yielding the largest treatment effect estimate, university education
the second largest, and engineering education the smallest.
An additional interesting finding concerns gender differences in inventive
productivity. While the OLS estimates show a strong negative association between
female gender and patent output, this effect disappears once the endogeneity of
engineering education is taken into account. A large majority of the engineers are male.
This suggests that the observed gender difference in patent productivity is simply due to
the different type of education chosen by women and men.
In addition to the results reported here, we attempted to use another instrument,
based on the variation over cohorts in the intake of students to engineering universities.
This instrument however turned out to be weak, possibly due to measurement error.19
The
2nd
stage results are uninformative due to the weakness of the instrument (the point
estimates vary in sign, and are insignificant), and we do not report them here.
19
We generate this measure in two alternative ways: First, the cohort size is defined as all those for whom
the university is the closest one (in the relevant age cohorts). Thus, for example for the years 1950-1958
when there were two universities, this measure takes on two values in each year, one for those who are
closest to Turku and one for those who are closest to Espoo. Second, the cohort is geographically defined
by a province, and we restrict the analysis to only those provinces where a university exists at one point in
time. Here, the variable takes on 4 values each year (one for each province included in the analysis). With
this definition, the intake measure is equal to zero for the cohorts in provinces before the establishment of
the universities. Both measures have measurement error which may affect our first stage results.

22
4.3 Tests for heterogeneous effects
We test for heterogeneous treatment effects using a test suggested by Heckman,
Schmierer and Urzua (2009). We first run a Probit regression to estimate the propensity
score of having a university engineering degree. We use the same set of control variables
as in our main specification (including father’s education). We then include a polynomial
of this propensity score, together with interactions of it with some of the controls, and test
for nonlinearity of these terms. The results for a variety of specifications of the
polynomial, reported in Table 7, suggest that we cannot reject the Null hypothesis of a
homogenous treatment effect.
Table 7 here
The implication of accepting the test results would be that the treatment effect we
have estimated is the average treatment effect on the treated, not the (weighted) local
average treatment effect. That would obviously alter, and make stronger, our policy
conclusions. We return to this below in the counterfactual analysis. Our reading of the
results is that we have some, but no overwhelming, evidence in favor of our estimate
being an average treatment effect on the treated.
4.4 Discussion
Taken together, the preceding analysis suggests that by increasing the geographic
availability of university engineering education, Finland enticed young people to enter
into engineering education, ultimately making them more likely to patent. The negative
selection bias that we report suggests that a feature of the policy was to entice “non-
standard” (more inventive) individuals to enter into engineering higher education.
23
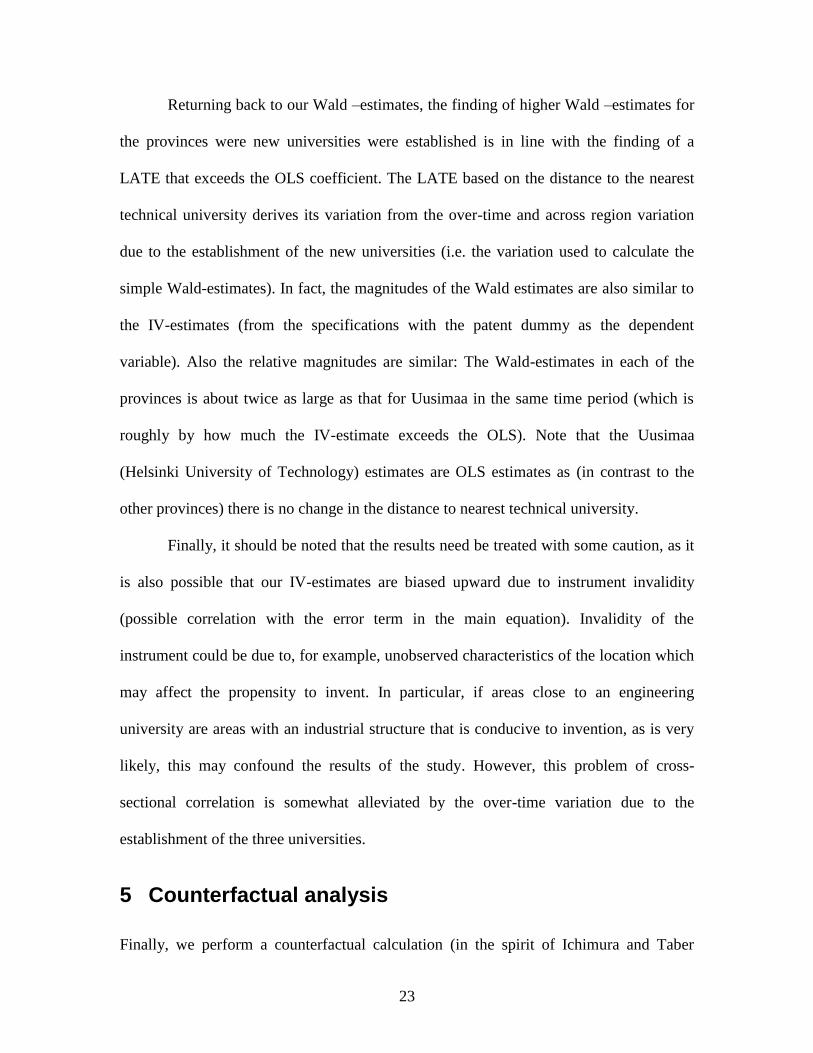
Returning back to our Wald –estimates, the finding of higher Wald –estimates for
the provinces were new universities were established is in line with the finding of a
LATE that exceeds the OLS coefficient. The LATE based on the distance to the nearest
technical university derives its variation from the over-time and across region variation
due to the establishment of the new universities (i.e. the variation used to calculate the
simple Wald-estimates). In fact, the magnitudes of the Wald estimates are also similar to
the IV-estimates (from the specifications with the patent dummy as the dependent
variable). Also the relative magnitudes are similar: The Wald-estimates in each of the
provinces is about twice as large as that for Uusimaa in the same time period (which is
roughly by how much the IV-estimate exceeds the OLS). Note that the Uusimaa
(Helsinki University of Technology) estimates are OLS estimates as (in contrast to the
other provinces) there is no change in the distance to nearest technical university.
Finally, it should be noted that the results need be treated with some caution, as it
is also possible that our IV-estimates are biased upward due to instrument invalidity
(possible correlation with the error term in the main equation). Invalidity of the
instrument could be due to, for example, unobserved characteristics of the location which
may affect the propensity to invent. In particular, if areas close to an engineering
university are areas with an industrial structure that is conducive to invention, as is very
likely, this may confound the results of the study. However, this problem of cross-
sectional correlation is somewhat alleviated by the over-time variation due to the
establishment of the three universities.
5 Counterfactual analysis
Finally, we perform a counterfactual calculation (in the spirit of Ichimura and Taber
24
2000, 2004) of total patent output in 1988-1996 had the three new technical universities
not been established. We do this by estimating the main equation (patent count as the
outcome), now including the distance to the nearest technical university as an explanatory
variable directly. We calculate the predictions in the actual scenario (and sum them over
all the individuals) and compare them to the scenario where everyone’s distance is
replaced by the distance to the technical university in Helsinki (Espoo, TKK). A
comparison of the two scenarios shows a predicted decrease in patent output of about
20% without the establishment of the three new technical universities. Specifications with
different polynomials of the instrument show counterfactual reductions in patent output
ranging from 13% to 20%.
A key question is of course what lesson our results, taken at face value, offer to
policy makers. A central message arises, which suggests that reducing the hurdles to
university-level engineering education may indeed lead to an increase in inventive output.
How then to achieve a lowering of the costs of an engineering education? It is not clear at
all from our results that reducing the distance is the right policy tool everywhere, even
though it seems to have worked in the post-war Finnish environment. Here, the different
interpretations of the estimated treatment effect lead to different implications. If the
estimate indeed is an average treatment effect on the treated, the choice of the policy
instrument is of much less significance. Any policy that leads to an increase in engineers
will lead to 0.2-0.3 patents more per every new engineer. If, on the other hand, the
estimate is a local average treatment effect, then this increase in patenting will only be
obtained if the implemented policy changes the behavior of the same part of the cohort
choosing what to study, as the Finnish policy affected in the post-war period. Whether

25
this will be the case or not is obviously much harder to assess.
Finally, notice that our counterfactual analysis is back-of-the-envelope because we
have not estimated a structural model. We thus do not know what the (general
equilibrium) effects of the adopted policy were, nor what would have happened if it had
not been implemented. For example, our analysis does not shed light on what those
individuals would have done who, because of the implemented policy, chose engineering
education. It is possible that they could have contributed more to GDP growth in the
alternative scenario even if they would have contributed less to Finnish patenting at the
USPTO.
6 Conclusions
Paraphrasing Jones (2005, pp. 1107), the question we address is: Can we, through
educational investments, increase the number of inventors, and thereby make us all
richer? Existing evidence based on macro level studies provides at best weak evidence of
a causal effect of education on growth (e.g. Krueger and Lindahl 2001), although Aghion,
Boustan, Hoxby and Vandenbussche (2009), using U.S. state level data, find evidence of
a positive effect of education on growth. To address the question directly at the micro-
level, we study the link between education and invention, using a matched dataset on
Finnish inventors of U.S. patents in 1988-1996.
We find a strong positive (causal) effect of engineering education on the
propensity to patent. We use a supply-side instrument - distance to the nearest
engineering university as our instrument - generated from the Finnish educational
policies of the period 1950-1981, i.e., the years in which the individuals in our sample

26
chose their education. The first stage result, that distance negatively affects individuals’
choice, indicates that the educational policy of increasing the geographic availability of
engineering education worked, in the sense that it increased the probability that
individuals from the nearby regions would enter university engineering education. The
interesting result is not only that the instrumental variable estimate is positive and
significant, but also that the OLS bias is negative, indicating that inventive individuals
are not the typical people who would obtain a university (engineering) education. Our
answer to the policy question is thus affirmative: Yes, the number of inventors can be
increased through educational policy. Our counterfactual exercise suggests that if Finland
had not established the new engineering universities in the post-war era, the number of
USPTO patents obtained by Finnish inventors would have been 20% lower.
Our results provide a potential explanation for the transformation of the Finnish
economy, noted e.g. by Trajtenberg (2001) and analyzed by Honkapohja, Koskela and
Uusitalo (2009), from a resource based to an innovation based economy. They also
provide a potential basis for the widely adopted educational policies in countries like e.g.
China and India that have invested heavily in increasing (science and) engineering
education, and to the recent U.S. worries about losing its comparative advantage in this
regard. Nevertheless, we stress that the result (of us having identified an average
treatment effect) leading to the policy conclusion that any policy that increases the
number of engineering students also increases innovation, rests on relatively thin
evidence. The effect of engineering education on innovation may well be context- and
policy-specific and thus not possible to generalize beyond the case examined here.

27
References
Acemoglu, Daron, 2002, Technical Change, Inequality, and the Labor Market, Journal of Economic
Literature, Vol. 40, Iss. 1, pp. 7-72.
Aghion, Philippe, Leah Platt Boustan, Caroline Hoxby and Jerome Vandenbussche, 2009, The Causal
Impact of Eduation on Economic Growth: Evidence from U.S., mimeo, Harvard University.
Aghion, Philippe and Peter Howitt, 1998, Endogenous Growth Theory, MIT Press, Cambridge, MA.
Aghion, Philippe and Peter Howitt, 2009, The Economics of Growth, MIT Press, Cambridge, MA.
Banerjee, Rangan, and Muley, Vinayak, 2008, Engineering Education in India, Department of Energy
Science and Engineering, Indian Institute of Technology, Bombay.
Burrelli, Joan, and Rapoport, Alan, 2009, Reasons for International Changes in the Ratio of Natural
Science and Engineering Degrees to College-Age Population, National Science Foundation Infobrief
NSF 09-308.
Cameron, Colin and Pravin Trivedi, 2005, Microeconometrics: Methods and Applications, Cambridge
University Press.
Card, David., 2001, Estimating the Return to Schooling: Progress on Some Persistent Econometric
Problems, Econometrica, Vol. 69, No. 5. pp. 1127-1160.
Freeman, Richard, 2006, Does Globalization of the Scientific/Engineering Workforce Threaten U.S.
Economic Leadership?, in Jaffe, Adam, Lerner, Josh, and Stern, Scott (eds.), Innovation Policy and
the Economy, vol. 6, the NBER and the MIT Press.
Freeman, Richard, 2010, What Does the Global Expansion of Higher Education Mean for the U.S.?, in
Clotfelter, Charles (ed.), American Universities in a Global Market, Chicago University Press.
Frenette, Marc, 2009, Do Universities Benefit Local Youth? Evidence from the Creation of New
Universities, Economics of Education Review, Vol. 28, pp. 318-328.
Gereffi, Gary, Vivek Wadhwa, Ben Rissing, and Ryan Ong, 2008, Getting the Numbers
Right:International Engineering Education in the United States, China and India, Journal of
Engineering Education, pp. 13-25.
Giuri P., Mariani M., Brusoni S., Crespi G., Francoz D., Gambardella A., Garcia-Fontes W., Geuna
A.,Gonzales R., Harhoff D., Hoisl K., Lebas C., Luzzi A., Magazzini L., Nesta L., Nomaler Ö.,
Palomeras N., Patel P., Romanelli M., Verspagen B., 2007, Inventors and Invention Processes in
Europe. Results from the PatVal-EU Survey, Research Policy, vol. 36, No. 8, 1107-1127.
Hall, Bronwyn, Adam B. Jaffe and Manuel Trajtenberg, 2002, The NBER Patent Citation Data File:
Lessons, Insights and Methodological Tools, Ch.13 in Jaffe and Trajtenberg, Patents, Citations &
Innovations: A Window on the Knowledge Economy, The MIT Press, 2002.
Heckman, James, Schmiere, Daniel, and Urzua, Sergio, 2009, Testing the Correlated Random Coefficient
Model, NBER working paper 15463.
Ichimura, Hidehiko and Jeffrey Taber, 2000, Direct Estimation of Policy Impacts, mimeo, UCL and IFS.
Ichimura, Hidehiko and Jeffrey Taber, 2002, Semiparametric Reduced-Form Estimation of Tuition
Subsidies, American Economic Review, Vol. 92, No. 2, pp. 286-292.
Imbens, Guido and Jeffrey Wooldridge, 2008, Recent Developments in the Econometrics of Program
Evaluation, NBER working paper 14251.
Jones, Charles, 2005, Growth and Ideas, ch. 16 in Handbook of Economic Growth 1B, Aghion P. and S.
Durlauf (eds.), Elsevier B.V.

28
Kelchtermans, Stijn and Frank Verboven, 2010, Program Duplication in Higher Education is Not
Necessarily Bad, Journal of Public Economics, Vol. 94, No. 5-6, pp. 397-410.
Korkeamäki, Ossi and Tomi Kyyrä, 2000, Integrated Panel of Finnish Companies and Workers, VATT
Discussion Paper No. 226.
Krueger, Alan and Mikael Lindahl, 2001, Education for Growth: Why and for Whom?, Journal of
Economic Literature, Vol. 39, 1101-1136.
Meghir, Costas and Mårten Palme, 2005, Educational Reform, Ability, and Family Background, The
American Economic Review, Vol. 95, No 1.
Murphy, Kevin, Andrei Shleifer, and Robert Vishny, 1991, The Allocation of Talent: Implications for
Growth, Quarterly Journal of Economics, Vol. 106, No. 2, 503-530.
National Science Foundation, 2006, Graduate Students and Postdoctorates in Science and Engineering: Fall
2006, available at http://www.nsf.gov/statistics/nsf08306/pdf/nsf08306.pdf, accessed August 28
2009.
National Science Foundation, Science and Engineering Indicators 2010, available at
http://www.nsf.gov/statistics/seind10/c/cs1.htm, accessed March 1, 2011.
OECD, 2008, Tertiary Education for the Knowledge Society, Vol. 1, Special features: governance, funding,
quality.
Pekkarinen, Tuomas, Roope Uusitalo and Sari Kerr, 2009, School tracking and intergenerational income
mobility: Evidence from the Finnish comprehensive school reform, Journal of Public Economics,
forthcoming.
Sianesi , Barbara and John Van Reenen, January 2003, The Returns to Education: Macroeconomics,
Journal of Economic Surveys, Vol. 17, No. 2, 157-200.
Shukla, Rajesh, 2005, India Science Report, National Council of Applied Economic Research, ISBN: 81-
88830-07-0.
Stevens, Philip and Martin Weale, 2004, Education and Economic Growth, in Johnes G. and Johnes J.
(eds.), The International Handbook on the Economics of Education, Edward Elgar Publishing.
Toivanen, Otto and Lotta Väänänen, 2010, Returns to Inventors, CEPR DP 7747. Forthcoming, The Review
of Economics and Statistics.
Trajtenberg, Manuel, 1990, A Penny for Your Quotes: Patent Citations and the Value of Innovations, Rand
Journal of Economics, Vol. 21, pp.172-187.
Trajtenberg, Manuel, 2001, Innovation in Israel 1968–1997: a Comparative Analysis Using Patent Data,
Research Policy, Vol. 30, Iss. 3, pp. 363-389.
Vandenbussche, Jerome, Philippe Aghion, and Costas Meghir, 2005, Growth and the Composition of
Human Capital, Journal of Economic Growth, vol. 11, No. 2, 97-127.

29
Table 1. Descriptive Statistics for the Inventors and for a Random Sample of the Population
Notes: The numbers are percentages, except for age which is in years.
Inventors Others
No. of observations 2,328 66,530
Level of education
upper secondary 14.4 37.8
lowest tertiary 11.0 13.0
lower-degree (bachelor) 18.0 5.4
higher-degree (master) 35.4 5.2
doctorate 13.6 0.4
unknown 7.6 38.3
Field of education
general 5.5 4.4
teacher education 0.3 1.9
humanities & arts 0.6 2.0
social science & business 2.7 11.9
natural sciences 11.2 1.2
engineering 65.9 22.2
agriculture and forestry 1.6 3.4
health and welfare 4.0 6.6
services 0.8 8.2
unknown 7.6 38.3
University engineering (master/doctor) 33.1 2.21
Age (years) 37 39
Female 7.9 49.3
Finnish-speaking 92.6 94.1
Swedish-speaking 6.5 5.4
Birth cohort
1931<born<1950 43.5 51.2
1949<born<1960 41.3 35.3
1959<born<1964 15.2 13.5
Labor market status
employed 95.7 83.6
unemployed 0.6 4.1
student 1.8 1.8
retired 0.5 5.4
other 1.5 5.1
Entrepreneur 6.4 11.9

30
Table 2. OLS coefficients of fields of education
Upper
Secondary Lowest Tertiary Bachelor Master's Doctorate
Teacher education -0.003*** -0.001** -0.002*** -0.003*** -0.003***
0.000 0.001 0.000 0.000 0.001
Humanities & arts -0.002*** -0.003*** -0.003*** -0.002*** -0.003***
0.001 0.000 0.000 0.001 0.001 Social science & business -0.002*** -0.002*** -0.002*** -0.003*** -0.004***
0.000 0.000 0.001 0.000 0.000
Natural sciences 0.000 -0.004*** -0.001 0.043*** 0.145***
0.003 0.000 0.001 0.006 0.026
Engineering -0.003*** 0.006*** 0.026*** 0.093*** 0.291***
0.000 0.001 0.003 0.007 0.050 Agriculture and forestry -0.004*** -0.004*** -0.004*** 0.004* 0.040*
0.000 0.000 0.000 0.002 0.024
Health and welfare -0.002*** -0.002*** -0.001 0.003* 0.105***
0.000 0.000 0.001 0.001 0.025
Services -0.003** -0.003*** -0.003*** -0.004*** 0.044
0.000 0.001 0.001 0.001 0.064 Notes: The dependent variable is the sum of patents of individual i in the period 1988-1996 (Patent Count) obtained by individual l i. The Table shows the estimated coefficient and standard error. *** indicate significance at 1%,** at 5% and * at 10% level. In all specifications, the control variables include gender, nationality, native tongue, and cohort dummies. The base category is “general” education (30).
31
Table 3. Wald -Estimates
Notes: The Table shows the fraction of the cohort that are inventors and engineers, both before and after the “treatment” of the establishment of a technical university in the province. In column 3 it presents the change in these, and in column 4 the Wald-estimate. The Uusimaa –province, where a technical university existed throughout the period, serves as the comparison group in each case.
PANEL A 1950-1958 1960-1968 Diff Wald
Pohjois-Pohjanmaa
Cohort size No. 22367 31660
Inventors No. 10 59
% 0.0004 0.0019 0.0014
Engineers No. 163 706
% 0.0073 0.0223 0.0150 0.0944
Uusimaa
Cohort size No. 23107 50135
Inventors No. 42 139
% 0.0018 0.0028 0.0010
Engineers No. 794 2866
% 0.0344 0.0572 0.0228 0.0419
PANEL B 1956-1964 1966-1974 Diff Wald
Pirkanmaa
Cohort size No. 29088 34142
Inventors No. 53 96
% 0.0018 0.0028 0.0010
Engineers No. 890 1365
% 0.0306 0.0400 0.0094 0.1055
Uusimaa
Cohort size No. 39089 55728
Inventors No. 107 138
% 0.0027 0.0025 -0.0003
Engineers No. 2127 2692
% 0.0544 0.0483 -0.0061 0.0427
PANEL C 1960-1968 1970-1978 Diff Wald
Etelä-Karjala
Cohort size No. 13769 13857
Inventors No. 14 22
% 0.0010 0.0016 0.0006
Engineers No. 466 571
% 0.0338 0.0412 0.0074 0.0775
Uusimaa
Cohort size No. 50135 58019
Inventors No. 139 155
% 0.0028 0.0027 -0.0001
Engineers No. 2866 3025
% 0.0572 0.0521 -0.0050 0.0201

32
Table 4. OLS Results
Patent Count No Family Background
+Father's Education
University eng. 0.110*** 0.118***
0.007 0.009
Engineering 0.0591*** 0.0628***
0.003 0.004
University 0.0316*** 0.0348***
0.002 0.002
Patent Indicator
University eng. 0.0493*** 0.0517***
0.003 0.003
Engineering 0.0282*** 0.0296***
0.001 0.001
University 0.0144*** 0.0156***
0.001 0.001
Citations
University eng. 1.179*** 1.350***
0.101 0.132
Engineering 0.618*** 0.357***
0.045 0.029
University 0.313*** 0.707***
0.021 0.059
Nobs
60234 33645 Notes: The dependent variable is the sum of patents of individual i in the period 1988-1996 (Patent Count), an indicator for individual i obtaining at least one patent during 1988-1996 (Patent Indicator), or the citations to the patents obtained by individual i. The Table shows the estimated coefficient and the standard error below. *** indicate significance at 1% level. In all specifications, the control variables include gender, nationality, native tongue, and cohort dummies. Father’s education is included as 45 dummies representing educational field-level combinations.

33
Table 5. First Stage Estimates
No Family
Background +Father's Education
University eng. -0.262*** -0.161***
0.029 0.061
Engineering -0.452*** -0.461***
0.047 0.096
University -1.08*** -0.378**
0.08 0.169
nobs
60234 33645 Notes: The Table shows the estimated coefficient and the associated standard errors below. *** indicate significance at 1% level,** at 5% level. Coefficients and standard errors have been multiplied by a factor of 100. The instrument is distance to nearest technical university when the dependent variable is either the indicator for a university engineering degree or an engineering degree, and distance to nearest university when the dependent variable is a university degree. In all specifications, the control variables include gender, nationality, native tongue, and cohort dummies. Father’s education is included as 45 dummies representing educational field-level combinations.

34
Table 6. IV – Estimates
Patent Count
No Family Background +Father's Education
University eng. 0.234*** 0.302**
0.038 0.15
Engineering 0.136*** 0.106***
0.021 0.041
University 0.067*** 0.202**
0.009 0.104
Patent Indicator
University eng. 0.108*** 0.155**
0.015 0.068
Engineering 0.063*** 0.054***
0.009 0.017
University 0.030*** 0.093**
0.004 0.045
Citations
University eng. 2.322*** 2.592
0.438 1.787
Engineering 1.347*** 0.907*
0.249 0.558
University 0.736*** 2.137*
0.117 1.213
Nobs 60234 33645
Control Variables
Fathers education no yes
Regional dummies no no Notes: The Table shows the estimated coefficient and the associated standard errors below. *** indicate significance at 1% level,** at 5% level, * at 10% level. In all specifications, the control variables include gender, nationality, native tongue, and cohort dummies. Father’s education is included as 45 dummies representing educational field-level combinations.

35
Table 7. Tests of Heterogenous Treatment Effects
No interactions With interactions
P-value P-value
2nd order 0.805 0.926
+3rd order 0.725 0.32 Notes: The Table shows the P-values of the joint significance (F-) tests. In all specifications, the control variables include gender, nationality, native tongue, and cohort dummies. Father’s education is included as 45 dummies representing educational field-level combinations. In column 2, we interact the instrument and its powers with nationality and native tongue – dummies.

36
Figure 1. Science and Engineering Graduates in Selected Countries
Notes: Source for all other countries but India NSF Science and Engineering Indicators 2010, Figure O-8.
See http://www.nsf.gov/statistics/seind10/figures.htm. For India, the source is Banerjee and Muley (2008).
Figure 2. USPTO Patents and Engineering Student Intake at Universities
Note: The USPTO patent series is 1981-2007, the engineering student intake series 1951-1977.
0.00
100.00
200.00
300.00
400.00
500.00
600.00
700.00
800.00
900.00
1998 1999 2000 2001 2002 2003 2004 2005 2006
United States
China
UK
Japan
South Korea
Germany
India
0
500
1000
1500
2000
2500
3000
1 3 5 7 9 11 13 15 17 19 21 23 25 27
USPTO patents
Eng. studentintake
37
Figure 3. Histogram of the Patent Count for the Sample of Inventors
Figure 4. Number of New Engineering Students at Each of the Universities
0
20
040
060
080
010
00
Fre
qu
en
cy
0 10 20 30Patent Applications 1988-1996
0
200
400
600
800
1000
1200
1400
1600
1800
2000
1945
1948
1951
1954
1957
1960
1963
1966
1969
1972
1975
1978
1981
TKK
OULU
LAPPEENRANTA
TAMPERE
ÅBO
TOTAL

38
Figure 5. Map of Finland, with Locations of Engineering Universities and Distances to
Helsinki
Note: Universities that did not offer engineering education (before 1988) were
established in Jyväskylä (1944), Vaasa (1968), Kuopio (1972), Joensuu (1970) and
Rovaniemi (1979).