education and global competitiveness
TRANSCRIPT

Education and Global Competitiveness:Lessons for the United Statesfrom International EvidenceThe Harvard community has made this
article openly available. Please share howthis access benefits you. Your story matters
Citation West, M. R. “Education and Global Competitiveness.” In K. Hassett,ed. Rethinking Competitiveness. Washington DC: AmericanEnterprise Institute Press. An excerpt of this paper also appears in:West, Martin R. 2012. Global Lessons for Improving U.S. Education.Issues in Science & Technology 28, no. 3:37-44
Citable link http://nrs.harvard.edu/urn-3:HUL.InstRepos:9544459
Terms of Use This article was downloaded from Harvard University’s DASHrepository, and is made available under the terms and conditionsapplicable to Other Posted Material, as set forth at http://nrs.harvard.edu/urn-3:HUL.InstRepos:dash.current.terms-of-use#LAA

1
3
Education and Global Competitiveness: Lessons for the United States from International Evidence
Martin West
The 2009 Program for International Student Assessment (PISA), the latest and most comprehensive international test of student achievement, placed the relative standing of the U.S. education system in stark relief. American students’ middling performance on international tests is by now familiar, and PISA 2009 was no exception: our fifteen-year-olds ranked fourteenth out of the thirty-four developed democracies that are members of the Organisation for Economic Co-operation and Development (OECD) in reading, seventeenth in science, and no better than twenty-fifth in math. The new wrinkle in the 2009 study was the participation of China’s Shanghai province, which topped the international league table in all three subjects, besting American students by the equivalent of multiple grade levels in each category. The results from Shanghai, home to the nation’s wealthiest city and a magnet for its most ambitious and talented citizens, are hardly representative of China as a whole. Yet its students’ eye-popping performance seemed to highlight new challenges facing the U.S. economy in an age of unprecedented global trade. U.S. Secretary of Education Arne Duncan deemed the results an “absolute wake-up call” and urged the nation “to get much more serious about investing in education” (Armario 2010).
Even before the December 2010 publication of the PISA data, the notion that educational competition threatens America’s future prosperity had been a recurrent theme of the Obama administration’s pronouncements on education policy. In his first State of the Union address, the president warned that “the countries that out-teach us today will out-compete us tomorrow” (White House 2009). He has repeatedly called attention to America’s declining rank in the share of students completing college degrees and established the goal of reclaiming America’s position as first in the world by this metric by 2020 (U.S. Department of Education 2010). In various speeches, President Obama and Secretary Duncan have emphasized the link between education and national economic competitiveness in making the case for the education funding allocated through the American Recovery and Reinvestment Act, for the state policy changes incentivized by the Race to the Top grant competition, and for increased federal support of early childhood education. More recently, in response to Republican proposals to rein in federal spending, the president has warned that “we cannot cut education. We can’t cut the things that will make America more competitive” (White House 2011).
Rhetoric linking education and economic competitiveness is hardly new. Concerns about global competition have long served to motivate federal investment in education and broader efforts to enhance the performance of American schools. A Nation at Risk, the 1983 report that captivated the public and informed a generation of school reform, famously warned that “our once unchallenged preeminence in commerce, industry, science, and technological innovation is being overtaken by competitors throughout the world. . . . What was unimaginable a generation ago has begun to occur—others are matching and surpassing our educational attainments” (National Commission on Excellence in Education 1983, ). A generation earlier, the Soviets’ launch of Sputnik sparked widespread angst about the quality of American math and science

2
education and the passage of the National Defense Education Act. As far back as 1914, the Commission on National Aid to Vocational Education warned that “the battles of the future between nations will be fought in the markets of the world. That nation will triumph . . . which is able to put the greatest amount of skill and brains into what it produces” (quoted in Grubb and Lazerson 2004, 11). The Smith-Hughes Act, which provided the first federal funding for elementary and secondary education programs, was enacted three years later.
As Secretary Duncan himself noted in 2010, however, “The relationship between education and international competitiveness is a subject rife with myth and misunderstanding” (Duncan 2010, 65). This confusion may stem from the fact that the concept of international competitiveness is notoriously difficult to pin down. Academic economists have long criticized the view that countries in a globalized economy are engaged in a zero-sum game in which only some can emerge as winners and others will inevitably lose out. As Paul Krugman (1996) pointed out in 1994, countries, unlike corporations, “do not go out of business” (6). Moreover, all countries can in theory benefit from international trade by specializing in those activities in which they have a comparative advantage. In what sense, then, does it make sense to talk about national economies competing?
These general lessons seem doubly true in the case of education, where the mechanisms by which gains abroad would undermine Americans’ prosperity are altogether unclear. Educational improvements in other countries enhance the productivity of their workforces, which in turn should reduce the costs of imports to the United States to the benefit of all Americans who do not compete directly in producing the same goods. At the top end of the education spectrum, growth in the number of graduate degrees awarded in fields such as science and engineering fosters technological advances from which Americans can benefit regardless of whether the key discoveries were made in the United States. Among developing countries, the ongoing expansion of educational opportunities for women in particular promises to reduce poverty, violence, and political instability. For all these reasons, developments such as Shanghai’s performance on the PISA, although at first glance startling, may in fact represent good news (Duncan 2010).
This is not to say, however, that America’s very real educational challenges are irrelevant to its economic performance going forward. On the contrary, the evidence that the quality of a nation’s education system is a key determinant of the future growth of its economy is increasingly strong (Hanushek and Woessmann 2011). If, following Xavier Sala-i-Martin (2010), the economist behind the World Economic Forum’s influential Global Competitiveness Index, competitiveness is redefined as “the set of institutions, policies, and factors that set the sustainable current and medium-term levels of economic prosperity” (1), then the performance of national education systems should be central to its measurement. To the extent that America’s education system stagnates as other countries advance, its relative standing in the world economy and global influence will no doubt suffer.
Assertions of education’s importance for global competitiveness, however misleading, can therefore be useful to the extent that they illustrate the potential for the American education system to perform at much higher levels and foster a sense of urgency about its improvement. Most Americans continue to assign high marks to their own local schools, even as they evaluate the nation’s schools more critically than ever (Bushaw and Lopez 2011). This pattern reflects and works to reinforce a reform agenda centered on increasing the performance of economically disadvantaged students, racial and ethnic minorities, and those at the bottom of the skill

3
distribution. While this task is and must remain an urgent priority, defining the nation’s educational challenge solely in terms of domestic achievement gaps ignores the gains that would result from improved performance and productivity across the American education system as a whole. Greater recognition of the “global achievement gap” may help to alter the perceptions of policymakers and the public and broaden support for politically controversial reforms (Wagner 2008).
Discussions of educational competition can also be useful to the extent that they foster systematic investigation of the factors that lead to higher and more equitable levels of performance across countries. Identifying the determinants of the performance of national education systems is challenging, and naïve attempts at “global benchmarking” based on case studies of high-performing countries can yield misleading lessons. However, careful research exploiting the differences in how public education is governed and organized across countries can shed light on which strategies are most promising in the American context. As education researcher Arthur W. Foshay put it in 1962 after conducting the first cross-country study of student achievement, “If custom and law define what is educationally allowable within a nation, the educational systems beyond one’s national borders suggest what is educationally possible” (quoted in Hanushek and Woessmann 2011, 90).
The remainder of this chapter surveys the emerging scholarly literature on the causes and consequences of differences in the performance of national education systems. I first use international studies of student achievement and attainment to shed light on the scope for improvement in the United States. I then review recent evidence on the link between education and economic growth to highlight the potential economic gains from performance improvements. Finally, I discuss lessons for American policymakers from research examining the policies associated with strong educational performance across countries.
Ranking the U.S. Education System: Quality and Quantity Indicators
National education systems can be compared in terms of both the quantity of education citizens receive and its quality. Studies of the former typically focus on the average years of schooling students complete or on the share of students receiving high school or postsecondary degrees. While these indicators are often easy to obtain, they implicitly assume that an additional year of schooling or a given educational credential means the same thing from one country to the next. Quality measures, which are based on common assessments of the academic achievement of a nation’s students at ages when most or all students remain enrolled in school, do not suffer from this drawback. As discussed below, quality measures also appear to be the more reliable barometer of the degree to which the nation is fostering conditions for sustained economic progress.
Student Achievement in Math and Science. Viewed through a quality lens, the evidence is clear that the American education system ranks in the middle of the pack, at best, among industrialized countries when it comes to math and science. The United States regularly participates in two major international testing programs in math and science, the PISA and the longer-running Trends in Mathematics and Science Study (TIMSS), providing multiple perspectives on how the performance of its students compares. TIMSS and PISA use quite different approaches to develop their assessments of student achievement: While TIMSS ensures

4
that the content of its tests are closely aligned to the math and science curricula of participating countries, PISA evaluates students against its own definitions of literacy in math, science, and reading and emphasizes items designed to measure students’ ability to apply knowledge of these subjects in real-world settings. Despite this difference in testing philosophy, however, the scores of countries that participate in both assessments are highly correlated.1 The fact that both assessments paint a similar picture suggests that conclusions concerning the U.S. performance are not driven by the idiosyncrasies of a particular testing regime.
Launched in 2000 as a project of the OECD, the PISA is administered every three years to nationally representative samples of students in each OECD country and a growing number of partner countries (and subnational units such as Shanghai). The seventy-four education systems that participated in the 2009 PISA study represented more than 85 percent of the global economy and included virtually all of America’s major trading partners, making it a particularly useful source of information on our students’ relative standing. Another advantage of the PISA study is its focus on students nearing the completion of secondary schooling.
Figure 3.1 displays the performance of the thirty top-performing OECD countries in math and science on the 2009 PISA study.2 Although Chile, Israel, Mexico, and Turkey have been excluded to enhance legibility, these countries do contribute to the average scores plotted for the OECD as a whole. As the figure indicates, U.S. students perform well below the OECD average in math and essentially match the OECD average in science. In math, the United States trails seventeen OECD countries by a statistically significant margin, its performance is indistinguishable from that of eleven countries, and it significantly outperforms only five countries (including the four excluded from the figure). In science, the United States significantly trails twelve countries and outperforms just nine. Countries scoring at similar levels to the United States in both subjects include Austria, the Czech Republic, Hungary, Ireland, Poland, Portugal, and Sweden.
1 The performance of countries participating in the 2003 TIMSS and PISA studies, for example, are correlated at 0.87 in math and 0.97 in science (see Hanushek and Woessmann 2008). Although the relative rank of U.S. students is higher on the TIMSS than on the PISA, this is attributable to the fact that the sample of countries participating in the TIMSS includes fewer industrialized countries and more developing ones. 2 I focus on math and science performance because achievement in these subjects is more reliably measured across countries and because it is in these subjects in which the evidence connecting education quality to economic growth is strongest. As noted above, the United States performs somewhat better on PISA’s reading assessment, with an average score of 500 as compared to the OECD average of 493. Even so, its reading performance significantly trails six OECD countries and is statistically indistinguishable from another fourteen.

5
Figure 3.1
Math and Science Achievement in OECD Countries (PISA 2009)
Source: Fleischman et al. (2010). Notes: Countries with solid (hollow) green markers outperform the United States in two (one) subjects by a statistically significant margin; countries with solid (hollow) red markers significantly trail the United States in two (one) subjects; countries with solid gold markers are statistically indistinguishable from the United States in both subjects. Slovakia outperformed the United States in math but trailed it in science. The OECD average is the average of the national averages from the OECD member countries, with each country weighted equally. Four OECD countries are excluded from the figure (but included in the calculation of OECD average). Their math (science) scores are as follows: Israel: 447 (455); Turkey: 445 (454); Chile: 421 (447); and Mexico: 419 (416).
AUS
AUT
BEL
CAN
CZE
DEN
EST
FIN
FRA
GER
GRC
HUN
ISL
IRL
ITA
JPN
KOR
LUX
NLD
NZL
NORPOL
PRT
SVK
SVN
SPN
SWE
SWI
UK
USA
OECD Average
OECD Average
460
480
500
520
540
Ave
rage
Mat
h S
core
460 480 500 520 540 560Average Science Score

6
The gap in average math and science achievement between the United States and the top-performing national school systems is dramatic. PISA established the scales it uses to evaluate achievement in mathematics in 2003 and in science in 2006 to have a mean of 500 and a (student-level) standard deviation of 100 across the OECD countries. The gap between the United States and the highest-performing OECD country therefore amounts to three-fifths of a standard deviation in math and just over half of a standard deviation in science. By way of comparison, the achievement gap between African American and white high school students within the United States is roughly four-fifths of a standard deviation. The gap between the United States and other countries can also be compared to the amount that students typically learn in one year of schooling, as estimated on the basis of age- and demographic-adjusted differences in the performance of students in different grades taking the assessment. In math the average American student by age fifteen is at least a full year behind the average student in six countries, including Canada, Japan, and the Netherlands. Students in six additional countries, including Australia, Belgium, Estonia, and Germany, outperform American students by more than half a year.3
The second-rate math and science performance of American students is particularly striking given the level of resources the nation devotes to elementary and secondary education. Data on cumulative expenditures per student in public and private schools between ages six and fifteen confirm that the United States spends more than any other OECD country save Luxembourg (a wealthy city-state that spends nearly 1.5 times as much as the United States). Figures 3.2 and 3.3, which plot average math and science achievement in 2009 against this spending measure across the OECD, reveal that the relationship between the level of educational investment and student achievement is very weak overall and altogether nonexistent among those countries spending at least $30,000 per student.4 This pattern suggests that national education systems vary widely in their spending productivity—that is, the achievement outcomes they produce for each dollar spent. This variation does not favor the United States. Most of the countries that outperform the United States in each subject spend between $60,000 and $80,000 per student, as compared with the nearly $105,000 spent by the United States. The Czech Republic, Hungary, and Poland, all of which perform at essentially the same level as the United States in both subjects, spend less than half as much. These three countries achieve comparable results while spending far less despite having far lower levels of GDP per capita, fewer than half as many college-educated adults, and, in the case of Hungary and Poland, twice as many students from socioeconomically disadvantaged backgrounds.
3 The reported grade-level equivalents for math and science are 41 and 38 scale score points, respectively. 4 Excluding Chile, Mexico, and Turkey, the correlation between math (science) achievement and cumulative spending per student across OECD countries is 0.08 (-0.06); neither correlation is statistically significant.

7
Figure 3.2 Math Achievement vs. Educational Expenditure across OECD Countries
Source: Organisation for Economic Co-operation and Development (2010a, figure I.3.9). Notes: Countries with green markers outperform the United States by a statistically significant margin; countries with red markers significantly trail the United States; countries with gold markers are statistically indistinguishable from the United States. Slovakia outperformed the United States in math but trailed it in science. The OECD averages are averages of the national averages from the OECD member countries, with each country weighted equally. Luxembourg is excluded from the figure (but included in the calculation of OECD averages); it had an average math score of 489 and cumulative expenditure per student of $155,624. PPP = purchasing power parity.
AUS
AUT
BEL
CAN
CHL
CZE
DEN
EST
FIN
FRA
GER
GRC
HUN
ISL
IRL
ISR
ITA
JPN
KOR
MEX
NLDNZL
NORPOL
PRT
SVK SVN
SPN
SWE
SWI
TUR
UK USAOECD Average
OECD Average
400
450
500
550
Aver
age
Mat
h Sc
ore
20000 40000 60000 80000 100000Cumulative Expenditure Per Student (USD, converted using PPPs)

8
Figure 3.3 Science Achievement vs. Educational Expenditure across OECD Countries
Source: Organisation for Economic Co-operation and Development (2010a, figure I.3.9). Notes: Countries with green markers outperform the United States by a statistically significant margin; countries with red markers significantly trail the United States; countries with gold markers are statistically indistinguishable from the United States. Slovakia outperformed the United States in math but trailed it in science. The OECD averages are averages of the national averages from the OECD member countries, with each country weighted equally. Luxembourg is excluded from the figure (but included in the calculation of OECD averages); it had an average math score of 484 and cumulative expenditure per student of $155,624. PPP = purchasing power parity.
AUS
AUT
BEL
CAN
CHL
CZE
DEN
EST
FIN
FRA
GER
GRC
HUN
ISL
IRL
ISR
ITA
JPNKOR
MEX
NLD
NZL
NOR
POL
PRTSVK
SVN
SPN
SWE
SWI
TUR
UK
USAOECD Average
OECD Average
400
450
500
550
Ave
rage
Sci
ence
Sco
re
20000 40000 60000 80000 100000Cumulative Expenditure Per Student (USD, converted using PPPs)

9
Some analysts have speculated that, despite the modest performance of its average students, the U.S. education system is characterized by pockets of excellence that can be expected to meet the needs of the knowledge economy. As discussed below, however, there is no clear evidence that educating a subset of students to very high levels is more important than raising average achievement levels for national economic success. Moreover, the United States in fact fares no better in comparisons of the share of students performing at exceptionally high levels. For example, only 9.9 percent of American students taking the 2009 PISA math test achieved at level 5 or 6 (the two top performance categories), a level of accomplishment that PISA claims indicate that students are “capable of complex mathematical tasks requiring broad, well-developed thinking and reasoning skills” (Organisation for Economic Co-operation and Development 2010b, 18). As in the case of average math performance, twenty-four of the thirty-four OECD countries outranked the United States by this metric. The share of students achieving level 5 or 6 exceeded 15 percent in ten OECD countries and exceeded 20 percent in another five. In Shanghai, China, fully 50.4 percent of students surpassed this benchmark—more than five times the level in the United States (OECD 2010a).
Another common response to our disappointing performance on international assessments has been to emphasize the relative diversity of American students and the wide variation in their socioeconomic status (see, for example, Ladd [2012]). Family background characteristics and other out-of-school factors clearly have a profound influence on students’ academic achievement. The available international assessments, all of which offer only a snapshot of how students have learned at a single point in time rather than evidence on how much progress they are making from one year to the next, are therefore best viewed as measuring the combined effects of differences in school quality and differences in these contextual factors. The latter are poorly measured across countries, making it difficult to pin down their relative import.
Even so, it is difficult to attribute the relative standing of U.S. students among OECD countries to out-of-school factors alone. The share of American students with college-educated parents, a key predictor of school success, actually ranks eighth among the thirty-four OECD countries. The typical American student is also well above the OECD average according to PISA’s preferred measure of students’ socioeconomic status (OECD 2011). Cross-country studies based on the PISA and other international assessments do indicate that the United States falls within the top quarter of developed countries in terms of the degree to which various measures of family background predict student achievement (see, for example, Schuetz, Ursprung, and Woessmann 2008; Woessmann 2004). This pattern is consistent with well-known evidence showing large gaps in academic achievement along lines of race, ethnicity, and family income and suggests that educational opportunity is less equitably distributed in the United States than in many other countries. Aggregate differences in family background, however, are unlikely to account for the performance gap between American students as a whole and those in top-performing countries. Educational Attainment. The United States, however, has never fared well in international comparisons of student achievement. The United States ranked eleventh out of twelve countries participating in the first major international study of student achievement, conducted in 1964, and its math and science scores on the 2009 PISA actually reflect modest improvements over the

10
test’s previous administration in 2006.5 America’s traditional reputation as the world’s educational leader stems instead from the fact that the spread of mass secondary education proceeded far earlier here than in most other nations.
In the first half of the twentieth century, demand for secondary schooling in the United States surged as technological changes increased the wages available to workers who could follow written instructions, decipher blueprints, and perform basic calculations. America’s highly decentralized school system, in which local communities could vote independently to support the creation of a high school, provided a uniquely favorable mechanism to drive increased public investment in schooling. As economic historian Claudia Goldin (2001) has documented, by 1955 almost 80 percent of American fifteen- to nineteen-year-olds were enrolled full-time in general secondary schooling, more than double the share in any European country. Goldin and Lawrence Katz (2008) provide compelling evidence that this rapid accumulation of human capital played a critical role in America’s twentieth-century economic success.
America’s historical advantage in terms of educational attainment has long since eroded. High school graduation rates in the United States peaked in 1970 at roughly 80 percent and have declined slightly since—a trend often masked in official statistics by the growing number of students receiving alternative credentials, such the General Educational Development (GED) certificate (Heckman and LaFontaine 2010). Although the share of students enrolling in college has continued to climb, the share completing a college degree has hardly budged. As this pattern suggests, both the time students are taking to complete college degrees and the dropout rates among students enrolling in college have increased sharply. The apparent stagnation in the accumulation of human capital in the United States in recent decades is especially puzzling in light of the fact that the economic returns to completing a postsecondary degree—and the economic costs of dropping out of high school—have grown substantially over the same period (Heckman and Krueger 2003).
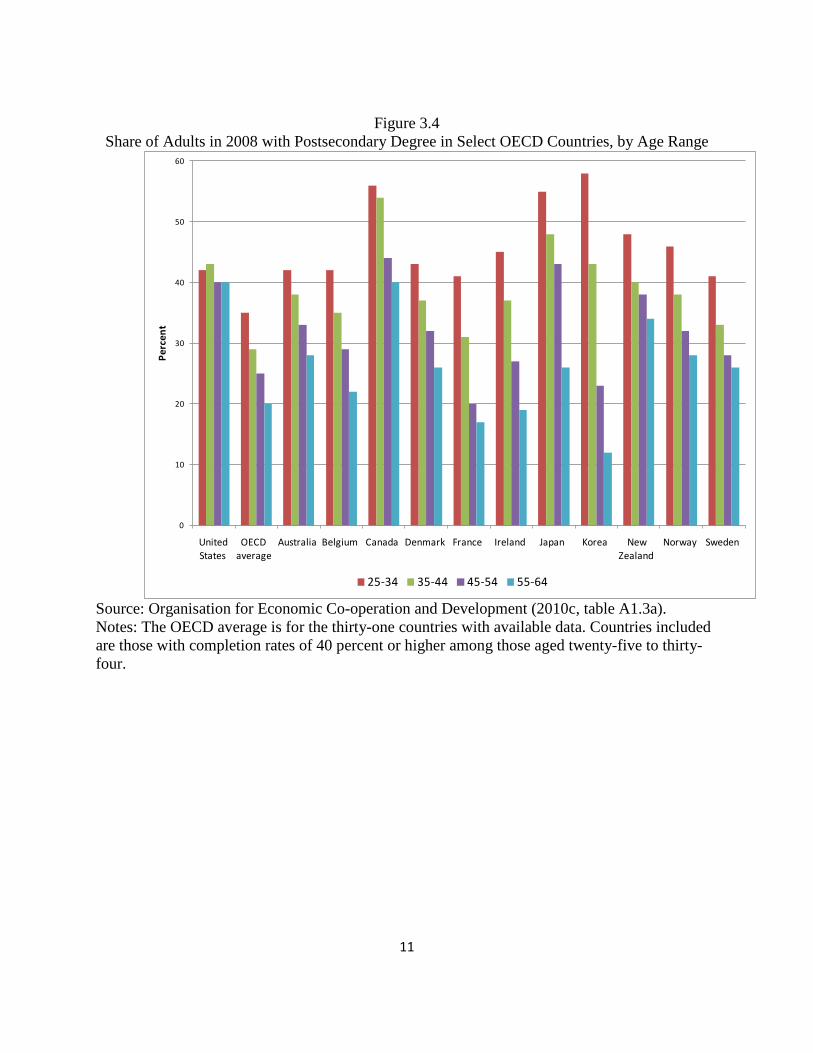
Meanwhile, other developed countries have continued to see steady increases in educational attainment and, in many cases, now have postsecondary completion rates that exceed those in the United States. America’s high school graduation rate now trails the average for European Union countries and ranks no better than eighteenth among the twenty-six OECD countries for which comparable data are available (OECD 2010c, table A2.1). Figure 3.4 displays the share of adults of various ages who have completed postsecondary degrees in the United States, OECD countries as a whole, and those OECD countries for whom the share of degree holders among those aged twenty-five to thirty-four exceeds 40 percent. On average across the OECD, postsecondary completion rates have increased steadily from one age cohort to the next: Although only 20 percent of those aged fifty-five to sixty-four have a postsecondary degree, the share among those aged twenty-five to thirty-four is up to 35 percent. The postsecondary completion rate of Americans aged twenty-five to thirty-four remains above the OECD average at 42 percent, but this reflects a decline of 1 percentage point relative to those aged thirty-five to forty-four and is only marginally higher than the rate registered by older cohorts. The comparison between the United States and Canada is particularly striking. Although the two nations have virtually identical postsecondary completion rates among those aged fifty-five to sixty-four, Canada’s rate among the youngest cohort now exceeds America’s by one-third. 5 U.S. performance on the PISA math assessment fell between 2003 and 2006, however, and its 2009 scores are not statistically different from those achieved in 2003. See Loveless (2011).
11
Figure 3.4
Share of Adults in 2008 with Postsecondary Degree in Select OECD Countries, by Age Range
Source: Organisation for Economic Co-operation and Development (2010c, table A1.3a). Notes: The OECD average is for the thirty-one countries with available data. Countries included are those with completion rates of 40 percent or higher among those aged twenty-five to thirty-four.
0
10
20
30
40
50
60
United States
OECD average
Australia Belgium Canada Denmark France Ireland Japan Korea New Zealand
Norway Sweden
Perc
ent
25-34 35-44 45-54 55-64

12
To be sure, in many respects the American higher education system remains the envy of the world. Despite recent concerns about rapidly increasing costs, declining degree-completion rates, and the quality of instruction available to undergraduate students, American universities continue to dominate world rankings of research productivity. The 2011 Academic Rankings of World Universities (ARWU), an annual publication of the Shanghai Jiao Tong University, placed 8 American universities within the global top 10, 17 within the top 20, and 151 within the top 500.6 A 2008 Rand study commissioned by the U.S. Department of Defense found that 63 percent of the world’s most highly cited academic papers in science and technology were produced by researchers based in the United States (Galama and Hosek 2008). America remains the top destination for graduate students studying outside of their own country, attracting 19 percent of all foreign students in 2008—9 percentage points more than its closest competitor, the United Kingdom (Wildavsky 2011).
Yet surely the most dramatic educational development in recent decades has been the rapid global expansion of higher education (Wildavsky 2008). Harvard economist Richard Freeman (2010) estimates that America’s share of the total number of postsecondary students worldwide fell from 29 percent in 1970 to just 12 percent in 2006, a 60 percent decline. A portion of this decline reflects the progress of developed countries documented above, but the more important factor by far has been the spectacular expansion of higher education in emerging economies such as China and India. In China alone, postsecondary enrollments exploded from fewer than 100,000 students in 1970 to 23.4 million in 2006. The increase over the same period in India was from 2.5 million to 12.9 million students. By way of comparison, just 17.5 million American students were enrolled in postsecondary degree programs in 2006.
Although these absolute enrollment numbers reflect China’s and India’s sheer size and say nothing about the quality of instruction students receive, several recent reports have nonetheless concluded that the rapidly shifting landscape of higher education threatens America’s continued dominance in such strategically important fields as science and technology. Perhaps best known is the 2007 National Academies committee report titled Rising Above the Gathering Storm, which drew on a variety of indicators of educational and scholarly performance to warn that the “scientific and technological building blocks critical to our economic leadership are eroding at a time when many other nations are gathering strength” (National Academy of Sciences 2007, 4). A follow-up report issued by a subset of the committee in 2010 warned that the storm was “rapidly approaching category five” (National Academy of Sciences 2010, While critics claim the committee exaggerated the degree to which the research coming out of emerging economies is comparable to that produced by researchers based in the United States, it seems safe to conclude that in the future America will occupy a much smaller share of a rapidly expanding academic marketplace (Galama and Hosek 2008).
6 These rankings are available at: http://www.shanghairanking.com/. The ARWU ranking is based on six indicators: number of alumni and staff who have won Nobel Prizes and Fields Medals (10 percent); number of highly cited researchers across a range of fields selected by Thomson Scientific (20 percent); number of articles published in Nature and Science (20 percent); number of articles indexed in Science Citation Index—Expanded and Social Sciences Citation Index (20 percent); and a size-adjusted performance measure that divides each indicator by the number of full-time faculty and academic staff (10 percent). Although the ARWU has been criticized for focusing solely on scholarly productivity and overemphasizing math and science publications, competing rankings yield similar conclusions regarding the relative performance of U.S. institutions.

13
The Economic Costs of Low-Quality Education American students now complete less schooling than those in many other developed countries and, at the secondary level, perform substantially worse in math and science. Moreover, America’s longstanding edge in higher education is fading as developing countries increasingly make investments in higher education a central part of their economic development strategies. How concerned should we be about these developments? And is it the improvement in educational outcomes abroad that should motivate our concern?
After all, until very recently the performance of the U.S. economy had far surpassed that of the industrialized world as a whole, despite our students’ mediocre performance on international tests. Some observers have gone so far as to question the existence of a link between available measures of the performance of national education systems and economic success. Education researcher Gerald Bracey in 2002 criticized those asserting that low-quality education threatened our national prosperity, noting that “none of these fine gentlemen has provided any data on the relationship between the economy’s health and the performance of schools. Our long economic boom suggests there isn’t one—or that our schools are better than the critics claim” (Bracey 2002, B01).7
Bracey’s evidentiary concern was not entirely misplaced. Economists as far back as Adam Smith have highlighted the theoretical importance of human capital as a source of national economic growth. For technologically advanced countries, highly educated workers represent a source of innovations needed to further enhance labor productivity (Benhabib and Spiegel 1994). For countries far from the frontier, education is necessary to allow workers to be able adopt new technologies developed elsewhere (Nelson and Phelps 1966). Because a given country is likely to be both near and far from the technological frontier in various industries at any given point in time, both of these mechanisms are likely to operate simultaneously. Yet rigorous empirical evidence supporting these commonsense propositions has been notoriously difficult to produce.
One key limitation of early research examining the relationship between education and economic growth is that it was based on crude measures of school enrollment ratios or the average years of schooling completed by the adult population. Although studies taking this approach tend to find a positive relationship between schooling and economic growth across countries, years of schooling is an incomplete and potentially quite misleading indicator of the performance of national education systems (see, for example, Krueger and Lindahl 2001). As noted above, measures of educational attainment implicitly assume that a year of schooling is equally valuable regardless of where it is completed—despite the clear evidence from international assessments that the skills achieved by students of the same age vary widely across countries.
Economists Eric Hanushek and Ludger Woessmann (2008) have addressed this limitation in an important series of papers published since 2008.8 Their key innovation is the use of twelve international assessments of math and science achievement conducted between 1964 and 2003 to construct a comparable measure of the cognitive skills of secondary school students for a large
7 For a more nuanced account questioning the strength of the relationship between education and economic growth, see Grubb and Lazerson (2004). 8 For an earlier attempt to relate measures of educational quality based on student test scores and economic growth, see Hanushek and Kimko (2000).

14
sample of countries. This measure enables them analyze the relationship between this measure and economic growth rates between 1960 and 2000 across all fifty countries for which cognitive skills and growth data are available and separately across twenty-four members of the OECD.
Hanushek and Woessmann’s work has yielded several notable results. First, after controlling for both a country’s initial GDP per capita and the average years of schooling completed in 1960, a 1 standard deviation increase in test scores is associated with an increase in annual growth rates of nearly 2 percent. Taken at face value, this implies that raising the performance of American students in math and science to the level of a top-performing nation such as Finland would increase our growth rate by more than a full percentage point over the long run (i.e., once students educated to that level of academic accomplishment make up the entire national workforce). Second, both the share of a country’s students performing at a very high level and the share performing above a very low level appear to contribute to economic growth in roughly equal amounts, suggesting that there is no clear economic rationale for policymakers to focus exclusively on improving performance at the top or the bottom of the ability distribution (Hanushek and Woessmann 2009). Finally, they show that, after controlling for their test-based measure of students’ cognitive skills, the number of years of schooling completed by the average student is no longer predictive of growth rates. This suggests that policies intended to increase the quantity of schooling students receive will only bear economic fruit if they are accompanied by measurable improvements in students’ cognitive skills (Hanushek and Woessmann 2010).
Although a clear improvement over previous evidence, skeptics may wonder whether the pattern Hanushek and Woessmann have identified linking education quality and economic growth in fact reflects a causal relationship. It is possible that unidentified factors enhance both the quality of national education systems and economic growth. In addition, the fact that they draw in part on very recent test score measures to predict growth rates between 1960 and 2000 leaves open the possibility that economic growth leads to strong educational performance rather than the other way around. Hanushek and Woessmann (2009) have performed a series of analyses intended to rule out these concerns. For example, they demonstrate that they obtain similar results when they use tests administered prior to 1980 to predict growth rates after that year and when they use changes in a country’s test scores over time to predict variation in growth rates during the time period of their analysis. Although none of these tests of causation is definitive on its own, together they strongly suggest that policies that increase education quality would in fact generate a meaningful economic return.
Moreover, the magnitude of the relationship Hanushek and Woessmann have identified is so large that it would remain important even if a substantial portion of it were driven by other factors. Consider the results of a simulation in which it is assumed that the math achievement of American students improves by 0.25 standard deviations gradually over a twenty-year period. Such an improvement would raise the United States to the level of countries such as New Zealand and the Netherlands, but not to that of the very top-performing OECD countries. Assuming that the past relationship between test scores and economic growth holds true in the future, the net present value of the resulting increment to GDP over an eighty-year horizon would amount to almost $44 trillion. A parallel simulation of the consequences of bringing American students up to the level of the top-performing countries suggests that doing so would yield benefits with a net present value approaching $112 trillion (Hanushek and Woessmann 2010).

15
Yet despite ubiquitous rhetoric about education’s importance for countries competing in the global marketplace, there is no evidence that these potential gains would come at the expense of other nations. Put differently, there is no reason to suspect that Americans are made worse off in absolute terms by the superior performance of students in places such as Finland, Korea, or even Shanghai. At the higher-education level, American universities clearly face growing competition in recruiting talented international students and faculty and will likely find it difficult to maintain their current dominance of world rankings. Yet, as Richard Freeman (2010) explains, “The globalization of higher education should benefit the United States and the rest of the world by accelerating the rate of technological advance associated with science and engineering and by speeding the adoption of best-practices around the world, which will lower the costs of production and prices of goods” (374).
This is not to say that a continued decline in the relative standing of the American education system would leave the U.S. economy entirely unaffected. As Caroline Hoxby (2003) points out, studies of the factor content of American exports and economic growth have long documented their disproportionate reliance on human capital. This pattern suggests that the United States has traditionally had a comparative advantage in the production of goods that depend on skilled labor, which in turns reflects its historical edge in the efficient production of highly educated workers. In recent decades American companies have increasingly addressed labor shortages in technical fields by “importing” human capital in the form of highly educated immigrants, many of whom received their postsecondary training in the United States (Freeman 2010). This strategy cannot be a source of comparative advantage in the long run, however, because other countries are by definition able to import talented immigrants at the same cost. The decline in the relative performance of our educational system may therefore have adverse consequences for the high-tech sectors on which the nation has historically depended to generate overall growth. The ability of the American economy as a whole to adapt in the face of such a disruption is, of course, an open question.
Policy Lessons In short, although there is little indication that education is an area in which countries are engaged in zero-sum global competition for scarce resources, education reform does provide a means to enhance economic growth and, in turn, the nation’s capacity to address its mounting fiscal challenges. Even if that were not the case, the moral argument for addressing the performance of America’s most dysfunctional school systems and the inequalities in social outcomes they produce would be overwhelming. What, then, are the lessons American policymakers should draw from the growing body of evidence examining the performance of national school systems?
The first, and most straightforward, is simply that dramatic improvement is possible—and that this is true even of the best-performing state school systems within the United States. Not only do many countries perform at markedly higher levels despite being at lower levels of economic development but also several of these countries have improved their performance substantially in the relatively short period of time since international tests were first widely administered (Mourshed, Chijioki, and Barber 2010). Nor does the international data suggest that countries face a stark trade-off between excellence and equity when considering strategies to raise student achievement. In fact, the countries with the highest average test scores tend to

16
exhibit less overall inequality in test scores and, in many cases, weaker dependence of achievement on family background characteristics (Freeman, Machin, and Viarengo 2010).
A policy agenda centered around closing the global achievement gap between American students and those in other developed countries would provide a complementary, and arguably more encompassing, rationale for education reform than one focused primarily on closing achievement gaps within the United States. The urgency of closing domestic achievement gaps is without question, but the current emphasis on this goal may well reinforce the perception among middle-class Americans that their schools are performing at acceptable levels. The 2011 Phi Delta Kappa–Gallup Poll shows that more than half of all Americans currently assign the public schools in their local community an “A” or “B” grade, whereas only 17 percent assign one of those grades to public schools in the nation as a whole (Bushaw and Lopez 2011). This gap between local and national evaluations has widened considerably over the past decade, and similar data from the 2011 Education Next–Program on Education Policy and Governance Survey shows that well-educated, affluent Americans are particularly likely to rate their local schools favorably (Howell, Peterson, and West 2011). Reporting systems that make it possible to compare the performance of students in specific American school districts to top-performing countries internationally could help to alter these perceptions and broaden support for reform.
A second lesson is that reform efforts should aim to improve the quality of education available to American students in elementary and secondary schools rather than merely increase the quantity of education they consume. The large economic return to the completion of college and especially graduate degrees suggests that there is considerable demand for workers who have been educated to those levels, and policymakers would be wise to address issues such as the complexity of financial aid systems that create obstacles to degree completion for academically prepared students. But increasing educational attainment should not be an end in and of itself. Doing so is unlikely to yield economic benefits absent reforms to K-12 schooling that ensure that a growing number of students are equipped for the rigors of postsecondary work.
A final general lesson is that additional financial investment is neither necessary nor sufficient to improve the quality of elementary and secondary education. The data presented above clearly show that other developed countries have managed to achieve far greater productivity in their school systems, in many cases spending considerably less than the United States, to achieve superior results. Nor have countries that have increased spending levels in recent decades experienced gains in their performance on international assessments, a pattern that is consistent with the mixed track record of spending increases in producing improved student outcomes within the United States.9
If countries with high-performing elementary and secondary education systems have not spent their way to the top, how have they managed to get there? Unfortunately, drawing more specific policy guidance for the United States on the basis of international evidence remains a challenge. While it is straightforward to document correlations between a given policy and performance across countries, it is much harder to rule out the existence of other factors that could explain the relationship. The vast cultural and contextual differences from one country to the next also imply that policies and practices that work well in one setting may not do so in
9 For a review of the international evidence on the relationship between spending and achievement across and within countries, see Hanushek and Woessmann (2011). For a review of evidence from the United States, see Hanushek (2003).

17
another. Even so, there are three broad areas in which the consistency of findings across studies using different international tests and country samples bears attention.
Exit Exams. Perhaps the best-documented area is that students perform at higher levels in countries (and in regions within countries) with externally administered, curriculum-based exams at the completion of secondary schooling that carry significant consequences for students of all ability levels (Bishop 2006; Hanushek and Woessmann 2011). Although many American states now require students to pass an exam in order to receive a high school diploma, these tests are typically designed to assess minimum competency in math and reading and are all but irrelevant to students elsewhere in the performance distribution. In contrast, exit exams in many European and Asian countries cover a broader swath of the curriculum, play a central role in determining students’ postsecondary options, and carry significant weight in the labor market. As a result, these systems provide strong incentives for student effort and valuable information to parents and other stakeholders about the relative performance of secondary schools. The most rigorous available evidence indicates that math and science achievement is a full grade-level equivalent higher in countries with such an exam system in the relevant subject (Woessmann 2003).
Private School Competition. Countries vary widely in the extent to which they make use of the private sector to provide public education. In countries such as Belgium, the Netherlands, and (more recently) Sweden, for example, private schools receive government subsidies for each student enrolled equivalent to the level of funding received by state-run schools. Because private schools in these countries are more heavily regulated than those in the United States, they more closely resemble American charter schools (though they typically have a distinctive religious character). In theory, government funding for private schools provides families of all income levels with a broader range of options and therefore subjects the state-run school system to increased competition from alternative providers. Rigorous studies confirm that students in countries that, for historical reasons, have a larger share of students in private schools perform at higher levels on international assessments while spending less on primary and secondary education, suggesting that competition can spur school productivity (West and Woessmann 2010). In addition, the achievement gap between socioeconomically disadvantaged and advantaged students is reduced in countries in which private schools receive more government funds (Woessmann et al. 2009).
High-Ability Teachers. Much attention has recently been devoted to the fact that several of the highest-performing countries internationally draw their teachers disproportionately from the top one-third of all students completing college degrees (Barber and Mourshed 2007). This contrasts sharply with patterns in the United States and, given the strong evidence that teacher effectiveness is the most important school-based determinant of student achievement, likely plays a decisive role in their success.10 Unfortunately, as education economist Dan Goldhaber (2009) points out, the differences in teacher policies across countries that have been documented to date “do not point toward a consensus about the types of policies—or even sets of policies—that might ensure a high-quality teacher workforce” (83). Although increasing average salaries provides one potential mechanism to attract a more capable teaching workforce, there is no clear relationship between teacher salary levels and student performance among developed countries. 10 For evidence on the importance of teacher effectiveness for student achievement, see Rockoff (2004).

18
Especially given the current strains on district and state budgets, any funds devoted to increasing teacher salaries should be targeted at subjects such as math and science (in which qualified candidates have stronger earnings opportunities in other industries) and at teachers who demonstrate themselves to be effective in the classroom. Intriguingly, the only available study on the latter topic shows that countries that allow teacher salaries to be adjusted on the basis of their performance in the classroom perform at higher levels (Woessmann 2010).
Over the past two decades, state and federal efforts to improve American education have centered on the development of test-based accountability systems that reward and sanction schools on the basis of their students’ performance on state assessments. The evidence is clear that the federal No Child Left Behind Act and its state-level predecessors have improved student achievement, in particular for students at the bottom of the performance distribution (Dee and Jacob 2011; Hanushek and Raymond 2005). Yet the progress made under these policies falls well short of their ambitious goals and, as important, appears to have been limited to a one-time increment in performance rather than launching schools on a trajectory of continuous improvement. International evidence does not provide definitive guidance for closing the global achievement gap between students in the United States and those in the top-performing countries abroad. It does, however, indicate that holding students accountable for their performance, creating competition from alternative providers of schooling, and developing strategies to recruit and retain more capable teachers all have important roles to play in addressing what should be a vital national priority.

19
References Armario, Christine. 2010. “Wake-up Call: U.S. Students Trail Global Leaders.” Associated Press
Wire, December 7. Barber, Michael, and Mona Mourshed. 2007. “How the World’s Best-Performing School
Systems Come Out on Top,” McKinsey and Company. Benhabib, Jess, and Mark Spiegel. 1994. “The Role of Human Capital in Economic
Development: Evidence from Aggregate Cross-National Data.” Journal of Monetary Economics 34:143–74.
Bishop, John. 2006. “Drinking from the Fountain of Knowledge: Student Incentive to Study and Learn—Externalities, Information Problems, and Peer Effects.” In Handbook of the Economics of Education, vol. 2, ed. Eric A. Hanushek and Finis Welch, 910–44. Amsterdam: Elsevier.
Bracey, Gerald. 2002. “Why do we Scapegoat the Schools?” Washington Post, May 5, B01. Bushaw, William J., and Shane J. Lopez. 2011. “Betting on Teachers: The 43rd Annual Phi
Delta Kappa/Gallup Poll of the Public’s Attitudes toward the Public Schools.” Phi Beta Kappan 93 (1): 8–26.
Dee, Thomas S., and Brian A. Jacob. 2011. “The Impact of No Child Left Behind on Student Achievement.” Journal of Policy Analysis and Management 30 (3): 418–46.
Duncan, Arne. 2010. “Back to School: Enhancing U.S. Education and Competitiveness.” Foreign Affairs 89 (6): 65-74.
Fleischman, Howard L., Paul J. Hopstock, Marisa P. Pelczar, and Brooke E. Shelley. 2010. Highlights from Pisa 2009: Performance of U.S. 15-Year-Old Students in Reading, Mathematics, and Science Literacy in an International Context. NCES 2011-004. U.S. Department of Education, National Center for Education Statistics. Washington, DC: U.S. Government Printing Office
Freeman, Richard B. 2010. “What Does the Global Expansion of Higher Education Mean for the United States?” In American Universities in a Global Market, ed. Charles T. Clotfelter, 373–404. Chicago: University of Chicago Press.
Freeman, Richard B., Stephen Machin, and Martina Viarengo. 2010. “Variation in Educational Outcomes and Policies across Countries and of Schools within Countries.” NBER Working Paper 16293. National Bureau of Economic Research, Cambridge, MA.
Galama, Titus, and James Hosek. 2008. U.S. Competitiveness in Science and Technology. Santa Monica, CA: Rand Corp.
Goldhaber, Dan. 2009. “Lessons from Abroad: Exploring Cross-Country Differences in Teacher Development Systems and What They Mean for U.S. Policy.” In Creating a New Teaching Profession, ed. Dan Goldhaber and Jane Hannaway, 81–111. Washington, DC: Urban Institute Press.
Goldin, Claudia. 2001. “The Human Capital Century and American Leadership: Virtues of the Past.” Journal of Economic History 61 (2): 263–92.
Goldin, Claudia, and Lawrence Katz. 2008. The Race between Education and Technology. Cambridge, MA: Belknap Press of Harvard University.
Grubb, W. Norton, and Marvin Lazerson. 2004. The Education Gospel: The Economic Power of Schooling. Cambridge, MA: Harvard University Press.

20
Hanushek, Eric A. 2003. “The Failure of Input-based Schooling Policies.” Economic Journal 113 (485): F64–98.
Hanushek, Eric A., and Dennis D. Kimko. 2000. “Schooling, Labor Force Quality, and the Growth of Nations.” American Economic Review 90 (5): 1184–1208.
Hanushek, Eric A., and Margaret Raymond. 2005. “Does School Accountability Lead to Improved Student Achievement?” Journal of Policy Analysis and Management 24 (2): 297–327.
Hanushek, Eric A., and Ludger Woessmann. 2008. “The Role of Cognitive Skills in Economic Development.” Journal of Economic Literature 46 (3): 607–68.
———. 2009. “Do Better Schools Lead to More Growth? Cognitive Skills, Economic Outcomes, and Causation.” NBER Working Paper 14633. National Bureau of Economic Research, Cambridge, MA.
———. 2010. “How Much Do Educational Outcomes Matter in OECD Countries?” NBER Working Paper 16515. National Bureau of Economic Research, Cambridge, MA.
——— . 2011. “The Economics of International Differences in Educational Achievement.” In Handbook of the Economics of Education, vol. 3, ed. Eric Hanushek, Stephen Machin, and Ludger Woessmann, 89–200. Amsterdam: Elsevier.
Heckman, James J., and Alan B. Krueger. 2003. Inequality in America: What Role for Human Capital Policies? Cambridge, MA: MIT Press.
Heckman, James J., and Paul A LaFontaine. 2010. “The American High School Graduation Rate: Trends and Levels.” Review of Economics and Statistics 92 (2): 244–62.
Howell, William G., Paul E. Peterson, and Martin R. West. 2011. “The Public Weighs In on School Reform.” Education Next 11 (4): 11–22.
Hoxby, Caroline M. 2003. “School Choice and School Productivity: Could School Choice Be a Tide That Lifts All Boats?” In The Economics of School Choice, ed. Caroline M. Hoxby, 287–341. Chicago: University of Chicago Press.
Krueger, Alan B., and Michael Lindahl. 2001. “Education for Growth: Why and For Whom?” Journal of Economic Literature 39 (4): 1101–36.
Krugman, Paul. 1996. Pop Internationalism. Cambridge, MA: MIT Press. Ladd, H. F. 2012. “Education and Poverty: Confronting the Evidence.” Journal of Policy
Analysis and Management 31 (2): 203-227. Loveless, Tom. 2011. The 2010 Brown Center Report on American Education: How Well Are
American Students Learning? Washington DC: Brookings Institution. Mourshed, Mona, Chinezi Chijioki, and Michael Barber. 2010. “How the Most Improved School
Systems in the World Keep Getting Better.” McKinsey and Company. National Academy of Sciences. 2007. Rising above the Gathering Storm: Energizing and
Employing America for a Brighter Economic Future. Washington, DC: National Academies Press.
———. 2010. Rising above the Gathering Storm, Revisited: Rapidly Approaching Category Five? Washington, DC: National Academies Press.
National Commission on Excellence in Education. 1983. A Nation at Risk: The Imperative for Educational Reform. Washington, DC: U.S. Department of Education.
Nelson, Richard F., and Edmund Phelps. 1966. “Investments in Humans, Technology Diffusion, and Economic Growth.” American Economic Review 56 (2): 69–75.

21
Organisation for Economic Co-operation and Development. 2010a. PISA 2009 Results, vol. 1, What Students Know and Can Do: Student Performance in Reading, Mathematics and Science. Paris: OECD.
———. 2010b. PISA 2009 at a Glance. Paris: OECD. ———. 2010c. Education Indicators at a Glance 2010. Paris: OECD. ———. 2011. Strong Performers and Successful Reformers in Education: Lessons from PISA
for the United States. Paris: OECD. Rockoff, Jonah E. 2004. “The Impact of Teachers on Student Achievement: Evidence from Panel
Data.” American Economic Review 94 (2): 247–52. Sala-i-Martin, Xavier. 2010. “The Economics behind the World Economic Forum’s Global
Competitiveness Index.” In Dimensions of Competitiveness, ed. Paul De Grauwe. Cambridge, MA: MIT Press.
Schuetz, Gabriela, Heinrich W. Ursprung, and Ludger Woessmann. 2008. “Education Policy and Equality of Opportunity.” Kyklos 61 (2): 279–308.
U.S. Department of Education. 2010. A Blueprint for Reform: Reauthorization of the Elementary and Secondary Education Act. Washington, DC: U.S. Department of Education, Office of Planning, Evaluation and Policy Development.
Wagner, Tony. 2008. The Global Achievement Gap: Why Even Our Best Schools Fail to Teach the New Survival Skills Our Children Need—And What We Can Do about It. New York: Basic Books.
West, Martin R., and Ludger Woessmann. 2010. “‘Every Catholic Child in a Catholic School’: Historical Resistance to State Schooling, Contemporary Private School Competition, and Student Achievement across Countries.” Economic Journal 120 (546): F229–55.
White House. 2009. “Remarks of President Barack Obama as Prepared for Delivery to Joint Session of Congress, February 24, 2009.” Available at http://www.whitehouse.gov/the_press_office/Remarks-of-President-Barack-Obama-Address-to-Joint-Session-of-Congress/.
———. 2011. “Remarks by the President on Education in Arlington, Virginia, March 14, 2011.” Available at http://www.whitehouse.gov/the-press-office/2011/03/14/remarks-president-education-arlington-virginia.
Wildavsky, Ben. 2008. The Great Brain Race: How Global Universities Are Reshaping the World. Princeton, NJ: Princeton University Press.
———. 2011. “Think Again: Education.” Foreign Policy, March/April. Woessmann, Ludger. 2003. “Central Exit Exams and Student Achievement: International
Evidence.” In No Child Left Behind? The Politics and Practice of School Accountability, ed. Paul E. Peterson and Martin R. West, 292–323. Washington, DC: Brookings Institution Press.
———. 2004. “How Equal Are Educational Opportunities? Family Background and Student Achievement in Europe and the United States.” CESifo Working Paper No. 1162. Ifo Institute, Center for Economic Studies, Munich, Germany.
———. 2010. “Cross-Country Evidence on Teacher Performance Pay.” Economics of Education Review 30 (3): 404–18.
Woessmann, Ludger, Elke Luedemann, Gabriela Schuetz, and Martin R. West. 2009. School Accountability, Autonomy, and Choice around the World. London: Edward Elgar.