edp results presentation 1q16
TRANSCRIPT

0

1
This document has been prepared by EDP - Energias de Portugal, S.A. (the "Company") solely for use at the presentation to be made on the 5th of May 2016 and its purpose is merely of informative nature and, as such, it may beamended and supplemented. By attending the meeting where this presentation is made, or by reading the presentation slides, you acknowledge and agree to be bound by the following limitations and restrictions. Therefore,this presentation may not be distributed to the press or to any other person in any jurisdiction, and may not be reproduced in any form, in whole or in part for any other purpose without the express and prior consent inwriting of the Company.
The information contained in this presentation has not been independently verified by any of the Company's advisors or auditors. No representation, warranty or undertaking, express or implied, is made as to, and no relianceshould be placed on, the fairness, accuracy, completeness or correctness of the information or the opinions contained herein. Neither the Company nor any of its affiliates, subsidiaries, directors, representatives, employeesand/or advisors shall have any liability whatsoever (in negligence or otherwise) for any loss howsoever arising from any use of this presentation or its contents or otherwise arising in connection with this presentation.
This presentation and all materials, documents and information used therein or distributed to investors in the context of this presentation do not constitute or form part of and should not be construed as, an offer (public orprivate) to sell or issue or the solicitation of an offer (public or private) to buy or acquire securities of the Company or any of its affiliates or subsidiaries in any jurisdiction or an inducement to enter into investment activity inany jurisdiction. Neither this presentation nor any materials, documents and information used therein or distributed to investors in the context of this presentation or any part thereof, nor the fact of its distribution, shall formthe basis of, or be relied on in connection with, any contract or commitment or investment decision whatsoever and may not be used in the future in connection with any offer (public or private) in relation to securities issuedby the Company. Any decision to purchase any securities in any offering should be made solely on the basis of the information to be contained in the relevant prospectus or final offering memorandum to be published in duecourse in relation to any such offering.
Neither this presentation nor any copy of it, nor the information contained herein, in whole or in part, may be taken or transmitted into, or distributed, directly or indirectly to the United States. Any failure to comply with thisrestriction may constitute a violation of U.S. securities laws. This presentation does not constitute and should not be construed as an offer to sell or the solicitation of an offer to buy securities in the United States. No securitiesof the Company have been registered under U.S. securities laws, and unless so registered may not be offered or sold except pursuant to an exemption from, or in a transaction not subject to, the registration requirements ofU.S. securities laws and applicable state securities laws.
This presentation is made to and directed only at persons (i) who are outside the United Kingdom, (ii) having professional experience in matters relating to investments who fall within the definition of "investmentprofessionals" in Article 19(5) of the Financial Services and Markets Act 2000 (Financial Promotions) Order 2005 (the "Order") or (iii) high net worth entities, and other persons to whom it may lawfully be communicated, fallingwithin Article 49(2)(a) to (d) of the Order (all such persons together being referred to as "Relevant Persons"). This presentation must not be acted or relied on by persons who are not Relevant Persons.
Matters discussed in this presentation may constitute forward-looking statements. Forward-looking statements are statements other than in respect of historical facts. The words “believe,” “expect,” “anticipate,” “intends,”“estimate,” “will,” “may”, "continue," “should” and similar expressions usually identify forward-looking statements. Forward-looking statements include statements regarding: objectives, goals, strategies, outlook and growthprospects; future plans, events or performance and potential for future growth; liquidity, capital resources and capital expenditures; economic outlook and industry trends; energy demand and supply; developments of theCompany’s markets; the impact of legal and regulatory initiatives; and the strength of the Company’s competitors. The forward-looking statements in this presentation are based upon various assumptions, many of which arebased, in turn, upon further assumptions, including without limitation, management’s examination of historical operating trends, data contained in the Company’s records and other data available from third parties. Althoughthe Company believes that these assumptions were reasonable when made, these assumptions are inherently subject to significant known and unknown risks, uncertainties, contingencies and other important factors which aredifficult or impossible to predict and are beyond its control. Important factors that may lead to significant differences between the actual results and the statements of expectations about future events or results include thecompany’s business strategy, financial strategy, national and international economic conditions, technology, legal and regulatory conditions, public service industry developments, hydrological conditions, cost of raw materials,financial market conditions, uncertainty of the results of future operations, plans, objectives, expectations and intentions, among others. Such risks, uncertainties, contingencies and other important factors could cause theactual results, performance or achievements of the Company or industry results to differ materially from those results expressed or implied in this presentation by such forward-looking statements.
The information, opinions and forward-looking statements contained in this presentation speak only as at the date of this presentation, and are subject to change without notice unless required by applicable law. The Companyand its respective directors, representatives, employees and/or advisors do not intend to, and expressly disclaim any duty, undertaking or obligation to, make or disseminate any supplement, amendment, update or revision toany of the information, opinions or forward-looking statements contained in this presentation to reflect any change in events, conditions or circumstances.

2
EBITDA +14% to €1,130mAdjusted EBITDA: +17% to €1,069m; adverse ForEx impact: -5% YoY
Iberian operations adjusted EBITDA +17% to €569mStrong hydro volumes in 1Q16 and good energy management results
Net Debt: €17.0bn -2% vs. Dec-15€0.5bn cash proceeds in Jan-16 from US wind deals (asset rotation + TEI)
Net Profit +11% to €263mAdjusted Net profit +28% to €287m
EDPR EBITDA +29% to €379m+15% on avg. installed capacity; Avg. load factor +4pp YoY
EDP Brasil EBITDA +43% to €185mIncluding -25% forex impact, end of GSF losses in hydro generation and consolidation of Pecém

3
Hydro production in Portugal: hydro resources 45% above the historical average in 1Q16
GSF in Brazil 12% below reference: no material financial impact due to low spot price (PLD) in 1Q16
Hydro Coefficient – Portugal (Deviation vs. average hydro year)
Wind Load Factor – EDPR(Load factors vs. average year)
EDP Hydro, Wind and Solar Production(TWh)
Hydro Deficit (1-GSF) - Brazil(Deviation vs. assured hydro contracted volumes)
5.86.4
4.0
6.7
1.6
1.6
1Q15
11.4
+39%
Wind &Solar
15.8
Hydro Brazil
1Q16
Hydro Iberia
1.1
% Chg. YoY
Production from new capacity
-12%-21%
45%
-26%
7%
-3%
1Q15 1Q16
1%
68%
30%
% of hydro & wind in mix
69% 76%

4(1) Fuel oil, thermal special regime (cogeneration, biomass), nuclear and solar (2) Full consolidation since May-15 of 720MW from Pecém I (contracted with a PPA), following full control of the plant backed by acquisition of 50% stake
Generation Breakdown by Technology(TWh)
Installed Capacity(GW)
Installed capacity +9% YoY: -0.2GW coal Spain, +0.4GW Hydro Portugal, +1.2GW wind, +0.7GW coal Brazil(2)
Power production +27% YoY due to rainy and windy weather conditions in Iberia in 1Q16
1Q15 1Q16
24.522.4
+9%
34%
36%
17%
33%
38%
15%
70% of capacity Hydro & Wind
12%13%
5.87.5
5.6
8.30.4
0.5
4.3
4.2
0.4
0.4
1Q15 1Q16
20.9
16.5
+27%
Coal
CCGT
Hydro
Wind
Other(1) 1%1%
Coal
CCGT
Hydro
Wind
Other (1)
-2%
-2%
+13%
+49%
30%
75% of production Hydro & Wind
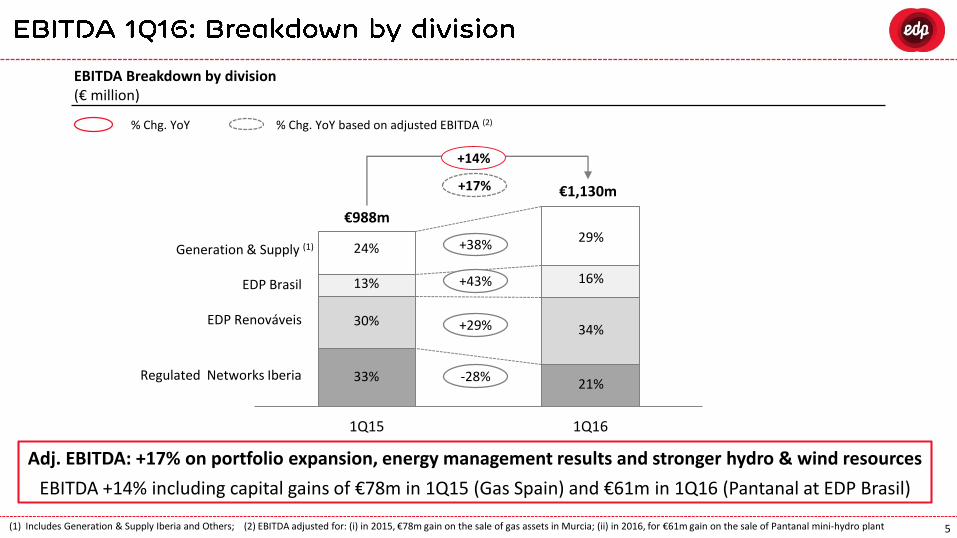
5(1) Includes Generation & Supply Iberia and Others; (2) EBITDA adjusted for: (i) in 2015, €78m gain on the sale of gas assets in Murcia; (ii) in 2016, for €61m gain on the sale of Pantanal mini-hydro plant
Adj. EBITDA: +17% on portfolio expansion, energy management results and stronger hydro & wind resources
EBITDA +14% including capital gains of €78m in 1Q15 (Gas Spain) and €61m in 1Q16 (Pantanal at EDP Brasil)
% Chg. YoY
Generation & Supply (1)
EBITDA Breakdown by division(€ million)
1Q15 1Q16
€988m
€1,130m
+14%
EDP Renováveis
EDP Brasil
Regulated Networks Iberia
16%
34%
21%
24%
33%
30%
13% +43%
+29%
-28%
+38%29%
% Chg. YoY based on adjusted EBITDA (2)
+17%
6
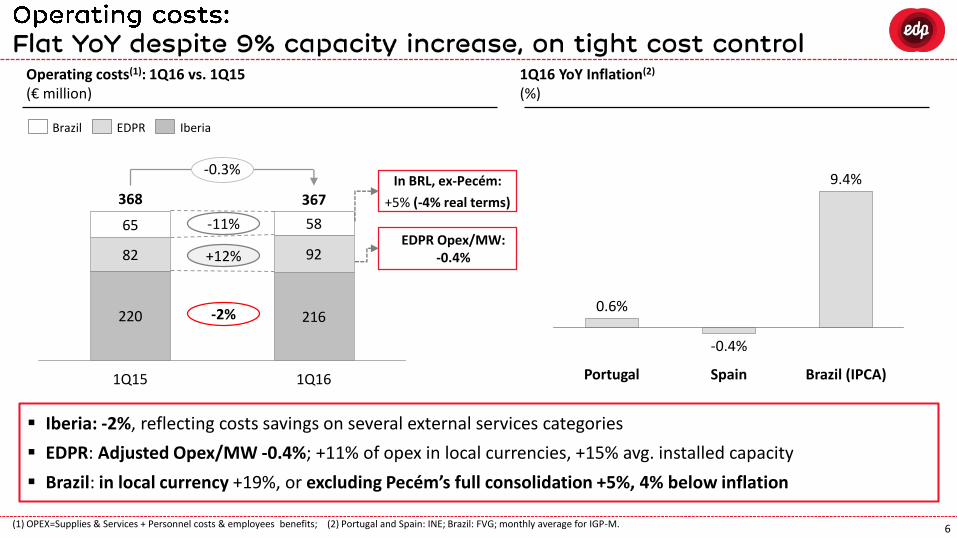
Operating costs(1): 1Q16 vs. 1Q15 (€ million)
(1) OPEX=Supplies & Services + Personnel costs & employees benefits; (2) Portugal and Spain: INE; Brazil: FVG; monthly average for IGP-M.
1Q16 YoY Inflation(2)
(%)
Iberia: -2%, reflecting costs savings on several external services categories
EDPR: Adjusted Opex/MW -0.4%; +11% of opex in local currencies, +15% avg. installed capacity
Brazil: in local currency +19%, or excluding Pecém’s full consolidation +5%, 4% below inflation
220 216
82 92
65 58
367
1Q15
368
1Q16
-0.3%
IberiaEDPRBrazil
-11%
+12%
-2%
Brazil (IPCA)
9.4%
Spain
0.6%
Portugal
-0.4%
In BRL, ex-Pecém:
+5% (-4% real terms)
EDPR Opex/MW: -0.4%


8
EDP PPA/CMEC Plants in Portugal: market deviation(1)
(€ million)
+85% hydro production replaces thermal production, particularly coal (-35%)
PPA/CMEC mkt deviation impacted by lower prices: hydro volume +45% vs. avg. year, lower coal production
EDP Liberalised Generation – Production(TWh)
(1) Diference between gross profit of power plants under CMECs assumptions and gross profit of power plants in the market
56
36
25
4
-5%
1Q16
61
1Q15
64
4
CoalAdjustment Hydro% Chg. YoY
5.78%
24%
62%
6%
1Q15
4.79%
44%
41%
7%
+20%
Coal
CCGT
Hydro
Nuclear
1Q16
0%
+85%
-35%
+13%

9
153 133
87
199
+38%
332
1Q15 1Q16
240
EBITDA Generation & Supply Iberia(€ million)
1Q16 marked by strong hydro resources and good energy management results
EBITDA Generation & Supply Iberia: +€91m YoY
Avg. generation cost -46% on higher hydro
contribution
Mini-hydro special regime: production +88% YoY
Delivery on new hydro capacity in Portugal:
+0.35GW in 1Q16(1); Shutdown of 0.2GW of coal
capacity in Spain (Soto 2)(1)
Transfer of 7 hydro plants in Portugal (627MW) to
merchant portfolio following the end of PPA
-13%
+128%
LT Contracted Generation
Liberalised activities

10
EBITDA - Regulated networks (€ million)
Adjusted EBITDA -2% reflects stable regulatory environments and weak demand in 1Q16
Electricity Portugal: Stable RoRAB at 6.38%; Electricity Spain: €7m positive one-off in 1Q15
Gas Iberia: €78m gain in 1Q15 on the sale of Gas Murcia, lower distributed gas volumes and other services in 1Q16
Adjusted EBITDA (1) - Regulated networks (€ million)
(1) 1Q15 excludes: i) €78m gain on the sale of gas assets in Murcia; ii) the €7m recovery of previous years’ regulated revenues in electricity distribution in Spain
1Q16
-28%
1Q15
234
324
Electricity PortugalGas Iberia Electricity Spain
234
1Q15
239
-2%
1Q16
Electricity PortugalElectricity SpainGas Iberia
-7%
-7%
0%
-62%
-25%
0%

11
North America: 10% capacity increase, strong wind resources (avg. load factor: +6pp) and -9% average selling price
Iberia: Full consolidation of assets from ENEOP since Sep-15; 1Q16 marked by strong average load factor and low power prices
EDPR Installed Capacity (GW)
EDPR EBITDA(€ million)
EDPR Wind Power Production(TWh)
8.1
47%
53%
+15%
1Q16
9.4
45%
55%
1Q15
+29%
1Q16
379
40%
60%
1Q15
295
39%
61%
North AmericaEurope and Brazil
+19%
+10%
26%+29%
33%+32%
30%
1Q16
7.5
49%
51%
1Q15
5.8
49%
51%

12(1) Adjustments: -R$278m one-off gain with the sale of Pantanal mini-hydro plant (2) Net of hedging
EDP Brasil EBITDA(BRL million)
EDP Brasil Adjusted(1) EBITDA(BRL million)
Capital Gains: +R$278m in 1Q16 from sale of Pantanal mini-hydro
Generation: 1Q16 includes R$201m from Pecém (full consolidation since May-15)
232
184 399
137
278
+96%
1Q16
814
1Q15
416
232137
184 399
1Q15
416
+29%
1Q16
536
DistributionGeneration & OtherDistributionGeneration & OtherCapital Gains
117%
-41%
Hydro Generation: +R$43m on end of GSF losses(2)
Distribution: -R$95m YoY on lower demand and costs with overcontracted volume at Bandeirante

13(1) Electricity distributed by EDP
Portugal: Electricity System Regulatory Receivables(€bn)
Slight increase of system receivables in 1Q16 on strong wind resources and low power prices
Wind Factor (1.0=avg.) 1.11 1.01
Demand(1) (YoY Chg.) -0.1% +1.1%
1.16
-1.8%
1.18
2.4 2.3 2.2 2.4
2.4 3.0 3.0 2.8
+€0.1bn
EDP
Other
1Q16
~5.3
2015
5.2
2014
5.3
2013
4.8
-0.3%
Special Regime Premium
(€/MWh)69 60 7066

14(1) Includes electricity and gas regulated activities in Portugal; (2) Includes new deviations generated, net of recoveries from deviations and past deficits
Portugal: +€184m YTD; +€278m from chg. in system debt attributable to EDP and -€94m from securitisations
Brazil: -€93m YTD; in BRL terms -R$417m YTD, on decline of energy costs and recovery of past deviations
EDP’s Regulatory Receivables(€ million)
70277 70
2.4202.315
Mar-16
2.568
+€91m
Spain
2.504
Dec-14 Dec-15
Brazil
Portugal (1) 2.236
187 170
2.477

15
Net expansion investments include €0.5bn Asset Rotation and TEI proceeds received in Jan-16
(1) EBITDA - Maintenance capex - Interest paid - Income taxes + Chg. in work. Capital excluding regulatory receivables; (2) Expansion capex, Net financial investments, TEI proceeds and Chg. in work. capital from equip. suppliers
Change in Net Debt: Mar-16 vs. Dec-15
(€ billion)
14.9
+0.1
Free CashFlow (1)
-0.3
-€0.4bn
Net DebtMar-16
Net DebtDec-15
14.4
2.6
ForEx
-0.1 17.0-0.1
Reg. Receivables & Securitiz.
17.4
2.5
Adj. Net Expansion Investments (2)
Regulatory Receivables
4.2x
3.6x
Net Debt/EBITDA
Adj. Net Debt/EBITDA
4.4x
3.8x

16
Financial Results: 1Q16 vs. 1Q15(€m)
46
37
(50)
Capitalized financial
costs
(18)
Capital gains
13
ForEx differ. &
derivatives
+€28m
1Q16
(180)
OtherNet Financial Interests
1Q15
(208)
Positive impact from decline of average cost of debt to 4.5% in 1Q16
Net interest costs: lower avg. cost of
debt (4.5% in 1Q16 vs. 4.7% in 1Q15)
and lower avg. net debt
ForEx: Negative impact in 1Q15 from
mark-to-market of EUR/USD
Capital gains: €11m in 1Q16 from sale
of stake in Tejo Energia
Lower capitalised financial costs:
following gradual commissioning of new
hydro plants in Portugal
Other: lower gains with tariff deficit
securitisation (-€26m YoY)

17(1) Adjustments in 1Q15: sale of Gas Murcia (€74m); adjustments in 1Q16: sale of Pantanal (€24m) and sale of Tejo Energia (€11m); and extraordinary energy tax in Portugal in both periods
(€ million) 1Q15 1Q16 ∆ % ∆ Abs.
EBITDA 988 1,130 +14% +141
Net Depreciations and
Provisions337 369 +9% +32
EBIT 651 760 +17% +109
Financial Results &
Associated Companies(210) (188) -10% +22
Income Taxes 82 152 +84% +69
Extraordinary Energy Tax
in Portugal61 59 -3% -2
Non-controlling interests 62 100 +62% +38
Net Profit 237 263 +11% +26 Adjusted net profit(1): +28% YoY from €224m in 1Q15 to
€287m in 1Q16
Increase of minorities at EDPR level and gain on sale of Pantanal at EDPB in 1Q16
Extraordinary energy tax: 0.85% on net fixed assets in Portugal (annual amount fully booked in 1Q)
Lower tax rate in 1Q15 due to Gas Murcia gain
Average cost of debt: -20bps to 4.5%
Increase of installed capacity: EDPR, Pecém, hydro Portugal

IR Contacts
Visit EDP Website
Site: www.edp.pt
Miguel Viana, Head of IR
Sónia Pimpão
João Machado
Maria João Matias
Sérgio Tavares
Noélia Rocha
E-mail: [email protected]
Phone: +351 210012834
Link Results & Presentations:
http://www.edp.pt/EDPI/Internet/EN/Group/Investors/Pu
blications/default.htm
Next Events
May 6th: Roadshow in London (JP Morgan)
May 9th: Roadshow in London (HSBC)
May 10th: Roadshow in Paris (Berenberg)
May 11th-13th: Roadshow in Boston/New York (Macquarie)
June 7th: 2016 Global Energy & Power Executive Conference in New York (RBC)
June 8th: Pan European Days in New York (Haitong)
June 8th-9th Energy Conference in London (Credit Suisse)
June 14th-15th: Utilities & Renewables Conference in London (BoAML)