edmonton-calgary corridor groundwater atlas - inf 140
DESCRIPTION
This groundwater-mapping atlas focuses on the Edmonton-Calgary Corridor (ECC) and examines fresh groundwater based on its geological, hydrological and hydrochemical properties. It will help Albertans better understand the province's groundwater resources by describing the groundwater-mapping processes used to map these resources, starting with a description of the physical and chemical properties of groundwater, and then providing details of the results of the mapping work.The atlas has the following sections:- introduction- bedrock geology,- surficial geology,- hydrology,- hydrogeology,- hydrochemistry, and- summary.Each section summarizes the work that AGS completed for the ECC groundwater-mapping project and provides a short summary of the methods used to create the various maps.TRANSCRIPT

5/11/2018 Edmonton-Calgary Corridor Groundwater Atlas - INF 140 - slidepdf.com
http://slidepdf.com/reader/full/edmonton-calgary-corridor-groundwater-atlas-inf-140 1/98

5/11/2018 Edmonton-Calgary Corridor Groundwater Atlas - INF 140 - slidepdf.com
http://slidepdf.com/reader/full/edmonton-calgary-corridor-groundwater-atlas-inf-140 2/98
ERCB/AGS Information Series 140 (September 2011) • i
©Her Majesty the Queen in Right of Alberta, 2011
ISBN 978-0-7785-8657-9
The Energy Resources Conservation Board/Alberta Geological Survey (ERCB/AGS), its employees and
contractors make no warranty, guarantee or representation, express or implied, or assume any legal liability
regarding the correctness, accuracy, completeness or reliability of this publication. Any references to proprietarysoftware and/or any use of proprietary data formats do not constitute endorsement by ERCB/AGS of any
manufacturer’s product.
If you use information from this publication in other publications or presentations, please acknowledge the
ERCB/AGS. We recommend the following reference format:
Barker, A.A., Riddell, J.T.F., Slattery, S.R., Andriashek, L.D., Moktan, H., Wallace, S., Lyster, S., Jean, G.,
Huff, G.F., Stewart, S.A. and Lemay, T.G., (2011): Edmonton–Calgary Corridor groundwater atlas; Energy
Resources Conservation Board, ERCB/AGS Information Series 140, 90 p.
Alberta Environment authors’ address:
A.A. Barker, H. Moktan and S. Wallace
Alberta Environment
9820 - 106 Street
Edmonton, AB T5K 2J6
Canada
Website: http://environment.alberta.ca/
Published September 2011 by:
Energy Resources Conservation Board
Alberta Geological Survey
4th Floor, Twin Atria Building
4999 – 98th Avenue
Edmonton, AB T6B 2X3
Canada
Tel: 780.422.1927
Fax: 780.422.1918
E-mail: [email protected]
Website: www.ags.gov.ab.ca

5/11/2018 Edmonton-Calgary Corridor Groundwater Atlas - INF 140 - slidepdf.com
http://slidepdf.com/reader/full/edmonton-calgary-corridor-groundwater-atlas-inf-140 3/98

5/11/2018 Edmonton-Calgary Corridor Groundwater Atlas - INF 140 - slidepdf.com
http://slidepdf.com/reader/full/edmonton-calgary-corridor-groundwater-atlas-inf-140 4/98
ERCB/AGS Information Series 140 (September 2011) • iii
Contents
Acknowledgements ..................................................................................................................................................................................................................v
1. Introduction ...........................................................................................................................................................................................................................1 Why We Map Groundwater .................................................................................................................................................................................................... .2
How the Atlas is Organized ......................................................................................................................................................................................................3
Study Area .................................................................................................................................................................................................................................3
ECC Land Use and Vegetation................................................................................................................................................................................................. 3
Physiography..............................................................................................................................................................................................................................7
Eastern Alberta Plains ..........................................................................................................................................................................................................9
Western Alberta Plains .........................................................................................................................................................................................................9
Southern Alberta Uplands .................................................................................................................................................................................................... 9
Rocky Mountain Foothills .................................................................................................................................................................................................... 9
Rocky Mountains .................................................................................................................................................................................................................. 9
Mapping Activities in the ECC ................................................................................................................................................................................................9
Geological Mapping..............................................................................................................................................................................................................9
Borehole Drilling .................................................................................................................................................................................................................11
Airborne Geophysical Surveying ........................................................................................................................................................................................11
Water-System Mapping ..........................................................................................................................................................................................................12
Data Sources ....................................................................................................................................................................................................................... 12
Mapping Where We Don’t Have Data ................................................................................................................................................................................... 13
2. Bedrock Geology ..............................................................................................................................................................................................................15 Why We Map Bedrock Geology .............................................................................................................................................................................................16
Regional Bedrock Geology ..................................................................................................................................................................................................... 16
Historical Context ................................................................................................................................................................................................................16
Composition of Bedrock Units ............................................................................................................................................................................................17
Bedrock Topography Mapping ..............................................................................................................................................................................................18
Why We Mapped Bedrock Topography ..............................................................................................................................................................................18
How Bedrock Topography Was Mapped .............................................................................................................................................................................18
What Bedrock Topography Shows Us .................................................................................................................................................................................18
Three-Dimensional Bedrock Model ...................................................................................................................................................................................... 21
3. Geology above Bedrock ................................................................................................................................................................................................23 RegionalSurcialGeologyandGeologyaboveBedrock ....................................................................................................................................................24
Recent Sediments................................................................................................................................................................................................................ 24
Quaternary Sediments ........................................................................................................................................................................................................ 26
Paleogene- to Neogene-Aged Sediments ............................................................................................................................................................................27
Sediment Thickness Mapping ................................................................................................................................................................................................27 Three-Dimensional Geological Model................................................................................................................................................................................... 27
4. Hydrology ............................................................................................................................................................................................................................31 What is Hydrology?.................................................................................................................................................................................................................32
The ECC’s Complex Hydrology .............................................................................................................................................................................................33
Alberta’s Precipitation and Evapotranspiration .................................................................................................................................................................. 33
Water Balance ..........................................................................................................................................................................................................................33
Annual Total Precipitation .................................................................................................................................................................................................. 34
Potential Evapotranspiration ...............................................................................................................................................................................................36
Actual Evapotranspiration .................................................................................................................................................................................................. 36
Total Surface Drainage ....................................................................................................................................................................................................... 36
Groundwater Recharge...........................................................................................................................................................................................................39
5. Hydrogeology .....................................................................................................................................................................................................................43 Hydrogeology Basics ...............................................................................................................................................................................................................44
Understanding the ECC’s Hydrogeology ............................................................................................................................................................................ 45 Hydrogeological Parameters .................................................................................................................................................................................................. 45
Well Density .............................................................................................................................................................................................................................47
Mapping the Water Table ....................................................................................................................................................................................................... 47
Groundwater Flow ..................................................................................................................................................................................................................49
Water-Level Surfaces .......................................................................................................................................................................................................... 51
Recharge and Discharge Areas ..............................................................................................................................................................................................53
Potential-Yield Mapping .........................................................................................................................................................................................................53
Groundwater Susceptibility ................................................................................................................................................................................................... 57
Aquifers in the ECC ................................................................................................................................................................................................................57
PotentialUnconnedAquifers........................................................................................................................................................................................... 59
PotentialConnedAquifersintheSedimentsaboveBedrock ..........................................................................................................................................62
PotentialBedrockAquifers.................................................................................................................................................................................................62
6. Hydrochemistry ................................................................................................................................................................................................................65 What is Hydrochemistry and Why Did We Study It? .........................................................................................................................................................66
Hydrochemical Mapping ........................................................................................................................................................................................................67
Hydrochemistry Maps ............................................................................................................................................................................................................68
Sediments above Bedrock ................................................................................................................................................................................................... 68
Paskapoo Formation ........................................................................................................................................................................................................... 73
Horseshoe Canyon Formation ............................................................................................................................................................................................. 74
Bearpaw Formation ............................................................................................................................................................................................................ 81
Belly River Group ...............................................................................................................................................................................................................82
7. Summary ..............................................................................................................................................................................................................................83 What We Mapped in the ECC................................................................................................................................................................................................84
How This Work Will Be Used ................................................................................................................................................................................................85
Where Do We Go from Here? ................................................................................................................................................................................................85
Glossary .....................................................................................................................................................................................................................................87
Endnotes ....................................................................................................................................................................................................................................90

5/11/2018 Edmonton-Calgary Corridor Groundwater Atlas - INF 140 - slidepdf.com
http://slidepdf.com/reader/full/edmonton-calgary-corridor-groundwater-atlas-inf-140 5/98
ERCB/AGS Information Series 140 (September 2011) • iv
Contents
FiguresFigure 1.1 Study area with green and white zones. ........................................................................................................................................................................3
Figure 1.2 Edmonton–Calgary Corridor study area with topography and major drainage basins ................................................................................................4
Figure 1.3 Natural regions of Alberta ............................................................................................................................................................................................5
Figure 1.4 Physiographic regions and sections...............................................................................................................................................................................8
Figure 1.5 Edmonton–Calgary Corridor borehole locations indicated by the red dots ............................................................................................................... 11
Figure 1.6 Data density and the relationship with uncertainty. .................................................................................................................................................... 13
Figure 2.1 Bedrock geology. ......................................................................................................................................................................................................... 19
Figure 2.2 Bedrock topography .................................................................................................................................................................................................... 20
Figure 2.3 Model of the bedrock geology..................................................................................................................................................................................... 21
Figure3.1 Surcialgeology ......................................................................................................................................................................................................... 25
Figure 3.2 Sediment thickness......................................................................................................................................................................................................28
Figure 3.3 Permeability of the sediments above bedrock ............................................................................................................................................................30
Figure 4.1 Hydrological cycle in the ECC....................................................................................................................................................................................32
Figure 4.2 Average annual total precipitation (1970–2000) ......................................................................................................................................................... 35
Figure 4.3 Average annual potential evapotranspiration (1970–2000) ........................................................................................................................................ 37
Figure 4.4 Average annual actual evapotranspiration (1970–2000) ............................................................................................................................................ 38
Figure 4.5 Hydrograph of the North Saskatchewan River in Edmonton (1967–1972) ................................................................................................................. 39
Figure 4.6 Average annual minimum base f low ..........................................................................................................................................................................40
Figure 4.7 Average annual maximum runoff ............................................................................................................................................................................... 41
Figure 4.8 Average annual minimum recharge ............................................................................................................................................................................42
Figure 5.1 Hydrogeological cycle in the ECC ..............................................................................................................................................................................44
Figure5.2 Cross-sectionthroughtheECCandtheaquiferpotentialofthebedrockformationsintheECC.............................................................................46
Figure5.3 ConceptualmodelofthesedimentsabovebedrockintheECCandtheaquiferpotentialofthosedifferentsediments...........................................46
Figure 5.4 Water-well density ....................................................................................................................................................................................................... 48
Figure 5.5 Water-table surface ......................................................................................................................................................................................................50
Figure 5.6 Two-dimensional schematic of a groundwater-flow system ......................................................................................................................................49
Figure 5.7 Potentiometric surface (for wells screened 30–40 metres below ground surface) .................................................................................................... 52
Figure 5.8 Vertical gradients (difference between 20–30 and 40–50 metres below ground surface .......................................................................................... 54Figure 5.9 Local recharge and discharge areas ............................................................................................................................................................................ 55
Figure 5.10 Regional recharge and discharge areas ....................................................................................................................................................................... 56
Figure 5.11 Potential groundwater yield ........................................................................................................................................................................................ 58
Figure 5.12 Schematic showing which part of the borehole or water-well lithological logs was used ......................................................................................... 59
Figure 5.13 Groundwater susceptibility ......................................................................................................................................................................................... 60
Figure 5.14 Geophysics and mapped coarse-grained materials near the land surface .................................................................................................................. 61
Figure5.15 LocationofburiedchannelcomplexesintheECCandtheoutlinesofthepotentialconnedaquifersassociatedwiththeburiedchannels.......... 62
Figure5.16 PotentialconnedaquifersfortheCookingLakemoraineasmappedfromlithologs .............................................................................................. 63
Figure 5.17 Sandiness of the Paskapoo Formation from 0–150 metres below ground surface ..................................................................................................... 64
Figure 6.1 Locations of wells completed in bedrock .................................................................................................................................................................... 69
Figure 6.2 Locations of wells completed in the sediments above bedrock .................................................................................................................................. 70
Figure 6.3 Total dissolved solids concentration in the sediments above bedrock ........................................................................................................................71
Figure 6.4 Hardness (as calcium carbonate) concentration in the sediments above bedrock ...................................................................................................... 72
Figure 6.5 Total dissolved solids concentration in the Paskapoo Formation ............................................................................................................................... 75
Figure 6.6 Hardness (as calcium carbonate) concentration in the Paskapoo Formation .............................................................................................................. 76Figure 6.7 Total dissolved solids concentration in the Horseshoe Canyon Formation (0–50 m bgs) ........................................................................................... 77
Figure 6.8 Hardness (as calcium carbonate) concentration in the Horseshoe Canyon Formation (0–50 m bgs) ......................................................................... 78
Figure 6.9 Total dissolved solids concentration in the Horseshoe Canyon Formation (50–100 m bgs) .......................................................................................79
Figure 6.10 Hardness (as calcium carbonate) concentration in the Horseshoe Canyon Formation (50–100 m bgs) .....................................................................80
Figure 6.11 Total dissolved solids concentration in the Bearpaw Formation ................................................................................................................................ 81
Figure 6.12 Hardness (as calcium carbonate) concentration in the Bearpaw Formation ............................................................................................................... 81
Figure 6.13 Total dissolved solids concentration in the Belly River Group ................................................................................................................................... 82
Figure 6.14 Hardness (as calcium carbonate) concentration in the Belly River Group ................................................................................................................. 82
TablesTable 2.1 Bedrock units in the ECC and their characteristics.................................................................................................................................................... 17
Table 5.1 The number of well records used to create water-level surfaces for each subsurface zone ....................................................................................... 51
Table 5.2 Description of the DRASTIC parameters. .................................................................................................................................................................. 57
Table 5.3 DRASTIC index values ..............................................................................................................................................................................................59

5/11/2018 Edmonton-Calgary Corridor Groundwater Atlas - INF 140 - slidepdf.com
http://slidepdf.com/reader/full/edmonton-calgary-corridor-groundwater-atlas-inf-140 6/98
ERCB/AGS Information Series 140 (September 2011) • v
Acknowledgements
In addition to the authors, we thank the following people who contributed to this summary of the
Edmonton–Calgary Corridor groundwater inventory:
• N.Atkinson,B.HathwayandM.Protzwhoprovidedthephotos;
• D.K.Chao,R.Elgr,K.Mckay,D.Magee,M.ProtzandE.J.Waterswhoassistedwithcreatingthefgures;
• L.Bentley,B.Chandler,C.R.Froese,M.Grobe,K.Parks,J.PentlandandR.Steinwhoprovidedthetechnicalreview;
• G.Hippolt-SquairandWordsmithAssociateswhoeditedthedocument;and
• M.Protzwhoprovidedthelayoutanddesktoppublishing.

5/11/2018 Edmonton-Calgary Corridor Groundwater Atlas - INF 140 - slidepdf.com
http://slidepdf.com/reader/full/edmonton-calgary-corridor-groundwater-atlas-inf-140 7/98

5/11/2018 Edmonton-Calgary Corridor Groundwater Atlas - INF 140 - slidepdf.com
http://slidepdf.com/reader/full/edmonton-calgary-corridor-groundwater-atlas-inf-140 8/98
ERCB/AGS Information Series 140 (September 2011) • 1
1. Introduction
Why We Map Groundwater
How the Atlas is Organized
Study Area
ECC Land Use and Vegetation
Physiography
Eastern Alberta Plains
Western Alberta Plains
Southern Alberta Uplands
Rocky Mountain Foothills
Rocky Mountains
Mapping Activities in the ECC
Geological Mapping
Borehole Drilling
Airborne Geophysical Surveying
Water-System Mapping
Data Sources
Mapping Where We Don't Have Data

5/11/2018 Edmonton-Calgary Corridor Groundwater Atlas - INF 140 - slidepdf.com
http://slidepdf.com/reader/full/edmonton-calgary-corridor-groundwater-atlas-inf-140 9/98
ERCB/AGS Information Series 140 (September 2011) • 2
1. Introduction
Why We Map Groundwater
WaterisoneofAlberta’smostimportantresources.Managingitrequires
high-qualityscienticinformation.ThisatlaswillhelpAlbertansbetter
understand the province’s groundwater resources by describing the
groundwater-mapping processes used to map these resources. It startswith descriptions of the study area, geology, and physical and chemical
properties of groundwater, and then provides details of the results of the
mapping work.
The Water for Life1 strategy outlines the Government of Alberta’s
commitment to managing water resources. Groundwater-resource
management aligns with each of the following Water for Life goals:
• safe, secure drinking water;
• healthy,aquaticecosystems;and
• reliable,qualitywatersuppliesforasustainableeconomy.
Groundwatermappingisidentiedinthe2009Water for Life Action Plan2
as a key act ion to improve knowledge about our groundwater resources.
This groundwater-mapping atlas focuses on the Edmonton–CalgaryCorridor (ECC) and examines fresh groundwater based on its geological,
hydrological and hydrochemical properties.
Why the Atlas Focuses on the ECC
The corridor between Edmonton and Calgary
• is a data-rich region of the province. As the most populated area
of Alberta, it has more water wells than any other part of Alberta.
The area also has many other sources of information on geology
and hydrogeology. As a result, the ECC is an excellent area to
study groundwater.
• has a very high demand for water. The ECC is experiencing rapid
urban and industrial growth, as well as ongoing agricultural
developmentandpossibleclimateshifts.Alloftheseinuenceshave
the potential to affect the area’s water resources. Therefore, thorough
planning is essential to ensure Albertans have enough groundwater in
the future.Alberta Geological Survey (AGS), which is part of the Energy Resources
Conservation Board, and Alberta Environment worked together to map
groundwater in the ECC and plan to do ongoing mapping work for the rest
of the province.
Understanding Alberta’s Changing Water Landscape
Most water users in the ECC rely on water in lakes, rivers, sloughs and
springs. But growing demand from urban, industrial and agr icultural
users is straining these surface-water sources. This means that the urban,
industrial and agricultural users will be turning more and more to
groundwater sources to meet their growing water needs. This will
affect current users of groundwater resources who have traditionally
been rural residents.
Groundwater mapping will tell us how much groundwater is available andwill show the shapes and locations of aquifers (sources of groundwater)
and aquitards (underground barriers to water movement). Information
aboutaquifersandaquitardsiscriticalwhenassessinghowtomeetnew
demands for groundwater.
Understandingaquifersandthegeologyaroundthemcan
• direct new water users to additional groundwater sources, giving
them the water they need and limiting depletion of any stressed
groundwater sources;
Red Deer River in the southeastern part of the Edmonton–Calgary Corridor. In the photo you can see a number of meander bends and a broad flood plain. The water is carrying
sediment giving it a murky look.

5/11/2018 Edmonton-Calgary Corridor Groundwater Atlas - INF 140 - slidepdf.com
http://slidepdf.com/reader/full/edmonton-calgary-corridor-groundwater-atlas-inf-140 10/98
ERCB/AGS Information Series 140 (September 2011) • 3
1. Introduction
• provideascienticbasisforprotectinggroundwatersourcesandareas
that replenish groundwater;
• helpuscreatemodelsforgroundwaterowinAlberta;
• support sustainable groundwater use; and
• help all levels of government make informed decisions aboutprotecting groundwater.
How the Atlas is Organized
To understand groundwater in an area as large as the ECC, we began by
studying the area’s geology (the history, structure and composition of the
Earth), then the hydrogeology (groundwater and its physical properties and
movements),andnally,welookedatthe hydrochemistry (the chemical
characteristics of groundwater).
To provide an overview of groundwater resources in the ECC, we
organized the atlas into the following sections:
• bedrock geology;
• surcial geology;
• hydrology;
• hydrogeology;
• hydrochemistry; and
• a summary.
Each section summarizes the work that AGS completed for the ECC
groundwater-mapping project and provides a short summary of the
methods used to create the various maps. Words highlighted with bold
italicsaredenedintheglossary.Themapsintheatlasarebasedon
available geological data. They give general information about the geology
in the ECC, as well as the hydrogeological and hydrochemical properties of
the ECC’s geological units. However, the atlas is not intended to be a
technical document. Readers who would like more technical publications
and maps about the ECC should visit the AGS website at
http://www.ags.gov.ab.ca/publications.
Study Area
The ECC is about 49 500 km2 in area and is roughly the size of NovaScotia (55 284 km2) (Figure 1.1). The ECC lies in portions of the North
Saskatchewan, Battle, Red Deer and Bow river basins (Figure 1.2). The
irregularly shaped boundary is the result of combining the shapes of 10
smaller drainage basins contained within the major river basins.
ECC Land Use and Vegetation
White Zone
The ECC is located mainly in Alberta’s white zone (Figure 1.1). The
Alberta Government’s Ministry of Sustainable Resource Development
uses the term white zone to describe land that is generally privately owned,
settled, populated and used for agriculture. Public land in the white zone is
managed by Sustainable Resource Development. These lands are generally
used for agricultural purposes, such as grazing.
Green Zone
Small portions of the ECC’s western edge are in the green zone, which is
Alberta’s forested land (Figure 1.1). Sustainable Resource Development
manages public land in the green zone for timber production, watershed
protection,wildlife,sheries,recreationandotheractivities.
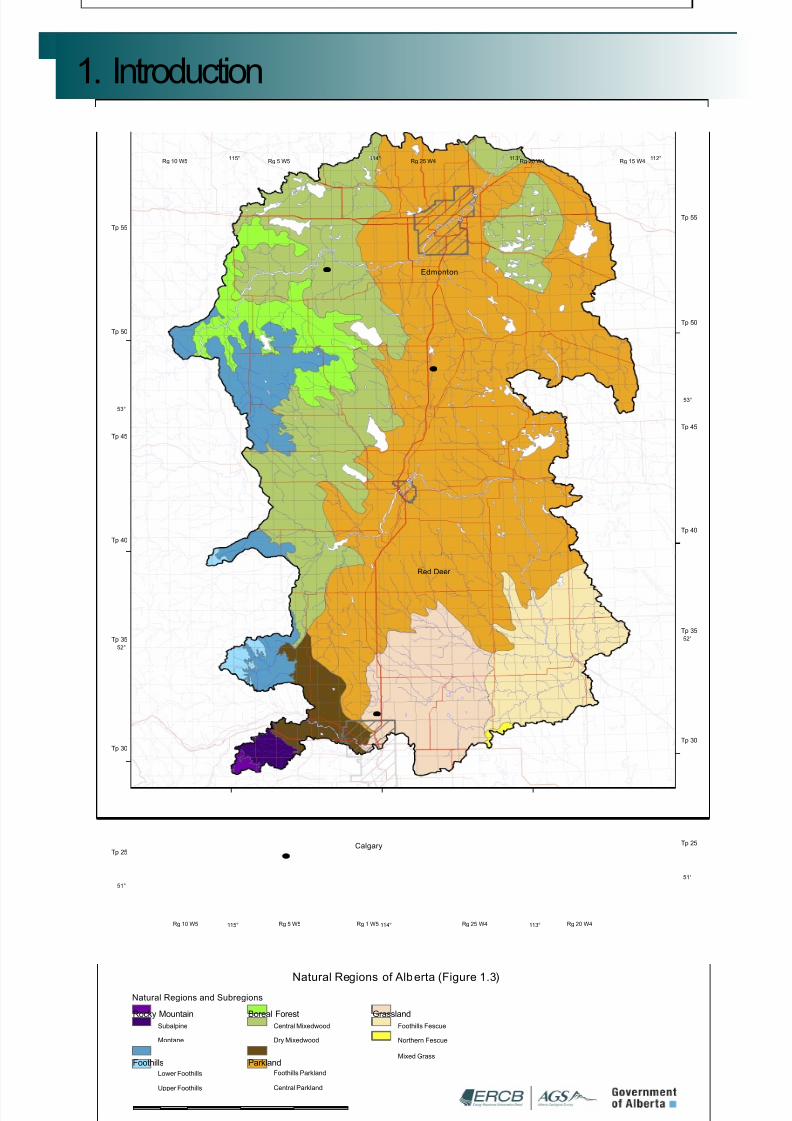
Alberta’s Natural Regions and Subregions
Landforms, soil type, vegetation and elevation are the main factors
inuencinglanduseinAlberta.SustainableResourceDevelopment
combined these factors to produce the Natural Regions and Subregions of
Albertamap.TheECClieswithinpartsofvenaturalregionsand
11 subregions (Figure 1.3).
!(
UV16
UV1
UV2
UV2
Edmonton
Red Deer
Calgary
0 25 50 75 10012.5km
Green Zone
White Zone
National Park
Elk IslandNational Park
Figure 1.1. Study area with green and white zones.

5/11/2018 Edmonton-Calgary Corridor Groundwater Atlas - INF 140 - slidepdf.com
http://slidepdf.com/reader/full/edmonton-calgary-corridor-groundwater-atlas-inf-140 11/98
ERCB/AGS Information Series 140 (September 2011) • 4
1. Introduction
UV16
UV1
UV2
UV2
Edmonton
Red Deer
Calgary
BaseData Provided by Spatial DataWarehouse Ltd.
Tp35
Tp40
Tp45
Tp50
Tp55
Tp25
Tp30
Tp25
Tp30
Tp35
Tp40
Tp45
Tp50
Tp55
115° 114° 113°
51°
52°
53°
115° 114° 113° 112°
53°
52°
51°
Rg 25 W4 Rg 20 W4Rg1W5Rg5W5Rg10W5
Rg15W4Rg20W4Rg25W4Rg5W5Rg10W5
0 25 50 75 10012.5km
Edmonton-Calgary Corridor Study Area with Topography and Major Drainage Basins (Figure 1.2)Ground Elevation (m asl)
901 - 1100
1101 - 1300
1301- 1500
1501- 2450
582 - 650
651 - 700
701 - 800
801 - 900
MajorBasin Boundaries
North Saskatchewan River Basin
Red Deer River Basin
Battle River Basin
Bow RiverBasin
5/11/2018 Edmonton-Calgary Corridor Groundwater Atlas - INF 140 - slidepdf.com
http://slidepdf.com/reader/full/edmonton-calgary-corridor-groundwater-atlas-inf-140 12/98
ERCB/AGS Information Series 140 (September 2011) • 5
1. Introduction
UV16
UV1
UV2
UV2
Edmonton
Red Deer
Calgary
Base Data Provided by Spatial Data Warehouse Ltd.
Tp 35
Tp 40
Tp 45
Tp 50
Tp 55
Tp 25
Tp 30
Tp 25
Tp 30
Tp 35
Tp 40
Tp 45
Tp 50
Tp 55
115° 114° 113°
51°
52°
53°
115° 114° 113° 112°
53°
52°
51°
Rg 25 W4 Rg 20 W4Rg 1 W5Rg 5 W5Rg 10 W5
Rg 15 W4Rg 20 W4Rg 25 W4Rg 5 W5Rg 10 W5
0 25 50 75 10012.5km
Natural Regions of Alberta (Figure 1.3)Natural Regions and Subregions
Rocky Mountain
Foothills
Boreal Forest
Parkland
Grassland
Subalpine
Montane
Lower Foothills
Upper Foothills
Central Mixedwood
Dry Mixedwood
Foothills Parkland
Central Parkland
Foothills Fescue
Northern Fescue
Mixed Grass

5/11/2018 Edmonton-Calgary Corridor Groundwater Atlas - INF 140 - slidepdf.com
http://slidepdf.com/reader/full/edmonton-calgary-corridor-groundwater-atlas-inf-140 13/98
ERCB/AGS Information Series 140 (September 2011) • 6
1. Introduction
The natural regions and subregions (the subregions are in parentheses)
are
• Rocky Mountain Natural Region (Subalpine and Montane);
• Foothills Natural Region (Lower Foothills and Upper Foothills);
• Boreal Forest Natural Region (Central Mixedwood and DryMixedwood);
• Parkland Natural Region (Foothills Parkland and Central Parkland);
and
• Grassland Natural Region (Foothills Fescue, Northern Fescue and
Mixedgrass).
Most of the ECC is within the Parkland and Boreal Forest natural
regions. A small part along the ECC’s western edge is within the
Foothills and Rocky Mountain natural regions. The south-central
and southeastern sections of the study area lie in the Grassland
Natural Region.
Vegetation
Geographic latitude and elevation affect the types of vegetation thatgrow in the ECC. The native vegetation in the southern portion of the
ECC consists mostly of grasses and shrubs. The main species include
porcupine grass, buckbrush, northern wheatgrass, western wheatgrass,
rose shrubs and mountain rough fescue.
The central and northeastern port ion of the ECC is extensively
cultivated. Where native vegetation exists, it consists generally of aspen
trees mixed with grasslands (plains rough fescue).
Land-surface elevation in the study area increases to the west, strongly
affecting the type of vegetation that grows along the ECC’s western
edge. Aspen stands with shrubby understories (growth beneath the
forest canopy), white spruce and jack pine dominate at lower elevations.
Alyssa Barker, Alberta Environment, Joanna Chan,
(Alberta Geological Survey summer student) and Tony
Lemay, Alberta Geological Survey, logging core for the
ECC borehole-drilling program. Rocks of the Horseshoe
Canyon Formation are being described. The Horseshoe
Canyon Formation contains many different rock types,
including sandstone, siltstone, mudstone and coal.This core in particular contained abundant finer
grained sandstone.
Satellite image of an example of the terrain in the green zone in the ECC west
of Calgary (black line indicates ECC boundary.) (Photo courtesy of the Alberta
Department of Transportation, acquisition 2008, resolution 2.5 m panchromatic,
originator Iunctus Geomatics.)
Pastureland in the white zone of the ECC. Much of the
landscape in the ECC is flat-lying, and the types of
sediment near the surface are good for growing crops
and forage.
Red Deer River cutting through the Paskapoo
Formation to form a steep-sided valley. Ski Hill Road,
Red Deer, Alberta.

5/11/2018 Edmonton-Calgary Corridor Groundwater Atlas - INF 140 - slidepdf.com
http://slidepdf.com/reader/full/edmonton-calgary-corridor-groundwater-atlas-inf-140 14/98
ERCB/AGS Information Series 140 (September 2011) • 7
1. Introduction
Evergreens (white spruce, black spruce, jack pine and tamarack) become more
abundant to the west and begin to dominate as the age of forest stands increases.
In the Foothills and Montane areas, the vegetation at lower elevations generally
consists of mixedwood forests (aspen, lodgepole pine and white spruce). At higher
elevations, mixed conifer-dominated forests (lodgepole pine, black and whitespruces,andDouglasr)grow.
Land Use
Agriculture and oil and gas activities dominate land use in the ECC. Coal mining
occurs in the northern and western parts. The western part of the ECC also has
forestry and recreational land uses.
Physiography
The ECC straddles the boundary between the Cordilleran and Interior Plains major
physiographic divisions of Canada3. The physiography of Alberta has been further
broken down from divisions to regions,4withtheECClyingwithinvemain
physiographic regions (Figure 1.4):
• Eastern Alberta Plains
• Western Alberta Plains
• Southern Alberta Uplands
• Rocky Mountain Foothills
• Rocky Mountains
These regions are subdivided into physiographic sections based on elevation
and morphological characteristics.4 The following sections describe each main
physiographic region and the physiographic sections that lie in each region.
Drill site near Wetaskiwin, Alberta. A water-well
rig completed all of the drilling for the ECC drilling
program. Alberta Environment and AGS staff
described all of the core on site and boxed the core for
additional examination and analysis.
Foothills physiographic region in the ECC. We can see some large, steep-sided hills
that are characteristic of a foothills region. Photo taken in the southwestern part of the ECC.
Tony Lemay and Gordon Jean, Alberta Geological
Survey, and Hira Moktan, Alberta Environment,
examining a bedrock outcrop.
Example of a Plains physiographic region in the
ECC. Plains regions have a gently rolling landscape
like what we see in this photo. Because of their flat-
lying landscape and the types of sediments near
the surface, the Plains physiographic regions are
commonly used for agricultural purposes, like growing
crops or forage.

5/11/2018 Edmonton-Calgary Corridor Groundwater Atlas - INF 140 - slidepdf.com
http://slidepdf.com/reader/full/edmonton-calgary-corridor-groundwater-atlas-inf-140 15/98
ERCB/AGS Information Series 140 (September 2011) • 8
1. Introduction
UV16
UV1
UV2
UV2
Edmonton
Red Deer
Calgary
OldsPlain
OldsPlain
Drayton Plain
Lodgepole Uplands
SullivanLakePlain
OldsPlain
Drumheller Uplands
EdmontonPlain
EdmontonPlain
BigRivers Plains
WesternBenchlands
BigRiversPlains
EdmontonPlain
Cooking LakeUplands
Cherhill Uplands
WesternBenchlands
Drumheller Uplands
BigRiversPlains
EdmontonPlain
Cherhill Uplands
S o u t h
e r n F o
o t h i l l s
O l d s P l a i n
C o o k i n
g L a k e U
p l a n d s
C e n t r
a l F o o t h i l l s
D r u m h e l l e r U
p l a n d s
D r u m h e
l l e r U p l a
n d s
S u l l i v a n L a k e
P
l a i n
E d m o n t o n
P l a i n
T a w a t i n a
w P l a i n
Cooking LakeUplands
LacLaBichePlain
BigstickLake Plain
Drumheller Uplands
FrontRanges
WesternBenchlands
Drayton Plain
TawatinawPlain
Cherhill Uplands
Lodgepole Uplands
Cooking LakeUplands
LacLaBichePlain
BaseData Provided by Spatial DataWarehouseLtd.
Tp35
Tp40
Tp45
Tp50
Tp55
Tp25
Tp30
Tp25
Tp30
Tp35
Tp40
Tp45
Tp50
Tp55
115° 114° 113°
51°
52°
53°
115° 114° 113° 112°
53°
52°
51°
Rg 25 W4 Rg 20 W4Rg1W5Rg5W5Rg10W5
Rg15W4Rg20W4Rg25W4Rg5W5Rg10W5
0 25 50 75 10012.5km
Physiographic Regions and Sections (Figure 1.4)Eastern Alberta Plains
Big Rivers Plains
Bigstick Lake Plain
Sullivan Lake Plain
Edmonton Plain
LacLa Biche Plain
Tawatinaw Plain
Cherhill Uplands
Cooking Lake Uplands
Drayton Plain
Olds Plain
Drumheller Uplands
Lodgepole Uplands
Western Benchlands
Central Foothills
Southern Foothills
FrontRanges
Western Alberta Plains
Southern Alberta Uplands
Rocky Mountain Foothills
Rocky Mountains

5/11/2018 Edmonton-Calgary Corridor Groundwater Atlas - INF 140 - slidepdf.com
http://slidepdf.com/reader/full/edmonton-calgary-corridor-groundwater-atlas-inf-140 16/98
ERCB/AGS Information Series 140 (September 2011) • 9
1. Introduction
Eastern Alberta Plains
The central and northeastern areas of the ECC are part of the Eastern
Alberta Plains. These plains cover a large area with a gently rolling
landscape dissected by steeply banked river valleys. Physiographic
sections in this region include
• Big Rivers Plains
• Sullivan Lake Plain
• Edmonton Plain
• Lac La Biche Plain
• Cherhill Uplands
• Cooking Lake Uplands
Western Alberta Plains
The western portion of the ECC lies in the Western Alberta Plains. Rolling
hills and steeply banked river valleys dominate these plains. Physiographic
sections of this region include
• Drayton Plain• Olds Plain
• Drumheller Uplands
• Lodgepole Uplands
Southern Alberta Uplands
The Southern Alberta Uplands region is represented in the ECC by the
Western Benchlands section. This section occurs along the western edge
of the ECC.
Rocky Mountain Foothills
Only the southwestern part of the ECC is in the Rocky Mountain Foothills
region, and that part overlaps with the Central and Southern foothills
sections. The Foothills are composed of large, steep-sided ridges and hills.
Rocky Mountains
Only the southwestern tip of the ECC is in the Rocky Mountains region,
west of Calgary. The region has ridged to steeply inclined topography inthe Front Ranges section. The elevation varies from 1200 to 3300 metres
above sea level (m asl).
Mapping Activities in the ECC
There has been a substantial amount of mapping work done in the
Edmonton–Calgary Corridor over the course of this project. We have
pulled together information on the climate, geology and water systems of
the study area. We have used new approaches to complete this mapping
work, and have improved our understanding in all of these areas. The
following subsections provide an introduction to our mapping work. Each
ofthesetopicsisreviewedindetailinsubsequentsectionsoftheatlas.
Geological Mapping
Geological mapping looks for the boundaries between formations, whichare the differences in the properties of sedimentat and below the land
surface,with the goal of understanding the processes that occurred to
deposit the types of sediment observed within a study area. The primary
geological mapping unit is the formation. Formations are bodies of
sedimentidentiedbytheirphysicalproperties(likearocktypeorthe
type of grains or minerals that make up a rock) and age. Understanding the
geology of an area lets us make better models of how the various types of
sediment occur in relation to one another in three dimensions.
Buildup of coarser grained materials (like sand, gravel and sandstone)
mayformpotentialaquifers,whereasbuildupofnergrainedsediment
(likeclay,siltandshale)mayformaquitards.Throughgeologicalmapping
and modelling, we can better understand the extent and characteristics
View of Wabamun Lake, Alberta, which is in the northeastern portion of the ECC. The photo was taken from Fallis point looking south, near Wabamun, Alberta.

5/11/2018 Edmonton-Calgary Corridor Groundwater Atlas - INF 140 - slidepdf.com
http://slidepdf.com/reader/full/edmonton-calgary-corridor-groundwater-atlas-inf-140 17/98
ERCB/AGS Information Series 140 (September 2011) • 10
1. Introduction
Borehole-drill bits for coring. The silver bit on the left has a diamond-impregnated
cutting surface for bedrock coring. The gold bit on the right is for coring
unconsolidated sediments above bedrock.
ofaquifersandaquitards.Wethenusethisinformationtodesignapproaches
forgroundwaterstudies,suchasgroundwater-explorationprograms,aquifer-
protection studies and groundwater- owmodellingexercises.
Weusedexistingdataandneweld-basedobservationstomapthegeologyof
the ECC. The existing data came from the following sources:• Alberta Environment’s Alberta Water Well Information Database;
• Alberta Research Council (now Alberta Innovates – Technology Futures);
and
• Energy Resources Conservation Board and Alberta Geological Survey.
Geological mapping that AGS has done in the area of the ECC to date includes
mapping the
• tops of the various bedrock formations;
• depth of the bedrock surface;
• thickness of sediment between the bedrock surface and the land surface;
and
• distribution of the types of sediments that occur at the surface.
These types of mapping activities can mainly be done by geologists at their
computerswithexistinginformation,combinedwitheldworktocheckthe
results of the mapping.
It is important to note that the sediment very close to the ground surface may
not be the same as the sediment at deeper depths between the ground surface
and the top of the bedrock surface. The geological processes responsible for
forming the ground-surface sediments generally only affect the very
near-surface sediments, leaving the sediments below unchanged from how
they were deposited.
Landon Woods (Alberta Geological Survey summer
student) and Hira Moktan, Alberta Environment,
sampling groundwater.
Joseph Riddell, Alberta Geological Survey, in the
Drumheller area studying the distribution of mud and
sandstone in the Horseshoe Canyon Formation.
Outcrop along the Red Deer River, near Red Deer,
Alberta.
5/11/2018 Edmonton-Calgary Corridor Groundwater Atlas - INF 140 - slidepdf.com
http://slidepdf.com/reader/full/edmonton-calgary-corridor-groundwater-atlas-inf-140 18/98
ERCB/AGS Information Series 140 (September 2011) • 11
1. Introduction
Thegeologicaleld-mappingprogramexaminedsurfacematerialsin
outcrops (rocks and sediment exposed at the surface) and gravel pits.
Theseeldactivitiesprovidedinformationonthegeologicalhistoryofthe
ECC, as well as on how landforms were created, and how materials were
deposited. The other data collection activities included a borehole-drilling
program and airborne- resistivitysurveys.Thegeologicaleldmappingand other data collection activities that the AGS did for this project helped
conrmthattheproductsofthecomputer-mappingexercisesareas
accurate as possible.
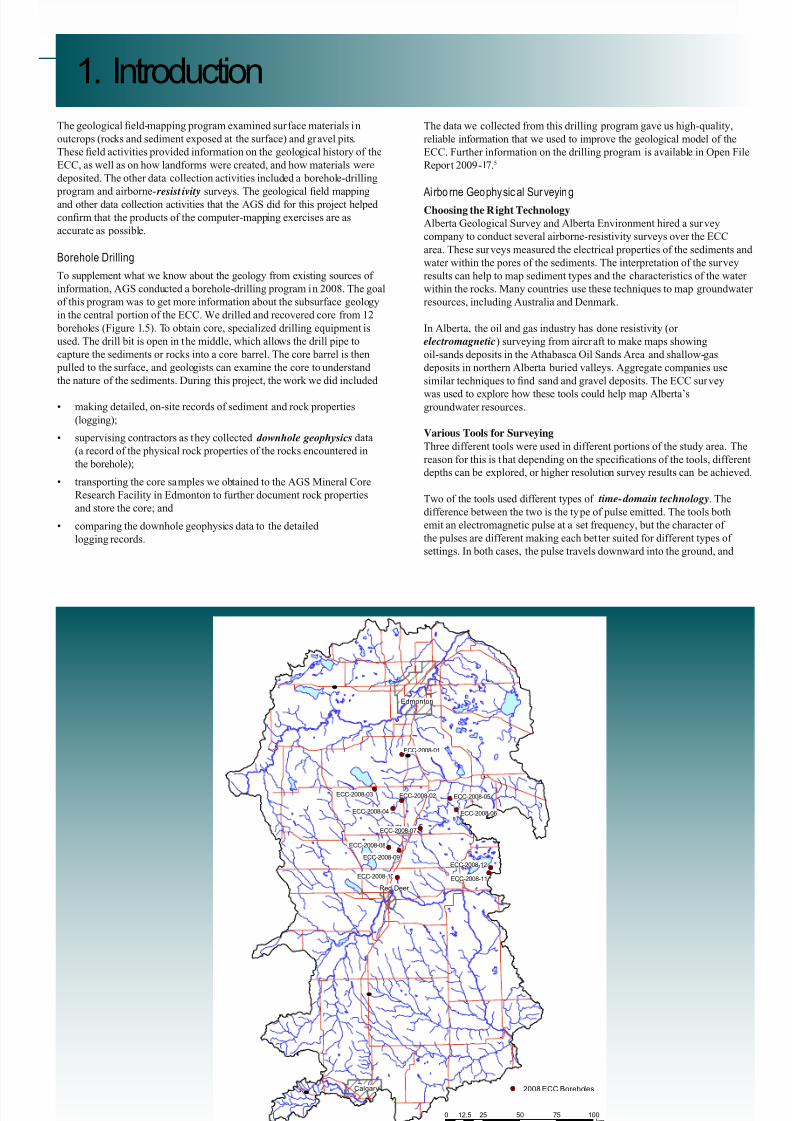
Borehole Drilling
To supplement what we know about the geology from existing sources of
information, AGS conducted a borehole-drilling program in 2008. The goal
of this program was to get more information about the subsurface geology
in the central portion of the ECC. We drilled and recovered core from 12
boreholes(Figure1.5).Toobtaincore,specializeddrillingequipmentis
used. The drill bit is open in the middle, which allows the drill pipe to
capture the sediments or rocks into a core barrel. The core barrel is then
pulled to the surface, and geologists can examine the core to understand
the nature of the sediments. During this project, the work we did included
• making detailed, on-site records of sediment and rock properties
(logging);
• supervising contractors as they collected downholegeophysics data
(a record of the physical rock properties of the rocks encountered in
the borehole);
• transporting the core samples we obtained to the AGS Mineral Core
Research Facility in Edmonton to further document rock properties
and store the core; and
• comparing the downhole geophysics data to the detailed
logging records.
Thedatawecollectedfromthisdrillingprogramgaveushigh-quality,
reliable information that we used to improve the geological model of the
ECC. Further information on the drilling program is available in Open File
Report 2009-17.5
Airborne Geophysical SurveyingChoosing the Right Technology
Alberta Geological Survey and Alberta Environment hired a survey
company to conduct several airborne-resistivity surveys over the ECC
area. These surveys measured the electrical properties of the sediments and
water within the pores of the sediments. The interpretation of the survey
results can help to map sediment types and the characteristics of the water
withintherocks.Manycountriesusethesetechniquestomapgroundwater
resources, including Australia and Denmark.
In Alberta, the oil and gas industry has done resistivity (or
electromagnetic) surveying from aircraft to make maps showing
oil-sands deposits in the Athabasca Oil Sands Area and shallow-gas
deposits in northern Alberta buried valleys. Aggregate companies use
similartechniquestondsandandgraveldeposits.TheECCsurvey
was used to explore how these tools could help map Alberta’sgroundwater resources.
Various Tools for Surveying
Three different tools were used in different portions of the study area. The
reasonforthisisthatdependingonthespecicationsofthetools,different
depths can be explored, or higher resolution survey results can be achieved.
Two of the tools used different types of time-domain technology. The
difference between the two is the type of pulse emitted. The tools both
emitanelectromagneticpulseatasetfrequency,butthecharacterof
the pulses are different making each bet ter suited for different types of
settings. In both cases, the pulse travels downward into the ground, and
!(
UV16
UV1
UV2
UV2
&=
&=
&=
&=
&= &=
&=
&=&=&=
&=
&=
Edmonton
Red Deer
Calgary
0 25 50 75 10012.5km
&= 2008 ECC Boreholes
ECC-2008-01
ECC-2008-04
ECC-2008-03 ECC-2008-02
ECC-2008-08
ECC-2008-09
ECC-2008-11
ECC-2008-12
ECC-2008-10
ECC-2008-06
ECC-2008-05
ECC-2008-07
Figure 1.5. Edmonton–Calgary Corridor borehole locations indicated by the red dots.

5/11/2018 Edmonton-Calgary Corridor Groundwater Atlas - INF 140 - slidepdf.com
http://slidepdf.com/reader/full/edmonton-calgary-corridor-groundwater-atlas-inf-140 19/98
ERCB/AGS Information Series 140 (September 2011) • 12
1. Introduction
Josh Bishop and Elizabeth Kravontka (Alberta
Geological Survey summer students) examining
core at a drill site. They are examining the size of
the grains in the samples. Important aspects to
consider when examining core include the type of
sediment encountered, its colour and the thickness
of the material.
the return signal from the ground is measured
by a tool towed behind the aircraft. The tool
records how long it took the signals to return.
Thesignalsmeasuredrstdeterminethe
properties of the upper sediments and water,
whereas the signals measured later determinethe properties of the deeper sediments and
water.
The third type of tool used in the study area
used frequency-domaintechnology. The
differencesinthefrequencyofthereturnpulse
are measured, and from that information, the
characteristics of the sediments and water at
differentdepthsisguredout.
In 2011, AGS will publish a series of
reports outlining the results of the airborne-
geophysical surveys.
Water-System Mapping
In our study of the ECC, we worked on
understanding all aspects of the way water
moves through the ECC. Using Government
of Canada and Government of Alberta climate
stations, we looked at the climate and how
much water enters the water system. We also
examinedhowmuchofthiswaterowsinto
rivers, streams, lakes and wetlands, and how
much evaporates or transpires. We examined
howwaterinltratestheground,howitmoves
through the subsurface and where it exits the
subsurface to discharge at the land surface
as how deep it is and how it was constructed.
Mapping water chemistry includes additional
scrutiny of well records. A chemical dataset, or
analysis, gives information about the chemical
composition of the groundwater at a particular
time, place and depth.
To ensure that the analyses were suitable
for mapping, we selected analyses based
on sample age, well-completion details,
completeness (full set of chemical parameters)
andanestimateofthequalityoftheanalysis.
We then matched each chemical analysis
within the ECC to the unit that the water
sample came from, based on the well location
and on the depth of the well’s completion.
In addition to using existing data, AGS
conductedaeldprogramtocollectwater
samples. During the summer of 2009, AGS
collected 39 water samples, which weanalyzed to understand the groundwater
chemistry of wells in the Paskapoo Formation,
unconsolidated sediments above bedrock
and springs in the ECC area. The focus of
this activity was to build upon the information
about the inorganicchemistryand processes
affecting water chemistry within the
sampling region.
as springs, or in r ivers, streams, lakes and
wetlands. We also examined how the chemistry
of groundwater changes across the ECC.
Data Sources
During the description of the water system
within the ECC, AGS made maps showing
details of various aspects of the water budget.
To do this, AGS assembled datasets on the
climate, surface water and groundwater. These
datasets came from several sources:
• Environment Canada’s climate stations;
• Alberta Environment’s stream-gauging
stations;
• Environment Canada’s stream-gauging
stations;
• Alberta Environment’s Alberta Water Well
Information Database;
• Alberta Research Council (now Alberta
Innovates – Technology Futures); and
• Energy Resources Conservation Board and
Alberta Geological Survey
Deciding Which Data to Use
The process of choosing which data to use
or exclude is a very important aspect in the
mapping process. In the case of a climate
station, we look at the length of time the station
has been collecting data and where that station
is located. When we are mapping aspects of
groundwaterow,welookatwelldetails,such
An airplane outfitted with the GEOTEM system to
perform airborne geophysical surveys for a portion of
central Alberta. Photo courtesy Fugro Data Solutions
(Canada) Inc.
Core samples from the borehole drilling program. The
light grey rocks (left) are from the Scollard Formation
and consist of mudstone, siltstone and fine-grained
sandstone. The dark grey rocks (right) are from the
Battle Formation and consist of mudstone. The dark
colour and rock type are typical of the Battle Formation.

5/11/2018 Edmonton-Calgary Corridor Groundwater Atlas - INF 140 - slidepdf.com
http://slidepdf.com/reader/full/edmonton-calgary-corridor-groundwater-atlas-inf-140 20/98
ERCB/AGS Information Series 140 (September 2011) • 13
1. Introduction
Information Developed Based on the Data
Usingtheclimate,streamow,groundwater
and chemical analyses data, AGS created maps
that describe the various aspects of the water
system in the ECC. We created maps showing
trendsinclimateinformation,streamow,groundwaterowandtheregionalqualityof
the groundwater in the ECC.
The groundwater maps focus on the
geological units in which the majority of well
owners completed their wells. Therefore,
the assessment provides an overview of
the shallower portion of the ECC. Alberta
Geological Survey will release the results of
this work in a series of reports in 2011.
Mapping Where We Don’t Have Data
Our environment is very complex. We continue
to improve our understanding of it throughinvestigations like measuring precipitation
andtemperature,drillingwellsandying
geophysical surveys, but there are often times
when we have to base our interpretations on
estimates of these values rather than on direct
observations.
For example, when we map the amount of
precipitation that falls over an area, we rely
on climate stations. These stations exist
throughout Alberta and provide detailed
information for the area near each station.
Based on this information, we can create maps
showing precipitation near the stations, as
well as between the stations using statistical
mappingtechniques.Theseestimates are
always better if we have a direct measurement,
such as from a climate station. Whereas we
have greater uncertainty for those locationsbetween data control points.
Consider the three examples below
(Figure 1.6). In case a), mapping a regularly
spaced, dense network of data points will
create a map with a low degree of uncertainty.
In case b), the data points are still regularly
spaced, but the distances between data points
are greater, yielding greater uncertainty in the
estimates for which there are no data points.
In case c), we have areas with clustered data
(shown in green), areas with more sparsely
distributed data points (shown in yellow) and
areas with no data points (shown in red).
Case c) is common in geological mappingwork. There is a low degree of uncertainty
if more data points exist, with an increasing
amount of uncertainty for areas with fewer
data points and high uncertainty for areas
without data points.
Giventhatseveraloftheguresandmapsof
the ECC rely on data points with a distribution
most like case c), it is important to consider the
data distribution and the associated degree of
certainty when drawing conclusions from any
map. q
Figure 1.6. Data density and the relationship with uncertainty.
Data collection begins with field notes.

5/11/2018 Edmonton-Calgary Corridor Groundwater Atlas - INF 140 - slidepdf.com
http://slidepdf.com/reader/full/edmonton-calgary-corridor-groundwater-atlas-inf-140 21/98

5/11/2018 Edmonton-Calgary Corridor Groundwater Atlas - INF 140 - slidepdf.com
http://slidepdf.com/reader/full/edmonton-calgary-corridor-groundwater-atlas-inf-140 22/98
ERCB/AGS Information Series 140 (September 2011) • 15
2. Bedrock Geology
Why We Map Bedrock Geology
Regional Bedrock Geology
Historical Context
Composition of Bedrock Units
Bedrock Topography Mapping
Why We Mapped Bedrock Topography
How Bedrock Topography Was Mapped
What Bedrock Topography Shows Us
Three-Dimensional Bedrock Model

5/11/2018 Edmonton-Calgary Corridor Groundwater Atlas - INF 140 - slidepdf.com
http://slidepdf.com/reader/full/edmonton-calgary-corridor-groundwater-atlas-inf-140 23/98
ERCB/AGS Information Series 140 (September 2011) • 16
2. Bedrock Geology
Why We Map Bedrock Geology
To understand groundwater resources and characteristics of an area, we
mustrstunderstandthearea.Thatisbecausegroundwatermovement
and chemistry below the ground, within the bedrock environment, are
determined by the physical and chemical characteristics, arrangement and
boundaries of bedrock formations.
Regional Bedrock Geology
Historical Context
The term bedrock refers to rocks, usually solid, that generally lie beneath
soil or other unconsolidated materials. Central Alberta’s bedrock formed
about80to50millionyearsago.Thisperiodwasheavilyinuencedby
mountain building (the LaramideOrogeny), which occurred along the
western edge of Alberta. During this time, rivers eroded and carried
sediments from the mountains and deposited them to the east in a
basin that thins toward the east. The sediments’ own weight and the
pressures exerted by the mountain-building forces caused the sediments
to consolidate (compact and solidify), so that, over time, the sediments
became the bedrock that lies under the ECC. The sediments that we’ve
includedinourstudyaremostlyclassiedasclasticsedimentaryrocks,
which means that they are composed of broken fragments of pre-existing
rocks or minerals that were eroded and car ried, likely by rivers, from their
places of origin.
Geologistsdenebedrockunitsbythetypeofsedimentstheyare
composed of and by the time period during which they were deposited.
The key bedrock units in our ECC study came from four time periods
during which coarse-grained sediments were deposited (represented by
rocks from the Belly River Group, Horseshoe Canyon, lower Scollard and
Paskapooformations)andfourtimeperiodsduringwhichnergrained
sediments were deposited (represented by the Lea Park, Bearpaw, Battle
and the upper Scollard formations).
The different types of rocks that make up the Horseshoe Canyon Formation give it a layered look. Photo taken near Drumheller, Alberta.
Joseph Riddell, Alberta Geological Survey, measuring the thickness of the layers of
rock in an exposure of the Horseshoe Canyon Formation near Drumheller, Alberta.

5/11/2018 Edmonton-Calgary Corridor Groundwater Atlas - INF 140 - slidepdf.com
http://slidepdf.com/reader/full/edmonton-calgary-corridor-groundwater-atlas-inf-140 24/98
ERCB/AGS Information Series 140 (September 2011) • 17
2. Bedrock Geology
Composition of Bedrock Units
The bedrock units in the ECC are sedimentary
rocks that are Cretaceous to Paleogene in
age. The Cretaceous Period began 145.5
million years ago and ended 65.5 million
years ago when the Paleogene Period began.The Paleogene Period ended 23 million years
ago. The end of a period is typically marked
byasignicantgeologicalevent,suchasthe
meteorite impact believed to have led to the
extinction of the dinosaurs. This particular
event happened 65.5 million years ago and
marked the end of the Cretaceous and the
beginning of the Paleogene.
Table 2.1 describes the various geological units
mapped and discussed in our ECC work, with
the youngest layer at the top.
Each of these bedrock units is in the ECC
to some extent. Removing the overlying,unconsolidated sediment would reveal where
each unit occurs at the bedrock surface
( subcrop location), as shown in Figure 2.1.
Looking at the map, it becomes obvious that
two of the formations are not shown. The
Battle Formation occurs below the Scollard
Formation and above the Horseshoe Canyon
Formation. It is relatively thin compared to the
other rock units; so at our map’s scale, it would
only show as a line the same thickness as the
line between the Scollard Formation and the
Horseshoe Canyon Formation. The Lea Park
Formation lies below the Belly River Group;
so it is not exposed at the subcrop surface in
the ECC.
Layer Name Period Dening Rocks and Traits
Paskapoo Formation Paleogene • non-marine,calcareous , cherty sandstone, siltstone
and mudstones
• generally a coarse-grained formation
Scollard Formation Cretaceous to
Paleogene
• non-marine feldspathic sandstone
• mudstone containing the clay mineral bentonite
• coalbeds
Battle Formation Cretaceous • bentonitic mudstone interbedded with consolidated
silica-rich, volcanic ash (siliceous tuff )
Horseshoe Canyon Formation Cretaceous • non-marine, feldspathic, clay-rich sandstone
• bentonitic mudstone
• carbonaceous shale
• scattered beds of ironstone, coal and limestone
Bearpaw Formation Cretaceous • marine shale and sandstone
Belly River Group Cretaceous • non-marine feldspathic sandstone
• clay-rich siltstone and mudstone
Lea Park Formation Cretaceous • marine shale
Alberta Geological Survey field party examines an
outcrop of the Horseshoe Canyon Formation. In the
photo we can see a thick layer of bentonite near
the centre of the photo (yellow-grey material in the
exposure face).
Steven Lyster, Alberta Geological Survey, at a Paskapoo
Formation outcrop at Fallis point near Wabamun,
Alberta. This occurrence of the Paskapoo Formation
marks the easternmost occurrence of the formation in
the northern portion of the ECC.
Ben Hathway, Alberta Geological Survey, measuring a
section in the Horseshoe Canyon Formation along the
Red Deer River.
Table 2.1. Bedrock uni ts in the ECC and their characteristi cs.

5/11/2018 Edmonton-Calgary Corridor Groundwater Atlas - INF 140 - slidepdf.com
http://slidepdf.com/reader/full/edmonton-calgary-corridor-groundwater-atlas-inf-140 25/98
ERCB/AGS Information Series 140 (September 2011) • 18
2. Bedrock Geology
Bedrock Topography Mapping
Why We Mapped Bedrock Topography
We mapped the top of the bedrock surface
for the ECC because it forms an important
boundary for both the geological andgroundwater models. In the geological model,
the bedrock surface is the boundary between
consolidated sediments (which form the
bedrock) and unconsolidated sediments (which
lie on top of the bedrock). In the groundwater
model,thissurfacecandenetheboundary
betweendifferentgroundwater-owpatterns.
Severalfactorshavesignicantlyalteredthe
bedrock topography from its original state:
• chemical and physical erosion (including
erosion during the advance and melting of
glaciers during the most recent glaciation);
• structural changes from tectonic
movement; and
• adjustment of the Earth’s crust after the
appearance or disappearance of glacier
ice sheets and the erosion of sediments
(isostaticrebound ).
Physical erosion is caused mostly by river
systems moving across the landscape, but
glaciersalsosignicantlyerodedthebedrock
surface. Physical erosion is generally the most
obvious change to the landscape, especially in
river valleys.
How Bedrock Topography Was Mapped
We mapped the bedrock topography using data
fromwaterwells,testholesandeld-based
geological observations. We collected these
data as a ser ies of points with information
about location and elevation of the bedrock top.
To produce the bedrock topographic surface,
we modelled the elevations (Figure 2.2) using
a mathematical process called geostatistics,
which applies statistical analysis to the
geological data to map it. Alberta Geological
Survey recently published details of this work
in Open File Report 2010-12.6
What Bedrock Topography Shows Us
The modelled bedrock surface shows us
a variable underground topography that
generallyreectsthepresent-daysurface
topography. The morphological elements(distinctive landforms, rock structure and
history) of the bedrock topography are grouped
into four elements:
1. highlands;
2. uplands;
3. lowlands; and
4. channel complexes.
The distinguishing features for each element
are the shape and elevation of the landforms in
the area.
The highlands and uplands most closely mirror
the present-day land surface and exist in thewestern part of the ECC.
The lowlands generally have a gently rolling
bedrock surface, but the present-day ground
surface is more uneven because of the buildup
of sediment on top of the bedrock surface.
The bedrock topography shows three channel
complexes or paleochannel complexes. This
means that they are remnants of ancient river
channels cut into the bedrock, later buried by
younger sediments. In some areas, present-
day rivers have eroded into the paleochannels,
but other channels remain buried. The three
paleochannel complexes are in the north of the ECC (Beverly-Onoway complex), the
central part (Red Deer River complex) and the
southeast corner (Drumheller complex).
Measuring the thickness of the types of rock material
in a core sample. Once a core sample is brought to
the surface, the types of sediment or rock material are
described, including the thicknesses, their colour and
any other important observations that may identify the
formation, and the environment in which the materials
were deposited.
Till overlying sandstone of the Paskapoo Formation. The
till is grey-brown and the sandstone is olive-brown with
some rusty brown. The pick handle is used for scale.
Coal within the Scollard Formation near Ardley,
Alberta. Coal accumulations vary in thickness and
can be several metres thick.

5/11/2018 Edmonton-Calgary Corridor Groundwater Atlas - INF 140 - slidepdf.com
http://slidepdf.com/reader/full/edmonton-calgary-corridor-groundwater-atlas-inf-140 26/98
ERCB/AGS Information Series 140 (September 2011) • 19
2. Bedrock Geology
UV16
UV1
UV2
UV2
Edmonton
Red Deer
Calgary
BaseData Provided by Spatial DataWarehouseLtd.
Tp35
Tp40
Tp45
Tp50
Tp55
Tp25
Tp30
Tp25
Tp30
Tp35
Tp40
Tp45
Tp50
Tp55
115° 114° 113°
51°
52°
53°
115° 114° 113° 112°
53°
52°
51°
Rg 25 W4 Rg 20 W4Rg1W5Rg5W5Rg10W5
Rg15W4Rg20W4Rg25W4Rg5W5Rg10W5
0 25 50 75 10012.5km
Bedrock Geology (Figure 2.1)Geological Formations
Bearpaw Formation
Belly RiverFormation
Horseshoe Canyon Formation
Paskapoo Formation
Scollard Formation
Bedrockin deformed zone

5/11/2018 Edmonton-Calgary Corridor Groundwater Atlas - INF 140 - slidepdf.com
http://slidepdf.com/reader/full/edmonton-calgary-corridor-groundwater-atlas-inf-140 27/98
ERCB/AGS Information Series 140 (September 2011) • 20
2. Bedrock Geology
UV16
UV1
UV2
UV2
Edmonton
Red Deer
Calgary
Base Data Providedby SpatialDataWarehouse Ltd.
Tp35
Tp40
Tp45
Tp50
Tp55
Tp25
Tp30
Tp25
Tp30
Tp35
Tp40
Tp45
Tp50
Tp55
115° 114° 113°
51°
52°
53°
115° 114° 113° 112°
53°
52°
51°
Rg 25 W4 Rg 20 W4Rg1W5Rg5W5Rg10W5
Rg15W4Rg20W4Rg25W4Rg5W5Rg10W5
0 25 50 75 10012.5km
Bedrock Topography (Figure 2.2)
568 - 625
625 - 650
650 - 675
675 - 700
700 - 750
750 - 800
800 - 850
850 - 900
900 - 950
950 - 1000
1000 - 1100
1100 - 1200
1200- 1300
1300- 1400
1400- 1500
1500- 2348
Elevation (metres above sea level)

5/11/2018 Edmonton-Calgary Corridor Groundwater Atlas - INF 140 - slidepdf.com
http://slidepdf.com/reader/full/edmonton-calgary-corridor-groundwater-atlas-inf-140 28/98
ERCB/AGS Information Series 140 (September 2011) • 21
2. Bedrock Geology
Three-Dimensional Bedrock Model
Alberta Geological Survey geologists built a three-dimensional model
of the bedrock geology to show the arrangement of the bedrock units in
relation to one another. This arrangement helps us understand groundwater
movement. We built the bedrock model for the ECC using the top surfacesof the Paskapoo, Scollard, Battle, Horseshoe Canyon, Bearpaw and Lea Park
formations, and the Belly River Group.
We modelled the bedrock surfaces for each bedrock unit using subsurface
data from water wells, geotechnical borehole logs, and oil and gas logs.
Alberta Geological Survey geologists examined these data sources to
determine the tops of the bedrock units and then geostatistically modelled
them to produce the surfaces for each unit. Figure 2.3 represents the
three-dimensional bedrock model.
Figure 2.3. Model of the bedrock geology.
Outcrop of the Paskapoo Formation. The nesting sites point out important differences
between the sandstone types at this exposure of the Paskapoo Formation. In the upper
part of the exposure, you can see that the nesting sites are in the rock itself (blue
rectangle), whereas the nesting sites in the lower part of the exposure (red rectangle)
are built on the rock face. The rock in the upper part is also much more eroded than
the rock in the lower part. These two pieces of information indicate that the rock in
the upper part is softer than the lower part, likely related to the degree of cementation
in the rock. Uncemented sandstone saturated with water forms desirable aquifers.
Understanding the subsurface distribution of these rocks is, therefore, important in a
groundwater study.
q

5/11/2018 Edmonton-Calgary Corridor Groundwater Atlas - INF 140 - slidepdf.com
http://slidepdf.com/reader/full/edmonton-calgary-corridor-groundwater-atlas-inf-140 29/98

5/11/2018 Edmonton-Calgary Corridor Groundwater Atlas - INF 140 - slidepdf.com
http://slidepdf.com/reader/full/edmonton-calgary-corridor-groundwater-atlas-inf-140 30/98
ERCB/AGS Information Series 140 (September 2011) • 23
3. Geology above Bedrock
Regional Surcial Geology and Geology above Bedrock
Recent Sediments
Quaternary Sediments
Paleogene- to Neogene-Aged Sediments
Sediment Thickness Mapping
Three-Dimensional Geological Model

5/11/2018 Edmonton-Calgary Corridor Groundwater Atlas - INF 140 - slidepdf.com
http://slidepdf.com/reader/full/edmonton-calgary-corridor-groundwater-atlas-inf-140 31/98
ERCB/AGS Information Series 140 (September 2011) • 24
3. Geology above Bedrock
Gravel pit in central Alberta. Depending on the types of rock material in this gravel deposit, and the conclusions on how this gravel accumulation was deposited, this gravel deposit may
have been laid down prior to the last glaciation in Alberta.
Alyssa Barker, Alberta Environment, measuring the thickness of gravel over bedrock
in the central part of the ECC. The tip of the measuring stick is pointing at the bedrock
overlain by gravel. In addition to looking at the gravel thickness, field parties will look at
the types and shapes of rock materials that make up the gravel and the patterns these
rock materials may make to understand how the gravel was deposited and from where
it came. When saturated with water, thick gravel and sand deposits can form desirable
aquifers, so mapping their occurrence is an important task.
Regional Surcial Geology and Geology above Bedrock
In the ECC, sediments lying above the bedrock surface vary in thickness and
age.Mostsedimentsatgroundsurface(surcialsediments)weredeposited
sometime during the Quaternary (this period began 2.6 million years ago
andended10000yearsago).Aminorpercentageofsurcialsedimentswere
deposited sometime during the Paleogene (this period began 36 million yearsago and ended 5 million years ago) or were deposited less than 10 000 years
ago.AlbertaGeologicalSurveypreviouslymappedthesurcialgeologyof
most of Alberta, including the central and southern portions of the province at
various scales.7, 8, 9
Figure 3.1 shows a compilation of these different mapping activities within
the ECC. During the ECC program, AGS added to the understanding of these
sediments by describing the sediments from the ground surface to the top of
the bedrock surface. This section describes these sediments’ grain size and
howgrainsizeisrelatedtogroundwaterow.
Recent Sediments
Recent sediments are less than 10 000 years old and were deposited after the
most recent glacial event in Alberta ended. Eolian (wind), lacustrine (lake), uvial (river) and slope-movement processes reworked glacial and bedrock
materials and deposited or redeposited these sediments.
Eolian Deposits
Eoliandepositsconsistofne-tomedium-grainedsandandsiltthatform
elongated or curve-shaped dunes. Figure 3.1 shows many eolian deposits.
Lacustrine Sediments
Lacustrine sediments exist mainly in areas that had proglacial lakes, but also
include recent lake sediments. Lacustrine deposits are generally composed of
sand,siltandclay.Theyformattogentlyundulatingtopography. Figure3.1
shows many areas with lacustrine deposits.

5/11/2018 Edmonton-Calgary Corridor Groundwater Atlas - INF 140 - slidepdf.com
http://slidepdf.com/reader/full/edmonton-calgary-corridor-groundwater-atlas-inf-140 32/98
ERCB/AGS Information Series 140 (September 2011) • 25
3. Geology Above Bedrock
3. Geology above Bedrock
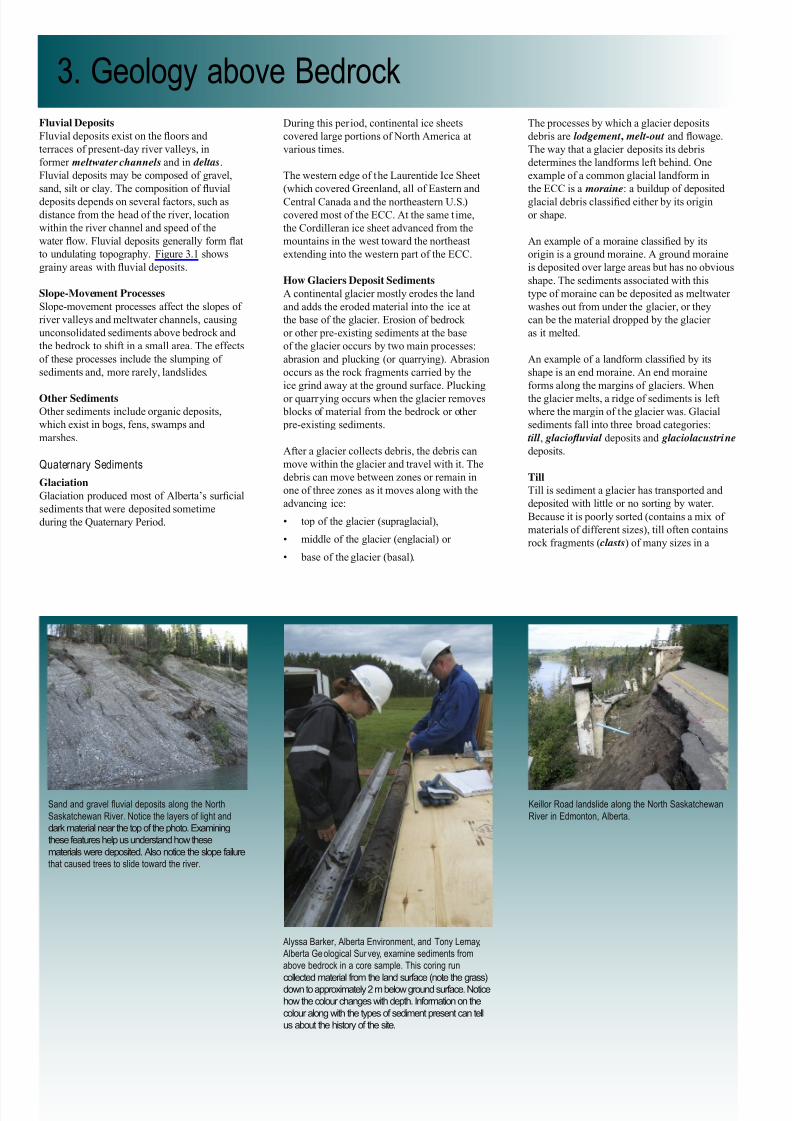
5/11/2018 Edmonton-Calgary Corridor Groundwater Atlas - INF 140 - slidepdf.com
http://slidepdf.com/reader/full/edmonton-calgary-corridor-groundwater-atlas-inf-140 33/98
ERCB/AGS Information Series 140 (September 2011) • 26
3. Geology above Bedrock
Keillor Road landslide along the North Saskatchewan
River in Edmonton, Alberta.
Alyssa Barker, Alberta Environment, and Tony Lemay,
Alberta Geological Survey, examine sediments from
above bedrock in a core sample. This coring run
collected material from the land surface (note the grass)down to approximately 2 m below ground surface. Notice
how the colour changes with depth. Information on the
colour along with the types of sediment present can tell
us about the history of the site.
Sand and gravel fluvial deposits along the North
Saskatchewan River. Notice the layers of light and
dark material near the top of the photo. Examining
these features help us understand how these
materials were deposited. Also notice the slope failure
that caused trees to slide toward the river.
The processes by which a glacier deposits
debris are lodgement, melt-out andowage.
The way that a glacier deposits its debris
determines the landforms left behind. One
example of a common glacial landform in
the ECC is a moraine: a buildup of deposited
glacialdebrisclassiedeitherbyitsorigin
or shape.
Anexampleofamoraineclassiedbyits
origin is a ground moraine. A ground moraine
is deposited over large areas but has no obvious
shape. The sediments associated with this
type of moraine can be deposited as meltwater
washes out from under the glacier, or they
can be the material dropped by the glacier
as it melted.
Anexampleofalandformclassiedbyits
shape is an end moraine. An end moraine
forms along the margins of glaciers. When
the glacier melts, a ridge of sediments is left
where the margin of the glacier was. Glacial
sediments fall into three broad categories:
till , glaciouvial deposits and glaciolacustrine
deposits.
Till
Till is sediment a glacier has transported and
deposited with little or no sorting by water.
Because it is poorly sorted (contains a mix of
materials of different sizes), till often contains
rock fragments ( clasts) of many sizes in a
Fluvial Deposits
Fluvialdepositsexistontheoorsand
terraces of present-day river valleys, in
former meltwaterchannels and in deltas.
Fluvial deposits may be composed of gravel,
sand,siltorclay.Thecompositionofuvial
deposits depends on several factors, such as
distance from the head of the river, location
within the river channel and speed of the
waterow.Fluvialdepositsgenerallyformat
to undulating topography. Figure 3.1 shows
grainyareaswithuvialdeposits.
Slope-Movement Processes
Slope-movement processes affect the slopes of
river valleys and meltwater channels, causing
unconsolidated sediments above bedrock and
the bedrock to shift in a small area. The effects
of these processes include the slumping of
sediments and, more rarely, landslides.
Other Sediments
Other sediments include organic deposits,
which exist in bogs, fens, swamps and
marshes.
Quaternary Sediments
Glaciation
GlaciationproducedmostofAlberta’ssurcial
sediments that were deposited sometime
during the Quaternary Period.
During this period, continental ice sheets
covered large portions of North America at
various times.
The western edge of the Laurentide Ice Sheet
(which covered Greenland, all of Eastern and
Central Canada and the northeastern U.S.)
covered most of the ECC. At the same t ime,
the Cordilleran ice sheet advanced from the
mountains in the west toward the northeast
extending into the western part of the ECC.
How Glaciers Deposit Sediments
A continental glacier mostly erodes the land
and adds the eroded material into the ice at
the base of the glacier. Erosion of bedrock
or other pre-existing sediments at the base
of the glacier occurs by two main processes:
abrasionandplucking(orquarrying).Abrasion
occurs as the rock fragments carried by the
ice grind away at the ground surface. Plucking
orquarryingoccurswhentheglacierremoves
blocks of material from the bedrock or other
pre-existing sediments.
After a glacier collects debris, the debris can
move within the glacier and travel with it. The
debris can move between zones or remain in
one of three zones as it moves along with the
advancing ice:
• top of the glacier (supraglacial),
• middle of the glacier (englacial) or
• base of the glacier (basal).

5/11/2018 Edmonton-Calgary Corridor Groundwater Atlas - INF 140 - slidepdf.com
http://slidepdf.com/reader/full/edmonton-calgary-corridor-groundwater-atlas-inf-140 34/98
ERCB/AGS Information Series 140 (September 2011) • 27
3. Geology above Bedrock
Contact between bedrock and sediments above
bedrock exposed along a stream. The bedrock can be
identified by its rusty-orange colour in places and the
horizontal layers of darker and lighter rock material.
The sediments above bedrock are light grey-brown
and do not have any noticeable layering.
Gordon Jean, Alberta Geological Survey, documenting
fluvial sediments along the North Saskatchewan River
near Edmonton. The sand he is pointing at shows the
presence of bedding. Above the sand is gravel.
Abhijit Mukherjee and Sheila Stewart, Alberta Geological
Survey, examining core samples of sediments from
above bedrock. By examining the sediments we begin to
understand where aquifers are and their extent.
ne-grained matrix. The map of the ECC’s
surcialgeology(Figure3.1)showsfour
types of till deposits (draped moraine,
stagnation moraine, ridged end moraine
or ice-thrust moraine.
GlaciouvialDeposits
Deposits that came from meltwater in rivers or
streamsthatowedon,within,beneathorout
ofaglacierarecalledglaciouvialdeposits.
TheECCsurcialgeologymap(Figure3.1)
showsglaciouvialdepositsascoarse-or
ne-grainedice-contactsediments(sediments
deposited beneath, on, within or immediately
adjacent to the glacier).
Glaciolacustrine Deposits
Sediments that glacial meltwater has
carried and then deposited into lakes are
called glaciolacustrine deposits. The ECC
surcialgeologymap(Figure3.1)showsglaciolacustrinedepositsascoarse-orne-
grained ice-contact sediments. Ice-contact
glaciolacustrine sediments are lake sediments
that had been directly in contact with a glacier.
Paleogene- to Neogene-Aged Sediments
The oldest unconsolidated sediments in the
ECC were deposited sometime during the
Paleogene. They generally consist of gravel
and sand with minor amounts of silt. Fluvial
systems transported and deposited these
sediments before glaciation. These deposits
remain preserved in a few places in the ECC.
In some areas, these sediments are preserved
on topographic highs (called uplands) or
in channels that ancient rivers cut into thebedrock. The sediments are generally covered
by till.
These sediments have not been mapped across
all of Alberta, and AGS is working to fully
understand the complex history of how they
were deposited.
Sediment Thickness Mapping
Figure 3.2 shows the thickness of sediment
between the ground surface and the top of
the bedrock throughout the ECC. Sediment
thickness in the ECC varies, ranging from
less than one metre to more than 100 metres.
Wehaveidentiedtrendsbetweensediment
thickness, land-surface topography,
bedrock-surface topography and physiography.10, 4
In general, the Rocky Mountains, Rocky
Mountain Foothills, benchland and upland
physiographic regions have thin sediment
cover(lessthanvemetresthick),andthe
ground surface mimics the bedrock topography
that lies underneath. Exceptions to this pattern
include the Cooking Lake Uplands west of
Edmonton and the Cherhill Uplands east of
Edmonton. In these uplands, glaciers deposited
more than 50 metres of sediment. Areas of
thick sediment cover (greater than 10 metres)
are generally associated with the Eastern andWestern Alberta plains physiographic regions
where they occur in the ECC.
Three-Dimensional Geological Model
To better understand the movement of
groundwater through the sediments above
bedrock, we completed a preliminary,
three-dimensional model of the sediments
above bedrock in the ECC. We modelled
the distribution and physical characteristics
of these sediments (such as grain size and
permeability) within the ECC. We assigned
values of low, medium or high ability for
watertoowthroughthesedimentsby
analyzing lithologs of the geological materials
encountered during drilling. Lithological
refers to the physical characteristics of a
sediment or rock, including colour, mineral
composition and grain size. A litholog
describesthesequenceofsedimentandrock
characteristics that a drill encounters as it
drills downward.

5/11/2018 Edmonton-Calgary Corridor Groundwater Atlas - INF 140 - slidepdf.com
http://slidepdf.com/reader/full/edmonton-calgary-corridor-groundwater-atlas-inf-140 35/98
ERCB/AGS Information Series 140 (September 2011) • 28
3. Geology above Bedrock

5/11/2018 Edmonton-Calgary Corridor Groundwater Atlas - INF 140 - slidepdf.com
http://slidepdf.com/reader/full/edmonton-calgary-corridor-groundwater-atlas-inf-140 36/98
ERCB/AGS Information Series 140 (September 2011) • 29
3. Geology above Bedrock
Alberta Geological Survey geologists
simpliedthedrillingdescriptionsofthe
sediments in the lithologs and rated the
descriptions according to relative permeability
based on grain size. As a starting point, we
divided the litholog into 5 m intervals start ing
at the land surface. Then, we examined
the descriptions of the geological materials
encountered in each interval. Based on
the dominant grain size of the geological
materials in each interval, we assigned a
relativepermeabilityvaluetoeachvemetre
section in the lithologs so we could model
permeability across that interval. For instance,
if a driller encountered 5 m of gravel in the
interval, we would give that a high value for
permeability. If a driller encountered clay in a
5 m interval, we would give that a low value
for permeability. Figure 3.3 shows examples
of the results. We used these results to model
groundwater movement.
To create this geological model of the ECC’s
sediment, we used subsurface data from
various sources. These sources included
water-well records, geological maps produced
byAGSandgeologicaldatafromeld
observations.6 Alberta Geological Survey
will release a detailed report outlining the
modelling process in 2011. qPaleogene sand and gravel overlain by dark grey-brown till. The occurrences and thicknesses of the various sand and
gravel layers along with the types of rock materials in the gravel tell us how these sand and gravel layers were deposited.
Initial interpretations indicate the sand and gravel layers at this location were deposited prior to the last glaciation.
Shawn Slattery, Alberta Geological Survey, examines
a fluvial sand exposure. The grain size of the sand
and any layering within it can help reconstruct the
depositional history of the area. This exposure has
many burrows, indicating it is a relatively soft material.
However, it has a cliff-like form; therefore, it has some
structural strength.
Till sample recovered during the drilling program
in the ECC. The coin is included for scale. The till
in this instance is light grey-brown with some rusty
colouration. The colour is an important tool in
mapping the occurrence of till from place to place
in the subsurface.
Borehole drilling site in the ECC at day break. This site is
near the top of a hill. Hills on the landscape of the ECC
can be related to underlying bedrock topography highs
or thick accumulations of sediments above bedrock. In
choosing sites for drilling, we chose some hilltops to
better understand these highs on the landscape.

5/11/2018 Edmonton-Calgary Corridor Groundwater Atlas - INF 140 - slidepdf.com
http://slidepdf.com/reader/full/edmonton-calgary-corridor-groundwater-atlas-inf-140 37/98
ERCB/AGS Information Series 140 (September 2011) • 30
3. Geology above Bedrock
Figure 3.3. Permeability of the sediments above bedrock. The ECC gures show the permeability of the sediments at different depths below ground surface (bgs), as determined by water-well
lithologs. The block diagram shows how these sediments may look in three-dimensional space.

5/11/2018 Edmonton-Calgary Corridor Groundwater Atlas - INF 140 - slidepdf.com
http://slidepdf.com/reader/full/edmonton-calgary-corridor-groundwater-atlas-inf-140 38/98
4. Hydrology
ERCB/AGS Information Series 140 (September 2011) • 31
What is Hydrology?
The ECC’s Complex Hydrology
Alberta’s Precipitation and Evapotranspiration
Water Balance
Annual Total Precipitation
Potential Evapotranspiration
Actual Evapotranspiration
Total Surface Drainage
Groundwater Recharge

5/11/2018 Edmonton-Calgary Corridor Groundwater Atlas - INF 140 - slidepdf.com
http://slidepdf.com/reader/full/edmonton-calgary-corridor-groundwater-atlas-inf-140 39/98
4. Hydrology
ERCB/AGS Information Series 140 (September 2011) • 32
What is Hydrology?
Hydrological Cycle
Hydrology is the science of water: its properties, movement and location on
and under the Earth’s surface and in the atmosphere. We study hydrological
processes because they show us where and how water enters
groundwater-owsystems.Thehydrologicalcycleincludesthefollowingwatercomponents (Figure 4.1):
Precipitation
Precipitation happens when water vapour in the atmosphere condenses and is
deposited on the Earth’s surface. Precipitation includes rain, snow, hail, sleet
and dew.
Evapotranspiration
Evapotranspiration is the reverse of precipitation. It is all of the water that the
Earth’s surface loses to the atmosphere. Evapotranspiration is a combination
of transpiration, when plants release water vapour to the atmosphere, and
evaporation, when water evaporates from the soil and from surface-water
bodies, such as lakes and ponds.
Runoff
Runoff is water that travels either on top of or slightly below the land surface.
Runoff occurs when the amount of water from precipitation or snowmelt
exceedstherateatwhichwatercanseepintothesoil.Runoffowsinto
surface-water bodies, such as rivers and lakes.
Recharge
Recharge is the water that enters the underground environment and becomes
part of the groundwater system. Recharge water typically comes from
precipitation that seeps into the ground.
Figure 4.1. Hydrological cycle in the ECC.
Storm clouds with precipitation falling in the distance. Precipitation in the form of rain
and snow are the primary means that water enters the groundwater environment.

5/11/2018 Edmonton-Calgary Corridor Groundwater Atlas - INF 140 - slidepdf.com
http://slidepdf.com/reader/full/edmonton-calgary-corridor-groundwater-atlas-inf-140 40/98
4. Hydrology
ERCB/AGS Information Series 140 (September 2011) • 33
Baseow
Baseow is groundwater that moves out of
the underground environment, adding water to
rivers and streams.
The ECC’s Complex HydrologyFigure 4.1 shows the general hydrological
processes occurring in the ECC. The ECC’s
hydrology is very complex because of
• its diverse landscape;
• its location within four major river basins;
• themountains’inuenceontheweather;
• the diverse properties of the geological
materials that affect how groundwater
moves through them; and
• the extensive interactions between
groundwater and surface water in
the plains.
Alberta’s Precipitation and
Evapotranspiration
Weatherandlandscapestronglyinuence
the hydrological cycle. Alberta’s climate
isclassiedascontinental at a provincial
scale, with cold winters and warm summers.
This provides a very high-level description
of Alberta’s weather. Because of the ECC’s
location, we had to consider additional factors,
suchashowgeographyinuencesweatherin
northern Alberta versus southern Alberta.
Erosion of sediments caused by runoff. The various
layers of the Horseshoe Canyon Formation show
different patterns of erosion. More resistive layers
will show less erosion.
Medicine River near Benalto, Alberta. Although this river
is a smaller river within the study area, understanding
the relationship between smaller rivers and groundwater
systems is important in developing a complete picture of
the hydrology of the study area.
Wetland area in the ECC, south of Sherwood Park,
Alberta. The physical and chemical relationships
between wetlands, surface water and groundwater are
important in understanding the overall hydrological
cycle and therefore important in our groundwater
inventory program.
Southern Alberta
In southern Alberta, the Rocky Mountains
create a rain shadow. Weather systems rise
as they move eastward over the mountains
and deposit most of their precipitation (such
as snow and rain) at high elevations in themountains and foothills. As a result, areas to
the east of the mountains tend to receive
less precipitation.
Southeastern Alberta
Southeastern Alberta is semi-arid. Here,
evapotranspiration tends to be slightly greater
than precipitation, mainly because of the rain
shadow created by the Rocky Mountains. As a
result, the air and soil are fairly dry.
Northern Alberta
Northern Alberta, which is farther from the
rain shadow created by the mountains, has a
sub-humid climate, with greater precipitationthan evapotranspiration. This means that
the air and soil here are moister than in
southern Alberta.
The ECC is Water Neutral
The ECC sits in a transitional area between
these different climatic regions. The ECC is
almost water neutral over the course of one
year. This means that, over one whole year,
theECC’sprecipitationisaboutequaltoits
evapotranspiration. However, Alberta’s climate
varies widely from year to year, which makes
all of Alberta’s hydrological processes vary as
well, including those in the ECC.
Water Balance
Water balance refers to water’s overall
movement in and out of an area. To understand
the ECC’s water balance, we did a hydrological
studyusingasimplewater-balanceequation.
This showed the importance of each of theECC’s hydrological processes in the overall
water balance.
Water-Balance Equation
Theoverallwater-balanceequationweused
states that the change in the amount of water
(surface water and groundwater), on a yearly
basis,mustequaltheamountofprecipitation,
surfacewaterandgroundwaterowingintothe
ECC minus the amount of evapotranspiration
andtheamountofwaterowingoutofthearea
(surface water and groundwater).
We can assess the change in how much water
is stored in an area’s surface-water bodies andgroundwater by subtracting all of the water
leaving the area from the precipitation and
groundwater the area receives.
Thiswater-balanceequationhelpsus
understand the average hydrological conditions
acrosstheECC.Inthisequation,weassume
that the total volume of surface water and
groundwater stored in the ECC does not
changefromyeartoyear.Wendthat,because
the ECC is in an almost water-neutral area,
small differences between precipitation and
evapotranspiration drive the hydrological
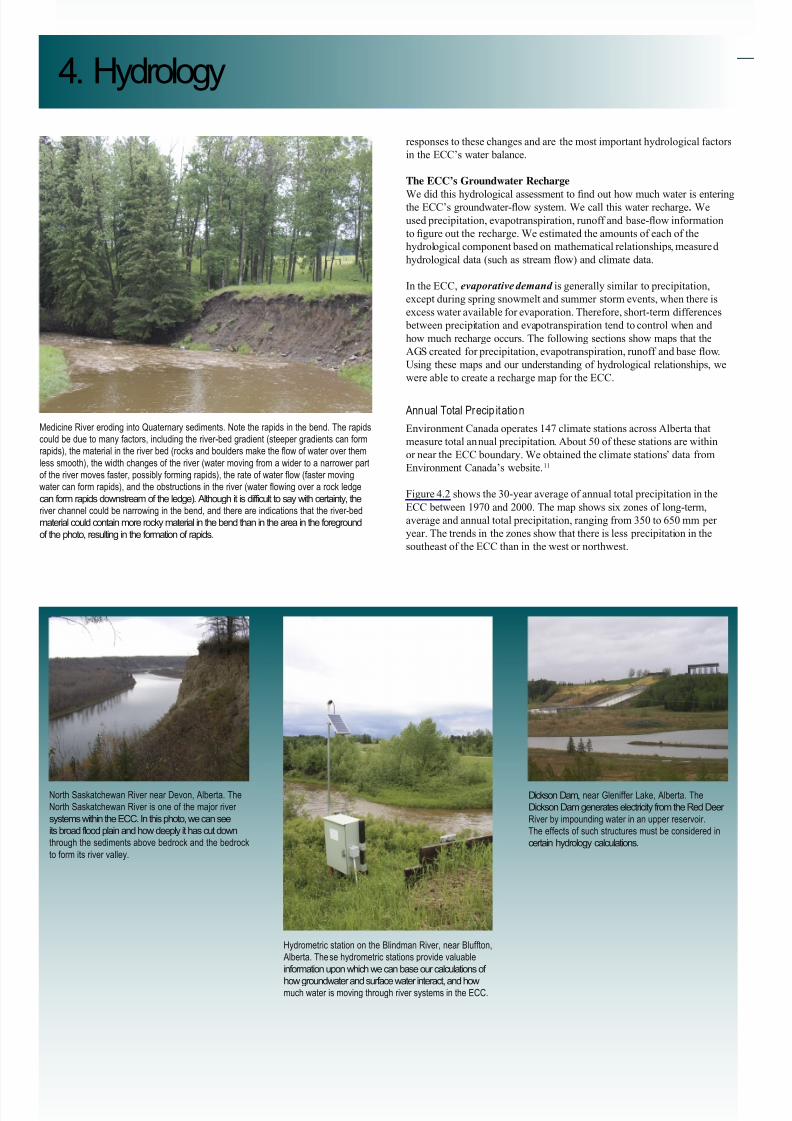
5/11/2018 Edmonton-Calgary Corridor Groundwater Atlas - INF 140 - slidepdf.com
http://slidepdf.com/reader/full/edmonton-calgary-corridor-groundwater-atlas-inf-140 41/98
4. Hydrology
ERCB/AGS Information Series 140 (September 2011) • 34
responses to these changes and are the most important hydrological factors
in the ECC’s water balance.
The ECC’s Groundwater Recharge
WedidthishydrologicalassessmenttondouthowmuchwaterisenteringtheECC’sgroundwater-owsystem.Wecallthiswaterrecharge .We
usedprecipitation,evapotranspiration,runoffandbase-owinformation
togureouttherecharge.Weestimatedtheamountsofeachofthe
hydrological component based on mathematical relationships, measured
hydrologicaldata(suchasstreamow)andclimatedata.
In the ECC, evaporativedemand is generally similar to precipitation,
except during spring snowmelt and summer storm events, when there is
excess water available for evaporation. Therefore, short-term differences
between precipitation and evapotranspiration tend to control when and
how much recharge occurs. The following sections show maps that the
AGScreatedforprecipitation,evapotranspiration,runoffandbaseow.
Using these maps and our understanding of hydrological relationships, we
were able to create a recharge map for the ECC.
Annual Total Precipitation
Environment Canada operates 147 climate stations across Alberta that
measure total annual precipitation. About 50 of these stations are within
or near the ECC boundary. We obtained the climate stations’ data from
Environment Canada’s website.11
Figure 4.2 shows the 30-year average of annual total precipitation in the
ECC between 1970 and 2000. The map shows six zones of long-term,
average and annual total precipitation, ranging from 350 to 650 mm per
year. The trends in the zones show that there is less precipitation in the
southeast of the ECC than in the west or northwest.
North Saskatchewan River near Devon, Alberta. The
North Saskatchewan River is one of the major river
systems within the ECC. In this photo, we can see
its broad flood plain and how deeply it has cut down
through the sediments above bedrock and the bedrock
to form its river valley.
Hydrometric station on the Blindman River, near Bluffton,
Alberta. These hydrometric stations provide valuable
information upon which we can base our calculations of
how groundwater and surface water interact, and howmuch water is moving through river systems in the ECC.
Dickson Dam, near Gleniffer Lake, Alberta. The
Dickson Dam generates electricity from the Red Deer
River by impounding water in an upper reservoir.
The effects of such structures must be considered in
certain hydrology calculations.
Medicine River eroding into Quaternary sediments. Note the rapids in the bend. The rapids
could be due to many factors, including the river-bed gradient (steeper gradients can form
rapids), the material in the river bed (rocks and boulders make the flow of water over them
less smooth), the width changes of the river (water moving from a wider to a narrower part
of the river moves faster, possibly forming rapids), the rate of water flow (faster moving
water can form rapids), and the obstructions in the river (water flowing over a rock ledge
can form rapids downstream of the ledge). Although it is difficult to say with certainty, the
river channel could be narrowing in the bend, and there are indications that the river-bed
material could contain more rocky material in the bend than in the area in the foreground
of the photo, resulting in the formation of rapids.

5/11/2018 Edmonton-Calgary Corridor Groundwater Atlas - INF 140 - slidepdf.com
http://slidepdf.com/reader/full/edmonton-calgary-corridor-groundwater-atlas-inf-140 42/98
4. Hydrology
ERCB/AGS Information Series 140 (September 2011) • 35
UV16
UV1
UV2
UV2
Edmonton
Red Deer
Calgary
Base Data Provided by Spatial Data Warehouse Ltd.
Tp 35
Tp 40
Tp 45
Tp 50
Tp 55
Tp 25
Tp 30
Tp 25
Tp 30
Tp 35
Tp 40
Tp 45
Tp 50
Tp 55
115° 114° 113°
51°
52°
53°
115° 114° 113° 112°
53°
52°
51°
Rg 25 W4 Rg 20 W4Rg 1 W5Rg 5 W5Rg 10 W5
Rg 15 W4Rg 20 W4Rg 25 W4Rg 5 W5Rg 10 W5
0 25 50 75 10012.5km
Average Annual Total Precipitation (1970-2000) (Figure 4.2)Precipitation (mm/year)
501 - 550
551 - 600
601 - 650
350 - 400
401 - 450
451 - 500

5/11/2018 Edmonton-Calgary Corridor Groundwater Atlas - INF 140 - slidepdf.com
http://slidepdf.com/reader/full/edmonton-calgary-corridor-groundwater-atlas-inf-140 43/98
4. Hydrology
ERCB/AGS Information Series 140 (September 2011) • 36
Potential Evapotranspiration
The Earth’s surface loses water via evaporation
from surface-water bodies, evaporation
from the soil and t ranspiration of plants.
Evapotranspiration is the sum of all of the
water that the Ear th’s surface loses to theatmosphere. Potential evapotranspiration is
the amount of water that would evaporate or
transpire from a land surface if water were
available in an unlimited supply.12
Typically, potential evapotranspiration is not
usedinwater-balanceequations.However,
potential evapotranspiration can help show a
maximum estimate of evapotranspiration. This
can be useful in relatively dry climates, such
as Alberta, to assess how much water would
evapotranspire in an area that was irrigated or
had small surface-water bodies.
Determining Potential EvapotranspirationWe can estimate potential evapotranspiration
by measuring the amount of water that
evaporates from a container over time or
using mathematical relationships based on
basic climate data. To calculate potential
evapotranspiration in the ECC, we used the
Thornthwaite method.13 Figure 4.3 shows the
average annual potential evapotranspiration
for the ECC from 1970 to 2000. Potential
evapotranspiration is greatest south of Red
Deer and toward the northeast of the ECC with
the lowest values found in the south of
the study area.
Travelling by raft in the headwaters of the North Saskatchewan River. Note the different characteristics of the river here as compared to the previous photo near Devon. Changes in the
river-flow system affect how surface water and groundwater interact.
Actual Evapotranspiration
Actual evapotranspiration is the amount of
water that the Ear th’s surface loses through
evaporation from surface-water bodies, the
soil and through transpiration by plants.
Unlike potential evapotranspiration, actualevapotranspiration takes into account that an
unlimited supply of water is not available for
evaporation or transpiration (under natural
climatic conditions). Therefore, if there is
no water, no evaporation or t ranspiration
can occur. Actual evapotranspiration is an
important part of the water balance, especially
in drier climates. In central Alberta’s relatively
dry climate, actual evapotranspiration
rarely approaches calculated potential
evapotranspiration values.
Calculating Actual Evapotranspiration for
the Entire ECC
The task of accurately predicting actualevapotranspirationiscomplex.Itoftenrequires
a lot of data and generally only shows the
actualevapotranspirationforspeciclocations.
To calculate average actual evapotranspiration
for the entire ECC, we used the Turc
equation,14whichrequiredonlyasmallamount
of data, such as temperature, humidity and
solar radiation.
UsingtheTurcequation,wecalculatedactual
evapotranspiration across the ECC. Not all
temperature stations had precipitation data,
so we used values from the precipitation map
(Figure 4.2), as necessary. Figure 4.4 shows the
actual evapotranspiration values we calculated
and the map we made based on those values.
Actual evapotranspiration is greatest in the
western portion of the ECC, decreasing toward
the east and southeast.
Total Surface Drainage
Unlike the atmospheric components
of the water budget (precipitation and
evapotranspiration) that are calculated at the
scale of the entire ECC, total surface drainage
anditssubcomponents(baseowandrunoff)
are calculated at a more detailed level, such as
the drainage basin scale. Environment Canada
andAlbertaEnvironmentmeasurestreamow
(the amount of water travelling in a stream
at a given time), also known as total surface
drainage, using stream gauges installed and
monitored in various parts of Alberta. Stream
owindirectlygivesusarecordofadrainage basin’srunoffandbase-owdata.Baseow
and runoff are important in a groundwater
study because they allow us to estimate
groundwater recharge.
Base Flow
Baseowisgroundwaterthatowsfrom
underground into a streambed or river bed.
Alberta Environment sometimes uses
base-owinformationtohelpdecidehow
much water from a certain stream or river it
will allow various users to use.

5/11/2018 Edmonton-Calgary Corridor Groundwater Atlas - INF 140 - slidepdf.com
http://slidepdf.com/reader/full/edmonton-calgary-corridor-groundwater-atlas-inf-140 44/98
4. Hydrology
ERCB/AGS Information Series 140 (September 2011) • 37
UV16
UV1
UV2
UV2
Edmonton
Red Deer
Calgary
Base Data Provided by Spatial Data Warehouse Ltd.
Tp 35
Tp 40
Tp 45
Tp 50
Tp 55
Tp 25
Tp 30
Tp 25
Tp 30
Tp 35
Tp 40
Tp 45
Tp 50
Tp 55
115° 114° 113°
51°
52°
53°
115° 114° 113° 112°
53°
52°
51°
Rg 25 W4 Rg 20 W4Rg 1 W5Rg 5 W5Rg 10 W5
Rg 15 W4Rg 20 W4Rg 25 W4Rg 5 W5Rg 10 W5
0 25 50 75 10012.5km
Average Annual Potential Evapotranspiration (1970-2000) (Figure 4.3)
Potential Evapotranspiration (mm/year)
451 - 475
476 - 500
501 - 550
551 - 575
315 - 375
376 - 400
401 - 425
426 - 450

5/11/2018 Edmonton-Calgary Corridor Groundwater Atlas - INF 140 - slidepdf.com
http://slidepdf.com/reader/full/edmonton-calgary-corridor-groundwater-atlas-inf-140 45/98
4. Hydrology
ERCB/AGS Information Series 140 (September 2011) • 38
UV16
UV1
UV2
UV2
Edmonton
Red Deer
Calgary
Base Data Provided by Spatial Data Warehouse Ltd.
Tp 35
Tp 40
Tp 45
Tp 50
Tp 55
Tp 25
Tp 30
Tp 25
Tp 30
Tp 35
Tp 40
Tp 45
Tp 50
Tp 55
115° 114° 113°
51°
52°
53°
115° 114° 113° 112°
53°
52°
51°
Rg 25 W4 Rg 20 W4Rg 1 W5Rg 5 W5Rg 10 W5
Rg 15 W4Rg 20 W4Rg 25 W4Rg 5 W5Rg 10 W5
0 25 50 75 10012.5km
Average Annual Actual Evapotranspiration (1970-2000) (Figure 4.4)
Actual Evapotranspiration (mm/year)
275 - 285
286 - 295
296 - 305
306 - 315
316 - 325
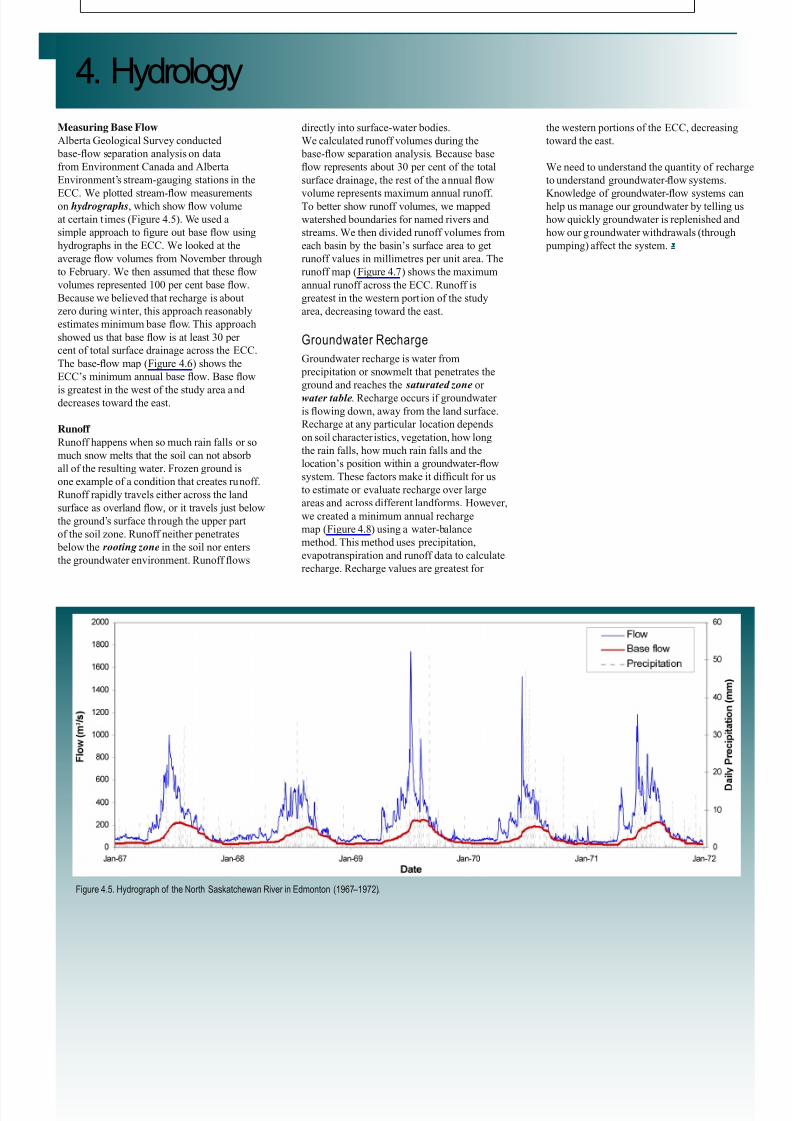
5/11/2018 Edmonton-Calgary Corridor Groundwater Atlas - INF 140 - slidepdf.com
http://slidepdf.com/reader/full/edmonton-calgary-corridor-groundwater-atlas-inf-140 46/98
4. Hydrology
ERCB/AGS Information Series 140 (September 2011) • 39
Measuring Base Flow
Alberta Geological Survey conducted
base-owseparationanalysisondata
from Environment Canada and Alberta
Environment’s stream-gauging stations in the
ECC.Weplottedstream-owmeasurementson hydrographs,whichshowowvolume
at certain t imes (Figure 4.5). We used a
simpleapproachtogureoutbaseowusing
hydrographs in the ECC. We looked at the
averageowvolumesfromNovemberthrough
toFebruary.Wethenassumedthattheseow
volumesrepresented100percentbaseow.
Because we believed that recharge is about
zero during winter, this approach reasonably
estimatesminimumbaseow.Thisapproach
showedusthatbaseowisatleast30per
cent of total surface drainage across the ECC.
Thebase-owmap(Figure4.6)showsthe
ECC’sminimumannualbaseow.Baseow
is greatest in the west of the study area anddecreases toward the east.
Runoff
Runoff happens when so much rain falls or so
much snow melts that the soil can not absorb
all of the resulting water. Frozen ground is
one example of a condition that creates runoff.
Runoff rapidly travels either across the land
surfaceasoverlandow,orittravelsjustbelow
the ground’s surface through the upper part
of the soil zone. Runoff neither penetrates
below the rootingzone in the soil nor enters
thegroundwaterenvironment.Runoffows
directly into surface-water bodies.
We calculated runoff volumes during the
base-owseparationanalysis.Becausebase
owrepresentsabout30percentofthetotal
surfacedrainage,therestoftheannualow
volume represents maximum annual runoff.To better show runoff volumes, we mapped
watershed boundaries for named rivers and
streams. We then divided runoff volumes from
each basin by the basin’s surface area to get
runoff values in millimetres per unit area. The
runoff map (Figure 4.7) shows the maximum
annual runoff across the ECC. Runoff is
greatest in the western port ion of the study
area, decreasing toward the east.
Groundwater Recharge
Groundwater recharge is water from
precipitation or snowmelt that penetrates the
ground and reaches the saturatedzone or
watertable. Recharge occurs if groundwater
isowingdown,awayfromthelandsurface.
Recharge at any particular location depends
on soil character istics, vegetation, how long
the rain falls, how much rain falls and the
location’spositionwithinagroundwater-ow
system.Thesefactorsmakeitdifcultforus
to estimate or evaluate recharge over large
areas and across different landforms. However,
we created a minimum annual recharge
map (Figure 4.8) using a water-balance
method. This method uses precipitation,
evapotranspiration and runoff data to calculate
recharge. Recharge values are greatest for
the western portions of the ECC, decreasing
toward the east.
Weneedtounderstandthequantityofrecharge
tounderstandgroundwater-owsystems.
Knowledgeofgroundwater-owsystemscanhelp us manage our groundwater by telling us
howquicklygroundwaterisreplenishedand
how our groundwater withdrawals (through
pumping) affect the system. q
Figure 4.5. Hydrograph of the North Saskatchewan River in Edmonton (1967–1972).

5/11/2018 Edmonton-Calgary Corridor Groundwater Atlas - INF 140 - slidepdf.com
http://slidepdf.com/reader/full/edmonton-calgary-corridor-groundwater-atlas-inf-140 47/98
4. Hydrology
ERCB/AGS Information Series 140 (September 2011) • 40
UV16
UV1
UV2
UV2
Edmonton
Red Deer
Calgary
Base Data Provided by Spatial Data Warehouse Ltd.
Tp 35
Tp 40
Tp 45
Tp 50
Tp 55
Tp 25
Tp 30
Tp 25
Tp 30
Tp 35
Tp 40
Tp 45
Tp 50
Tp 55
115° 114° 113°
51°
52°
53°
115° 114° 113° 112°
53°
52°
51°
Rg 25 W4 Rg 20 W4Rg 1 W5Rg 5 W5Rg 10 W5
Rg 15 W4Rg 20 W4Rg 25 W4Rg 5 W5Rg 10 W5
0 25 50 75 10012.5km
Average Annual Minimum Base Flow (Figure 4.6)Minimum Annual Base Flow (mm/year)
0 - 4
5 - 12
13 - 43
44 - 72
73 - 127
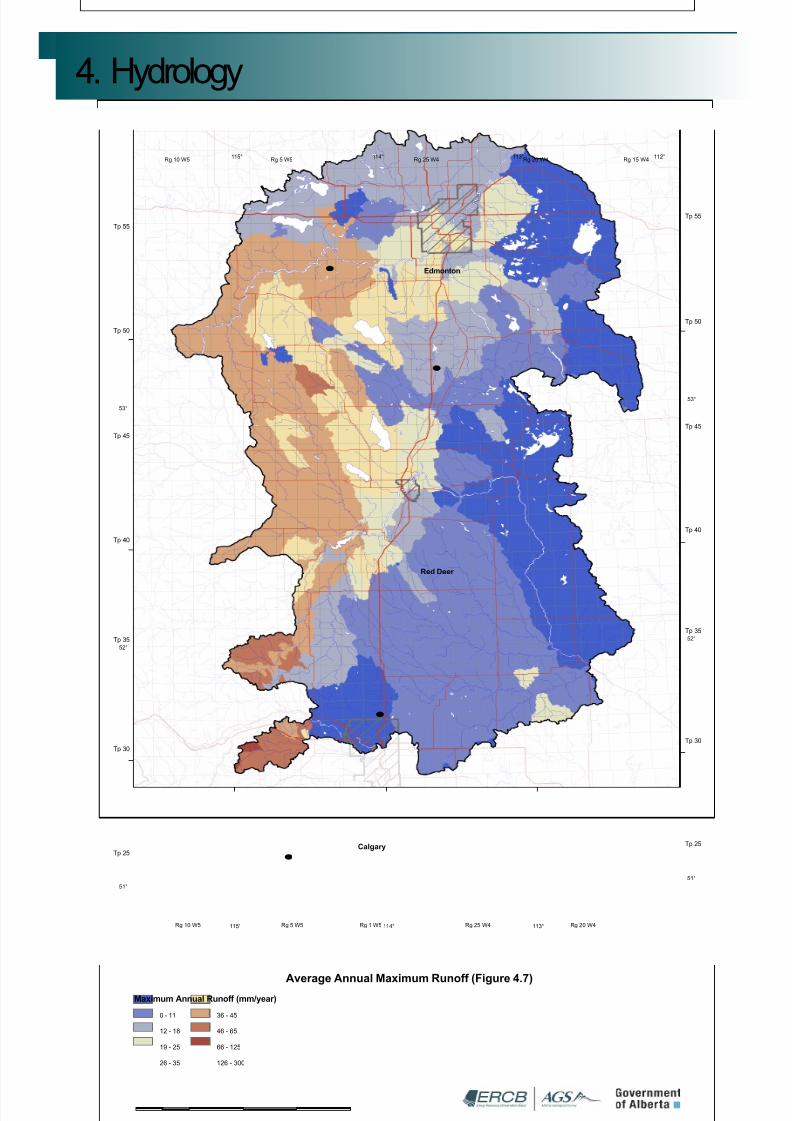
5/11/2018 Edmonton-Calgary Corridor Groundwater Atlas - INF 140 - slidepdf.com
http://slidepdf.com/reader/full/edmonton-calgary-corridor-groundwater-atlas-inf-140 48/98
4. Hydrology
ERCB/AGS Information Series 140 (September 2011) • 41
UV16
UV1
UV2
UV2
Edmonton
Red Deer
Calgary
Base Data Provided by Spatial Data Warehouse Ltd.
Tp 35
Tp 40
Tp 45
Tp 50
Tp 55
Tp 25
Tp 30
Tp 25
Tp 30
Tp 35
Tp 40
Tp 45
Tp 50
Tp 55
115° 114° 113°
51°
52°
53°
115° 114° 113° 112°
53°
52°
51°
Rg 25 W4 Rg 20 W4Rg 1 W5Rg 5 W5Rg 10 W5
Rg 15 W4Rg 20 W4Rg 25 W4Rg 5 W5Rg 10 W5
0 25 50 75 10012.5km
Average Annual Maximum Runoff (Figure 4.7)
Maximum Annual Runoff (mm/year)
36 - 45
46 - 65
66 - 125
126 - 300
0 - 11
12 - 18
19 - 25
26 - 35

5/11/2018 Edmonton-Calgary Corridor Groundwater Atlas - INF 140 - slidepdf.com
http://slidepdf.com/reader/full/edmonton-calgary-corridor-groundwater-atlas-inf-140 49/98
4. Hydrology
ERCB/AGS Information Series 140 (September 2011) • 42
UV16
UV1
UV2
UV2
Edmonton
Red Deer
Calgary
Base Data Provided by Spatial Data Warehouse Ltd.
Tp 35
Tp 40
Tp 45
Tp 50
Tp 55
Tp 25
Tp 30
Tp 25
Tp 30
Tp 35
Tp 40
Tp 45
Tp 50
Tp 55
115° 114° 113°
51°
52°
53°
115° 114° 113° 112°
53°
52°
51°
Rg 25 W4 Rg 20 W4Rg 1 W5Rg 5 W5Rg 10 W5
Rg 15 W4Rg 20 W4Rg 25 W4Rg 5 W5Rg 10 W5
0 25 50 75 10012.5km
Average Annual Minimum Recharge (Figure 4.8)Recharge (mm/year)
151 - 175
176 - 200
201 - 225
76 - 100
101 - 125
126 - 150
0 - 25
26 - 50
51 - 75

5/11/2018 Edmonton-Calgary Corridor Groundwater Atlas - INF 140 - slidepdf.com
http://slidepdf.com/reader/full/edmonton-calgary-corridor-groundwater-atlas-inf-140 50/98
5. Hydrogeology
ERCB/AGS Information Series 140 (September 2011) • 43
Hydrogeology Basics
Understanding the ECC’s Hydrogeology
Hydrogeological Parameters
Well Density
Mapping the Water Table
Groundwater Flow
Water-Level Surfaces
Recharge and Discharge Areas
Potential-Yield Mapping
Groundwater Susceptibility
Aquifers in the ECC
Potential Unconned Aquifers
Potential Conned Aquifers in the Sediments above Bedrock
Potential Bedrock Aquifers

5/11/2018 Edmonton-Calgary Corridor Groundwater Atlas - INF 140 - slidepdf.com
http://slidepdf.com/reader/full/edmonton-calgary-corridor-groundwater-atlas-inf-140 51/98
5. Hydrogeology
ERCB/AGS Information Series 140 (September 2011) • 44
Thomas Graf, Alberta Geological Survey, measuring Paskapoo Formation sandstone
thickness near Drayton Valley. The Paskapoo Formation is an important source of
groundwater in Alberta. Understanding its properties and subsurface extent helps
us map those portions of the Paskapoo Formation best suited for use as sources
of groundwater.
Hydrogeology Basics
Hydrogeology is the subdiscipline of geology that deals with the interactions
between groundwater, surface water, and sediments and rocks. Hydrogeology
uses concepts from geology, biology, physics and chemistry to help us
understand groundwater movement and the chemical reactions that occur as
groundwater moves in the Earth’s subsurface.
Groundwater Movement
Groundwater movement is driven by differences in the elevation of hydraulic
heads in the subsurface. The hydraulic head is the level that groundwater
rises to within a well. Hydraulic head is a measure of the potential energy that
drivestheowofgroundwater.Groundwaterowsfromareaswithhigher
hydraulic-head elevations to areas with lower hydraulic-head elevations to
equalizetheheadwaterpressuresbetweenthetwoareas.Figure5.1shows
thatgroundwaterowmaytakeplaceovershortdistancesandtimespans
(localow)orlongdistancesandtimespans(regionalow).Groundwater-
owsystemsandhydraulic-headelevationsareinuencedbynaturalfactors
(droughtorooding)orbyman-madestresses(groundwaterpumpingor
alteration of the land surface).
Groundwater follows the path of least resistance through the subsurface. The
properties of the geological layers determine this path.15 These properties
include the geological layers’
• geometry (orientation and shape of the layer),
• porosity (how much open space exists in the sediments or rocks), and
• permeability(howeasilyauidcanmovethroughthesedimentorrock).
When we understand the properties of the geological layers in the subsurface,
wecangureoutwhichlayerswillconductgroundwater(aquifers)andwhich
willhinderit(aquitards).
Aquifersaregeologicallayersthatarewater-saturated,havehigh
permeabilitiesandcanyieldsignicantquantitiesofwatertowellsorsprings.
Figure 5.1. Hydrogeological cycle in the ECC.

5/11/2018 Edmonton-Calgary Corridor Groundwater Atlas - INF 140 - slidepdf.com
http://slidepdf.com/reader/full/edmonton-calgary-corridor-groundwater-atlas-inf-140 52/98
5. Hydrogeology
ERCB/AGS Information Series 140 (September 2011) • 45
Aquitards(orconninglayers)aregeological
layers that are water-saturated, have low
permeabilities,butcannottransmitsignicant
quantitiesofwater.Aquiferscanbeconned—
enclosedaboveandbelowbyaquitards—or
unconned,withnoaquitardabovetheaquifer.
How We Gain Access to Groundwater
Groundwaterowstothelandsurfacetoform
springs,owsintosurface-waterbodies(like
rivers, streams, lakes and wetlands) and can be
sampled or monitored in wells (Figure 5.1).
A spring is typically a small point on the
Earth’s surface where groundwater moving
through the subsurface intersects the land
surface. Groundwater that feeds into surface-
water bodies helps maintain the water levels
in streams, rivers and lakes. Wells allow us to
extract groundwater from, or monitor the
water levels in, the geological layer in whicha well is completed.
Groundwater mapping almost exclusively
relies on data from boreholes, like wells,
since the movement of groundwater is not
usually visible or measurable at the land
surface without them. The maps in this section
use these data to estimate both the parameters
being mapped for which we have borehole
information and the areas where no wells
exist. This is done with statistical mapping
techniques.Itisveryimportanttoknowthat
all maps have some level of uncertainty in
them, as described in Section 1.
Understanding the ECC’s Hydrogeology
The following sections outline the work
AGS completed to understand the ECC’s
hydrogeology. The primary data source was
the Alberta Water Well Information Database,
supplemented by AGS data. We summarizethe work in this section and provide detailed
information later in this chapter.
The ECC’s Hydrogeological Framework
We used our understanding of the sediments
above bedrock and of the bedrock units to
construct models showing the hydraulic
properties of the ECC’s major geological
units. Figure 5.2 shows a cross-section of
the bedrock formations with a chart showing
whichsedimentsareaquifersandwhich
areaquitards.Figure5.3showsthepossible
geometry of the sediments above bedrock with
achartshowingwhichsedimentsareaquifers
andwhichareaquitards.
Well Density
Well density shows us where the ECC’s wells
are and which areas have more wells than
other areas. We consider this information when
interpreting maps based on the water-well
data. Areas with more water wells generally
give us a more accurate understanding of
hydrogeological parameters. In areas with low
well density, greater uncertainty exists in the
accuracy of the estimates. When examining
any map, it is good practice to also review the
data density to understand which estimates are
based on data and which estimates are based
on calculations.
Hydrogeological Parameters
Water Table
The water table is where fully saturatedgroundwaterconditionsarerstencountered
below the surface of the Earth if we were to
dig or drill downward from the Earth’s surface.
The whole subsurface is saturated below the
water table. Therefore, the water table is the
surface between the unsaturatedzone and
saturated zone (Figure 5.1). The water table is a
three-dimensional surface and usually follows
the surface topography in a subdued manner.
We typically use the elevation of the water-
table surface to estimate local groundwater-
owdirections,identifyshallowaquifersand
determine the depth to groundwater in an area.
Groundwater Flow
We looked at the hydraulic-head elevations
in wells to understand how groundwater
is moving in the subsurface. Recall that
groundwaterowsfromhighertolower
hydraulic-headelevations.Thisowhasa
component that moves in a horizontal direction
and a component that moves in a vertical
direction. When you add the horizontal
and vertical components together, you have
theoveralldirectionofgroundwaterow.
Groundwatermovingbetweenaquifers
typically travels slower than groundwater
movingwithinanaquifer,becausethe
Steven Lyster, Alberta Geological Survey, measuring thin till cover on unconsolidated sand and gravel. The till-sand and gravel contact is best seen in the leftmost portion of the
photo where the lighter and darker grey-brown till overlies the sand and gravel. You can follow this contact across the photo. This sharp contact is also marked in many places by a
zone of rusty colouration. Sand and gravel deposits can also be important sources of groundwater. By mapping them near the land surface and in the subsurface, we gain a better
understanding of their potential as sources of groundwater.

5/11/2018 Edmonton-Calgary Corridor Groundwater Atlas - INF 140 - slidepdf.com
http://slidepdf.com/reader/full/edmonton-calgary-corridor-groundwater-atlas-inf-140 53/98
ERCB/AGS Information Series 140 (September 2011) • 46
5. Hydrogeology
Figure 5.2. Cross-section through the ECC and the aquifer potential of the bedrock formations in the ECC.
Figure 5.3. Conceptual model of the sediments above bedrock in the ECC and the aquifer potential of those different sediments.
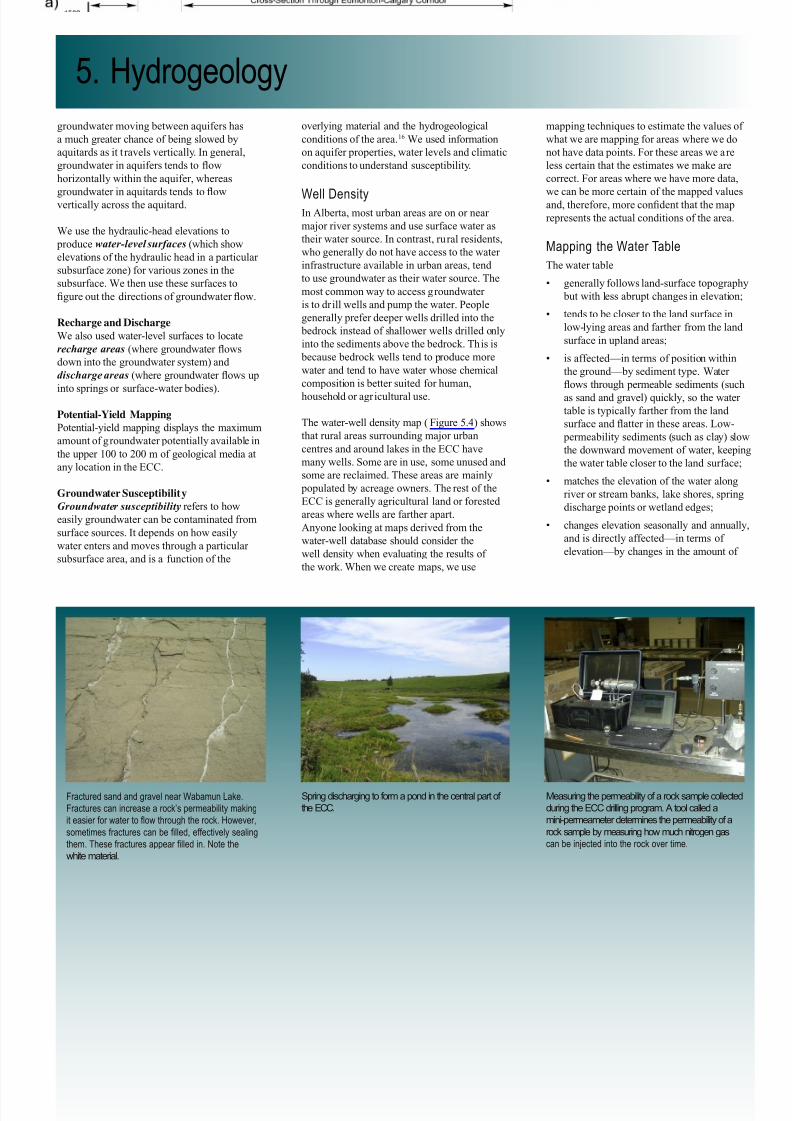
5/11/2018 Edmonton-Calgary Corridor Groundwater Atlas - INF 140 - slidepdf.com
http://slidepdf.com/reader/full/edmonton-calgary-corridor-groundwater-atlas-inf-140 54/98
5. Hydrogeology
ERCB/AGS Information Series 140 (September 2011) • 47
Fractured sand and gravel near Wabamun Lake. Fractures can increase a rock’s permeability making
it easier for water to flow through the rock. However,
sometimes fractures can be filled, effectively sealing
them. These fractures appear filled in. Note the
white material.
Spring discharging to form a pond in the central part of
the ECC.
Measuring the permeability of a rock sample collected
during the ECC drilling program. A tool called a
mini-permeameter determines the permeability of a
rock sample by measuring how much nitrogen gas
can be injected into the rock over time.
groundwatermovingbetweenaquifershas
a much greater chance of being slowed by
aquitardsasittravelsvertically.Ingeneral,
groundwaterinaquiferstendstoow
horizontallywithintheaquifer,whereas
groundwaterinaquitardstendstoowverticallyacrosstheaquitard.
We use the hydraulic-head elevations to
produce water-levelsurfaces (which show
elevations of the hydraulic head in a particular
subsurface zone) for various zones in the
subsurface. We then use these surfaces to
gureoutthedirectionsofgroundwaterow.
Recharge and Discharge
We also used water-level surfaces to locate
rechargeareas(wheregroundwaterows
down into the groundwater system) anddischargeareas (wheregroundwaterowsup
into springs or surface-water bodies).
Potential-Yield Mapping
Potential-yield mapping displays the maximum
amount of groundwater potentially available in
the upper 100 to 200 m of geological media at
any location in the ECC.
Groundwater Susceptibility
Groundwatersusceptibility refers to how
easily groundwater can be contaminated from
surface sources. It depends on how easily
water enters and moves through a particular
subsurface area, and is a function of the
overlying material and the hydrogeological
conditions of the area.16 We used information
onaquiferproperties,waterlevelsandclimatic
conditions to understand susceptibility.
Well DensityIn Alberta, most urban areas are on or near
major river systems and use surface water as
their water source. In contrast, rural residents,
who generally do not have access to the water
infrastructure available in urban areas, tend
to use groundwater as their water source. The
most common way to access groundwater
is to drill wells and pump the water. People
generally prefer deeper wells drilled into the
bedrock instead of shallower wells drilled only
into the sediments above the bedrock. This is
because bedrock wells tend to produce more
water and tend to have water whose chemical
composition is better suited for human,
household or agricultural use.
The water-well density map (Figure 5.4) shows
that rural areas surrounding major urban
centres and around lakes in the ECC have
many wells. Some are in use, some unused and
some are reclaimed. These areas are mainly
populated by acreage owners. The rest of the
ECC is generally agricultural land or forested
areas where wells are farther apart.
Anyone looking at maps derived from the
water-well database should consider the
well density when evaluating the results of
the work. When we create maps, we use
mappingtechniquestoestimatethevaluesof
what we are mapping for areas where we do
not have data points. For these areas we are
less certain that the estimates we make are
correct. For areas where we have more data,
we can be more certain of the mapped valuesand,therefore,morecondentthatthemap
represents the actual conditions of the area.
Mapping the Water Table
The water table
• generally follows land-surface topography
but with less abrupt changes in elevation;
• tends to be closer to the land surface in
low-lying areas and farther from the land
surface in upland areas;
• is affected—intermsofpositionwithin
theground—bysedimenttype.Water
owsthroughpermeablesediments(such
assandandgravel)quickly,sothewater
table is typically farther from the land
surfaceandatterintheseareas.Low-
permeability sediments (such as clay) slow
the downward movement of water, keeping
the water table closer to the land surface;
• matches the elevation of the water along
river or stream banks, lake shores, spring
discharge points or wetland edges;
• changes elevation seasonally and annually,
andisdirectlyaffected—intermsof
elevation—bychangesintheamountof
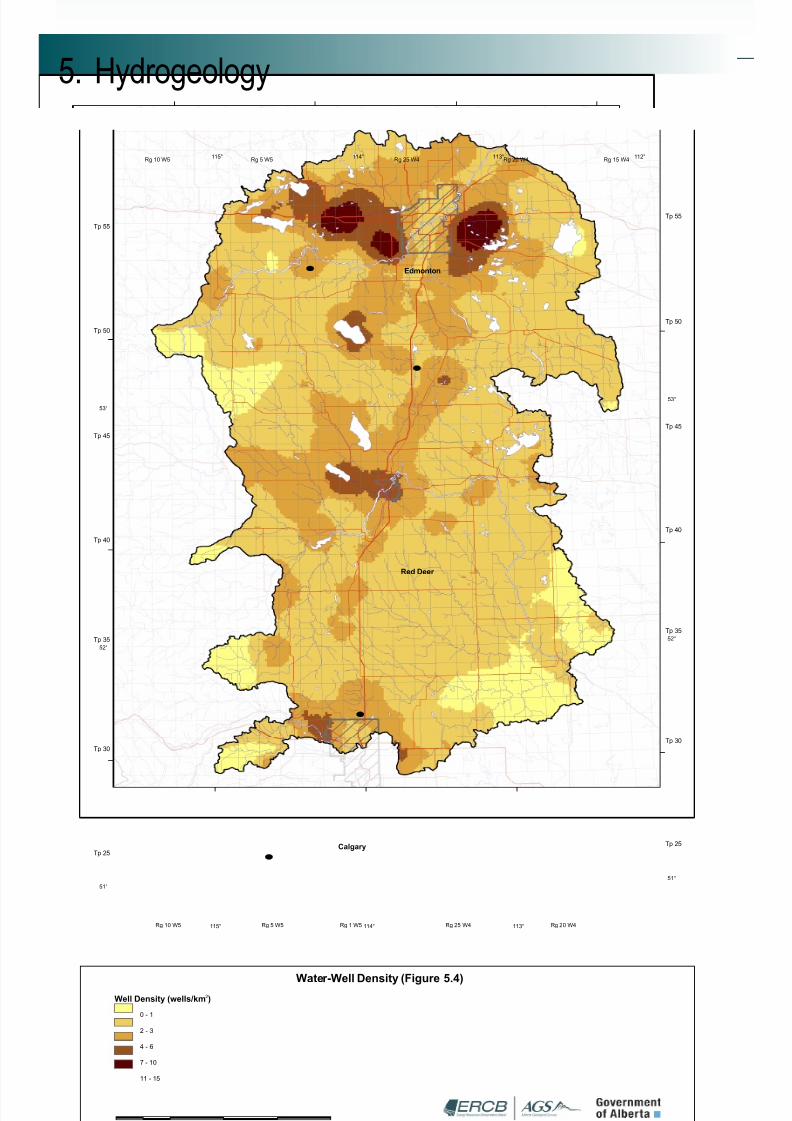
5/11/2018 Edmonton-Calgary Corridor Groundwater Atlas - INF 140 - slidepdf.com
http://slidepdf.com/reader/full/edmonton-calgary-corridor-groundwater-atlas-inf-140 55/98
5. Hydrogeology
ERCB/AGS Information Series 140 (September 2011) • 48
UV16
UV1
UV2
UV2
Edmonton
Red Deer
Calgary
Base Data Provided by Spatial Data Warehouse Ltd.
Tp 35
Tp 40
Tp 45
Tp 50
Tp 55
Tp 25
Tp 30
Tp 25
Tp 30
Tp 35
Tp 40
Tp 45
Tp 50
Tp 55
115° 114° 113°
51°
52°
53°
115° 114° 113° 112°
53°
52°
51°
Rg 25 W4 Rg 20 W4Rg 1 W5Rg 5 W5Rg 10 W5
Rg 15 W4Rg 20 W4Rg 25 W4Rg 5 W5Rg 10 W5
0 25 50 75 10012.5km
Water-Well Density (Figure 5.4)2Well Density (wells/km )
0 - 1
2 - 3
4 - 6
7 - 10
11 - 15

5/11/2018 Edmonton-Calgary Corridor Groundwater Atlas - INF 140 - slidepdf.com
http://slidepdf.com/reader/full/edmonton-calgary-corridor-groundwater-atlas-inf-140 56/98
5. Hydrogeology
ERCB/AGS Information Series 140 (September 2011) • 49
water entering and leaving the
groundwater system; and
• may lie in the bedrock, especially in
upland areas where bedrock is near the
land surface (and the land surface has thin
sediment cover) or where river valleys have
cut into the land and lowered the water table.
We map the water-table surface because we
can use it to estimate other hydrogeological
characteristics, such as the thickness of the
interval between the land surface and the water
table (the unsaturated zone), local groundwater-
owdirectionsorthepositionsofshallow
aquifers.
How We Mapped the Water Table
To create the map of the water-table surface we used
• elevations of permanent water bodies (such
as wetlands, lakes and rivers);• elevations of springs; and
• water levels from wells that have
screened intervals in the sediments
above the bedrock or screens in bedrock
(if the bedrock is within 5 m of the
ground surface).
Figure 5.5 (next page) shows the water-table
surface, which looks very similar to the
present-day land surface. When we look at this
mapandtalkaboutgroundwaterow,
we expect groundwater to move from areas of
higher elevation to areas of lower elevation.
Groundwater Flow
Groundwaterowisthemovementofwaterinthe saturated zone, which is everything below
thewatertable.Groundwaterowoccurs
because of elevation differences in hydraulic
heads from one point to another in the same
aquiferorbetweenoverlyingaquifers.
Groundwaterowcan
• be local to regional in scale;
• be constrained horizontally by boundaries
known as groundwater divides:
groundwater moves in one direction on one
side of the boundary and in the opposite
direction on the other side of the boundary;
• be constrained vertically or horizontally by boundariesthatgroundwatercannotow
through(aquitards);and
• contain one or more recharge and/or
discharge areas.
Ourunderstandingofgroundwaterowin
the ECC comes mainly f rom work done by
József Tóth17onowinsmalldrainagebasins
in prairie environments. Tóth’s work described
localgroundwaterowversusregional
groundwaterowandchangedtheway
hydrogeologists understand these concepts.
Whenweusetheseconceptsofowwithour
knowledge of the type of sediment that the
various geological units are composed of, we
canreneourinterpretationofgroundwater
owwithintheECC.
For the purposes of this atlas, we wanted
tounderstandgroundwaterowinabroad,
regional sense across the ECC. Because we
cannot measure the direction of groundwater
owdirectly,weusethehydraulic-head
elevationsinwellstogureoutowdirection
(Figure 5.6). We use the hydraulic-head
elevations from the wells completed in various
subsurface zones to generate water-level
surfaces for these zones. We then use the
information from these surfaces to understand
groundwater-owdirectionswithinand
between subsurface zones.
Groundwaterowsinthreedimensions.Tounderstandthisthree-dimensionalow,
we look at the horizontal (groundwater
owwithinthesamesubsurfacezone)and
vertical(groundwaterowacrosssubsurface
zones)componentsofgroundwaterow.As
groundwaterowsfromhigherhydraulic-head
elevations to lower hydraulic-head elevations,
groundwater moves toward or away from a
well depending on that well’s hydraulic-head
elevation compared to surrounding wells.
Withinaquifers,owismainlyhorizontal.
Withinaquitards,owismainlyvertical.
Figure 5.6. Two-dimensional schematic of a
groundwater-flow system showing the water-table surface,
recharge and discharge areas and the associated
hydraulic-head elevations in the groundwater wells installed
in different parts of the flow system and groundwater-flow
direction.

5/11/2018 Edmonton-Calgary Corridor Groundwater Atlas - INF 140 - slidepdf.com
http://slidepdf.com/reader/full/edmonton-calgary-corridor-groundwater-atlas-inf-140 57/98
5. Hydrogeology
ERCB/AGS Information Series 140 (September 2011) • 50
UV16
UV1
UV2
UV2
Edmonton
Red Deer
Calgary
Base Data Provided by Spatial Data Warehouse Ltd.
Tp 35
Tp 40
Tp 45
Tp 50
Tp 55
Tp 25
Tp 30
Tp 25
Tp 30
Tp 35
Tp 40
Tp 45
Tp 50
Tp 55
115° 114° 113°
51°
52°
53°
115° 114° 113° 112°
53°
52°
51°
Rg 25 W4 Rg 20 W4Rg 1 W5Rg 5 W5Rg 10 W5
Rg 15 W4Rg 20 W4Rg 25 W4Rg 5 W5Rg 10 W5
0 25 50 75 10012.5km
Water-Table Surface (Figure 5.5)
Elevation (metres above sea level)
751 - 800
801 - 850
851 - 900
901 - 950
951 - 1100
1101 - 2254
516 - 650
651 - 700
701 - 750

5/11/2018 Edmonton-Calgary Corridor Groundwater Atlas - INF 140 - slidepdf.com
http://slidepdf.com/reader/full/edmonton-calgary-corridor-groundwater-atlas-inf-140 58/98
5. Hydrogeology
ERCB/AGS Information Series 140 (September 2011) • 51
Theverticalmovementinaquifersand
aquitardsalsohaveadownwardorupward
component. When the horizontal and vertical
components are combined, the result is a
pictureoftheoveralldirectionofow.
Water-Level Surf aces
A water-level surface is an estimate of the
hydraulic-head elevations within the same
aquiferorinthesamesubsurfacezone.The
water table is an example of a water-level
surface. We used the available hydraulic-head
data from the Alberta Water Well Information
Database to create the water-level surfaces
referred to in this section. Water-level surfaces
show how hydraulic-head elevations vary
across an area.
In this section, we focus on the hydraulic-head
information available for the various bedrock formations in the ECC. We created water-level
surfaces using wells completed in bedrock
that had measured hydraulic-head values. We
sorted the wells into ten metre intervals below
the ground surface, based on the depth of the
completion. Table 5.1 shows the number of
wells at each depth interval. (For example, in
the ECC, there are 11 152 wells in bedrock
whose completions are between 10 metres and
20 metres below the ground surface (m bgs)).
We created 10 water-level surfaces to show
groundwaterowwithinandbetweenthe
various bedrock formations in the ECC, one
for each of the intervals listed in Table 5.1. An upcoming AGS report will provide the full analysis of
theresults.However,forthisatlas,wewillshowasummaryofthendingsusingoneexampleofthe
created surfaces.
Figure 5.7 shows the water-level surface of the 30–40 m bgs interval. We chose this water-level surfaceas an example for the atlas because the data density in this interval is high (10 824 wells), suggesting
that it represents a common target depth for wells within the ECC.
Whenwelookatthemap,wecancommentongeneralpatternsofhorizontalowwithintheECC
in this depth interval. Flow will be from the darker colours toward the lighter colours. We can see
theimportantrolethatthemajorriversplayincontrollinggroundwaterow,asmanyofthelowest
elevations coincide with the North Saskatchewan, Battle and Red Deer rivers.
Togureoutthedirectionoftheverticalgroundwater-owcomponent,weusedthedifferences
between the hydraulic-head values in a given interval and the hydraulic-head values in the interval
immediately above or immediately below that interval.
Usually,mapsshowingtheverticalgroundwater-owcomponentusearrowsshowingthedifferencein
hydraulic-head values at a particular point in successive layers. This value is called the
Table 5.1. The number o f well record s used to create water-level sur faces for each subsur face zone.
Depth In terval (m bgs ) Wel l Records
10–20 11 152
20–30 11 121
30–40 10 824
40–50 6445
50–60 3730
60–70 2430
70–80 1618
100–125 432
100 + 636
200 + 40
Groundwater discharge at the land surface near Fort
Saskatchewan, Alberta. Where the land surface is
lower than the water table elevation, groundwater can
discharge at the land surface forming wet areas that,
over time, can change in size and depth depending on
changes to the water table.
Measuring groundwater discharge from a spring near
Rocky Mountain House. Springs represent discrete
points on the landscape where groundwater leaves
the subsurface environment to flow out of the rock or
other sediments. They can be caused by many factors,
including the geology and hydrogeology of the area.
Groundwater discharge from a flowing well in the
central portion of the ECC. The well water has risen
above the top of the casing, forming a pond adjacent
to the well.

5/11/2018 Edmonton-Calgary Corridor Groundwater Atlas - INF 140 - slidepdf.com
http://slidepdf.com/reader/full/edmonton-calgary-corridor-groundwater-atlas-inf-140 59/98
5. Hydrogeology
ERCB/AGS Information Series 140 (September 2011) • 52
UV16
UV1
UV2
UV2
Edmonton
Red Deer
Calgary
Base Data Providedby SpatialDataWarehouse Ltd.
Tp35
Tp40
Tp45
Tp50
Tp55
Tp25
Tp30
Tp25
Tp30
Tp35
Tp40
Tp45
Tp50
Tp55
115° 114° 113°
51°
52°
53°
115° 114° 113° 112°
53°
52°
51°
Rg 25 W4 Rg 20 W4Rg1W5Rg5W5Rg10W5
Rg15W4Rg20W4Rg25W4Rg5W5Rg10W5
0 25 50 75 10012.5km
Potentiometric Surface (for wells screened 30-40 metres below ground surface) (Figure 5.7)
Elevation (metres above sea level)
581 - 650
651 - 700
701 - 750
751 - 800
801 - 850
851 - 950
951 - 1050
1051- 1300
1301- 1895

5/11/2018 Edmonton-Calgary Corridor Groundwater Atlas - INF 140 - slidepdf.com
http://slidepdf.com/reader/full/edmonton-calgary-corridor-groundwater-atlas-inf-140 60/98
5. Hydrogeology
ERCB/AGS Information Series 140 (September 2011) • 53
verticalgradient . The ECC is too large of an
area for us to use ar rows to display the vertical
gradient, so we mapped the vertical gradient
as a series of surfaces using the information
from two successive layers. Figure 5.8 shows
the vertical gradients across the ECC basedon the differences between the 20–30 m bgs
and the 40–50 m bgs water-level surfaces. This
mapshowsuswheregroundwaterowis
mainly downward (mapped in blue) or upward
(mapped in red). A vertical gradient close to
zeromeanslittletonoverticalow.
Recharge and Discharge Areas
Recharge areas are the par ts of the landscape
where water moves from the land surface into
thegroundwater-owsystem.Rechargeareas
are typically elevated areas where the main
groundwaterowdirectionisdownward.
Chapter4discusseshowweguredouttheamount of recharge entering the
groundwater-owsystem( Figure4.8).
Dischargeareasarewheregroundwaterows
upward to the land surface. Discharge areas
are generally in low-elevation areas where
lakes, rivers or wetlands exist. Discharge can
occur in isolated areas (such as springs) or
over broad areas (such as lake and river beds).
Discharge areas, especially those in regionally
low-elevation areas, may receive a mixture
ofgroundwaterfromlocalowsystems(in
which the groundwater takes tens of years to
travel from recharge to discharge) and regional
owsystems(inwhichthegroundwatertakes
hundreds or thousands of years to travel from
recharge to discharge areas).
We mapped the recharge and dischargeareas to see where they exist in the ECC
andtounderstandthevariousowsystems
in the ECC.
How We Mapped Recharge and Discharge
Areas
We mapped recharge and discharge areas
by subtracting water-level surfaces from the
land surface. Figure 5.9 shows the difference
between the 10–20 m bgs water-level
surface and the land surface. The results of
thissubtractionshouldshowtheinuence
of recharge (green areas on the map) and
discharge (red areas on the map) associated
withlocalowsystems.
Figure 5.10 shows the difference between the
70–80 m bgs water-level surface and the land
surface. The results of this subtraction should
showtheinuenceoftherecharge(greenareas
on the map) and discharge (red areas on the
map)associatedwithregionalowsystems.
Of the mapped values, the larger, negative
numbers mean strong discharge conditions,
and the larger, positive numbers mean strong
recharge conditions.
What These Maps Show Us
The local recharge and discharge areas in
Figure 5.9 show that recharge and discharge
generally occur between adjacent high and
low land-surface elevation areas. We
compared known spring locations to thismap, and they show a strong match with the
discharge areas. Figure 5.10 suggests that
only a few areas receive discharge from
regionalowsystems.Thesetendtobe
regionally low-elevation areas.
Potential-Yield Mapping
Many people ask how much groundwater
is available at a given location when they
are trying to decide where to drill a well.
Between 1968 and 1983, the Alberta Research
Council (now Alberta Innovates–Technology
Futures) mapped the hydrogeology of most of
Alberta. One thing these maps showed washow much water would be available to a well
from the upper 300 m of geological media
for each map area. In 2009, AGS digitized
and compiled these original hydrogeological
maps.18 These maps provided estimates of how
much groundwater could be pumped out of the
sediment units by wells completed within a
given area.
Updating the Potential-Yield Map
With this atlas, we wanted to update our
understanding of the ECC’s potential water
yield by adding to our mapping process the
Spring flowing out of sediments above bedrock near Bluffton, Alberta. Note the high flow of water and the abundant vegetation where the spring flows out of the ground.

5/11/2018 Edmonton-Calgary Corridor Groundwater Atlas - INF 140 - slidepdf.com
http://slidepdf.com/reader/full/edmonton-calgary-corridor-groundwater-atlas-inf-140 61/98
5. Hydrogeology
ERCB/AGS Information Series 140 (September 2011) • 54
UV16
UV1
UV2
UV2
Edmonton
Red Deer
Calgary
Base Data Provided by Spatial Data Warehouse L td.
Tp 35
Tp 40
Tp 45
Tp 50
Tp 55
Tp 25
Tp 30
Tp 25
Tp 30
Tp 35
Tp 40
Tp 45
Tp 50
Tp 55
115° 114° 113°
51°
52°
53°
115° 114° 113° 112°
53°
52°
51°
Rg 25 W4 Rg 20 W4Rg 1 W5Rg 5 W5Rg 10 W5
Rg 15 W4Rg 20 W4Rg 25 W4Rg 5 W5Rg 10 W5
0 25 50 75 10012.5km
Vertical Gradients (difference between 20-30 and 40-50 metres below ground surface)(Figure 5.8)
Upward Flow Downward Flow
Potential for Potential for
Strong
Weak
Weak
Strong
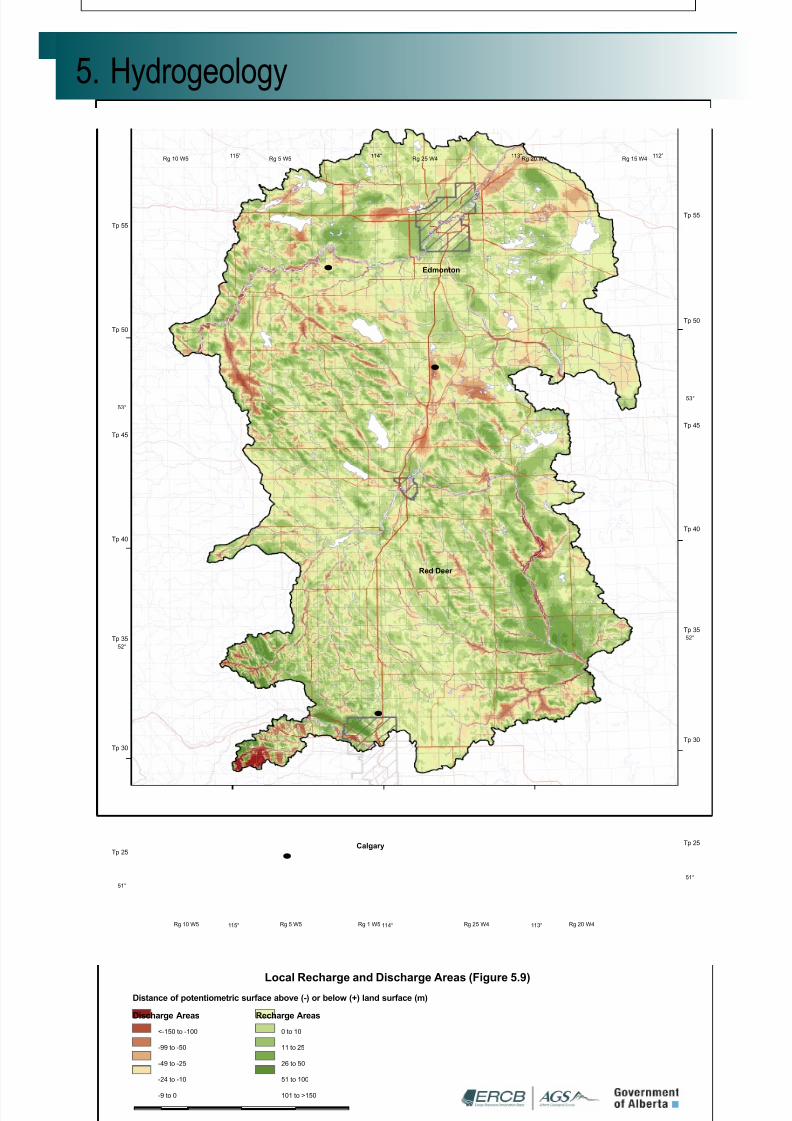
5/11/2018 Edmonton-Calgary Corridor Groundwater Atlas - INF 140 - slidepdf.com
http://slidepdf.com/reader/full/edmonton-calgary-corridor-groundwater-atlas-inf-140 62/98
5. Hydrogeology
ERCB/AGS Information Series 140 (September 2011) • 55
UV16
UV1
UV2
UV2
Edmonton
Red Deer
Calgary
Base Data Provided by Spatial Data Warehouse Ltd.
Tp 35
Tp 40
Tp 45
Tp 50
Tp 55
Tp 25
Tp 30
Tp 25
Tp 30
Tp 35
Tp 40
Tp 45
Tp 50
Tp 55
115° 114° 113°
51°
52°
53°
115° 114° 113° 112°
53°
52°
51°
Rg 25 W4 Rg 20 W4Rg 1 W5Rg 5 W5Rg 10 W5
Rg 15 W4Rg 20 W4Rg 25 W4Rg 5 W5Rg 10 W5
0 25 50 75 10012.5km
Local Recharge and Discharge Areas (Figure 5.9)Distance of potentiometric surface above (-) or below (+) land surface (m)
<-150 to -100
-99 to -50
-49 to -25
-24 to -10
-9 to 0
Discharge Areas
0 to 10
11 to 25
26 to 50
51 to 100
101 to >150
Recharge Areas

5/11/2018 Edmonton-Calgary Corridor Groundwater Atlas - INF 140 - slidepdf.com
http://slidepdf.com/reader/full/edmonton-calgary-corridor-groundwater-atlas-inf-140 63/98
5. Hydrogeology
ERCB/AGS Information Series 140 (September 2011) • 56
UV16
UV1
UV2
UV2
Edmonton
Red Deer
Calgary
Base Data Provided by Spatial Data Warehouse Ltd.
Tp 35
Tp 40
Tp 45
Tp 50
Tp 55
Tp 25
Tp 30
Tp 25
Tp 30
Tp 35
Tp 40
Tp 45
Tp 50
Tp 55
115° 114° 113°
51°
52°
53°
115° 114° 113° 112°
53°
52°
51°
Rg 25 W4 Rg 20 W4Rg 1 W5Rg 5 W5Rg 10 W5
Rg 15 W4Rg 20 W4Rg 25 W4Rg 5 W5Rg 10 W5
0 25 50 75 10012.5km
Regional Recharge and Discharge Areas (Figure 5.10)
Distance of potentiometric surface above (-) or below (+) land surface (m)
Recharge AreasDischarge Areas
-125 to -75
-74 to -50
-49 to -25
-24 to -10
-9 to 0
0 to 10
11 to 25
26 to 50
51 to 100
101 to >250

5/11/2018 Edmonton-Calgary Corridor Groundwater Atlas - INF 140 - slidepdf.com
http://slidepdf.com/reader/full/edmonton-calgary-corridor-groundwater-atlas-inf-140 64/98
5. Hydrogeology
ERCB/AGS Information Series 140 (September 2011) • 57
information now available in the Alberta
Water Well Information Database since the
completion of the Alberta Research Council’s
hydrogeological maps. The potential yield
values that we mapped are based on the
extraction rates (how much water should beremoved and how fast, based on the geological
material in which the well was completed) that
well drillers recommend after they install a
well. These values are based on the driller’s
assessment of the sediment in which the well
is completed and not necessarily on a test
to determine the rate at which water can be
pumped out over the long term. It should also
be noted that the driller’s assessment likely
does not take into account the possible effects
that neighbouring wells could have on the
long-termyieldofaspecicwell.Therefore,
we must view the results of the mapping work
aspotentialyield,notasdenitivevalues.
The resulting yield map, Figure 5.11, shows
the well driller recommended extraction rate
of groundwater in imperial gallons per minute
(igpm – a standard unit of measure in the well-
drilling industry; 1 igpm = 0.000076 m3 /s) for
the ECC. We refer to this map as the potential
water yield because these values do not
representyieldoveraspecictime,nordothey
represent the actual groundwater yield possible
for each geological formation. This map is a
guideline for the potential water yield that one
mayndintheupper100to200mofsediment
at any given location.
Groundwater Susceptibilit y
Bydenition,intrinsicaquifersusceptibility
(or groundwater susceptibility) “is a measure
of the ease with which water enters and moves
throughanaquifer,itisacharacteristicofthe
aquiferandoverlyingmaterialandhydrologicconditions, and is independent of the chemical
characteristics of the contaminant and its
sources.”16Weconsideredthisdenitionof
groundwater susceptibility when we chose to
use the DRASTIC mapping method19 to map
groundwater susceptibility in the ECC.
The DRASTIC method lets us consider the
ECC’s diverse hydrogeological conditions
in our assessment of susceptibility. It also
uses information (such as type of geological
material and measured water levels) to better
limit our assessment.
Each letter in the DRASTIC acronymidentiesanaspectofthegroundwatersystem
that is part of the susceptibility assessment.
The process includes a weighting factor to
signify the importance of each component in
calculating susceptibility (a higher weighting
factor means that that aspect has more
inuenceontheoutcomeofthecalculation).
Table 5.2 shows our data sources for each
variable, and Figure 5.12 schematically shows
what the data represent.
We made minor changes to the method to
calculateaquifersusceptibilitysothatitwould
betterreecttheECC’srangeofconditions.
Themodicationsweregenerallybasedon
the hydrological and hydrogeological work we
have done on the ECC. The DRASTIC indexvalues we obtained for each of the method’s
parameters were multiplied by their respective
weighting factors and then added to obtain the
ECC’s DRASTIC groundwater susceptibility
index. Figure 5.13 shows the mapped
DRASTIC index values.
The DRASTIC index has eight categories
as shown in Table 5.3. The DRASTIC index
values that we calculated for the ECC ranged
from38to160.Thesevaluestintothe
classicationscheme’sextremelylowto
medium range. The low index values are
primarily due to the ECC’s low recharge rates
and relatively deep water tables. The mediumDRASTIC index values suggest a more humid
climate or areas with geological formations of
higher permeability.
Aquifers in the ECC
To fur ther our assessment of the regional
hydrogeology, we highlighted the types of
aquifersandtheirprobablelocationsin
the ECC.
Asmentioned,aquifersaregeological
layers that are water-saturated, have high
permeabilitiesandcanyieldlargequantities
Table 5.2 Descriptio n of the DRASTIC parameters.*
Letter Parameter Weighting Factor Data Source
D Depth to ground water 5 Water-table surface (Figure 5.5)
R Net Recharge 4Groundwater recharge values from the
water-budget analysis (Figure 4.8)
A Aquifer materials 3
Types of materials present in the
subsurface as reported by well drillers
for wells in the Alberta Water Well
Information Database
S Soil materials 2
Descriptions of soils found in the
AgraSID soils database20 released by
Alberta Agriculture, Food and Rural
Development, (now Agriculture and
Rural Development)
T Topography 1Land-surface elevation (as seen on
Figure 1.1)
I Impact of vadose zone 5
Types of materials in the subsurface
above the water table, as reported by well
drillers for wells in the Alberta Water Well
Information Database
C HydraulicConductivity 3
Values from published tables summarizing
the rate at which water moves through the
types of materials found in the ECC
* This assessment was done for a regional pro ject. Local-scale assessments can use Figur e 5.13 generated from
these data as a starting point for further site-specific mapping to determine risks to groundwater resources.

5/11/2018 Edmonton-Calgary Corridor Groundwater Atlas - INF 140 - slidepdf.com
http://slidepdf.com/reader/full/edmonton-calgary-corridor-groundwater-atlas-inf-140 65/98
5. Hydrogeology
ERCB/AGS Information Series 140 (September 2011) • 58
UV16
UV1
UV2
UV2
Edmonton
Red Deer
Calgary
Base Data Providedby SpatialDataWarehouse Ltd.
Tp35
Tp40
Tp45
Tp50
Tp55
Tp25
Tp30
Tp25
Tp30
Tp35
Tp40
Tp45
Tp50
Tp55
115° 114° 113°
51°
52°
53°
115° 114° 113° 112°
53°
52°
51°
Rg 25 W4 Rg 20 W4Rg1W5Rg5W5Rg10W5
Rg15W4Rg20W4Rg25W4Rg5W5Rg10W5
0 25 50 75 10012.5km
Potential Groundwater Yield (Figure 5.11)
Recommended Extraction Rate(imperial gallons per minute)
1.5- 5
6 - 10
11- 15
16-25
26-42

5/11/2018 Edmonton-Calgary Corridor Groundwater Atlas - INF 140 - slidepdf.com
http://slidepdf.com/reader/full/edmonton-calgary-corridor-groundwater-atlas-inf-140 66/98
5. Hydrogeology
ERCB/AGS Information Series 140 (September 2011) • 59
of water to wells or springs. A geological layer
thatformsanaquifercanbemadeupofrock
or loose sediment, like gravel, sand, silt or
combinations of these materials.
Therearetwogeneraltypesofaquifersin the ECC, unconnedaquifers andconnedaquifers.
Unconnedaquifersarenearthelandsurface,
andthewatertabledenesthetopsofthese
aquifers.Theyareinthesedimentsabove
bedrock, in bedrock units or in a combination
of sediments above bedrock and bedrock units,
depending on how the materials are stacked.
Connedaquifersarepermeable,saturated,
geological layers found between other
geologicallayersthatimpedetheowof
water through them. As mentioned, geological
layersthatimpedetheowofwaterarecalled
aquitards.Waterdoesowthroughaquitards, butthemovementisveryslow,soaquitardsare
unabletotransmitwaterinsufcientquantities
to allow them to produce any reliable,
substantial volumes of water over time.
How We Mapped Potential Aquifers
WeusedAGSmapsofthesurcialgeology
and known sand and gravel deposits,
geological data from well drillers and oil
and gas wells, and airborne geophysics to
mapwherepotentialaquiferscouldbein
the ECC. The airborne geophysics provided
uswithnewdatatohelpusmapaquifer
locations. The geophysical survey measures
the differences in the electrical properties of the various geological layers. These differences
can be interpreted by geologists and used
to determine which layers are mainly sand
instead of clay. This combination of geological
and geophysical information allows us to better
mapaquifers.
Potential Unconned Aquifers
Figure 5.14 shows the locations near the land
surface where coarse-grained materials, like
sand and gravel, have been mapped by AGS
and the results of the airborne geophysics
for the upper 10 m of the subsurface. Several
Table 5.3 DRASTIC index values.
Extremely Low Less than 79
Very Low 80–99
Low 100–119
Medium-Low 120–139
Medium 140–159
High 160–179
Very High 180–199
Extremely High 200+
areas show overlaps between where coarse-
grained materials are mapped and where the
geophysical results suggest coarse-grained
materials exist. The areas of overlap show us
wherewecanfocusfutureworktoconrm
the extent of near-surface, coarse-grainedmaterials and if they contain water.
Depending on the thickness of near-surface,
coarse-grained materials and the water-table
depth, these areas of coarse-grained materials
couldmakeupthebestunconnedaquifers
in the ECC. Alberta Geological Survey is
currently working on mapping the major
aquifersacrossAlbertaandwilltakeinto
account the information from our ECC work
as we continue this province-wide work. The
natureofthesepotentialunconnedaquifers
will be determined once the mapping work
is completed.
There are other areas where geophysical
signatures suggest that coarse-grained
materials may be present. As we look at other
depth slices and at what we know geologically
about the deeper depths, we can decide if
these other areas could be additional buildups
of near-surface, coarse-grained sediment, or
deeper buildups of coarser-grained sediment.
Figure 5.12. Schematic showingwhich part of the borehole or
water-well lithological logswas used for the D (Depth togroundwater), A (Aquifer media),
S (Soil media or the top metreof material), I (Impact of thevadose zone), and C (hydraulic
Conductivity of aquifer media)parameters used for theDRASTIC Intrinsic Aquifer
Susceptibility analysis. The otherparameters in the DRASTICacronym are T (Topographic
slope) and R (groundwaterRecharge rate), which do not relyon borehole information.

5/11/2018 Edmonton-Calgary Corridor Groundwater Atlas - INF 140 - slidepdf.com
http://slidepdf.com/reader/full/edmonton-calgary-corridor-groundwater-atlas-inf-140 67/98
5. Hydrogeology
ERCB/AGS Information Series 140 (September 2011) • 60
UV16
UV1
UV2
UV2
Edmonton
Red Deer
Calgary
Base Data Providedby SpatialDataWarehouse Ltd.
Tp35
Tp40
Tp45
Tp50
Tp55
Tp25
Tp30
Tp25
Tp30
Tp35
Tp40
Tp45
Tp50
Tp55
115° 114° 113°
51°
52°
53°
115° 114° 113° 112°
53°
52°
51°
Rg 25 W4 Rg 20 W4Rg1W5Rg5W5Rg10W5
Rg15W4Rg20W4Rg25W4Rg5W5Rg10W5
0 25 50 75 10012.5km
Groundwater Susceptibility (Figure 5.13)
DRASTIC Index Values
100 - 119 L ow
120 -139 MediumLow
140 -159 Medium
< 79 Extremely Low
80 - 99 Very Low
>160 High

5/11/2018 Edmonton-Calgary Corridor Groundwater Atlas - INF 140 - slidepdf.com
http://slidepdf.com/reader/full/edmonton-calgary-corridor-groundwater-atlas-inf-140 68/98
5. Hydrogeology
ERCB/AGS Information Series 140 (September 2011) • 61
UV16
UV1
UV2
UV2
Edmonton
Red Deer
Calgary
Base Data Provided by Spatial Data Warehouse Ltd.
Tp 35
Tp 40
Tp 45
Tp 50
Tp 55
Tp 25
Tp 30
Tp 25
Tp 30
Tp 35
Tp 40
Tp 45
Tp 50
Tp 55
115° 114° 113°
51°
52°
53°
115° 114° 113° 112°
53°
52°
51°
Rg 25 W4 Rg 20 W4Rg 1 W5Rg 5 W5Rg 10 W5
Rg 15 W4Rg 20 W4Rg 25 W4Rg 5 W5Rg 10 W5
0 25 50 75 10012.5km
Coarse-grained material
Geophysics near Land Surface
High Resistivity
Low Resistivity
Geophysics and Mapped Coarse-Grained Materials near the Land Surface (Figure 5.14)

5/11/2018 Edmonton-Calgary Corridor Groundwater Atlas - INF 140 - slidepdf.com
http://slidepdf.com/reader/full/edmonton-calgary-corridor-groundwater-atlas-inf-140 69/98
5. Hydrogeology
ERCB/AGS Information Series 140 (September 2011) • 62
Potential Conned Aquifers in the Sediments above Bedrock
Themostextensiveconnedaquifersinthesedimentsabovebedrock
areassociatedwithburied-valleyaquifersandarefoundinchannel
complexes.WeidentiedthreechannelcomplexesinChapter2:
the Beverly-Onoway complex, the Red Deer River complex and the
Drumheller complex (Figure 5.15). Just like current r iver systems, these
ancient systems can contain substantial buildup of sand and gravel along
the lengths of the channels. Filled with water, these deposits can yield
large amounts of groundwater to wells. Figure 5.15 shows where these
channelsappeartohavethehighestpotentialtobeaquifersbasedonthe
mapping work and the geophysical surveys.
Anotherpotentialconned-aquifersysteminthesedimentsabove
bedrock is in the Cooking Lake area. Figure 5.16 shows the buildup
of coarser grained materials at different depths within this area, which
indicatesthatthepotentialaquifersinthisareaarestacked.Wecan
use the geophysical survey results to clarify the extent of these
deposits and show us where to focus any future work to map the
extent of these systems.
Thereareotherpotentialaquiferswithinthesedimentsabovebedrock,
but they are smaller than the buried-valley deposits and those near
Cooking Lake. They may form important sources of water to local
users,buttheirsizemakesthemminoraquifersinthecontextofthe
larger ECC.
Potential Bedrock Aquifers
Based on our understanding of the bedrock units in the ECC (see
Chapter2),oneunithasthehighestpotentialtohostaquifersystems:
the Paskapoo Formation. We mapped the extent and thickness of the
Paskapoo in the ECC and looked at where the coarser grained materials
versusthenergrainedmaterialsexistandhowthesematerialsrelate
to one another. By mapping where the coarser grained materials occur,
we get a sense of where the Paskapoo Formation has the potential
to produce the most water. Figure 5.17 shows where the coarser
grained parts of the Paskapoo Formation are within 150 m of the
land surface. These are the areas where the Paskapoo Formation has
ahigherpotentialforhostingaquifersthatwouldmostcommonlybe
used by domestic and agricultural users.
The other bedrock formations in the ECC are used as sources of
groundwater but generally for low-volume household or agricultural
needs.Theseformationsgenerallyhavenergrainedrocksthan
those in the Paskapoo Formation. In the ECC, they do
nottypicallyhostlarge,regionalaquifersthatproducelarge
volumes of groundwater.
Figure 5.15. Location of buried channel complexes in the ECC and the outlines of the potential conned aquifers associated with the buried channels. A) Bedrock elevation (metres above
sea level) with the location of the buried channel complexes in the ECC. B) Potential conned aquifers in the sediments above bedrock, as outlined by the mapped, coarse-grained
material. These boundaries were determined using lithologs and the geophysical results 20 metres below ground surface. C) Potential conned aquifers that lie on the bedrock surface, as
outlined by the mapped, coarse-grained material. These boundaries were determined using lithologs and the geophysical results 30 metres below ground surface.
q
A B C

5/11/2018 Edmonton-Calgary Corridor Groundwater Atlas - INF 140 - slidepdf.com
http://slidepdf.com/reader/full/edmonton-calgary-corridor-groundwater-atlas-inf-140 70/98
5. Hydrogeology
ERCB/AGS Information Series 140 (September 2011) • 63
Figure 5.16. Potential conned aquifers for the Cooking Lake moraine as mapped from lithologs (a to c) or interpreted from the geophysics (d). All gures show sediments
that have been mapped as having medium to high sediment permeability.

5/11/2018 Edmonton-Calgary Corridor Groundwater Atlas - INF 140 - slidepdf.com
http://slidepdf.com/reader/full/edmonton-calgary-corridor-groundwater-atlas-inf-140 71/98
5. Hydrogeology
ERCB/AGS Information Series 140 (September 2011) • 64
Figure 5.17. Sandiness of the Paskapoo Formation from 0–150 metres below ground surface. The map shows areas that have 55% or greater sand content. These sandy areas represent the
potential aquifers in the upper 0–150 metres of the Paskapoo Formation. The surface is DEM -150 metres and the yellow line is the boundary of the Paskapoo Formation.

5/11/2018 Edmonton-Calgary Corridor Groundwater Atlas - INF 140 - slidepdf.com
http://slidepdf.com/reader/full/edmonton-calgary-corridor-groundwater-atlas-inf-140 72/98
ERCB/AGS Information Series 140 (September 2011) • 65
6. Hydrochemistry
What is Hydrochemistry and Why Did We Study It?
Hydrochemical Mapping
Hydrochemistry Maps
Sediments above Bedrock
Paskapoo Formation
Horseshoe Canyon Formation
Bearpaw Formation
Belly River Group

5/11/2018 Edmonton-Calgary Corridor Groundwater Atlas - INF 140 - slidepdf.com
http://slidepdf.com/reader/full/edmonton-calgary-corridor-groundwater-atlas-inf-140 73/98
ERCB/AGS Information Series 140 (September 2011) • 66
6. Hydrochemistry
Measuring the water level using a water-level tape and collecting groundwater
samples from a well in the central portion of the ECC.
What is Hydrochemistry and Why Did We Study It?
Hydrochemistry is the study of chemical reactions and conditions in
groundwater. Water interacts with the underground environment by dissolving
solids and gases or by forming solids, causing changes to the chemical
composition of the water. When we analyze and interpret groundwater’s
chemistry, we learn
• from where the water came;
• through which type(s) of materials it has travelled and for how long; and
• if it has mixed with other types of water.
Hydrochemistry helps us complete the groundwater model of the ECC by
llingindetailsabouthowgroundwatermovesthroughtheunderground
system. Knowledge of groundwater chemistry is also important when we
want to decide which groundwater is suitable for drinking, agriculture or
industrial use.
General Principles of Hydrochemistry
As mentioned above, many factors affect the chemical composition of
groundwater.Therstcontrolongroundwaterchemistryisthesource
of the water in the groundwater system. Water that makes up the shallow
groundwater system largely comes from precipitation that falls on the land
surface as rain or snow. The properties of rain and snow can dissolve and
alter the geological materials they contact as they move from the land surface
down to the water table. These react ions change the chemistry of the water
and the geological materials. Once water that recharges the groundwater
system moves below the water table, it mixes with the existing water in the
subsurface, making mixing an important consideration as we evaluate
water chemistry.
Dissolution reactions continue to occur below the water table, but increasingly,
other types of water-rock interactions happen as water moves from its
recharge zone toward its discharge zone. Depending on the amount of cer tain
Creative water-well construction. Wells we sampled
in the ECC came in all shapes and sizes. In this
case, the well owner constructed the pump with
parts on hand.
The Alberta Geological Survey sampling team visited
a site in conjunction with Alberta Environment. The
equipment inserted into the well includes a submersible
pump to conduct a pump test, a water-level tape to
measure the water level and sampling tubing to collect a
water sample.
Landon Wood (Alberta Geological Survey summer
student) processing water samples collected in
the central portion of the ECC. Water samples
are collected for different types of analysis. The
collection protocols for each sample type are carefully
developed to avoid contamination during sampling.
Landon is wearing gloves to not contaminate the
sample, and the sampling materials are relatively inert
to not contaminate the sample during collection.

5/11/2018 Edmonton-Calgary Corridor Groundwater Atlas - INF 140 - slidepdf.com
http://slidepdf.com/reader/full/edmonton-calgary-corridor-groundwater-atlas-inf-140 74/98
ERCB/AGS Information Series 140 (September 2011) • 67
6. Hydrochemistry
Spring discharge in Big Hill Springs Provincial Park,
near Cochrane, Alberta. Groundwater samples were
collected from wells and springs within the ECC.
Discharge from springs can be substantial, as we see
here, or form just a trickle.
Measuring the water level in a well prior to collecting
groundwater samples. The water-level tape is lowered
into the well until it touches the water. The depth is
determined using the measurement scale on the tape.
Typical groundwater sampling set up. Prior to
sampling, all bottles are labelled, the equipment is
connected to a sampling point, or lowered down the
well, and any equipment that measures the physical or
chemical properties of the water are calibrated.
Deciding Which Data to Use
A groundwater analysis shows the chemical
composition of groundwater at a par ticular
time, place and depth. We chose the most
suitable of the 20 000 available analyses
by considering
• Age: We chose only analyses performed
after 1980 because we wanted information
about relatively recent groundwater
conditions:
• Completion length: Wells are pipes with
slots or perforations cut into the
well-casing walls, or with separate
lengthsofpipewithnelyslotted
intervals attached to the well casing, that
are installed (referred to as completions)
at the depth the well driller thinks
groundwaterwillowintothewell.
Werequiredsamplesfromwellswith
completions 15 m or shorter in length tondsamplesfromasinglegeologicallayer.
If a water sample comes from multiple
geological layers, the groundwater from
the multiple layers mixes and gives us less
accurate chemistry data.
• Complete dataset and charge balanced:
For mapping purposes, we used only
analyses with a selected set of inorganic
chemical parameters. We then performed
aquality-controlassessment,calleda
charge balance, on the analyses. The
elements dissolved in the water, and things
like pH and water temperature, instead of
dissolving material, material may be formed,
or certain elements dissolved in the water may
react with the geological material and take
the place of elements that were part of thegeological material. These previously attached
elements are then released from the geological
material and dissolve in the water. The amount
of dissolved material in the water typically
increasesalongtheowpathandwithdepth,
and the types and amounts of constituents
typically change as well.
What We Studied in the ECC
This atlas contains maps showing total
dissolved solids and hardness, because these
twochemicalparametersoftenletusquickly
decide which groundwater is suitable for which
use (such as drinking instead of agriculture).
HealthCanada’swater-qualityguidelines21
provide ranges of chemical concentrations it
considers acceptable for different uses of water.
Totaldissolvedsolidsexpressthequantity
of dissolved minerals in a sample of water.
Hardness is a property of water that causes
residue to form when the water is used with
soap or forms a deposit when water evaporates.
Water hardness is determined by a combination
of calcium and magnesium concentrations
but is expressed as hardness as CaCO3
(calcium carbonate).
We looked at how groundwater chemistry
relates to different geological units, the
sediments above bedrock and the bedrock
units. We used this approach because
the characteristics of the materials that
groundwaterowsthroughisoneofthe primaryinuencesongroundwaterchemistry.
Hydrochemical Mapping
Data Sources
The AGS gathered more than 20 000 analyses
of groundwater chemistry within the ECC.
These analyses came from several sources:
• Alberta Environment’s Alberta Water Well
Information Database: These are samples
that
» well drillers collected when they
installed wells; and
» well owners submitted to provincial
laboratories for analysis.
• Alberta Research Council (now Alberta
Innovates – Technology Futures): These
are samples Alberta Research Council
collected from water wells or from wells
it drilled.
• Energy Resources Conservation Board
and Alberta Geological Survey: These
are samples AGS collected from Alberta
Environment observation wells, water
wells or wells that AGS drilled.

5/11/2018 Edmonton-Calgary Corridor Groundwater Atlas - INF 140 - slidepdf.com
http://slidepdf.com/reader/full/edmonton-calgary-corridor-groundwater-atlas-inf-140 75/98
ERCB/AGS Information Series 140 (September 2011) • 68
6. Hydrochemistry
Different samples are collected at each site for
different types of analyses. Each analysis has different
requirements, including the type of bottle used to hold
the sample. This photo shows the various types of
bottles used in sampling work.
Flowing well in the central ECC encountered during
sampling. Some wells, like this one, do not require us
to connect our sampling equipment to the water well’s
plumbing system. The natural groundwater in the area
has raised the water level above the top of the casing.
Collecting a water sample from a well with a manifold
(upper right). Because of the types of analyses
performed on the groundwater samples we collect, it
is important for the sample to be collected prior to it
entering any pressure tank or treatment system. In this
case, the manifold has a connection point prior to the
groundwater from the well entering a pressure tank.
charge-balance calculation lets us know
if the electrical contributions of cations
(positively charged parameters) and
anions (negatively charged parameters)
arenearlyequalinthewatersample.In
theory, cations and anions must balancein all solutions. Therefore, to account for
reasonable errors in analysis practices, we
accepted charge balances that were within
+/- 5% of neutral.
• Total dissolved solids compared to
the base of groundwater protection:
The Alberta Government considers
groundwater with total dissolved solids of
more than 4000 milligrams per litre (mg/L)
to be saline (salty water). We know most
wells in the ECC are screened in intervals
that tend to be categorized as non-saline.
When we looked at the overall percentage
of water samples with a total dissolved
solidsconcentrationequaltoorgreaterthan 4000 mg/L, we saw that only a very
low overall percentage of the samples fell
into the saline category. Thus, because we
are mapping the overall characteristics of
groundwater chemistry, and not isolated
anomalies, we decided not to use analyses
that had a total dissolved solids greater
than 4000 mg/L.
After applying all of these criteria to the data,
we had 4835 analyses to map.
How We Mapped the Hydrochemistry
OurrststepinmappingtheECC’s
hydrochemistry was to choose from which of
the ECC’s geological units each analysis came.
To do this, we considered well locations and
the depths of the well screens, and we usedthe geological model that we had constructed
previously. Figure 6.1 shows where wells are in
relation to each bedrock unit. After all of the
data were examined, we found that few data
were available to characterize water chemistry
in the Scollard. Therefore, we chose not to
include descriptions of its water chemistry in
the atlas. Figure 6.2 shows where wells are in
the sediments above bedrock.
After we split the analyses based on which
geological unit they came from, we analyzed
each set of chemical constituents. The results
of the analysis gave us an initial picture of
the distribution of concentrations of eachchemical constituent. Alberta Geological
Survey hydrogeologists then adjusted this
representation manually to map the ranges of
concentrations for each chemical constituent in
each geological formation. More information
on this process will be available from AGS in
an upcoming report.
Hydrochemistry Maps
This atlas shows total dissolved solids
and hardness as calcium carbonate for the
sediments above bedrock and for the Paskapoo,
Horseshoe Canyon and Bearpaw formations
and the Belly River Group.
Sediments above Bedrock
We used the sediment thickness map
(Figure 3.2) to determine where the sediment
was mostly thicker than 10 m, and we drew
boundaries around these areas. We then
mapped the groundwater chemistry within
these boundaries. Figure 6.3 shows the
total dissolved solids concentration ranges,
and Figure 6.4 shows the hardness
concentration ranges.
Total dissolved solids concentrations are
generally less than 1500 mg/L except incertain areas south and east of Edmonton, and
in the southernmost portion of the study area.
Hardness values are greatest near Edmonton
and in distinct areas along the eastern edge of
the study area. According to Health Canada,22
the hardness values shown on Figure 6.4 places
the water in the very hard category.

5/11/2018 Edmonton-Calgary Corridor Groundwater Atlas - INF 140 - slidepdf.com
http://slidepdf.com/reader/full/edmonton-calgary-corridor-groundwater-atlas-inf-140 76/98
ERCB/AGS Information Series 140 (September 2011) • 69
6. Hydrochemistry
UV16
UV1
UV2
UV2
Edmonton
Red Deer
Calgary
Base Data Provided by SpatialDataWarehouse Ltd.
Tp35
Tp40
Tp45
Tp50
Tp55
Tp25
Tp30
Tp25
Tp30
Tp35
Tp40
Tp45
Tp50
Tp55
115° 114° 113°
51°
52°
53°
115° 114° 113° 112°
53°
52°
51°
Rg 25 W4 Rg 20 W4Rg1W5R g5W5Rg10W5
Rg15W4Rg20W4Rg25W4Rg5 W5Rg10W5
0 25 50 75 10012.5km
Locations of Wells Completed in Bedrock (Figure 6.1)
! Paskapoo Wells
" Horseshoe Canyon Wells
G Belly River Wells
# Bearpaw WellsBearpaw Formation
Belly River Formation
Horseshoe Canyon Formation
Paskapoo Formation
Scollard Formation

5/11/2018 Edmonton-Calgary Corridor Groundwater Atlas - INF 140 - slidepdf.com
http://slidepdf.com/reader/full/edmonton-calgary-corridor-groundwater-atlas-inf-140 77/98
ERCB/AGS Information Series 140 (September 2011) • 70
6. Hydrochemistry
UV16
UV1
UV2
UV2
Edmonton
Red Deer
Calgary
Base Data Provided by Spatial Data Warehouse Ltd.
Tp 35
Tp 40
Tp 45
Tp 50
Tp 55
Tp 25
Tp 30
Tp 25
Tp 30
Tp 35
Tp 40
Tp 45
Tp 50
Tp 55
Locations of Wells Completed in the Sediments above Bedrock (Figure 6.2)
115° 114° 113°
51°
52°
53°
115° 114° 113° 112°
53°
52°
51°
Rg 25 W4 Rg 20 W4Rg 1 W5Rg 5 W5Rg 10 W5
Rg 15 W4Rg 20 W4Rg 25 W4Rg 5 W5Rg 10 W5
Well
Sediment >10 m thick
0 25 50 75 10012.5km

5/11/2018 Edmonton-Calgary Corridor Groundwater Atlas - INF 140 - slidepdf.com
http://slidepdf.com/reader/full/edmonton-calgary-corridor-groundwater-atlas-inf-140 78/98
ERCB/AGS Information Series 140 (September 2011) • 71
6. Hydrochemistry
UV16
UV1
UV2
UV2
Edmonton
Red Deer
Calgary
Base Data Provided by SpatialDataWarehouse Ltd.
Tp35
Tp40
Tp45
Tp50
Tp55
Tp25
Tp30
Tp25
Tp30
Tp35
Tp40
Tp45
Tp50
Tp55
Total Dissolved Solids Concentrationin the Sediments above Bedrock (Figure 6.3)
115° 114° 113°
51°
52°
53°
115° 114° 113° 112°
53°
52°
51°
Rg 25 W4 Rg 20 W4R g1W5R g5W5Rg10W5
Rg15W4Rg20W4Rg25W4R g5W5Rg10W5
Total Dissolved Solids (mg/L)
<1000
1000.1- 1500
1500.1- 2000
>2000
0 25 50 75 10012.5km

5/11/2018 Edmonton-Calgary Corridor Groundwater Atlas - INF 140 - slidepdf.com
http://slidepdf.com/reader/full/edmonton-calgary-corridor-groundwater-atlas-inf-140 79/98
ERCB/AGS Information Series 140 (September 2011) • 72
6. Hydrochemistry
UV16
UV1
UV2
UV2
Edmonton
Red Deer
Calgary
Base DataProvided by SpatialData WarehouseLtd.
Tp35
Tp40
Tp45
Tp50
Tp55
Tp25
Tp30
Tp25
Tp30
Tp35
Tp40
Tp45
Tp50
Tp55
Hardness (as Calcium Carbonate) Concentrationin the Sediments above Bedrock (Figure 6.4)
115° 114° 113°
51°
52°
53°
115° 114° 113° 112°
53°
52°
51°
Rg 25 W4 Rg 20 W4R g1W5R g5W5Rg10W5
Rg15W4Rg20W4Rg25W4R g5W5Rg10W5
Hardness as Calcium Carbonate (mg/L)
<250
250.1- 500
>500
0 25 50 75 10012.5km

5/11/2018 Edmonton-Calgary Corridor Groundwater Atlas - INF 140 - slidepdf.com
http://slidepdf.com/reader/full/edmonton-calgary-corridor-groundwater-atlas-inf-140 80/98
ERCB/AGS Information Series 140 (September 2011) • 73
6. Hydrochemistry
As we read in Section 3, glaciers deposited
the majority of the unconsolidated sediments
above bedrock in the area. The values of
the total dissolved solids concentrations and
hardness are in the range typical for areas
affected by glaciation.23
Specicreasonsforthe trends we see are related to the chemical
composition of the geological materials that
thewaterowsthrough,aswellasthegrain
size of the sediments, which affects how easily
water can move through the sediments. As a
general principle, the longer the water remains
in contact with geological materials, the more
the water can react with those materials,
changing the composition of the water and of
the geological materials in the process.
Paskapoo Formation
WedenedthePaskapooFormation’swestern
boundary as the edge of the ECC and thedeformationbelt.Wedenedtheeastern
boundary as the Paskapoo subcrop edge.
Figure 6.5 shows the total dissolved solids
concentration ranges in Paskapoo groundwater,
and Figure 6.6 shows the hardness
concentration ranges.
Total dissolved solids concentrations are lowest
toward the north-central and western portions
of where the Paskapoo Formation subcrops,
Sheila Stewart, Alberta Geological Survey, taking a groundwater sample from a well
equipped with a hand pump. Although we encountered many different well construction
types during the sampling program in the central portion of the ECC, few had hand pumps.
Sophisticated, high-capacity, water-distribution system.
Groundwater sampling in the central ECC from a well
with a hand pump.
Ingenious design for a well. The pump mechanism
uses many different components, including a wheel
rim, a tire and a small engine. On the left side, you
can see the pump’s outflow in the white bucket.

5/11/2018 Edmonton-Calgary Corridor Groundwater Atlas - INF 140 - slidepdf.com
http://slidepdf.com/reader/full/edmonton-calgary-corridor-groundwater-atlas-inf-140 81/98
ERCB/AGS Information Series 140 (September 2011) • 74
6. Hydrochemistry
with the concentrations increasing toward the
southeast.GroundwaterowinthePaskapoo
Formation is generally away from the Foothills
toward the subcrop edge.
Figure 6.5 shows how total dissolved solidsconcentrationsincreasealongtheowpath.
Furthermore, in many places, the Paskapoo
Formation total dissolved solids concentrations
are less than those in the sediments above
bedrock (Figure 6.3).
As we read in Sections 2 and 3, the
composition of the Paskapoo Formation is
quitedifferentfromthatofthesediments
overlying bedrock. Unlike the sediments above
bedrock, the components of the Paskapoo
Formation do not generally react to any great
extent with water, so less are dissolved as
water moves through the Paskapoo Formation
as compared to water moving through thesediments above bedrock. The result is a lower
total dissolved solids concentration in many
parts of the Paskapoo Formation.
Water in the Paskapoo Formation is medium
hard to very hard based on Health Canada
documents.22 Hardness is lowest in the central
portions of the Paskapoo Formation subcrop
area, increasing toward the subcrop edge and
the Foothills. Hardness values in the Paskapoo
Formation are generally less than those in the
sediments above bedrock. As with the total
dissolved solids concentrations, once again,
the composition of the Paskapoo Formation
compared to that of the sediments above
bedrock is the likely reason for the differences.
Horseshoe Canyon Formation
TodenetheHorseshoeCanyonFormation’s
western boundary, we selected an area that
would include all of the data, as well as provide
abitofabuffertothewest.Wedenedthe
eastern boundary as the subcrop edge and
ECC boundary. We had enough data in the
Horseshoe Canyon to split the data into two
categories: wells completed between 0–50 m
below land surface and wells completed
between 51–100 m below the land surface.
For the 0–50 m interval, Figure 6.7 shows the
total dissolved solids concentration ranges, andFigure 6.8 shows the hardness concentration
ranges. For the 51–100 m interval, Figure 6.9
shows the total dissolved solids concentration
ranges, and Figure 6.10 shows the hardness
concentration ranges.
When comparing the total dissolved solids
concentration maps, there appears to be a
general trend of increasing total dissolved
solids concentrations with depth. This is
because water that is deeper below the surface
has typically been in the ground longer than
water closer to the surface. Therefore, the
deeper water has had more time to react with
geological materials th rough which it
is moving.
We also noticed that the total dissolved solids
concentrations are greater in the Horseshoe
Canyon Formation than in the Paskapoo
Formation. As we read in Section 2,
the composition and grain size in the
Horseshoe Canyon Formation are generally
different from the composition and grain size
in the Paskapoo Formation. The Horseshoe
CanyonFormationisnergrainedandhas
more variability in the types of sediments from
which it is made. This means that water moves
more slowly through the Horseshoe Canyon
and can react with more types of materials
over a longer time, resulting in greater total
dissolved solids concentrations.
Water in the shallower portions of the
Horseshoe Canyon Formation is of medium
hardness to very hard. The water in the deeper
interval of the Horseshoe Canyon that we
examined is soft in many areas but very hard
in the Edmonton area. A likely reason for
these changes with depth is the composition
of the Horseshoe Canyon Formation and the
chemical reactions that take place as water
moves through the rocks of the formation. The
Alyssa Barker, Alberta Environment, collecting
groundwater samples from a well in the central part of
the ECC. Whereas the sampling protocols remained
the same for each site, the geology of potential
aquifers would change. The effects of the geological
and hydrogeological settings on the hydrochemistry
were key questions asked at the outset of the
program. Answering these question dictated the
details of the sampling program.
Hira Moktan, Alberta Environment, taking field notes
during sampling. The information collected at each site
includes site location, site description, physical and
chemical measurements (like groundwater pH), and
quality control-quality assurance details.
Upward groundwater discharge at a spring in the
central ECC. The upward discharge is forcing
sediment to become suspended in the water.
The sediment was fine-grained, requiring careful
processing of the sample to remove all of it.

5/11/2018 Edmonton-Calgary Corridor Groundwater Atlas - INF 140 - slidepdf.com
http://slidepdf.com/reader/full/edmonton-calgary-corridor-groundwater-atlas-inf-140 82/98
ERCB/AGS Information Series 140 (September 2011) • 75
6. Hydrochemistry
UV16
UV1
UV2
UV2
Edmonton
Red Deer
Calgary
Base DataProvidedby SpatialData Warehouse Ltd.
Tp35
Tp40
Tp45
Tp50
Tp55
Tp25
Tp30
Tp25
Tp30
Tp35
Tp40
Tp45
Tp50
Tp55
Total Dissolved Solids Concentrationin the Paskapoo Formation (Figure 6.5)
115° 114° 113°
51°
52°
53°
115° 114° 113° 112°
53°
52°
51°
Rg 25 W4 Rg 20 W4R g1W5Rg5 W5Rg10W5
Rg15W4Rg20W4Rg25W4R g5W5Rg10W5
Total Dissolved Solids (mg/L)
<500
500.1- 1000
1000.1 - 1500
>1500
0 25 50 75 10012.5km

5/11/2018 Edmonton-Calgary Corridor Groundwater Atlas - INF 140 - slidepdf.com
http://slidepdf.com/reader/full/edmonton-calgary-corridor-groundwater-atlas-inf-140 83/98
ERCB/AGS Information Series 140 (September 2011) • 76
6. Hydrochemistry
UV16
UV1
UV2
UV2
Edmonton
Red Deer
Calgary
Base DataProvided by SpatialData WarehouseLtd.
Tp35
Tp40
Tp45
Tp50
Tp55
Tp25
Tp30
Tp25
Tp30
Tp35
Tp40
Tp45
Tp50
Tp55
Hardness (as Calcium Carbonate) Concentrationin the Paskapoo Formation (Figure 6.6)
115° 114° 113°
51°
52°
53°
115° 114° 113° 112°
53°
52°
51°
Rg 25 W4 Rg 20 W4R g1W5R g5W5Rg10W5
Rg15W4Rg20W4Rg25W4R g5W5Rg10W5
Hardness as Calcium Carbonate (mg/L)
<150
150.1- 250
>250
0 25 50 75 10012.5km

5/11/2018 Edmonton-Calgary Corridor Groundwater Atlas - INF 140 - slidepdf.com
http://slidepdf.com/reader/full/edmonton-calgary-corridor-groundwater-atlas-inf-140 84/98
ERCB/AGS Information Series 140 (September 2011) • 77
6. Hydrochemistry
UV16
UV1
UV2
UV2
Edmonton
Red Deer
Calgary
Base DataProvidedby SpatialData Warehouse Ltd.
Tp35
Tp40
Tp45
Tp50
Tp55
Tp25
Tp30
Tp25
Tp30
Tp35
Tp40
Tp45
Tp50
Tp55
Total Dissolved Solids Concentrationin the Horseshoe Canyon Formation (0-50 m bgs) (Figure 6.7)
115° 114° 113°
51°
52°
53°
115° 114° 113° 112°
53°
52°
51°
Rg 25 W4 Rg 20 W4R g1W5Rg5 W5Rg10W5
Rg15W4Rg20W4Rg25W4R g5W5Rg10W5
Total Dissolved Solids (mg/L)
<1000
1000.1 - 1500
1500.1 - 2000
>2000
0 25 50 75 10012.5km

5/11/2018 Edmonton-Calgary Corridor Groundwater Atlas - INF 140 - slidepdf.com
http://slidepdf.com/reader/full/edmonton-calgary-corridor-groundwater-atlas-inf-140 85/98
ERCB/AGS Information Series 140 (September 2011) • 78
6. Hydrochemistry
UV16
UV1
UV2
UV2
Edmonton
Red Deer
Calgary
Base DataProvided by SpatialData WarehouseLtd.
Tp35
Tp40
Tp45
Tp50
Tp55
Tp25
Tp30
Tp25
Tp30
Tp35
Tp40
Tp45
Tp50
Tp55
Hardness (as Calcium Carbonate) Concentrationin the Horseshoe Canyon Formation (0-50 m bgs) (Figure 6.8)
115° 114° 113°
51°
52°
53°
115° 114° 113° 112°
53°
52°
51°
Rg 25 W4 Rg 20 W4R g1W5R g5W5Rg10W5
Rg15W4Rg20W4Rg25W4R g5W5Rg10W5
Hardness as Calcium Carbonate (mg/L)
<100
100.1- 250
>250
0 25 50 75 10012.5km
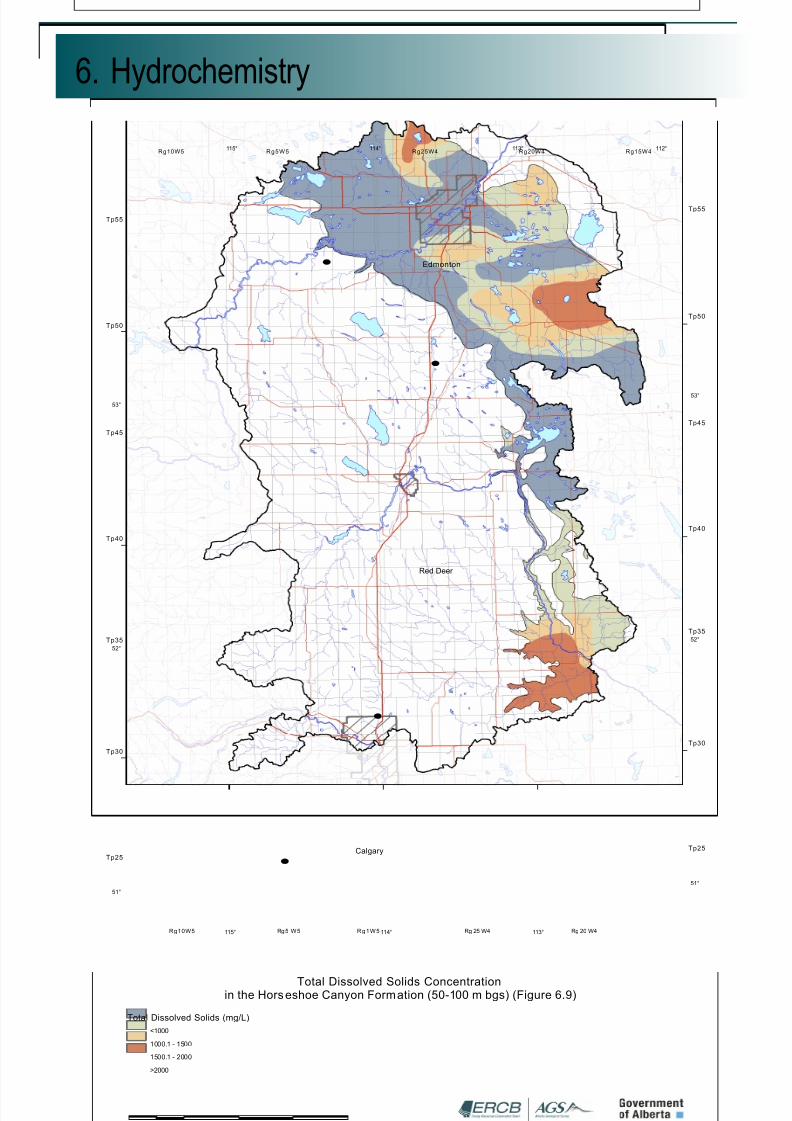
5/11/2018 Edmonton-Calgary Corridor Groundwater Atlas - INF 140 - slidepdf.com
http://slidepdf.com/reader/full/edmonton-calgary-corridor-groundwater-atlas-inf-140 86/98
ERCB/AGS Information Series 140 (September 2011) • 79
6. Hydrochemistry
UV16
UV1
UV2
UV2
Edmonton
Red Deer
Calgary
Base DataProvidedby SpatialData Warehouse Ltd.
Tp35
Tp40
Tp45
Tp50
Tp55
Tp25
Tp30
Tp25
Tp30
Tp35
Tp40
Tp45
Tp50
Tp55
Total Dissolved Solids Concentrationin the Horseshoe Canyon Formation (50-100 m bgs) (Figure 6.9)
115° 114° 113°
51°
52°
53°
115° 114° 113° 112°
53°
52°
51°
Rg 25 W4 Rg 20 W4R g1W5Rg5 W5Rg10W5
Rg15W4Rg20W4Rg25W4R g5W5Rg10W5
Total Dissolved Solids (mg/L)
<1000
1000.1 - 1500
1500.1 - 2000
>2000
0 25 50 75 10012.5km

5/11/2018 Edmonton-Calgary Corridor Groundwater Atlas - INF 140 - slidepdf.com
http://slidepdf.com/reader/full/edmonton-calgary-corridor-groundwater-atlas-inf-140 87/98
ERCB/AGS Information Series 140 (September 2011) • 80
6. Hydrochemistry
UV16
UV1
UV2
UV2
Edmonton
Red Deer
Calgary
Base DataProvided by SpatialData WarehouseLtd.
Tp35
Tp40
Tp45
Tp50
Tp55
Tp25
Tp30
Tp25
Tp30
Tp35
Tp40
Tp45
Tp50
Tp55
Hardness (as Calcium Carbonate) Concentrationin the Horseshoe Canyon Formation (50-100 m bgs) (Figure 6.10)
115° 114° 113°
51°
52°
53°
115° 114° 113° 112°
53°
52°
51°
Rg 25 W4 Rg 20 W4R g1W5R g5W5Rg10W5
Rg15W4Rg20W4Rg25W4R g5W5Rg10W5
Hardness as Calcium Carbonate (mg/L)
<50
50.1- 150
150.1- 250
>250
0 25 50 75 10012.5km

5/11/2018 Edmonton-Calgary Corridor Groundwater Atlas - INF 140 - slidepdf.com
http://slidepdf.com/reader/full/edmonton-calgary-corridor-groundwater-atlas-inf-140 88/98
ERCB/AGS Information Series 140 (September 2011) • 81
6. Hydrochemistry
Spring at the Raven fish hatchery near Caroline, Alberta. The springs at the Raven fish
hatchery form pools and straight channels, which are ideal habitats for the trout raised at
the hatchery.
elements responsible for making water hard react with the rocks,
and these elements bind to the rocks. The elements that were bound
previously to the rocks are released and enter the water. These released
elements are different from those that made the water hard, thus making
the water softer.
Bearpaw Formation
TodenetheBearpawFormation’swesternboundary,weselectedan
area that would include all of the data, including a bit of a buffer to the
west.Wedenedtheeasternboundaryasthesubcropedge.Onlya
few of the wells in the ECC that are completed in the Bearpaw
Formation have water chemistry information, so we had limited data
to map the chemical concentration ranges. Figure 6.11 shows the
total dissolved solids concentration ranges, and Figure 6.12 shows
the hardness concentration ranges.
Total dissolved solids concentrations in wells completed in the Bearpaw
Formation increase toward the southeast. Concentrations are somewhat
higher than those in the Horseshoe Canyon Formation, suggesting that the
link between an increase in depth and an increase in total dissolved solids
concentrations exists here as well.
Water from the Bearpaw Formation is very hard. Hardness values in the
Bearpaw Formation are similar to those in the sediments above bedrock.
This could mean that we are witnessing mixing between water from these
two intervals.

5/11/2018 Edmonton-Calgary Corridor Groundwater Atlas - INF 140 - slidepdf.com
http://slidepdf.com/reader/full/edmonton-calgary-corridor-groundwater-atlas-inf-140 89/98
ERCB/AGS Information Series 140 (September 2011) • 82
6. Hydrochemistry
Belly River Group
TodenetheBellyRiverGroup’swesternboundary,weselectedan
area that would include all of the data, including a bit of a buffer to the
west.WedenedtheeasternboundaryastheECC’sboundary.Onlya
few of the wells in the ECC that are completed in the Belly River Group
have water chemistry information, so we had limited data to map the
chemical concentration ranges. Figure 6.13 shows the total dissolved solids
concentration ranges, and Figure 6.14 shows the hardness concentration
ranges.
Total dissolved solids concentrations increase toward the southeast.
Concentrations in the Belly River Group are generally less than those in
the Bearpaw Formation but greater than those in the Horseshoe Canyon
Formation. These trends are related to differences in the sediment within
eachoftheserockunitsandtheamountoftimewaterspendsinowsystems
within each of these units.
Water from the Belly River Group is very hard. Hardness values are greatest
northeast of Edmonton.
Spring water flow forming a stream in the central part of the ECC.
q

5/11/2018 Edmonton-Calgary Corridor Groundwater Atlas - INF 140 - slidepdf.com
http://slidepdf.com/reader/full/edmonton-calgary-corridor-groundwater-atlas-inf-140 90/98
ERCB/AGS Information Series 140 (September 2011) • 83
7. Summary
What We Mapped in the ECC
How This Work Will Be Used
Where Do We Go From Here?

5/11/2018 Edmonton-Calgary Corridor Groundwater Atlas - INF 140 - slidepdf.com
http://slidepdf.com/reader/full/edmonton-calgary-corridor-groundwater-atlas-inf-140 91/98
ERCB/AGS Information Series 140 (September 2011) • 84
7. Summary
The Water for Life strategy1 outlines the Government of Alberta’s
commitment to managing water resources in the province. This document
identiesanumberofkeydirections:
• Albertans will have access to the knowledge needed to achieve safe
drinkingwater,healthyaquaticecosystemsandreliable,qualitywater
supplies for a sustainable economy;
• Water for Life partners are empowered, informed and fully engaged in
watershed stewardship; and
• All sectorsunderstandhowtheirbehavioursimpactwaterquality,
quantityandthehealthofaquaticecosystems.Theywilladoptawater
conservation ethic and take action.
The groundwater inventory work we are conducting in the ECC provides
the information and knowledge that can be used in achieving success in all
three of these directions.
What We Mapped in the ECC
The AGS compiled and mapped the following information for the ECC:
• physical arrangement and composition of the sediments above bedrock;• physical arrangement and composition of the bedrock units;
• hydrological parameters, such as precipitation, evapotranspiration, base
ow,runoffandrecharge;
• hydrogeological parameters, such as the water-table elevations,
water-levelsurfaces,estimatesofgroundwater-owdirections,vertical
gradients, recharge and discharge areas, potential groundwater yield,
groundwatersusceptibility,andthelocationofthemajoraquifertypes
in the area; and
• hydrochemistry (the range of chemical concentrations found in each
geological formation).
Gordon Jean, Alberta Geological Survey, measuring the physical properties of the water
in the North Saskatchewan River near Edmonton, Alberta. Measurements included pH,
conductivity, dissolved oxygen and temperature. These water properties are used to
report on the water quality in the study area.
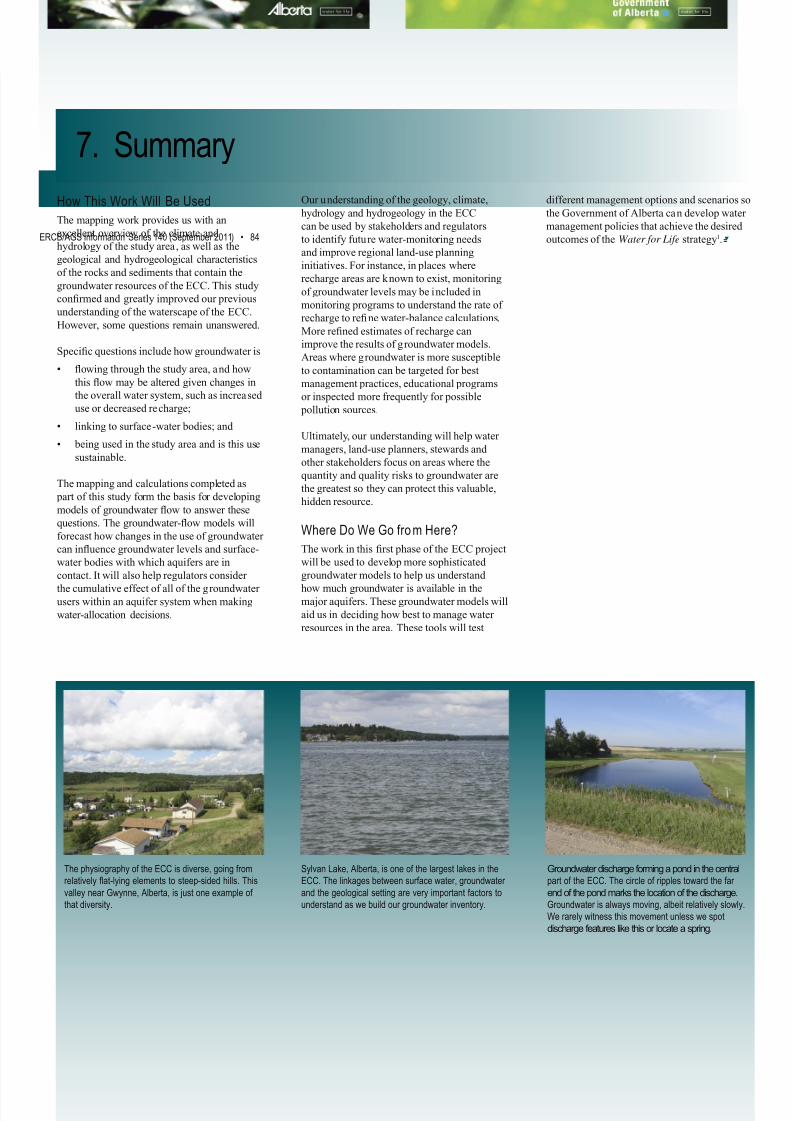
5/11/2018 Edmonton-Calgary Corridor Groundwater Atlas - INF 140 - slidepdf.com
http://slidepdf.com/reader/full/edmonton-calgary-corridor-groundwater-atlas-inf-140 92/98
ERCB/AGS Information Series 140 (September 2011) • 85
7. Summary
different management options and scenarios so
the Government of Alberta can develop water
management policies that achieve the desired
outcomes of the Water for Life strategy1.
How This Work Will Be Used
The mapping work provides us with an
excellent overview of the climate and
hydrology of the study area, as well as the
geological and hydrogeological characteristics
of the rocks and sediments that contain thegroundwater resources of the ECC. This study
conrmedandgreatlyimprovedourprevious
understanding of the waterscape of the ECC.
However,somequestionsremainunanswered.
Specicquestionsincludehowgroundwateris
• owing through the study area, and how
thisowmaybealteredgivenchangesin
the overall water system, such as increased
use or decreased recharge;
• linking to surface-water bodies; and
• being used in the study area and is this use
sustainable.
The mapping and calculations completed as
part of this study form the basis for developing
modelsofgroundwaterowtoanswerthese
questions.Thegroundwater-owmodelswill
forecast how changes in the use of groundwater
caninuencegroundwaterlevelsandsurface-
waterbodieswithwhichaquifersarein
contact. It will also help regulators consider
the cumulative effect of all of the groundwater
userswithinanaquifersystemwhenmaking
water-allocation decisions.
Groundwater discharge forming a pond in the central
part of the ECC. The circle of ripples toward the far
end of the pond marks the location of the discharge.
Groundwater is always moving, albeit relatively slowly.
We rarely witness this movement unless we spot
discharge features like this or locate a spring.
Sylvan Lake, Alberta, is one of the largest lakes in the
ECC. The linkages between surface water, groundwater
and the geological setting are very important factors to
understand as we build our groundwater inventory.
The physiography of the ECC is diverse, going from
relatively flat-lying elements to steep-sided hills. This
valley near Gwynne, Alberta, is just one example of
that diversity.
Our understanding of the geology, climate,
hydrology and hydrogeology in the ECC
can be used by stakeholders and regulators
to identify future water-monitoring needs
and improve regional land-use planning
initiatives. For instance, in places whererecharge areas are known to exist, monitoring
of groundwater levels may be included in
monitoring programs to understand the rate of
rechargetorenewater-balancecalculations.
Morerenedestimatesofrechargecan
improve the results of groundwater models.
Areas where groundwater is more susceptible
to contamination can be targeted for best
management practices, educational programs
orinspectedmorefrequentlyforpossible
pollution sources.
Ultimately, our understanding will help water
managers, land-use planners, stewards and
other stakeholders focus on areas where thequantityandqualityriskstogroundwaterare
the greatest so they can protect this valuable,
hidden resource.
Where Do We Go from Here?
TheworkinthisrstphaseoftheECCproject
will be used to develop more sophisticated
groundwater models to help us understand
how much groundwater is available in the
majoraquifers.Thesegroundwatermodelswill
aid us in deciding how best to manage water
resources in the area. These tools will test
q

5/11/2018 Edmonton-Calgary Corridor Groundwater Atlas - INF 140 - slidepdf.com
http://slidepdf.com/reader/full/edmonton-calgary-corridor-groundwater-atlas-inf-140 93/98

5/11/2018 Edmonton-Calgary Corridor Groundwater Atlas - INF 140 - slidepdf.com
http://slidepdf.com/reader/full/edmonton-calgary-corridor-groundwater-atlas-inf-140 94/98
ERCB/AGS Information Series 140 (September 2011) • 87
Glossary

5/11/2018 Edmonton-Calgary Corridor Groundwater Atlas - INF 140 - slidepdf.com
http://slidepdf.com/reader/full/edmonton-calgary-corridor-groundwater-atlas-inf-140 95/98
ERCB/AGS Information Series 140 (September 2011) • 88
Glossary
aquifer – Body of rock or sediment that is water-saturated, made up
ofhighlypermeablematerialandcansupplylargequantitiesof
groundwater to wells, springs or surface-water bodies.
aquitard – Body of rock or sediment that is water-saturated, made up
oflow-permeablematerialandcannottransmitlargequantitiesof
water.
baseow–Partofthestreamowinriversandstreamsthatcomes
from groundwater moving into a river or stream.
bedrock – General term for rock, usually solid, lying under soil or other
loose surface materials.
bentonite (-ic) – Rock containing bentonite. Bentonite is a soft clay
or claystone largely composed of the mineral smectite. Bentonite
canabsorblargequantitiesofwater,whichcausesittoincreasein
volume.
calcareous – Rock or sediment containing calcium carbonate. When
used with a rock name, it means that as much as 50 per cent of the
rock is calcium carbonate.
carbonaceous – Rock or sediment rich in carbon. It may contain coal. It
is also said of sediments containing organic mat ter.
chert (-y) –Hard,verynegrainedsedimentaryrock,oftenfoundas
nodulesinlimestoneordolostone.Cherthasalsobeencalledint.
clast – Individual piece, grain or fragment of a sediment or rock
produced by the mechanical or chemical disintegration of a larger
rock mass.
clastic – Rock or sediment made of broken pieces from pre-existing
rocks or minerals. This may also refer to the texture of a rock.
conned aquifer–Aquiferboundedaboveandbelowbyconningbeds
(oraquitards).
delta–Low,nearlyatsectionoflandatornearthemouthofariver,
commonly forming a triangular or fan-shaped plain of sediments. It
istheresultofthebuildupofgreatquantitiesofsedimentsuppliedby
a river.
discharge area – Area where groundwater is being released from the
saturated zone.
downhole geophysics – Geophysical data collected by lowering
measurement tools (e.g., electric, gravity, magnetic) into and out of a
borehole.
electromagnetic – Electrical exploration method measuring alternating
magneticeldsfromnaturalorarticiallyinducedsourcesinthe
subsurface.
eolian – Erosion and deposition of sediments caused by the wind,
usually forming deposits such as sand dunes.
evaporation–Processbywhichasubstancepassesfromtheliquidor
solid state to the vapour state. In this case, the evaporation of water
from surface-water bodies or the land surface.
evaporative demand – Rate of water loss from a wet surface.
evapotranspiration– Loss of water from a land area through the
transpiration of plants and evaporation from the soil and surface-
water bodies.
feldspathic – Containing feldspar, which is a group of rock-forming
minerals comprising 60 per cent of the Earth’s crust.
ow modelling – Groundwater-owmodelsareconceptualdescriptions
or approximations describing physical systems using mathematical
equations.
uvial – Of or pertaining to a river; sediments produced by the
movementofastreamorriverare‘uvialsediments.’
formation–Bodyofrockidentiedbyitsphysicalcharacteristicsand
position in relation to other bodies of rock. It can usually be mappedat the Earth’s surface or traced in the subsurface.
frequency-domain technology – Geophysical exploration method based
onmeasuringmagneticeldscreatedbyanelectromagneticeld
withaxedfrequency.
geophysics (geophysical) –StudyoftheEarthbyquantitativephysical
methods using physics principles.
geostatistics – Branch of applied statistics dealing with phenomena that
uctuateintwo-orthree-dimensionalspace.Statisticsasappliedto
geology.
glaciation – Formation, movement and recession of glaciers or ice sheets.
glaciouvial– Refers to the sediments from the meltwater streams
owingfrommeltingglaciericeandespeciallytothedepositsand
landforms produced by such streams; the result of the combined
action of glaciers and streams.
glaciolacustrine – Sediments from or deposited in glacial lakes,
especially the deposits and landforms composed of material carr ied bymeltwaterstreamsowingintolakesborderingaglacier.
groundwater – Water below the land surface and the water table; the
source for springs and wells.
groundwater susceptibility – Ease with which water enters and moves
throughanaquifer.Itisafunctionoftheoverlyingsedimentandthe
aquifer’sphysicalcharacteristics.
hydraulic head – Elevation of water in a groundwater well. This
elevation is related to the pressure acting on the water from within
theaquiferinwhichthegroundwaterwelliscompleted.
hydrochemistry – Study of chemical processes and conditions in
groundwater.
hydrogeology – Study of subsurface water, its movements and its
interactions with geological materials and surface water.hydrograph – Graph showing characteristics such as the elevation or the
rateofowofwaterwithrespecttotime.
hydrology –Scienceofglobalwater(bothliquidandsolid),its
properties, circulation and distribution on and under the Earth’s
surface and in the atmosphere.
inorganic chemistry – Chemistry of compounds that contain no carbon.
interbedded – Refers to geological layers or ‘beds’ that lie between or
alternate with different types of geological layers.
isostatic rebound – Adjustment of the Earth’s crust to the unloading
from the removal of glacier ice or as sediments are eroded from the
landscape.
lacustrine – Refers to sediments produced by or formed in a lake.
Laramide Orogeny – Time of geological deformation that occurred
in the eastern Rocky Mountains. There were several phases that
extended from the Late Cretaceous until the end of the Paleocene
(about 80 to 50 million years ago).
litholog –Logdescribingthesequenceofphysical(lithological)
characteristics of the sediments or rocks encountered while drilling
a well or borehole. It is compiled from the examination of well
cuttings or core.
lithology (lithological) – Description of sediments or rocks based on
such characteristics as colour, mineral composition and grain size.
The physical character of a sediment or rock.
lodgement – Process of depositing glacial debris from the base of a
moving glacier through pressure melting and/or mechanical means.
matrix–Finergrainedmaterialenclosingorllingthespacesbetweenthe larger grains or par ticles of a sediment or sedimentary rock.
melt-out – Slow release of debris from ice that is not sliding or
deforming.
meltwater – Water from the melting of snow or ice, used most often
when referring to water from melting glacial ice.
meltwater channel – Channel eroded into the land surface by water
from the melting of snow or ice, especially from melting glacier ice.
moraine – Mound, ridge or other distinct buildup of unsorted, not
layered glacial materials, predominantly till, usually deposited by
direct action of glacier ice. It can form a variety of topographic
landforms independent of the land surface on which the moraine was
deposited.
morphology (morphological) – Shape, form or arrangement of sediments and rocks as they relate to landforms on the Earth’s
surface.Areasdenedbydistinctivelandformsaregroupedtogether
and called morphological elements or regions.
paleochannel – Remnant of a stream channel cut in older rock or
sedimentandlledbyyoungeroverlyingrockorsediment.Itoften
refers to buried stream channels.
permeability – Ability or capacity of a porous rock or sediment to
transmit water. It is a measure of how easily water can move through
a given material.
physiography (-ic) – Description of the physical nature (shape,
composition and arrangement) of natural features on the Earth’s surface.
5/11/2018 Edmonton-Calgary Corridor Groundwater Atlas - INF 140 - slidepdf.com
http://slidepdf.com/reader/full/edmonton-calgary-corridor-groundwater-atlas-inf-140 96/98
ERCB/AGS Information Series 140 (September 2011) • 89
Glossary
porosity – Percentage of the volume of a rock or soil that is occupied by
void spaces. These spaces can be isolated or connected.
precipitation – Water that falls to the Earth’s surface from the
atmosphere as rain, snow, hail or sleet.
proglacial – Immediately in f ront of or just beyond the outer limitsof a glacier or ice sheet. This is usually said of lakes, streams and
deposits produced by or from the glacier ice.
recharge – Processes involved in adding water to the saturated zone.
It occurs naturally via precipitation or runoff. It also refers to the
amount of water added to the saturated zone.
recharge area – Area where water is being added to the saturated zone.
resistivity (electrical) – Electrical resistance of a material. This is used
in geophysical explorations to describe the rock or sediment.
rooting zone – Soil in the immediate area of plant roots.
runoff – Water from precipitation or snowmelt travelling across the land
surface, either on top of the land surface or slightly below it. This
watercontributestostreamow.
saturated zone – Subsurface zone (area below the water table) in whichallofthevoidspacesofthesedimentsandrocksarelledwith
water.
sediment – Material from the weathering of rocks transported and
deposited by air, water or ice. This material is deposited in layers on
the Earth’s surface in a loose (unconsolidated) form.
sedimentary rock – Rock formed from the consolidation or compaction
of loose sediments collected in layers on the Ear th’s surface.
siliceous tuff – Consolidated or cemented volcanic ash rich in the
mineral silica.
subcrop – Subsurface outcrop describes the areal limits of a rock unit
buried below other sediments. These limits are shown on subcrop
maps.
surcial–SomethingoccurringontheEarth’ssurface.Asurcialdeposit refers to the loose (unconsolidated) sediments lying on top of
bedrock and generally represent the most recent geological deposits.
tectonic (-s) – Forces involved in moving geological plates around
the Earth. Tectonics is a branch of geology dealing with the broad
architecture of the outer part of the Earth.
till – Sediment dominantly unconsolidated, unsorted and not layered
deposited directly by or underneath a glacier without being
subsequentlyreworkedbywater.Tillgenerallyconsistsofamixture
of clay, silt, sand, gravel and boulders ranging widely in size and
shape.
time-domain technology – Geophysical exploration method based on
measurementsofelectromagneticquantitieswithtime.
topography–Generalcongurationofasurface(eitherlandsurfaceor
undergroundsurface)asdenedbyitselevation.
transpiration – Water evaporated from a plant’s surface.
unconnedaquifer –Aquifernearthelandsurface.Thewatertable
denesthetopoftheseaquifers.
unconsolidated – Sediment loosely arranged or whose particles are not
cemented together.
unsaturated zone–Subsurfacezonewhosevoidspacesarelledwitha
combinationofgasesorwater.Thetopofthiszoneisdenedbythe
landsurface,andthebaseisdenedbythesaturatedzone.
vertical gradient – Rate of change in the vertical direction. It can be
calculatedfromthehorizontalowdata.Itsuggestswhichdirection
groundwater is travelling in the vertical direction.
water-level surface – Surface representing the elevation of groundwaterforaparticulargeologicallayeroraquifer.Itisgeneratedusingthe
water levels measured in wells. The water table is an example of a
water-level surface.
water table–Wherefullysaturatedgroundwaterconditionsarerst
encountered below the surface of the Earth. It also represents the
surface between the saturated and unsaturated zones.

5/11/2018 Edmonton-Calgary Corridor Groundwater Atlas - INF 140 - slidepdf.com
http://slidepdf.com/reader/full/edmonton-calgary-corridor-groundwater-atlas-inf-140 97/98
ERCB/AGS Information Series 140 (September 2011) • 90
Endnotes
1. Alberta Environment (2009): Water for life: a renewal; Alberta
Environment, 18 p., URL <http://environment.gov.ab.ca/info/
library/8035.pdf > [August 2011].
2. Alberta Environment (2009): Water for life: action plan; Alberta
Environment, 23 p., URL <http://environment.gov.ab.ca/info/
library/8236.pdf > [August 2011].
3. Bostock, H.S. (1964): A provisional physiographic map of Canada;
Geological Survey of Canada, Paper No. 64-35, 24 p.
4. Pettapiece, W.W. (1986): Physiographic subdivisions of Alberta; Land
Resource Research Centre, Agriculture Canada, physiographic map,
scale 1:1 500 000.
5. Riddell, J.T.F., Andriashek, L.D., Jean, G. and Slattery, S.R. (2009):
Preliminary results of sediment and bedrock coring in the Edmonton-
Calgary Corridor, central Alberta; Energy Resources Conservation
Board, ERCB/AGS Open File Report 2009-17, 81 p., URL <http://
www.ags.gov.ab.ca/publications/abstracts/OFR_2009_17.html>
[August 2011].
6. Slattery, S.R., Barker, A.A., Andriashek, L.D., Jean, G., Stewart,
S.A., Moktan, H. and Lemay, T.G. (2010): Bedrock topography andsediment thickness mapping in the Edmonton–Calgary Corridor,
central Alberta: an overview of protocols and methodologies; Energy
Resources Conservation Board, ERCB/AGS Open File Report 2010-
12, 16 p., URL <http://www.ags.gov.ab.ca/publications/abstracts/
OFR_2010_12.html> [August 2011].
7. Shetsen, I. (1987): Quaternary geology, southern Alberta; Alberta
Research Council, Alberta Geological Survey, Map 207, scale
1:500 000, URL <http://www.ags.gov.ab.ca/publications/abstracts/
MAP_207.html> [August 2011].
8. Shetsen, I. (1990): Quaternary geology, central Alberta; Alberta
Research Council, Alberta Geological Survey, Map 213, scale
1:500 000, URL <http://www.ags.gov.ab.ca/publications/abstracts/
MAP_213.html> [August 2011].
9. Bayrock,L.A.andReimchen,T.H.F.(1980):Surcialgeology,Alberta Foothills and Rocky Mountains; Alberta Environment,
Alberta Research Council, Alberta Geological Survey, Map 150, scale
1:250 000, URL <http://www.ags.gov.ab.ca/publications/abstracts/
MAP_150.html> [August 2011].
10. Slattery, S.R. and Barker, A.A. (2011): Thickness of Quaternary and
Neogene sediments in the Edmonton–Calgary cor ridor (NTS 82O,
82P, 83A, 83B, 83G and 83H); Energy Resources and Conservation
Board, ERCB/AGS Map 548, scale 1:500 000, URL <http://www.ags.
gov.ab.ca/publications/abstracts/MAP_548.html > [August 2011].
11. Environment Canada (2001): Canadian climate normals or averages
1971–2000; Environment Canada, URL <http://climate.weatherofce.
gc.ca/climate_normals/index_e.html> [August 2011].
12. Domenico, P. and Schwartz, F. (1997): Physical and chemical
hydrogeology; John Wiley and Sons, New York, New York, 494 p.13. Thornthwaite, C.W. (1948): An approach toward a rational
classicationofclimate;GeographicalReview,v.38,no.1,p.55–94.
14. Turc, L. (1961): Evaluation des besoins en eau d’irrigation,
évapotranspirationpotentielle,formulesimpliéetmiseàjour;
AnnalesAgronomiques,v.12,p.13–49.
15. Freeze, R.A. and Witherspoon, P.A. (1967): Theoretical analysis of
regionalgroundwaterow:2.effectofwater-tablecongurationand
subsurface permeability variation; Water Resources Research, v. 3, no.
2, p. 623–634, doi:10.1029/WR003i002p00623.
16. Focazio, M.J., Reilly, T.E., Rupert, M.G. and Helsel, D.R. (2002):
Assessing ground-water vulnerability to contamination: providing
scienticallydefensibleinformationfordecisionmakers;U.S.
Geological Survey, Circular 1224, 33 p.
17. Toth,J.(1963):Atheoreticalanalysisofgroundwaterowinsmall
drainage basins; Journal of Geophysical Research, v. 68, no. 16, p.
4795–4812.
18. Lemay, T.G. and Guha, S. (2009): Compilation of Alberta groundwater
information from existing maps and data sources; Energy Resources
Conservation Board, ERCB/AGS Open File Report 2009-02, 43 p.,
URL <http://www.ags.gov.ab.ca/publications/abstracts/OFR_2009_02.
html> [August 2011].
19. Aller, L., Bennet, T., Lehr, J.H. and Petty, R.J. (1987): DRASTIC: a
standardized system to evaluate ground water pollution potential using
hydrogeologic settings; US EPA Report 600, 57 p.
20. Alberta Agriculture and Rural Development (2001): Agricultural
region of Alberta soil inventory database (version 3.0); J.A. Brierley,
T.C. Martin and D.J. Spiess (ed.), Alberta Agriculture and Rural
Development, Alberta Soil Information Centre, URL <http://www1.
agric.gov.ab.ca/$department/deptdocs.nsf/all/sag3249?opendocument >
[August 2011].21. HealthCanada(2010):Waterquality–reportsandpublications;Health
Canada, URL <http://www.hc-sc.gc.ca/ewh-semt/pubs/water-eau/
index-eng.php> [August 2011].
22. Health Canada (1979): Hardness; in Guidelines for Canadian Drinking
Water Quality – Technical Documents, Health Canada, 5 p., URL
<http://www.hc-sc.gc.ca/ewh-semt/pubs/water-eau/hardness-durete/
index-eng.php> [August 2011].
23. Freeze, R.A. and Cherry, J.A. (1979): Groundwater; Prentice-Hall,
Englewood Cliffs, New Jersey, 604 p.

5/11/2018 Edmonton-Calgary Corridor Groundwater Atlas - INF 140 - slidepdf.com
http://slidepdf.com/reader/full/edmonton-calgary-corridor-groundwater-atlas-inf-140 98/98